Embed Size (px)
Citation preview

Experiment
•An experiment deliberately imposes a treatment on a group of objects or subjects in the interest of observing the response.
•Differs from an observational study, which involves collecting and analyzing data without changing existing conditions

Experimental Controls
•The control group is practically identical to the treatment group, except for the single variable of interest whose effect is being tested, which is only applied to the treatment group.
•An example would be a drug trial. ▫The group receiving the drug would be the
treatment group and the one receiving the placebo would be the control group.
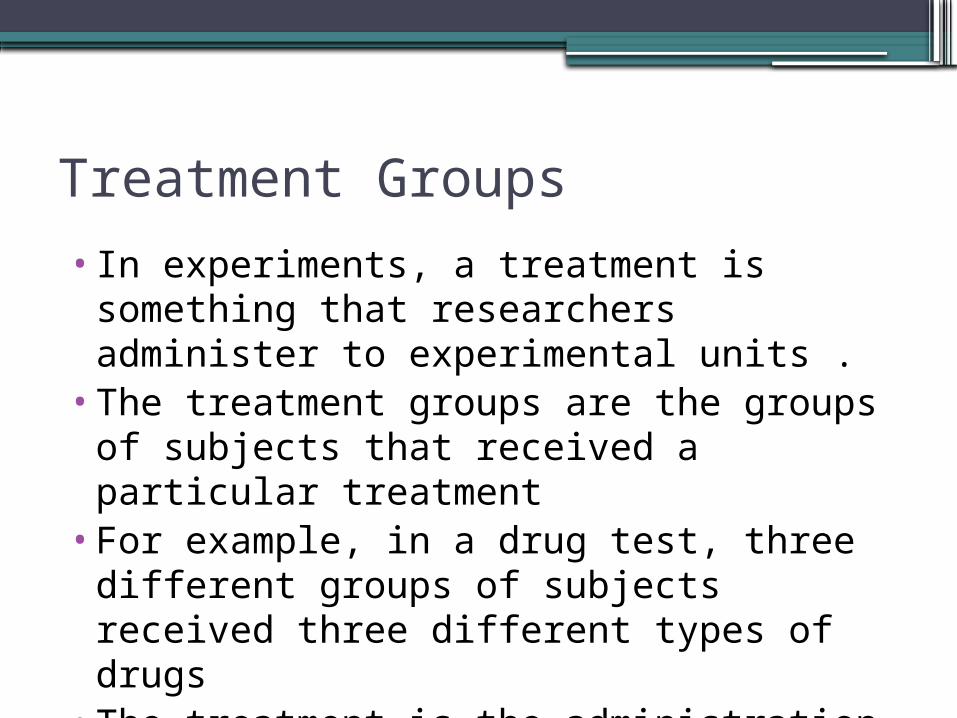
Treatment Groups
•In experiments, a treatment is something that researchers administer to experimental units .
•The treatment groups are the groups of subjects that received a particular treatment
•For example, in a drug test, three different groups of subjects received three different types of drugs
•The treatment is the administration of a particular drug type

Experimental Design
•The proper organization of the experiment ensures that the right type of data, and enough of it, is available to answer the questions of interest as clearly and efficiently as possible.
•This process is called experimental design.•Because the validity of a experiment is
directly affected by its construction and execution, attention to experimental design is extremely important

Factors•In an experimental design, a factor in an
experiment is a controlled independent variable▫A variable whose levels are set by the
experimenter•A factor consists of categories of treatments
▫Remember: Factors are independent variables•From a statistical standpoint, the researcher
looks for differences in the averages of the dependent variable(s) across the groups of independent variables

Experimental Bias
•When researchers fail to control for the effects of the differences in subjects, it can lead to experimental bias
•Experimental bias is the favoring of certain outcomes over others

Randomization
•Because it is generally extremely difficult for experimenters to eliminate bias using only their expert judgment, the use of randomization in experiments is common practice.
•In a randomized experimental design, objects or individuals are randomly assigned (by chance) to an experimental group.

Replication• To improve the significance of an experimental
result, replication, the repetition of an experiment on a large group of subjects, is required.
• If a treatment is truly effective, the long-term averaging effect of replication will reflect its experimental worth.
• If it is not effective, then the few members of the experimental population who may have reacted to the treatment will be negated by the large numbers of subjects who were unaffected by it.

Formats
•Experimental Designs are defined by their formats
•Examples of these formats include:▫Student t-test- two groups▫One-way Analysis of Variance▫Multivariate Analysis of Variance▫Factorial Analysis of Variance▫Split Plot Design▫Latin Square Design

One-way Analysis of VarianceProduction Office Maintenance
3 1 74 0 82 0 54 1 75 2 96 3 6
4.00 1.17 7.00

Multivariate Analysis of Variance

Split Plot Design

One-way Analysis of Variance Example• A One-way Analysis of Variance identifies significant
differences between group averages• In a One-way Analysis of Variance, the researcher
randomly selects subjects and assigns them to one of three different forklift driving training programs.
• The three different programs are:▫Classroom based only▫Hands-on only▫Combination hands-on and classroom
• Our treatment variable (or factor) is “forklift training program” and it has three levels (listed above)

One-way Analysis of Variance Example•The researcher randomly selects 11
subjects for each of the different training program, formats▫If the subjects are not randomly selected,
what could occur?•The researcher will compare the average
number of forklift accidents incurred by each group to determine if there is a significant difference between the averages

Classroom Hands-on Combination
2 1 0
0 0 0
1 0 0
0 0 0
0 0 0
2 0 0
1 1 0
0 2 0
2 1 0
1 0 1
2 0 0
1.0000 0.454545 0.090909 Average

Classroom Hands-on Combination2 1 00 0 01 0 00 0 00 0 02 0 01 1 00 2 02 1 01 0 12 0 0

Performing the Analysis
•The ANOVA utilizes the F-ratio to determine if there is a significant difference between the group averages
•The null hypothesis is:▫Ave Grp 1 = Ave Grp 2 = Ave Grp 3
•The alternative hypothesis is:▫Ave Grp 1 NE Ave Grp 2 NE Ave Grp 3
•A significant F-ratio indicates there is a significant difference between the group averages

ANOVA ResultsAnova: Single Factor
SUMMARY
Groups Count Sum Average Variance
Class Training 11 11 1 0.8
Hand on only 11 5 0.454545 0.472727
Both 11 1 0.090909 0.090909
ANOVA
Source of Variation SS df MS F P-value F crit
Between Groups 4.606061 2 2.30303 5.066667 0.012713 3.31583
Within Groups 13.63636 30 0.454545
Total 18.24242 32

Interpretation• The ANOVA procedure found the significance of
the F-ratio to be .0127.• If an Alpha level of .05 is used, then because .012
is less than .05, one can conclude there is a significant difference between the group averages
• The odds of these results occurring totally due to random chance is .0127.
• Another way of saying this is “The researcher has a .0127 percent chance of rejecting the Null Hypothesis when the Null Hypothesis is in fact true”

Post-Hoc Tests• When the ANOVA test result is found to be
significant, the next step is to run a post-hoc test to determine where the significance lies between groups.
• There are a number of different post-hoc tests that can be run (Scheffe’s, Tukey’s, etc.)▫For example, is Group 1 significantly different
from Groups 2 or 3▫ Is Group 2 significantly different from Groups 1
or 3▫Etc.

Correlation