Embed Size (px)
Citation preview

Experience of Inclusive Institutions and the Value ofParticipation: Experimental Evidence from Bangladesh
JOB MARKET PAPER (latest version)
Serena Cocciolo*
October 7, 2018
Abstract
A prerequisite for institutional development is that citizens prefer the new institu-tions to the old ones. However, it is unclear how citizens value di�erent institutionalsettings and how these values evolve. This paper advances our understanding of institu-tional development by answering two questions: If given a choice, would citizens chooseto adopt democratic and inclusive institutions in order to take collective decisions? Doesexperiencing inclusive institutions a�ect how citizens value them? I implement a novellab-in-the-�eld experiment, which provides the �rst incentivized measure of the valuethat citizens place on taking collective decisions via a participatory process. Then,exploiting randomly assigned exposure to inclusive institutions through a Community-Driven Development (CDD) program, I provide the �rst causal evidence over whetherexperiencing such institutions changes citizens' evaluations of participatory governance.My results indicate that citizens prefer taking collective decisions by an inclusive pro-cess, and these positive evaluations are reinforced by the exposure to the CDD program.The overall e�ect is driven primarily by an increase in the value that citizens attachto inclusive decision-making practices per se, above and beyond instrumental consid-erations. The evidence presented in this paper elucidates one potential mechanism forinstitutional development.
*Institute for International Economic Studies, Stockholm University. Email: [email protected] am indebted to Jakob Svensson, Anna Tompsett and Ingvild Almas for their guidance and support.The project greatly bene�ted from the advice and discussions with Anna Aevarsdottir, Martina Björkman,Jonathan de Quidt, Selene Ghisol�, Magnus Johannesson, Anna Sandberg and Domenico Viganola. I thankfor their comments and suggestions seminar participants at the IIES, Stockholm University, Stockholm Schoolof Economics, WZB Berlin Social Science Center, ASWEDE Conference, Economics PhD Conference atWarwick University, ECARES-Universite libre de Bruxelles, RES Symposium for Junior Researchers, Inter-disciplinary Ph.D. Workshop on Sustainable Development at Columbia University, Boston University, MIT,PODER Summer School and CBESS Annual PhD Workshop.This project is realized in collaboration with NGO Forum for Public Health. I thank NGO Forum ExecutiveDirector Mr S.M.A. Rashid for his cooperation, and Ahasan Habib for his support in all critical phases ofthe project. I am indebted to Jahirul Islam for tireless and invaluable supervision of the project, and to theextraordinary team of enumerators: Ahsan Habib, Tariqul Islam, Suvo, Mir Rahian, Jannatun Chowdhuryand Kawsar Ahmmed. I thank all Bangladeshi participants to the lab-in-the-�eld experiment, who showed agreat cooperation during all phases of the project and agreed to take part in it with the hope of contributingto the design of better development work in their region.The project was funded by LEAP, IGC Bangladesh, JPAL-GI, Kock-Lindberg Foundation and MannerfeltsFund. AEA RCT registration and Pre-Analysis Plan: AEARCTR-0001809.
1

1 Introduction
A broad consensus holds that institutions are a fundamental pillar of economic prosperity.
Strengthening governance is therefore now a top priority in developing countries (World Bank,
2017).1 However, there remains much to learn about how institutions form and develop, and
how change in institutions can be fomented.2 One important open debate among both
policy-makers and researchers concerns whether or not exposure to democratic or inclusive
institutions can lead to sustainable institutional changes.3
In order to advance this debate it is crucial to understand how experience with institutions
a�ect how citizens value them.4 How citizens value di�erent institutions is ex-ante ambiguous,
because di�erent institutional settings imply di�erent costs and bene�ts for agents.5 Further,
a prerequisite for sustainable institutional change is that citizens prefer the new institutions
to the old ones: because they like them intrinsically, because they think they work better,
or both (Casey, 2018).6 In this paper, I combine a novel lab-in-the-�eld experiment and a
temporary exogenous shock to local institutions in order to answer the following questions: If
given a choice, would citizens choose to adopt democratic and inclusive institutions in order
to take collective decisions? Does experiencing inclusive institutions a�ect how citizens value
them?
Learning about how citizens value institutions, and how these values change in response
to experience of institutions, is di�cult for two reasons. First, measuring socio-political
values is methodologically challenging. Previous research has focused on stated preferences
or realized behaviors and institutions. The latter can be more easily observed, but they
do not necessarily re�ect values and preferences.7 Subjective survey measures provide some
1For example, the World Bank has launched in July 2018 a $12 million fund to increase governmenttransparency, improve accountability and strengthen citizen engagement and government responsiveness.
2Attempts to elaborate unifying theories of institutional development are complicated by its many �ir-regularities� e.g. the evolution of democracies into autocracies (Acemoglu and Robinson, 2017; Acemogluet al., 2013), or the failure of political reforms to deliver expected outcomes (Acemoglu and Robinson, 2008;Anderson et al., 2015).
3For example, Casey et al. (2018) show that experts in public policy and academia held very divergentprior beliefs over the e�ect of programs designed to make local institutions more inclusive and democraticon actual institutional change in the long-run.
4Recent theoretical contributions model the two-way interplay between values and institutions and howthey coevolve: values and norms in�uence policies and institutions, whereas policies and institutions in turnmodel values and norms (Aghion et al., 2010; Besley and Persson, 2018).
5For example, democratic systems may deliver better socio-economic outcomes or encourage cooperativebehaviors (Dal Bó et al., 2010), and citizens might appreciate living in a democracy per se and the possibilityto express their view on issues of common interest (Coate et al., 2008). At the same time, well functioningdemocracies require well-informed voters (Banerjee et al., 2011; Ferraz and Finan, 2008; Stromberg, 2004)and citizens bear the costs of participating in elections.
6A second requirement is that citizens possess the requisite political will to change existing power dynamics(Casey, 2018).
7For example, individual values and preferences may not translate into realized behaviors if the latter are
2
evidence, but respondents may � consciously of unconsciously � refrain from truthfully re-
porting their views and opinions (Bertrand and Mullainathan, 2001), for example because of
social desirability concerns. The risk of reporting bias is particularly severe in the context
of initiatives that promote the adoption of democratic and inclusive practices (Mansuri and
Rao, 2013). Second, it is di�cult to provide a casual link between experience and citizens'
value of institutional regimes. The institutions that citizens have previously been exposed to
may themselves re�ect preferences and institutions and values coevolve. A further concern
is that institutional changes are often embedded within broadly transformative economic,
social and political reforms, making it hard to isolate the direct e�ect of experiencing new
institutions on how citizens value them.
My study resolves both these challenges. First, I implement a novel lab-in-the-�eld ex-
periment which provides the �rst incentivized measure of how citizens value taking collective
decisions via inclusive institutions. Then, exploiting randomly assigned exposure to inclusive
institutions through a Community-Driven Development (CDD) program, I provide the �rst
causal evidence over whether exposure to such institutions changes these values.8
In order to provide empirical evidence on citizens' value of inclusive institutions and its
evolution with experience of institutions, my paper focuses on one speci�c institutional set-
ting: participatory decision-making. A central feature of this approach is that decisions
regarding a community or a group are delegated to the community or the group themselves,
and typically taken via debates and deliberations during public meetings. Participatory gov-
ernance is largely widespread, for example in direct democracies (e.g. town meetings), as
a way to deliver development programs, or for decentralization reforms.9 The lab-in-the-
�eld experiment elicits agents' willingness-to-pay (WTP) for participatory decision-making
relative to an alternative option designed to have the same unconditional expected mone-
tary outcome as the participatory process. The participatory process requires participants
to discuss face-to-face in an unregulated negotiation process in groups of three, and take
distributive choices for the group by unanimous consensus. The alternative procedure con-
sists of receiving the distributive choice of another group, randomly extracted within the
in�uenced by social concerns or otherwise constrained.8The non-descriptive analysis is based on the pre-analysis plan submitted to the AEA-RCT registry:
AEARCTR-0001809.9In direct democracies, citizens directly express their views on laws and policies, often during town or
village meetings (Hinnerich and Pettersson-Lidbom, 2014). Participatory governance has emerged as oneof the dominant approaches in the development sector. Over the past few decades, development projectsbased on community participation have received a massive injection of funding (for example the WorldBank currently supports 190 active CDD projects in 78 countries, for a total value of $19.2 billion (Wongand Guggenheim, 2018)), and international aid agencies increasingly condition access to their funds on theadoption of bene�ciary participation components (Banerjee et al., 2010). Decentralization reforms are oftenbased on deliberative fora intended to actively engage stakeholders in community decision-making (Ban et al.,2012; Besley et al., 2005).
3

same community. The elicitation procedure is fully incentivized: agents' WTP for participa-
tory decision-making determines how group decisions will be taken in the last stage of the
experiment, with approximately one-third of the Bangladeshi rural daily wage at stake.
I �nd that taking decisions via an inclusive process is preferred by the large majority
of participants in my sample, and 47% of agents have a positive WTP for participatory
decision-making. However, support for participatory decision-making is highly polarized,
with 26% of participants willing to pay 8% or more of Bangladeshi rural daily wage for
participatory decision-making, and 22% of participants willing to forgo the same amount or
more to avoid it. My results also indicate that selection into participatory decision-making
is highly selected: subjects who choose to participate are those with greater in�uence over
decisions (e.g. leaders and those with higher education) and lower costs of participation (e.g.
men and the youth).
For the policy evaluation, I use an exogenous shock to local institutions through a CDD
program. The CDD program is a water-safety intervention with strong participatory com-
ponents (Cocciolo et al., 2018a). The CDD program assigns decision-making powers to
communities that otherwise have no jurisdiction over the provision of local public goods or
services, and therefore can be interpreted as a participation experience. The community
decision-making process imposes rules which ensure that everyone is guaranteed the de jure
right to express his/her voice, providing �rst-hand exposure to an inclusive institutional ar-
rangement. The CDD program is randomly assigned to eligible communities, meaning that
communities assigned to the CDD program are statistically identical to communities assigned
not to receive the program. Importantly, the CDD program is limited in time and scope. Ex-
posure to the CDD program can be interpreted as a learning experience of the material and
non-material costs and bene�ts of inclusive institutions (e.g. costs of participation; house-
holds' access to safe water), but it has no impact on political or socio-economic dimensions
that can be directly related to how citizens value institutions. These features allow me to
estimate the causal e�ect of this temporary exogenous shock to local institutions on WTP
for participatory decision-making.10
I �nd that the value that citizens associate to participatory decision-making is signi�cantly
larger in communities that experienced inclusive institutions through the CDD intervention.
This e�ect is primarily driven by a 10 percentage point increase in the share of share of citizens
that strongly prefers inclusive practices. The lab-in-the-�eld experiment design allows me
10In this paper I follow an emerging literature that adopts lab-in-the-�eld experiments as a tool to developbetter measures to evaluate the impact of development programs on social norms, values and preferences(e.g. Attanasio et al. (2015) and Polan (2016)), including Fearon et al. (2009), Fearon et al. (2015), Avdeenkoand Gilligan (2015) in the context of participatory governance. While these previous contributions relyon standard experimental measures of social cohesion and social capital, in my project I introduce a novelmeasure of procedural utility.
4

to separately estimate the e�ect of the CDD program on the instrumental and intrinsic
value of participatory decision-making. I �nd that the expected monetary gain from taking
part in decision-making is smaller in treated than in control communities, and therefore the
main e�ect is driven entirely by an increase in the value that citizens place on participatory
processes per se, above and beyond instrumental motives.
The exposure to inclusive institutions can a�ect how citizens value them via three chan-
nels: it might lead to e�ciency gains for future public consultations with similar characteris-
tics; it might induce citizens to update their beliefs on the bene�ts and costs of these types of
institutional arrangements; or it might generate a taste for inclusive practices. Being exposed
to the CDD program does not change the quality of the bargaining outcomes � in terms of
realized inequality or total contributions in public good games � nor the negotiation time,
but it is associated to a lower risk of con�icts, therefore reducing the psychological costs and
e�orts associated to a face-to-face negotiation dynamics. Agents in treated communities are
less overcon�dent on their ability to in�uence collective decisions in their favor, and therefore
they report lower expected monetary outcomes from participating in decision-making and
lower negotiation skills. Suggestive evidence indicates that the e�ect of the CDD program
on the value of participation does not vary with the quality of community decisions or the
welfare impact of the intervention, but it is larger in communities were the decision-making
process was more actively participated. Overall, these results suggest that the main e�ect is
not driven by improvements in or learning about the decision outcomes of inclusive institu-
tions, but rather by learning about the intrinsic qualities of participatory practices and how
to reduce the non-monetary costs associated to them (e.g. con�icts).
My paper is related to a number of literatures. It contributes most generally to the broad
literature on the formation and development of institutions, and in particular how citizens'
values are shaped by the institutional setting they are exposed to. One limitation is that
the existing evidence focuses on stated preferences or realized behaviors.11 A second concern
is that previous papers often rely on �institutional shocks� from the past history that had
a transformative impact on many aspects of the political, social and economic environment,
such as in the case of transition from socialism (Aghion et al., 2010) or communism in East
Germany (Alesina and Fuchs-Schündeln, 2007) or North Korea (Kim et al., 2017). Under-
standing the e�ects of institutions on citizens' values, other than intellectually intriguing,
can have important policy implications. For example, exposure to democratic or inclusive
11For example, (Aghion et al., 2010), (Alesina and Fuchs-Schündeln, 2007) and (Kim et al., 2017) usesurvey measures that capture citizens' attitudes and trust towards the state. Other papers instead relyon political preferences and turnout in relation to past voting experience (Fujiwara et al., 2016) or to theexposure to democratic regimes (Fuchs-Schundeln and Schundeln, 2015), violent con�icts (Blattman, 2009)or events building national identity and civic duty (Madestam and Yanagizawa-Drott, 2011).
5

institutions can have a more sustainable impact on citizen's choices and behaviors if these
changes are mediated by a shift in preferences, values and norms.12 In my paper I provide
the �rst direct causal evidence on the link between experiencing democratic and inclusive in-
stitutions and the value that citizens attach to them. I also take advantage of a shock to local
institutions which is limited in time and scope, with no impact on political or socio-economic
dimensions that can be directly related to how citizens value institutions.
Previous literature on procedural utility has primarily focused on individual decision-
making.13 The existing evidence does not easily generalize to the case of group decision-
making, which � especially in case of face-to-face unregulated public negotiations � entails a
di�erent set of potential costs and bene�ts for participants.14 Using ex-post survey measures
of satisfaction, previous studies provide suggestive evidence on whether and how citizens
evaluate that a development program is implemented via a deliberative and participated
process (Alatas et al., 2012; Beath et al., 2017; Madajewicz et al., 2017; Olken, 2010). In a
recent review, Casey (2018) stresses the need to better understand the potential participation
costs of participatory initiatives. My paper provides the �rst incentivized measure of the net
value that citizens attach ex-ante to di�erent decision-making processes in the context of
group deliberations.
Finally, my paper relates to the literature on the e�ect of participatory initiatives on
local institutions. By encouraging participation and dialogue between social groups, CDD
programs are often promoted as a potential channel to build social cohesion and strengthen
democratic values and practices (Mansuri and Rao, 2013).15 However, exposure to CDD
12A large body of research in political science and sociologyholds that democratic values play a key rulein inducing and supporting democratic institutions, for example because democratic attitudes can sustaincitizens' willingness to struggle for democracy and cumulated values can increase the stability of democracies(Besley and Persson, 2018; Persson and Tabellini, 2009).
13The economic concept of procedural utility was �rst advanced by Frey et al. (2004) and Frey and Stutzer(2005). The existing evidence in the context of individual decision-making indicates that agents evaluatethe decision processes per se (Bolton et al., 2005), their voting rights (Güth and Weck-Hannemann, 1997),their autonomy and decision power (Bartling et al., 2014; Fehr et al., 2013; Neri and Rommeswinkel, 2014;Owens et al., 2014). Rather than being a �xed construct, demand for agency is in�uenced by social norms,for example gender norms (Afzal et al., 2018).
14Deliberative processes might create a sense of legitimacy for resource allocation, and bene�ciaries oftenseem to value being consulted and involved. However, the exercise of voice and choice can be costly, forinstance because of the opportunity cost of the time dedicated to participation, the psychological costs ofcon�ictual deliberations, or the material/social costs incurred when citizens take positions that are contraryto the interests of powerful groups (Mansuri and Rao, 2004).
15Additionally, community participation is often proposed as a method to improve the quality of develop-ment programs and service delivery. Community participation can e�ectively incorporate local knowledgeinto planning, implementation and monitoring of interventions (Alatas et al., 2012), generate accountabilityfor service delivery (Björkman et al., 2017; Björkman and Svensson, 2009; Reinikka and Svensson, 2011;World Bank, 2014) and reinforce stakeholders' sense of ownership over project assets (Alatas et al., 2012).However, successful experiences of community mobilization are counterbalanced by projects with limitedwelfare impacts (Banerjee et al., 2010; Khwaja, 2004; Olken, 2007) or whose outcomes are distorted in favor
6

programs does not seem to a�ect local governance (Casey et al., 2012; Humphreys et al.,
2012; van der Windt et al., 2018).16 Fearon et al. (2015) and Casey et al. (2018) argue that
exposure to CDD programs seems create �zombie� institutions that exist on paper but in
practice remain unadopted.17 As stressed in Casey (2018), it remains to be explained why
CDD programs, despite being e�ective in bringing public goods to poor communities, fail to
induce local institutional changes. One potential explanation is simply that the temporary
experience of democratic and inclusive institutions does not increase the value that citizens
attach to them. In this paper I show that this hypothesis appears unlikely to explain the
absence of changes in local institutions.
The �ndings of this paper elucidate one potential mechanism for institutional develop-
ment. Citizens demand being involved in decision-making for their community, and this can
encourage initiatives from governments and international organizations aimed at promoting
community participation and decentralization reforms. While previous evidence indicates
that participatory initiatives have no impact on local governance, I �nd that experiencing in-
clusive institutions does strengthen the value that citizens attach to them. What can explain
these supposedly contrasting results? One possible explanation is that, while experiencing
inclusive institutions increases the value that citizens attach per se on being involved in
decision-making, it also induces more realistic expectations on the personal bene�ts from
participation, with an ambiguous e�ect on the overall demand for institutional reforms. An
alternative explanation is that the exposure to CDD programs can change social values for
participatory practices in receiving communities, but these changes will not necessarily trans-
late into realized institutional reforms, as institutions are persistent and constrained by the
existing social and political structures within a society. This explanation would have signi�-
cant policy implications, as it would suggest that interventions aimed at fostering institutional
development should focus on relaxing such potential constraints.
In the remaining of the paper I �rst describe the data collection (Section 2) and the
sample (Section 3). In Section 4 I illustrate the design of the lab-in-the-�eld experiment and
the details of the WTP elicitation, and in Section 5 I describe my novel measure of value of
of local elites (Alatas et al., 2013; Labonne and Chase, 2009) or wealthier communities (Baird et al., 2013).Recent reviews agree that the available evidence indicates that CDD e�ectively delivers public goods atrelatively low cost (Casey, 2018; White et al., 2018).
16Exposure to CDD programs does have signi�cant e�ects on self-reported pro-social values and norms(Avdeenko and Gilligan, 2015; Ibanez and Rao, 2005; Labonne and Chase, 2011), but it is unclear how these�ndings are driven by experimenter demand e�ects.
17For example, Beath et al. (2013) �nd that local elected councils function e�ectively several years aftertheir creation as part of a CDD program in Afghanistan, but communities rely on them to take collectivedecisions only when speci�cally called upon by external agencies. Similarly, Casey et al. (2018) shows thatcommunities that received a CDD program in Sierra Leone are more likely to have a village developmentcommittee, but this committees are not being used for much in practice.
7

participatory decision-making. Section 6 presents the CDD program and explains why it can
be used as a temporary exogenous shock to local institutions. In Section 7 I test whether the
experience of inclusive institutions through the CDD program had an impact on the value
of participatory decision-making measured via the lab-in-the-�eld experiment, and discuss
potential mechanisms. Section 8 concludes with policy implications and avenues for future
work.
2 Data
The project relies on data collected during a baseline household survey, a baseline water
source census, the implementation of the CDD program and the lab-in-the-�eld experiment
(Figure A.1). The set up allows to link individual data from the lab-in-the-�eld experiment
to detailed information collected within the CDD program during the baseline survey and
during the project implementation. The richness of the data allows me to explore the mech-
anisms that might drive the e�ect of the CDD program on the value that people place on
participatory decision-making.
Baseline data collection
The baseline data collection was carried out between August 2015 and February 2016,
before the randomization of the CDD treatment status and before the implementation of the
intervention. The household survey includes information on household's composition, health,
wealth, network, leadership and participation in the life of the community. I rely on this in-
formation in order to stratify the sample of participants to the lab-in-the-�eld experiment by
household leadership status (Section 3), and for estimating heterogeneous treatment e�ects.
CDD program
The CDD intervention started in October 2015 and was completed by August 2017. I rely
on rich implementation data in order to characterize the dynamic of community discussion,
the degree of participation of each household in the community debate and deliberation, and
the distribution of bene�ts from the program within the community. This data allows me
to provide suggestive evidence on whether the e�ect of the CDD program on the value of
participatory decision-making is driven by the characteristics of the community discussion,
the quality of community decisions or the welfare impact of the intervention.
Lab-in-the-�eld experiment
8

The lab-in-the-�eld experiment was run between December 2016 and May 2017.18 The
experiment was always conducted after decisions regarding the CDD program were taken by
the community during the community meetings.19 Participants successfully invited to the
experiment complete an individual survey on social values and attitudes (Appendix D.4).
During the experimental session, a team of six enumerators record the outcomes from each
task and the time required to each group/player to complete each task, as well as their
observations on group dynamics, their perceived level of con�ict within the group and indi-
vidual bargaining skills. After the experimental session and before payments are disbursed,
participants complete a short individual questionnaire on understanding of the tasks and
satisfaction (Appendix E.5).
3 Sample
3.1 Selection of communities
The communities enrolled in the CDD programs were 171, 42 in the control and and 129 in
the treated group. Because of budget constraints, I carried out the lab-in-the-�eld experiment
only in 96 communities (35 control and 61 treated communities).20
I select the villages where to conduct the lab-in-the-�eld experiment primarily via an
optimization procedure that maximizes the balance between the treatment and the control
group.21 The main rationale for this optimization procedure is small sample bias reduction.
In Appendix C, I describe the optimization procedure in details, and I report the set of pre-
intervention observables used to test the balance between the treatment and control group.
As ensured by this optimization procedure, treated and control communities selected for the
lab-in-the-�eld experiment are balanced (Table A19). As indicated in the pre-analysis plan,
in one of the robustness checks I correct standard errors in order to take into account this
18Every day we conduct the lab-in-the-�eld experiment in a di�erent community. We work sequentially innearby communities, and I do not expect information about the lab to spread across communities throughexisting social networks so rapidly.
19In order to avoid possible confounding e�ects, I try to run the experiment after the full implementationof the CDD program: after the community failed to raise contributions or after the tubewell installationwas complete. In only 7 communities the lab-in-the-�eld experiment was conducted before the tubewellinstallation work was completed.
20The lab-in-the-�eld experiment was run between December 2016 and May 2017. Because the CDDprogram was scheduled to be implemented in the Gaibandha District in 2017, I carried out the lab-in-the-�eld experiment only in the Bogra District.
21I follow an optimization algorithm that selects as best sample � out of 1,000 random samples � the onewith the highest pvalue from the F-test on the balance of pre-intervention observables between treated andcontrol villages. The random sampling procedure respects the strati�cation by Union of the CDD intervention,and it is balanced on contribution approaches.
9

sample selection procedure.
The sample departs from this selection rule in two respects. One, I excluded six commu-
nities where he CDD program failed because of hydro-geological reasons that impeded the
installations of new safe water sources (�exogenous failures�). At the time of sample selection
(November 2016), the implementing partner NGOF was exploring the possibility to adopt
an improved installation technology, and therefore to make a second installation attempt in
communities where the �rst one failed. Because I did not want to contaminate the CDD
program with the lab-in-the-�eld experiment before the intervention was complete, I decided
to not run the lab-in-the-�eld experiment in communities where the CDD program �failed
exogenously�.22 Because these cases concerns only one Union, in one pre-speci�ed robustness
check I verify that the main treatment e�ect does not vary if I include or exclude this Union.
Two, I oversampled four communities where the CDD program failed due to tensions and
disagreements within the community or lack of interest in the CDD program (�endogenous
failures�).23 At the time of sample selection, in agreement with project sta�, I excluded these
communities because of feasibility constraints.24 As the project sta� gained experience with
the implementation of the lab-in-the-�eld experiment, I was able to revise this decision and
add these four communities to the sample of 92 communities selected via the optimization al-
gorithm. Because I oversampled communities where the CDD program �failed endogenously�,
the estimates of the main treatment e�ect might be downward biased. In order to correct
this bias, I pre-speci�ed to weight all regressions by the probability of each community to be
selected by the optimization algorithm.25 In addition, in one of the pre-speci�ed robustness
checks, I verify that the main �ndings are not driven by the choice to include or exclude
these four oversampled communities.
22These cases are concentrated in one Union only, speci�cally in the South-Eastern region of Deuli Union.This results in a non-homogeneous geographic distribution of treated and control communities in Deuli Union.In Deuli Union, communities involved in the lab-in-the-�eld experiment are widespread in the whole area ifthey belong to the control group, but they are mainly from the North-Western area if from the treated group.
23The CDD program failed �endogenously� in four communities: (i) one where the community was notinterested in holding the meeting; (ii) two where the community did not reach an agreement during thecommunity meetings; (iii) one where installation failed for one tubewell and cash contributions failed for theother tubewell.
24Although aware that this selection might create an upward bias in my estimates, this choice was imposedby feasibility constraints. We thought it was unfeasible to conduct the lab-in-the-�eld experiment in commu-nities where the implementation of the CDD program created tensions within the communities and betweenthe community and project sta�.
25In order to derive the weights, I repeat the optimization procedure 1,000 times on the full sample ofTreatment Units in the CCLPG program, and for each Treatment Unit I calculate the probability to beincluded in the optimal sample.
10
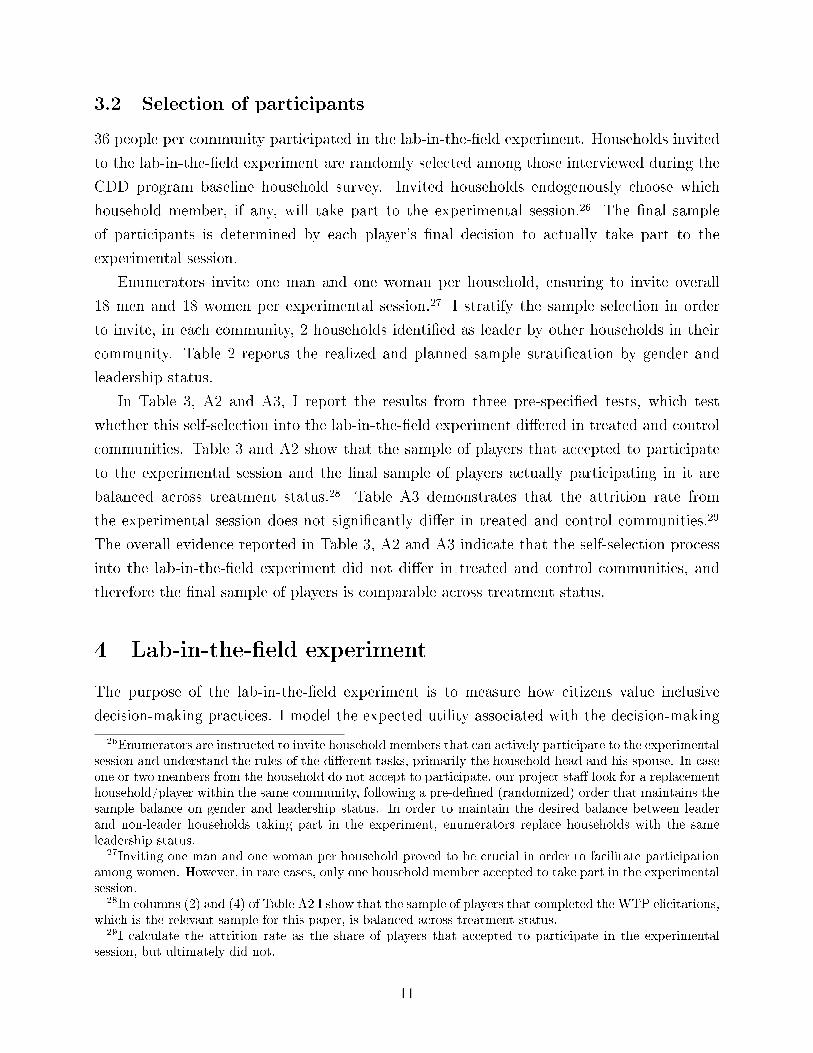
3.2 Selection of participants
36 people per community participated in the lab-in-the-�eld experiment. Households invited
to the lab-in-the-�eld experiment are randomly selected among those interviewed during the
CDD program baseline household survey. Invited households endogenously choose which
household member, if any, will take part to the experimental session.26 The �nal sample
of participants is determined by each player's �nal decision to actually take part to the
experimental session.
Enumerators invite one man and one woman per household, ensuring to invite overall
18 men and 18 women per experimental session.27 I stratify the sample selection in order
to invite, in each community, 2 households identi�ed as leader by other households in their
community. Table 2 reports the realized and planned sample strati�cation by gender and
leadership status.
In Table 3, A2 and A3, I report the results from three pre-speci�ed tests, which test
whether this self-selection into the lab-in-the-�eld experiment di�ered in treated and control
communities. Table 3 and A2 show that the sample of players that accepted to participate
to the experimental session and the �nal sample of players actually participating in it are
balanced across treatment status.28 Table A3 demonstrates that the attrition rate from
the experimental session does not signi�cantly di�er in treated and control communities.29
The overall evidence reported in Table 3, A2 and A3 indicate that the self-selection process
into the lab-in-the-�eld experiment did not di�er in treated and control communities, and
therefore the �nal sample of players is comparable across treatment status.
4 Lab-in-the-�eld experiment
The purpose of the lab-in-the-�eld experiment is to measure how citizens value inclusive
decision-making practices. I model the expected utility associated with the decision-making
26Enumerators are instructed to invite household members that can actively participate to the experimentalsession and understand the rules of the di�erent tasks, primarily the household head and his spouse. In caseone or two members from the household do not accept to participate, our project sta� look for a replacementhousehold/player within the same community, following a pre-de�ned (randomized) order that maintains thesample balance on gender and leadership status. In order to maintain the desired balance between leaderand non-leader households taking part in the experiment, enumerators replace households with the sameleadership status.
27Inviting one man and one woman per household proved to be crucial in order to facilitate participationamong women. However, in rare cases, only one household member accepted to take part in the experimentalsession.
28In columns (2) and (4) of Table A2 I show that the sample of players that completed the WTP elicitations,which is the relevant sample for this paper, is balanced across treatment status.
29I calculate the attrition rate as the share of players that accepted to participate in the experimentalsession, but ultimately did not.
11

process p as having three components: the expected individual outcome from the decisions
taken under arrangement p;30 the intrinsic value that agents might place on taking decisions
via arrangement p (precedural utility); the expected time cost of participating in the decision-
making process p:31
Valuep = Expected outcomep +Procedural Utilityp −Time costp (1)
In the context of participatory governance, the procedural utility term from arrangement
p can be interpreted as the net evaluation of procedure p, as resulting from, for example,
legitimacy of the decision outcomes, value of autonomy and self-expression, stress and risk of
con�icts, social and psychological costs of negotiating, actively participating in deliberations
and publicly disagreeing. Although the value that citizens attach to taking common-interest
decisions via procedure p can be modelled in a more comprehensive fashion, this framework
mirrors exactly the experimental design.32 The main objective of the design is to disentangle
instrumental and intrinsic motives and ensure that the time cost component does not vary
across decision-making processes.
One experimental session is carried out in each community separately.33 Each experi-
mental session is conducted with 12 groups of three people each and it is divided in 5 main
stages, illustrated in Figure 1.34 In this paper I focus on the WTP elicitations, which al-
low me to measure my main variable of interest: the net value that agents attach to take
decisions regarding their group in a participatory way. During the WTP elicitations, par-
ticipants are presented with group tasks inspired to redistribution games and public good
games. Participants can choose, under di�erent price conditions, how to solve these group
tasks during the last stage of the experiment: if via a participatory process or not. In order
to incentivize participants to report their preferences truthfully, each of their choices has a
30This term depends on the context in which decisions are taken. For example it can be thought as accessto safe water in the context of an arsenic-mitigation program, or receiving a cash-transfer in the context ofa social safety net program.
31These three components mirror the three terms in the Downsian �calculus of voting� framework (Downs,1957; Riker and Ordeshook, 1968; Tullock, 1968). In the context of individual decision-making, Bartling et al.(2014) already discuss that preferences for being in control of own decisions might be driven by instrumentaland intrinsic motives.
32For example, altruistic agents might evaluate di�erent institutional settings not only based on their ownexpected outcome, but considering also the expected outcomes of others and the fairness of the resultingdistribution. Because di�erent decision-making processes can be associated to di�erent level of uncertainty,my simple framework can also be extended in order to take into account the variance of the decision outcomesand agents' risk aversion.
33In Appendix E I report the scripts of the experimental session.34The lab-in-the-�eld experiment is conducted in collaboration with Selene Ghisol�. In a related paper,
Ghisol� (2018) studies the dynamics of group-bargaining occurring during Task 1 and Task 2. Despite wejoined forces for fund raising and implementation of the experiment, our research projects are originated,developed and designed independently.
12
positive probability to be implemented during the last stage of the experiment.
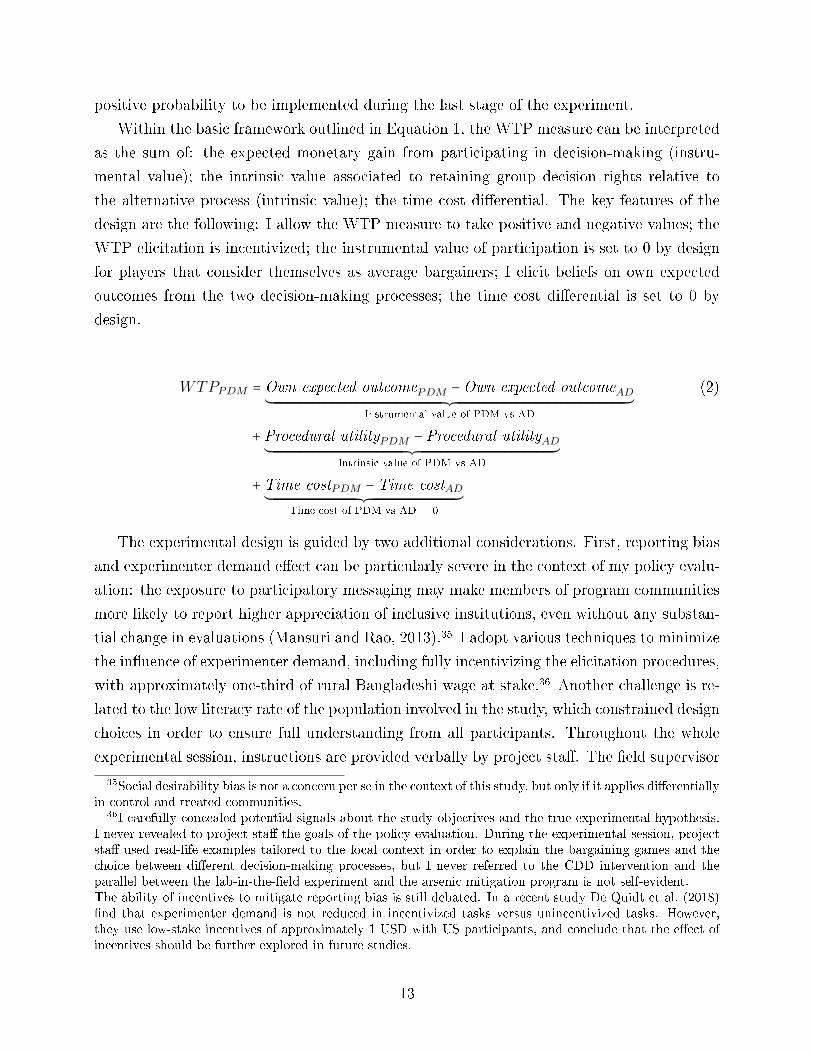
Within the basic framework outlined in Equation 1, the WTP measure can be interpreted
as the sum of: the expected monetary gain from participating in decision-making (instru-
mental value); the intrinsic value associated to retaining group decision rights relative to
the alternative process (intrinsic value); the time cost di�erential. The key features of the
design are the following: I allow the WTP measure to take positive and negative values; the
WTP elicitation is incentivized; the instrumental value of participation is set to 0 by design
for players that consider themselves as average bargainers; I elicit beliefs on own expected
outcomes from the two decision-making processes; the time cost di�erential is set to 0 by
design.
WTPPDM = Own expected outcomePDM −Own expected outcomeAD´¹¹¹¹¹¹¹¹¹¹¹¹¹¹¹¹¹¹¹¹¹¹¹¹¹¹¹¹¹¹¹¹¹¹¹¹¹¹¹¹¹¹¹¹¹¹¹¹¹¹¹¹¹¹¹¹¹¹¹¹¹¹¹¹¹¹¹¹¹¹¹¹¹¹¹¹¹¹¹¹¹¹¹¹¹¹¹¹¹¹¹¹¹¹¹¹¹¹¹¹¹¹¹¹¹¹¹¹¹¹¹¹¹¹¹¹¹¹¹¹¹¹¹¹¹¹¹¹¹¹¹¹¹¹¹¹¹¹¹¹¹¹¹¹¹¹¹¹¹¹¹¹¹¹¹¹¹¹¹¹¹¹¹¹¹¹¹¹¹¹¹¹¹¹¹¹¹¹¹¹¹¹¹¹¹¹¹¹¹¹¹¹¹¹¸¹¹¹¹¹¹¹¹¹¹¹¹¹¹¹¹¹¹¹¹¹¹¹¹¹¹¹¹¹¹¹¹¹¹¹¹¹¹¹¹¹¹¹¹¹¹¹¹¹¹¹¹¹¹¹¹¹¹¹¹¹¹¹¹¹¹¹¹¹¹¹¹¹¹¹¹¹¹¹¹¹¹¹¹¹¹¹¹¹¹¹¹¹¹¹¹¹¹¹¹¹¹¹¹¹¹¹¹¹¹¹¹¹¹¹¹¹¹¹¹¹¹¹¹¹¹¹¹¹¹¹¹¹¹¹¹¹¹¹¹¹¹¹¹¹¹¹¹¹¹¹¹¹¹¹¹¹¹¹¹¹¹¹¹¹¹¹¹¹¹¹¹¹¹¹¹¹¹¹¹¹¹¹¹¹¹¹¹¹¹¹¹¹¹¶Instrumental value of PDM vs AD
(2)
+Procedural utilityPDM −Procedural utilityAD´¹¹¹¹¹¹¹¹¹¹¹¹¹¹¹¹¹¹¹¹¹¹¹¹¹¹¹¹¹¹¹¹¹¹¹¹¹¹¹¹¹¹¹¹¹¹¹¹¹¹¹¹¹¹¹¹¹¹¹¹¹¹¹¹¹¹¹¹¹¹¹¹¹¹¹¹¹¹¹¹¹¹¹¹¹¹¹¹¹¹¹¹¹¹¹¹¹¹¹¹¹¹¹¹¹¹¹¹¹¹¹¹¹¹¹¹¹¹¹¹¹¹¹¹¹¹¹¹¹¹¹¹¹¹¹¹¹¹¹¹¹¹¹¹¹¹¹¹¹¹¹¸¹¹¹¹¹¹¹¹¹¹¹¹¹¹¹¹¹¹¹¹¹¹¹¹¹¹¹¹¹¹¹¹¹¹¹¹¹¹¹¹¹¹¹¹¹¹¹¹¹¹¹¹¹¹¹¹¹¹¹¹¹¹¹¹¹¹¹¹¹¹¹¹¹¹¹¹¹¹¹¹¹¹¹¹¹¹¹¹¹¹¹¹¹¹¹¹¹¹¹¹¹¹¹¹¹¹¹¹¹¹¹¹¹¹¹¹¹¹¹¹¹¹¹¹¹¹¹¹¹¹¹¹¹¹¹¹¹¹¹¹¹¹¹¹¹¹¹¹¹¹¹¹¶Intrinsic value of PDM vs AD
+Time costPDM −Time costAD´¹¹¹¹¹¹¹¹¹¹¹¹¹¹¹¹¹¹¹¹¹¹¹¹¹¹¹¹¹¹¹¹¹¹¹¹¹¹¹¹¹¹¹¹¹¹¹¹¹¹¹¹¹¹¹¹¹¹¹¹¹¹¹¹¹¹¹¹¹¹¹¹¹¹¹¹¹¹¹¹¹¹¹¹¹¹¹¹¹¹¹¹¹¹¹¹¸¹¹¹¹¹¹¹¹¹¹¹¹¹¹¹¹¹¹¹¹¹¹¹¹¹¹¹¹¹¹¹¹¹¹¹¹¹¹¹¹¹¹¹¹¹¹¹¹¹¹¹¹¹¹¹¹¹¹¹¹¹¹¹¹¹¹¹¹¹¹¹¹¹¹¹¹¹¹¹¹¹¹¹¹¹¹¹¹¹¹¹¹¹¹¹¹¶Time cost of PDM vs AD = 0
The experimental design is guided by two additional considerations. First, reporting bias
and experimenter demand e�ect can be particularly severe in the context of my policy evalu-
ation: the exposure to participatory messaging may make members of program communities
more likely to report higher appreciation of inclusive institutions, even without any substan-
tial change in evaluations (Mansuri and Rao, 2013).35 I adopt various techniques to minimize
the in�uence of experimenter demand, including fully incentivizing the elicitation procedures,
with approximately one-third of rural Bangladeshi wage at stake.36 Another challenge is re-
lated to the low literacy rate of the population involved in the study, which constrained design
choices in order to ensure full understanding from all participants. Throughout the whole
experimental session, instructions are provided verbally by project sta�. The �eld supervisor
35Social desirability bias is not a concern per se in the context of this study, but only if it applies di�erentiallyin control and treated communities.
36I carefully concealed potential signals about the study objectives and the true experimental hypothesis.I never revealed to project sta� the goals of the policy evaluation. During the experimental session, projectsta� used real-life examples tailored to the local context in order to explain the bargaining games and thechoice between di�erent decision-making processes, but I never referred to the CDD intervention and theparallel between the lab-in-the-�eld experiment and the arsenic mitigation program is not self-evident.The ability of incentives to mitigate reporting bias is still debated. In a recent study De Quidt et al. (2018)�nd that experimenter demand is not reduced in incentivized tasks versus unincentivized tasks. However,they use low-stake incentives of approximately 1 USD with US participants, and conclude that the e�ect ofincentives should be further explored in future studies.
13

introduces the lab-in-the-�eld experiment to all participants and gives the main instructions
for each task. Enumerators play a crucial role in ensuring that all participants fully under-
stand the rules of each task: they provide additional clari�cations whenever needed, and
explain in details the WTP elicitation procedure to each participant, individually.37
4.1 Group negotiation tasks
The experimental decision-making process is designed in order to mimic the procedures and
implementation rules that are typical of participatory initiatives. Participants are divided
in groups of three and discuss face-to-face in an unregulated negotiation process in order
to take decisions for the group, which entails common and individual economic interests.
Additionally, group decisions should be taken by unanimous consensus, and groups have
maximum 20 minutes to reach an agreement. These features impose similar dynamics and
constraints as in the CDD program studied in this paper (Section 6), where decisions are
taken by the community during an open negotiation, community members know each other
and will meet each other after the deliberation, and communities have a maximum of 3
community meetings to reach an unanimous agreement, otherwise they lose the possibility
to receive the intervention.
The group tasks are a �Redistribution task� and a �Contribution task�, played in ran-
dom order.38 Participants receive an initial individual endowment, and then complete the
negotiation exercise with their group peers.39 During the �Redistribution task�, participants
receive their individual endowment and negotiate on how to redistribute among themselves
a group endowment of 30 tokens. In the �Contribution task�, participants decide how much
of their initial endowment to contribute for the creation of a common pool of resources,
equivalent to twice the sum of the contributions, and simultaneously negotiate on how to
distribute it. The �Redistribution task� mimics a situation when bene�ciary communities
receive development interventions or public service provisions for free, but they are involved
37I do not expect this feature to worsen concerns related to experimenter demand e�ect. I always discussedthe purposes of the lab-in-the-�eld experiment with project sta� in terms of understanding the dynamicsof group bargaining and preferences for participation in the context of rural Bangladesh. I never revealedthat the project aims at evaluating how the CDD intervention a�ects evaluations of inclusive institutions.Additionally, while the �eld supervisor was also involved in the implementation of the CDD program, theenumerators took no role in it.
38For both group tasks, participants play one training round and one round with real money at stake.Before starting the training round, participants answers few questions to verify their understanding on therules and on how their �nal rewards are calculated. In order to enable all players, even those with poornumerical skills, to e�ectively take part in the group discussion, participants complete the tasks using simpleand intuitive visual aids.
39Within each community, players are randomly pre-assigned to the equality/inequality treatment. Equal-ity: before each task, participants receive an initial endowment of 10 tokens. Inequality: before each task,participants in each group randomly receive initial endowments of 15, 10 token or 5 tokens.
14

in decision-making regarding how to redistribute project bene�ts within the community. The
�Contribution task� is the experimental counterpart of community projects that, in addition,
require communities to co-fund the project with cash or labour contributions.40
For this paper, the �Contribution task� and the �Redistribution task� serve two main
purposes. First, during Task 1 and Task 2, all participants experience the discussion dynamics
and observe the outcomes of the deliberation. This is a crucial feature in order to allow
participants to take meaningful choices when I present them the option to choose the decision-
making process for Task 3. Second, it allows me to directly observe players' performance
within an open negotiation process, which I expected to play an import role in driving their
preferences for the decision-making process for Task 3.
4.2 WTP elicitation
During the WTP elicitation, I randomly assign to participants their initial individual en-
dowment for Task 3, and I inform them that during Task 3 they might face again the same
group task as in the �Contribution task� or the �Redistribution task�, with new group peers,
randomly selected and ex-ante unknown. I o�er them the possibility to decide ex-ante how
they want their group to take decisions during Task 3. The �rst option is the participatory
decision-making process (PDM): the same negotiation process that they already experienced
under Task 1 and Task 2. The other option is to not participate in decision-making and
receive an assigned distribution of tokens (AD). In this latter case, the group receives the
outcome distribution decided by another group, randomly selected within the same commu-
nity, during that task.41
I measure individual willingness to pay for participatory decision-making using a binding
auction design. I start by presenting participants a hypothetical choice between �participatory
decision-making� and �assigned distribution� at zero price. I present to all participant ten
other choices by varying the price attached to the participatory option, ranging from -5 tokens
to +5 tokens.42 I de�ne individual WTP as the highest price attached to the participatory
40Community contributions � in cash, kinds, or labor � are a key component of CDD programs. Co-�nancing requirements, other than reducing implementation costs, are seen as a way to elicit informationabout demand and to enhance the sense of ownership over project assets. However, this approach is far frombeing uncontroversial. A requirement for �nancial contributions may prevent poorer communities to accessthe intervention. Cash contributions may transfer greater decision power towards local elite and wealthierindividuals, creating a channels through which elites are legitimated to capture project bene�ts. In Coccioloet al. (2018a) we provide the �rst experimental evaluation of the e�ect of contribution requirements oncommunity decision-making and the impact of a project to provide a local public good.
41Each person in the group receive the �nal number of tokens obtained during that group task by theperson in the assigned group with the same initial individual endowment. The group is randomly selectedwithin the same equality/inequality treatment.
42I do not allow players to submit choices that are inconsistent across prices. In these cases, enumerators
15

option at which the participant does not choose the �assigned distribution� option.
By design, because future group peers are randomly selected and ex-ante unknown and
the outcome received under the �assigned distribution� is a random draw from the previ-
ous outcomes of other players within the same community, an average player has the same
unconditional expected monetary outcome under the participatory process or the �assigned
distribution� procedure. Additionally, all monetary rewards are disbursed at the end of the
experimental session, after all groups completed Task 3 and after a short individual ques-
tionnaire, therefore there is no time saving from avoiding the participatory decision-making
process.43 These are the key features of the design, which allow to interpret, following Equa-
tion 2, the WTP measure as a close approximation of the intrinsic value of participation in
group decisions.
This interpretation of the WTP measure applies only to participants that consider them-
selves average negotiators. For players that expect to receive above- or below-average out-
comes from participating in group decisions, the WTP measure should be interpreted as the
sum of the instrumental and intrinsic components. In order to measure the share of partic-
ipants whose instrumental value of taking part in group negotiation is zero, I elicit players'
beliefs on their expected outcomes under the two decision-rules. I incentivize their answers
by awarding a prize if their guess under the �assigned distribution� option is correct. The be-
liefs elicitation is not incentivized for the �participatory decision-making� option, as it would
not be incentive compatible given the ability of players to collude during Task 3. The beliefs
elicitation also allows to calculate the instrumental value of participation and to derive an
explicit measure of the intrinsic value of participatory decision-making for all players.
I complete the WTP elicitation with one participant per group, individually assisted by
one enumerator. This approach ensures that one of participant's choices will be implemented
in the last stage of the experiment, without diluting the real incentives associated to the
WTP elicitation procedure.44 The design presents several further advantages. First, because
are required to review players' choices and, if necessary, clarify the WTP elicitation procedure. Using auditdata automatically recorded with the tablets, I am able to measure the frequency of initial inconsistencies inthe WTP elicitation procedure, which is 18% relatively to Task 1 and 15% relatively to Task 2 (Table A1).
43Despite all participants are required to spend the same amount of time at the experiment, participatingin decision-making in the last stage of the experimental session obviously requires additional e�orts fromparticipants. The mental, social and psychological costs of a face-to-face negotiation process are intrinsiccharacteristics of participatory decision-making which, in my simple framework outlined in Equation 1, areincluded in the Procedural utility term.
44Although I sacri�ce a larger sample size, this feature allows me to assign one enumerator to each partic-ipant during the WTP elicitation within the available budget and the time constraints of the experimentalsession, and it avoids adding further complexities to the design. Conducting the WTP elicitation with allparticipants would have implied to introduce an additional rule to aggregate choices expressed by participantsassigned to the same group in Task 3, for example a majority rule or implementing the choice of one playerper group, randomly extracted.
16

I present all price conditions to all participants and I implement their choices for Task 3,
the elicitation procedure is incentive compatible and it ensures that it is optimal for all
participants to truthfully report their preferences.45 Second, by design players do not know
the identity of their group members for Task 3, ensuring that their choices are not driven by
selection e�ects. Finally, choices are elicited with the assistance of one enumerator, privately
and independently from other players, ensuring understanding from all participants and
preventing individual choices to be in�uenced by peer pressure or reputation concerns.46
4.3 Realization of choices
Before the last stage of the experimental session, each participant that completed the WTP
elicitation is randomly assigned one task (�Contribution task� or �Redistribution task�) and
one price between -5 tokens and +5 tokens.
The decision rule for Task 3 depends on whether, relatively to the assigned task at the
assigned price, the participant previously chose the participatory option or not. Participants
with a WTP equal or higher than the assigned price complete Task 3 together with their new
group peers, and pay/receive the assigned price. Participants with a WTP lower than the
assigned price, as well as their new group peers, do not complete the last negotiation stage
and receive the outcome distribution decided by another group randomly selected within the
same community. During the last stage of the experimental session there is approximately
one-third of the Bangladeshi rural daily wage at stake, and this feature should minimize
concerns related to reporting bias and experimenter demand e�ect.
The random selection of the task and the price for participatory decision-making relatively
to Task 3 is conducted privately by the enumerators with each participant that completed
the WTP elicitation stage. The randomly selected price is never revealed to other players,
45To in�uence the results, experimented demand e�ects should be more important to the respondent thanthe real expected gains (in terms of expected monetary outcomes and procedural utility) from answeringtruthfully.
46Enumerators take several steps in order to ensure understanding from all participants. Before the WTPelicitations, enumerators verify individual understanding for each participant on the two decision-makingprocesses and on how their �nal outcome is determined under the two alternatives. Enumerators verifythat crucial elements of the design are clear, speci�cally that under the �participatory decision-making�option they will bargain with new group peers, and that under the �assigned distribution� option they willbe assigned the �nal outcome of another player randomly extracted. Enumerators stress that each of theirchoices might be implemented in Task 3, and therefore it is best for them to truthfully report their preferences.They stress that choices are con�dential, and that, by design, other players cannot infer their answers fromthe decision-making process implemented during Task 3. In order to facilitate participants in their choices,enumerators remind them about their outcome in the previous round, ask them whether they liked or dislikedthe bargaining stage and how much they expect to be in�uential in the last stage given their initial tokens.Relatively to the �rst WTP elicitation procedure, the instruction time is on average more than 3 minutes,the WTP elicitation almost 2 minutes and the beliefs elicitation 1.5 minutes (Table A1).
17

and this guarantees that individual choices expressed during the WTP elicitation are never
fully revealed by the decision-making process implemented during Task 3. This is a further
mechanism to ensure that individual choices during the WTP elicitation are not in�uenced
by peer pressure or reputation concerns.
4.4 Payment
Payments are disbursed at the end of the experimental session, only after all groups completed
the last group negotiation during Task 3 and after the completion of a short individual
questionnaire on satisfaction. Participants receives a �xed net show-up fee of 40 Bangladeshi
Takas (1 BDT = 0.013 USD in December 2016).47 They receive a bonus equals to the sum of
their outcomes from Task 1, Task 2 and Task 3, converting 1 token in 5 BDT. Players that
completed the WTP elicitations receive(pay) the randomly assigned price in case they chose
the �participatory decision-making� option under the randomly assigned scenario (task-price).
Correct beliefs on outcomes under the �assigned distribution� option are rewarded with 30
BDT. Participants can expect a total reward between 250 BDT and 500 BDT, equivalent
to 0.8-1.7 local daily wage.48 Therefore, when players in the WTP elicitations express their
preferences on the decision-making process for Task 3, there is approximately one-third of
local daily wage at stake.
5 Value of participatory-decision making
Despite the widespread adoption of participatory development, the question of whether agents
value collective decision-making rights has not been explored before. Democratic and inclu-
sive institutions entails monetary and non-monetary bene�ts (e.g. legitimacy of the decision
outcomes, value of autonomy and self-expression) and costs for citizens (e.g. social and psy-
chological costs of exercising voice and decision rights). In a recent review, Casey (2018)
stresses that, while participation costs have received little attention in the literature, these
considerations should be carefully taken into account when designing and evaluating partic-
ipatory programs. In this Section, I provide novel evidence on this topic by describing the
individual demand for participatory decision-making as well as the instrumental and intrinsic
value that citizens associate to it.
The large majority of participants in my sample prefer to take group decisions in a par-
ticipatory way: 71% of participants prefer the participatory option at the 0 price condition
47Because the Bangladeshi law requires a �at 10 BDT tax from those with a daily income larger than 400BDT, the gross show-up fee is 50 BDT for participants with total outcome higher than 400 BDT.
48The average daily income in rural Bangladesh is approximately 300 BDT.
18

(WTP ≥ 0), and 47% have a strictly positive WTP for participatory decision-making. By
aggregating participants choices with a simple majority rule, I observe that 84% of commu-
nities would choose to adopt a participatory decision-making process at 0 price, and 34%
of them even at positive prices. This is in line with the consensus emerging from the be-
havioral literature, where several studies show that agents value the decision process per se
(Bolton et al., 2005), their voting rights (Güth and Weck-Hannemann, 1997), their autonomy
and decision power [Fehr et al. (2013), Owens et al. (2014), Bartling et al. (2014), Neri and
Rommeswinkel (2017).
By design, the WTP range is constrained between +5 and -5 tokens, corresponding to
+25 and -25 BDT. Despite these amounts are small in absolute terms, the maximum and
minimum WTP allowed by the design are signi�cant amount within the experiment, as they
represent 25% of the median expected monetary outcome from each group negotiation task.
They are also non-trivial amount in the local context where this study took place, as 5 tokens
correspond to 8% of the average daily income in rural Bangladesh.49 The average WTP is
0.3 tokens, corresponding to 2% of the median expected monetary outcome from the future
group task.
Figure 2 shows the distribution of the WTP measure in my sample. Preferences are
polarized on three main focal points, characterizing three types of agents. 26% of agents
display a strong support for inclusive arrangements: under any o�ered price condition (up
to 8% or rural Bangladeshi wage), they prefer that decisions for their groups are determined
through a participatory decision-making process rather than exogenously assigned. 24% of
participants have a weak preference for participation (WTP = 0), choosing the participatory
option over the �assigned distribution� alternative only at 0 or negative prices, but not at
positive prices. 22% of agents display a strong disfavor for participatory decision-making,
being willing to forgo any o�ered compensation (up to 8% or rural Bangladeshi wage) in
order to avoid the next group deliberation.
As discussed in Section 4, one main feature of the experimental design is that, for players
with self-perceived average bargaining skills, the alternative decision-making process has the
same unconditional expected monetary outcome as the participatory process. I make use
of the beliefs elicitation procedure in order to validate this feature of the design. Figure
3 shows the distribution of the instrumental of participatory decision-making, calculated as
the di�erence in expected outcomes under the �participatory decision-making� option and the
�assigned distribution� alternative.50 As might be expected given the experimental design,
the large majority of participants (71%) expect to receive the same monetary outcome under
49Approximately 300 BDT.50For comparison, I censor the distribution of the instrumental value of participatory decision-making at
the WTP ranges.
19

the �participatory decision-making� option and the �assigned distribution� alternative. A
remaining 11% and 18% of participants expect, respectively, to be penalized or to bene�t
from taking part in decision-making.51 The polarization of evaluations observed in Figure 2
is not mirrored in the distribution of the instrumental value of participatory decision-making,
indicating that players that display a strong support or a strong disfavor for participation
must be motivated by intrinsic considerations.
The WTP measure can be interpreted as the net intrinsic value of participatory decision-
making, but only for players that expect to receive the same monetary outcome from par-
ticipating or not in decision-making. For the remaining 29% of players, the WTP measure
captures both the instrumental value and the intrinsic value of participatory decision-making.
In order to obtain an explicit measure of the intrinsic value of participatory decision-making
for all participants to the experimental session, I apply Equation 2 and calculate the in-
trinsic value of participatory decision-making as the di�erence between the WTP measure
and the instrumental value of participation. In my sample, 45% of participants associate a
positive intrinsic value to taking part in decision-making, above and beyond instrumental
consideration, but for 38% of them the social and psychological costs of participation prevail.
Comparing Figure 2 and Figure 4 con�rms that intrinsic motives drive the highly polarized
views that players have on participatory practices.
These �ndings can elucidate some anecdotal evidence on real-world participatory initia-
tives. Mansuri and Rao (2013) argue that bene�ciaries of development programs seem to
value being consulted and involved in decision-making, and deliberative processes might cre-
ate a sense of legitimacy for the resource allocation. On the other hand, (Mansuri and Rao,
2004) stress that the exercise of voice and choice can be costly, for instance because of psycho-
logical e�orts entailed in public deliberations or the material/social costs when participation
requires taking positions that are contrary to the interests of powerful groups. Alatas et al.
(2012) show that community decision-making often entails extended e�ort and fatigues for
participants. Rather than providing a unifying answer to these contrasting arguments, my
�ndings indicate that the intrinsic value associated to participating in decision-making is
indeed highly heterogeneous across agents.
51The experimental data allows to verify whether players have correct beliefs on the monetary outcome fromparticipating and non-participating in decision-making. Figure A.3 and Figure A.4 show that, respectively,55% and 27% of participants have correct beliefs on their own monetary outcome from participating or non-participating in decision-making. On average, errors are small: more than 60% of participants predict theirmonetary outcome from participating and non-participating in decision-making within a +/- 2 tokens range.Accuracy of beliefs is partially explained by the small variation in the outcomes from the group negotiationtasks. Ghisol� (2018) shows that groups seem to follow fairly homogeneous strategies on how to solve thegroup tasks, especially in the �Redistribution task�. For example, among groups with an equal distribution ofinitial individual endowments, respectively 80% and 63% distribute the group resources equally when solvingthe �Redistribution task�/�Contribution task�.
20

The rich data collected before and during the lab-in-the-�eld experiment allows me to
explore the determinants of these heterogeneity. The estimates reported in Table 4 indicate
that the group dynamic and the quality of the negotiation process experienced in the pre-
vious experimental group tasks are critical factors in shaping evaluations of participatory
decision-making, primarily via instrumental motives. For example, the instrumental value of
participatory decision-making is higher for players that were able to obtain an higher out-
come in the previous group task, and in groups with higher realized inequality. I observe
that agents take into account the group negotiation task that they previously experienced,
and update accordingly their beliefs on their ability to in�uence the group deliberation in
their favor. In line with the theoretical predictions in Osborne et al. (2000), these strategic
considerations partially drive participation choices, and agents that expect to be able to exert
greater in�uence over decisions are more likely to self-select into participation.
Choosing to participate in decision-making is also correlated with socio-economic char-
acteristics that are associated with lower costs of participation. For example, value of par-
ticipation is higher for leaders and lower for women (Table 5). Because the instrumental
value of participation does not di�er across socio-economic groups, di�erences in the WTP
for participatory decision-making must be driven by intrinsic motives. Leader households
may place a higher value on participation because they are more used to be involved in com-
munity decision-making and therefore associate a lower social/psychological costs to taking
part in a public debate. The opposite might be true for women, who in the Bangladeshi
rural context rarely play an active role in the public sphere and therefore their participation
choices might be constrained by social norms and self-perceived barriers to public express
own opinions and possibly disagreeing with others.52 These considerations are in line with
the positive self-selection of bene�ciaries in community meetings that is often observed during
the implementation of CDD programs (Besley et al., 2005; Labonne and Chase, 2009; White
et al., 2018). It is worth noticing that CDD programs often mandate participation quota for
historically marginalized groups, such as women or the poor. Casey (2018) raises concerns
that explicit requirements to include the poorest and most marginalized groups in project ac-
tivities might represent a regressive tax, for example because of time-opportunity costs. My
evidence extends these considerations beyond time-opportunity costs, looking explicitly at
the instrumental and intrinsic value of participation for di�erent socio-economic groups. For
example, because women associate a lower value to participatory decision-making, we should
be conscientious of the potential hidden welfare costs of mandating women participation in
community decision-making.
52In line with this result, Fafchamps and Hill (2018) �nd that demand for agency and the value of decidingautonomously are smaller among Pakistani women than Pakistani men.
21

Because the intrinsic value of participatory decision-making is obtained as a residual term
between the WTP and the instrumental value measures, it potentially captures a variety of
social attitudes and values that are not explicitly modelled in the simple framework outlined
in Equation 1. In order to address these concerns, in Table A4 I show how the WTP,
instrumental value and intrinsic value measures correlate with a battery of social attitudes
and values elicited before the lab-in-the-�eld experiment. As expected, the instrumental
values of participatory decision-making is higher for those players that perceive themselves
as good negotiators. The WTP and the instrumental/intrinsic value of participatory decision-
making are not driven by other social attitudes and values, such as trust towards others, risk
aversion, fairness preferences or generosity.53 Therefore, the available evidence suggests that
the WTP and the intrinsic value measures can be interpreted as good proxies of the value
that agents place on participatory practices per se.
6 The CDD program
Does experiencing inclusive institutions a�ect how citizens value them? In order to answer
this question I combine the value of participatory decision-making measured via the lab-in-
the-�eld experiment with random exposure to inclusive institutions through a CDD program.
The CDD program is an arsenic mitigation program conducted in rural Bangladesh (Cocciolo
et al., 2018a). The program consists of a package of technical advice and subsidies for the
installation of new sources of safe drinking water, and it has strong participatory components.
Communities take all key decisions regarding project implementation and maintenance:
(i) how many water sources to install in the community; (ii) where to construct them; (iii)
how to divide the required contributions between households, if required; (iv) who are the
households responsible for the management and maintenance of each new water source. These
decisions are crucial because they determine which households will have access to the new
safe water source and the sustainability of the new public infrastructure. Communities take
all decisions at meetings organized by project sta�. Project sta� organize information meet-
ings in order to increase awareness of water safety issues and stressing the importance that
everyone takes an active part in the community meeting. The community meetings are held
only if minimum participation requirements are met. All decisions must be taken by unan-
imous consensus during the meeting in the presence of project sta�. The project is not
implemented in communities where an agreement is not found after a maximum of three
community meetings. The rules and procedures imposed on the decision-making process
53All measures reported in Table A4 are non-incentivized, except �Generosity�, which represents the amountdonated in an incentivized dictator game.
22
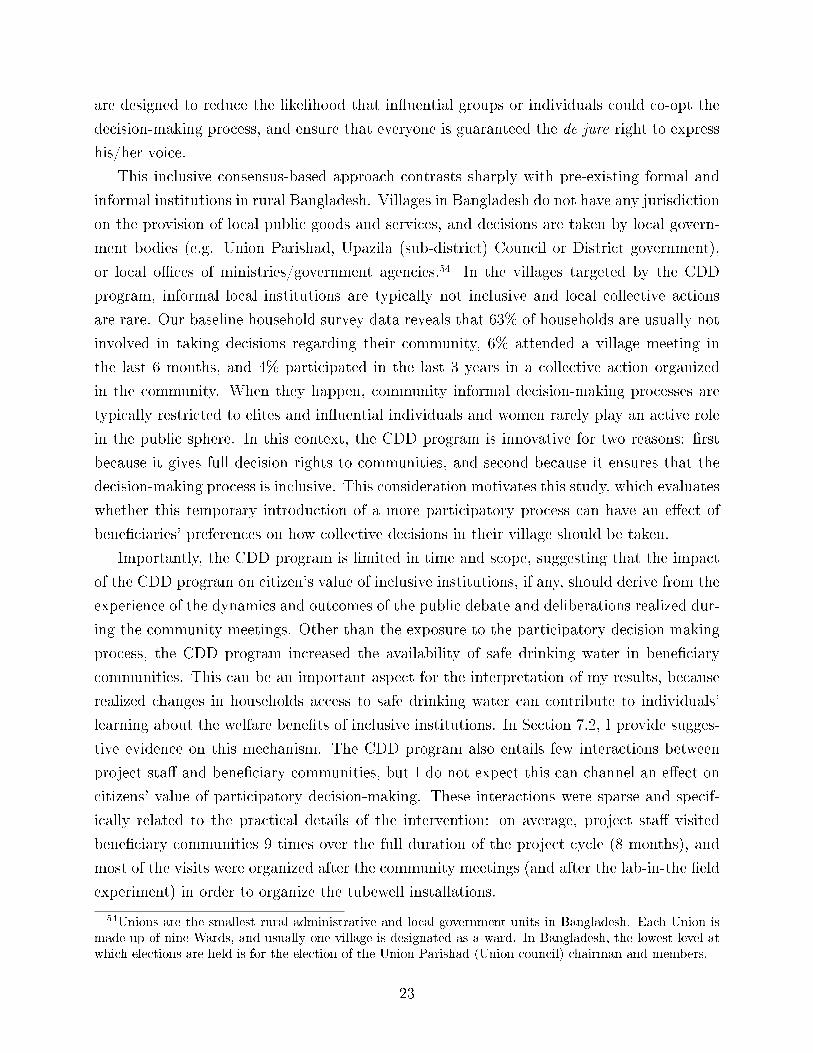
are designed to reduce the likelihood that in�uential groups or individuals could co-opt the
decision-making process, and ensure that everyone is guaranteed the de jure right to express
his/her voice.
This inclusive consensus-based approach contrasts sharply with pre-existing formal and
informal institutions in rural Bangladesh. Villages in Bangladesh do not have any jurisdiction
on the provision of local public goods and services, and decisions are taken by local govern-
ment bodies (e.g. Union Parishad, Upazila (sub-district) Council or District government),
or local o�ces of ministries/government agencies.54 In the villages targeted by the CDD
program, informal local institutions are typically not inclusive and local collective actions
are rare. Our baseline household survey data reveals that 63% of households are usually not
involved in taking decisions regarding their community, 6% attended a village meeting in
the last 6 months, and 4% participated in the last 3 years in a collective action organized
in the community. When they happen, community informal decision-making processes are
typically restricted to elites and in�uential individuals and women rarely play an active role
in the public sphere. In this context, the CDD program is innovative for two reasons: �rst
because it gives full decision rights to communities, and second because it ensures that the
decision-making process is inclusive. This consideration motivates this study, which evaluates
whether this temporary introduction of a more participatory process can have an e�ect of
bene�ciaries' preferences on how collective decisions in their village should be taken.
Importantly, the CDD program is limited in time and scope, suggesting that the impact
of the CDD program on citizen's value of inclusive institutions, if any, should derive from the
experience of the dynamics and outcomes of the public debate and deliberations realized dur-
ing the community meetings. Other than the exposure to the participatory decision-making
process, the CDD program increased the availability of safe drinking water in bene�ciary
communities. This can be an important aspect for the interpretation of my results, because
realized changes in households access to safe drinking water can contribute to individuals'
learning about the welfare bene�ts of inclusive institutions. In Section 7.2, I provide sugges-
tive evidence on this mechanism. The CDD program also entails few interactions between
project sta� and bene�ciary communities, but I do not expect this can channel an e�ect on
citizens' value of participatory decision-making. These interactions were sparse and specif-
ically related to the practical details of the intervention: on average, project sta� visited
bene�ciary communities 9 times over the full duration of the project cycle (8 months), and
most of the visits were organized after the community meetings (and after the lab-in-the �eld
experiment) in order to organize the tubewell installations.
54Unions are the smallest rural administrative and local government units in Bangladesh. Each Union ismade up of nine Wards, and usually one village is designated as a ward. In Bangladesh, the lowest level atwhich elections are held is for the election of the Union Parishad (Union council) chairman and members.
23

The CDD program does not have an impact on other political or socio-economic dimen-
sions that can be directly related to how citizens value institutions (Table A13). Improved
access to safe water can a�ect the time devoted to household chores and labor activities,
but in the context of rural Bangladesh households are not willing to walk long to access safe
water, and water collection is almost entirely a women' responsibility, who have limited op-
tions outside home production.55 Participating in community decision-making and collective
actions can boost community cohesiveness and trust and extend the existing network struc-
ture. However, communities targeted by the CDD program are small � between 50 and 250
households � and relatively homogeneous (e.g. in terms of religion), community members
well know each other, and they report high trust and good community relations. In this
context, the dynamics fueled by the CDD program can hardly make a durable impact on the
level and quality of household interactions.
The CDD program targets communities with high levels of arsenic contamination. The
intervention is located in north-western Bangladesh, in Shibganj and Sonatala Upazilas in
Bogra District and in Gobindaganj Upazila in Gaibandha District, and it is implemented by
the Bangladeshi NGO �NGO Forum for Public Health�. This area was selected for the in-
tervention because government o�cials and national media (Daily Observer, 2014) reported
high levels of arsenic contamination and low levels of prior intervention. Based on water test
results from a census of all existing sources of drinking water in the community (performed
during the baseline data collection), 171 communities were enrolled in the program, 129 se-
lected randomly selected to receive the intervention. Treated communities were randomly
assigned to three contribution requirements: under the cash contribution approach commu-
nities are required to co-fund the installation costs; under the labour contribution approach
communities are required to provide labour to help with the installation work: under the
waiver approach the new water source is installed for free. The randomization of the pro-
gram was performed during public lottery meetings, where we invited representatives from
each eligible community. In order to guarantee complete transparency of the randomization
process and full understanding by bene�ciaries, the randomization was strati�ed only by
Union.56
The intervention was implemented between October 2015 and August 2017. All com-
55Baseline survey data indicate that 76% of households are willing to switch to a new safe water sourcedistant 2 minutes by walking from their house, but only 20% if the water source is 5 minutes away (Coccioloet al., 2018b).
56The program is randomized at �Treatment Unit� level. Treatment Units are communities of 50-250households. Treatment Units are de�ned using administrative household lists at village level. Villages withless than 50 households are excluded from the study, and larger villages are divided into several smallerTreatment Units along pre-existing geographic boundaries. I refer to �communities� or �Treatment units�interchangeably.
24

munities selected to receive the program initially decided to participate, with the exception
of one community. Communities agreed on tubewell location(s) during the �rst community
meeting in 91% of cases, and during the second community meeting in 8% of cases. In only
one case the intervention failed because the community was not able to �nd a consensus
on the tubewell location(s). The CDD program successfully installed at least one tubewell
in 64% of treated communities. In communities assigned to labor or waiver approach the
causes of failures are only related to hydrogeological constraints impeding installation or lack
of suitable land. However, in cash communities the low uptake is primarily due to com-
munities failing to raise the required cash contributions. On average, the CDD program
installed 1.1 tubewells in communities assigned to the labor or waiver approach, and 0.2 in
communities assigned to the cash approach. The majority of tubewells (64%) are located on
private land, and they are on average around 300 feet deep. For each installed tubewell, the
community selected two caretakers, one man and one woman. All caretakers participated in
a one-day training course and are provided with a toolkit for basic maintenance, as well as
contact details for local engineers who are able to provide services for more advanced repairs
if necessary. The details of the implementation are reported in greater details in Cocciolo
et al. (2018b).
7 CDD program and value of participation
One important open debate among both policy-makers and researchers concerns whether the
exposure to democratic or inclusive institutions can lead to sustainable institutional changes.
A prerequisite for sustainable institutional change is that citizens prefer the new institutions
to the old ones. In this Section I provide evidence on this mechanism by combining my
experimental measure of citizens' value of participatory practices (Section 5) with a random
shock to local institutions via a CDD program (Section 6). The lab-in-the-�eld experiment
designs allows me to test the e�ect of experiencing inclusive institutions on how citizens value
them, as well as explaining whether the main e�ect is driven by changes in the instrumental
value or the intrinsic value of inclusive institutions.
The e�ect of the CDD program is estimated using the following speci�cation:
yigc = α + βTc + ηdc + εigc (3)
where yigc is outcome of interest of player i in group g and community c, Tc indicates
whether community c received the CDD program or not, dc are Union �xed e�ects and stan-
25

dard errors are clustered at community level.57 Because the actual exposure to the treatment
depends on the community decision on whether to receive the CDD program and individ-
ual and household decisions about involvement in its implementation (e.g. participation to
the community meeting(s) and contribution to the installation costs/work), β provides the
intention-to-treat e�ect.
7.1 Main treatment e�ect
The main �nding of the paper is that previous experience of inclusive institutions via the CDD
intervention signi�cantly increases the value that subjects attach to participatory decision-
making (Table 6). This e�ect represents an increase of 3% of the WTP relative to the
median expected outcome from the group task, and an increase of 1% of the WTP relative
to the average Bangladesh rural daily wage.58 The exposure to the CDD program does not
change the share of participants with a negative or null WTP for participatory decision-
making. Instead, the main e�ect is driven by a 10 percentage point increase in the share
of participants with a positive value of participation, especially of those that choose the
participatory process under any o�ered price conditions (up to 8% of rural Bangladeshi daily
wage).
Next, I make use of the belief elicitation in order to calculate the instrumental value of
participatory decision-making as the di�erence in expected outcomes from the participatory
decision-making option and the �assigned distribution� alternative. I apply Equation 2 and
calculate the intrinsic value of participatory decision-making as the di�erence between the
WTP of participation and its instrumental value. Table 7 shows that the CDD program has
a positive e�ect on the value of participation, despite a negative e�ect on its instrumental
value. Agents in treated communities have less optimistic expectations on the bene�ts from
participatory decision-making: experiencing the CDD program leads to a lower share of
players that expect to gain from participating in decision-making and an increase in the
share of players that expect to receive the same monetary outcome from the participatory
decision-making option and the �assigned distribution� alternative (Figure 6). The main
treatment e�ect is driven by an increase in the intrinsic value of participatory practices,
above and beyond instrumental considerations (Table 7). Figure 7 shows that the exposure
to the CDD program leads to a decrease in the share of players with a negative intrinsic value
of participatory decision-making, and a corresponding increase among those with a positive
57Following the pre-analysis plan, the regressions, unless speci�ed, are estimated pooling together the datafrom the �Redistribution task� and the �Contribution task�.
58The estimated e�ect doubles if I take into account that the WTP variable is censored both from aboveand below at 5/-5 tokens (column (2)).
26

intrinsic value.59
Despite CDD programs are often promoted as a way to empower the more marginalized
groups (e.g. women, non-elites, the poorer) in the society, I do not �nd that the main
treatment e�ect varies signi�cantly across socio-economic groups (Table A7). It should be
noted though that my study is under-powered to detect these heterogeneous e�ects. One
alternative explanation might be that the implementation of CDD interventions necessarily
interacts with the existing social structure in receiving communities. In the context of the
CDD program studied in this paper and carried out in rural Bangladesh, despite a strong
commitment to guarantee to all community members equal voice and decision rights, women
rarely play an active role in the discussion and the decision-making process is often polarized
by few in�uential persons. These dynamics might explain why the treatment e�ect is not
signi�cantly larger for those social groups that, in the absence of the program, would be less
involved in community decision-making.
7.2 Mechanisms
The main results of the paper indicate the value of participatory decision-making increases
with exposure to the CDD program, primarily because an increase in the value that citizens
attach to inclusive practices per se, above and beyond instrumental considerations. The ex-
posure to inclusive institutions can a�ect how citizens value them via three channels: it might
lead to e�ciency gains for future public consultations with similar characteristics; it might
induce citizens to update their beliefs on the bene�ts and costs of these types of institutional
arrangements; or it might generate a taste for inclusive practices.
E�ciency
Table 8 shows the negotiation stage delivers the same outcomes in treated and control
communities, for instance in terms of inequality in the �nal outcome distribution or the total
contributions raised in a public good game (�Contribution task�). The average bargaining
time is also not signi�cantly di�erent for groups previously exposed to the CDD program.
However, the risk of con�icts is signi�cantly lower in communities that received the CDD
program.60 Because project sta� plays an important mediation role during the community
meetings, one interpretation of this e�ect is that the exposure to the CDD program provided
59In Table A5 and Table A6 I test these distributional shifts within a regression framework.60The variable �Tense bargaining� is based on enumerators' observations during the group negotiation
tasks. Table A8 validates this measure, showing that it positively correlates with features of the negotiationtasks that indicate a more intense bargaining dynamics, such as bargaining time and inequality in the �naldistribution of experimental tokens.
27

communities with new tools to avoid or solve con�icts and tensions during public debates.61
Consistent with these results, experiencing the CDD program might lead to an increase in
the intrinsic value of participatory decision-making via a reduction in the social costs and
psychological e�orts associated to a face-to-face group deliberation.
Beliefs updating
Previous experience of inclusive institutions via the CDD program might lead to beliefs
updating on the bene�ts and costs of these types of institutional arrangements. Table 7
shows that players in treated communities associate a lower instrumental value to participa-
tory practices. This e�ect is entirely driven by a lower expected outcome from participating
in group deliberations (Table 9), and it can be explained by lower self-perceived negotia-
tion skills in treated communities report lower self-perceived negotiation skills. Experiencing
inclusive institutions via the CDD program might induce agents in treated communities to
adjust their beliefs on their ability to in�uence the decision-making process and to shift com-
munity decisions in their favor. Indeed, suggestive evidence indicate that players in treated
communities are less likely to be overestimate their monetary outcome from participating in
the last negotiation task, and more likely to predict it correctly (Table 10). This e�ect is
speci�c to beliefs on own monetary outcome from participatory decision-making: exposure
to the CDD program does not a�ect the probability of correctly predicting the monetary
outcome from the non-participatory option (Table A9).
Further, I test whether beliefs updating on the bene�ts of inclusive institutions relates
to the welfare impacts of the CDD program. I �nd that the main treatment e�ect is not
larger in communities with poorer baseline water quality and therefore most in need of the
intervention (Table 11), and it does not vary with the randomly assigned implementation
rules (Table A10), despite these are associated with di�erent success rates (Cocciolo et al.,
2018a). Suggestive evidence indicates that the main treatment e�ect is not larger in com-
munities where the chosen sites for tubewell installation provide the largest possible welfare
improvement, nor for household who bene�ted the most from the CDD program in terms of
access to safe water (Table 12).
Preferences
61The CDD program can be interpreted as a short training on dispute resolutions. Hartman et al. (2018)evaluate the impact of a campaign to promote alternative dispute resolution (ADR) practices, and �nd thatit reduces the hostilities and violence associated to local disputes, but not the incidence of disputes. Becauseof data limitations, I cannot elucidate further whether the risk of con�icts decreases in response to the CDDprogram because less disputes arise or because disputes are less likely to escalate.
28

The third channel is the hardest to test, because I cannot directly observe preferences.
However, the available evidence seems to indicate that experiencing inclusive institutions
via the CDD program have an e�ect on the value of participatory decision-making because
agents learn about the intrinsic qualities of these types of institutional arrangements. For
instance, the CDD program seems to have the larger e�ect on the value of participatory
decision-making in smaller communities (Table A11), where the community meetings are
more inclusive and actively participated (Cocciolo et al., 2018c).62 Table 13 provides sugges-
tive evidence that it is not attendance per se that drives the main treatment e�ect, but rather
active participation of the community in the decision-making process, for example in terms
of the number of sites for tubewell installation discussed during the community meeting or
the share of households that raised their voice during the debate. Finally, Table A12 shows
that the CDD program does not have an e�ect on other social values and attitudes, such as
trust towards others, fairness attitudes, generosity, or distributional preferences.63
Intrinsic motives
The evidence presented in this Section indicates that the e�ect of the CDD program on
the value of participation is not driven by improvements in or learning about the decision
outcomes of inclusive institutions. Two possible explanations remain. One is that the main
treatment e�ect is driven by a reduction of the social costs and psychological e�orts associ-
ated to taking part in face-to-face deliberations. The other one is that, in line with classic
economic models of habit formation in consumption, experiencing a CDD program generates
a taste for inclusive practices, for example by reinforcing preferences for autonomy or the
legitimacy of decision outcomes when taken via a participated process. Consistently with
both explanations, previous exposure to inclusive institutions increases the value associated
to participatory practices because of intrinsic motives: via a reduction of the non-monetary
costs associated to participatory practices (e.g. con�icts) or because of learning about their
intrinsic qualities.
62(Cocciolo et al., 2018c) exploit a project rule that generates exogenous variation in the size of communitiesthat receive the arsenic-mitigation program. In order to implement the CDD program in communities ofmanageable size, administrative units smaller than 250 households are treated as one treatment unit, andadministrative units larger than 250 households as two treatment units, and so on and so forth at otherthresholds which are multiples of 250. Critically, by design the number of households per o�ered tubewellsvaries smoothly across the thresholds. (Cocciolo et al., 2018c) show that the distribution of administrativeunits is smooth across all the thresholds, and that the predicted treatment unit size, conditional on a smoothfunction of administrative unit size, does not systematically predict any important baseline characteristics.
63Inequality preferences are elicited via an incentivized tasks where external spectators take distributivechoices for other groups in their community (Ghisol�, 2018).
29

7.3 Robustness checks
In Appendix ??, I show that the main results is robust to several robustness checks. First, I
verify that the main �ndings are robust to the non-random sample selection of communities
in the lab-in-the-�eld experiment. The �rst concern is related to the initial exclusion from
the optimal sample of communities where the CDD program failed endogenously,64 and their
ex-post inclusion to the sample obtained via the optimization procedure described in Section
3.1 and in Appendix C. Both excluding or including the communities where the project
failed endogenously from the optimal sample would bias the results, most likely in opposite
directions. In my preferred speci�cations I use the full sample with weights that take into
account the ex-ante probability of each community to be selected in the optimal sample.65
In Table A14, I compare the main estimates with two natural robustness checks, including
and excluding from the �nal sample the four communities where the CDD project failed
endogenously and originally considered not eligible for the lab-in-the-�eld experiment. As
expected, the main coe�cient of interest is downward biased when these communities are
included in the sample without the weight correction: in these cases the implementation
of the CDD program was problematic, it raised problems and con�icts in the community,
and ultimately we failed to deliver the intervention. It is therefore reasonable to expect
targeted bene�ciaries living in these communities to be skeptical about participatory decision-
making approaches, as they mostly experienced the costs but not the bene�ts potentially
associated to them. Similarly, I estimate a larger treatment e�ect when I exclude from
the �nal sample these communities where the CDD program failed endogenously. These
di�erences are marginal and go in the expected directions, supporting the choice of use
weighted regressions as preferred speci�cations.
The second concern relates to the exclusion of communities where we were not able to
deliver the CDD intervention due to hydro-geological constraints in Deuli Union. Installation
failures are unlikely to be correlated with our main outcome variables, nor with the CDD
treatment assignment, which is random by design. However, they are a function of geography:
treated communities where installations failed due to hydro-geological constraints are mainly
64Originally, I considered ineligible for this project four communities where the project failed endogenously:(i) one where the community was not interested in holding the meeting; (ii) two where the community didnot reach an agreement during the community meetings; (iii) one where installation failed for one tubewelland cash contributions failed for the other tubewell. I excluded TUs where the project failed �endogenously�because at that stage, in agreement with the �eld team, I considered unfeasible to conduct the lab-in-the-�eldexperiment in communities where the project failed due to tensions and disagreements within the communityor lack of interest in the CDD program. Although aware that this selection might bias our estimates, thischoice was imposed by feasibility constraints.
65In order to derive the weights I repeat the optimization procedure 1,000 times on the full sample ofcommunities in the CDD program, and I calculate the probability of each community to be included in theoptimal sample.
30

concentrated in the South-Eastern side of Deuli Union. As a result, control and treated
communities selected for the lab-in-the-�eld experiment are not equally distributed in the
area: treated communities are mainly from the North-Western side of Deuli Union, while
control communities are homogeneously spread in the area. In Table A14, I compare the
results from my preferred speci�cation with the estimates obtained by excluding Deuli Union,
the only strata where we experienced issues in the implementation of the project due to
hydro-geological factors. The main �ndings are robust to the exclusion of this strata and, if
anything, the results are stronger and more signi�cant.
The third concern arises from the optimization procedure adopted in order to identify
the sample of communities where to implement the lab-in-the-�eld experiment, described in
details in Section 3.1 and in Appendix C. The main rationale for this non-random sample
selection is small sample bias reduction, a valid concern posed by the sample size consisting
in less than one hundred communities. In order to correct inference, I obtain boostrapped
standard errors by implementing a two-step bootstrapping procedure that replicates the
optimization procedure for sample selection (Appendix C). I obtain B=350 �optimal boot-
strapped samples�, which I use to obtain bootstrapped standard errors of the main coe�cient
of interest. Each �optimal bootstrapped sample� is obtained from K=1,000 samples, boot-
strapped at community level by Union and treatment status, by selecting the one with the
highest pvalue from the F-test on the balance of pre-intervention observables between treated
and control villages. As the bootstrapped standard errors for the main coe�cient of interest
are smaller (Table A15), in my preferred speci�cation and main analysis I report the most
conservative speci�cation with unadjusted standard errors.
Finally, Table A16 con�rms that the coe�cient of interest is robust to the inclusion of
di�erent sets of controls, including optimal sets of controls as identi�ed by Lasso algorithms.
Since both the magnitude and the signi�cance of the main coe�cient of interest show minimal
variations when controls are included in the main speci�cation, I do exclude covariates from
my preferred speci�cation and main analysis.
8 Conclusions
In this paper I evaluate the impact of a CDD program on democratic values and practices in
receiving communities. Speci�cally, I focus on a novel measure of procedural utility measured
in a lab setting: individual preferences on the process to take collective decisions.
The majority of citizens (weakly) prefer taking common decisions via democratic and
inclusive institutions. However, participation in the decision-making process is selected,
with women and the elderly less likely to engage into public consultations while leaders and
31

more educated agents place an higher value on participation. Preferences are driven by
instrumental and non-instrumental considerations, and are in�uenced by the outcomes and
the quality of similar decision-making processes already experienced by agents.
The value of participatory decision-making increases with exposure to the CDD program.
The overall e�ect is driven primarily by an increase in the intrinsic value of participation in
response to the CDD program, as subjects in treated communities have lower expectations
of the instrumental gains of participation. This suggests that the exposure to participatory
governance has an impact on the value that citizens attach to inclusive decision-making
practices per se, above and beyond instrumental considerations.
A remaining open question is whether my results will extend outside the lab-in-the-�eld
experiment setting, to contexts where participatory decision-making is applied to real-world
community decisions and real-world alternative decision-making processes, such as a Top-
Down approach or pre-existing informal local institutions. In a companion project conducted
in the same Bangladeshi communities (Cocciolo et al., 2018d), we address these considera-
tions by eliciting truthful individual evaluations for di�erent types of institutional arrange-
ment with respect to the future implementation of an intervention to provide a local public
good.66 This companion project will give new insights on citizens' evaluations over di�erent
institutional arrangements and the impact of past exposure to participatory governance in a
real-world setting.
The evidence presented in this paper complements the results by Fearon et al. (2015),
Beath et al. (2013) and Casey et al. (2018), that stress that, even in case new inclusive
and e�ective institutions are available to communities, it remains unclear whether and under
which conditions they will choose to make use of them endogenously instead of relying on
traditional pre-existing institutions. A prerequisite for the endogenous adoption of the newly
created institutions is that citizens prefer them to the old institutional arrangement: because
they like them intrinsically, because they think they work better, or both Casey (2018). In
my paper I provide evidence on the existence of this channel. Are these changes in citizens's
value of inclusive institutions and participation are su�cient in order to induce changes in
66We o�er communities the possibility to participate in a future development programs to install a newa communal source of safe drinking water. We o�er participants the possibility to choose, under di�erentsubsidy levels, between three alternative decision-making processes: (i) a top-down approach, where projectsta� takes key decisions; (ii) an unregulated community participation process, where communities take deci-sions under their own local institutions; and (iii) a consensus-based community participation process, whereproject decisions are taken by unanimous consensus during community meetings at the presence of projectsta�, under the same rules as the CDD program implemented by Cocciolo et al. (2018a). We incentivizethe elicitation procedure by randomly selecting a subset of communities to truly receive the future project,and de�ning the implementation rules by taking into account respondents' answers in the WTP elicitationprocedure (majority rule). Because each community has a positive probability of receiving the possibilityto install the new safe water source, respondents should truthfully report their preferences, as long as theybelieve there is a non-zero probability that their preferences in�uence the �nal decision.
32

individual participation choices and, ultimately, on local governance? In line with the existing
literature, preliminary results suggest that this is not the case in the context of this study
(Table 14).
Why are institutions persistent despite individual preferences and values do respond to
exogenous shocks, such as the exposure to democratic and inclusive decision-making pro-
cesses? One possible explanation is that, while experiencing inclusive institutions increases
the value that citizens attach per se on being involved in decision-making, it also induces
more realistic expectations on the personal bene�ts from participation, with an ambiguous
e�ect on the overall demand for institutional reforms. An alternative explanation is that the
exposure to democratic and inclusive institutions can change social values for participatory
practices in receiving communities, but these changes will not translate into realized institu-
tional reforms because institutions are persistent and constrained by the existing social and
political structures within a society. This explanation would have signi�cant policy impli-
cations, as it would suggest that interventions aimed at fostering institutional development
should focus on relaxing such potential constraints. These questions are beyond the scope of
this paper, but they create important avenues for future work.
33

References
Acemoglu, D. and J. A. Robinson (2008): �Persistence of power, elites, and institutions,�
American Economic Review, 98, 267�293.
��� (2017): �The Emergence of Weak, Despotic and Inclusive States,� NBER Working
Paper.
Acemoglu, D., J. A. Robinson, and R. Torvik (2013): �Why do voters dismantle
checks and balances?� Review of Economic Studies, 80, 845�875.
Afzal, U., G. D'Adda, M. Fafchamps, and F. Said (2018): �Intrahousehold Consump-
tion Allocation and Demand for Agency: A Triple Experimental Investigation,� NBER
Working paper.
Aghion, P., Y. Algan, P. Cahuc, and A. Shleifer (2010): �Regulation and distrust,�
The Quarterly Journal of Economics, 125, 1015�1049.
Alatas, I., A. Banerjee, R. Hanna, B. A. Olken, and J. Tobias (2012): �Targeting
the Poor : Evidence from a Field Experiment in Indonesia,� American Economic Review,
102, 1206�1240.
Alatas, V., A. Banerjee, R. Hanna, B. A. Olken, R. Purnamasari, and M. Wai-
Poi (2013): �Does Elite Capture Matter? Local Elites and Targeted Welfare Programs in
Indonesia,� Tech. rep., National Bureau of Economic Research.
Alesina, A. and N. Fuchs-Schündeln (2007): �Good bye Lenin ( or not ?): The e�ect
of Communism on people' s preferences,� American Economic Review, 97, 1507�1528.
Anderson, S., P. Francois, and A. Kotwal (2015): �Clientelism in Indian Villages,�
American Economic Review, 105, 1780�1816.
Attanasio, O., S. Polania-Reyes, and L. Pellerano (2015): �Building Social Cap-
ital: Conditional Cash Transfers and Cooperation,� Journal of Economic Behavior and
Organization, 118, 22�39.
Avdeenko, A. and M. Gilligan (2015): �International Interventions to Build Social
Capital: Evidence from a Field Experiment in Sudan,� American Political Science Review,
109, 427�449.
Baird, S., C. McIntosh, and B. Özler (2013): �The regressive demands of demand-
driven development,� Journal of Public Economics, 106, 27�41.
34

Ban, R., S. Jha, and V. Rao (2012): �Who has voice in a deliberative democracy?
Evidence from transcripts of village parliaments in south India,� Journal of Development
Economics, 99, 428�438.
Banerjee, A., R. Banerji, E. Duflo, R. Glennerster, and S. Khemani (2010):
�Pitfalls of Participatory Programs: Evidence from a Randomized Evaluation in Education
in India,� American Economic Journal: Economic Policy, 2, 1�30.
Banerjee, A. V., K. Selvan, P. Rohini, and F. Su (2011): �Do Informed Voters Make
Better Choices? Experimental Evidence from Urban India,� Working Paper.
Bartling, B., E. Fehr, and H. Herz (2014): �The intrinsic value of decision rights,�
Econometrica, 82, 2005�2039.
Beath, A., F. Christia, and R. Enikolopov (2017): �Direct democracy and resource
allocation: Experimental evidence from Afghanistan,� Journal of Development Economics,
124, 199�213.
Beath, A., C. Fotini, and R. Enikolpov (2013): �Do Elected Councils Improve Gover-
nance? Experimental Evidence on Local Institutions in Afghanistan,� World Bank Policy
Research Working Paper.
Bertrand, M. and S. Mullainathan (2001): �Do People Mean What They Say? Im-
plications for Subjective Survey Data,� American Economic Review, 91, 67�72.
Besley, T., R. Pande, and V. Rao (2005): �Participatory democracy in action: Survey
evidence from South India,� Journal of the European Economic Association, 3, 648�657.
Besley, T. and T. Persson (2018): �Democratic Values and Institutions,� Working Paper.
Björkman, M., D. de Walque, and J. Svensson (2017): �Experimental Evidence on
the Long-Run Impact of Community-Based Monitoring,� American Economic Journal:
Applied Economics, 9, 33�69.
Björkman, M. and J. Svensson (2009): �Power to the People: Evidence from a Random-
ized Experiment on Community-Based Monitoring in Uganda,� The Quarterly Journal of
Economics, 124, 735�769.
Blattman, C. (2009): �From Violence to Voting: War and Political Participation in
Uganda,� American Political Science Review, 103, 231�247.
35

Bolton, G., J. Brandts, and A. Ockenfels (2005): �Fair procedure: evidence from
games involving lotteries,� The Economic Journal, 115, 1054�1076.
Casey, K. (2018): �Radical Decentralization: Does Community-Driven Development
Work?� Annual Review of Economics, 10, 139�163.
Casey, K., R. Clennerster, and E. Miguel (2012): �Reshaping Institutions: Evidence
on Aid Impacts using a Preanalysis Plan,� The Quarterly Journal of Economics, 127,
1755�1812.
Casey, K., R. Glennerster, E. Miguel, and M. Voors (2018): �Skill versus Voice in
Local Development,� NBER Working Paper Series.
Coate, S., M. Conlin, and A. Moro (2008): �The Performance of Pivotal-Voter Mod-
els in Small-scale Elections: Evidence from Texas Liquor Referenda,� Journal of Public
economics, 92, 582�596.
Cocciolo, S., S. Ghisolfi, A. Habib, B. Hinnerich, and A. Tompsett (2018a):
�Community Contributions, Participatory Decision-making and Local Public Goods: A
Field Experiment in Bangladesh,� Work in progress.
Cocciolo, S., S. Ghisolfi, A. Habib, and A. Tompsett (2018b): �Access to Safe
Drinking Water: Experimental Evidence from NewWater Sources in Bangladesh,� Baseline
report.
Cocciolo, S., A. Habib, and A. Tompsett (2018c): �Group Size and Collective Action,�
Work in progress.
��� (2018d): �Understanding Institutional Persistence: Exposure to Community-Driven
Development and the Value of Autonomy and Democracy,� Work in progress.
Dal Bó, P., A. Foster, and L. Putterman (2010): �Institutions and Behavior : Exper-
imental Evidence on the E�ects of Democracy,� American Economic Review, 100, 2205�
2229.
De Quidt, J., J. Haushofer, and C. Roth (2018): �Measuring and Bounding Experi-
menter Demand,� American Economic Review (forthcoming).
Downs, A. (1957): �An Economic Theory of Political Action in a Democracy,� Journal of
Political Economy, 65, 135�150.
36

Fafchamps, M. and R. V. Hill (2018): �Redistribution and Group Participation: Exper-
imental Evidence from Africa and the UK,� World Bank Policy Research Working Paper.
Fearon, J., M. Humphreys, and J. Weinstein (2009): �Can Development Aid Con-
tribute to Social Cohesion after Civil War? Evidence from a Field Experiment in Post-
Con�ict Liberia,� American Economic Review: Papers & Proceedings, 99, 287�291.
Fearon, J. D., M. Humphreys, and J. M. Weinstein (2015): �How Does Development
Assistance A�ect Collective Action Capacity? Results from a Field Experiment in Post-
Con�ict Liberia,� American Political Science Review, 109, 450�469.
Fehr, E., H. Herz, and T. Wilkening (2013): �The Lure of Authority: Motivation and
Incentive E�ects of Power,� American Economic Review, 103, 1325�1359.
Ferraz, C. and F. Finan (2008): �Exposing Corrupt Politicians: The e�ects of Brazil's
Publicly Released Audits on Electoral Outcomes,� The Quarterly Journal of Economics,
123, 703�745.
Frey, B. S., M. Benz, and A. Stutzer (2004): �Introducing Procedural Utility: Not
Only What, but Also How Matters,� Journal of Institutional and Theoretical Economics,
160, 377�401.
Frey, B. S. and A. Stutzer (2005): �Beyond Outcomes: Measuring Procedural Utility,�
Oxford Economic Papers, 57, 90�111.
Fuchs-Schundeln, N. and M. Schundeln (2015): �On the endogeneity of political
preferences: Evidence from individual experience with democracy,� Science, 347, 1145�
1148.
Fujiwara, T., K. Meng, and T. Vogl (2016): �Habit formation in voting: Evidence
from rainy elections,� American Economic Journal: Applied Economics, 8, 160�188.
Ghisolfi, S. (2018): �Contribution Requirements and Preferences on Redistribution,� Work
in progress.
Güth, W. and H. Weck-Hannemann (1997): �Do people care about democracy? An
experiment exploring the value of voting rights,� Public Choice, 91, 27�47.
Hartman, A. C., R. A. Blair, and C. Blattman (2018): �Engineering Informal In-
stitutions: Long-run Impacts of Alternative Dispute Resolution on Violence and Property
Rights in Liberia,� NBER Working Paper.
37

Hinnerich, B. T. and P. Pettersson-Lidbom (2014): �Democracy, Redistribution, and
Political Participation: Evidence From Sweden 1919-1938,� Econometrica, 82, 961�993.
Humphreys, M., R. S. de la Sierra, and P. van der Windt (2012): �Social and
Economic Impacts of Tuungane: Final Report on the E�ects of a Community Driven
Reconstruction Program in Eastern Democratic Republic of Congo,� Final Report.
Ibanez, A. M. and V. Rao (2005): �The social impact of social funds in Jamaica: A partici-
patory econometric analysis of targeting, collective action, and participation in community-
driven development,� Journal of Development Studies, 41, 788�838.
Khwaja, A. I. (2004): �Is increasing community participation always a good thing?� Journal
of the European Economic Association, 2, 427�436.
Kim, B. Y., S. Choi, J. Lee, S. Lee, and K. Choi (2017): �Do Institutions A�ect
Social Preferences? Evidence from Divided Korea,� Journal of Comparative Economics,
45, 865�888.
Labonne, J. and R. Chase (2009): �Who is at the Wheel When Communities Drive
Development? Evidence from the Philippines,� World Development, 37, 219�231.
��� (2011): �Do community-driven development projects enhance social capital? Evi-
dence from the Philippines,� Journal of Development Economics, 96, 348�358.
Madajewicz, M., A. Tompsett, and A. Habib (2017): �How does delegating decisions
to bene�ciaries a�ect their access to a public service? Evidence from a �eld experiment in
Bangladesh,� Working Paper.
Madestam, A. and D. Yanagizawa-Drott (2011): �Shaping the Nation: The E�ect of
Fourth of July on Political Preferences and Behavior in the United States,� Working Paper.
Mansuri, G. and V. Rao (2004): �Community-Based and -Driven Development: A Critical
Review,� The World Bank Research Observer, 19, 1�39.
��� (2013): �Localizing Development: Does Participation Work?� World Bank Policy
Research Report.
Neri, C. and H. Rommeswinkel (2014): �Decision Rights: Freedom, Power, and Inter-
ference,� Working Paper.
��� (2017): �Freedom , Power and Interference,� SSRN Working Paper.
38

Olken, B. (2007): �Monitoring Corruption: Evidence from a Field Experiment in Indone-
sia,� Journal of Political Economy, 115, 200�249.
Olken, B. A. (2010): �Direct democracy and local public goods: Evidence from a �eld
experiment in Indonesia,� American Political Science Review, 104, 243�267.
Osborne, M., J. Rosenthal, and M. Turner (2000): �Meetings with Costly Participa-
tion,� American Economic Association, 90, 927�943.
Owens, D., Z. Grossman, and R. Fackler (2014): �The Control Premium: A Preference
for Payo� Autonomy,� American Economic Journal: Microeconomics, 91, 138�161.
Persson, T. and G. Tabellini (2009): �Democratic capital: The nexus of political and
economic change,� American Economic Journal: Macroeconomics, 1, 88�126.
Polan, S. (2016): �Coordination as Unintended Bene�t: Lab-in-the-Field Evidence from a
Conditional Cash Transfer Program,� Working Paper.
Reinikka, R. and J. Svensson (2011): �The power of information in public services:
Evidence from education in Uganda,� Journal of Public Economics, 95, 956�966.
Riker, W. H. and P. C. Ordeshook (1968): �A Theory of the Calculus of Voting,�
American Political Science Review, 62, 25�42.
Stromberg, D. (2004): �Radio's Impact on Public Spending,� The Quarterly Journal of
Economics, 119, 189�221.
Tullock, G. (1968): Toward a Mathematics of Politics.
van der Windt, P., M. Humphreys, and R. Sanchez de la Sierra (2018): �Gender
quotas in development programming: Null results from a �eld experiment in Congo,�
Journal of Development Economics, 133, 326�345.
White, H., R. Menon, and H. Waddington (2018): �Community-Driven Development:
does it build social cohesion or infrastructure ? A mixed-method evidence synthesis,� 3ie
Working Paper.
Wong, S. and S. Guggenheim (2018): �Community-Driven Development: Myths and
Realities,� World Bank Policy Research Working Paper.
World Bank (2014): �Making Services Work for Poor People,� World Development Report
2014.
��� (2017): �Governance and the Law,� World Development Report 2017.
39

Figures
Figure 1: Timeline of the experiment
� Task 1 (�Contribution task� or �Redistribution task�)
� WTP elicitation w.r.t. to Task 1:
� Elicitation of WTP for participatory decision-making
� Beliefs elicitation
� Task 2 (�Contribution task� or �Redistribution task�)
� WTP elicitation w.r.t. to Task 1:
� Elicitation of WTP for participatory decision-making
� Beliefs elicitation
� Task 3 according to the decision taken during the WTPelicitation
Figure 2: Distribution of WTP for participatory decision-making
40

Figure 3: Instrumental value of participatory decision-making
Figure 4: Intrinsic value of participatory decision-making
41

Figure 5: Intrinsic value of participatory decision-making
Figure 6: Intrinsic value of participatory decision-making
42

Figure 7: Intrinsic value of participatory decision-making
43

Tables
Table 1: Price list for the elicitation procedure
Choice Alternative A Alternative B
1 Participatory decision-making Assigned distribution
2 Participatory decision-making - 1 Assigned distribution
3 Participatory decision-making - 2 Assigned distribution
4 Participatory decision-making - 3 Assigned distribution
5 Participatory decision-making - 4 Assigned distribution
6 Participatory decision-making - 5 Assigned distribution
7 Participatory decision-making + 1 Assigned distribution
8 Participatory decision-making + 2 Assigned distribution
9 Participatory decision-making + 3 Assigned distribution
10 Participatory decision-making + 4 Assigned distribution
11 Participatory decision-making + 5 Assigned distribution
Table 2: Sample strati�cation for players in the WTP elicitations
Women Men Total
Total participants 576 576 1152
Participants from a leader
household (planned)145(192) 180(192) 325(384)
44

Table 3: Sample balance among �nal and prospective participants
Dependent variable: CDD program (1) (2) (3) (4)
Bacteria contaminated household -0.06* -0.05 -0.06 -0.05
Arsenic contaminated household 0.00 -0.00 0.00 -0.00
Poverty score - 2 USD -0.00 0.00 -0.00 0.00
Indegree centrality -0.01 -0.03 -0.01 -0.03
Outdegree centrality 0.03 0.04* 0.03 0.04*
Leader household -0.04 -0.03 -0.03 -0.02
Share of not educated people in the household 0.13* 0.06 0.12* 0.06
Literacy rate in the household 0.12* 0.02 0.11* 0.05
Household size -0.00 0.01 -0.00 0.01
Muslim household -0.06 -0.01 -0.06 -0.01
Decision on a new public safe water source - unanimity -0.06 0.03 -0.05 0.03
Decision on a new public safe water source - majority 0.02 -0.01 0.03 0.00
Decision on a new public safe water source - government -0.01 -0.15* -0.02 -0.15*
Decision on a new public safe water source - village leaders 0.03 0.07 0.02 0.06
Decision on a new public safe water source - ngo 0.05 0.14** 0.06 0.14**
WTP (cash) for new public safe WS in most preferred location 0.00 0.00 0.00 0.00
WTP (cash) for new public safe WS in socially optimal location 0.00 -0.00 0.00 -0.00
WTP (time) for new public safe WS in most preferred location -0.00 -0.00 -0.00 -0.00
F-test (pvalue) 0.185 0.452 0.130 0.477
Player sample Final Final Accepted Accepted
Participation task only ✓ ✓Pre-speci�ed ✓ ✓N 3208 1054 3358 1105
Notes: Standard errors clustered at community level. Union FE are included in all regressions.
45

Table 4: Correlations with previous experience with experimental tasks
WTP WTP≥0Always
participate
Instrumental
value
Expected
outcome
participation
Expected
outcome non
participation
Intrinsic
value
(1) (2) (3) (4) (5) (6) (7)
Outcome in previous round 0.08** 0.01*** 0.00 0.17*** 0.20*** 0.04 -0.09*
(0.03) (0.00) (0.00) (0.04) (0.05) (0.03) (0.05)
Inequality in previous round 0.71 0.01 0.06 1.21** 2.04*** 0.83 -0.50
(0.59) (0.07) (0.06) (0.51) (0.73) (0.61) (0.73)
Bargaining time (mins) -0.03 -0.00 -0.00 0.14*** 0.22*** 0.08** -0.17***
(0.04) (0.00) (0.00) (0.05) (0.06) (0.04) (0.06)
Tense bargaining 0.02 -0.01 0.00 -0.02 0.59** 0.62*** 0.04
(0.19) (0.02) (0.03) (0.17) (0.25) (0.19) (0.25)
Pre-speci�ed
N 2302 2302 2302 2302 2302 2302 2302
Notes: Standard errors clustered at community level. Union FE and enumerator FE are included in all regressions.
Table 5: Correlations with demographic characteristics
WTP WTP≥0Always
participate
Instrumental
value
Expected
outcome
participation
Expected
outcome non
participation
Intrinsic
value
(1) (2) (3) (4) (5) (6) (7)
Secondary education 0.09 0.03 -0.01 0.35 0.20 -0.15 -0.25
(0.23) (0.02) (0.03) (0.23) (0.23) (0.20) (0.32)
Age -0.03*** -0.00** -0.00** 0.00 -0.00 -0.00 -0.03***
(0.01) (0.00) (0.00) (0.01) (0.01) (0.01) (0.01)
Poverty score 0.52 0.03 0.11* 0.09 -0.02 -0.10 0.43
(0.56) (0.07) (0.06) (0.58) (0.58) (0.41) (0.70)
Female -0.20 0.01 -0.06*** -0.15 0.33 0.48*** -0.05
(0.19) (0.02) (0.02) (0.18) (0.20) (0.15) (0.27)
Leader household 0.54* 0.06* 0.03 0.17 0.92*** 0.75*** 0.37
(0.30) (0.03) (0.03) (0.28) (0.28) (0.22) (0.40)
Indegree centrality 0.03 0.00 0.00 0.04 -0.01 -0.04 -0.01
(0.10) (0.01) (0.01) (0.08) (0.10) (0.07) (0.12)
Outdegree centrality -0.01 0.00 0.00 0.05 -0.03 -0.07 -0.05
(0.12) (0.02) (0.01) (0.11) (0.12) (0.11) (0.15)
Pre-speci�ed
N 2090 2090 2090 2090 2090 2090 2090
Notes: Standard errors clustered at community level. Union FE and enumerator FE are included in all regressions.
46

Table 6: Main treatment e�ect
WTP
WTP
relative to
endowment
WTP<0 WTP>0 Always
participate
(1) (2) (3) (4) (5) (6)
CDD program 0.58** 1.17** 0.07** -0.04 0.07* 0.10***
(0.27) (0.52) (0.03) (0.03) (0.03) (0.03)
Mean (control) -0.02 -0.02 -0.01 0.32 0.44 0.20
Pre-speci�ed ✓ML for censored data ✓N 2304 2304 2304 2304 2304 2304
Notes: Standard errors clustered at community level. Regressions weighted by the probability of each village to be
selected by the optimization procedure for sample selection.
Table 7: Treatment e�ect on instrumental and intrinsic value of participatory decision-making
WTPInstrumental
value
Intrinsic
value
(1) (2) (3)
CDD program 0.58** -0.52** 1.10***
(0.27) (0.21) (0.31)
Mean (control) -0.02 1.02 -1.04
Pre-speci�ed ✓ ✓ ✓N 2304 2304 2304
Notes: Standard errors clustered at community level. Regressions
weighted by the probability of each village to be selected by the opti-
mization procedure for sample selection.
47
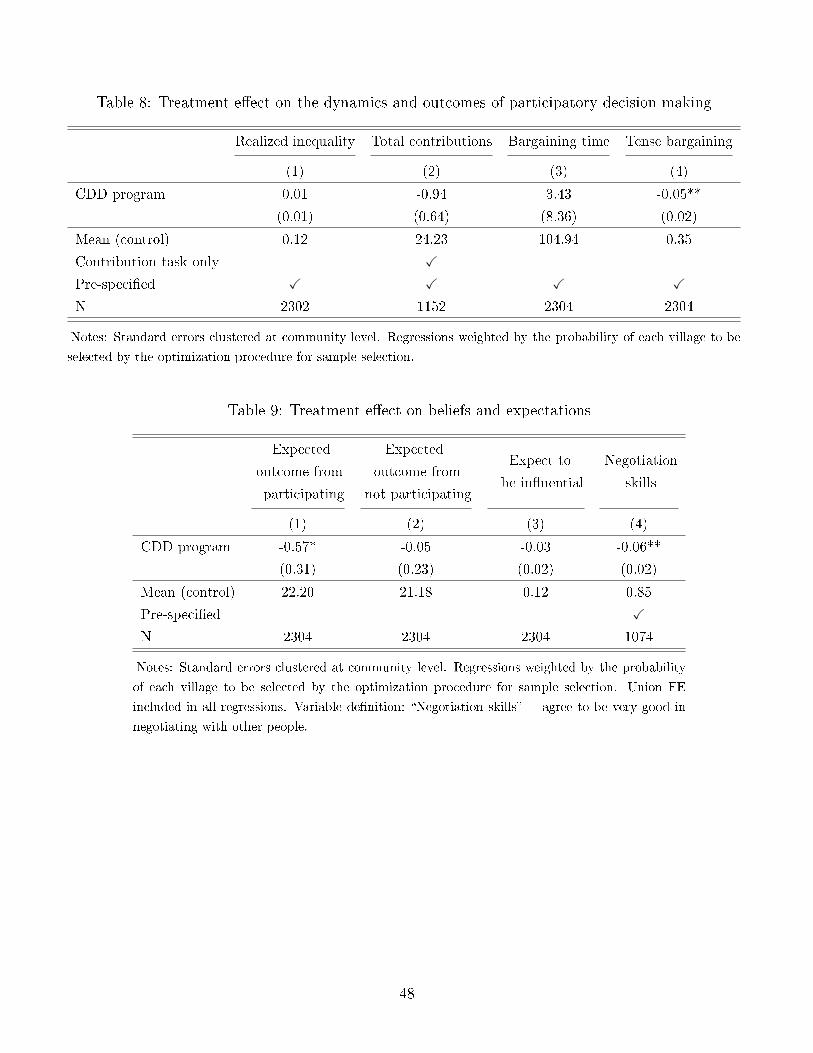
Table 8: Treatment e�ect on the dynamics and outcomes of participatory decision-making
Realized inequality Total contributions Bargaining time Tense bargaining
(1) (2) (3) (4)
CDD program 0.01 -0.94 3.43 -0.05**
(0.01) (0.64) (8.36) (0.02)
Mean (control) 0.12 24.23 104.94 0.35
Contribution task only ✓
Pre-speci�ed ✓ ✓ ✓ ✓
N 2302 1152 2304 2304
Notes: Standard errors clustered at community level. Regressions weighted by the probability of each village to be
selected by the optimization procedure for sample selection.
Table 9: Treatment e�ect on beliefs and expectations
Expected
outcome from
participating
Expected
outcome from
not participating
Expect to
be in�uential
Negotiation
skills
(1) (2) (3) (4)
CDD program -0.57* -0.05 -0.03 -0.06**
(0.31) (0.23) (0.02) (0.02)
Mean (control) 22.20 21.18 0.12 0.85
Pre-speci�ed ✓
N 2304 2304 2304 1074
Notes: Standard errors clustered at community level. Regressions weighted by the probability
of each village to be selected by the optimization procedure for sample selection. Union FE
included in all regressions. Variable de�nition: �Negotiation skills� = agree to be very good in
negotiating with other people.
48
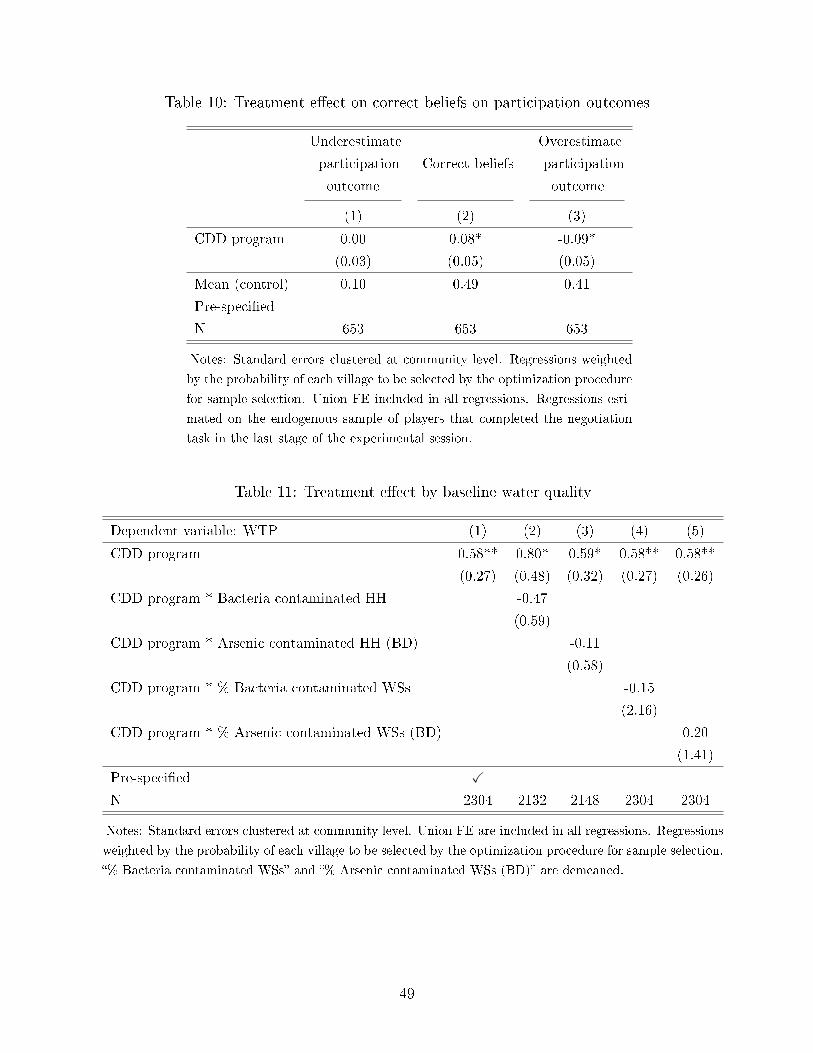
Table 10: Treatment e�ect on correct beliefs on participation outcomes
Underestimate
participation
outcome
Correct beliefs
Overestimate
participation
outcome
(1) (2) (3)
CDD program 0.00 0.08* -0.09*
(0.03) (0.05) (0.05)
Mean (control) 0.10 0.49 0.41
Pre-speci�ed
N 653 653 653
Notes: Standard errors clustered at community level. Regressions weighted
by the probability of each village to be selected by the optimization procedure
for sample selection. Union FE included in all regressions. Regressions esti-
mated on the endogenous sample of players that completed the negotiation
task in the last stage of the experimental session.
Table 11: Treatment e�ect by baseline water quality
Dependent variable: WTP (1) (2) (3) (4) (5)
CDD program 0.58** 0.80* 0.59* 0.58** 0.58**
(0.27) (0.48) (0.32) (0.27) (0.26)
CDD program * Bacteria contaminated HH -0.47
(0.59)
CDD program * Arsenic contaminated HH (BD) -0.11
(0.58)
CDD program * % Bacteria contaminated WSs -0.15
(2.16)
CDD program * % Arsenic contaminated WSs (BD) 0.20
(1.41)
Pre-speci�ed ✓
N 2304 2132 2148 2304 2304
Notes: Standard errors clustered at community level. Union FE are included in all regressions. Regressions
weighted by the probability of each village to be selected by the optimization procedure for sample selection.
�% Bacteria contaminated WSs� and �% Arsenic contaminated WSs (BD)� are demeaned.
49

Table 12: Treatment e�ect by community decisions and household bene�ts from the program
Dependent variable: WTP (1) (2) (3) (4)
Any accepted site on private land 0.041
(0.444)
Distance accepted sites-optimal locations 0.002***
(0.001)
Distance HH-closest accepted site 0.000 0.001
(0.001) (0.001)
Distance HH-closest accepted site * Arsenic contaminated HH -0.001
(0.002)
Treated only ✓ ✓ ✓ ✓
Pre-speci�ed ✓* ✓* ✓* ✓*
N 1324 1324 1314 1314
Notes: Standard errors clustered at community level. Union FE are included in all regressions. Regressions
weighted by the probability of each village to be selected by the optimization procedure for sample selection.
Table 13: Treatment e�ect by dynamics of community decision-making
Dependent variable: WTP (1) (2) (3) (4)
HH attendance -4.94** -5.06***
(1.86) (1.67)
Female attendance 2.22 2.32
(1.63) (1.55)
Active participation in meeting 6.71 7.08*
(4.08) (4.20)
Meeting duration 0.01 0.01
(0.01) (0.01)
Discussed/o�ered TWs 0.47* 0.23
(0.28) (0.23)
Treated only ✓ ✓ ✓ ✓
Pre-speci�ed ✓* ✓* ✓* ✓*
N 1464 1464 1464 1464
Notes: Standard errors clustered at community level. Union FE are included
in all regressions. Regressions weighted by the probability of each village to
be selected by the optimization procedure for sample selection.
50

Table 14: Treatment e�ect on real-world participation behavior
EstimatesObserva-
tions
Involvement in community
decision-making0.03 (0.03) 2314
Attendance to village meetings -0.01 (0.02) 2259
Participation in local associations 0.03 (0.02) 2236
Participation in local collective actions 0.01 (0.02) 2192
Notes: Standard errors clustered at community level. Union FE are included in all
regressions. Regressions with the follow-up random sample in communities involved in
the lab-in-the-�eld experiment. Regressions weighted by the probability of each village
to be selected by the optimization procedure for sample selection.
51

A Appendix: Figures
Figure A.1: Project timeline
� Baseline data collection
CDD program in treated communities �
� Invitation to the lab and individual survey
� Lab-in-the-�eld experiment
� Individual survey on satisfaction
Figure A.2: Errors in beliefs on monetary outcome from participation
52

Figure A.3: Errors in beliefs on monetary outcome from participation
Figure A.4: Errors in beliefs on monetary outcome from non-participation
53

B Appendix: Tables
Table A1: Time and errors of WTP elicitation
Stage 1 Stage 2 Overall
Instructions on WTP elicitation
Time supervisor (mins) 1.7 0.9 1.3
Time enumerators (mins) 1.6 1.0 1.3
WTP elicitation
Time (mins) 1.9 0.9 1.4
Initial inconsistencies 0.18 0.15 0.17
Beliefs elicitation
Time (mins) 1.4 0.8 1.1
Correlations
WTP elicitation and
instruction time+∗∗∗
+∗∗∗
+∗∗∗
Inconsistencies and instruction
time+∗∗
+ +∗∗
54
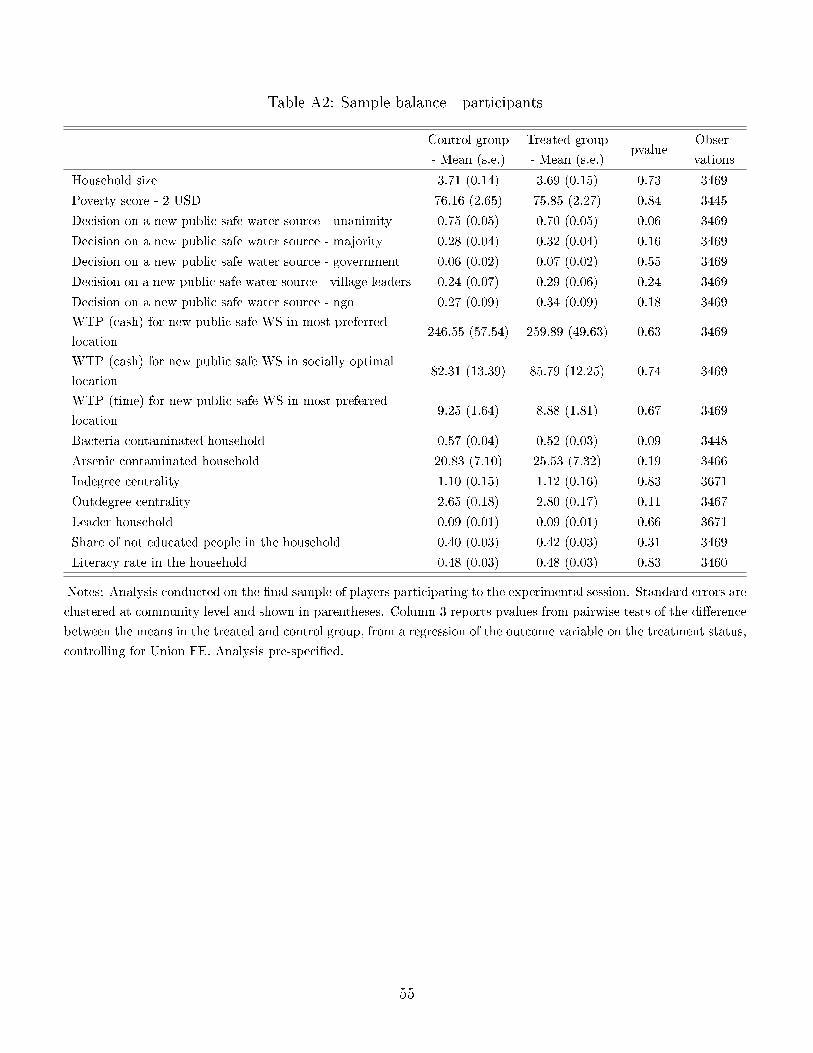
Table A2: Sample balance - participants
Control group
- Mean (s.e.)
Treated group
- Mean (s.e.)pvalue
Obser-
vations
Household size 3.71 (0.14) 3.69 (0.15) 0.73 3469
Poverty score - 2 USD 76.16 (2.65) 75.85 (2.27) 0.84 3445
Decision on a new public safe water source - unanimity 0.75 (0.05) 0.70 (0.05) 0.06 3469
Decision on a new public safe water source - majority 0.28 (0.04) 0.32 (0.04) 0.16 3469
Decision on a new public safe water source - government 0.06 (0.02) 0.07 (0.02) 0.55 3469
Decision on a new public safe water source - village leaders 0.24 (0.07) 0.29 (0.06) 0.24 3469
Decision on a new public safe water source - ngo 0.27 (0.09) 0.34 (0.09) 0.18 3469
WTP (cash) for new public safe WS in most preferred
location246.55 (57.54) 259.89 (49.63) 0.63 3469
WTP (cash) for new public safe WS in socially optimal
location82.31 (13.39) 85.79 (12.25) 0.74 3469
WTP (time) for new public safe WS in most preferred
location9.25 (1.64) 8.88 (1.81) 0.67 3469
Bacteria contaminated household 0.57 (0.04) 0.52 (0.03) 0.09 3448
Arsenic contaminated household 20.83 (7.10) 25.53 (7.32) 0.19 3466
Indegree centrality 1.10 (0.15) 1.12 (0.16) 0.83 3671
Outdegree centrality 2.65 (0.18) 2.80 (0.17) 0.11 3467
Leader household 0.09 (0.01) 0.09 (0.01) 0.66 3671
Share of not educated people in the household 0.40 (0.03) 0.42 (0.03) 0.31 3469
Literacy rate in the household 0.48 (0.03) 0.48 (0.03) 0.83 3460
Notes: Analysis conducted on the �nal sample of players participating to the experimental session. Standard errors are
clustered at community level and shown in parentheses. Column 3 reports pvalues from pairwise tests of the di�erence
between the means in the treated and control group, from a regression of the outcome variable on the treatment status,
controlling for Union FE. Analysis pre-speci�ed.
55

Table A3: Attrition from the lab-in-the-�eld experiment
Dependent variable: Drop out (1) (2) (3) (4)
Treated 0.01 -0.01 0.01 -0.02
(0.01) (0.02) (0.01) (0.02)
Attrition rate 0.05 0.06 0.05 0.06
Controls ✓ ✓In WTP elicitation ✓ ✓Pre-speci�ed ✓ ✓N 3374 1127 3323 1105
Notes: �Drop out� identi�es players that accepted to participate in the ex-
perimental session, but ultimately did not. �Attrition rate� is the equivalent
share.
56
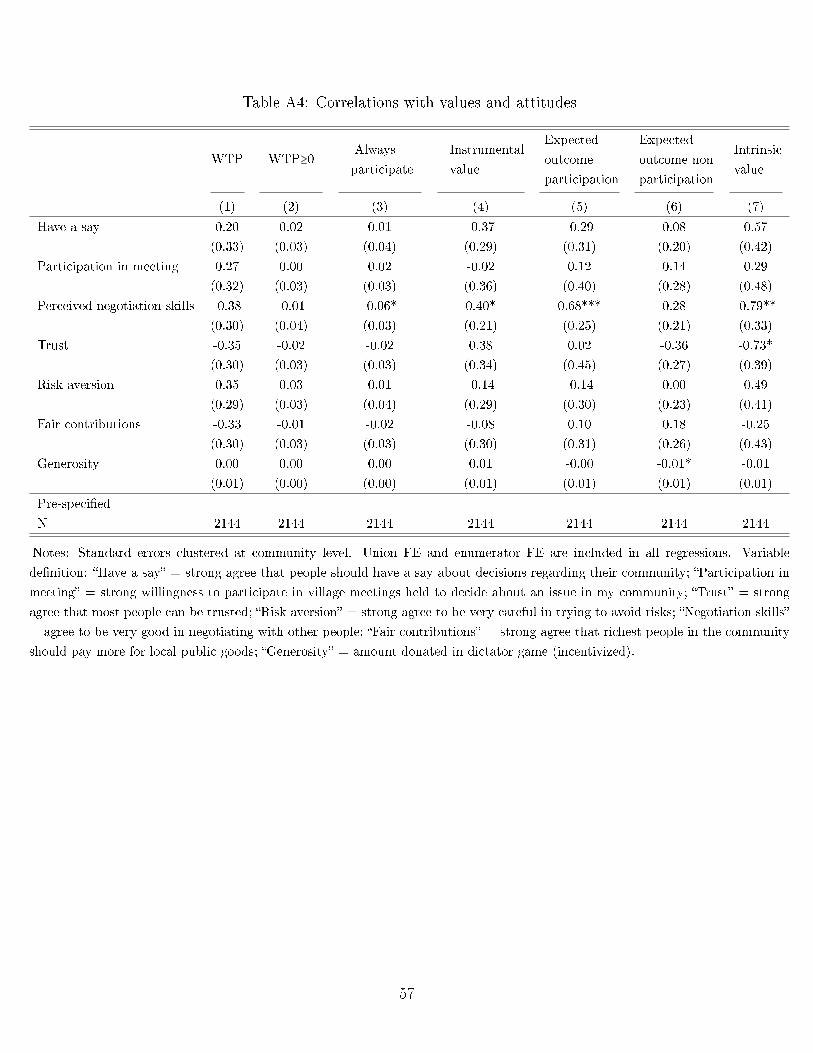
Table A4: Correlations with values and attitudes
WTP WTP≥0Always
participate
Instrumental
value
Expected
outcome
participation
Expected
outcome non
participation
Intrinsic
value
(1) (2) (3) (4) (5) (6) (7)
Have a say 0.20 0.02 0.01 -0.37 -0.29 0.08 0.57
(0.33) (0.03) (0.04) (0.29) (0.31) (0.20) (0.42)
Participation in meeting 0.27 0.00 0.02 -0.02 0.12 0.14 0.29
(0.32) (0.03) (0.03) (0.36) (0.40) (0.28) (0.48)
Perceived negotiation skills -0.38 -0.01 -0.06* 0.40* 0.68*** 0.28 -0.79**
(0.30) (0.04) (0.03) (0.21) (0.25) (0.21) (0.33)
Trust -0.35 -0.02 -0.02 0.38 0.02 -0.36 -0.73*
(0.30) (0.03) (0.03) (0.34) (0.45) (0.27) (0.39)
Risk aversion 0.35 0.03 0.01 -0.14 -0.14 0.00 0.49
(0.29) (0.03) (0.04) (0.29) (0.30) (0.23) (0.41)
Fair contributions -0.33 -0.01 -0.02 -0.08 0.10 0.18 -0.25
(0.30) (0.03) (0.03) (0.30) (0.31) (0.26) (0.43)
Generosity 0.00 0.00 0.00 0.01 -0.00 -0.01* -0.01
(0.01) (0.00) (0.00) (0.01) (0.01) (0.01) (0.01)
Pre-speci�ed
N 2144 2144 2144 2144 2144 2144 2144
Notes: Standard errors clustered at community level. Union FE and enumerator FE are included in all regressions. Variable
de�nition: �Have a say� = strong agree that people should have a say about decisions regarding their community; �Participation in
meeting� = strong willingness to participate in village meetings held to decide about an issue in my community; �Trust� = strong
agree that most people can be trusted; �Risk aversion� = strong agree to be very careful in trying to avoid risks; �Negotiation skills�
= agree to be very good in negotiating with other people; �Fair contributions� = strong agree that richest people in the community
should pay more for local public goods; �Generosity� = amount donated in dictator game (incentivized).
57

Table A5: Distributional change in the instrumental value of participation
Instrumental
value
Instrumental
value < 0
Instrumental
value > 0
High
instrumental
value
(1) (2) (3) (4)
CDD program -0.52** 0.03 -0.05** -0.03*
(0.21) (0.02) (0.02) (0.02)
Mean (control) 1.02 0.10 0.21 0.14
Pre-speci�ed
N 2304 2304 2304 2304
Notes: Standard errors clustered at community level. Union FE are included in all
regressions. Regressions weighted by the probability of each village to be selected by the
optimization procedure for sample selection.
Table A6: Distributional change in the intrinsic value of participation
Intrinsic
value
Intrinsic
value < 0
Intrinsic
value > 0
High
intrinsic
value
(1) (2) (3) (4)
CDD program 1.10*** -0.09*** 0.09*** 0.10***
(0.31) (0.03) (0.03) (0.03)
Mean (control) -1.04 0.43 0.40 0.20
Pre-speci�ed
N 2304 2304 2304 2304
Notes: Standard errors clustered at community level. Union FE are
included in all regressions. Regressions weighted by the probability of
each village to be selected by the optimization procedure for sample
selection.
58

Table A7: Heterogeneous treatment e�ects
WTP Always participate
(1) (2) (3) (4) (5) (6) (7) (8)
CDD program 0.47 0.41 0.39 1.11 0.11*** 0.10*** 0.09** 0.10
(0.29) (0.30) (0.33) (1.01) (0.03) (0.04) (0.04) (0.10)
CDD program * Female 0.23 -0.02
(0.41) (0.04)
CDD program * Leader HH 0.57 0.02
(0.47) (0.06)
CDD program * Indegree centrality 0.16 0.01
(0.17) (0.02)
CDD program * Poverty score -0.01 -0.00
(0.01) (0.00)
Pre-speci�ed ✓ ✓ ✓ ✓
N 2304 2304 2304 2130 2304 2304 2304 2130
Notes: Standard errors clustered at community level. Regressions weighted by the probability of each village to be
selected by the optimization procedure for sample selection.
Table A8: Tense bargaining
Tense bargaining
(1)
Bargaining time 0.00***
(0.00)
Realized inequality 0.21***
(0.06)
Inequality treatment 0.10***
(0.02)
Redistribution task -0.04**
(0.02)
First task 0.00
(0.02)
Pre-speci�ed
N 2302
Notes: Standard errors clustered at commu-
nity level. Union FE and enumerator FE are
included.
59

Table A9: Treatment e�ect on correct beliefs on non-participation outcomes
Underestimate
non-participation
outcome
Correct beliefs
Overestimate
non-participation
outcome
(1) (2) (3)
CDD program -0.03 0.02 0.01
(0.03) (0.02) (0.02)
Mean (control) 0.19 0.26 0.56
Pre-speci�ed
N 2302 2302 2302
Notes: Standard errors clustered at community level. Regressions weighted by the probability
of each village to be selected by the optimization procedure for sample selection. Union FE
included in all regressions.
60

Table A10: Treatment e�ect by CDD program treatments
Dependent variable: WTP (1) (2) (3) (4)
CDD program 0.58**
(0.27)
Cash TU 0.48
(0.37)
Labour TU 0.92**
(0.38)
Waiver TU 0.37
(0.35)
No SMS reminder 0.57*
(0.33)
SMS reminder, TU info 0.73*
(0.40)
SMS reminder, HH info 0.46
(0.45)
Anchoring TU 0.60*
(0.31)
Non-anchoring TU 0.56
(0.35)
Pre-speci�ed ✓ ✓* ✓* ✓*
N 2304 2304 2304 2304
Notes: Standard errors clustered at community level. Union FE are
included in all regressions. Regressions weighted by the probability of
each village to be selected by the optimization procedure for sample
selection.
61

Table A11: Treatment e�ect by community size
Dependent variable: WTP (1) (2) (3) (4)
CDD program 0.58** 0.49* 0.55** 0.43
(0.27) (0.27) (0.27) (0.31)
Treated * TU size -0.00 -0.02*
(0.01) (0.01)
Treated * Predicted TU size -0.01*
(0.01)
Model OLS OLS RF IV
AU size controls ✓ ✓ ✓
Pre-speci�ed ✓ ✓* ✓* ✓*
N 2304 2304 2304 2304
Notes: Standard errors clustered at community level. Union FE are
included in all regressions. Regressions weighted by the probability of
each village to be selected by the optimization procedure for sample
selection. �TU size� and �Predicted TU size� are demeaned.
Table A12: Treatment e�ect on values and attitudes
Have a sayParticipation
in meetingTrust
Risk
aversion
Fair
contributionsGenerosity
Inequality
preferences
(1) (2) (3) (4) (5) (6) (7)
CDD program -0.01 0.01 0.02 0.03 -0.06* 0.46 -0.01
(0.03) (0.04) (0.03) (0.02) (0.04) (0.97) (0.01)
Mean (control) 0.16 0.35 0.31 0.11 0.34 18.59 0.18
Pre-speci�ed ✓ ✓ ✓ ✓ ✓ ✓
N 1080 1081 1081 1080 1081 1081 3408
Notes: Standard errors clustered at community level. Union FE are included in all regressions. Regressions weighted by
the probability of each village to be selected by the optimization procedure for sample selection. Variable de�nition: �Have
a say� = strong agree that people should have a say about decisions regarding their community; �Participation in meeting�
= strong willingness to participate in village meetings held to decide about an issue in my community; �Trust� = strong
agree that most people can be trusted; �Risk aversion� = strong agree to be very careful in trying to avoid risks; �Fair
contributions� = strong agree that richest people in the community should pay more for local public goods; �Generosity� =
amount donated in dictator game (incentivized); �Inequality preferences� = inequality determined by distributive choices of
external spectators (incentivized).
62

Table A13: The socio-economic impact of the CDD program
EstimatesObserva-
tions
Poverty score 0.46 (1.14) 3007
Share of adults in labour force 0.00 (0.01) 4029
Savings -8677.71* (4910.81) 3983
Rooms -0.10 (0.07) 4029
Good commuity relations -0.01 (0.02) 2314
Trust towards other villagers -0.01 (0.03) 2314
Trust towards local leaders -0.02 (0.02) 2314
Outdegree centrality -.8*** (0.31) 2280
Experienced crisis -0.01 (0.02) 4029
Cope crisis: relatives and friends -0.05 (0.04) 1273
Notes: Standard errors clustered at community level. Union FE are included in all
regressions. Regressions with the follow-up random sample in communities involved
in the lab-in-the-�eld experiment. Regressions weighted by the probability of each
village to be selected by the optimization procedure for sample selection. Variable
de�nition: �Savings� = savings in BDT in the previous year; �Good community
relations� = dummy if the household reported that residents of the community get
along with each and cooperate very well; �Trust towards other villagers� = high
trust towards village residents to solve problems which the village may face; �Trust
towards local leaders� = high trust towards local leaders to solve problems which
the village may face; �Experienced crisis� = dummy if the household experienced
any crisis in the previous year; �Cope crisis: relatives and friends� = dummy if the
household relied on relatives or friends to cope with any experienced crisis.
63

Table A14: Robustness checks: sample weights and endogenous/exogenous failures
Full sample
weighted
Full sample
unweighted
Drop
endogenous
failures
Drop
exogenous
failures
Dependent variable: WTP (1) (2) (3) (4)
CDD program 0.58** 0.50* 0.61** 0.49*
(0.27) (0.26) (0.26) (0.27)
Full sample ✓ ✓Weighted ✓Pre-speci�ed ✓ ✓ ✓ ✓N 2304 2304 2208 1992
Notes: Standard errors clustered at community level.
Table A15: Robustness checks: correcting inference
Full sample unweighted Drop endogenous failures
Dependent variable: WTP (1) (2) (3) (4)
CDD program 0.5** 0.5*** 0.61** 0.61***
(0.26) (0.15) (0.26) (0.16)
Bootstrapped S.E ✓ ✓Pre-speci�ed ✓ ✓ ✓ ✓N 2304 2304 2208 2208
Notes: Standard errors clustered at community level. Regressions weighted by the probability of
each village to be selected by the optimization procedure for sample selection. Bootstrapped standard
errors are obtained from B = 350 �optimal samples�. Each �optimal sample� is obtained from K = 1000
samples bootstrapped by Union and treatment status.
64

Table A16: Robustness checks: controls
Dependent variable: WTP (1) (2) (3) (4) (5) (6)
CDD program 0.58** 0.47* 0.55* 0.52* 0.60** 0.61**
(0.27) (0.28) (0.28) (0.27) (0.27) (0.28)
Controls ✓ ✓ ✓ ✓ ✓Controls (favorite set) ✓ ✓Enumerator FE ✓ ✓ In Lasso
Lasso ✓Pre-speci�ed ✓ ✓ ✓N 2304 2108 2108 2090 2090 2144
Notes: Standard errors clustered at community level. Regressions weighted by the probability
of each village to be selected by the optimization procedure for sample selection.
C Appendix: Selection of control and treated villages
Within the CDD program, treated villages are further randomly assigned to di�erent con-
tribution requirements in terms of co-funding the project: (i) cash contribution; (ii) labour
contribution; (iii) waiver. By design of the CDD program, 1/4 of communities are in the
control group and 3/4 in the treated group (Table A17).
According to the initial design, selected for the lab-in-the-�eld experiment 92 communities:
35 from the control group and 57 from the treated group, evenly distributed across treatment
arms (Table A18).
Table A17: Sample size for the CDD program
Union name Control Cash Labour Waiver Total
Deuli 8 8 7 8 31
Saidpur 9 9 10 10 38
Balua 4 5 5 4 18
Mokamtala 9 9 9 9 36
Shibgonj 2 2 2 2 8
Maidanhata 4 4 3 4 15
Roynagar 1 1 1 3
Kichak 1 1 2 2 5
Total 38 39 39 39 155
65

Table A18: Sample size for lab-in-the-�eld experiment
Union name Control Cash Labour Waiver Total
Deuli 5 2 2 2 11
Saidpur 9 5 5 6 25
Balua 4 2 2 2 10
Mokamtala 9 5 5 5 24
Shibgonj 2 1 1 1 5
Maidanhata 4 2 2 2 10
Roynagar 1 1 1 3
Kichak 1 1 1 1 4
Total 35 19 19 19 92
Originally, I considered ineligible for this project nine communities: (i) one where the
community was not interested in holding the meeting; (ii) two where the community did not
reach an agreement during the community meetings; (iii) one where installation failed for
one tubewell and cash contributions failed for the other tubewell; (iv) �ve communities in
Deuli Union where installations failed due to hydro-geological reasons.
Among eligible communities, I select the ones where to conduct the lab-in-the-�eld exper-
iment in order to maximize the balance between the treatment and control group on a set of
pre-intervention observables. I reiterate 1,000 times a random sampling procedure strati�ed
by Union, and I implement the one with the highest pvalue from the F-test on the balance
of pre-intervention observables between treated and control villages. We test the balance be-
tween the treatment and control group on the following set of pre-intervention observables,
aggregated at village level:
� village size;
� number of clusters;
� share of arsenic contaminated water sources;
� share of bacteria contaminated water sources;
� number of o�ered water sources if treated;
� average poverty score (2$ poverty line);67
67The poverty score is the Progress out of Poverty Index (PPI), which uses answers to simple questionsabout a household's characteristics and asset ownership in order to compute the likelihood that the household
66

� average willingness to take part to a collective action for the construction of a new
public water source;
� share of households reporting that the decision on the construction of a new public
water source in their village should be taken by unanimity;
� share of households reporting that the decision on the construction of a new public
water source in their village should be taken by majority;
� share of households reporting that the decision on the construction of a new public
water source in their village should be taken by the government;
� share of households reporting that the decision on the construction of a new public
water source in their village should be taken by village leaders;
� average self-reported willingness to pay (cash) for a new public water source in own's
favourite location;
� average self-reported willingness to pay (cash) for a new public water source in the best
location for the community;
� average self-reported willingness to pay (time) for a new public water source the in best
location for the community;
� average network size;
� number of leader households;
� distance to the closest pharmacy;
� distance to the closest health clinic;
� share of villagers with no education;
� literacy rate.
As performed in date December 2, 2016, the best random sample has F-test with pvalue
equal to 0.96.
As I reconsidered the sample selection in February 2017, I added the four communities
in categories (i)-(iii) to the original sample of 92 communities selected via the optimization
algorithm. In Table A19 I test for balance in the �nal sample of 96 communities, reporting
is living below 2$ poverty line. We refer here to the construction of the PPI for Bangladesh. Further referencescan be found here: http://www.progressoutofpoverty.org/.
67

the pvalues from pairwise ttests between the control and treated groups for the set of pre-
intervention observables used to identify the optimal random sample.
Table A19: Balance tests of covariates between treatment and control group
Control group
- Mean (s.e.)
Treated group
- Mean (s.e.)pvalue Observations
Number of clusters 1.10 (0.31) 1.31 (0.29) 0.315 96
Average household size 3.95 (0.09) 3.91 (0.09) 0.550 96
Number of anchors 1.11 (0.15) 1.18 (0.14) 0.528 96
Average poverty score - 2 USD 81.51 (2.30) 80.97 (2.17) 0.737 96
Participation to a collective action to provide a new
public safe water source0.98 (0.01) 0.97 (0.01) 0.932 96
Decision on a new public safe water source - unanimity 0.77 (0.04) 0.73 (0.04) 0.168 96
Decision on a new public safe water source - majority 0.42 (0.04) 0.43 (0.04) 0.593 96
Decision on a new public safe water source -
government0.09 (0.03) 0.09 (0.03) 0.936 96
Decision on a new public safe water source - village
leaders0.23 (0.06) 0.27 (0.06) 0.245 96
Decision on a new public safe water source - ngo 0.17 (0.06) 0.22 (0.06) 0.203 96
WTP (cash) for installation of a new public safe water
source in most preferred247.49 (34.94) 252.97 (32.95) 0.821 96
WTP (cash) for installation of a new public safe water
source in location servin104.49 (16.49) 110.49 (15.54) 0.600 96
WTP (time) for installation of a new public safe water
source in most preferred10.37 (4.39) 8.90 (4.14) 0.627 96
Share of bacteria contaminated water sources 0.57 (0.04) 0.56 (0.04) 0.618 96
Share of arsenic contaminated water sources 0.68 (0.07) 0.73 (0.07) 0.382 96
TU size 117.35 (17.87) 125.40 (16.85) 0.516 96
Average network size 2.76 (0.13) 2.86 (0.13) 0.270 96
Number of leaders 2.69 (0.12) 2.70 (0.12) 0.852 96
Distance to the closest pharmacy (min) 18.82 (1.93) 18.84 (1.82) 0.988 96
Distance to the closest health clinic (min) 26.81 (2.70) 26.65 (2.54) 0.934 96
Share of not educated people 0.33 (0.03) 0.35 (0.03) 0.330 96
Literacy rate 0.57 (0.03) 0.57 (0.03) 0.677 96
Note: Standard errors are shown in parentheses. Column 4 reports the pvalues from pairwise tests of the mean
di�erence between treatment and control group, from a regression of the outcome variable on indicators for the
two groups (with Union �xed e�ects and no constant).
68

D Appendix: Scripts
D.1 Introduction of the project to the community
We are working for a NGO called NGO Forum for Public Health, and collaborating with
researchers from Stockholm University, Sweden.
NGO Forum is conducting an arsenic mitigation program in the region. As part of that
project, some months ago we tested for bacteria and arsenic all sources of drinking water
in this village. Moreover, we conducted an interview with some households in this village.
Remind the community people about the project and the treatment status of the village, and
the progress of the project.
We now selected your village for another related project, which is called �Community Decision
Making Project�. The aim of this new project is to study how communities take decisions in
rural Bangladesh.
What we learn from this study will help us and other organizations to improve the design
of programs, like the arsenic mitigation program we are conducting in this region. This may
help other communities like your own.
We randomly selected 21 households for this project, and we will invite one man and one
woman per household to participate to an experimental session. Their tasks will take ap-
proximately 4-5 hours, and we will compensate participants for their time.
D.2 Invitation of participants
We are working for a NGO called NGO Forum for Public Health, and collaborating with
researchers from Stockholm University.
NGO Forum is conducting an arsenic mitigation program in the region. As part of that
project, some months ago we tested for bacteria and arsenic all sources of drinking water in
this village. Moreover, we conducted an interview with some households in this village. We
now selected your village for another related project.
We conducted a public lottery in order to decide which villages were going to receive the
intervention and the possibility to construct a new public source of safe water.
69
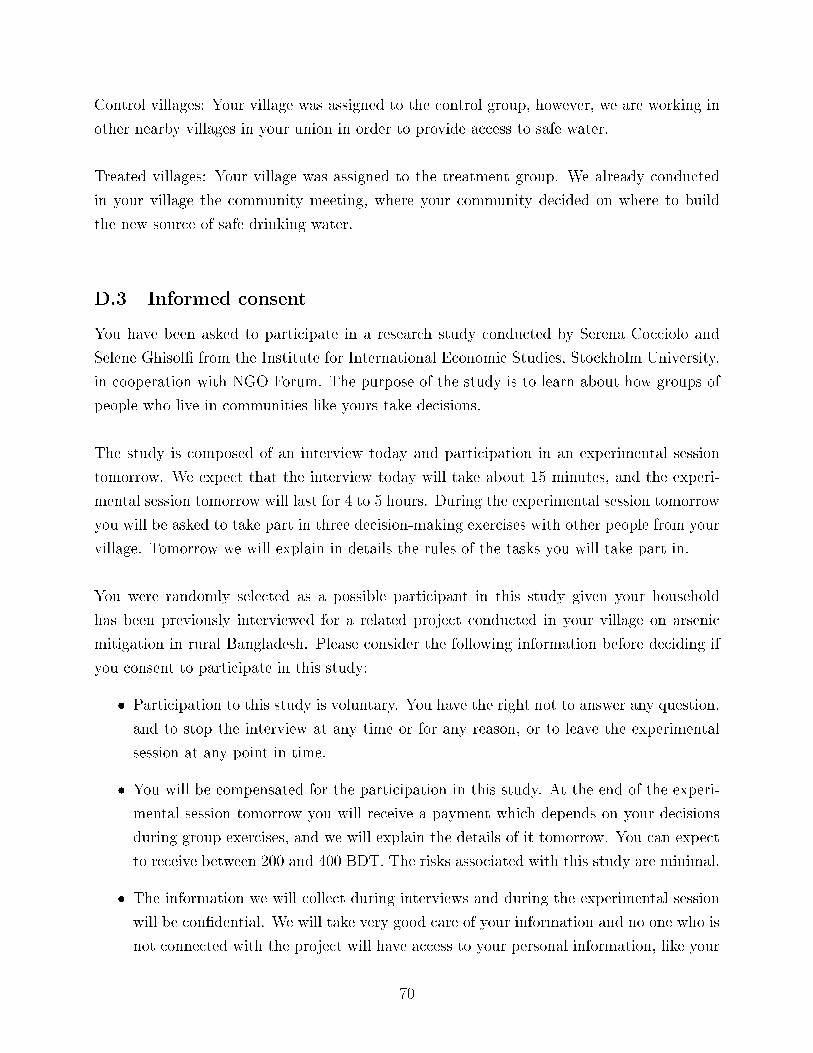
Control villages: Your village was assigned to the control group, however, we are working in
other nearby villages in your union in order to provide access to safe water.
Treated villages: Your village was assigned to the treatment group. We already conducted
in your village the community meeting, where your community decided on where to build
the new source of safe drinking water.
D.3 Informed consent
You have been asked to participate in a research study conducted by Serena Cocciolo and
Selene Ghisol� from the Institute for International Economic Studies, Stockholm University,
in cooperation with NGO Forum. The purpose of the study is to learn about how groups of
people who live in communities like yours take decisions.
The study is composed of an interview today and participation in an experimental session
tomorrow. We expect that the interview today will take about 15 minutes, and the experi-
mental session tomorrow will last for 4 to 5 hours. During the experimental session tomorrow
you will be asked to take part in three decision-making exercises with other people from your
village. Tomorrow we will explain in details the rules of the tasks you will take part in.
You were randomly selected as a possible participant in this study given your household
has been previously interviewed for a related project conducted in your village on arsenic
mitigation in rural Bangladesh. Please consider the following information before deciding if
you consent to participate in this study:
� Participation to this study is voluntary. You have the right not to answer any question,
and to stop the interview at any time or for any reason, or to leave the experimental
session at any point in time.
� You will be compensated for the participation in this study. At the end of the experi-
mental session tomorrow you will receive a payment which depends on your decisions
during group exercises, and we will explain the details of it tomorrow. You can expect
to receive between 200 and 400 BDT. The risks associated with this study are minimal.
� The information we will collect during interviews and during the experimental session
will be con�dential. We will take very good care of your information and no one who is
not connected with the project will have access to your personal information, like your
70

name. We will only use your personal information, like your name, in carrying out this
project, and if we use information from the survey in the future we will remove your
name and change your location so that no one can recognize you.
� We would like to record the experimental session. W will not record the session if you
do not grant permission for doing it. You have the right to revoke recording permission
at any time.
This project will be completed by April 2017. All interview recordings will be stored in a
secure work space until 1 year after that date. The tapes will then be destroyed.
Do you understand the procedures described above? Did I answer your questions to your
satisfaction?
Do you consent to participate in this study?
Do you give permission for the experimental session to be recorded?
D.4 Individual survey
Script for questionnaire introduction:
�In the next questions we will ask you some questions about your preferences and opinion.
There will be no correct answer! We are only interested in what are your personal preferences
and opinions. So you can feel free to give us your true answers.�
� Think about situations when your household have to take a decision about an important
purchase (e.g. furniture). Are you usually involved in these kind of major decisions for
the household?
Options: I decide alone; I am involved in the decision; I am not involved in the decision;
Don't know; Refused to answer.
� Please tell me how much you agree with the following statement: �Generally speaking,
most people can be trusted.�
Options: Strongly agree; Agree; Neither agree nor disagree; Disagree Strongly disagree;
Don't know; Refused to answer.
� Please tell me how much you agree with the following statement: �In life, people are
rewarded for their e�orts.�
Options: Strongly agree; Agree; Neither agree nor disagree; Disagree Strongly disagree;
Don't know; Refused to answer.
71

� Now I will brie�y describe some people. Please indicate for each description whether
that person is very much like you, somewhat like you, not like you, or not at all like
you: �This person is very careful in trying to avoid risks. For instance, when taking
farming decisions (men), when cooking (women), when deciding about health, when in
tra�c, etc.�
Options: Very much like me; Like me; Not like me; Not at all like me; Don't know;
Refused to answer.
� Now I will brie�y describe some people. Please indicate for each description whether
that person is very much like you, somewhat like you, not like you, or not at all like you:
�It is important for this person to help the people nearby, to care for their well-being.�
Options: Very much like me; Like me; Not like me; Not at all like me; Don't know;
Refused to answer.
� Now I will brie�y describe some people. Please indicate for each description whether
that person is very much like you, somewhat like you, not like you, or not at all like
you: �This person is very good in negotiating with other people: he/she is not afraid
about expressing his/her opinion, even when in disagreement with other people, and
he/she is able to express his/her own opinion in a convincing way, and he/she is often
able to make other people reconsider their position.�
Options: Very much like me; Like me; Not like me; Not at all like me; Don't know;
Refused to answer.
� Please state whether you agree or disagree with the following statements about an
hypothetical construction of a public infrastructure, for instance a mosque/temple:
�The richest people in the village should pay more of the cost of the construction.�
Options: Strongly agree; Agree; Neither agree nor disagree; Disagree Strongly disagree;
Don't know; Refused to answer.
� Please indicate whether you agree or not with the following statement: �If there was
a village meeting in order to decide about an issue in my community (e.g. building
a new road, school, temple/mosque, tubewell, etc), I would participate in the village
meeting.�
Options: Strongly agree; Agree; Neither agree nor disagree; Disagree Strongly disagree;
Don't know; Refused to answer.
� Please indicate whether you agree or not with the following statement: �I think people
should have a say about decisions regarding their community.�
72
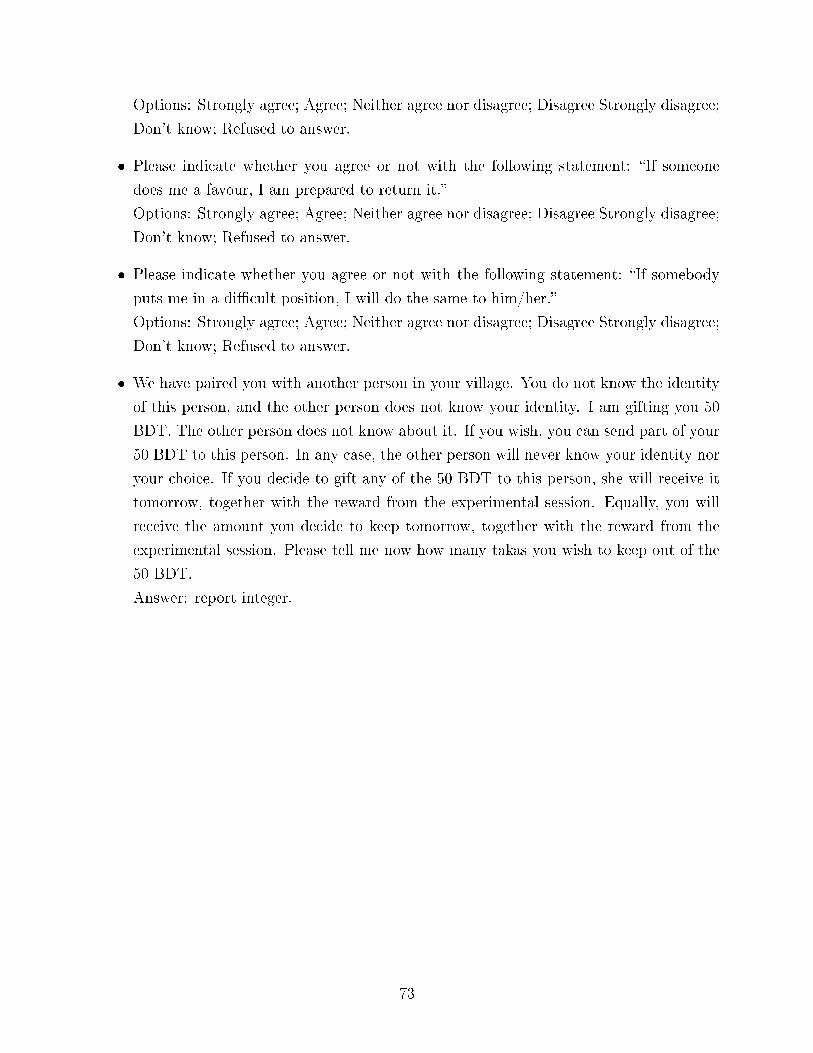
Options: Strongly agree; Agree; Neither agree nor disagree; Disagree Strongly disagree;
Don't know; Refused to answer.
� Please indicate whether you agree or not with the following statement: �If someone
does me a favour, I am prepared to return it.�
Options: Strongly agree; Agree; Neither agree nor disagree; Disagree Strongly disagree;
Don't know; Refused to answer.
� Please indicate whether you agree or not with the following statement: �If somebody
puts me in a di�cult position, I will do the same to him/her.�
Options: Strongly agree; Agree; Neither agree nor disagree; Disagree Strongly disagree;
Don't know; Refused to answer.
� We have paired you with another person in your village. You do not know the identity
of this person, and the other person does not know your identity. I am gifting you 50
BDT. The other person does not know about it. If you wish, you can send part of your
50 BDT to this person. In any case, the other person will never know your identity nor
your choice. If you decide to gift any of the 50 BDT to this person, she will receive it
tomorrow, together with the reward from the experimental session. Equally, you will
receive the amount you decide to keep tomorrow, together with the reward from the
experimental session. Please tell me now how many takas you wish to keep out of the
50 BDT.
Answer: report integer.
73

E Appendix: Scripts for the experimental session
E.1 General introduction to the lab
Welcome everybody and thank you for coming.
This experiment is conducted by researchers from Stockholm University in cooperation with
NGO Forum. NGO Forum is conducting in this region a related project in order to provide
safe drinking water to communities in this region highly a�ected by arsenic.
We conduct this experiment in order to study how communities take decisions in rural
Bangladesh. The results from this study will help to develop policies that can better serve
rural villages.
This experimental session will last around 3 hours and you are going to complete 3 di�erent
tasks. At the end you will receive a reward, which will depend on the decisions taken by
yourself and your group peers during all the 3 exercises.
You will complete each task in groups. The groups will be di�erent for each task. At the
beginning of each exercises we will describe exactly your task. Everything contained in these
instructions and everything you hear in this session is an accurate representation of this ex-
periment. Be sure to ask any questions that you may have during this instruction period,
and ask for assistance, if needed, at any time.
You will complete the tasks using tokens. At the end of each round we will record how many
tokens you have gained. The more tokens you have earned, the higher will be your �nal
reward.
Each token will be exchanged for 5 takas. We will also reward your participation with a
constant show-up fee of 30 takas.
You will be involved in three group tasks.
For the �rst two exercises, you will �rst complete a TRIAL round to familiarize with the
rules, and the you will complete the REAL round. Only the REAL round will count to
determine your �nal reward. You will complete the third task only once, without TRIAL.
74

At the end of the session, we will reward all participants according to the sum of tokens you
obtained for each task. In order to maximize your winnings, remember to complete each task
at your best throughout the whole session!
Throughout the experiment we will use lotteries in order to guarantee the fairness of the
experiment for all participants. All the relevant steps are clearly documented, and follow
scienti�c and academic standards. None of these procedures is related to gambling.
You are required to keep a tidy and calm behaviour. Any misbehaviour will be punished
with the exclusion from the project and you will not receive any reward. You are explicitly
not allowed to:
� Make physical threats of any kind or verbally abuse other players;
� Steal or hide tokens from your group or from the other group members;
� Remove, exchange or lose your ID codes;
� Suggest how to play to people outside your group;
� Agree to share compensations after the experiment;
� Ask other participants how much they have earned when the experiment has ended.
E.2 Contribution task
In this exercise you will start with a number of tokens of your property. You will extract a
color, and your tokens will be of that color. The extracted color determines your number of
initial tokens and you cannot change it. You will be assigned the same number of tokens in
the TRIAL and in the REAL round. Each token has the exact same value, regardless of the
color. We will also distribute 30 white tokens.
We will also distribute a timer per group.
Please do not touch the tokens nor the timer until we give you the start.
[Enumerators distribute individual and group tokens. Enumerators distribute the timers and
explain how to operate it.]
75

Imagine now that the marked central area represents a common project you can undertake
together with your group mates. Investing money in this common project results in doubling
your investment. Your aim is to decide how much of your colored tokens you want to invest in
this common project, and simultaneously how to divide among your group the whole amount
of the project, which is double the sum of what each of you invested.
To give you a real-life example, imagine that your group has decided to build a new mosque/tem-
ple and that a donor has accepted to co-fund it. Then, your group has to decide who
is contributing to the mosque/temple, and also where to place it. When you place the
mosque/temple the group members who are close to it will be happier than the ones who are
far from it.
In practice, during this exercise, any of you can decide to contribute any number of your own
colored tokens to the project by putting them in the central area. By doing this you will be
allowed to take the same number of white tokens and put them in the central area as well.
This is our way to show how the investment in the common project doubles.
In the same way, you can also remove tokens of your color from the central area. When you
do this, you must also remove the same number of white tokens.
There must always be the same number of colored (no matter what color) tokens and white
tokens in the central area.
You will also decide how to distribute all the tokens in the central area (both the white
ones and the colored ones). In order to distribute tokens, you must put the tokens in front of
the person you want to give the common tokens to, but still keeping them in the central area.
Contributions to the common project are fully voluntary. However, you will have to agree
with your group mates on how to divide the tokens in the central area between yourselves.
You cannot place the colored tokens of another person in the central area, if she does not
want to. And you cannot remove from the central area the colored tokens of someone else, if
she does not want to.
Similarly, none can take your colored tokens and put them in the central area if you do not
want to. And none can take your colored tokens from the central area and place them outside
76

the central area if you do not want to.
You have maximum 20 minutes to reach a �nal agreement. In order to reach a valid agree-
ment all group members should agree with it. If at the end of the 20 minutes you have not
reached an agreement, you will lose all the white tokens and keep just the colored tokens you
were given initially. After 20 minutes you will not be allowed to touch the tokens or negotiate
anymore.
In case you reach an agreement before 20 minutes, raise your hand and signal that your group
has reached a �nal decision on the distribution of the tokens. One enumerator will come to
attend your group.
When you complete the task, or when the time is over, stop the timer by pressing on the
�START/STOP� button.
The enumerators will accept a distribution only if everyone agrees with it. Moreover, they
will check that the number of white tokens is the same as the total number of colored tokens.
The enumerator will record the sum of the tokens, both inside and outside the central areas.
This represents your result for the round.
The enumerator will reorganize all the tokens as at the beginning. In the REAL round you
will receive the same number of tokens of same color. You cannot keep any token from the
TRIAL to the REAL round.
In order to clarify the rules, we will now give you some examples:
� Control question 1:
If everyone in the group contributes all his/her tokens, at the end you will have 60
tokens to split across your group. Please raise your hand if this is right.
[Verify EVERYONE has their hand raised. If someone did not understand, clarify.]
� Control question 2:
If everyone in the group contributes no tokens, at the end you will have no tokens to
split across your group. Please raise your hand if this is right.
[Verify EVERYONE has their hand raised. If someone did not understand, clarify.]
77

� Control question 3:
If everyone in the group contributes just 5 tokens, at the end you will have 30 tokens
to split across your group. Please raise your hand if this is right. [Verify EVERYONE
has their hand raised. If someone did not understand, clarify.]
You will complete this task two times. The �rst time is a TRIAL, for you to learn the rules.
The second time is the REAL round, and the number of tokens will be used to calculate your
�nal reward. We start now with the TRIAL round, you will complete the REAL round after
this.
Remember to press the button �START/STOP� when you complete the task or the time is
over.
E.3 Redistribution task
In this exercise you will start with a number of tokens of your property. You will extract a
color, and your tokens will be of that color. The extracted color determines your number of
initial tokens and you cannot change it. You will be assigned the same number of tokens in
the TRIAL and in the REAL round. Each token has the exact same value, regardless of the
color. We will also distribute 30 white tokens in the central area.
We will also distribute a timer per group.
Please do not touch the tokens nor the timer until we give you the start.
[Enumerators distribute individual and group tokens. Enumerators distribute the timers and
explain how to operate it.]
Your task is to agree with your group mates on how to distribute the white tokens among
yourselves.
You can take the white tokens from the center and distribute them in the marked central
area, in front of the member of your group you want to assign them to. Anyone in your group
can move the white tokens. You can always touch and distribute all the white tokens, and
you must leave them in the marked central area. You cannot put your own colored tokens in
the central area or give them to other players in the group.
78

To give you a real-life example, imagine that someone has decided to donate to your group
to build a new mosque/temple. Then, your group has to decide where to place it. When you
place the mosque/temple the group members who are close to it will be happier than the
ones who are far from it.
You have 20 minutes to reach a �nal agreement on how to split the white tokens. After that,
you will not be allowed to touch the tokens or negotiate anymore. If at the end of the 20
minutes you have not reached an agreement, the whole group will lose all the white tokens
and everyone will just keep the initial colored tokens.
In case you reach an agreement before 20 minutes, raise you hand and signal that your group
has reached a �nal decision on the distribution of the tokens. One enumerator will then come
to attend your group.
When you complete the task, or when the time is over, stop the timer by pressing on the
�START/STOP� button.
The enumerators will accept a distribution only if everyone agrees with it. Moreover, they
will check that colored tokens have not been distributed among players.
The enumerator will record the sum of the tokens, both inside and outside the central areas.
This represents your result for the round.
The enumerator will reorganize all the tokens as at the beginning. In the REAL round you
will receive the same number of tokens of same color. You cannot keep any token from the
TRIAL to the REAL round.
In order to clarify the rules, we will now give you some examples:
� Control question 1:
Your group can decide to split the tokens equally among you. Since the total number
of tokens to share is 30, this means that everyone of you can have 10 tokens more than
what you started with. If everyone in your group agrees with this distribution, this can
be done. Please raise your hand if this is right.
[Verify EVERYONE has their hand raised. If someone did not understand, clarify.]
� Control question 2:
Your group can decide to split the tokens such that at the end of the task everyone has
79
the same number of tokens, either colored or white. This means that some people will
have more white tokens, and some people less white tokens. If everyone in your group
agrees with the distribution, this can be done. Please raise your hand if you think this
is right.
[Verify EVERYONE has their hand raised. If someone did not understand, clarify.]
You will complete this task two times. The �rst time is a TRIAL, for you to learn the rules.
The second time is the REAL round, and the number of tokens might be used to calculate
your �nal reward. We start now with the TRIAL round, you will complete the REAL round
after this.
Remember to press the button �START/STOP� when you complete the task or the time is
over.
E.4 WTP Elicitation
As the instructions are identical for Task 1 and Task 2, for simplicity in the next paragraphs
we describe it referring to Task 1 only.
E.4.1 Scripts for the �eld supervisor
� With all participants:
We are now starting the third part of Task 1. For this part we have formed new groups,
di�erent from the groups you just played with. Each group face the same situation as
in the Task 1.
We selected randomly one person per group to play this part of the task. This person
to decide how he/she wants that her group will take decisions. We will explain the
details to each participant later.
During Task 3 of the experimental session, some of the groups might play again Task 1.
This will depend on the choices made by the group representative in this part of the task.
According to the choice expressed by the group representative, some groups will play
again, and some others will not. In all cases, all of you will receive receive some pay-
ment for Task 3.
80

It is important for all of you to know that the persons selected for this �rst part of the
task should feel free to choose whatever they prefer. At the end you should not ask
them which choices they took. Also, you should know that it will not be possible for
anyone to understand from the �nal results of the task which choices they took.
We will now tell you who should stay for this part of the task.
� With only participants selected for the task:
Consider that each group face the same situation as in Task 1. Remind the rules for
Task 1.
This time, you have been extracted in order to decide how this group decision will be
taken.
The �rst option is to play again the bargaining stage as in the previous round. This
means that you will seat again with your group members and will bargain until you
reach a common agreement. You will be paid for Task 3 according to the decision taken
with your new group.
The other option is to not participate in the decision. In this latter case, we will impose
a decision. We will assign to your group the agreement taken by another group in the
previous REAL round of Task 1 that we just played. We will do this assignment using
a lottery. Each person in your group will receive the �nal number of tokens obtained
by the person in the assigned group with the same color. In this way we will de�ne
your payment for TASK 3. For example the person with the yellow tokens in your new
group will receive the same number of tokens obtained by the person with the yellow
tokens in the assigned group. This means that, in case you will not play again with
your group, you can expect to receive the same number of tokens as a standard player
with your same colour in Task 1. This outcome will be de�nitive and it will not be
possible to change it.
According to your choices, your group might play again Task 1. In case of playing
again, you and your group will play during the third round.
81

Each of you will complete this part of the task with one enumerator.
For this part of the task there will NOT be a trial round. The decisions you will take
are �nal.
Remember that we will keep secret all your answers. The other group members will
never know your choices at this stage.
Remember that we already formed new groups, but you do not know the identity of
your new group peers.
The rule under which you will play the last round will depend on your choices. There-
fore, it is always better for you to carefully pick the option you truly prefer.
In order to clarify the rules, we will now give you some examples:
� Control question 1:
Please raise your hand if you think that the following sentence is correct: �You
will be asked to choose between, on one side, performing the Task 1 again and, on
the other side, be assigned the outcome of another group.�
[Verify EVERYONE has their hand raised. If someone did not understand, clarify.]
� Control question 2:
Please raise your hand if you think that the following sentence is correct: �In both
cases, if you play again Task 1, and if you do not, you will always receive some
payment for TASK 3. The two payments might be di�erent.
[Verify EVERYONE has their hand raised. If someone did not understand, clarify.]
E.4.2 Scripts for the enumerators
I will now present you di�erent choices in which you have to choose between two alternatives.
The �rst alternative will always be repeat Task 1 as you have just done with new group peers.
If you take part again in Task 1, you will be in group with di�erent team mates than before.
The second alternative will be to NOT repeat Task 1 with new group peers.
82

What will happen in Task 3 will depend on your answers. Before Task 3 we will extract one
choice, and the choice you made in that case will be �nal.
Each choice can be extracted. Therefore, it is always better for you to tell me your true
answer. The lottery guarantees that no one will be able to understand your choices. And I
will keep secret all your answers. Therefore you can feel free to express your true opinions.
When you choose whether you prefer to complete Task 1 again with new group peers or not
you might think at di�erent factors. For example:
� Do you remember how much did you get in the real round you just completed? How
much?
[Remind the correct answer.]
� In the previous two rounds, did you enjoy completing Task 1(2) with your group?
� Consider to play again Task 1(2) with your newly assigned initial tokens. How much do
you think you will be in�uential in the group in order to determine the �nal outcome?
Elicitation procedure of WTP and beliefs:
� Choice 1:
The �rst alternative is to complete Task 1 again with new group peers.
The second alternative is to not complete Task 1 with new group peers.
Remember that in case we will extract this choice, your new group will complete Task
1 again or not according to your answer. Your decision will be �nal.
� Choice 2-6:
The �rst alternative is to complete Task 1 again with new group peers AND lose 1-5
token.
The second alternative is to not complete Task 1 with new group peers.
In case you choose to �rst alternative, you will complete Task 1 with your initial tokens.
We will deduct 1-5 token (5-25 BDT) from your �nal total compensation.
Remember that in case we will extract this choice, your new group will complete Task
1 again or not according to your answer. Your decision will be �nal.
� Choice 7-11:
The �rst alternative is to complete Task 1 again with new group peers AND win 1-5
tokens.
83

The second alternative is to not complete Task 1 with new group peers.
In case you choose to �rst alternative, you will complete Task 1 with your initial tokens.
We will add 1-5 token (5-25 BDT) to your �nal total compensation.
Remember that in case we will extract this choice, your new group will complete Task
1 again or not according to your answer. Your decision will be �nal.
� Guess under the participatory option:
Consider your initial tokens. Imagine to complete again Task 1(2) with new group
members. How many tokens IN TOTAL do you think you will get?
� Guess under the group-extraction option:
Imagine you do not complete again Task 1(2), and instead receive the outcome of a
player with your initial tokens from another group. How many tokens IN TOTAL do
you think you will get? You will win 30 takas if you answer correctly to this question!!
E.5 Individual survey after the experimental session
Script for intro:
�Thank you for your participation in the study!
In conclusion, we would like you to ask you few questions on your perceptions of the tasks.
All your responses will be kept con�dential: we will not share your answers with anyone
outside the research team.
You will receive your compensation from the tasks after this short survey. The answers in
this short survey will not change your compensation.�
� How much are you satis�ed with your outcome in the 1st round?
Options: Very satis�ed; Satis�ed; Neither satis�ed or dissatis�ed; Dissatis�ed; Very
dissatis�ed; Don't know; Refused to answer.
� How much are you satis�ed with your outcome in the 2nd round?
Options: Very satis�ed; Satis�ed; Neither satis�ed or dissatis�ed; Dissatis�ed; Very
dissatis�ed; Don't know; Refused to answer.
� How much are you satis�ed with your outcome in the 3rd round?
Options: Very satis�ed; Satis�ed; Neither satis�ed or dissatis�ed; Dissatis�ed; Very
dissatis�ed; Don't know; Refused to answer.
� After which round were you most satis�ed with your outcome?
Options: Task 1; Task 2; Task 3.
84

� What is the maximum amount all your group could have won in the contribution task?
Answer: report integer.
� How could you reach this maximum amount? (do not probe)
Options: We could have won the maximum if everyone had contributed everything;
Other; Don't know; Refused to answer.
85