Embed Size (px)
Citation preview

9197 South Peoria Street Englewood, CO 80112-5833 +1 303 397-8100 or 1-800 835-3832 teletech.com
TeleTech is a leading global provider of customer experience, engagement, and growth solutions. Founded in 1982, the company helps its clients acquire, retain, and grow profitable customer relationships. Using customer-centric strategy, technology, processes, and operations, TeleTech partners with business leadership across marketing, sales, and customer care to design and deliver a simple, more human customer experience across every interaction channel.
TeleTech’s 48,000 employees live by a set of customer-focused values that guide relationships with clients, their customers, and each other.
To learn more about how TeleTech is bringing humanity to the customer experience, visit us at TeleTech.com.
Experience Matters
2016 ANNUAL REPORT
It’s everywhere we look, touch and interact. As our world becomes more digital, connected and data-driven, our expectations for experiences with brands are skyrocketing. We will no longer accept “please hold” or “page not found.” We expect to be recognized, helped and entertained. Treat us like a number and we are gone. Treat us like individuals and we are yours. For now...
281654_2016_AR_cover.indd 1 3/29/17 6:56 AM

Corporate InformationDirectorsKenneth D. TuchmanFounder, Chairman of the Board
Steven J. AnenenFormer Chief Executive Officer, CDK Global, Inc.; former President of ADP Dealer Services; former Senior Vice President of North America Systems.
Tracy L. BahlExecutive Vice President, Health Plans, CVS Health; former Director, MedExpress; former Executive Chairman, Emdeon; former Chief Executive Officer, Uniprise
Gregory A. ConleyDirector, HaulHound.com; former Chief Executive Officer, Aha! Software; former Chief Executive Officer, Odyssey Group, SA
Robert N. FrerichsDirector, Merkle, Inc.; former International Chairman, Accenture, Inc.; former Chairman, Aricent Group; former Chairman, Avanade
Marc L. HoltzmanChief Executive Officer of Kazkommertsbank; Chairman, Bank of Kigali; former Director, FTI Consulting; former Chairman, Meridian Capital HK; former Vice Chairman, Barclays Capital
Shrikant MehtaChief Executive Officer, Combine International, Inc.; Director, Lenderlive, Little Switzerland and NETLINK
Executive OfficeKenneth D. TuchmanChief Executive Officer
Regina M. PaolilloExecutive Vice President; Chief Administrative and Financial Officer
Martin F. DeGhettoExecutive Vice President; Chief Operating Officer; Customer Management and Customer Growth Services
Judi A. HandExecutive Vice President; Chief Revenue Officer
Robert N. JimenezExecutive Vice President; Customer Strategy Services
Steven C. PollemaSenior Vice President; Customer Technology Services
Margaret B. McLeanSenior Vice President, General Counsel and Chief Risk Officer
Audit CommitteeGregory A. Conley, ChairmanSteven J. AnenenRobert N. Frerichs
Compensation CommitteeTracy L. Bahl, ChairmanGregory A. ConleyRobert N. Frerichs
Nominating and Governance CommitteeRobert N. Frerichs, ChairmanSteven J. AnenenTracy L. Bahl
Executive CommitteeKenneth D. Tuchman, ChairmanTracy L. BahlShrikant Mehta
Stock ListingNASDAQ Global Select MarketSymbol: TTEC
Websiteteletech.com
2017 Annual Meeting of StockholdersThe Annual Meeting of Stockholders will be held Wednesday, May 24, 2017, beginning at 1:00 p.m. MDT at:TeleTech Holdings, Inc.Global Headquarters9197 South Peoria StreetEnglewood, CO 80112-5833
Transfer Agent and RegistrarBroadridge Corporate Issuer Solutions, Inc.1717 Arch Street, Suite 1300Philadelphia, PA 19103Telephone: 855.206.5002Facsimile: 215.553.5402Email: [email protected]
Investor InformationInvestor information, including TeleTech’s Annual Report, press releases and fili gs with the U.S. Securities and Exchange Commission, may be obtained from TeleTech’s website, teletech.com or by contacting TeleTech Investor Relations at:[email protected]
Independent AccountantsPricewaterhouseCoopers LLP, Denver, Colorado
2014 2015 2016Revenue $ 1,241.8 $ 1,286.8 $ 1,275.3
EBITDA $ 157.1 $ 151.9 $ 121.9
Operating income $ 96.5 $ 90.2 $ 52.8
Operating margin 7.8% 7.0% 4.1%
EBIT $ 100.5 $ 88.1 $ 53.3
Net income $ 72.3 $ 61.7 $ 33.7
Average diluted shares outstanding 50.1 49.0 47.7
Net income per diluted share $ 1.44 $ 1.26 $ 0.71
Cash and cash equivalents $ 77.3 $ 60.3 $ 55.3
Total debt $ 105.9 $ 107.3 $ 229.6
Capital expenditures $ 67.6 $ 66.6 $ 50.8
Financial Highlights($ in millions, except per share data)
34%
17%14%
12%
9%
6%4%4%
2016 Revenue by Vertical Market 2016 Revenue by Segment
Telecommunications, Internet, Media and Entertainment
Financial Services
Automotive
Healthcare
Technology
Other
Retail
Government 73%
11%
11%
5%
Customer Management Services
Customer Technology Services
Customer Growth Services
Customer Strategy Services
20152014 20152014 20152014
$1,241.8 $96.5$1.44
2016
$1,286.8
2016
$90.2$1.26
2016
Non-GAAP* $1,241.8 $1,286.8 $100.2 $100.1 $1.43 $1.48
$1,275.3
$1,295.5
$52.8
$83.3
$0.71
$1.32
Revenue Operating Income Net Income Per Diluted Share
*For a reconciliation to Non-GAAP figu es, please see the financial table ollowing the Chairman’s Letter and the information provided in Form 10-K.
281654_2016_AR_cover.indd 2 3/29/17 6:56 AM

Experience Matters
2016 was the year that customer experience hit the tipping point. Customer experience emerged as the key differentiator and business leaders across the globe took notice. Our client conversations pivoted from making the case for transformation to building the blueprint for delivering amazing customer experiences at every touchpoint.
It was a busy year for us:
− We established 42 new client relationships, several new strategic channel partnerships, and expanded our global footprint through the acquisition of Canadian-based Atelka.
− We increased our analytics business 26 percent, our cloud business 19 percent, and our sales outsourcing business 11 percent.
− And, our 2016 client NPS results continued to be the best in the services industry and our employee satisfaction reached an all-time high.
We also faced some challenges. In the fir t half of the year, we encountered sales execution gaps that impacted our financial r sults for the year. We acted with speed by putting new leadership in place and fla tening our sales and marketing organization. We redirected sales investment to place more emphasis on growing our existing client base and streamlined our solutioning groups to simplify and prioritize the sale of integrated solutions. Additionally, we put significant emphasis on impr ving utilization across our segments and optimizing our SG&A costs.
As we head into 2017, we are well positioned to take full advantage of the unique customer experience platform we have worked so hard to build. With a growing pipeline and a streamlined operating structure, we are confident ou will see meaningful improvement in our financial pe formance in the quarters ahead.
So what is next on our agenda?
The marketplace is ripe, our offerings are on target, and our clients are onboard. Today, we are operating on the front lines of an omni-channel customer experience revolution. How do we evolve to further improve our top and bottom line?
Do business with clients whose true north is customer-centricity Over the past several years, we have shifted our focus to companies that share our passion for customer experience as a differentiator. We seek clients who are driven to make a genuine, lasting connection with their customers and are willing to invest for the long-run. These clients realize that when they create a relevant and frictionless experience with their customers they are rewarded with a lasting and profitablerelationship. They don’t view customer interactions as tasks to be managed but rather as relationships to be nurtured. They know that authentic customer engagement translates into increased revenue, profitabili y, and shareholder value.
Kenneth D. Tuchman Founder, Chairman and CEO
281654_2016_AR_Letter.indd 1 3/29/17 6:58 AM

Today’s customers expect frictionless experiences. They want to be capti-vated, entertained and acknowledged everywhere they encounter a brand.
We will derive our growth from two distinct client groups. New economy brands like Netflix that seek a high tech, l w friction experience for their customers, and well established, evolving brands like T-Mobile, Qantas and Telstra that are successfully winning in their respective markets because of their customer obsession and maniacal focus on a differentiated experience.
Today’s customers expect frictionless experiences. They want to be captivated, entertained and acknowledged everywhere they encounter a brand. That means every touch point as well as the white space in between. Customers expect companies to pay attention to and remember every interaction from physical stores and kiosks to text, voice, chat, email, social and video. They demand the ability to start an interaction in one channel and complete it in another. They choose interactions that are seamless and predictive across every modality - whether it is face-to-face, voice-to-voice or chat-to-chatbot.
Clients select us to help them imagine and create experiences their customers will love. They are asking us to design and deliver a roadmap to balance the convenience and immediacy of technology with the compassion of a human touch. They want ways to listen and learn from their customers’ journeys so they can understand and prioritize the experiences that drive action and earn lasting loyalty.
They view us as a strategic partner with a solution that delivers defined, aluable outcomes. Our relationship is not about labor augmentation. It is about business transformation and it touches every business unit, channel, customer, and touchpoint. Our clients are depending on us for thought leadership, best practices, and operational excellence at scale.
Leverage our full portfolio of offerings to deliver predictable, sustainable outcomesFor over 34 years, we have operated our business around one premise: The best and most satisfying customer experience is always delivered with an optimum return on investment. If a company can solve a problem or sell a product with one personalized interaction, the need for a myriad of complex phone calls, chats, texts, and emails is eliminated. The equation is simple -- when you replace the agony of multiple unfulfilledsearches, interminable wait times and endless IVR loops with the joy of a fl wlessly orchestrated, seamless interaction, the result is a happier customer and a better bottom line.
Getting to seamless, however, is not easy. It requires an immersive solution that weaves strategy, analytics, technology, and operations around a unique customer need. It doesn’t happen by creating a strategy alone. It is not achieved solely by putting the latest technology in the cloud. It is not accomplished by creating complicated predictive models or hiring highly motivated and skilled front line employees. Getting to seamless is about synchronization across every channel, every moment, every touchpoint, every time. It’s about using all of the knowledge a company has about a customer in the moment to recognize and remember the individual so that future interactions are easier, smarter and friction free.
281654_2016_AR_Letter.indd 2 3/29/17 6:58 AM

Our integrated customer experience platform helps our clients unify the customer experience across the entire customer engagement value chain. Today, as clients begin to consume our CX capability more comprehensively, we are delivering greater impact in terms of increased revenue, improved profitabili y and deeper customer loyalty.
Companies across the globe are having an epiphany. Experiences matter. Analog or digital, experiences are defini g their brands and their future. Now more than ever, companies need a partner to help them delight their customers at every moment of truth.
Saying goodbye to a dear friend
This year we lost director and vice chairman James Barlett, marking the end of an era for TeleTech. Mr. Barlett was elected to TeleTech’s Board of Directors in February 2001 and had a significant impa t on the long-term development of the company. Over his tenure at the company, he facilitated relationships with new clients, built strategic alliances with key partners and acted as a trusted mentor for countless executives. He was a consummate gentleman, a patriot, a warrior, and an incredibly generous and caring friend. He will truly be missed.
Accelerated progress in 2017
We are well positioned to deliver on our commitments to our clients, people, and shareholders. We are focused on delivering customer success for our clients, providing exciting careers for our people, and improving our enterprise value for our shareholders. With a ready market, unique client base, portfolio of innovative solutions, experienced leadership team, and an exceptional employee base, we have what it takes to grow our top line with predictability and reliability and to accelerate our profitabili y and cash fl w.
In closing, on behalf of our dedicated, passionate people across the globe and our Board of Directors, thank you for your support and I look forward to sharing our exciting progress in the months to come.
Getting to seamless interactions requires synchronizing across every channel, in every moment, at every touchpoint, and every time.
Kenneth D. Tuchman
281654_2016_AR_Letter.indd 3 3/29/17 6:58 AM

Reconciliation of Non-GAAP Revenue (in millions)
2014 2015 2016Revenue $ 1,241.8 $ 1,286.8 $ 1,275.3 Changes due to foreign currency flu tuations $ - $ - $ 20.2Non-GAAP Revenue $ 1,241.8 $ 1,286.8 $ 1,295.5
Reconciliation of Non-GAAP Income from Operations and Operating Margin (in millions)
2014 2015 2016GAAP Income from Operations $ 96.5 $ 90.2 $ 52.8 Restructuring charges, net $ 3.3 $ 1.8 $ 4.4 Impairment losses $ 0.4 $ 8.1 $ 32.0 Changes due to foreign currency flu tuations $ - $ - $ (5.9)Non-GAAP Income from Operations $ 100.2 $ 100.1 $ 83.3 Non-GAAP Operating Margin 8.1% 7.8% 6.5%
Reconciliation of Non-GAAP Net Income and Net Income per Diluted Share (in millions except per share data)
2014 2015 2016GAAP Net Income $ 72.3 $ 61.7 $ 33.7 Asset impairment and restructuring charges, net of related taxes $ 2.4 $ 6.6 $ 26.2 Changes in acquisition contingent consideration, net of related taxes $ (2.8) $ 0.3 $ (4.6) Estimated loss on assets held for sale, net of related taxes $ - $ - $ 4.2 Changes in valuation allowance and returns on provision adjustments $ (0.1) $ 3.9 $ 3.6Non-GAAP Net Income $ 71.8 $ 72.5 $ 63.1 Average diluted shares outstanding 50.1 49.0 47.7Non-GAAP Net Income per Diluted Share $ 1.43 $ 1.48 $ 1.32
Reconciliation of Free Cash Flow (in millions)
2014 2015 2016Net cash provided by operating activities $ 94.1 $ 133.8 $ 107.9 Purchases of property, plant and equipment $ 67.6 $ 66.6 $ 50.8 Free Cash Flow $ 26.5 $ 67.2 $ 57.1
Cautionary Note About Forward-Looking Statements This Report contains “forward-looking statements” within the meaning of Section 27A of the Securities Act of 1933, Section 21E of the Securities Exchange Act of 1934, and the Private Securities Litigation Reform Act of 1995, relating to our operations, expected financial p sition, results of operation, and other business matters that are based on our current expectations, assumptions, and projections with respect to the future, and are not a guarantee of performance. In this report, when we use words such as “may,” “believe,” “plan,” “will,” “anticipate,” “estimate,” “expect,” “intend,” “project,” “would,” “could,” “target,” or similar expressions, or when we discuss our strategy, plans, goals initiatives, or objectives, we are making forward-looking statements.We caution you not to rely unduly on any forward-looking statements. Actual results may differ materially from what is expressed in the forward-looking statements, and you should review and consider carefully the risks, uncertainties and other factors that affect our business and may cause such differences as outlined but are not limited to factors discussed in the section entitled “Risk Factors” of TeleTech Annual Report on Form 10-K. Our forward looking statements speak only as of the date that this report is filed with the Uni ed States Securities and Exchange Commission and we undertake no obligation to update them, except as may be required by applicable laws.
281654_2016_AR_Letter.indd 4 3/29/17 6:58 AM

UNITED STATES SECURITIES AND EXCHANGE COMMISSION Washington, D.C. 20549
Form 10-K
(Mark One) ANNUAL REPORT PURSUANT TO SECTION 13 OR 15(d) OF THE SECURITIES EXCHANGE ACT OF 1934
For the fiscal year ended December 31, 2016 or
TRANSITION REPORT PURSUANT TO SECTION 13 OR 15(d) OF THE SECURITIES EXCHANGE ACT OF 1934 For the transition period from to
Commission File Number: 001-11919
TeleTech Holdings, Inc. (Exact name of registrant as specified in its charter)
Delaware 84-1291044 (State or other jurisdiction of incorporation or organization)
(I.R.S. Employer Identification No.)
9197 South Peoria Street Englewood, Colorado 80112
(Address of principal executive offices) Registrant’s telephone number, including area code:
(303) 397-8100
Securities registered pursuant to Section 12(b) of the Act:
Title of each class Name of each exchange on which registered Common Stock, $0.01 par value NASDAQ Global Select Market
Securities registered pursuant to Section 12(g) of the Act: None. Indicate by checkmark if the registrant is a well-known seasoned issuer, as defined in Rule 405 of the Securities Act. Yes No Indicate by check mark if the registrant is not required to file reports pursuant to Section 13 or 15(d) of the Securities Exchange Act of 1934. Yes No Indicate by check mark whether the registrant (1) has filed all reports required to be filed by Section 13 or 15(d) of the Securities Exchange Act of 1934 during the preceding 12 months (or for such shorter period that the registrant was required to file such reports) and (2) has been subject to such filing requirements for the past 90 days. Yes No Indicate by check mark whether the registrant has submitted electronically and posted on its corporate Web site, if any, every Interactive Data File required to be submitted and posted pursuant to Rule 405 of Regulation S-T (§232.405 of this chapter) during the preceding 12 months (or for such shorter period that the registrant was required to submit and post such files). Yes No Indicate by check mark if disclosure of delinquent filers pursuant to Item 405 of Regulation S-K (§ 229.405) is not contained herein, and will not be contained, to the best of registrant’s knowledge, in definitive proxy or information statements incorporated by reference in Part III of this Form 10-K or any amendment to this Form 10-K. Indicate by check mark whether the registrant is a large accelerated filer, an accelerated filer, a non-accelerated filer, or a smaller reporting company. See the definitions of “large accelerated filer,” “accelerated filer” and “smaller reporting company” in Rule 12b-2 of the Exchange Act. (Check one):
Large accelerated filer Accelerated filer Non-accelerated filer (Do not check if a smaller reporting company) Smaller reporting company Indicate by check mark whether the registrant is a shell company (as defined in Rule 12b-2 of the Exchange Act). Yes No As of June 30, 2016, the last business day of the registrant’s most recently completed second fiscal quarter, there were 47,319,652 shares of the registrant’s common stock outstanding. The aggregate market value of the registrant’s voting and non-voting common stock that was held by non-affiliates on such date was $415,904,745 based on the closing sale price of the registrant’s common stock on such date as reported on the NASDAQ Global Select Market. As of February 28, 2017, there were 45,893,001 shares of the registrant’s common stock outstanding.
DOCUMENTS INCORPORATED BY REFERENCE Certain information required for Part III of this report is incorporated by reference to the proxy statement for the registrant’s 2017 annual meeting of stockholders.

i
TELETECH HOLDINGS, INC. AND SUBSIDIARIES DECEMBER 31, 2016 FORM 10-K
TABLE OF CONTENTS
Page No.
CAUTIONARY NOTE ABOUT FORWARD-LOOKING STATEMENTS ii
AVAILABILITY OF INFORMATION ii
PART I
Item 1. Business 1
Item 1A. Risk Factors 7
Item 1B. Unresolved Staff Comments 17
Item 2. Properties 17
Item 3. Legal Proceedings 18
Item 4. Mine Safety Disclosures 18
PART II.
Item 5. Market for Registrant’s Common Equity, Related Stockholder Matters and Issuer Purchases of Equity Securities 19
Item 6. Selected Financial Data 22
Item 7. Management’s Discussion and Analysis of Financial Condition and Results of Operations 24
Item 7A. Quantitative and Qualitative Disclosures About Market Risk 39
Item 8. Financial Statements and Supplementary Data 42
Item 9. Changes in and Disagreements with Accountants on Accounting and Financial Disclosure 42
Item 9A. Controls and Procedures 42
Item 9B. Other Information 45
PART III
Item 10. Directors, Executive Officers and Corporate Governance 46
Item 11. Executive Compensation 46
Item 12. Security Ownership of Certain Beneficial Owners and Management and Related Stockholder Matters 46
Item 13. Certain Relationships and Related Transactions, and Director Independence 46
Item 14. Principal Accountants Fees and Services 46
PART IV
Item 15. Exhibits and Financial Statement Schedules 47
Item 16. Form 10-K Summary 49
SIGNATURES 50
INDEX TO THE CONSOLIDATED FINANCIAL STATEMENTS OF TELETECH HOLDINGS, INC. F-1

ii
CAUTIONARY NOTE ABOUT FORWARD-LOOKING STATEMENTS
This Annual Report on Form 10-K contains “forward-looking statements” within the meaning of Section 27A of the Securities Act of 1933, Section 21E of the Securities Exchange Act of 1934, and the Private Securities Litigation Reform Act of 1995, relating to our operations, expected financial position, results of operation, and other business matters that are based on our current expectations, assumptions, and projections with respect to the future, and are not a guarantee of performance. In this report, when we use words such as “may,” “believe,” “plan,” “will,” “anticipate,” “estimate,” “expect,” “intend,” “project,” “would,” “could,” “target,” or similar expressions, or when we discuss our strategy, plans, goals, initiatives, or objectives, we are making forward-looking statements.
We caution you not to rely unduly on any forward-looking statements. Actual results may differ materially from what is expressed in the forward-looking statements, and you should review and consider carefully the risks, uncertainties and other factors that affect our business and may cause such differences as outlined but are not limited to factors discussed in the section of this report entitled “Risk Factors”. Our forward looking statements speak only as of the date that this report is filed with the United States Securities and Exchange Commission (“SEC”) and we undertake no obligation to update them, except as may be required by applicable laws. AVAILABILITY OF INFORMATION
TeleTech Holdings, Inc.’s principal executive offices are located at 9197 South Peoria Street, Englewood, Colorado 80112. Electronic copies of our Annual Reports on Form 10-K, Quarterly Reports on Form 10-Q, Current Reports on Form 8-K, Proxy Statements and any amendments to these reports are available free of charge by (i) visiting our website at http://www.teletech.com/investors/sec-filings/ or (ii) sending a written request to Investor Relations at our corporate headquarters or to [email protected]. TeleTech’s SEC filings are posted on our corporate website as soon as reasonably practical after we electronically file such materials with, or furnish them to, the SEC. Information on our website is not incorporated by reference into this report.
You may also access any materials that we file with the SEC at the SEC’s Public Reference Room at 100 F. Street, N.E., Room 1580, Washington, D.C. 20549 (telephone number 1-800-SEC-0330); or via the SEC’s public website at www.sec.gov.

1
PART I
ITEM 1. BUSINESS
Our Business
TeleTech Holdings, Inc. (“TeleTech”, “the Company”, “we”, “our” or “us”) is a leading global provider of technology enabled customer experience services. We help leading brands improve customer experiences and operational effectiveness through a unique combination of technological innovation and operational expertise. Our portfolio of solutions includes consulting, technology, operations and analytics to enable a seamless customer experience across every interaction channel and phase of the customer lifecycle. Our solutions are supported by 48,000 employees delivering services in 23 countries from 82 customer engagement centers on six continents. Our revenue for fiscal 2016 was $1,275 million.
Since our establishment in 1982, we have helped clients strengthen their customer relationships, brand recognition and loyalty by simplifying and personalizing interactions with their customers. We deliver thought leadership, technology and innovation that create customer strategies designed to differentiate our clients from their competition; data analytics that personalize interactions and increase customer value; and integration services that connect clients’ customer relationship management (“CRM”) system to a cloud-based collaboration platform, leading to customer interactions that are seamless and relevant.
Our services are value-oriented, outcome-based, and delivered on a global scale across all of our business segments: Customer Management Services (“CMS”), Customer Growth Services (“CGS”), Customer Technology Services (“CTS”) and Customer Strategy Services (“CSS”). Our integrated customer experience platform differentiates the Company by combining strategic consulting, data analytics, process optimization, system design and integration, operational excellence, and technology solutions and services.
We have developed tailored expertise in the automotive, communications, financial services, government, healthcare, logistics, media and entertainment, retail, technology, travel and transportation industries. We target customer-focused industry leaders in the Global 1000 and serve approximately 300 global clients.
To improve our competitive position in a rapidly changing market and stay strategically relevant to our clients, we continue to invest in innovation and growth businesses, diversifying our heritage business process outsourcing services of our CMS segment into higher-value consulting, data analytics, digital marketing and technology-enabled services. Of the $1,275 million in revenue we reported in 2016, approximately 27.5% or $351 million came from the CGS, CTS and CSS segments (our “Emerging Segments”), focused on customer-centric strategy, growth or technology-based services, with the remainder of our revenue coming from the heritage business process outsourcing focused CMS segment.
Consistent with our growth and diversification strategy, we continue to invest in technology differentiation, analytics, and cloud computing. We also invest in businesses that enable us to expand our geographic footprint and increase our scale: in 2016, we acquired Atelka Enterprises, Inc., a Canadian-based customer management services company which provides our clients with additional geographic capabilities; and in 2014, we acquired Sofica Group, a Bulgarian customer management services company which provides our clients with the capabilities of 18 additional languages while contributing to the geographic and time zone diversity of our footprint; and rogenSi, a global leadership, change management and sales consulting company that further diversifies our consulting offerings.

2
Our business is structured and reported in the following four segments:
Operating Segments and Industry Verticals CMS CGS CTS CSS Automotive Automotive Automotive Automotive Communication Communication Communication Communication Financial Services Financial Services Financial Services Financial Services Government Healthcare Government Government Healthcare Media & Entertainment Healthcare Healthcare Media & Entertainment Retail Media & Entertainment Media & Entertainment Retail Technology Retail Retail Technology Travel & Transportation Technology Technology Travel & Transportation Travel & Transportation Our strong balance sheet, cash flows from operations and access to debt and capital markets have historically provided us the financial flexibility to effectively fund our organic growth, capital expenditures, strategic acquisitions and incremental investments. Additionally, we continue to return capital to our shareholders via an ongoing stock repurchase program and regular semi-annual dividends. As of December 31, 2016, our cumulative authorized repurchase allowance was $737.3 million, of which we repurchased 45.5 million shares for $717.4 million. For the period from January 1, 2017 through February 28, 2017, we purchased 234 thousand additional shares at a cost of $7.0 million. The stock repurchase program does not have an expiration date. Effective February 23, 2017, the Board of Directors authorized an increase in the share repurchase allowance of $25 million.
On February 24, 2015, our Board of Directors adopted a dividend policy, with the intent to distribute a periodic cash dividend to stockholders of our common stock, after consideration of, among other things, TeleTech’s performance, cash flows, capital needs and liquidity factors. Given our cash flow generation and balance sheet strength, we believe cash dividends and early returns to shareholders through share repurchases, in balance with our investments in innovation and strategic acquisitions, align shareholder interests with the needs of the Company. The initial dividend of $0.18 per common share was paid on March 16, 2015 to shareholders of record as of March 6, 2015. A second dividend of $0.18 per common share was paid on October 14, 2015 to shareholders of record as of September 30, 2015. A third dividend of $0.185 per common share was paid on April 15, 2016 to shareholders of record as of March 31, 2016. A fourth dividend of $0.20 per common share was paid on October 14, 2016 to shareholders of record as of October 3, 2016. Effective February 23, 2017, the Board of Directors authorized an additional semi-annual dividend of $0.22 per common share, payable on April 14, 2017 to shareholders of record as of March 31, 2017.
Our Market Opportunity
We believe that our ability to help clients design and deliver simple, engaging and personal customer experiences across every interaction channel will continue to create sustainable economic value, in part, driven by the following trends:
• Increasing focus on customer engagement to sustain competitive advantage. — Our ability to sustain a competitive advantage based on price or product differentiation has significantly narrowed given the speed of technological innovation. As our clients’ customers become more connected and widely broadcast their experiences across a variety of social networking channels, the quality of the experience has a profound impact on brand loyalty and business performance. We believe customers are increasingly shaping their attitudes, behaviors and willingness to recommend or stay with a brand on the totality of their experience, including not only the superiority of the product or service but more importantly on the quality of their ongoing service interactions. Given the strong correlation between high customer satisfaction and improved profitability, we believe more companies are increasingly focused on selecting third-party partners, such as TeleTech, who can deliver an analytic-driven, integrated solution that increases the lifetime value of each customer relationship versus merely reducing costs.

3
• Increasing percentage of companies consolidating their customer engagement requirements with a few select partners who can deliver measurable business outcomes by offering an integrated, technology-rich solution. — The proliferation of mobile communication technologies and devices along with customers’ increased access to information and heightened expectations are driving the need for companies to implement enabling technologies that ensure customers have the best experience across all devices and channels. These two-way interactions need to be received or delivered seamlessly via the customer channel of choice and include voice, email, chat, SMS text, intelligent self serve, virtual agents and the social network. We believe companies will continue to consolidate to third-party partners, like TeleTech, who have demonstrated expertise in increasing brand value by delivering a holistic, integrated customer-centric solution that spans strategy to execution versus the time, expense and often failed returns resulting from linking together a series of point solutions from different providers.
• Focus on speed-to-market by companies launching new products or entering new geographic locations. — As companies broaden their product offerings and enter new markets, they are looking for partners that can provide speed-to-market while reducing their capital and operating risk. To achieve these benefits, companies select us because of our extensive operating track record, established global footprint, financial strength, commitment to innovation, and our ability to quickly scale infrastructure and complex business processes around the globe in a short period of time while assuring a high-quality experience for their customers.
Our Strategy
We aim to grow our revenue and profitability by focusing on our heritage customer management capabilities as well as higher margin, data and technology-enabled services that drive a superior customer experience and engagement. To that end we plan to continue:
• Building deeper, more strategic relationships with existing global clients to drive enduring, transformational change within their organizations;
• Pursuing new clients who lead their respective industries and who are committed to the customer engagement as a differentiator;
• Investing in our sales leadership team at both the segment level to improve collaboration and speed-to-market and consultative sales level to deliver more integrated, strategic, and transformational solutions;
• Executing strategic acquisitions that further complement and expand our integrated solutions; and
• Investing in innovative technology-enabled platforms and innovating through technology advancements, broader and globally protected intellectual property, and process optimization.
Our Integrated Service Offerings and Business Segments
We have four operating and reportable segments, which provide an integrated set of services including:
Customer Strategy Services
We typically begin by engaging our clients at a strategic level. Through our strategy and operations, analytics, and learning and performance consulting expertise, we help our clients design, build and execute their customer engagement strategies. We help our clients to better understand and predict their customers’ behaviors and preferences along with their current and future economic value. Using proprietary analytic models, we provide the insight clients need to build the business case for customer centricity, to better optimize their marketing spend and then work alongside them to help implement our recommendations. A key component of this segment involves instilling a high performance culture through management and leadership alignment and process optimization.
4
Customer Technology Services
Once the design of the customer engagement is completed, our ability to architect, deploy and host or manage the client’s customer experience environments becomes a key enabler to achieving and sustaining the client’s customer engagement vision. Given the proliferation of mobile communication technologies and devices, we enable our clients’ operations to interact with their customers across the growing array of channels including email, social networks, mobile, web, SMS text, voice and chat. We design, implement and manage cloud, on-premise or hybrid customer experience environments to deliver a consistent and superior experience across all touch points on a global scale that we believe result in higher quality, lower costs and reduced risk for our clients. Through our Humanify™ platform, we also provide data-driven context aware software-as-a-service (“SaaS”) based solutions that link customers seamlessly and directly to appropriate resources, any time and across any channel.
Customer Management Services
We design and manage clients’ front-to-back office processes to deliver just-in-time, personalized, multi-channel interactions. Our front-office solutions seamlessly integrate voice, chat, email, e-commerce and social media to optimize the customer experience for our clients. In addition, we manage certain client back-office processes to enhance their customer-centric view of relationships and maximize operating efficiencies. Our delivery of integrated business processes via our onshore, offshore or work-from-home associates reduces operating costs and allows customer needs to be met more quickly and efficiently, resulting in higher satisfaction, brand loyalty and a stronger competitive position for our clients.
Customer Growth Services
We offer integrated sales and marketing solutions to help our clients boost revenue in new, fragmented or underpenetrated business-to-consumer or business-to-business markets. We deliver approximately $3 billion in client revenue annually via the discovery, acquisition, growth and retention of customers through a combination of our highly trained, client-dedicated sales professionals and our proprietary Revana Analytic Multichannel PlatformTM. This platform continuously aggregates individual customer information across all channels into one holistic view so as to ensure more relevant and personalized communications.
Based on our clients’ requirements, we provide our services on an integrated cross-business segment and on a discrete basis.
Additional information with respect to our segments and geographic footprint is included in Part II, Item 8. Financial Statements and Supplementary Data, Note 3 to the Consolidated Financial Statements.
Our Competitive Strengths
We believe our integrated suite of products and services and holistic approach to customer experience and engagement is an industry differentiator. Our end-to-end capabilities, from customer strategy and technology services to customer management and growth services, improve customer outcomes, increase satisfaction and loyalty, strengthen operating effectiveness and efficiencies, and drive long-term growth and profitability for our clients. We also believe that our technological solutions, innovative human capital strategies and globally scaled and deployed best practices are key elements to our continued industry leadership.
As the complexity and pace of technological change required to deliver multi-channel customer engagement increases, the successful execution of our principal corporate strategies is based on our competitive strengths, which are briefly described below:
• Our industry reputation and leadership position with over three decades of expertise delivering integrated customer engagement solutions provides our clients with the ability to enable, manage and grow the value of every customer relationship;
• Multi-channel, multi-modal solutions that meet the rapidly changing profile of the customer and their heightened expectations;
• Scalable technology and human capital infrastructure using globally deployed best practices to ensure a consistent, high-quality service;

5
• Tailored and optimized customer care delivery through the use of proprietary workforce hiring, training and performance optimization methodology and tools; and
• Commitment to continued product and services innovation that enhances the strategic capabilities of our clients.
Technological Excellence
Our technology platform is based on a secure, private, 100% internet protocol based infrastructure. This architecture enables us to centralize and standardize our worldwide delivery capabilities resulting in improved scalability and quality of delivery for our clients, as well as lower capital, and lower information technology (“IT”) operating costs.
The foundation of this platform is our four IP hosting centers known as TeleTech GigaPOPs®, which are located on three continents. Our GigaPOPs® provide a fully integrated suite of voice and data routing, workforce management, quality monitoring, business analytic and storage capabilities, enabling seamless operations from any location around the globe. This hub and spoke model enables us to provide our services at the lowest cost while increasing scalability, reliability, asset utilization and the diversity of our service offerings. It also provides an effective redundancy to address ordinary course system interruptions and outages due to natural disasters and other force majeure conditions.
To ensure high end-to-end security and reliability of this critical infrastructure, we monitor and manage the TeleTech GigaPOPs® 24 x 7, 365 days per year from several strategically located global command centers as well as providing redundant, fail-over capabilities for each GigaPOP® to address ordinary course system interruptions and outages due to natural disasters and other force majeure conditions.
Importantly, this platform has become the foundation for new, innovative offerings including TeleTech’s cloud-based offerings, TeleTech@Home and our suite of human capital solutions.
Innovative Human Capital Strategies
Our globally located, highly trained employees are a crucial component of the success of our business. We have made significant investments in proprietary technologies, management tools, methodologies and training processes in the areas of talent acquisition, learning services, knowledge management, workforce collaboration and performance optimization. These capabilities are the culmination of more than three decades of experience in managing large, global workforces combined with the latest technology, innovation and strategy in the field of human capital management. This capability has enabled us to deliver a consistent, scalable and flexible workforce that is highly engaged in achieving or exceeding our clients’ business objectives.
Globally Deployed Best Operating Practices
Globally deployed best operating practices assure that we deliver a consistent, scalable, high-quality experience to our clients’ customers from any of our 82 customer engagement centers and work from home associates around the world. Standardized processes include our approach to attracting, screening, hiring, training, scheduling, evaluating, coaching and maximizing associate performance to meet our clients’ needs. We provide real-time reporting and analytics on performance across the globe to ensure consistency of delivery. This information provides valuable insight into what is driving customer inquiries, enabling us to proactively recommend process changes to our clients to optimize their customers’ experience.
Our global operating model includes customer engagement centers in 17 countries on six continents that operate 24 hours a day, 365 days a year. New customer engagement centers are established and existing centers are expanded or scaled down to accommodate anticipated business demands or specific client needs. We have significant capacity in the Philippines and Latin America to support customer demand and deliver superior cost efficiencies. We continue to explore opportunities in North America, Central Europe and Africa to diversify our client footprint enabling near-shore and off-shore locations that enable our multi-lingual service offerings and provide superior client economics.

6
Of the 17 countries from which we provide customer management solutions, 11 provide services for onshore clients including the U.S., Australia, Brazil, Canada, China, Germany, Ireland, New Zealand, South Africa, Thailand, and the United Kingdom. The total number of workstations in these countries is 16,100, or 42% of our total delivery capacity. The other six countries provide services, partially or entirely, for offshore clients including Bulgaria, Costa Rica, Macedonia, Mexico, Poland, and the Philippines. The total number of workstations in these countries is 22,700 or 58% of our total delivery capacity.
See Item 1A. Risk Factors for a description of the risks associated with our foreign operations.
Clients
We develop long-term relationships with Global 1000 companies in customer intensive industries, whose business complexities and customer focus requires a partner that can quickly and globally scale integrated technology and data-enabled services.
In 2016, our top five and ten clients represented 35% and 51% of total revenue, respectively; and one of our clients, Telstra Corporation Limited, represented 10% of our total annual revenue. In several of our operating segments, we enter into long-term relationships which provide us with a more predictable revenue stream. Although most of our contracts can be terminated for convenience by either party, our relationships with our top five clients have ranged from 10 to 20 years including multiple contract renewals for several of these clients. In 2016, we had a 97% client retention rate for the combined Customer Management Services and Customer Growth Services segments.
Certain of our communications clients provide us with telecommunication services through arm’s length negotiated transactions. These clients currently represent approximately 17% of our total annual revenue. Expenditures under these supplier contracts represent less than one percent of our total operating costs.
Competition
We are a diverse, global customer engagement management company. Our competitors vary by geography and business segment, and range from large multinational corporations to smaller, narrowly-focused enterprises. Across our lines of business, the principal competitive factors include: client relationships, technology and process innovation, integrated solutions, operational performance and efficiencies, pricing, brand recognition and financial strength.
Our strategy in maintaining market leadership is to prudently invest, innovate and provide integrated value-driven services, all centered around customer engagement management. Today, we are executing on a more expansive, holistic strategy by transforming our business into higher-value offerings through organic investments and strategic acquisitions. As we execute, we are differentiating ourselves in the marketplace and entering new markets that introduce us to an expanded competitive landscape.
In our Customer Management Services business, we primarily compete with in-house customer management operations as well as other companies that provide customer care including: Convergys, Sykes, and Teleperformance, among others. As we expand our offerings into customer engagement consulting, technology, and growth, we are competing with smaller specialized companies and divisions of multinational companies, including Bain & Company, McKinsey & Company, Accenture, IBM, AT&T, Interactive Intelligence, LiveOps, inContact, Five9, WPP, Publicis Groupe, Dentsu, Sitel, and others.
Employees
Our people are our most valuable asset. As of December 31, 2016, we had 48,000 employees in 23 countries on six continents. Although a percentage of our Customer Management Services employees are hired seasonally to address the fourth quarter and first quarter higher business volumes in retail, healthcare and other seasonal industries, most remain employed throughout the year and work at 82 locations and through our @home environment. Approximately 69% of our employees are located outside of the U.S. Approximately 13% of our employees are covered by collective bargaining agreements, most of which are mandated under national labor laws outside of the United States. These agreements are subject to periodic renegotiations and we anticipate that they will be renewed in the ordinary course of business without material impact to our business or in a manner materially different from other companies covered by such industry-wide agreements.

7
Research, Innovation, Intellectual Property and Proprietary Technology
We recognize the value of innovation in our business and are committed to developing leading-edge technologies and proprietary solutions. Research and innovation has been a major factor in our success and we believe that it will continue to contribute to our growth in the future. We use our investment in research and development to create, commercialize and deploy innovative business strategies and high-value technology solutions.
We deliver value to our clients through, and our success in part depends on, certain proprietary technologies and methodologies. We leverage U.S. and foreign patent, trade secret, copyright and trademark laws as well as confidentiality, proprietary information non-disclosure agreements, and key staff non-competition agreements to protect our proprietary technology.
As of December 31, 2016 we had 66 patent applications pending in 11 jurisdictions; and own 122 U.S. and non-U.S. patents that we leverage in our operations and as market place differentiation for our service offerings. Our trade name, logos and names of our proprietary solution offerings are protected by their historic use and by trademarks and service marks registered in 27 countries.
ITEM 1A. RISK FACTORS
In addition to the other information presented in this Annual Report on Form 10-K, you should carefully consider the risks and uncertainties discussed in this section when evaluating our business. If any of these risks or uncertainties actually occurs, our business, financial condition, and results of operations (including revenue, profitability and cash flows) could be materially adversely affected and the market price of our stock may decline.
Our markets are highly competitive and we might not be able to compete effectively
The markets where we offer our services are highly competitive. Our future performance is largely dependent on our ability to compete successfully in markets we currently serve, while expanding into new, profitable markets. We compete with large multinational service providers; offshore service providers from lower-cost jurisdictions that offer similar services, often at highly competitive prices and more aggressive contract terms; niche solution providers that compete with us in specific geographic markets, industry segments or service areas, including companies that rely on new technologies or delivery models; and in-house functions of large companies that use their own resources, rather than outsourcing customer care services we provide. Some of our competitors have greater financial or marketing resources than we do and, therefore, may be better able to compete.
Further, the continuing trend of consolidation in the technology sector and among business process outsourcing competitors in various geographies where we have operations may result in new competitors with greater scale, a broader footprint, better technologies, and price efficiencies attractive to our clients. If we are unable to compete successfully and provide our clients with superior service and solutions at competitive prices, we could lose market share and clients to competitors, which would materially adversely affect our business, financial condition, and results of operations.
If we are unsuccessful in implementing our business strategy, our long-term financial prospects could be adversely affected
Our growth strategy included a diversification of our business beyond contact center customer care outsourcing to an integrated customer experience platform that unites innovative technologies, strategic consulting, data analytics, client growth solutions, and customer care focused system design and integration. These investments in technologies and integrated solution development, however, may not lead to increased revenue and profitability as we may not be successful in deploying our new products and services. If we are not successful in creating value from these investments, the investments could have a negative impact on our operating results and financial condition.

8
Our profitability could suffer if our cost-management strategies are unsuccessful
Our ability to improve or maintain our profitability is dependent on our ability to successfully manage our costs. Our cost management strategies include optimizing the alignment between the demand for our services and our resource capacity, including contact center utilization; the costs of service delivery; the cost of sales and general and administrative costs as a percentage of revenues. If we are not effective in managing our operating and administrative costs in response to changes in demand and pricing for our services, or if we are unable to absorb or pass on to our clients the increases in our costs of operations, our results of operations could be materially adversely affected.
Cyber attacks and unauthorized disclosure of personal identifiable information could harm our reputation, cause liability and result in service outages, any of which could adversely affect our business and results of operations
Our business is dependent upon our information technology systems. Information security breaches, computer viruses, interruption or loss of business data, DDoS (denial of service) attacks, and other cyber attacks on any of these systems could disrupt the normal operations of our contact centers, our cloud platform offerings, and our enterprise services, impeding our ability to provide critical services to our clients and preventing key personnel from being able to perform their duties or communicate within our organization.
Our business involves the use, storage, and transmission of information about our clients, customers of our clients, and our employees. While we take reasonable measures to protect the security of and unauthorized access to our systems and the privacy of personal and proprietary information that we access and store, our security controls over our systems may not prevent the improper access to or disclosure of this information. Such unauthorized access or disclosure could subject us to liability under relevant law and our contracts, and could harm our reputation resulting in loss of revenue and loss of business opportunities.
In recent years, there have been an increasing number of high profile security breaches at private and public companies and government agencies, and security experts have warned about the growing risks of hackers, cyber criminals and a broad range of potential attacks targeting information technology systems. While we have taken reasonable measures to protect our systems from intrusion, we cannot be certain that advances in cyber criminal capabilities, discovery of new system vulnerabilities, and attempts to exploit such vulnerabilities will not compromise or breach the technology protecting our systems and the information that we manage and control.
Cyber attacks may force us to expend significant additional resources in response to system disruptions or security breaches, including additional investments in repairing system damage, reconfiguring and rerouting systems to reduce vulnerabilities; cyber security protection costs, and litigation and resolution of related legal claims. A significant cyber security breach could materially harm our business, financial condition, and operating results.
Our results of operations and ability to grow could be materially adversely affected if we cannot adapt our services offerings to changes in technology
Our success depends on our ability to develop and implement technology, consulting and outsourcing services and solutions that anticipate and respond to rapid and continuing changes in technology. Areas of significant change include mobility, cloud-based computing, artificial intelligence, digitization, and processing and analyzing large and unstructured data. Our growth and profitability will depend on our ability to develop and adopt new technologies that expand our existing solutions and service offerings to leverage new technological trends and developments, and achieve cost efficiencies in our operations. We may not be successful in anticipating or responding to new technology developments and our integration of new technologies may not achieve their intended cost reductions. Services and technologies offered by our competitors may make our service offerings obsolete. Our failure to innovate, maintain technological advantage, or respond effectively and timely to transformational changes in technology could have a material adverse effect on our business, financial condition, and results of operations.

9
Our cloud solutions present execution and competitive risks
We are devoting significant resources to extend our current cloud solutions which are and will continue to be materially dependent upon certain third party infrastructure and licensed software. There can be no assurance that such third parties will continue to support and maintain their products and services. In addition to certain software development costs, we are incurring costs to build and maintain infrastructure to support cloud computing services.
Certain new competitors offer alternative cloud-based services for consumers and business customers. While we believe our expertise, investments in infrastructure, and the breadth of our cloud-based services provide us with a solid foundation to compete, there can be no assurances that our strategies will generate the revenue required to be successful given the level of investment being made.
If we are unable to attract and retain industry leaders for key positions in our business, our business and our strategy execution can be adversely impacted
Our business success depends on contributions of senior management and key personnel. Our ability to attract, motivate and retain key senior management staff is conditioned on our ability to pay adequate compensation and incentives. We compete for top senior management candidates with other, often larger, companies that at times have access to greater resources. Our ability to attract senior management is also impacted by our requirement that members of senior management sign non-compete agreements as a condition to joining TeleTech. If we are not able to attract and retain industry leaders, we would be unable to compete effectively and our growth may be limited, which could have a material adverse effect on our business, results of operations, and prospects.
A large portion of our revenue is generated from a limited number of clients and the loss of one or more of our clients could adversely affect our business
We rely on strategic, long-term relationships with large, global companies in targeted industries. As a result, we derive a substantial portion of our revenue from relatively few clients. Our five and ten largest clients collectively represented 35% and 51% of our revenue in 2016 while the largest client represented 10% of our revenue in 2016.
Although we have multiple engagements with each of our largest clients and all contracts are unlikely to terminate at the same time, the contracts with our five largest clients expire between 2017 and 2020 and there can be no assurance that these contracts will continue to be renewed at all or be renewed on favorable terms. The loss of all or part of a major client’s business could have a material adverse effect on our business, financial condition, and results of operations, if the loss of revenue was not replaced with profitable business from other clients.
We serve clients in industries that have historically experienced a significant level of consolidation. If one of our clients is acquired (including by another of our clients) our business volume and revenue may materially decrease due to the termination or phase out of an existing client contract, volume discounts or other contract concessions which could have an adverse effect on our business, financial condition, and results of operations.
Our delivery model involves geographic concentration exposing us to significant operational risks
Our business model is dependent on our service customer engagement centers and enterprise support functions being located in low cost jurisdictions around the globe. We have presence in 23 countries, but our customer care management delivery capacity and our back office functions are concentrated in the Philippines and Mexico, and our technology solutions customer engagement centers are concentrated in a few locations in the United States. Natural disasters (floods, winds, and earthquakes), terrorist attacks, pandemics, large-scale utilities outages, telecommunication and transportation disruptions, labor or political unrest, and restriction on repatriation of funds at some of these locations may interrupt or limit our ability to operate or may increase our costs. Our business continuity and disaster recovery plans, while extensive, may not be effective, particularly if catastrophic events occur.

10
Our dependence on our customer engagement centers and enterprise services support functions in the Philippines, which is subject to frequent severe weather, natural disasters, occasional security threats, and certain volatile positions recently taken by its government leaders with respect to the country’s relationship with the United States, represents a particular risk. Our dependence on our customer engagement centers and enterprise services support functions in Mexico, which could be subject to risks associated with a political backlash regarding recent immigration positions taken by the United States government, also represents a potential risk. For these and other reasons, our geographic concentration could result in a material adverse effect on our business, financial condition and results of operations. Although we procure business interruption insurance to cover some of these exposures, adequate insurance may not be available on an ongoing basis for a reasonable price.
Our growth of operations could strain our resources and cause our business to suffer
We plan to continue growing our business organically through expansion, sales efforts, and strategic acquisitions, while maintaining tight controls on our expenses and overhead. Lean overhead functions combined with focused growth may place a strain on our management systems, infrastructure and resources, resulting in internal control failures, missed opportunities, and staff attrition which could impact our business and results of operations.
Our share price could be adversely affected if we are unable to maintain effective internal controls over financial reporting and we are not able to prevent or timely detect errors or fraud
Our management is responsible for establishing and maintaining adequate internal control over financial reporting. As previously disclosed, in prior periods, our management had identified material weaknesses in our internal control over financial reporting related to the effectiveness of our control environment and controls over account reconciliations, journal entries, revenue, and impairments.
A material weakness is a deficiency, or a combination of deficiencies, in internal control over financial reporting, such that there is a reasonable possibility that a material misstatement in our annual or interim financial statements will not be prevented or detected on a timely basis. Although we are taking remedial actions in response to the previously identified material weaknesses in our internal control over financial reporting, there can be no assurances that we will be able to prevent future control deficiencies, including material weaknesses, from occurring, nor that our remediation actions taken to date will be successful. If additional material weaknesses or significant deficiencies in our internal control over financial reporting are discovered or occur in the future, our consolidated financial statements may contain material misstatements. These misstatements could result in restatements of our consolidated financial statements, cause us to fail to meet our reporting obligations or cause investors to lose confidence in our reported financial information, which could lead to a decline in our stock price.
Any internal and disclosure controls and procedures, no matter how well conceived and operated, can provide only reasonable, not absolute, assurance that the objectives of the control system are met. Inherent limitations within a control system include the realities that judgments in decision-making can be faulty, and that breakdowns can occur because of simple error or mistake. Additionally, any controls can be circumvented by individuals acting alone or in collusion with others to override controls. Accordingly, because of the inherent limitations in the design of a cost effective control system, misstatements due to error or fraud may occur and may not always be prevented or timely detected, even if we are successful in remediating the material weaknesses previously identified by management.

11
Our financial results depend on our capacity utilization and our ability to forecast demand and make timely decisions about staffing levels, investments, and operating expenses
Our ability to meet our strategic growth and profitability objectives depends on how effectively we manage our contact center capacity against the fluctuating and seasonal client demands. Predicting customer demand and making timely staffing level decisions, investments, and other operating expenditure commitments in each of our delivery center locations is key to our successful project execution and profitability maximization. We can provide no assurance that we will continue to be able to achieve or maintain desired delivery center capacity utilization, because quarterly variations in client volumes, many of which are outside our control, can have a material adverse effect on our utilization rates. If our utilization rates are below expectations, because of our high fixed costs of operation, our financial conditions and results of operations could be adversely affected.
If we cannot recruit, hire, train, and retain qualified employees to respond to client demands, our business will be adversely affected
Our business is labor intensive and our ability to recruit and train employees with the right skills at the right price point is critical to achieving our growth objective. Demand for qualified personnel with multiple language capabilities and fluency in English may exceed supply. Employees with new backgrounds and skills may also be required to keep pace with evolving technologies and client demands. While we invest in employee retention, we continue to experience high employee turnover and are continuously recruiting and training replacement staff. Some of our facilities are located in geographies with low unemployment, which makes it costly to hire personnel, and in several jurisdictions, jurisdiction-specific wage regulations are changing rapidly making it difficult to recruit new employees at price points acceptable for our business model. Our inability to attract and retain qualified personnel at costs acceptable under our contracts, our costs associated with attracting, training, and retaining employees, and the challenge of managing the continuously changing and seasonal client demands could have a material adverse effect on our business, financial condition, and results of operations.
We may continue to incur material restructuring charges and our restructuring efforts may not produce anticipated results
We continually evaluate ways to optimize our operating expenses and adapt to changing industry and market conditions, which sometimes lead to restructuring opportunities, including more effective utilization of our assets, workforce, and operating facilities. We have recorded restructuring charges in the past related to staff reductions, market exits, and facility closures, and we may incur similar restructuring charges in the future. These efforts may result in significant restructuring charges that may adversely affect our results of operations for the periods in which such charges occur. Additionally, actual costs related to such restructuring may exceed estimated and disclosed amounts and may not lead to improvements in results of operations at levels expected.
Turnover in senior sales staff and the length of time required for newly-hired sales staff to become productive could adversely impact our growth and our results of operations
It can take several months before newly-hired sales staff are productive in selling our service offerings, technology and consulting solutions to prospective clients. The long ramp period impacts the speed at which they can be effective in contributing to our growth. The cost of sales staff recruiting and their base compensation, therefore, cannot be immediately offset by the revenue such staff produce. Further, given the length of the ramp period, sometimes we cannot determine if new sales representatives would succeed until they have been employed for a period of time. If we cannot reliably limit turnover in our sales staff and speed up development of newly-hired sales staff to a productive level, or if we lose productive sales representatives in whom we have heavily invested, our future growth rates and revenue will suffer.

12
Our sales cycles for new client relationships and new lines of business with existing clients can be long, which results in a long lead time before we receive certain revenues
We often face a long selling cycle to secure contracts with new clients or contracts for new lines of business with existing clients. When we are successful in securing a new engagement, it is generally followed by a long implementation period when clients must give notice to incumbent service providers or transfer in-house operations to us. There may also be a long ramp up period before we commence our services, and for certain contracts we receive no revenue until we start performing the work. If we are not successful in obtaining contractual commitments after the initial prolonged sales cycle or in maintaining the contractual relationship for a period of time necessary to offset new project investment costs and appropriate return on that investment, the investments may have a material adverse effect on our results of operations.
Contract terms typical in our industry can lead to volatility in our revenue and our margins
Many of our contracts have termination for convenience clauses, which could have a material adverse effect on our results of operation. Although many of our contracts can be terminated for convenience, our relationships with our top five clients have ranged from 10 to 20 years with the majority of these clients having completed multiple contract renewals with us. Yet, our contracts do not guarantee a minimum revenue level or profitability, and clients may terminate them or materially reduce customer interaction volumes, which would reduce our earning potential. This could have a material adverse effect on our results of operations and makes it harder to make projections.
Many of our contracts utilize performance pricing that link some of our fees to the attainment of performance criteria, which could increase the variability of our revenue and operating margin. These performance criteria can be complex, and at times they are not entirely within our control. If we fail to satisfy our contract performance metrics, our revenue under the contracts and our operating margin are reduced.
We may not always offset increased costs with increased fees under long-term contracts. The pricing and other terms of our client contracts, particularly our long-term contact center agreements, are based on estimates and assumptions we make at the time we enter into these contracts. These estimates reflect our best judgments regarding the nature of the engagement and our expected costs to provide the contracted services and could differ from actual results. Not all our larger long-term contracts allow for escalation of fees as our cost of operations increase. While many of our contracts allow periodic fee adjustments based on increases in certain price indices, in the past several years, our payroll costs, including jurisdiction specific minimum wage costs, have increased at rates much greater than increases in these indices. If we cannot negotiate long-term contract terms that provide for fee adjustments to reflect increases in our cost of service delivery, our business, financial conditions, and results of operation would be materially impacted.
Our contracts seldom address the impacts of currency fluctuation on our costs of delivery. As we continue to leverage our global delivery model, more of our expenses may be incurred in currencies other than those in which we bill for services. An increase in the value of certain currencies, such as Australian dollar against the U.S. dollar and Philippine peso, could increase costs for our delivery at offshore sites by increasing our labor and other costs that are denominated in local currencies. Our contractual provisions, cost management efforts, and currency hedging activities may not be able to offset the currency fluctuation impact, resulting in the decrease of the profitability of our contracts.
Our pricing depends on effectiveness of our forecasting of the level of effort. Pricing for our services in our technology and strategic consulting businesses is highly contingent on our ability to accurately forecast the level of effort and cost necessary to deliver our services, which is data dependent and could turn out to be materially inaccurate. The inaccurate level of effort in project estimates could yield lower profit margins or cause projects to become unprofitable, resulting in adverse impacts on our results of operations.

13
Delays in payment for our services by clients who represent a large percentage of our accounts receivable balance could adversely affect our business
We often carry significant accounts receivable balances from a limited number of clients that generate a large portion of our revenues. We assess and monitor the creditworthiness of our clients and manage outstanding accounts receivable balances proactively, but we may not always accurately assess such creditworthiness. While we closely monitor timely payment of our accounts receivable, a client may become unable or unwilling to pay its balance timely due to an economic weakness in its industry or the financial insolvency of its business. Client delays in payments, requests for modifications to their contractual payment arrangements, or defaults on their payment obligations to us could adversely impact our income from operations and cash flow.
We face special risks associated with our business outside of the United States
An important component of our business strategy is service delivery outside of the United States and our continuing international expansion. In 2016 we derived approximately 46% of our revenue from operations outside of the United States. Conducting business abroad is subject to a variety of risks, including:
• currency exchange rate fluctuations, restrictions on currency movement, and impact of international tax laws could adversely affect our results of operations, if we are forced to maintain assets in currencies other than the U.S. dollars, while our financial results are reported in U.S. dollars;
• longer payment cycles and/or difficulties in accounts receivable collections particular to operations outside of the United States could impact our cash flows and results of operations;
• political and economic instability and unexpected changes in regulatory regimes could adversely affect our ability to deliver services overseas and our ability to repatriate cash;
• inconsistent regulations, licensing and legal requirements may increase our cost of operations as we endeavor to comply with multiple, complex laws that differ from one country to another;
• terrorist attacks and civil unrests in some of the regions where we do business (e.g. tension in the Middle East, Latin America, and the Philippines, and terror attacks in Europe), and the resulting need for enhanced security measures may impact our ability to deliver services, threaten the safety of our employees, and increase our costs of operations; and
• special challenges in managing risks inherent in international operations, such as unique and prescriptive labor rules, corrupt business environments, restrictive immigration and export control laws may cause an inadvertent violation of laws that we may not be able to immediately detect or correct.
While we monitor and endeavor to mitigate timely the relevant regulatory, geopolitical, and other risks related to our operations outside of the United States, we cannot assess with certainty what impact such risks are likely to have over time on our business, and we can provide no assurance that we will always be able to mitigate these risks successfully and avoid material impact to our business and results of operations.

14
Restrictions on mobility of people across boarders may affect our ability to compete for and provide services to clients
Our business depends on the ability of some of our employees to obtain the necessary visas and entry permits to do business in the countries where our clients and customer engagement centers are located. In recent years, in response to terrorist attacks and global unrest, immigration authorities generally, and those in the United States in particular, have increased the level of scrutiny in granting such visas, and even imposed bans on immigration and commercial travel for citizens of certain countries. If further terrorist attacks occur or global unrest intensifies, we anticipate that these restrictions will further increase. Immigration and business entry rules outside of the United States may also require us to meet certain additional legal requirements as a condition to obtaining or maintaining visas. Furthermore, immigration laws in most countries where we do business are subject to legislative change and varying standards of application and enforcement due to political forces, economic conditions or other events unrelated to our operations. If we are unable to obtain the necessary visas for our personnel who need to travel internationally, if the issuance of such visas is delayed or if the length of such visas is shortened, we may not be able to continue to provide services on a timely and cost-effective basis, receive revenues as early as expected or manage our customer engagement centers efficiently. Any of these developments could have a material adverse effect on our business, results of operations and financial condition.
Uncertainty of tax regulations in countries where we do business may affect our costs of operation
We operate in multiple countries through legal entity forms that optimize our operations and tax positions globally. We make our business decisions regarding entity capitalization and repatriation of capital based on the needs of the business and costs and tax impacts of such decisions. Changes in the tax regulations in the countries where we currently operate could lead to higher taxation levels, changes in our legal operating status, and higher costs of doing business. Plans for tax reform in the United States announced by the new administration may also impact our business decisions. Many of these yet unknown changes may materially affect our business, operating costs, and results of operations, although not all the changes would necessarily result in negative impact.
If the transfer pricing arrangements we have among our subsidiaries are determined to be inappropriate, our tax liability may increase
We have transfer pricing arrangements among our subsidiaries in relation to various aspects of our business, including operations, marketing, sales, and delivery functions. U.S., Australian, Philippines and other transfer pricing regulations in other countries where we operate, require that cross-border transaction between affiliates be on arm’s-length terms. We carefully consider the pricing among our subsidiaries to assure that they are at arm’s length. If tax authorities were to determine that the transfer prices and terms we have applied are not appropriate, we may incur increased tax liability, including accrued interest and penalties, which would cause material increase in our tax liability, thereby impacting our profitability and cash flows, and potentially resulting in a material adverse effect on our operations, effective tax rate and financial condition.
Our strategy of growing through selective acquisitions involves risks of failing to successfully identify, acquire, and integrate acquisition opportunities and realize returns on our investments
Our corporate development team continuously evaluates opportunities to expand the scope of our services through acquisitions. Yet, we may be unable to identify companies that complement our strategies and which are available to be acquired at valuation levels accretive to our business.
Our acquisition strategy also involves the potential risks of our inability to integrate acquired companies effectively and realize the full amounts of anticipated synergies and benefits from the acquisitions; the diversion of management’s attention to the integration of the acquired businesses at the expense of delivering results for the legacy business; the risk that we will not be able to retain key employees of the acquired business or that they will not be effective as part of TeleTech operations; the impact of liabilities of the acquired businesses undiscovered or underestimated as part of the acquisition due diligence; and the unforeseen difficulties experienced by the acquired operations due to the acquisition or the integration which could result in short or longer term effects on our operating results.

15
We have incurred and may in the future incur impairments to goodwill, long-lived assets or strategic investments
As a result of past acquisitions, as of December 31, 2016, we have approximately $129.6 million of goodwill and $30.8 million of intangible assets included on our Consolidated Balance Sheet. We review our goodwill and intangible assets for impairment at least once annually, and more often when events or changes in circumstances indicate the carrying value may not be recoverable. We perform an assessment of qualitative and quantitative factors to determine whether the existence of events or circumstances leads to a determination that it is more likely than not that the fair value of the goodwill or intangible asset is less than its carrying amount. In the event that the book value of goodwill or intangible asset is impaired, such impairment would be charged to earnings in the period when such impairment is determined. We have recorded goodwill and intangible impairments in the past, and there can be no assurance that we will not incur impairment charges in the future that could have material adverse effects on our financial condition or results of operations.
”Social engineering” attacks and other phishing scams aimed at the company may result in the inadvertent loss of cash and cash equivalents
The increased activity and sophistication of corporate social engineering attacks and other phishing scams in recent years have increased the risk of inadvertent transfer of large amounts of cash and cash equivalents from the various bank accounts we have around the world. We actively train and inform our employees and key personnel about these risks and, while we have implemented a series of measures to curb these risks, the very nature of these attacks may deceive one or more employees, thereby resulting in a material loss.
Intellectual property infringement by us and by others may adversely impact our ability to innovate and compete Our services or solutions could infringe intellectual property of others impacting our ability to deploy them with clients. From time to time, we and members of our supply chain receive assertions that our service offerings or technologies infringe on the patents or other intellectual property rights of third parties. While to date we have been successful in defending such claims and many of these claims are without basis, the claims could require us to cease activities, incur expensive licensing costs, or engage in costly litigation, which could adversely affect our business and results of operation.
Our intellectual property may not always receive favorable treatment from the United States Patent and Trademark Office, the European Patent Office or similar foreign intellectual property adjudication and registration agencies; and our “patent pending” intellectual property may not receive a patent or may be subject to prior art limitations. The lack of legal system sophistication in certain countries where we do business or lack of commitment to protection of intellectual property rights, may prevent us from being able to defend our intellectual property and related technology against infringement by others, leading to a material adverse effect on our business, results of operations and financial condition.
Increases in the cost of communication and data services or significant interruptions in such services could adversely affect our business
Our business is significantly dependent on telephone, internet and data service provided by various domestic and foreign communication companies. Any disruption of these services could adversely affect our business. We have taken steps to mitigate our exposure to service disruptions by investing in complex and multi-layered redundancies, and we can transition services among different of our contact centers around the world. Despite these efforts, there can be no assurance, however, that the redundancies we have in place would be sufficient to maintain operations without disruption.
Our inability to obtain communication and data services at favorable rates could negatively affect our business results. Where possible, we have entered into long-term contracts with various providers to mitigate short term rate increases and fluctuations. There is no obligation, however, for the vendors to renew their contracts with us, or to offer the same or lower rates in the future, and such contracts are subject to termination or modification for various reasons outside of our control. A significant increase in the cost of communication services that is not recoverable through an increase in the price of our services could adversely affect our business.

16
Our financial results may be adversely impacted by foreign currency exchange rate risk
Many contracts that we service from customer engagement centers outside of the United States (for example in Bulgaria, Canada, Costa Rica, Mexico, the Philippines and the United Kingdom) are typically priced, invoiced, and paid in U.S. and Australian dollars or Euros, while the costs incurred to operate these customer engagement centers are denominated in the functional currency of the applicable operating subsidiary. The fluctuations between the currencies of the contract and operating currencies present foreign currency exchange risks. Furthermore, because our financial statements are denominated in U.S. dollars, but approximately 22% of our revenue is derived from contracts denominated in other currencies, our results of operations could be adversely affected if the U.S. dollar strengthens significantly against foreign currencies.
While we hedge against the effect of exchange rate fluctuations, we can provide no assurance that we will be able to continue to successfully manage this foreign currency exchange risk and avoid adverse impacts on our business, financial condition, and results of operations.
Compliance with laws, including unexpected changes to such laws, could adversely affect our results of operations
Our business is subject to extensive regulation by U.S. and foreign national, state and provincial authorities relating to confidential client and customer data, customer communications, telemarketing practices, and licensed healthcare and financial services activities, among other areas. Costs and complexity of compliance with existing and future regulations could adversely affect our profitability. If we fail to comply with regulations relevant to our business, we could be subject to civil or criminal liability, monetary damages and fines. Private lawsuits and enforcement actions by regulatory agencies may materially increase our costs of operations and impact our ability to serve our clients.
As we provide services to clients’ customers residing in countries across the world, we are subject to numerous, and sometimes conflicting, legal regimes on matters as diverse as import/export controls, communication content requirements, trade restrictions and sanctions, tariffs, taxation, data privacy, labor relations, wages and severance, health care requirements, internal and disclosure control obligations, and immigration. Violations of these regulations could impact our reputation and result in financial liability, criminal prosecution, unfavorable publicity, restrictions on our ability to process information and breach of our contractual commitments.
Adverse changes in laws or regulations that impact our business may negatively affect the sale of our services, slow the growth of our operations, or mandate changes to how we deliver our services, including our ability to use offshore resources. These changes could threaten our ability to continue to serve certain markets.
The current trend to outsource customer care may not continue and the prices that clients are willing to pay for the services may diminish, adversely affecting our business
Our growth depends, in large part, on the willingness of our clients and potential clients to outsource customer care and management services to companies like TeleTech. There can be no assurance that the customer care outsourcing trend will continue; and our clients and potential clients may elect to perform in-house customer care and management services that they currently outsource. Reduction in demand for our services and increased competition from other providers and in-house service alternatives would create pricing pressures and excess capacity that could have an adverse effect on our business, financial condition, and results of operations.
Legislation discouraging offshoring of service by U.S. companies or making such offshoring difficult could significantly affect our business
A perceived association between offshore service providers and the loss of jobs in the United States has been at the center of political debate during recent presidential campaign. As a result, current and prospective clients may be reluctant to hire offshore service providers like TeleTech to avoid negative perceptions and regulatory scrutiny. If they seek customer care and management capacity onshore that was previously available to them through outsourcers outside of the United States, they may elect to perform these services in-house as a less expensive alternative to outsourcing the services onshore. Possible tax incentives for U.S. businesses to return offshored, including outsourced and offshored, services to the U.S. could also impact our clients’ continuing interest in using our services.

17
Legislation aimed to expand privacy protections in the United States could also impact offshore outsourcing opportunities by requiring notice and consent as a condition for sharing personal identifiable information with third party service providers outside of the United States. Any material changes in current trends among U.S. based clients to use services outsourced offshore would materially impact our business and results of operations.
Health epidemics could disrupt our business and adversely affect our financial results
Our contact centers typically seat hundreds of employees in one location. Accordingly, an outbreak of a contagious infection in one or more of the markets in which we do business may result in significant worker absenteeism, lower capacity utilization rates, voluntary or mandatory closure of our customer engagement centers, travel restrictions on our employees, and other disruptions to our business. Any prolonged or widespread health epidemic could severely disrupt our business operations and have a material adverse effect on our business, its financial condition and results of operations.
The volatility of our stock price may result in loss of investment
Our share price has been and may continue to be subject to substantial fluctuation. We believe that market prices of outsourced customer care management services stock in general have experienced volatility and such volatility will affect our stock price. As we continue to diversify our service offerings to include growth, technology and strategic consulting, our stock price volatility may stabilize or it may be further impacted by stock price fluctuations in these new industries. In addition to fluctuations specific to our industry and service offerings, we believe that various other factors such as general economic conditions, changes or volatility in the financial markets, and changing market condition for our clients could impact the valuation of our stock. The quarterly variations in our financial results, acquisition and divestiture announcements by us or our competitors, strategic partnerships and new service offering, our failure to meet our growth objectives or exceed our targets, and securities analysts’ perception about our performance could cause the market price of our shares to fluctuate substantially in the future.
Our Chairman and Chief Executive Officer controls a majority of our stock and has control over all matters requiring action by our stockholders
Kenneth D. Tuchman, our Chairman and Chief Executive Officer, directly and beneficially owns approximately 68% of TeleTech’s common stock. As a result, Mr. Tuchman could exercise control over all matters requiring action by our stockholders, including the election of our entire Board of Directors. Therefore, a change in control of our company could not be effected without his approval, even when such a change of control could benefit our other stockholders.
ITEM 1B. UNRESOLVED STAFF COMMENTS
We have not received written comments regarding our periodic or current reports from the staff of the SEC that were issued 180 days or more preceding the end of our 2016 fiscal year that remain unresolved.
ITEM 2. PROPERTIES
Our corporate headquarters are located in Englewood, Colorado, which consists of approximately 264,000 square feet of owned office space. In addition to our headquarters and the customer engagement centers used by our Customer Management Services and Customer Growth Services segments discussed below, we also maintain sales and consulting offices in several countries around the world which serve our Customer Technology Services and Customer Strategy Services segments.
As of December 31, 2016 we operated 82 customer engagement centers that are classified as follows:
• Multi-Client Center — We lease space for these centers and serve multiple clients in each facility;
• Dedicated Center — We lease space for these centers and dedicate the entire facility to one client; and

18
• Managed Center — These facilities are leased or owned by our clients and we staff and manage these sites on behalf of our clients in accordance with facility management contracts.
As of December 31, 2016, our customer engagement centers were located in the following countries:
Total Number of Multi-Client Dedicated Managed Delivery Centers Centers Centers Centers Australia 1 4 — 5 Brazil 2 — — 2 Bulgaria 2 — — 2 Canada 8 — 1 9 China — — 1 1 Costa Rica — 1 — 1 Germany — — 1 1 Ireland 1 — — 1 Macedonia 1 — — 1 Mexico 3 — — 3 New Zealand 1 — — 1 Philippines 16 3 — 19 Poland — — 1 1 South Africa — — 2 2 Thailand — — 1 1 United Kingdom — — 2 2 United States of America 16 5 9 30
Total 51 13 18 82 The leases for our customer engagement centers have remaining terms ranging from one to 10 years and generally contain renewal options. We believe that our existing customer engagement centers are suitable and adequate for our current operations, and we have plans to build additional centers to accommodate future business.
ITEM 3. LEGAL PROCEEDINGS
From time to time, the Company has been involved in legal actions, both as plaintiff and defendant, which arise in the ordinary course of business. The Company accrues for exposures associated with such legal actions to the extent that losses are deemed both probable and reasonably estimable. To the extent specific reserves have not been made for certain legal proceedings, their ultimate outcome, and consequently, an estimate of possible loss, if any, cannot reasonably be determined at this time.
Based on currently available information and advice received from counsel, the Company believes that the disposition or ultimate resolution of any current legal proceedings, except as otherwise specifically reserved for in its financial statements, will not have a material adverse effect on the Company’s financial position, cash flows or results of operations.
ITEM 4. MINE SAFETY DISCLOSURES Not applicable.

19
PART II
ITEM 5. MARKET FOR REGISTRANT’S COMMON EQUITY, RELATED STOCKHOLDER MATTERS AND ISSUER PURCHASES OF EQUITY SECURITIES
Our common stock is traded on the NASDAQ Global Select Market under the symbol “TTEC.” The following table sets forth the range of the high and low sales prices per share of the common stock for the quarters indicated as reported on the NASDAQ Global Select Market:
High Low Fourth Quarter 2016 $ 31.75 $ 25.40 Third Quarter 2016 $ 30.24 $ 26.87 Second Quarter 2016 $ 28.29 $ 25.80 First Quarter 2016 $ 28.71 $ 24.49 Fourth Quarter 2015 $ 30.61 $ 26.76 Third Quarter 2015 $ 28.97 $ 25.37 Second Quarter 2015 $ 28.01 $ 25.14 First Quarter 2015 $ 25.54 $ 21.86 As of December 31, 2016, we had approximately 206 holders of record of our common stock and during 2016 we declared and paid an $0.185 per share dividend and a $0.20 per share dividend on our common stock as discussed below.
On February 24, 2015, our Board of Directors adopted a dividend policy, with the intent to distribute a periodic cash dividend to stockholders of our common stock, after consideration of, among other things, TeleTech’s performance, cash flows, capital needs and liquidity factors. Given our cash flow generation and balance sheet strength, we believe cash dividends and early returns to shareholders through share repurchases, in balance with our investments in innovation and strategic acquisitions, align shareholder interests with the needs of the Company. The initial dividend of $0.18 per common share was paid on March 16, 2015 to shareholders of record as of March 6, 2015. A second dividend of $0.18 per common share was paid on October 14, 2015 to shareholders of record as of September 30, 2015. A third dividend of $0.185 per common share was paid on April 15, 2016 to shareholders of record as of March 31, 2016. A fourth dividend of $0.20 per common share was paid on October 14, 2016 to shareholders of record as of October 3, 2016. On February 23, 2017, the Board of Directors authorized a $0.22 dividend per common share, payable on April 14, 2017, to shareholders of record as of March 31, 2017. While it is our intention to continue to pay semi-annual dividends in 2017 and beyond, any decision to pay future cash dividends will be made by our Board of Directors. In addition, our credit facility restricts our ability to pay dividends in the event we are in default or do not satisfy certain covenants.
Stock Repurchase Program
We continue to return capital to our shareholders via an ongoing stock repurchase program (originally authorized by the Board of Directors in 2001). As of December 31, 2016, the cumulative authorized repurchase allowance was $737.3 million, of which we have purchased 45.5 million shares for $717.4 million.

20
Issuer Purchases of Equity Securities During the Fourth Quarter of 2016
The following table provides information about our repurchases of equity securities during the quarter ended December 31, 2016: Total Number of Approximate Dollar Shares Value of Shares that Purchased as May Yet Be Part of Publicly Purchased Under Total Number Announced the Plans or of Shares Average Price Plans or Programs (In Period Purchased Paid per Share Programs thousands) September 30, 2016 $ 12,310 October 1, 2016 - October 31, 2016 228,874 $ 28.62 228,874 $ 5,760 November 1, 2016 - November 30, 2016 166,833 $ 27.31 166,833 $ 26,204 December 1, 2016 - December 31, 2016 210,801 $ 29.87 210,801 $ 19,906
Total 606,508 606,508 In 2017, through February 28, 2017, we purchased 234 thousand additional shares at a cost of $7.0 million. The stock repurchase program does not have an expiration date and the Board authorizes additional stock repurchases under the program from time to time. On February 23, 2017, the Board of Directors authorized an increase in the share repurchase allowance of $25 million.
Stock Performance Graph
The graph depicted below compares the performance of TeleTech common stock with the performance of the NASDAQ Composite Index; the Russell 2000 Index; and customized peer group over the period beginning on December 31, 2011 and ending on December 31, 2016. We have chosen a “Peer Group” composed of Convergys Corporation (NYSE: CVG), Sykes Enterprises, Incorporated (NASDAQ: SYKE) and Teleperformance (NYSE Euronext: RCF). We believe that the companies in the Peer Group are relevant to our current business model, market capitalization and position in the overall BPO industry.
The graph assumes that $100 was invested on December 31, 2011 in our common stock and in each comparison index, and that all dividends were reinvested. We declared per share dividends on our common stock of $0.36 during 2015 and $0.385 during 2016. Stock price performance shown on the graph below is not necessarily indicative of future price performance.
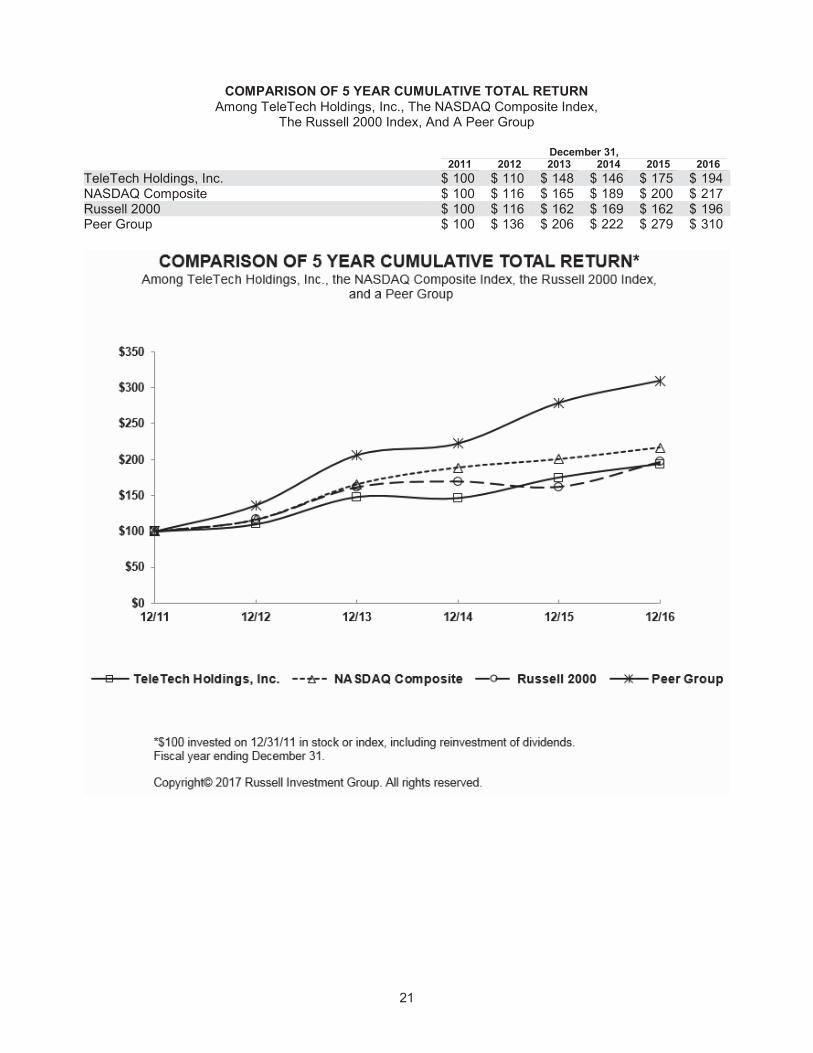
21
COMPARISON OF 5 YEAR CUMULATIVE TOTAL RETURN Among TeleTech Holdings, Inc., The NASDAQ Composite Index,
The Russell 2000 Index, And A Peer Group
December 31, 2011 2012 2013 2014 2015 2016 TeleTech Holdings, Inc. $ 100 $ 110 $ 148 $ 146 $ 175 $ 194 NASDAQ Composite $ 100 $ 116 $ 165 $ 189 $ 200 $ 217 Russell 2000 $ 100 $ 116 $ 162 $ 169 $ 162 $ 196 Peer Group $ 100 $ 136 $ 206 $ 222 $ 279 $ 310

22
ITEM 6. SELECTED FINANCIAL DATA
The following selected financial data should be read in conjunction with Item 7. Management’s Discussion and Analysis of Financial Condition and Results of Operations, the Consolidated Financial Statements and the related notes appearing elsewhere in this Form 10-K (amounts in thousands except per share amounts). Year Ended December 31,
2016 2015 2014 2013 2012
Statement of Operations Data
Revenue $ 1,275,258 $ 1,286,755 $ 1,241,781 (7) $ 1,193,157 (12) $ 1,162,981 (17)
Cost of services (941,592) (928,247) (886,492) (846,631) (834,803) Selling, general and administrative (175,797) (194,606) (198,553) (193,423) (182,634) Depreciation and amortization (68,675) (63,808) (56,538) (46,064) (41,166) Other operating expenses (36,442) (1) (9,914) (5) (3,723) (8) (5,640) (13) (25,833) (18)
Income from operations 52,752 90,180 96,475 101,399 78,545
Other income (expense) (2,454) (2) (4,291) 3,984 (9) (9,330) (14) (4,683) (Provision for) benefit from income taxes (12,863) (3) (20,004) (6) (23,042) (10) (20,598) (15) 61 (19)
Noncontrolling interest (3,757) (4,219) (5,124) (4,083) (3,908) Net income attributable to TeleTech stockholders $ 33,678 $ 61,666 $ 72,293 $ 67,388 $ 70,015
Weighted average shares outstanding
Basic 47,423 48,370 49,297 51,338 54,738
Diluted 47,736 49,011 50,102 52,244 55,540
Net income per share attributable to TeleTech stockholders
Basic $ 0.71 $ 1.27 $ 1.47 $ 1.31 $ 1.28
Diluted $ 0.71 $ 1.26 $ 1.44 $ 1.29 $ 1.26
Dividends issued per common share $ 0.385 $ 0.36 $ — $ — $ —
Balance Sheet Data
Total assets $ 846,304 (4) $ 843,327 $ 852,475 (11) $ 842,342 (16) $ 847,173 (20)
Total long-term liabilities $ 304,380 (4) $ 191,473 $ 187,780 (11) $ 175,564 (16) $ 175,431 (20)
(1) Includes $3.4 million expense related to reductions in force, a $1.0 million expense due to facility exit and other charges, a $1.3 million impairment of fixed assets, a $1.4 million impairment of goodwill, a $11.1 million impairment of internally developed software, and a $18.2 million of impairment charges related to several trade name, customer relationship and non-compete intangible assets.
(2) Includes a $5.3 million estimated loss related to two business units which have been classified as assets held for sale offset by a $4.8 million benefit related to fair value adjustments to the contingent consideration based on revised estimates of performance against targets for two of our acquisitions.
(3) Includes $1.7 million of expense related to return to provision adjustments, $1.1 million of expense related to a transfer pricing adjustment for a prior period, $0.5 million of expense related to tax rate changes, $0.5 million of expense related to changes in valuation allowances, $1.5 million of benefit related to restructuring charges, and $9.8 million of benefit related to impairments and assets held for sales.
(4) The Company spent $46.1 million, net of cash acquired of $2.7 million, in 2016 for the acquisition of Atelka. Upon acquisition of Atelka, the Company acquired $25.1 million in assets assumed, $7.7 million in liabilities ($1.4 million in long-term liabilities).
(5) Includes $1.8 million expense related to reductions in force, a $0.4 million expense related to the impairment of property and equipment, and a $7.7 million expense related to the impairment of goodwill.

23
(6) Includes a $0.7 million benefit related to restructuring charges, $1.2 million net of expense related to changes in valuation allowance and a related release of a deferred tax liability, $1.5 million of expense related to provisions for uncertain tax positions, $2.6 million of benefit related to impairments, $1.3 million of expense related to state net operating losses and credits, and $0.4 million of benefit related to other discrete items.
(7) Includes $30.0 million in revenue generated by Sofica and rogenSi, which were acquired in 2014. (8) Includes $3.3 million expense related to reductions in force and $0.4 million expense related to the
impairment of property and equipment. (9) Includes a net $6.7 million benefit related to fair value adjustments to the contingent consideration based
on revised estimates of performance against targets for four of our acquisitions. (10) Includes a $1.3 million benefit related to restructuring charges, a $0.4 million benefit related to a
valuation allowance for equity compensation, a $1.2 million benefit related to the closing of statute of limitations in Canada, $3.8 million of expense related to future contingent payments, $1.3 million of expense related to the resolution of an audit in the Netherlands, and $0.2 million of expense related to other discrete items.
(11) The Company spent $23.8 million net of cash acquired of $3.5 million in 2014 for the acquisitions of Sofica and rogenSi. Upon the acquisitions of Sofica and rogenSi, the Company acquired $59.5 million in assets and assumed $11.1 million in liabilities ($5.4 million in long-term liabilities). The Company also assumed a purchase price payable of $22.4 million related to these acquisitions. Of the $22.4 million purchase price payable, $13.2 million was included in long-term liabilities.
(12) Includes $51.4 million in revenue generated by WebMetro, which was acquired in 2013, and TSG, which was acquired on December 31, 2012.
(13) Includes $4.1 million expense related to reductions in force, $0.3 million related to facilities exit charges, $0.1 million expense related to the impairment of property and equipment and $1.1 million expense related to the impact of intangible assets.
(14) Includes a $3.7 million charge related to the deconsolidation of a subsidiary and a $1.9 million charge related to a fair value adjustment to the contingent consideration based on revised estimates of performance against targets for three of our acquisitions.
(15) Includes a $1.8 million benefit related to restructuring charges, a $1.5 million benefit related to return to provision adjustments, and $1.8 million of expense related to valuation allowance increases.
(16) The Company spent $8.9 million net of cash acquired of $6.4 million in 2013 for the acquisition of WebMetro. Upon the acquisition of WebMetro, the Company acquired $27.5 million in assets and assumed $9.7 million in liabilities ($0.8 million in long-term liabilities). The Company also assumed a purchase price payable of $2.5 million related to this acquisition. Of the $2.5 million purchase price payable, $1.8 million was included in long-term liabilities.
(17) Includes $8.9 million in revenue generated by OnState, iKnowtion and Guidon, which were acquired in 2012.
(18) Includes $22.5 million expense related to reductions in force, $0.4 million expense related to facilities exit charges, and $2.9 million expense related to the impairment of property and equipment.
(19) Includes a $7.6 million benefit related to Australia and New Zealand Transfer Pricing Arrangements, a $1.4 million benefit from the release of uncertain tax positions, a $9.2 million benefit related to restructuring charges, a $1.9 million benefit related to return to provision adjustments and $0.1 million of expense related to other discrete items.
(20) The Company spent $35.8 million, net of cash acquired of $3.7 million, in 2012 for the acquisitions of OnState, iKnowtion, Guidon, and TSG through an increase in borrowings on its line of credit. Upon acquisition of these companies, the Company acquired $65.6 million in assets and assumed $12.4 million in liabilities ($3.1 million in long-term liabilities). The Company also assumed a purchase price payable of $12.7 million related to these acquisitions. Of the $12.7 million purchase price payable, $10.8 million was included in long-term liabilities.

24
ITEM 7. MANAGEMENT’S DISCUSSION AND ANALYSIS OF FINANCIAL CONDITION AND RESULTS OF OPERATIONS
Executive Summary
TeleTech Holdings, Inc. (“TeleTech”, “the Company”, “we”, “our” or “us”) is a leading global provider of technology enabled customer experience services. We help leading brands improve customer experiences and operational effectiveness through a unique combination of technological innovation and operational expertise. Our portfolio of solutions includes consulting, technology, operations and analytics to enable a seamless customer experience across every interaction channel and phase of the customer lifecycle. Our solutions are supported by 48,000 employees delivering services in 23 countries from 82 customer engagement centers on six continents. Our revenue for fiscal 2016 was $1,275 million.
Since our establishment in 1982, we have helped clients strengthen their customer relationships, brand recognition and loyalty by simplifying and personalizing interactions with their customers. We deliver thought leadership, technology and innovation that create customer strategies designed to differentiate our clients from their competition; data analytics that personalize interactions and increase customer value; and integration services that connect clients’ customer relationship management (“CRM”) system to a cloud-based collaboration platform, leading to customer interactions that are seamless and relevant.
Our services are value-oriented, outcome-based, and delivered on a global scale across all of our business segments: Customer Management Services (“CMS”), Customer Growth Services (“CGS”), Customer Technology Services (“CTS”) and Customer Strategy Services (“CSS”). Our integrated customer experience platform differentiates the Company by combining strategic consulting, data analytics, process optimization, system design and integration, operational excellence, and technology solutions and services.
We have developed tailored expertise in the automotive, communications, financial services, government, healthcare, logistics, media and entertainment, retail, technology, travel and transportation industries. We target customer-focused industry leaders in the Global 1000 and serve approximately 300 global clients.
To improve our competitive position in a rapidly changing market and stay strategically relevant to our clients, we continue to invest in innovation and growth businesses, diversifying our heritage business process outsourcing services of our CMS segment into higher-value consulting, data analytics, digital marketing and technology-enabled services. Of the $1,275 million in revenue we reported in 2016, approximately 27.5% or $351 million came from the CGS, CTS and CSS segments (our “Emerging Segments”), focused on customer-centric strategy, growth or technology-based services, with the remainder of our revenue coming from the heritage business process outsourcing focused CMS segment.
We have four operating and reportable segments, which provide an integrated set of services including:
Customer Strategy Services
We typically begin by engaging our clients at a strategic level. Through our strategy and operations, analytics, and learning and performance consulting expertise, we help our clients design, build and execute their customer engagement strategies. We help our clients to better understand and predict their customers’ behaviors and preferences along with their current and future economic value. Using proprietary analytic models, we provide the insight clients need to build the business case for customer centricity, to better optimize their marketing spend and then work alongside them to help implement our recommendations. A key component of this segment involves instilling a high performance culture through management and leadership alignment and process optimization.

25
Customer Technology Services
Once the design of the customer engagement is completed, our ability to architect, deploy and host or manage the client’s customer management environment becomes a key enabler to achieving and sustaining the client’s customer engagement vision. Given the proliferation of mobile communication technologies and devices, we enable our clients’ operations to interact with their customers across the growing array of channels including email, social networks, mobile, web, SMS text, voice and chat. We design, implement and manage cloud, on-premise or hybrid customer experience environments to deliver a consistent and superior experience across all touch points on a global scale that we believe result in higher quality, lower costs and reduced risk for our clients. Through our Humanify™ platform, we also provide data-driven context aware SaaS-based solutions that link customers seamlessly and directly to appropriate resources, any time and across any channel.
Customer Management Services
We design and manage clients’ front-to-back office processes to deliver just-in-time, personalized, multi-channel interactions. Our front-office solutions seamlessly integrate voice, chat, email, e-commerce and social media to optimize the customer experience for our clients. In addition, we manage certain client back-office processes to enhance their customer-centric view of relationships and maximize operating efficiencies. Our delivery of integrated business processes via our onshore, offshore or work-from-home associates reduces operating costs and allows customer needs to be met more quickly and efficiently, resulting in higher satisfaction, brand loyalty and a stronger competitive position for our clients.
Customer Growth Services
We offer integrated sales and marketing solutions to help our clients boost revenue in new, fragmented or underpenetrated business-to-consumer or business-to-business markets. We deliver approximately $3 billion in client revenue annually via the discovery, acquisition, growth and retention of customers through a combination of our highly trained, client-dedicated sales professionals and our proprietary Revana Analytic Multichannel PlatformTM. This platform continuously aggregates individual customer information across all channels into one holistic view so as to ensure more relevant and personalized communications.
Based on our clients’ requirements, we provide our services on an integrated cross-business segment and on a discrete basis.
Additional information with respect to our segments and geographic footprint is included in Part II, Item 8. Financial Statements and Supplementary Data, Note 3 to the Consolidated Financial Statements.
Our 2016 Financial Results
In 2016, our revenue decreased 0.9% to $1,275.3 million over the same period in 2015, including a decrease of 1.6% or $20.2 million due to foreign currency fluctuations. The decrease in revenue is comprised of increases for CMS and CGS offset by a reduction in the CTS segment due to lower Avaya revenue and overall product sales and a reduction in the CSS segment due to decreases in our Middle East consulting business in connection with macro-economic trends. Revenue adjusted for the $20.2 million decrease related to foreign exchange increased 0.7% over the prior year.
Our 2016 income from operations decreased $37.4 million to $52.8 million or 4.1% of revenue, from $90.2 or 7.0% of revenue for 2015. The decrease is primarily due to $18.2 million of impairment charges related to trade name, customer relationship and non-compete intangible assets, $11.1 million of impairment charges related to internally developed software and technology, a $1.4 million impairment of goodwill (see Part II. Item 8. Financial Statements and Supplementary Data, Notes 6 and 7 to the Consolidated Financial Statements) and a $1.3 million impairment of fixed assets. Also included in 2016 was a $3.7 million restructuring charge related to a reorganization of the global sales force and restructuring of a portion of the IT functions, and a large decrease for the CSS segment related to lower revenue which caused an under utilization of the consultants. These were offset by increased income for the CMS segment related to higher revenue. Included in 2015 was $7.7 million of goodwill impairment for our WebMetro and Latin America reporting units (see Part II. Item 8. Financial Statements and Supplementary Data, Note 6 to the Consolidated Financial Statements). Income from operations in 2016 and 2015 included $36.4 million and $9.9 million of restructuring charges and asset impairments, respectively.

26
Our offshore customer engagement centers serve clients based in the U.S. and in other countries and span five countries with 22,700 workstations representing 58% of our global delivery capabilities. Revenue for our CMS and CGS segments that is provided in these offshore locations was $437 million and represented 41% of our revenue for 2016, as compared to $450 million and 43% of our revenue for 2015.
At December 31, 2016, we had $55.3 million of cash and cash equivalents, total debt of $229.6 million, and a total debt to total capitalization ratio of 39.0%.
We internally target capacity utilization in our customer engagement centers at 80% to 90% of our available workstations. As of December 31, 2016, the overall capacity utilization in our multi-client centers was 80%. The table below presents workstation data for all of our centers as of December 31, 2016 and 2015. Our utilization percentage is defined as the total number of utilized production workstations compared to the total number of available production workstations. December 31, 2016 December 31, 2015 Total Total Production % In Production % In Workstations In Use Use Workstations In Use Use Total centers
Sites open >1 year 38,506 30,674 80 % 31,354 22,710 72 % Sites open <1 year 270 270 100 % 4,022 3,334 83 %
Total workstations 38,776 30,944 80 % 35,376 26,044 74 % While we continue to see demand from all geographic regions to utilize our offshore delivery capabilities and expect this trend to continue with our clients, some of our clients have regulatory pressures to bring the services onshore to the United States. In light of these trends, we plan to continue to selectively retain and grow capacity and expand into new offshore markets, while maintaining appropriate capacity in the United States. As we grow our offshore delivery capabilities and our exposure to foreign currency fluctuations increases, we continue to actively manage this risk via a multi-currency hedging program designed to minimize operating margin volatility.
Critical Accounting Policies and Estimates
Management’s Discussion and Analysis of our financial condition and results of operations are based upon our Consolidated Financial Statements, which have been prepared in accordance with accounting principles generally accepted in the U.S. (“GAAP”). The preparation of these financial statements requires us to make estimates and assumptions that affect the reported amounts of assets, liabilities, revenue and expenses as well as the disclosure of contingent assets and liabilities. We regularly review our estimates and assumptions. These estimates and assumptions, which are based upon historical experience and on various other factors believed to be reasonable under the circumstances, form the basis for making judgments about the carrying values of assets and liabilities that are not readily apparent from other sources. Reported amounts and disclosures may have been different had management used different estimates and assumptions or if different conditions had occurred in the periods presented. Below is a discussion of the policies that we believe may involve a high degree of judgment and complexity.
Revenue Recognition
We recognize revenue when evidence of an arrangement exists, the delivery of service has occurred, the fee is fixed or determinable and collection is reasonably assured. The BPO inbound and outbound service fees are based on either a per minute, per hour, per full-time employee, per transaction or per call basis. Certain client programs provide for adjustments to monthly billings based upon whether we achieve, exceed or fail certain performance criteria. Adjustments to monthly billings consist of contractual bonuses/penalties, holdbacks and other performance based contingencies. Revenue recognition is limited to the amount that is not contingent upon delivery of future services or meeting other specified performance conditions.

27
Revenue also consists of services for agent training, program launch, professional consulting, fully-hosted or managed technology and learning innovation. These service offerings may contain multiple element arrangements whereby we determine if those service offerings represent separate units of accounting. A deliverable constitutes a separate unit of accounting when it has standalone value and delivery or performance of the undelivered items is considered probable and substantially within our control. If those deliverables are determined to be separate units of accounting, revenue is recognized as services are provided. If those deliverables are not determined to be separate units of accounting, revenue for the delivered services are bundled into one unit of accounting and recognized over the life of the arrangement or at the time all services and deliverables have been delivered and satisfied. We allocate revenue to each of the deliverables based on a selling price hierarchy of vendor specific objective evidence (“VSOE”), third-party evidence, and then estimated selling price. VSOE is based on the price charged when the deliverable is sold separately. Third-party evidence is based on largely interchangeable competitor services in standalone sales to similarly situated customers. Estimated selling price is based on our best estimate of what the selling prices of deliverables would be if they were sold regularly on a standalone basis. Estimated selling price is established considering multiple factors including, but not limited to, pricing practices in different geographies, service offerings, and customer classifications. Once we allocate revenue to each deliverable, we recognize revenue when all revenue recognition criteria are met.
Periodically, we will make certain expenditures related to acquiring contracts or provide up-front discounts for future services. These expenditures are capitalized as contract acquisition costs and amortized in proportion to the expected future revenue from the contract, which in most cases results in straight-line amortization over the life of the contract. Amortization of these contract acquisition costs is recorded as a reduction to revenue.
During 2014, new guidance was issued related to how an entity should recognize revenue to depict the transfer of promised goods or services to customers in an amount that reflects the consideration to which the entity expects to be entitled in exchange for those goods or services. The new guidance is effective for years beginning after December 15, 2017 and can be adopted retrospectively or as a cumulative effect adjustment. We have assigned a project manager and team, have selected an external consulting company to assist us through the project, have begun our project assessment phase, and are determining our implementation approach. As we have not yet completed our assessment, we have not made any conclusions regarding the potential impact to our financials.
Income Taxes
Accounting for income taxes requires recognition of deferred tax assets and liabilities for the expected future income tax consequences of transactions that have been included in the Consolidated Financial Statements or tax returns. Under this method, deferred tax assets and liabilities are determined based on the difference between the financial statement and tax basis of assets and liabilities using tax rates in effect for the year in which the differences are expected to reverse. When circumstances warrant, we assess the likelihood that our net deferred tax assets will more likely than not be recovered from future projected taxable income.
We continually review the likelihood that deferred tax assets will be realized in future tax periods under the “more-likely-than-not” criteria. In making this judgment, we consider all available evidence, both positive and negative, in determining whether, based on the weight of that evidence, a valuation allowance is required.
We follow a two-step approach to recognizing and measuring uncertain tax positions. The first step is to determine if the weight of available evidence indicates that it is more likely than not that the tax position will be sustained on audit. The second step is to estimate and measure the tax benefit as the amount that has a greater than 50% likelihood of being realized upon ultimate settlement with the tax authority. We evaluate these uncertain tax positions on a quarterly basis. This evaluation is based on the consideration of several factors including changes in facts or circumstances, changes in applicable tax law, and settlement of issues under audit.
Interest and penalties relating to income taxes and uncertain tax positions are accrued net of tax in Provision for income taxes in the accompanying Consolidated Statements of Comprehensive Income (Loss).

28
In the future, our effective tax rate could be adversely affected by several factors, many of which are outside our control. Our effective tax rate is affected by the proportion of revenue and income before taxes in the various domestic and international jurisdictions in which we operate. Further, we are subject to changing tax laws, regulations and interpretations in multiple jurisdictions in which we operate, as well as the requirements, pronouncements and rulings of certain tax, regulatory and accounting organizations. We estimate our annual effective tax rate each quarter based on a combination of actual and forecasted results of subsequent quarters. Consequently, significant changes in our actual quarterly or forecasted results may impact the effective tax rate for the current or future periods.
Impairment of Long-Lived Assets
We evaluate the carrying value of property, plant and equipment and definite-lived intangible assets for impairment whenever events or changes in circumstances indicate that the carrying amount may not be recoverable. An asset is considered to be impaired when the forecasted undiscounted cash flows of an asset group are estimated to be less than its carrying value. The amount of impairment recognized is the difference between the carrying value of the asset group and its fair value. Fair value estimates are based on assumptions concerning the amount and timing of estimated future cash flows and assumed discount rates.
Goodwill and Indefinite-Lived Intangible Assets
We evaluate goodwill and indefinite-lived intangible assets for possible impairment at least annually or whenever events or changes in circumstances indicate that the carrying amount of such assets may not be recoverable.
We use a three step process to assess the realizability of goodwill. The first step, Step 0, is a qualitative assessment that analyzes current economic indicators associated with a particular reporting unit. For example, we analyze changes in economic, market and industry conditions, business strategy, cost factors, and financial performance, among others, to determine if there would be a significant decline to the fair value of a particular reporting unit. A qualitative assessment also includes analyzing the excess fair value of a reporting unit over its carrying value from impairment assessments performed in previous years. If the qualitative assessment indicates a stable or improved fair value, no further testing is required.
If a qualitative assessment indicates that a significant decline to fair value of a reporting unit is more likely than not, or if a reporting unit’s fair value has historically been closer to its carrying value, we will proceed to Step 1 testing where we calculate the fair value of a reporting unit based on discounted future probability-weighted cash flows. If Step 1 indicates that the carrying value of a reporting unit is in excess of its fair value, we will proceed to Step 2 where the fair value of the reporting unit will be allocated to assets and liabilities as it would be completed in a business combination. Impairment occurs when the carrying amount of goodwill exceeds its estimated fair value calculated in Step 2.
We estimate fair value using discounted cash flows of the reporting units. The most significant assumptions used in these analyses are those made in estimating future cash flows. In estimating future cash flows, we use financial assumptions in our internal forecasting model such as projected capacity utilization, projected changes in the prices we charge for our services, projected labor costs, as well as contract negotiation status. The financial and credit market volatility directly impacts our fair value measurement through our weighted average cost of capital that we use to determine our discount rate. We use a discount rate we consider appropriate for the country where the business unit is providing services.
Similar to goodwill, the Company may first use a qualitative analysis to assess the realizability of its indefinite-lived intangible assets. The qualitative analysis will include a review of changes in economic, market and industry conditions, business strategy, cost factors, and financial performance, among others, to determine if there would be a significant decline to the fair value of an indefinite-lived intangible asset. If a quantitative analysis is completed, an indefinite-lived intangible asset (such as a trade name) is evaluated for possible impairment by comparing the fair value of the asset with its carrying value. Fair value is estimated as the discounted value of future revenues arising from a trade name using a royalty rate that a market participant would pay for use of that trade name. An impairment charge is recorded if the trade name’s carrying value exceeds its estimated fair value.

29
Restructuring Liability
We routinely assess the profitability and utilization of our customer engagement centers and existing markets. In some cases, we have chosen to close under-performing customer engagement centers and complete reductions in workforce to enhance future profitability. Severance payments that occur from reductions in workforce are in accordance with postemployment plans and/or statutory requirements that are communicated to all employees upon hire date; therefore, we recognize severance liabilities when they are determined to be probable and reasonably estimable. Other liabilities for costs associated with an exit or disposal activity are recognized when the liability is incurred, rather than upon commitment to a plan.
Derivatives
We enter into foreign exchange forward and option contracts to reduce our exposure to foreign currency exchange rate fluctuations that are associated with forecasted revenue earned in foreign locations. We enter into interest rate swaps to reduce our exposure to interest rate fluctuations associated with our variable rate debt. Upon proper qualification, these contracts are accounted for as cash flow hedges under current accounting standards. From time-to-time, we also enter into foreign exchange forward contracts to hedge our net investment in a foreign operation.
All derivative financial instruments are reported in the accompanying Consolidated Balance Sheets at fair value. Changes in fair value of derivative instruments designated as cash flow hedges are recorded in Accumulated other comprehensive income (loss), a component of Stockholders’ Equity, to the extent they are deemed effective. Based on the criteria established by current accounting standards, all of our cash flow hedge contracts are deemed to be highly effective. Changes in fair value of any net investment hedge are recorded in cumulative translation adjustment in Accumulated other comprehensive income (loss) in the accompanying Consolidated Balance Sheets offsetting the change in cumulative translation adjustment attributable to the hedged portion of our net investment in the foreign operation. Any realized gains or losses resulting from the foreign currency cash flow hedges are recognized together with the hedged transactions within Revenue. Any realized gains or losses resulting from the interest rate swaps are recognized in Interest expense. Gains and losses from the settlements of our net investment hedges remain in Accumulated other comprehensive income (loss) until partial or complete liquidation of the applicable net investment.
We also enter into fair value derivative contracts to reduce our exposure to foreign currency exchange rate fluctuations associated with changes in asset and liability balances. Changes in the fair value of derivative instruments designated as fair value hedges affect the carrying value of the asset or liability hedged, with changes in both the derivative instrument and the hedged asset or liability being recognized in Other income (expense), net in the accompanying Consolidated Statements of Comprehensive Income (Loss).
While we expect that our derivative instruments will continue to be highly effective and in compliance with applicable accounting standards, if our hedges did not qualify as highly effective or if we determine that forecasted transactions will not occur, the changes in the fair value of the derivatives used as hedges would be reflected currently in earnings.
Contingencies
We record a liability for pending litigation and claims where losses are both probable and reasonably estimable. Each quarter, management reviews all litigation and claims on a case-by-case basis and assigns probability of loss and range of loss.
Explanation of Key Metrics and Other Items
Cost of Services
Cost of services principally include costs incurred in connection with our customer management services, including direct labor and related taxes and benefits, telecommunications, technology costs, sales and use tax and certain fixed costs associated with the customer engagement centers. In addition, cost of services includes income related to grants we may receive from local or state governments as an incentive to locate customer engagement centers in their jurisdictions which reduce the cost of services for those facilities.

30
Selling, General and Administrative
Selling, general and administrative expenses primarily include costs associated with administrative services such as sales, marketing, product development, legal settlements, legal, information systems (including core technology and telephony infrastructure) and accounting and finance. It also includes outside professional fees (i.e., legal and accounting services), building expense for non-delivery center facilities and other items associated with general business administration.
Restructuring Charges, Net
Restructuring charges, net primarily include costs incurred in conjunction with reductions in force or decisions to exit facilities, including termination benefits and lease liabilities, net of expected sublease rentals.
Interest Expense
Interest expense includes interest expense, amortization of debt issuance costs associated with our Credit Facility, and the accretion of deferred payments associated with our acquisitions.
Other Income
The main components of other income are miscellaneous income not directly related to our operating activities, such as foreign exchange gains and reductions in our contingent consideration liabilities.
Other Expenses
The main components of other expenses are expenditures not directly related to our operating activities, such as foreign exchange losses and increases in our contingent consideration liabilities.
RESULTS OF OPERATIONS
Year Ended December 31, 2016 Compared to December 31, 2015
The tables included in the following sections are presented to facilitate an understanding of Management’s Discussion and Analysis of Financial Condition and Results of Operations and present certain information by segment for the years ended December 31, 2016 and 2015 (amounts in thousands). All inter-company transactions between the reported segments for the periods presented have been eliminated.
Customer Management Services
Year Ended December 31, 2016 2015 $ Change % Change Revenue $ 924,325 $ 913,272 $ 11,053 1.2 % Operating Income 50,541 58,018 (7,477) (12.9) % Operating Margin 5.5 % 6.4 % The increase in revenue for the Customer Management Services segment was attributable to a $47.0 million net increase in client programs and acquisitions offset by program completions of $18.2 million. Revenue was further impacted by a $17.7 million reduction due to foreign currency fluctuations, primarily the Australian dollar and the Brazilian Real.
The operating income as a percentage of revenue decreased to 5.5% in 2016 as compared to 6.4% in 2015. The decrease was primarily driven by a $11.1 million impairment for internally developed software and technology assets and a $1.4 million impairment of goodwill (see Part II. Item 8. Financial Statements and Supplementary Data, Note 6 to the Consolidated Financial Statements) and a shift in business mix to onshore vs. offshore. This was offset by an increase of $4.3 million due to foreign currency fluctuations. Included in the operating income was amortization related to acquired intangibles of $0.9 million and $0.8 million for the years ended December 31, 2016 and 2015, respectively.

31
Customer Growth Services
Year Ended December 31, 2016 2015 $ Change % Change Revenue $ 141,005 $ 129,021 $ 11,984 9.3 % Operating Income 6,969 3,077 3,892 126.5 % Operating Margin 4.9 % 2.4 % The increase in revenue for the Customer Growth Services segment was due to a $21.9 million increase in client programs offset by program completions of $8.6 million and a $1.3 million reduction due to foreign currency fluctuations.
The operating income as a percentage of revenue increased to 4.9% in 2016 as compared to 2.4% in 2015. This increase was attributable to increased revenue and improvements in the efficiency of the selling, general and administrative expenses and a decrease in amortization. Also included in the 2015 income was a $5.9 million goodwill impairment for the WebMetro reporting unit (see Part II. Item 8. Financial Statements and Supplementary Data, Note 6 to the Consolidated Financial Statements). Included in the operating income was amortization related to acquired intangibles of $1.8 million and $2.7 million for the years ended December 31, 2016 and 2015, respectively.
Customer Technology Services
Year Ended December 31, 2016 2015 $ Change % Change Revenue $ 141,254 $ 157,606 $ (16,352) (10.4) % Operating Income 933 13,339 (12,406) (93.0) % Operating Margin 0.7 % 8.5 % The decrease in revenue for the Customer Technology Services segment was driven most significantly by lower volumes in the Avaya platform due to Avaya’s product transition and financial challenges. Additionally, CISCO product sales have declined as clients increasingly move to adopt cloud based solutions.
The operating income as a percentage of revenue decreased to 0.7% in 2016 as compared to 8.5% in 2015. Included in the 2016 income was a $12.1 million charge related to the impairment of customer relationships, trade name, non-compete intangible assets and technology fixed assets due to continued lower financial performance of the Avaya business unit (see Part II. Item 8. Financial Statements and Supplementary Data, Note 7 to the Consolidated Financial Statements). This was offset by increases in the profitability of the CISCO platform including Cloud, Managed Service and Consulting services. Included in the operating income was amortization related to acquired intangibles of $4.6 million and $4.2 million for the years ended December 31, 2016 and 2015, respectively.
Customer Strategy Services Year Ended December 31, 2016 2015 $ Change % Change Revenue $ 68,674 $ 86,856 $ (18,182) (20.9) % Operating Income (5,691) 15,746 (21,437) (136.1) % Operating Margin (8.3) % 18.1 % The decrease in revenue for the Customer Strategy Services segment was primarily related to the decrease in the Middle East consulting business as well as revenue volatility in several other regions and a $1.2 million decrease due to foreign currency fluctuations.

32
The operating loss as a percentage of revenue was (8.3)% in 2016 as compared to income of 18.1% in 2015. The loss included $7.5 million of charges for the impairment of two trade name intangible assets due to continued lower performance for two business units (see Part II. Item 8. Financial Statements and Supplementary Data, Note 7 to the Consolidated Financial Statements). The operating margin decrease also related to lower revenue which caused an under utilization of the consultants as well as the planned investments in practice areas and geographic expansion. Included in the operating income was amortization expense related to acquired intangibles of $2.9 million and $2.9 million for the years ended December 31, 2016 and 2015, respectively.
Interest Income (Expense)
Interest income increased slightly to $1.2 million in 2016 from $1.1 million in 2015. Interest expense increased to $7.9 million during 2016 from $7.5 million for the comparable period in 2015, primarily due to higher outstanding balances on the line of credit.
Other Income (Expense), Net
Included in the year ended December 31, 2016 was a total of $5.3 million of estimated losses related to two business units which have been classified as assets held for sale (see Part II. Item 8. Financial Statements and Supplementary Data, Note 2 to the Consolidated Financial Statements).
Included in the year ended December 31, 2016, was a $4.8 million benefit related to fair value adjustments of the contingent consideration based on revised estimates of performance against targets for two of our acquisitions (see Part II, Item 8. Financial Statements and Supplementary Data, Note 9 to the Consolidated Financial Statements).
Included in the year ended December 31, 2015, was a net $26 thousand expense related to fair value adjustments of the contingent consideration based on revised estimates of performance against targets for two of our acquisitions (see Part II, Item 8. Financial Statements and Supplementary Data, Note 9 to the Consolidated Financial Statements).
Income Taxes
The reported effective tax rate for 2016 was 25.6% as compared to 23.3% for 2015. The effective tax rate for 2016 was impacted by earnings in international jurisdictions currently under an income tax holiday, $1.7 million of expense related to return to provision adjustments, $1.1 million of expense related to a transfer pricing adjustment for a prior period, $0.5 million of expense related to tax rate changes, $0.5 million of expense related to changes in valuation allowances, $1.5 million of benefit related to restructuring expenses, and $9.8 million of benefit related to impairments and assets held for sale. Without these items our effective tax rate for the year ended December 31, 2016 would have been 23.3%.
For the year ended December 31, 2015, our effective tax rate was 23.3%. The effective tax rate for 2015 was impacted by earnings in international jurisdictions currently under an income tax holiday, $2.6 million of benefit related to impairments, $0.7 million benefit related to restructuring charges, $1.2 million net of expense related to changes in valuation allowance and a related release of a deferred tax liability, $1.3 million of expense related to state net operating losses and credits, $1.5 million of expense related to provisions for uncertain tax positions, and $0.4 million benefit related to other discrete items. Without these items our effective tax rate for the year ended December 31, 2015 would have been 20.4%.
Year Ended December 31, 2015 Compared to 2014
The tables included in the following sections are presented to facilitate an understanding of Management’s Discussion and Analysis of Financial Condition and Results of Operations and present certain information by segment for the years ended December 31, 2015 and 2014 (amounts in thousands). All inter-company transactions between the reported segments for the periods presented have been eliminated.

33
Customer Management Services
Year Ended December 31, 2015 2014 $ Change % Change Revenue $ 913,272 $ 923,497 $ (10,225) (1.1) % Operating Income 58,018 76,792 (18,774) (24.4) % Operating Margin 6.4 % 8.3 % The change in revenue for the Customer Management Services segment was attributable to a $69.3 million net increase in client programs and acquisitions offset by program completions of $25.6 million. Revenue was further impacted by a $53.9 million reduction due to foreign currency fluctuations, primarily the Australian dollar and the Brazilian Real.
The operating income as a percentage of revenue decreased to 6.4% in 2015 as compared to 8.3% in 2014. The operating margin, as with revenue, was negatively impacted by $13.0 million of foreign currency fluctuations and a $4.5 million increase in spending on a number of growth related investments in CMS including sales, marketing and research and development. The decrease is also attributable to a $1.8 million goodwill impairment for the Latin America reporting unit (see Part II, Item 8. Financial Statements and Supplementary Data, Note 6 to the Consolidated Financial Statements), and the build out of a super site for one of our largest clients. Included in the operating income was amortization related to acquired intangibles of $0.8 million and $0.8 million for the years ended December 31, 2015 and 2014, respectively.
Customer Growth Services
Year Ended December 31, 2015 2014 $ Change % Change Revenue $ 129,021 $ 115,434 $ 13,587 11.8 % Operating Income 3,077 7,255 (4,178) (57.6) % Operating Margin 2.4 % 6.3 % The increase in revenue for the Customer Growth Services segment was due to a $29.4 million increase in client programs offset by program completions of $10.4 million and a $5.4 million reduction due to foreign currency fluctuations.
The operating income as a percentage of revenue decreased to 2.4% in 2015 as compared to 6.3% in 2014. This decrease was primarily driven by a $5.9 million goodwill impairment for the WebMetro reporting unit (see Part II, Item 8. Financial Statements and Supplementary Data, Note 6 to the Consolidated Financial Statements), a $1.8 million decrease due to foreign currency fluctuations and the completion of established programs. These were partially offset by increased profits from additional business booked during 2015 which began operating in 2015. Included in the operating income was amortization related to acquired intangibles of $2.7 million and $2.7 million for the years ended December 31, 2015 and 2014, respectively.
Customer Technology Services
Year Ended December 31, 2015 2014 $ Change % Change Revenue $ 157,606 $ 139,182 $ 18,424 13.2 % Operating Income 13,339 4,519 8,820 195.2 % Operating Margin 8.5 % 3.2 % The increase in revenue for the Customer Technology Services segment was related to increases in both the Cisco and Avaya offerings including recurring revenue for the cloud and managed services solutions.

34
The operating income as a percentage of revenue increased to 8.5% in 2015 as compared to 3.2% in 2014. The improvement in operating income margin is attributable to increased revenue in combination with lower selling, general and administrative expenses. Also, as the revenue grows for the cloud and managed services solutions, the margins increase due to higher utilization of fixed expenses. Included in the operating income was amortization related to acquired intangibles of $4.2 million and $4.4 million for the years ended December 31, 2015 and 2014, respectively.
Customer Strategy Services
Year Ended December 31, 2015 2014 $ Change % Change Revenue $ 86,856 $ 63,668 $ 23,188 36.4 % Operating Income 15,746 7,909 7,837 99.1 % Operating Margin 18.1 % 12.4 % The increase in revenue for the Customer Strategy Services segment was primarily related to the acquisition of rogenSi in August 2014, as well as organic growth across several of our geographies and practices including our Customer Insights and Service Optimization practices offset by a $3.9 million reduction due to foreign currency fluctuations.
The operating income as a percentage of revenue increased to 18.1% in 2015 as compared to 12.4% in 2014. The operating margin increase was related to the acquisition of rogenSi and stronger year over year margins in the Customer Insight, Service Optimization and CX Consulting practices. Included in the operating income was amortization expense related to acquired intangibles of $2.9 million and $2.1 million for the years ended December 31, 2015 and 2014, respectively.
Interest Income (Expense)
Interest income decreased to $1.1 million in 2015 from $1.8 million in 2014. Interest expense increased to $7.5 million during 2015 from $6.9 million for the comparable period in 2014, primarily due to higher outstanding debt.
Other Income (Expense), Net
Included in the year ended December 31, 2015, was a net $26 thousand expense related to fair value adjustments of the contingent consideration based on revised estimates of performance against targets for two of our acquisitions (see Part II, Item 8. Financial Statements and Supplementary Data, Note 9 to the Consolidated Financial Statements).
Included in the year ended December 31, 2014, was a combined net $6.7 million benefit related to fair value adjustments of the contingent consideration based on revised estimates of performance against targets for four of our acquisitions (see Part II, Item 8. Financial Statements and Supplementary Data, Note 9 to the Consolidated Financial Statements).
Income Taxes
The reported effective tax rate for 2015 was 23.3% as compared to 22.9% for 2014. The effective tax rate for 2015 was impacted by earnings in international jurisdictions currently under an income tax holiday, $2.6 million of benefit related to impairments, $0.7 million of benefit related to restructuring charges, $1.2 million net of expense related to changes in valuation allowance and a related release of a deferred tax liability, $1.3 million of expense related to state net operating losses and credits, $1.5 million of expense related to provisions for uncertain tax positions, and $0.4 million benefit related to other discrete items. Without these items our effective tax rate for the year ended December 31, 2015 would have been 20.4%. For the year ended December 31, 2014, our effective tax rate was 22.9%. Without a $1.3 million benefit related to restructuring charges, a $1.2 million benefit related to the closing of statute of limitations in Canada, a $0.4 million benefit related to a valuation allowance for equity compensation, $3.8 million of expense related to future contingent payments, $1.3 million of expense related to the resolution of an audit in the Netherlands, and $0.2 million of expense related to other discrete items, our effective tax rate for the year ended December 31, 2014 would have been 19.8%.

35
Liquidity and Capital Resources
Our principal sources of liquidity are our cash generated from operations, our cash and cash equivalents, and borrowings under our credit facility, dated June 3, 2013 which was amended and restated effective February 11, 2016 (the “Credit Facility”). During the year ended December 31, 2016, we generated positive operating cash flows of $107.9 million. We believe that our cash generated from operations, existing cash and cash equivalents, and available credit will be sufficient to meet expected operating and capital expenditure requirements for the next 12 months.
We manage a centralized global treasury function in the United States with a focus on concentrating and safeguarding our global cash and cash equivalents. While the majority of our cash is held outside the U.S., we prefer to hold U.S. Dollars in addition to the local currencies of our foreign subsidiaries. We expect to use our offshore cash to support working capital and growth of our foreign operations. While there are no assurances, we believe our global cash is protected given our cash management practices, banking partners and utilization of diversified, high quality investments.
We have global operations that expose us to foreign currency exchange rate fluctuations that may positively or negatively impact our liquidity. We are also exposed to higher interest rates associated with our variable rate debt. To mitigate these risks, we enter into foreign exchange forward and option contracts and interest rate swaps through our cash flow hedging program. Please refer to Item 7A. Quantitative and Qualitative Disclosures About Market Risk, Foreign Currency Risk, for further discussion.
We primarily utilize our Credit Facility to fund working capital, general operations, stock repurchases, dividends, and other strategic activities, such as the acquisitions described in Part II. Item 8. Financial Statements and Supplementary Data, Note 2 to the Consolidated Financial Statements. As of December 31, 2016 and 2015, we had borrowings of $217.3 million and $100.0 million, respectively, under our Credit Facility, and our average daily utilization was $375.3 million and $319.6 million for the years ended December 31, 2016 and 2015, respectively. After consideration for the current level of availability based on the covenant calculations, our remaining borrowing capacity was approximately $370 million as of December 31, 2016. As of December 31, 2016, we were in compliance with all covenants and conditions under our Credit Facility.
The amount of capital required over the next 12 months will depend on our levels of investment in infrastructure necessary to maintain, upgrade or replace existing assets. Our working capital and capital expenditure requirements could also increase materially in the event of acquisitions or joint ventures, among other factors. These factors could require that we raise additional capital through future debt or equity financing. We can provide no assurance that we will be able to raise additional capital with commercially reasonable terms acceptable to us.
The following discussion highlights our cash flow activities during the years ended December 31, 2016, 2015, and 2014.
Cash and Cash Equivalents
We consider all liquid investments purchased within 90 days of their original maturity to be cash equivalents. Our cash and cash equivalents totaled $55.3 million and $60.3 million as of December 31, 2016 and 2015, respectively. We diversify the holdings of such cash and cash equivalents considering the financial condition and stability of the counterparty institutions.
We reinvest our cash flows to grow our client base, expand our infrastructure, for investment in research and development, for strategic acquisitions, for the purchase of our outstanding stock and to pay dividends.
Cash Flows from Operating Activities
For the years 2016, 2015 and 2014 we reported net cash flows provided by operating activities of $107.9 million, $133.8 million and $94.1 million, respectively. The decrease of $25.9 million from 2015 to 2016 was primarily due to a $12.0 million increase in cash collected from accounts receivable, a $5.3 million increase in prepaid assets, offset by a $35.0 million increase in payments made for operating expenses. The net increase of $39.7 million from 2014 to 2015 was primarily due to a $21.1 million increase in cash collected from accounts receivable, a $20.1 million decrease in payments made for operating expenses offset by decreases in deferred revenue of $13.1 million.

36
Cash Flows from Investing Activities
For the years 2016, 2015 and 2014, we reported net cash flows used in investing activities of $100.4 million, $77.2 million and $91.9 million, respectively. The net increase in cash used in investing activities from 2015 to 2016 was primarily due to increased spending on acquisitions of $44.7 million offset by a decrease in spending on investments of $5.8 million and a decrease of $15.8 due to lower capital expenditures. The net decrease in cash used in investing activities from 2014 to 2015 was primarily due to decreased spending on acquisitions and investments of $13.6 million.
Cash Flows from Financing Activities
For the years 2016, 2015 and 2014, we reported net cash flows provided by (used in) financing activities of $2.3 million, $(52.9) million and $(74.2) million, respectively. The change in net cash flows from 2015 to 2016 was primarily due to a $117.3 million increase in borrowing on the Credit Facility, a decrease in the contingent consideration and hold-back payments of $2.4 million, offset by a $57.5 million increase in purchases of our outstanding common stock, a $4.1 million payment to purchase a non-controlling interest, and $1.9 million paid for debt issuance costs. The change in net cash flows from 2014 to 2015 was primarily due to a $39.8 million decrease in purchases of our outstanding common stock offset by $17.4 million of dividends paid during 2015 and a $3.3 million increase for payments of contingent consideration related to acquisitions.
Free Cash Flow
Free cash flow (see “Presentation of Non-GAAP Measurements” below for the definition of free cash flow) was $57.1 million, $67.2 million and $26.4 million for the years 2016, 2015 and 2014, respectively. The decrease from 2015 to 2016 was primarily due to the decrease in cash flows provided by operating activities offset by a decrease in spend for capital expenditures. The increase from 2014 to 2015 was primarily due to the increase in cash flows provided by operating activities and a decrease in spend for capital expenditures and acquisitions.
Presentation of Non-GAAP Measurements
Free Cash Flow
Free cash flow is a non-GAAP liquidity measurement. We believe that free cash flow is useful to our investors because it measures, during a given period, the amount of cash generated that is available for debt obligations and investments other than purchases of property, plant and equipment. Free cash flow is not a measure determined by GAAP and should not be considered a substitute for “income from operations,” “net income,” “net cash provided by operating activities,” or any other measure determined in accordance with GAAP. We believe this non-GAAP liquidity measure is useful, in addition to the most directly comparable GAAP measure of “net cash provided by operating activities,” because free cash flow includes investments in operational assets. Free cash flow does not represent residual cash available for discretionary expenditures, since it includes cash required for debt service. Free cash flow also includes cash that may be necessary for acquisitions, investments and other needs that may arise.
The following table reconciles net cash provided by operating activities to free cash flow for our consolidated results (in thousands): Year Ended December 31,
2016 2015 2014
Net cash provided by operating activities $ 107,897 $ 133,750 $ 94,090 Less: Purchases of property, plant and equipment 50,832 66,595 67,641
Free cash flow $ 57,065 $ 67,155 $ 26,449

37
Obligations and Future Capital Requirements
Future maturities of our outstanding debt and contractual obligations as of December 31, 2016 are summarized as follows (in thousands): Less than 1 to 3 3 to 5 Over 5 1 Year Years Years Years Total Credit Facility(1) $ 4,828 $ 9,484 $ 222,635 $ — $ 236,947 Equipment financing arrangements 2,118 2,004 457 — 4,579 Contingent consideration 608 642 — — 1,250 Purchase obligations 7,318 11,072 2,154 — 20,544 Operating lease commitments 39,362 60,601 34,372 32,364 166,699 Other debt 2,521 4,038 1,208 — 7,767
Total $ 56,755 $ 87,841 $ 260,826 $ 32,364 $ 437,786
(1) Includes estimated interest payments based on the weighted-average interest rate, unused commitment
fees, current interest rate swap arrangements, and outstanding debt as of December 31, 2016. • Contractual obligations to be paid in a foreign currency are translated at the period end exchange rate.
• Purchase obligations primarily consist of outstanding purchase orders for goods or services not yet received, which are not recognized as liabilities in our Consolidated Balance Sheets until such goods and/or services are received.
• The contractual obligation table excludes our liabilities of $3.5 million related to uncertain tax positions because we cannot reliably estimate the timing of future cash payments. See Part II, Item 8. Financial Statements and Supplementary Data, Note 10 to the Consolidated Financial Statements for further discussion.
Our outstanding debt is primarily associated with the use of funds under our Credit Agreement to fund working capital, repurchase our common stock, pay dividends and for other cash flow needs across our global operations.
Purchase Obligations
Occasionally we contract with certain of our communications clients to provide us with telecommunication services. These clients currently represent approximately 17% of our total annual revenue. We believe these contracts are negotiated on an arm’s-length basis and may be negotiated at different times and with different legal entities.
Future Capital Requirements
We expect total capital expenditures in 2017 to be approximately 4.2% of 2017 revenue. Approximately 65% of these expected capital expenditures are to support growth in our business and 35% relate to the maintenance of existing assets. The anticipated level of 2017 capital expenditures is primarily driven by new client contracts and the corresponding requirements for additional customer engagement center capacity as well as enhancements to our technological infrastructure.
We may consider restructurings, dispositions, mergers, acquisitions and other similar transactions. Such transactions could include the transfer, sale or acquisition of significant assets, businesses or interests, including joint ventures or the incurrence, assumption, or refinancing of indebtedness and could be material to the consolidated financial condition and consolidated results of our operations. Our capital expenditures requirements could also increase materially in the event of an acquisition or joint ventures. In addition, as of December 31, 2016, we were authorized to purchase an additional $19.9 million of common stock under our stock repurchase program (see Item 5. Market for Registrant’s Common Equity, Related Stockholder Matters and Issuer Purchases of Equity Securities). Our stock repurchase program does not have an expiration date.

38
The launch of large client contracts may result in short-term negative working capital because of the time period between incurring the costs for training and launching the program and the beginning of the accounts receivable collection process. As a result, periodically we may generate negative cash flows from operating activities.
Debt Instruments and Related Covenants
On February 11, 2016, we entered into a First Amendment to our June 3, 2013 Amended and Restated Credit Agreement and Amended and Restated Security Agreement (collectively the “Credit Agreement”) for a senior secured revolving credit facility (the “Credit Facility”) with a syndicate of lenders led by Wells Fargo Bank, National Association, as agent, swing line and fronting lender.
The Credit Agreement provides for a secured revolving credit facility that matures on February 11, 2021 with an initial maximum aggregate commitment of $900.0 million, and an accordion feature of up to $1.2 billion in the aggregate, if certain conditions are satisfied. At our discretion, direct borrowing options under the Credit Agreement include (i) Eurodollar loans with one, two, three, and six month terms, (ii) overnight base rate loans, and (iii) alternate currency loans. The Credit Agreement also provides for a foreign subsidiary borrowing capacity sub-limit for loans or letters of credit of up to 50% of the total commitment amount, in both U.S. dollars and certain foreign currencies.
We primarily utilize our Credit Facility to fund working capital, general operations, stock repurchases, dividends, acquisitions, and other strategic activities.
Base rate loans bear interest at a rate equal to the greatest of (i) Wells Fargo’s prime rate, (ii) one half of 1% in excess of the federal funds effective rate, or (iii) 1.25% in excess of the one month London Interbank Offered Rate (“LIBOR”); and Eurodollar loans bear interest at LIBOR. For each loan a margin is added based upon our net leverage ratio ranging from 0% to 0.75% for base rate loans and 1.0% and 1.75% for LIBOR fixed rate loans. Alternate currency loans bear interest at rates applicable to their respective currencies.
Letter of credit fees are one eighth of 1% of the stated amount of the letter of credit on the date of issuance, renewal or amendment, plus an annual fee equal to the borrowing margin for Eurodollar loans.
The Credit Facility commitment fees are payable to the lenders in an amount equal to the unused portion of the Credit Facility multiplied by a range of 0.125% to 0.250% per annum determined by our net leverage ratio.
Indebtedness under the Credit Agreement is guaranteed by certain of our domestic subsidiaries and is secured by security interests (subject to permitted liens) in the U.S. accounts receivable and cash of our Company and certain of its domestic subsidiaries. The indebtedness may also be secured by tangible assets of our Company and its domestic subsidiaries, if borrowings by foreign subsidiaries exceed $100.0 million and the total net leverage ratio is greater than 3.00 to 1.00. We also pledged 65% of the voting stock and all of the non-voting stock, if any, of certain of our material foreign subsidiaries.
The Credit Agreement contains customary affirmative, negative, and financial covenants. These covenants include, but are not limited to, the following, in each case subject to exceptions set forth in the Credit Agreement: incurring additional indebtedness or, guaranteeing of indebtedness; creating, incurring, assuming or permitting to exist liens on property and assets; making loans and investments and entering into certain types of mergers, consolidations and acquisitions; making capital distributions or paying, redeeming or repurchasing subordinated debt; entering into certain affiliate transactions; and entering into agreements that would restrict the ability of the Company’s subsidiaries to pay dividends and make distributions.
In addition, the Company is obligated to maintain a maximum net leverage ratio of 3.25 to 1.00, and a minimum Interest Coverage Ratio of 2.50 to 1.00.
The Credit Facility also contains certain customary information and reporting requirements, and events of default, including without limitation events of default based on payment obligations, material inaccuracies of representations and warranties, covenant defaults, cross defaults to certain other debt, certain ERISA events, changes in control, monetary judgments, and insolvency proceedings. Upon the occurrence of an event of default, the lenders may accelerate the maturity of all amounts outstanding under the Credit Facility.

39
As of December 31, 2016 and 2015, we had borrowings of $217.3 million and $100.0 million, respectively, under the Credit Facility. During 2016, 2015 and 2014, borrowings accrued interest at an average rate of approximately 1.5%, 1.2%, and 1.2% per annum, respectively, excluding unused commitment fees. Our daily average borrowings during 2016, 2015 and 2014 were $375.3 million, $319.6 million and $285.9 million, respectively. As of December 31, 2016, and 2015, based on the current level of availability based on the covenant calculations, other remaining borrowing capacity was approximately $370 million and $415 million, respectively.
Client Concentration
During 2016, one of our clients represented 10% of our total annual revenue. Our five largest clients accounted for 35%, 35% and 38% of our annual revenue for the years ended December 31, 2016, 2015 and 2014, respectively. We have long-term relationships with our top five clients, ranging from 10 to 20 years, with the majority of these clients having completed multiple contract renewals with us. The relative contribution of any single client to consolidated earnings is not always proportional to the relative revenue contribution on a consolidated basis and varies greatly based upon specific contract terms. In addition, clients may adjust business volumes served by us based on their business requirements. We believe the risk of this concentration is mitigated, in part, by the long-term contracts we have with our largest clients. Although certain client contracts may be terminated for convenience by either party, we believe this risk is mitigated, in part, by the service level disruptions and transition/migration costs that would arise for our clients.
The contracts with our five largest clients expire between 2017 and 2020. Additionally, a particular client may have multiple contracts with different expiration dates. We have historically renewed most of our contracts with our largest clients, but there can be no assurance that future contracts will be renewed or, if renewed, will be on terms as favorable as the existing contracts.
Recently Issued Accounting Pronouncements
We discuss the potential impact of recent accounting pronouncements in Part II, Item 8. Financial Statements and Supplementary Data, Note 1 to the Consolidated Financial Statements.
ITEM 7A. QUANTITATIVE AND QUALITATIVE DISCLOSURES ABOUT MARKET RISK
Market risk represents the risk of loss that may impact our consolidated financial position, consolidated results of operations, or consolidated cash flows due to adverse changes in financial and commodity market prices and rates. Market risk also includes credit and non-performance risk by counterparties to our various financial instruments. We are exposed to market risks due to changes in interest rates and foreign currency exchange rates (as measured against the U.S. dollar); as well as credit risk associated with potential non-performance of our counterparty banks. These exposures are directly related to our normal operating and funding activities. We enter into derivative instruments to manage and reduce the impact of currency exchange rate changes, primarily between the U.S. dollar/Philippine peso, the U.S. dollar/Mexican peso, and the Australian dollar/Philippine peso. We enter into interest rate derivative instruments to reduce our exposure to interest rate fluctuations associated with our variable rate debt. To mitigate against credit and non-performance risk, it is our policy to only enter into derivative contracts and other financial instruments with investment grade counterparty financial institutions and, correspondingly, our derivative valuations reflect the creditworthiness of our counterparties. As of the date of this report, we have not experienced, nor do we anticipate, any issue related to derivative counterparty defaults.
Interest Rate Risk
We entered into interest rate derivative instruments to reduce our exposure to interest rate fluctuations associated with our variable rate debt. The interest rate on our Credit Agreement is variable based upon the Prime Rate and LIBOR and, therefore, is affected by changes in market interest rates. As of December 31, 2016, we had $217.3 million of outstanding borrowings under the Credit Agreement. Based upon average daily outstanding borrowings during the years ended December 31, 2016 and 2015, interest accrued at a rate of approximately 1.5% and 1.2% per annum, respectively. If the Prime Rate or LIBOR increased by 100 basis points, there would be $1.0 million of additional interest expense per $100.0 million of outstanding borrowing under the Credit Agreement.

40
The Company’s interest rate swap arrangements as of December 31, 2016 and 2015 were as follows: Contract Contract Notional Variable Rate Fixed Rate Commencement Maturity As of December 31, 2016 Amount Received Paid Date Date Swap 2 $ 15 million 1 - month LIBOR 3.14 % May 2012 May 2017 15 million As of December 31, 2015 Swap 1 $ 25 million 1 - month LIBOR 2.55 % April 2012 April 2016 Swap 2 15 million 1 - month LIBOR 3.14 % May 2012 May 2017 40 million Foreign Currency Risk
Our subsidiaries in Bulgaria, Costa Rica, Mexico, Poland, and the Philippines use the local currency as their functional currency for paying labor and other operating costs. Conversely, revenue for these foreign subsidiaries is derived principally from client contracts that are invoiced and collected in U.S. dollars or other foreign currencies. As a result, we may experience foreign currency gains or losses, which may positively or negatively affect our results of operations attributed to these subsidiaries. For the years ended December 31, 2016, 2015 and 2014, revenue associated with this foreign exchange risk was 32%, 30% and 31% of our consolidated revenue, respectively.
The following summarizes relative (weakening) strengthening of local currencies that are relevant to our business: Year Ended December 31, 2016 2015 2014 Canadian Dollar vs. U.S. Dollar 3.1 % (19.3) % (8.7) % Philippine Peso vs. U.S. Dollar (5.9) % (4.7) % (0.9) % Mexican Peso vs. U.S. Dollar (19.5) % (17.5) % (13.0) % Australian Dollar vs. U.S. Dollar (1.3) % (11.8) % (8.8) % Euro vs. U.S. Dollar (3.6) % (11.5) % (13.3) % Philippine Peso vs. Australian Dollar (4.5) % 6.3 % 7.2 % In order to mitigate the risk of these non-functional foreign currencies weakening against the functional currencies of the servicing subsidiaries, which thereby decreases the economic benefit of performing work in these countries, we may hedge a portion, though not 100%, of the projected foreign currency exposure related to client programs served from these foreign countries through our cash flow hedging program. While our hedging strategy can protect us from adverse changes in foreign currency rates in the short term, an overall weakening of the non-functional revenue foreign currencies would adversely impact margins in the segments of the servicing subsidiary over the long term.
Cash Flow Hedging Program
To reduce our exposure to foreign currency exchange rate fluctuations associated with forecasted revenue in non-functional currencies, we purchase forward and/or option contracts to acquire the functional currency of the foreign subsidiary at a fixed exchange rate at specific dates in the future. We have designated and account for these derivative instruments as cash flow hedges for forecasted revenue in non-functional currencies.
While we have implemented certain strategies to mitigate risks related to the impact of fluctuations in currency exchange rates, we cannot ensure that we will not recognize gains or losses from international transactions, as this is part of transacting business in an international environment. Not every exposure is or can be hedged and, where hedges are put in place based on expected foreign exchange exposure, they are based on forecasts for which actual results may differ from the original estimate. Failure to successfully hedge or anticipate currency risks properly could adversely affect our consolidated operating results.

41
Our cash flow hedging instruments as of December 31, 2016 and 2015 are summarized as follows (in thousands). All hedging instruments are forward contracts, except as noted. Local Currency U.S. Dollar % Maturing Contracts Notional Notional in the next Maturing As of December 31, 2016 Amount Amount 12 months Through Philippine Peso 14,315,000 301,134 (1) 42.3 % August 2021 Mexican Peso 2,089,000 129,375 23.7 % May 2021 $ 430,509
Local
Currency U.S. Dollar Notional Notional As of December 31, 2015 Amount Amount
Philippine Peso 16,362,000 361,571 (1)
Mexican Peso 2,637,000 173,124
$ 534,695
(1) Includes contracts to purchase Philippine pesos in exchange for New Zealand dollars and Australian dollars, which are translated into equivalent U.S. dollars on December 31, 2016 and December 31, 2015.
The fair value of our cash flow hedges at December 31, 2016 was a liability (in thousands): Maturing in the December 31, 2016 Next 12 Months Philippine Peso (16,068) (10,367) Mexican Peso (37,971) (7,461) $ (54,039) $ (17,828) Our cash flow hedges are valued using models based on market observable inputs, including both forward and spot foreign exchange rates, implied volatility, and counterparty credit risk. The fair value of our cash flow hedges decreased by $8.3 million from December 31, 2015 to December 31, 2016. The decrease in fair value from December 31, 2015 largely reflects a broad strengthening in the U.S. dollar during 2016.
We recorded net losses of $28.0 million, $12.4 million, and $2.4 million for settled cash flow hedge contracts for the years ended December 31, 2016, 2015, and 2014, respectively. These losses were reflected in Revenue in the accompanying Consolidated Statements of Comprehensive Income (Loss). If the exchange rates between our various currency pairs were to increase or decrease by 10% from current period-end levels, we would incur a material gain or loss on the contracts. However, any gain or loss would be mitigated by corresponding increases or decreases in our underlying exposures.
Other than the transactions hedged as discussed above and in Part II. Item 8. Financial Statements and Supplementary Data, Note 8 to the Consolidated Financial Statements, the majority of the transactions of our U.S. and foreign operations are denominated in their respective local currency. However, transactions are denominated in other currencies from time-to-time. We do not currently engage in hedging activities related to these types of foreign currency risks because we believe them to be insignificant as we endeavor to settle these accounts on a timely basis. For the years ended 2016 and 2015, approximately 22% and 23%, respectively, of revenue was derived from contracts denominated in currencies other than the U.S. Dollar. Our results from operations and revenue could be adversely affected if the U.S. Dollar strengthens significantly against foreign currencies.
Fair Value of Debt and Equity Securities
We did not have any investments in marketable debt or equity securities as of December 31, 2016 or 2015.

42
ITEM 8. FINANCIAL STATEMENTS AND SUPPLEMENTARY DATA
The financial statements required by this item are located beginning on page F-1 of this report and incorporated herein by reference.
ITEM 9. CHANGES IN AND DISAGREEMENTS WITH ACCOUNTANTS ON ACCOUNTING AND FINANCIAL DISCLOSURE
Not applicable.
ITEM 9A. CONTROLS AND PROCEDURES
This Form 10-K includes the certifications of our Chief Executive Officer (the “CEO”) and Chief Financial Officer (the “CFO”) required by Rule 13a-14 of the Securities Exchange Act of 1934 (the “Exchange Act”). See Exhibits 31.1 and 31.2. This Item 9A includes information concerning the controls and control evaluations referred to in those certifications.
Disclosure Controls and Procedures
Disclosure controls and procedures (as defined in Rules 13a-15(e) and 15d-15(e) under the Exchange Act, as amended) are designed to provide reasonable assurance that information required to be disclosed in reports filed or submitted under the Exchange Act is recorded, processed, summarized, and reported within the time periods specified in SEC rules and forms and that such information is accumulated and communicated to management, including our CEO and CFO, to allow timely decisions regarding required disclosures.
Based on their evaluation, as of December 31, 2016, the end of the period covered by this Form 10-K, the Company’s CEO and CFO have concluded that the Company’s disclosure controls and procedures (as defined in Rules 13a-15(e) and 15d-15(e) under the Securities Exchange Act of 1934, as amended) were not effective because of the material weaknesses in our internal control over financial reporting described in “Management’s Report on Internal Control over Financial Reporting” below.
Notwithstanding such material weaknesses in internal control over financial reporting, our CEO and CFO have concluded that our consolidated financial statements included in this Form 10-K present fairly, in all material respects, our financial position, results of operations and cash flows for the periods presented in conformity with accounting principles generally accepted in the United States and Article 10 of Regulation S-X of under the Exchange Act.
Inherent Limitations of Internal Controls
Our management, including the CEO and CFO, believes that any disclosure controls and procedures or internal control over financial reporting, no matter how well conceived and operated, can provide only reasonable, not absolute, assurance that the objectives of internal controls are met. Further, the design of internal controls must consider the benefits of controls relative to their costs. Inherent limitations within internal controls include the realities that judgments in decision-making can be faulty, and that breakdowns can occur because of simple error or mistake. Additionally, controls can be circumvented by the individual acts of some persons, by collusion of two or more people, or by unauthorized override of the control. Over time, control may become inadequate because of changes in conditions or deterioration in the degree of compliance with associated policies or procedures. While the objective of the design of any system of controls is to provide reasonable assurance of the effectiveness of controls, such design is also based in part upon certain assumptions about the likelihood of future events, and such assumptions, while reasonable, may not take into account all potential future conditions. Thus, even effective internal control over financial reporting can only provide reasonable assurance of achieving their objectives. Therefore, because of the inherent limitations in cost effective internal controls, misstatements due to error or fraud may occur and may not be prevented or detected.

43
Management’s Report on Internal Control over Financial Reporting
Management, under the supervision of our CEO and CFO, is responsible for establishing and maintaining adequate internal control over financial reporting, as defined in Rules 13a-15(f) and 15d-15(f) under the Securities Exchange Act of 1934, as amended. Internal control over financial reporting is a process designed to provide reasonable assurance regarding the reliability of financial reporting and the preparation of financial statements for external purposes in accordance with generally accepted accounting principles. Internal control over financial reporting includes those policies and procedures which (a) pertain to the maintenance of records that, in reasonable detail, accurately and fairly reflect the transactions and dispositions of assets, (b) provide reasonable assurance that transactions are recorded as necessary to permit preparation of financial statements in accordance with generally accepted accounting principles, (c) provide reasonable assurance that receipts and expenditures are being made only in accordance with appropriate authorization of management and the Board of Directors, and (d) provide reasonable assurance regarding prevention or timely detection of unauthorized acquisition, use or disposition of assets that could have a material effect on the financial statements.
In connection with the preparation of this Annual Report on Form 10-K, our management, under the supervision and with the participation of our CEO and CFO, conducted an evaluation of the effectiveness of our internal control over financial reporting as of December 31, 2016 based on the framework established in Internal Control — Integrated Framework (2013) issued by the Committee of Sponsoring Organizations of the Treadway Commission (“COSO”). As a result of that evaluation, our management concluded that the Company’s internal control over financial reporting was not effective as of December 31, 2016, the end of the period covered by this Form 10-K, because of the material weaknesses in our internal control over financial reporting described below under “Material Weaknesses in Internal Control over Financial Reporting”.
We excluded Atelka Enterprises, Inc. (“Atelka”) from our assessment of internal control over financial reporting as of December 31, 2016 because it was acquired by the Company in a purchase business combination during 2016. Atelka’s total assets and total revenues represent 6.7% and 0.8%, respectively, of the related consolidated financial amounts as of and for the year ended December 31, 2016.
Material Weaknesses in Internal Control over Financial Reporting
A material weakness is a deficiency, or a combination of deficiencies, in internal control over financial reporting, such that there is a reasonable possibility that a material misstatement of the company’s annual or interim financial statements will not be prevented or detected on a timely basis.
We identified the following material weaknesses as of December 31, 2016:
Control Environment: We did not maintain an effective control environment as we did not have a sufficient complement of qualified personnel commensurate with our financial reporting requirements. This material weakness contributed to the following control deficiencies, each of which is considered to be a material weakness.
Revenue: We did not maintain processes, procedures and internal controls that were adequately designed, documented, and executed over our revenue process which could lead to inaccurate and untimely recording or reporting of revenue. This material weakness did not result in the identification of any adjustments to the annual or interim consolidated financial statements.
Impairments: We did not design and maintain effective internal controls over the review of the cash flow forecasts used in the accounting for long-lived asset recoverability and goodwill impairment and determination of the impairment charge in accordance with generally accepted accounting principles. Specifically, the Company did not design and maintain effective internal controls related to determining the fair value of reporting units for the purpose of performing goodwill impairment testing and management’s review of the data, model and assumptions used in its cash flow forecasts for long-lived asset recoverability and goodwill impairment. This material weakness resulted in an immaterial misstatement to goodwill during the year-ended December 31, 2014 and immaterial out-of-period adjustments to goodwill during each of the quarters ended September 30, 2015 and December 31, 2015.

44
While these material weaknesses did not result in errors that were material to our annual or interim financial statements, they could result in misstatements of our accounts or disclosures which would result in a material misstatement of our consolidated financial statements and disclosures which would not be prevented or detected.
The effectiveness of our internal control over financial reporting as of December 31, 2016 has been audited by PricewaterhouseCoopers LLP, our independent registered public accounting firm, as stated in their report, which is included herein.
Remediation of Prior Material Weaknesses
The following captures the progress made by management related to each of the material weaknesses that have been remediated.
Account Reconciliations: Management previously identified a material weakness in the design and operating effectiveness of controls over account reconciliations, including the failure to reconcile certain accounts and to review underlying financial information in the correct reporting period. During 2016 TeleTech accounting management engaged a consulting firm to assist in the development of an improved control framework for all accounting processes deemed to be included in remediation of identified material weaknesses. Included in this remediation was a significant focus on the design and execution of account reconciliations. Enhanced controls were documented and a process for quarterly control owner certification was implemented. In addition, a significant investment was made in training the accounting personnel on the required documentation for account reconciliations. Based on the results of our testing, management has concluded that the controls are adequately designed and have operated effectively for a sufficient period of time during 2016. Accordingly, the account reconciliation material weakness is remediated.
Journal Entries: Management previously identified a material weakness in the design and operating effectiveness of controls related to the review and approval of journal entries, including maintaining appropriate supporting documentation. Management has taken the necessary steps to redesign the control framework, including accounting system configurations, over review and approval of journal entries including: integrated our acquired companies onto our global accounting system; reduced the number of journal entry sources; implementation of reporting analytics to detect and prevent unauthorized journal entry sources and to ensure an appropriate segregation of duties related to creation and approval; documentation evidencing the review and approval controls; and quarterly certifications executed by the responsible party’s attesting to completion of the journal entry controls. Based on the results of our testing Management has concluded that the controls are adequately designed and have operated effectively for a sufficient period of time during 2016. Accordingly, the journal entry material weakness is remediated.
Remediation Efforts and Status of Remaining Material Weaknesses
Revenue: During 2016, management has taken the necessary steps to redesign the control framework, including the implementation of (i) a revenue quality assurance organization, (ii) standardized contract and invoice review and approval templates, and (iii) a document storage system for improved organization and evidence of review. Additionally, management established a quarterly control owner certification process and invested in employee training. Management has completed the design and implementation of this control framework and has tested the revenue controls in the quarter ending December 31, 2016. Management will continue to test the controls for revenue in 2017 to ensure they have operated for a sufficient period of time before concluding on remediation.
Impairments: During 2016, management has taken the necessary steps to redesign the control framework, including implementation of specific preparation and review procedures to (i) ensure the accuracy of the valuation models used to calculate fair market values, (ii) validate the source of the financial forecasts, and (iii) evidence the assessment of the models for reasonableness. In addition, TeleTech has engaged a third party valuation expert to assist management with the underlying valuation models supporting the goodwill and intangible impairment assessments. Management has completed the design and implementation of the control framework and has tested the impairment controls in the quarter ending December 31, 2016. Management will continue to test the controls for impairment in 2017 to ensure they have operated for a sufficient period of time before concluding on remediation.

45
Control Environment: During 2016 TeleTech invested significantly in the quality of our accounting talent including management, technical, process improvement and financial system roles. Additionally, we implemented a number of programs to: improve our talent acquisition and retention platforms; enhance technical, transactional and control knowledge of our accounting teams; create a culture of accountability and control. These programs have significantly improved the stability of our global accounting organization. In order to consider this material weakness to be fully remediated, we believe additional time is needed to demonstrate sustainability as it relates to our internal control over financial reporting and improvements made to our complement of resources.
Changes in Internal Control over Financial Reporting
As described above under Remediation Efforts and Status of Remaining Material Weaknesses there were changes in our internal control over financial reporting that occurred during the quarter ended December 31, 2016 that have materially affected, or are reasonably likely to materially affect, our internal control over financial reporting.
ITEM 9B. OTHER INFORMATION
None.

46
PART III
ITEM 10. DIRECTORS, EXECUTIVE OFFICERS AND CORPORATE GOVERNANCE
The information in our 2017 Definitive Proxy Statement on Schedule 14A, which will be filed no later than 120 days after December 31, 2016 (the “2017 Proxy Statement”) regarding our executive officers under the heading “Information Regarding Executive Officers” is incorporated herein by reference. We have both a Code of Ethical Conduct for Executive and Financial Managers and a Code of Conduct. The Code of Ethical Conduct for Executive and Financial Officers applies to our Chief Executive Officer, Chief Financial Officer, presidents of our business segments, Controller, Treasurer, the General Counsel, Chief Audit executive, senior financial officers of each operating segment and other persons performing similar functions. The Code of Conduct applies to all directors, officers, employees and members of our supply chain (as applicable). Both the Code of Ethical Conduct for Executive and Financial Officers and the Code of Conduct are posted on our website at www.teletech.com on the Corporate Governance page. We will post on our website any amendments to or waivers of the Code of Ethical Conduct for Executive and Financial Officers and our Code of Conduct, in accordance with applicable laws and regulations. There have been no material changes to the procedures by which stockholders may recommend nominees to the board of directors. The remaining information called for by this Item 10 is incorporated by reference herein from our 2017 Proxy Statement.
ITEM 11. EXECUTIVE COMPENSATION
The information in our 2017 Proxy Statement is incorporated herein by reference.
ITEM 12. SECURITY OWNERSHIP OF CERTAIN BENEFICIAL OWNERS AND MANAGEMENT AND RELATED STOCKHOLDER MATTERS
The information regarding these matters is included in Part II, Item 5. Market for Registrant’s Common Equity, Related Stockholder Matters and Issuer Purchases of Equity Securities. Also the information in our 2017 Proxy Statement is incorporated herein by reference.
ITEM 13. CERTAIN RELATIONSHIPS AND RELATED TRANSACTIONS, AND DIRECTOR INDEPENDENCE
The information in our 2017 Proxy Statement is incorporated herein by reference.
ITEM 14. PRINCIPAL ACCOUNTANTS FEES AND SERVICES
The information in our 2017 Proxy Statement is incorporated herein by reference.

47
PART IV
ITEM 15. EXHIBITS AND FINANCIAL STATEMENT SCHEDULES
(a) The following documents are filed as part of this report:
1. Consolidated Financial Statements.
The Index to Consolidated Financial Statements is set forth on page F-1 of this report.
2. Financial Statement Schedules.
All schedules for TeleTech have been omitted since the required information is not present or not present in amounts sufficient to require submission of the schedule, or because the information is included in the respective Consolidated Financial Statements or notes thereto.
3. Exhibits. EXHIBIT INDEX
Exhibit No. Description 3.01**
Restated Certificate of Incorporation of TeleTech Holdings, Inc. filed with the State of Delaware on August 1, 1996 (incorporated by reference to Exhibit 3.1 to TeleTech’s Amendment No. 2 to Form S-1 Registration Statement (Registration No. 333-04097) filed on July 5, 1996)
3.02**
Amended and Restated Bylaws of TeleTech Holdings, Inc., effective February 22, 2017 (incorporated by reference to Exhibit 3.02 to TeleTech’s Current Report on Form 8-K filed on February 27, 2017)
10.06**
TeleTech Holdings, Inc. 2010 Equity Incentive Plan (incorporated by reference as Appendix A to TeleTech’s Definitive Proxy Statement, filed April 12, 2010)
10.24**
Form of Restricted Stock Unit Agreement (Section 16 Officers) (incorporated by reference as Exhibit 4.3 to TeleTech’s Form S-8 Registration Statement (Registration No. 333-167300) filed on June 3, 2010)
10.25**
Form of Restricted Stock Unit Agreement (Non-Section 16 Employees) (incorporated by reference as Exhibit 4.4 to TeleTech’s Form S-8 Registration Statement (Registration No. 333-167300) filed on June 3, 2010)
10.27**
Form of Global Restricted Stock Unit Agreement (Operating Committee Member) (incorporated by reference to Exhibit 10.1 to TeleTech’s Quarterly Report on Form 10-Q filed on May 1, 2013)
10.28**
Form of Global Restricted Stock Unit Agreement (Non-Operating Committee Member) (incorporated by reference as Exhibit 10.2 to TeleTech’s Quarterly Report on Form 10-Q filed on May 1, 2013)
10.29**
Form of TeleTech Holdings, Inc. Restricted Stock Unit Award Agreement (other employees) effective July 1, 2014 (incorporated by reference as Exhibit 10.29 to TeleTech’s Annual Report on Form 10-K for the year ended December 31, 2014)

48
Exhibit No. Description 10.30**
Form of TeleTech Holdings, Inc. Restricted Stock Unit Award Agreement (Directors and Executive Committee Members) effective July 1, 2014 (incorporated by reference as Exhibit 10.30 to TeleTech’s Annual Report on Form 10-K for the year ended December 31, 2014)
10.32**
Independent Director Compensation Arrangements (effective January 1, 2016) (incorporated by reference as Exhibit 10.32 to TeleTech’s Annual Report on Form 10-K for the year ended December 31, 2015)
10.33**
Form of Indemnification Agreement with Directors (incorporated by reference as Exhibit 10.1 to TeleTech’s Current Report on Form 8-K filed on February 22, 2010)
10.40**
Employment Agreement between Kenneth D. Tuchman and TeleTech dated October 15, 2001 (incorporated by reference as Exhibit 10.68 to TeleTech’s Annual Report on Form 10-K for the year ended December 31, 2001)
10.41**
Amendment to Employment Agreement between Kenneth D. Tuchman and TeleTech dated December 31, 2008 (incorporated by reference as Exhibit 10.17 to TeleTech’s Annual Report on Form 10-K for the year ended December 31, 2008)
10.60**
Employment Agreement between Regina Paolillo and TeleTech Holdings, Inc. effective as of November 3, 2011 (incorporated by reference as Exhibit 10.1 to TeleTech’s Current Report on Form 8-K filed October 27, 2011)
10.63**
Non-Qualified Stock Option Agreement dated as of November 15, 2011 between TeleTech Holdings, Inc. and Regina Paolillo (Option Agreement)(incorporated by reference as Exhibit 10.3 to TeleTech’s Current Report on Form 8-K/A filed November 21, 2011)
10.81**
Employment Agreement between Robert N. Jimenez and TeleTech Services Corporation effective as of April 20, 2015 (incorporated by reference as Exhibit 10.81 to TeleTech’s Quarterly Report on Form 10-Q for the quarter ended March 31, 2015)
10.82**
Employment Agreement between Judi Hand and TeleTech Services Corporation effective as of July 1, 2016 (incorporated by reference as Exhibit 10.82 to TeleTech’s Quarterly Report on Form 10-Q for the quarter ended June 30, 2016)
10.83**
Employment Agreement between Martin DeGhetto and TeleTech Services Corporation effective as of July 1, 2016 (incorporated by reference as Exhibit 10.83 to TeleTech’s Quarterly Report on Form 10-Q for the quarter ended June 30, 2016)
10.90**
First Amendment to Amended and Restated Credit Agreement and First Amendment to Amended and Restated Security Agreement for the senior secured revolving credit facility with a syndicate of lenders led by Wells Fargo Bank, National Association, as agent, swing line and fronting lender. (Incorporated by reference to Exhibit 10.90 to TeleTech’s Form 8-K filed on February 16, 2016)
10.95
Share Purchase Agreement between TeleTech Europe BV and TeleTech Canada and Kilmer Capital Fund II L.P., 8169306 Canada Inc. Bank of Montreal, doing business as BMO Capital Partners, and certain management shareholders of November 9, 2016 (incorporated by reference as Exhibit 10.2 to TeleTech’s Quarterly Report on Form 10-Q for the quarter ended September 30, 2016)
21.1* List of subsidiaries

49
Exhibit No. Description
23.1* Consent of Independent Registered Public Accounting Firm
24.1* Power of Attorney
31.1* Rule 13a-14(a) Certification of CEO of TeleTech
31.2* Rule 13a-14(a) Certification of CFO of TeleTech
32.1*
Written Statement of Chief Executive Officer Pursuant to Section 906 of the Sarbanes-Oxley Act of 2002 (18 U.S.C. Section 1350)
32.2*
Written Statement of Chief Financial Officer Pursuant to Section 906 of the Sarbanes-Oxley Act of 2002 (18 U.S.C. Section 1350)
101.INS*** XBRL Instance Document
101.SCH*** XBRL Taxonomy Extension Schema Document
101.CAL*** XBRL Taxonomy Extension Calculation Linkbase Document.
101.LAB*** XBRL Taxonomy Extension Label Linkbase Document
101.PRE*** XBRL Taxonomy Extension Presentation Linkbase Document
101.DEF*** XBRL Taxonomy Extension Definition Linkbase Document
* Filed or furnished herewith. ** Identifies exhibit that consists of or includes a management contract or compensatory plan or arrangement. *** Attached as Exhibit 101 to this report are the following documents formatted in XBRL (Extensible Business
Reporting Language): (i) Consolidated Balance Sheets as of December 31, 2016 and 2015, (ii) Consolidated Statements of Comprehensive Income (Loss) for the years ended December 31, 2016, 2015 and 2014, (iii) Consolidated Statements of Stockholders’ Equity for the years ended December 31, 2016, 2015 and 2014, (iv) Consolidated Statements of Cash Flows for the years ended December 31, 2016, 2015 and 2014, and (v) Notes to Consolidated Financial Statements.
ITEM 16. FORM 10-K SUMMARY
None

50
SIGNATURES
Pursuant to the requirements of Section 13 or 15(d) of the Securities Exchange Act of 1934, the registrant has duly caused this report to be signed on its behalf by the undersigned; thereunto duly authorized on March 16, 2017.
TELETECH HOLDINGS, INC. By: /s/ KENNETH D. TUCHMAN Chief Executive Officer Pursuant to the requirements of the Securities Exchange Act of 1934, this report has been signed below on March 16, 2017, by the following persons on behalf of the registrant and in the capacities indicated:
Signature Title
/s/ KENNETH D. TUCHMAN PRINCIPAL EXECUTIVE OFFICER Kenneth D. Tuchman Chief Executive Officer and Chairman of the Board
/s/ REGINA M. PAOLILLO PRINCIPAL FINANCIAL AND ACCOUNTING OFFICER Regina M. Paolillo Chief Financial Officer
* DIRECTOR
Steven J. Annen * DIRECTOR
Tracy L. Bahl * DIRECTOR
Gregory A. Conley * DIRECTOR
Robert Frerichs * DIRECTOR
Marc L. Holtzman * DIRECTOR
Shrikant Mehta * By /s/ Regina M. Paolillo under Power of Attorney as attached hereto as Exhibit 24.1

F-1
INDEX TO THE CONSOLIDATED FINANCIAL STATEMENTS OF TELETECH HOLDINGS, INC.
Page No. Report of Independent Registered Public Accounting Firm F-2 Consolidated Balance Sheets as of December 31, 2016 and 2015 F-4 Consolidated Statements of Comprehensive Income (Loss) for the Years Ended December 31, 2016,
2015 and 2014 F-5 Consolidated Statements of Stockholders’ Equity for the Years Ended December 31, 2016, 2015
and 2014 F-6 Consolidated Statements of Cash Flows for the Years Ended December 31, 2016, 2015 and 2014 F-7 Notes to the Consolidated Financial Statements F-8

F-2
Report of Independent Registered Public Accounting Firm
To the Stockholders and Board of Directors of TeleTech Holdings, Inc. In our opinion, the accompanying consolidated balance sheets and the related consolidated statements of comprehensive income (loss), of stockholders’ equity and of cash flows present fairly, in all material respects, the financial position of TeleTech Holdings, Inc. and its subsidiaries at December 31, 2016 and 2015, and the results of their operations and their cash flows for each of the three years in the period ended December 31, 2016, in conformity with accounting principles generally accepted in the United States of America. Also in our opinion, the Company did not maintain, in all material respects, effective internal control over financial reporting as of December 31, 2016, based on criteria established in Internal Control - Integrated Framework (2013) issued by the Committee of Sponsoring Organizations of the Treadway Commission (COSO) because material weaknesses in internal control over financial reporting existed as of that date related to (i) an ineffective control environment, as the Company did not have a sufficient complement of qualified personnel commensurate with the Company’s financial reporting requirements. This material weakness contributed to material weaknesses related to (ii) ineffective controls over the accurate and timely recognition of revenue and (iii) ineffective design and execution of controls over the review of cash flow forecasts used in the accounting for long-lived asset recoverability and goodwill impairment analyses. A material weakness is a deficiency, or a combination of deficiencies, in internal control over financial reporting, such that there is a reasonable possibility that a material misstatement of the annual or interim financial statements will not be prevented or detected on a timely basis. The material weaknesses referred to above are described in Management's Report on Internal Control over Financial Reporting appearing under Item 9A. We considered these material weaknesses in determining the nature, timing, and extent of audit tests applied in our audit of the 2016 consolidated financial statements, and our opinion regarding the effectiveness of the Company’s internal control over financial reporting does not affect our opinion on those consolidated financial statements. The Company's management is responsible for these financial statements, for maintaining effective internal control over financial reporting and for its assessment of the effectiveness of internal control over financial reporting included in management's report referred to above. Our responsibility is to express opinions on these financial statements and on the Company's internal control over financial reporting based on our integrated audits. We conducted our audits in accordance with the standards of the Public Company Accounting Oversight Board (United States). Those standards require that we plan and perform the audits to obtain reasonable assurance about whether the financial statements are free of material misstatement and whether effective internal control over financial reporting was maintained in all material respects. Our audits of the financial statements included examining, on a test basis, evidence supporting the amounts and disclosures in the financial statements, assessing the accounting principles used and significant estimates made by management, and evaluating the overall financial statement presentation. Our audit of internal control over financial reporting included obtaining an understanding of internal control over financial reporting, assessing the risk that a material weakness exists, and testing and evaluating the design and operating effectiveness of internal control based on the assessed risk. Our audits also included performing such other procedures as we considered necessary in the circumstances. We believe that our audits provide a reasonable basis for our opinions. A company’s internal control over financial reporting is a process designed to provide reasonable assurance regarding the reliability of financial reporting and the preparation of financial statements for external purposes in accordance with generally accepted accounting principles. A company’s internal control over financial reporting includes those policies and procedures that (i) pertain to the maintenance of records that, in reasonable detail, accurately and fairly reflect the transactions and dispositions of the assets of the company; (ii) provide reasonable assurance that transactions are recorded as necessary to permit preparation of financial statements in accordance with generally accepted accounting principles, and that receipts and expenditures of the company are being made only in accordance with authorizations of management and directors of the company; and (iii) provide reasonable assurance regarding prevention or timely detection of unauthorized acquisition, use, or disposition of the company’s assets that could have a material effect on the financial statements.

F-3
Because of its inherent limitations, internal control over financial reporting may not prevent or detect misstatements. Also, projections of any evaluation of effectiveness to future periods are subject to the risk that controls may become inadequate because of changes in conditions, or that the degree of compliance with the policies or procedures may deteriorate. As described in Management’s Report on Internal Control over Financial Reporting, management has excluded Atelka Enterprises, Inc. (“Atelka”) from its assessment of internal control over financial reporting as of December 31, 2016, because it was acquired by the Company in a purchase business combination during 2016. We have also excluded Atelka from our audit of internal control over financial reporting. Altelka is a wholly-owned subsidiary whose total assets and total revenues represent 6.7% and 0.8%, respectively, of the related consolidated financial statement amounts as of and for the year ended December 31, 2016. /s/ PricewaterhouseCoopers LLP Denver, Colorado March 16, 2017

F-4
TELETECH HOLDINGS, INC. AND SUBSIDIARIES Consolidated Balance Sheets
(Amounts in thousands, except share amounts)
December 31, December 31, 2016 2015 ASSETS
Current assets Cash and cash equivalents $ 55,264 $ 60,304 Accounts receivable, net 300,808 283,474 Prepaids and other current assets 59,905 64,180 Income tax receivable 7,035 7,114 Assets held for sale 10,715 —
Total current assets 433,727 415,072
Long-term assets Property, plant and equipment, net 151,037 168,289 Goodwill 129,648 114,183 Deferred tax assets, net 53,585 52,082 Other intangible assets, net 30,787 51,215 Other long-term assets 47,520 42,486
Total long-term assets 412,577 428,255 Total assets $ 846,304 $ 843,327
LIABILITIES AND STOCKHOLDERS’ EQUITY Current liabilities
Accounts payable $ 38,197 $ 43,323 Accrued employee compensation and benefits 66,133 71,634 Other accrued expenses 14,830 33,160 Income tax payable 7,040 9,125 Deferred tax liabilities, net — — Deferred revenue 23,318 26,184 Other current liabilities 29,154 23,480 Liabilities held for sale 1,357 —
Total current liabilities 180,029 206,906
Long-term liabilities Line of credit 217,300 100,000 Deferred tax liabilities, net 160 3,333 Deferred rent 15,256 11,791 Other long-term liabilities 71,664 76,349
Total long-term liabilities 304,380 191,473 Total liabilities 484,409 398,379
Commitments and contingencies (Note 14)
Mandatorily redeemable noncontrolling interest — 4,131 Stockholders’ equity
Preferred stock; $0.01 par value; 10,000,000 shares authorized; zero shares outstanding as of December 31, 2016 and December 31, 2015 — — Common stock; $0.01 par value; 150,000,000 shares authorized; 46,113,693 and 48,481,323 shares outstanding as of December 31, 2016 and December 31, 2015, respectively 462 485 Additional paid-in capital 348,739 347,251 Treasury stock at cost: 35,938,560 and 33,570,930 shares as of December 31, 2016 and December 31, 2015, respectively (603,262) (533,744) Accumulated other comprehensive income (loss) (126,964) (101,365) Retained earnings 735,939 720,989 Noncontrolling interest 6,981 7,201
Total stockholders’ equity 361,895 440,817 Total liabilities and stockholders’ equity $ 846,304 $ 843,327
The accompanying notes are an integral part of these consolidated financial statements.
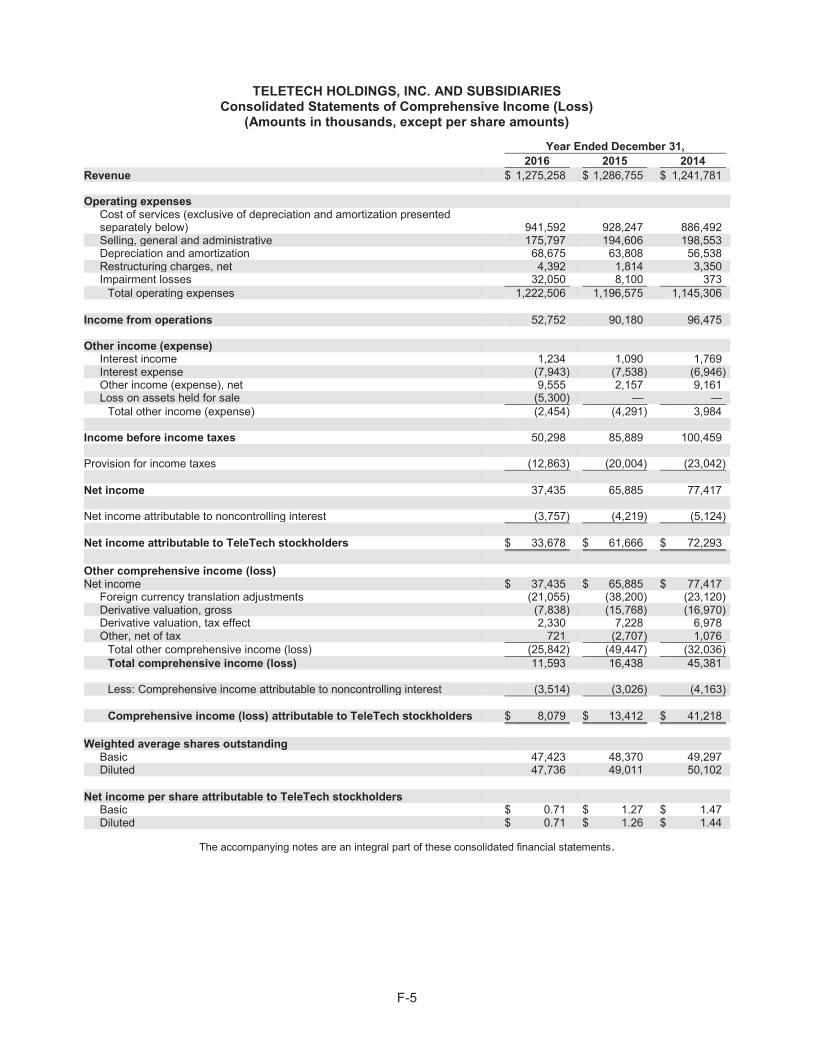
F-5
TELETECH HOLDINGS, INC. AND SUBSIDIARIES Consolidated Statements of Comprehensive Income (Loss)
(Amounts in thousands, except per share amounts) Year Ended December 31, 2016 2015 2014 Revenue $ 1,275,258 $ 1,286,755 $ 1,241,781 Operating expenses
Cost of services (exclusive of depreciation and amortization presented separately below) 941,592 928,247 886,492 Selling, general and administrative 175,797 194,606 198,553 Depreciation and amortization 68,675 63,808 56,538 Restructuring charges, net 4,392 1,814 3,350 Impairment losses 32,050 8,100 373
Total operating expenses 1,222,506 1,196,575 1,145,306 Income from operations 52,752 90,180 96,475 Other income (expense)
Interest income 1,234 1,090 1,769 Interest expense (7,943) (7,538) (6,946) Other income (expense), net 9,555 2,157 9,161 Loss on assets held for sale (5,300) — —
Total other income (expense) (2,454) (4,291) 3,984 Income before income taxes 50,298 85,889 100,459 Provision for income taxes (12,863) (20,004) (23,042) Net income 37,435 65,885 77,417 Net income attributable to noncontrolling interest (3,757) (4,219) (5,124) Net income attributable to TeleTech stockholders $ 33,678 $ 61,666 $ 72,293 Other comprehensive income (loss) Net income $ 37,435 $ 65,885 $ 77,417
Foreign currency translation adjustments (21,055) (38,200) (23,120) Derivative valuation, gross (7,838) (15,768) (16,970) Derivative valuation, tax effect 2,330 7,228 6,978 Other, net of tax 721 (2,707) 1,076
Total other comprehensive income (loss) (25,842) (49,447) (32,036) Total comprehensive income (loss) 11,593 16,438 45,381
Less: Comprehensive income attributable to noncontrolling interest (3,514) (3,026) (4,163)
Comprehensive income (loss) attributable to TeleTech stockholders $ 8,079 $ 13,412 $ 41,218
Weighted average shares outstanding
Basic 47,423 48,370 49,297 Diluted 47,736 49,011 50,102
Net income per share attributable to TeleTech stockholders
Basic $ 0.71 $ 1.27 $ 1.47 Diluted $ 0.71 $ 1.26 $ 1.44
The accompanying notes are an integral part of these consolidated financial statements.

F-6
TELETECH HOLDINGS, INC. AND SUBSIDIARIES Consolidated Statements of Stockholders’ Equity
(Amounts in thousands)
Stockholders’ Equity of the Company
Accumulated
Other Preferred Stock Common Stock Treasury Additional Comprehensive Retained Noncontrolling Shares Amount Shares Amount Stock Paid-in Capital Income (Loss) Earnings interest Total Equity Balance as of December 31, 2013 — $ — 50,353 $ 503 $ (477,399) $ 356,381 $ (20,586) $ 606,502 $ 8,081 $ 473,482
Net income — — — — — — — 72,293 4,512 76,805 Dividends distributed to noncontrolling interest — — — — — — — — (4,275) (4,275) Adjustments to redemption value of mandatorily redeemable noncontrolling interest — — — — — — — (936) — (936) Foreign currency translation adjustments — — — — — — (22,771) — (349) (23,120) Derivatives valuation, net of tax — — — — — — (9,993) — — (9,993) Vesting of restricted stock units — — 396 4 5,979 (11,362) — — — (5,379) Exercise of stock options — — 58 1 876 (434) — — — 443 Excess tax benefit from equity-based awards — — — — — 1,015 — — — 1,015 Equity-based compensation expense — — — — — 11,192 — — 14 11,206 Purchases of common stock — — (2,354) (23) (57,051) — — — — (57,074) Other, net of tax — — — — — — 1,076 — — 1,076
Balance as of December 31, 2014 — $ — 48,453 $ 485 $ (527,595) $ 356,792 $ (52,274) $ 677,859 $ 7,983 $ 463,250 Net income — — — — — — — 61,666 3,382 65,048 Dividends to shareholders ($0.36 per common share) — — — — — — — (17,423) — (17,423) Dividends distributed to noncontrolling interest — — — — — — — — (3,960) (3,960) Adjustments to redemption value of mandatorily redeemable noncontrolling interest — — — — — — — (1,113) — (1,113) Foreign currency translation adjustments — — — — — — (37,844) — (356) (38,200) Derivatives valuation, net of tax — — — — — — (8,540) — — (8,540) Vesting of restricted stock units — — 372 4 5,768 (10,016) — — — (4,244) Exercise of stock options — — 342 3 5,307 (9,737) — — — (4,427) Excess tax benefit from equity-based awards — — — — — (823) — — — (823) Equity-based compensation expense — — — — — 11,035 — — 152 11,187 Purchases of common stock — — (686) (7) (17,224) — — — — (17,231) Other, net of tax — — — — — — (2,707) — — (2,707)
Balance as of December 31, 2015 — $ — 48,481 $ 485 $ (533,744) $ 347,251 $ (101,365) $ 720,989 $ 7,201 $ 440,817 Net income — — — — — — — 33,678 3,757 37,435 Dividends to shareholders ($0.385 per common share) — — — — — — — (18,262) — (18,262) Dividends distributed to noncontrolling interest — — — — — — — — (3,825) (3,825) Adjustments to redemption value of mandatorily redeemable noncontrolling interest — — — — — — — (466) — (466) Foreign currency translation adjustments — — — — — — (20,812) — (243) (21,055) Derivatives valuation, net of tax — — — — — — (5,508) — — (5,508) Vesting of restricted stock units — — 297 3 4,681 (8,614) — — — (3,930) Exercise of stock options — — 29 — 458 (82) — — — 376 Excess tax benefit from equity-based awards — — — — — 557 — — — 557 Equity-based compensation expense — — — — — 9,627 — — 81 9,708 Purchases of common stock — — (2,693) (26) (74,657) — — — — (74,683) Other, net of tax — — — — — — 721 — 10 731
Balance as of December 31, 2016 — $ — 46,114 $ 462 $ (603,262) $ 348,739 $ (126,964) $ 735,939 $ 6,981 $ 361,895
The accompanying notes are an integral part of these consolidated financial statements.

F-7
TELETECH HOLDINGS, INC. AND SUBSIDIARIES Consolidated Statements of Cash Flows
(Amounts in thousands)
Year Ended December 31, 2016 2015 2014 Cash flows from operating activities
Net income $ 37,435 $ 65,885 $ 77,417 Adjustments to reconcile net income to net cash provided by operating activities:
Depreciation and amortization 68,675 63,808 56,538 Amortization of contract acquisition costs 659 900 856 Amortization of debt issuance costs 753 712 705 Imputed interest expense and fair value adjustments to contingent consideration (4,523) 716 (6,233) Provision for doubtful accounts 1,164 1,465 633 (Gain) loss on disposal of assets (44) (166) 141 Impairment losses 32,050 8,100 373 Loss on held for sale assets 5,300 — — Deferred income taxes (1,583) 9,317 9,514 Excess tax benefit from equity-based awards (601) (662) (1,399) Equity-based compensation expense 9,773 11,304 11,307 (Gain) loss on foreign currency derivatives 1,710 (1,469) (1,548) Changes in assets and liabilities, net of acquisitions:
Accounts receivable (7,858) (19,867) (41,005) Prepaids and other assets (92) (5,379) (5,300) Accounts payable and accrued expenses (23,074) 11,941 (8,115) Deferred revenue and other liabilities (11,847) (12,855) 206
Net cash provided by operating activities 107,897 133,750 94,090
Cash flows from investing activities Proceeds from sale of long-lived assets 114 202 135 Purchases of property, plant and equipment, net of acquisitions (50,832) (66,595) (67,641) Investments in non-marketable equity investments (3,179) (9,000) — Acquisitions, net of cash acquired of $2,655, zero, and $3,525, respectively (46,460) (1,776) (24,416)
Net cash used in investing activities (100,357) (77,169) (91,922)
Cash flows from financing activities Proceeds from line of credit 2,093,500 2,262,350 2,077,400 Payments on line of credit (1,976,200) (2,262,350) (2,077,400) Payments on other debt (3,222) (3,222) (4,504) Payments of contingent consideration and hold-back payments to acquisitions (9,467) (11,883) (8,547) Dividends paid to shareholders (18,262) (17,423) — Payments to noncontrolling interest (4,317) (4,593) (5,962) Purchase of mandatorily redeemable noncontrolling interest (4,105) — — Proceeds from exercise of stock options 371 825 443 Excess tax benefit from equity-based awards 601 662 1,399 Payments of debt issuance costs (1,888) (35) — Purchase of treasury stock (74,683) (17,231) (57,074)
Net cash provided by (used in) financing activities 2,328 (52,900) (74,245)
Effect of exchange rate changes on cash and cash equivalents (14,908) (20,693) (8,624) Decrease in cash and cash equivalents (5,040) (17,012) (80,701) Cash and cash equivalents, beginning of period 60,304 77,316 158,017 Cash and cash equivalents, end of period $ 55,264 $ 60,304 $ 77,316 Supplemental disclosures
Cash paid for interest $ 6,976 $ 6,052 $ 5,404 Cash paid for income taxes $ 19,741 $ 15,178 $ 14,545
Non-cash investing and financing activities Acquisition of long-lived assets through capital leases $ 584 $ 10,492 696 Acquisition of equipment through increase in accounts payable, net $ (681) $ 386 $ 4,170 Contract acquisition costs credited to accounts receivable $ 206 $ 1,055 471
The accompanying notes are an integral part of these consolidated financial statements.

TELETECH HOLDINGS, INC. AND SUBSIDIARIES Notes to the Consolidated Financial Statements
F-8
(1) OVERVIEW AND SUMMARY OF SIGNIFICANT ACCOUNTING POLICIES
Overview
TeleTech Holdings, Inc. and its subsidiaries (“TeleTech” or the “Company”) is a leading global provider of technology enabled customer experience services. The Company helps leading brands improve customer experiences and operational effectiveness through a unique combination of technological innovation and operational expertise. The Company’s portfolio of solutions includes consulting, technology, operations and analytics to enable a seamless customer experience across every interaction channel and phase of the customer lifecycle. TeleTech’s 48,000 employees serve clients in the automotive, communication, financial services, government, healthcare, logistics, media and entertainment, retail, technology, transportation and travel industries via operations in the U.S., Australia, Belgium, Brazil, Bulgaria, Canada, China, Costa Rica, Germany, Hong Kong, Ireland, Lebanon, Macedonia, Mexico, New Zealand, the Philippines, Poland, Singapore, South Africa, Thailand, Turkey, the United Arab Emirates, and the United Kingdom.
Basis of Presentation
The Consolidated Financial Statements are comprised of the accounts of TeleTech, its wholly owned subsidiaries, its 55% equity owned subsidiary Percepta, LLC, and its 100% interest in iKnowtion, LLC effective January 2016, (see Note 16). All intercompany balances and transactions have been eliminated in consolidation.
During the three months ended March 31, 2016, the Company recorded an additional tax expense of $1.1 million that should have been recorded in prior periods related to operations by an entity outside its country of incorporation. The total amount of $1.1 million should have been recorded as additional expense in the amount of $180 thousand in 2011, $123 thousand in 2012, $137 thousand in 2013, $358 thousand in 2014 and $301 thousand in 2015.
During the three months ended June 30, 2015, the Company recorded an additional expense of $1.75 million as an additional estimated tax liability that should have been recorded in prior periods related to ongoing discussions with relevant government authorities related to site compliance with tax advantaged status. The total amount of $1.75 million should have been recorded as additional tax expense in the amount of $466 thousand in 2012, $406 thousand in 2013, $645 thousand in 2014 and $234 thousand in the first quarter of 2015.
During the three months ended June 30, 2015, the Company recorded an additional $3.2 million loss related to foreign currency translation within Other comprehensive income (loss) that should have been recorded in 2014 and the three months ended March 31, 2015 to correct for an error in translating the financial results of Sofica Group AD, which the Company acquired on February 28, 2014. Of the $3.2 million recorded, approximately $1.7 million and $1.5 million should have been recorded in the year ended December 31, 2014, and the three months ended March 31, 2015, respectively. The Company also recorded an additional $2.7 million loss to Other, net of tax within Other comprehensive income (loss) in the three months ended March 31, 2015 related to the annual actuarial analysis for the Company’s Philippines pension liability that should have been recorded in the fourth quarter of 2014.
During the three months ended December 31, 2015, the Company recorded an additional $2.9 million impairment to correct for an error in the goodwill impairment annual assessment and quarterly assessment for the WebMetro reporting unit. The Company should have recorded a $2.3 million impairment in the three months ended December 31, 2014 and an additional $0.6 million impairment in the three months ended September 30, 2015.
The Company has evaluated the aggregate impact of these adjustments and concluded that these adjustments were not material to the previously issued or current period Consolidated Financial Statements.

TELETECH HOLDINGS, INC. AND SUBSIDIARIES Notes to the Consolidated Financial Statements
F-9
Use of Estimates
The preparation of the Consolidated Financial Statements in conformity with accounting principles generally accepted in the U.S. (“GAAP”) requires management to make estimates and assumptions in determining the reported amounts of assets and liabilities, disclosure of contingent liabilities at the date of the Consolidated Financial Statements and the reported amounts of revenue and expenses during the reporting period. On an on-going basis, the Company evaluates its estimates including those related to derivatives and hedging activities, income taxes including the valuation allowance for deferred tax assets, self-insurance reserves, litigation reserves, restructuring reserves, allowance for doubtful accounts, contingent consideration, and valuation of goodwill, long-lived and intangible assets. The Company bases its estimates on historical experience and on various other assumptions that are believed to be reasonable, the results of which form the basis for making judgments about the carrying values of assets and liabilities. Actual results may differ materially from these estimates under different assumptions or conditions.
Concentration of Credit Risk
The Company is exposed to credit risk in the normal course of business, primarily related to accounts receivable and derivative instruments. Historically, the losses related to credit risk have been immaterial. The Company regularly monitors its credit risk to mitigate the possibility of current and future exposures resulting in a loss. The Company evaluates the creditworthiness of its clients prior to entering into an agreement to provide services and as necessary through the life of the client relationship. The Company does not believe it is exposed to more than a nominal amount of credit risk in its derivative hedging activities, as the Company diversifies its activities across six well-capitalized, investment-grade financial institutions.
Fair Value of Financial Instruments
Fair values of cash equivalents, accounts receivable and payable and debt approximate the carrying amounts because of their short-term nature.
Cash and Cash Equivalents
The Company considers all cash and highly liquid short-term investments with an original maturity of 90 days or less to be cash equivalents. The Company manages a centralized global treasury function in the United States with a focus on concentrating and safeguarding its global cash and cash equivalents. While the majority of the Company’s cash is held outside the U.S., the Company prefers to hold U.S. Dollars in addition to the local currencies of the foreign subsidiaries. The Company believes that it has effectively mitigated and managed its risk relating to its global cash through its cash management practices, banking partners, and utilization of diversified, high quality investments. However, the Company can provide no assurances that it will not sustain losses.
Accounts Receivable
An allowance for doubtful accounts is determined based on the aging of the Company’s accounts receivable, historical experience, client financial condition, and management judgment. The Company writes off accounts receivable against the allowance when the Company determines a balance is uncollectible.
Derivatives
The Company enters into foreign exchange forward and option contracts to reduce its exposure to foreign currency exchange rate fluctuations that are associated with forecasted revenue earned in foreign locations. The Company also enters into interest rate derivatives which consist of interest rate swaps to reduce the Company’s exposure to interest rate fluctuations associated with its variable rate debt. Upon proper qualification, these contracts are designated as cash flow hedges. The Company formally documents at the inception of the hedge all relationships between hedging instruments and hedged items as well as its risk management objective and strategy for undertaking various hedging activities.

TELETECH HOLDINGS, INC. AND SUBSIDIARIES Notes to the Consolidated Financial Statements
F-10
All derivative financial instruments are reported at fair value and recorded in Prepaids and other current assets, Other assets, Other current liabilities, and Other liabilities in the accompanying Consolidated Balance Sheets as applicable for each period end. Changes in fair value of derivative instruments designated as cash flow hedges are recorded in Accumulated other comprehensive income (loss), a component of Stockholders’ Equity, to the extent they are deemed effective. Ineffectiveness is measured based on the change in fair value of the forward contracts and the fair value of the hypothetical derivatives with terms that match the critical terms of the risk being hedged. Based on the criteria established by current accounting standards, the Company’s cash flow hedge contracts are deemed to be highly effective. Any realized gains or losses resulting from the foreign currency cash flow hedges are recognized together with the hedged transaction within Revenue. Any realized gains or losses from the interest rate swaps are recognized in Interest expense. Gains and losses from the settlements of the Company’s net investment hedges remain in Accumulated other comprehensive income (loss) until partial or complete liquidation of the applicable net investment.
The Company also enters into fair value derivative contracts that hedge against foreign currency exchange gains and losses primarily associated with short-term payables and receivables. Changes in the fair value of derivative instruments designated as fair value hedges affect the carrying value of the asset or liability hedged, with changes in both the derivative instrument and the hedged asset or liability being recognized in Other income (expense), net in the accompanying Consolidated Statements of Comprehensive Income (Loss).
Property, Plant and Equipment
Property, plant and equipment are stated at historical cost less accumulated depreciation and amortization. Maintenance, repairs and minor renewals are expensed as incurred.
Depreciation and amortization are computed on the straight-line method based on the following estimated useful lives:
Building 25 years Computer equipment and software 3 to 7 years Telephone equipment 4 to 7 years Furniture and fixtures 5 years Leasehold improvements Lesser of economic useful life (typically 10 years) or original lease term Other 3 to 7 years
The Company evaluates the carrying value of property, plant and equipment for impairment whenever events or changes in circumstances indicate that the carrying amounts may not be recoverable. An asset is considered to be impaired when the forecasted undiscounted cash flows of an asset group are estimated to be less than its carrying value. The amount of impairment recognized is the difference between the carrying value of the asset group and its fair value. Fair value estimates are based on assumptions concerning the amount and timing of forecasted future cash flows.
Software Development Costs
The Company capitalizes costs incurred to acquire or develop software for internal use. Capitalized software development costs are amortized using the straight-line method over the estimated useful life equal to the lesser of the license term or 4 years. The amortization expense is recorded in Depreciation and amortization in the accompanying Consolidated Statements of Comprehensive Income (Loss).

TELETECH HOLDINGS, INC. AND SUBSIDIARIES Notes to the Consolidated Financial Statements
F-11
Goodwill
The Company evaluates goodwill for possible impairment at least annually on December 1, and whenever events or changes in circumstances indicate that the carrying amount of such assets may not be recoverable. The Company uses a three step process to assess the realizability of goodwill. The first step, Step 0, is a qualitative assessment that analyzes current economic indicators associated with a particular reporting unit. For example, the Company analyzes changes in economic, market and industry conditions, business strategy, cost factors, and financial performance, among others, to determine if there would be a significant decline to the fair value of a particular reporting unit. A qualitative assessment also includes analyzing the excess fair value of a reporting unit over its carrying value from impairment assessments performed in previous years. If the qualitative assessment indicates a stable or improved fair value, no further testing is required.
If a qualitative assessment indicates that a significant decline to fair value of a reporting unit is more likely than not, or if a reporting unit’s fair value has historically been closer to its carrying value, the Company will proceed to Step 1 testing where the Company calculates the fair value of a reporting unit. If Step 1 indicates that the carrying value of a reporting unit is in excess of its fair value, the Company will proceed to Step 2 where the fair value of the reporting unit will be allocated to assets and liabilities as they would in a business combination. Impairment occurs when the carrying amount of goodwill exceeds its estimated fair value calculated in Step 2.
Other Intangible Assets
The Company has other intangible assets that include customer relationships (definite-lived) and trade names (indefinite-lived and definite-lived) and non-compete agreements (definite-lived). Definite-lived intangible assets are amortized on a straight-line basis over their estimated useful lives, which range from three to 12 years. The Company evaluates the carrying value of its definite-lived intangible assets whenever events or changes in circumstances indicate that the carrying amount may not be recoverable. A definite-lived intangible asset is considered to be impaired when the forecasted undiscounted cash flows of its asset group are estimated to be less than its carrying value.
The Company evaluates indefinite-lived intangible assets for possible impairment at least annually or whenever events or changes in circumstances indicate that the carrying amount of such assets may not be recoverable. Similar to goodwill, the Company may first use a qualitative analysis to assess the realizability of its indefinite-lived intangible assets. The qualitative analysis will include a review of changes in economic, market and industry conditions, business strategy, cost factors, and financial performance, among others, to determine if there would be a significant decline to the fair value of an indefinite-lived intangible asset. If a quantitative analysis is completed, an indefinite-lived intangible asset (i.e. trade name) is evaluated for possible impairment by comparing the fair value of the asset with its carrying value. Fair value is estimated as the discounted value of future revenues arising from a trade name using a royalty rate that a market participant would pay for use of that trade name. An impairment charge is recorded if the trade name’s carrying value exceeds its estimated fair value.
Self Insurance Liabilities
The Company self-insures for certain levels of workers’ compensation, employee health, property, errors and omissions, cyber risks, and general liability insurance. The Company records estimated liabilities for these insurance lines based upon analyses of historical claims experience. The most significant assumption the Company makes in estimating these liabilities is that future claims experience will emerge in a similar pattern with historical claims experience. The liabilities related to workers’ compensation and employee health insurance are included in Accrued employee compensation and benefits in the accompanying Consolidated Balance Sheets. The liability for other general liability insurance is included in Other accrued expenses in the accompanying Consolidated Balance Sheets.

TELETECH HOLDINGS, INC. AND SUBSIDIARIES Notes to the Consolidated Financial Statements
F-12
Restructuring Liabilities
The Company routinely assesses the profitability and utilization of its customer engagement centers and existing markets. In some cases, the Company has chosen to close under-performing customer engagement centers and complete reductions in workforce to enhance future profitability. Severance payments that occur from reductions in workforce are in accordance with the Company’s postemployment plans and/or statutory requirements that are communicated to all employees upon hire date; therefore, severance liabilities are recognized when they are determined to be probable and reasonably estimable. Other liabilities for costs associated with an exit or disposal activity are recognized when the liability is incurred, rather than upon commitment to a plan.
Income Taxes
Accounting for income taxes requires recognition of deferred tax assets and liabilities for the expected future income tax consequences of transactions that have been included in the Consolidated Financial Statements or tax returns. Under this method, deferred tax assets and liabilities are determined based on the difference between the financial statement and tax basis of assets and liabilities using enacted tax rates in effect for the year in which the differences are expected to reverse. Gross deferred tax assets may then be reduced by a valuation allowance for amounts that do not satisfy the realization criteria established by current accounting standards.
The Company accounts for uncertain tax positions using a two-step approach to recognizing and measuring uncertain tax positions. The first step is to determine if the weight of available evidence indicates that it is more likely than not that the tax position will be sustained on audit. The second step is to estimate and measure the tax benefit as the amount that has a greater than 50% likelihood of being realized upon ultimate settlement with the tax authority. The Company evaluates these uncertain tax positions on a quarterly basis. This evaluation is based on the consideration of several factors including changes in facts or circumstances, changes in applicable tax law, and settlement of issues under audit. The Company recognizes interest and penalties related to uncertain tax positions as a part of the Provision for income taxes in the accompanying Consolidated Statements of Comprehensive Income (Loss).
The Company provides for U.S. income tax expense on the earnings of foreign subsidiaries unless the subsidiaries’ earnings are considered permanently reinvested outside the U.S.
Equity-Based Compensation Expense
Equity-based compensation expense for all share-based payment awards granted is determined based on the grant-date fair value net of an estimated forfeiture rate on a straight-line basis over the requisite service period of the award, which is typically the vesting term of the share-based payment award. The Company estimates the forfeiture rate annually based on its historical experience of forfeited awards.
Foreign Currency Translation
The assets and liabilities of the Company’s foreign subsidiaries, whose functional currency is not the U.S. Dollar, are translated at the exchange rates in effect on the last day of the period and income and expenses are translated using the monthly average exchange rates in effect for the period in which the items occur. Foreign currency translation gains and losses are recorded in Accumulated other comprehensive income (loss) within Stockholders’ Equity. Foreign currency transaction gains and losses are included in Other income (expense), net in the accompanying Consolidated Statements of Comprehensive Income (Loss).
Revenue Recognition
The Company recognizes revenue when evidence of an arrangement exists, the delivery of service has occurred, the fee is fixed or determinable and collection is reasonably assured. The BPO inbound and outbound service fees are based on either a per minute, per hour, per FTE, per transaction or per call basis. Certain client programs provide for adjustments to monthly billings based upon whether the Company achieves, exceeds or fails certain performance criteria. Adjustments to monthly billings consist of contractual bonuses/penalties, holdbacks and other performance based contingencies. Revenue recognition is limited to the amount that is not contingent upon delivery of future services or meeting other specified performance conditions.

TELETECH HOLDINGS, INC. AND SUBSIDIARIES Notes to the Consolidated Financial Statements
F-13
Revenue also consists of services for agent training, program launch, professional consulting, fully-hosted or managed technology and learning innovation services. These service offerings may contain multiple element arrangements whereby the Company determines if those service offerings represent separate units of accounting. A deliverable constitutes a separate unit of accounting when it has standalone value and delivery or performance of the undelivered item is considered probable and substantially within our control. If those deliverables are determined to be separate units of accounting, revenue is recognized as services are provided. If those deliverables are not determined to be separate units of accounting, revenue for the delivered services are bundled into one unit of accounting and recognized over the life of the arrangement or at the time all services and deliverables have been delivered and satisfied. The Company allocates revenue to each of the deliverables based on a selling price hierarchy of vendor specific objective evidence (“VSOE”), third-party evidence, and then estimated selling price. VSOE is based on the price charged when the deliverable is sold separately. Third-party evidence is based on largely interchangeable competitor services in standalone sales to similarly situated customers. Estimated selling price is based on the Company’s best estimate of what the selling prices of deliverables would be if they were sold regularly on a standalone basis. Estimated selling price is established considering multiple factors including, but not limited to, pricing practices in different geographies, service offerings, and customer classifications. Once the Company allocates revenue to each deliverable, the Company recognizes revenue when all revenue recognition criteria are met.
Deferred Revenue and Costs
The Company records amounts billed and received, but not earned, as deferred revenue. These amounts are recorded in Deferred revenue or as a component of Other long-term liabilities in the accompanying Consolidated Balance Sheets based on the period over which the Company expects to render services.
We defer revenue for initial training that occurs upon commencement of a new contract if that training is billed separately because the training is not considered to provide standalone value from other services. Accordingly, the corresponding training costs, consisting primarily of labor and related expenses, are also deferred. In these circumstances, both the training revenue and costs are amortized straight-line over the life of the contract as a component of Revenue and Cost of services, respectively. In situations where these initial training costs are not billed separately, but rather included in the hourly service rates paid by the client over the life of the contract, no deferral is necessary as the revenue is being recognized over the life of the contract and the associated training costs are expensed as incurred.
Rent Expense
The Company has negotiated certain rent holidays, landlord/tenant incentives and escalations in the base price of rent payments over the initial term of its operating leases. The initial term could include the “build-out” period of leases, where no rent payments are typically due. The Company recognizes rent holidays and rent escalations on a straight-line basis to rent expense over the lease term. The landlord/tenant incentives are recorded as an increase to deferred rent liabilities and amortized on a straight line basis to rent expense over the initial lease term.
Asset Retirement Obligations
Asset retirement obligations relate to legal obligations associated with the retirement of long-lived assets resulting from the acquisition, construction, development and/or normal use of the underlying assets.
The Company records all asset retirement obligations at estimated fair value. The Company’s asset retirement obligations primarily relate to clauses in its customer engagement center operating leases which require the Company to return the leased premises to its original condition. The associated asset retirement obligations are capitalized as part of the carrying amount of the underlying asset and depreciated over the estimated useful life of the asset. The liability, reported within Other long-term liabilities, is accreted through charges to operating expenses. If the asset retirement obligation is settled for an amount other than the carrying amount of the liability, the Company recognizes a gain or loss on settlement.

TELETECH HOLDINGS, INC. AND SUBSIDIARIES Notes to the Consolidated Financial Statements
F-14
Recently Issued Accounting Pronouncements
In May 2014, the FASB issued ASU 2014-09, “Revenue from Contracts with Customers”. ASU 2014-09 provides new guidance related to how an entity should recognize revenue to depict the transfer of promised goods or services to customers in an amount that reflects the consideration to which the entity expects to be entitled in exchange for those goods or services. In addition, ASU 2014-09 specifies new accounting for costs associated with obtaining or fulfilling contracts with customers and expands the required disclosures related to revenue and cash flows from contracts with customers. While ASU-2014-09 was originally effective for fiscal years and interim periods within those years beginning after December 15, 2016, in August 2015, the FASB issued ASU 2015-14, “Deferral of Effective Date”, deferring the effective date by one year, to be effective for fiscal years, and interim periods within those years, beginning after December 15, 2017. Earlier adoption is permitted only as of annual reporting periods beginning after December 15, 2016, including interim reporting periods within that reporting period. ASU 2014-09 can be adopted either retrospectively to each prior reporting period presented or as a cumulative-effect adjustment as of the date of adoption, with early application not permitted. The Company has assigned a project manager and team, has selected an external consulting company to assist through the project, has begun the project assessment phase, and is determining its implementation approach. As the Company has not yet completed the assessment, the Company has not made any conclusions regarding the potential impact to the financials.
In April 2015, the FASB issued ASU No. 2015-03, “Simplifying the Presentation of Debt Issuance Costs”. ASU 2015-03 requires all costs incurred in connection with the issuance of debt to be presented in the balance sheet as a direct deduction from the carrying value of the associated debt liability. This ASU is effective for interim and annual periods beginning on or after December 15, 2015 and early adoption is permitted. Beginning in 2016, the Company has applied the new guidance as applicable and the adoption of this standard did not have a material impact on its financial position, results of operations or related disclosures.
In February 2016, the FASB issued ASU 2016-02 “Leases”, which amends the existing accounting standards for lease accounting, including requiring lessees to recognize most leases on their balance sheets related to the rights and obligations created by those leases and making targeted changes to lessor accounting. The ASU also requires new disclosures to regarding the amounts, timing, and uncertainty of cash flows arising from leases. The ASU is effective for interim and annual periods beginning on or after December 15, 2018 and early adoption is permitted. The new leases standard requires a modified retrospective transition approach for all leases existing at, or entered into after, the date of initial application, with an option to use certain transition relief. The Company is currently assessing the impact on the consolidated financial statements and related disclosures, evaluating software solutions and other tracking methods, and determining the implementation timeline.
In March 2016, the FASB issued ASU 2016-09, “Compensation – Stock Compensation: Improvements to Employee Share-Based Payment Accounting”, which amends the existing accounting standards related to stock-based compensation. The ASU simplifies several aspects of accounting for share-based payment transactions, including the accounting for income taxes, forfeitures, statutory tax withholding requirements, as well as classification in the statement of cash flows. The ASU is effective for interim and annual periods beginning on or after December 15, 2016 and early adoption is permitted. The Company has finalized the implementation which will occur effective January 1, 2017, and is currently assessing the impact on its consolidated statements and related disclosures.
In August 2016, the FASB issued ASU No. 2016-15, “Statement of Cash Flows”. ASU 2016-15 is intended to reduce diversity in practice regarding how certain cash transactions are presented and classified in the Consolidated Statement of Cash Flows by providing guidance on eight specific cash flow issues. The ASU is effective for interim and annual periods beginning on or after December 15, 2017 and early adoption is permitted. The Company is currently assessing the impact on the consolidated statements and related disclosures.

TELETECH HOLDINGS, INC. AND SUBSIDIARIES Notes to the Consolidated Financial Statements
F-15
In January 2017, the FASB issued ASU No. 2017-04, “Intangibles – Goodwill and Other: Simplifying the Accounting for Goodwill Impairment”. ASU 2017-04 removes the need to complete Step 2 of any goodwill impairment test that has failed Step 1. The goodwill impairment will now be calculated as the amount by which a reporting unit’s carrying value exceeds its fair value. The ASU is effective for interim and annual periods beginning on or after December 15, 2019 and early adoption is permitted. The Company has determined it will early adopt this standard in 2017.
(2) ACQUISITIONS AND DIVESTITURES
Atelka
On November 9, 2016, the Company acquired all of the outstanding shares of Atelka Enterprise Inc. (“Atelka”), a Canadian customer contact center management and business process outsourcing services company that serves Canadian telecommunications, logistics, and entertainment clients. This acquisition is an addition to the Customer Management Services (“CMS”) segment. Atelka employs approximately 2,800 in Quebec, Ontario, New Brunswick and Prince Edward Island.
The total purchase price was $48.8 million ($65.2 CAD), subject to certain working capital adjustments, and consisted of $47.5 million in cash at closing and a $1.4 million hold-back payment for contingencies as defined in the sale and purchase agreement, which will be paid out in 12 and 24 months, if required.
The following summarizes the preliminary estimated fair values of the identifiable assets acquired and liabilities assumed as of the acquisition date. (in thousands): Preliminary Estimate of Acquisition Date Fair Value Cash $ 2,655 Accounts receivable, net 18,104 Other assets 616 Property, plant and equipment 3,161 Deferred tax assets, net 583 Customer relationships 10,500 Goodwill 20,876 56,495 Accounts payable 1,199 Accrued employee compensation and benefits 2,413 Accrued expenses 2,418 Other 1,678 7,708
Total purchase price $ 48,787
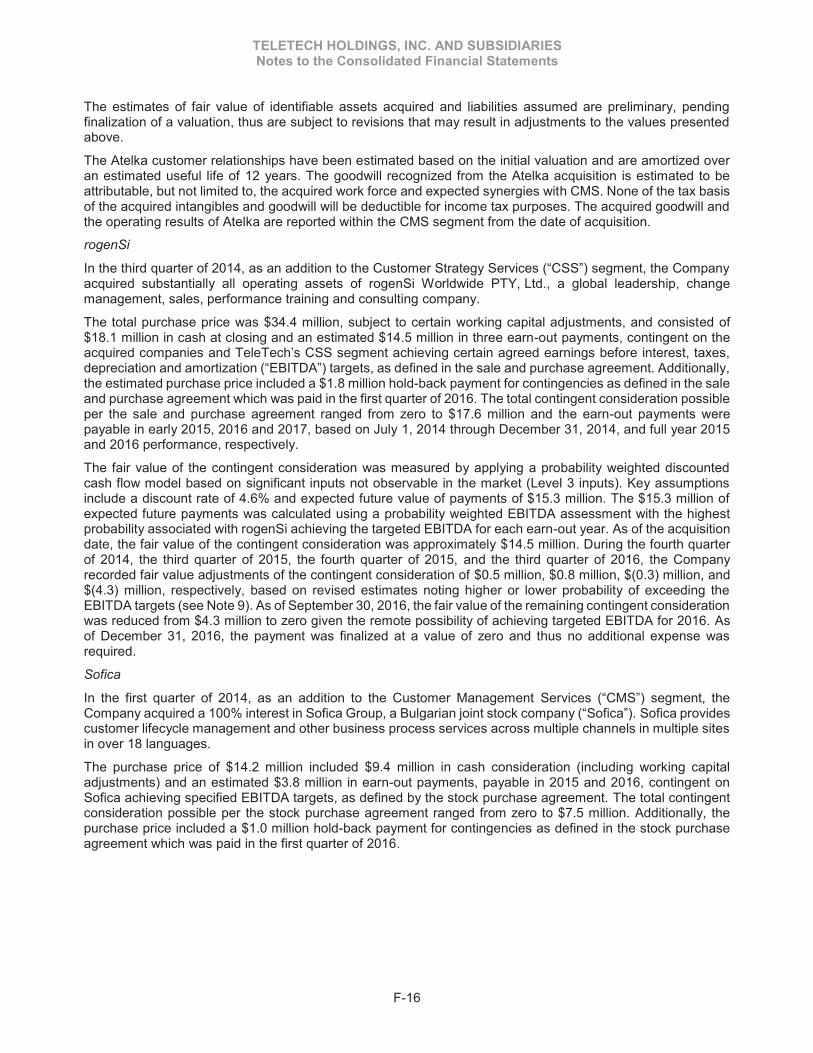
TELETECH HOLDINGS, INC. AND SUBSIDIARIES Notes to the Consolidated Financial Statements
F-16
The estimates of fair value of identifiable assets acquired and liabilities assumed are preliminary, pending finalization of a valuation, thus are subject to revisions that may result in adjustments to the values presented above.
The Atelka customer relationships have been estimated based on the initial valuation and are amortized over an estimated useful life of 12 years. The goodwill recognized from the Atelka acquisition is estimated to be attributable, but not limited to, the acquired work force and expected synergies with CMS. None of the tax basis of the acquired intangibles and goodwill will be deductible for income tax purposes. The acquired goodwill and the operating results of Atelka are reported within the CMS segment from the date of acquisition.
rogenSi
In the third quarter of 2014, as an addition to the Customer Strategy Services (“CSS”) segment, the Company acquired substantially all operating assets of rogenSi Worldwide PTY, Ltd., a global leadership, change management, sales, performance training and consulting company.
The total purchase price was $34.4 million, subject to certain working capital adjustments, and consisted of $18.1 million in cash at closing and an estimated $14.5 million in three earn-out payments, contingent on the acquired companies and TeleTech’s CSS segment achieving certain agreed earnings before interest, taxes, depreciation and amortization (“EBITDA”) targets, as defined in the sale and purchase agreement. Additionally, the estimated purchase price included a $1.8 million hold-back payment for contingencies as defined in the sale and purchase agreement which was paid in the first quarter of 2016. The total contingent consideration possible per the sale and purchase agreement ranged from zero to $17.6 million and the earn-out payments were payable in early 2015, 2016 and 2017, based on July 1, 2014 through December 31, 2014, and full year 2015 and 2016 performance, respectively.
The fair value of the contingent consideration was measured by applying a probability weighted discounted cash flow model based on significant inputs not observable in the market (Level 3 inputs). Key assumptions include a discount rate of 4.6% and expected future value of payments of $15.3 million. The $15.3 million of expected future payments was calculated using a probability weighted EBITDA assessment with the highest probability associated with rogenSi achieving the targeted EBITDA for each earn-out year. As of the acquisition date, the fair value of the contingent consideration was approximately $14.5 million. During the fourth quarter of 2014, the third quarter of 2015, the fourth quarter of 2015, and the third quarter of 2016, the Company recorded fair value adjustments of the contingent consideration of $0.5 million, $0.8 million, $(0.3) million, and $(4.3) million, respectively, based on revised estimates noting higher or lower probability of exceeding the EBITDA targets (see Note 9). As of September 30, 2016, the fair value of the remaining contingent consideration was reduced from $4.3 million to zero given the remote possibility of achieving targeted EBITDA for 2016. As of December 31, 2016, the payment was finalized at a value of zero and thus no additional expense was required.
Sofica
In the first quarter of 2014, as an addition to the Customer Management Services (“CMS”) segment, the Company acquired a 100% interest in Sofica Group, a Bulgarian joint stock company (“Sofica”). Sofica provides customer lifecycle management and other business process services across multiple channels in multiple sites in over 18 languages.
The purchase price of $14.2 million included $9.4 million in cash consideration (including working capital adjustments) and an estimated $3.8 million in earn-out payments, payable in 2015 and 2016, contingent on Sofica achieving specified EBITDA targets, as defined by the stock purchase agreement. The total contingent consideration possible per the stock purchase agreement ranged from zero to $7.5 million. Additionally, the purchase price included a $1.0 million hold-back payment for contingencies as defined in the stock purchase agreement which was paid in the first quarter of 2016.
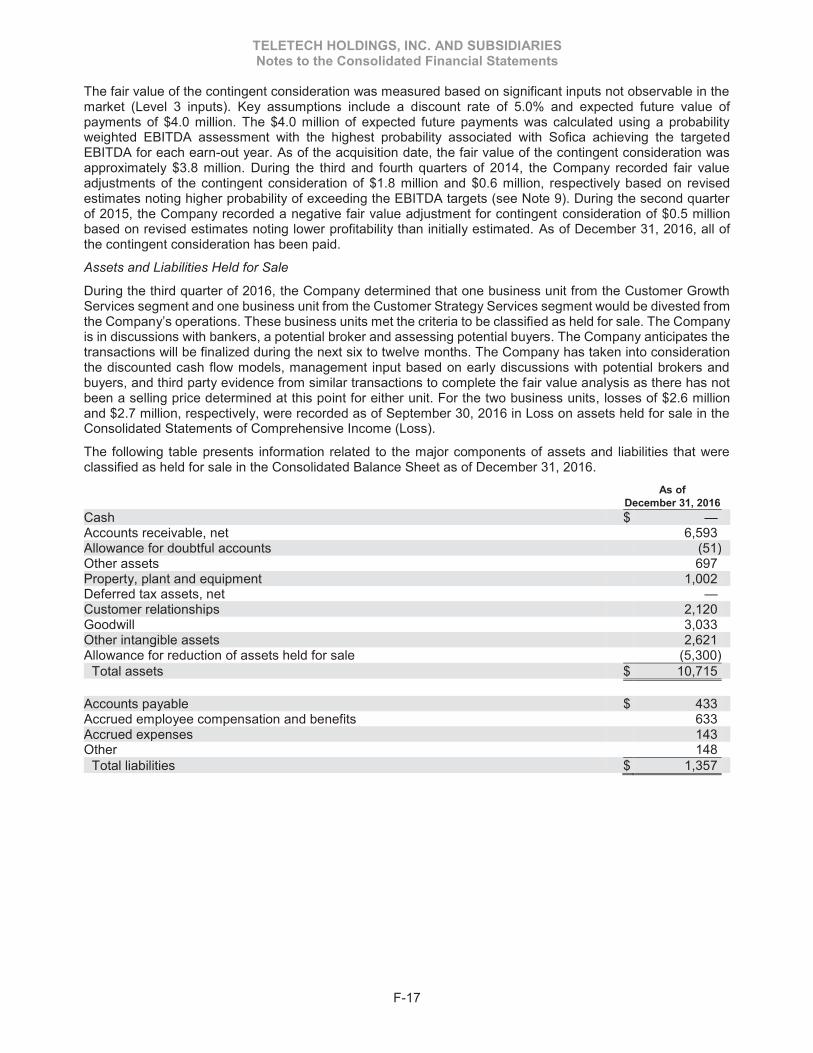
TELETECH HOLDINGS, INC. AND SUBSIDIARIES Notes to the Consolidated Financial Statements
F-17
The fair value of the contingent consideration was measured based on significant inputs not observable in the market (Level 3 inputs). Key assumptions include a discount rate of 5.0% and expected future value of payments of $4.0 million. The $4.0 million of expected future payments was calculated using a probability weighted EBITDA assessment with the highest probability associated with Sofica achieving the targeted EBITDA for each earn-out year. As of the acquisition date, the fair value of the contingent consideration was approximately $3.8 million. During the third and fourth quarters of 2014, the Company recorded fair value adjustments of the contingent consideration of $1.8 million and $0.6 million, respectively based on revised estimates noting higher probability of exceeding the EBITDA targets (see Note 9). During the second quarter of 2015, the Company recorded a negative fair value adjustment for contingent consideration of $0.5 million based on revised estimates noting lower profitability than initially estimated. As of December 31, 2016, all of the contingent consideration has been paid.
Assets and Liabilities Held for Sale
During the third quarter of 2016, the Company determined that one business unit from the Customer Growth Services segment and one business unit from the Customer Strategy Services segment would be divested from the Company’s operations. These business units met the criteria to be classified as held for sale. The Company is in discussions with bankers, a potential broker and assessing potential buyers. The Company anticipates the transactions will be finalized during the next six to twelve months. The Company has taken into consideration the discounted cash flow models, management input based on early discussions with potential brokers and buyers, and third party evidence from similar transactions to complete the fair value analysis as there has not been a selling price determined at this point for either unit. For the two business units, losses of $2.6 million and $2.7 million, respectively, were recorded as of September 30, 2016 in Loss on assets held for sale in the Consolidated Statements of Comprehensive Income (Loss).
The following table presents information related to the major components of assets and liabilities that were classified as held for sale in the Consolidated Balance Sheet as of December 31, 2016.
As of December 31, 2016 Cash $ — Accounts receivable, net 6,593 Allowance for doubtful accounts (51) Other assets 697 Property, plant and equipment 1,002 Deferred tax assets, net — Customer relationships 2,120 Goodwill 3,033 Other intangible assets 2,621 Allowance for reduction of assets held for sale (5,300)
Total assets $ 10,715 Accounts payable $ 433 Accrued employee compensation and benefits 633 Accrued expenses 143 Other 148
Total liabilities $ 1,357

TELETECH HOLDINGS, INC. AND SUBSIDIARIES Notes to the Consolidated Financial Statements
F-18
Investments
CaféX
In the first quarter of 2015, the Company invested $9.0 million in CafeX Communications, Inc. (“CaféX”) through the purchase of a portion of the Series B Preferred Stock of CaféX. CaféX is a provider of omni-channel web-based real time communication (WebRTC) solutions that enhance mobile applications and websites with in-app video communication and screen share technology to increase customer satisfaction and enterprise efficiency. TeleTech anticipates deploying the CaféX technology as part of the TeleTech customer experience offerings within the CMS business segment and as part of its Humanify platform. At December 31, 2015, the Company owned 17.2% of the total equity of CaféX. During the fourth quarter of 2016, the Company invested an additional $4.3 million to purchase a portion of the Series C Preferred Stock; $3.2 million was paid in the fourth quarter of 2016 and $1.1 million was paid in the first quarter of 2017. At December 31, 2016, the Company owns 17.0% of the total equity of CaféX. The investment is accounted for under the cost method of accounting. The Company evaluates its investments for possible other-than-temporary impairment at least annually or whenever events or changes in circumstances indicate that the carrying amount of such assets may not be recoverable. The Company tested the investment in CaféX for impairment and concluded that the investment was not impaired at December 31, 2016 or December 31, 2015.
(3) SEGMENT INFORMATION
The Company reports the following four segments:
• the CMS segment includes the customer experience delivery solutions which integrate innovative technology with highly-trained customer experience professionals to optimize the customer experience across all channels and all stages of the customer lifecycle from an onshore, offshore or work-from-home environment;
• the CGS segment provides technology-enabled sales and marketing solutions that support revenue generation across the customer lifecycle, including sales advisory, search engine optimization, digital demand generation, lead qualification, and acquisition sales, growth and retention services;
• the CTS segment includes system design consulting, customer experience technology product, implementation and integration consulting services, and management of clients’ cloud and on-premise solutions; and
• the CSS segment provides professional services in customer experience strategy and operations, insights, system and operational process optimization, and culture development and knowledge management.
The Company allocates to each segment its portion of corporate operating expenses. All intercompany transactions between the reported segments for the periods presented have been eliminated.
The following tables present certain financial data by segment (in thousands): Year Ended December 31, 2016 Depreciation Gross Intersegment Net & Income from Revenue Sales Revenue Amortization Operations Customer Management Services $ 924,654 $ (329) $ 924,325 $ 48,770 $ 50,541 Customer Growth Services 141,005 — 141,005 5,905 6,969 Customer Technology Services 141,865 (611) 141,254 10,645 933 Customer Strategy Services 68,674 — 68,674 3,355 (5,691)
Total $ 1,276,198 $ (940) $ 1,275,258 $ 68,675 $ 52,752

TELETECH HOLDINGS, INC. AND SUBSIDIARIES Notes to the Consolidated Financial Statements
F-19
Year Ended December 31, 2015 Depreciation Gross Intersegment Net & Income from Revenue Sales Revenue Amortization Operations Customer Management Services $ 913,272 $ — $ 913,272 $ 44,633 $ 58,018 Customer Growth Services 129,021 — 129,021 6,065 3,077 Customer Technology Services 157,838 (232) 157,606 9,775 13,339 Customer Strategy Services 86,856 — 86,856 3,335 15,746
Total $ 1,286,987 $ (232) $ 1,286,755 $ 63,808 $ 90,180 Year Ended December 31, 2014 Depreciation Gross Intersegment Net & Income from Revenue Sales Revenue Amortization Operations Customer Management Services $ 923,497 $ — $ 923,497 $ 40,577 $ 76,792 Customer Growth Services 115,434 — 115,434 6,048 7,255 Customer Technology Services 139,218 (36) 139,182 7,489 4,519 Customer Strategy Services 63,668 — 63,668 2,424 7,909
Total $ 1,241,817 $ (36) $ 1,241,781 $ 56,538 $ 96,475
For the Year Ended December 31,
2016 2015
2014
Capital Expenditures Customer Management Services $ 40,321 $ 56,570 $ 49,630 Customer Growth Services 4,185 4,681 3,195 Customer Technology Services 5,217 4,216 14,423 Customer Strategy Services 1,109 1,128 393
Total $ 50,832 $ 66,595 $ 67,641
December 31, 2016 2015 2014 Total Assets
Customer Management Services $ 585,679 $ 525,470 $ 528,705 Customer Growth Services 71,540 75,291 88,394 Customer Technology Services 115,537 146,480 145,693 Customer Strategy Services 73,548 96,086 89,683
Total $ 846,304 $ 843,327 $ 852,475 December 31, 2016 2015 2014 Goodwill
Customer Management Services $ 42,589 $ 23,218 $ 27,080 Customer Growth Services 24,439 24,439 30,395 Customer Technology Services 41,500 41,500 41,500 Customer Strategy Services 21,120 25,026 29,730
Total $ 129,648 $ 114,183 $ 128,705

TELETECH HOLDINGS, INC. AND SUBSIDIARIES Notes to the Consolidated Financial Statements
F-20
The following tables present certain financial data based upon the geographic location where the services are provided (in thousands): As of and for the Year Ended December 31, 2016 2015 2014 Revenue United States $ 693,023 $ 679,959 $ 603,297 Philippines 351,853 343,013 348,339 Latin America 122,347 147,267 172,270 Europe / Middle East / Africa 65,866 78,182 83,944 Asia Pacific 28,219 32,554 28,294 Canada 13,950 5,780 5,637
Total $ 1,275,258 $ 1,286,755 $ 1,241,781 Property, plant and equipment, gross United States $ 441,222 $ 415,918 $ 382,508 Philippines 133,214 140,712 119,482 Latin America 50,605 49,464 67,193 Europe / Middle East / Africa 8,805 14,567 13,367 Asia Pacific 23,484 23,181 26,502 Canada 19,988 16,239 19,299
Total $ 677,318 $ 660,081 $ 628,351 Other long-term assets United States $ 36,442 $ 34,007 $ 27,728 Philippines 8,194 5,220 5,202 Latin America 1,161 1,161 1,456 Europe / Middle East / Africa 1,099 811 692 Asia Pacific 110 165 1,309 Canada 514 1,122 271
Total $ 47,520 $ 42,486 $ 36,658
(4) ACCOUNTS RECEIVABLE AND SIGNIFICANT CLIENTS
Accounts receivable, net in the accompanying Consolidated Balance Sheets consists of the following (in thousands): December 31, 2016 2015 Accounts receivable $ 301,470 $ 285,650 Less: Allowance for doubtful accounts (662) (2,176)
Accounts receivable, net $ 300,808 $ 283,474 Activity in the Company’s Allowance for doubtful accounts consists of the following (in thousands): December 31, 2016 2015 2014 Balance, beginning of year $ 2,176 $ 3,425 $ 3,815
Provision for doubtful accounts 1,164 1,465 633 Uncollectible receivables written-off (2,670) (2,035) (681) Effect of foreign currency and other (8) (679) (342)
Balance, end of year $ 662 $ 2,176 $ 3,425

TELETECH HOLDINGS, INC. AND SUBSIDIARIES Notes to the Consolidated Financial Statements
F-21
Significant Clients
The Company had one client that contributed in excess of 10% of total revenue in the years ended December 31, 2016, 2015 and 2014. This client operates in the communications industry and is included in the Customer Management Services segment. The revenue from this client as a percentage of total revenue was as follows:
Year Ended December 31, 2016 2015 2014 Telecommunications client 10 % 10 % 11 % Accounts receivable from this client was as follows (in thousands):
Year Ended December 31, 2016 2015 2014 Telecommunications client $ 28,080 $ 23,953 $ 38,400 The loss of one or more of its significant clients could have a material adverse effect on the Company’s business, operating results, or financial condition. The Company does not require collateral from its clients. To limit the Company’s credit risk, management performs periodic credit evaluations of its clients and maintains allowances for uncollectible accounts and may require pre-payment for services. Although the Company is impacted by economic conditions in various industry segments, management does not believe significant credit risk exists as of December 31, 2016. (5) PROPERTY, PLANT AND EQUIPMENT Property, plant and equipment consisted of the following (in thousands):
December 31, 2016 2015 Land and buildings $ 38,868 $ 38,833 Computer equipment and software 364,854 359,581 Telephone equipment 42,858 41,035 Furniture and fixtures 68,248 62,606 Leasehold improvements 162,232 157,788 Motor vehicles 143 238 Construction-in-progress and other 115 —
Property, plant and equipment, gross 677,318 660,081 Less: Accumulated depreciation and amortization (526,281) (491,792)
Property, plant and equipment, net $ 151,037 $ 168,289 Depreciation and amortization expense for property, plant and equipment was $59.1 million, $54.0 million and $46.9 million for the years ended December 31, 2016, 2015 and 2014, respectively.
Included in the computer equipment and software is internally developed software of $10.1 million net and $18.4 million net as of December 31, 2016 and 2015, respectively.
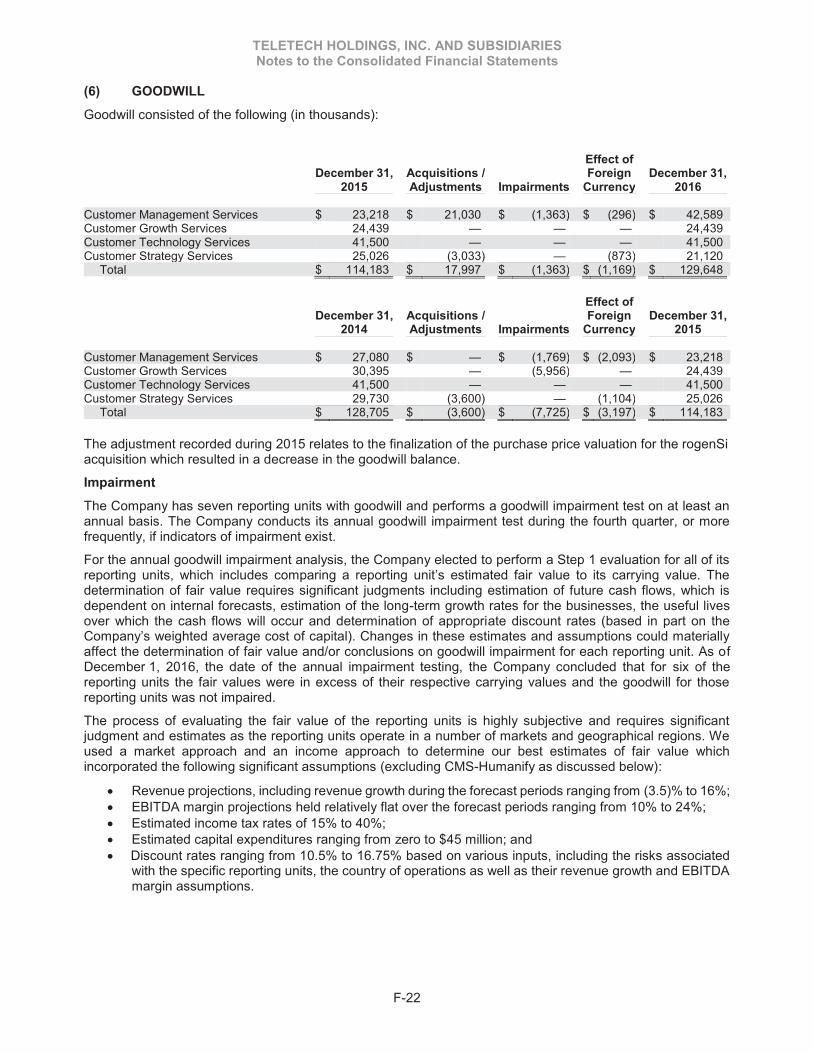
TELETECH HOLDINGS, INC. AND SUBSIDIARIES Notes to the Consolidated Financial Statements
F-22
(6) GOODWILL
Goodwill consisted of the following (in thousands):
Effect of
December 31, Acquisitions / Foreign December 31, 2015 Adjustments Impairments Currency 2016 Customer Management Services $ 23,218 $ 21,030 $ (1,363) $ (296) $ 42,589 Customer Growth Services 24,439 — — — 24,439 Customer Technology Services 41,500 — — — 41,500 Customer Strategy Services 25,026 (3,033) — (873) 21,120
Total $ 114,183 $ 17,997 $ (1,363) $ (1,169) $ 129,648 Effect of December 31, Acquisitions / Foreign December 31, 2014 Adjustments Impairments Currency 2015 Customer Management Services $ 27,080 $ — $ (1,769) $ (2,093) $ 23,218 Customer Growth Services 30,395 — (5,956) — 24,439 Customer Technology Services 41,500 — — — 41,500 Customer Strategy Services 29,730 (3,600) — (1,104) 25,026
Total $ 128,705 $ (3,600) $ (7,725) $ (3,197) $ 114,183 The adjustment recorded during 2015 relates to the finalization of the purchase price valuation for the rogenSi acquisition which resulted in a decrease in the goodwill balance.
Impairment
The Company has seven reporting units with goodwill and performs a goodwill impairment test on at least an annual basis. The Company conducts its annual goodwill impairment test during the fourth quarter, or more frequently, if indicators of impairment exist.
For the annual goodwill impairment analysis, the Company elected to perform a Step 1 evaluation for all of its reporting units, which includes comparing a reporting unit’s estimated fair value to its carrying value. The determination of fair value requires significant judgments including estimation of future cash flows, which is dependent on internal forecasts, estimation of the long-term growth rates for the businesses, the useful lives over which the cash flows will occur and determination of appropriate discount rates (based in part on the Company’s weighted average cost of capital). Changes in these estimates and assumptions could materially affect the determination of fair value and/or conclusions on goodwill impairment for each reporting unit. As of December 1, 2016, the date of the annual impairment testing, the Company concluded that for six of the reporting units the fair values were in excess of their respective carrying values and the goodwill for those reporting units was not impaired.
The process of evaluating the fair value of the reporting units is highly subjective and requires significant judgment and estimates as the reporting units operate in a number of markets and geographical regions. We used a market approach and an income approach to determine our best estimates of fair value which incorporated the following significant assumptions (excluding CMS-Humanify as discussed below):
• Revenue projections, including revenue growth during the forecast periods ranging from (3.5)% to 16%; • EBITDA margin projections held relatively flat over the forecast periods ranging from 10% to 24%; • Estimated income tax rates of 15% to 40%; • Estimated capital expenditures ranging from zero to $45 million; and • Discount rates ranging from 10.5% to 16.75% based on various inputs, including the risks associated
with the specific reporting units, the country of operations as well as their revenue growth and EBITDA margin assumptions.

TELETECH HOLDINGS, INC. AND SUBSIDIARIES Notes to the Consolidated Financial Statements
F-23
CMS - Humanify reporting unit
As of December 1, 2016, the calculated fair value for the Humanify reporting unit was below the carrying value which necessitated an impairment analysis. The Company tested all of the assets of the reporting unit for impairment.
Definite-lived long-lived assets consisted of internally developed software and purchased IP. Based on a decision to change the strategy of this business unit in December 2016 which will not use these assets on a go forward basis, the Company has determined that there is no value associated with these assets and recorded a $10.8 million impairment in the three months ended December 31, 2016, which was included in Impairment losses in the Consolidated Statements of Comprehensive Income (Loss).
For the goodwill impairment analysis, the Company calculated the fair value of the Humanify reporting unit and compared that to the updated carrying value and determined that the fair value was not in excess of its carrying value. Key assumptions used in the fair value calculation for goodwill impairment testing include, but are not limited to, revenue growth of approximately $300 thousand to $1 million per year through 2027, a perpetual growth rate of 3%, a discount rate of 16.75%, and negative EBITDA through 2020 growing to a 15.6% EBITDA for the terminal year. Estimated future cash flows under the income approach were based on the Company’s internal business plan adjusted as appropriate for the Company’s view of market participant assumptions.
The fair value of the Humanify reporting unit was determined to be zero. Upon completing this assessment, the Company determined that the implied fair value of goodwill was below the carrying value and the entire goodwill balance of $1.4 million was impaired and expensed in the three months ended December 31, 2016 which is included in Impairment losses in the Consolidated Statements of Comprehensive Income (Loss).
CSS reporting unit
During the quarter ended September 30, 2016, the Company identified negative indicators such as lower financial performance and the reversal of contingent consideration for the CSS reporting unit and thus the Company updated its quantitative assessment for the CSS reporting unit fair value using an income based approach. The determination of fair value requires significant judgments including estimation of future cash flows, which is dependent on internal forecasts, estimation of the long-term growth rates for the businesses, the useful lives over which the cash flows will occur and determination of appropriate discount rates (based in part on the Company’s weighted average cost of capital). Changes in these estimates and assumptions could materially affect the determination of fair value and/or conclusions on goodwill impairment for each reporting unit. At September 30, 2016, the fair value for the CSS reporting unit exceeded the carrying value and thus no impairment was required.
The Company also determined that effective September 30, 2016 the assets of one of the business units within the CSS reporting unit will be held for sale (see discussion in Note 2). Therefore the CSS reporting unit was separated into the component that will be held for sale and the components that will be held for use and two separate fair value analyses were completed. At September 30, 2016 the fair value for the CSS held for use component exceeded the carrying value and thus no impairment was required. The fair value for the CSS held for sale component also exceeded the carrying value and thus no impairment was required.
CGS - WebMetro reporting unit
At September 30, 2015, the Company updated its quantitative assessment for the WebMetro reporting unit fair value using an income based approach based on a relatively small margin of fair value in excess of carrying value as of December 31, 2014. At September 30, 2015, the updated fair value for WebMetro was below the carrying value which necessitated an interim impairment analysis. The Company tested all of the assets of this reporting unit for impairment.
Definite-lived long-lived assets consisted of fixed assets, internally developed software, and an intangible asset related to the WebMetro customer relationships. The Company determined that the undiscounted future cash flows would be sufficient to cover the net book value of all definite-lived long-lived assets.

TELETECH HOLDINGS, INC. AND SUBSIDIARIES Notes to the Consolidated Financial Statements
F-24
For the goodwill impairment analysis, the Company calculated the fair value of the WebMetro reporting unit and compared that to the updated carrying value and determined that the fair value was not in excess of its carrying value. Key assumptions used in the fair value calculation for goodwill impairment testing include, but are not limited to, a compounded annual revenue growth rate of 20% for the years 2016 through 2019, a perpetuity growth rate of 4.0% based on the current inflation rate combined with the GDP growth rate for the reporting unit’s geographical region and a discount rate of 17.0%, which is equal to the reporting unit’s equity risk premium adjusted for its size and company specific risk factors. Estimated future cash flows under the income approach are based on the Company’s internal business plan adjusted as appropriate for the Company’s view of market participant assumptions. The current business plan assumes the occurrence of certain events, including increased revenue growth for the next several years. Significant differences in the outcome of some or all of these assumptions may impact the calculated fair value of this reporting unit resulting in a different outcome to goodwill impairment in a future period.
Since the fair value of the reporting unit was not in excess of its carrying value, the Company calculated the implied fair value of goodwill and compared that value to the carrying value of goodwill. Implied fair value of goodwill is equal to the excess of the reporting unit’s fair value over the amounts assigned to its net identifiable assets and liabilities. Upon completing this assessment, the Company determined that the implied fair value of goodwill was below the carrying value and thus a $3.1 million impairment was recorded in the three months ended September 30, 2015, and was included in Impairment losses in the Consolidated Statements of Comprehensive Income (Loss).
As of December 1, 2015, during the annual goodwill impairment analysis the Company determined that for the WebMetro reporting unit there was an error in the discounted cash flow analysis regarding the inclusion of amortization of the intangible assets into future years including the perpetuity income calculation. When this error was corrected, the WebMetro fair value was below the carrying value including the impairment recorded as of September 30, 2015. The Company determined the error occurred in past periods and recalculated the adjusted fair value as of December 1, 2014. Based on this analysis, the fair value was below the carrying value as of December 1, 2014 and a Step 2 impairment analysis was completed. The Company completed the goodwill analysis based on the key assumptions that were used as of December 1, 2014.
Since the fair value of the reporting unit was not in excess of its carrying value, the Company calculated the implied fair value of goodwill and compared that value to the carrying value of goodwill. Upon completing this assessment, the Company determined that the implied fair value of goodwill was below the carrying value and thus a $2.3 million impairment should have been recorded as of December 1, 2014. Based on these revisions, the third quarter 2015 assessment was also adjusted and additional $0.6 million impairment should have been recorded as of September 30, 2015. These impairments were recorded in the prior year in the three months ended December 31, 2015, and were included in Impairment losses in the Consolidated Statements of Comprehensive Income (Loss). As of December 31, 2015, the entire goodwill balance for WebMetro has been impaired.
CMS – Latin America reporting unit
As of December 1, 2015, the updated fair value for the CMS - Latin America reporting unit was below the carrying value which necessitated an impairment analysis. The Company tested all of the assets of this reporting unit for impairment.
Definite-lived long-lived assets consisted of fixed assets and an intangible asset related to customer relationships. The Company determined that the undiscounted future cash flows would be sufficient to cover the net book value of all definite-lived long-lived assets.

TELETECH HOLDINGS, INC. AND SUBSIDIARIES Notes to the Consolidated Financial Statements
F-25
For the goodwill impairment analysis, the Company calculated the fair value of the CMS - Latin America reporting unit and compared that to the updated carrying value and determined that the fair value was not in excess of its carrying value. Key assumptions used in the fair value calculation for goodwill impairment testing include, but are not limited to, a compounded annual revenue growth rate of negative 22% for 2016 followed by 6% for years 2017 through 2020, a perpetuity growth rate of 4% based on the current inflation rate combined with the GDP growth rate for the reporting unit’s geographical region and a discount rate of 15.8%, which is equal to the reporting unit’s equity risk premium adjusted for its size, country and company specific risk factors. Estimated future cash flows under the income approach were based on the Company’s internal business plan adjusted as appropriate for the Company’s view of market participant assumptions.
Since the fair value of the CMS - Latin America reporting unit was not in excess of its carrying value, the Company calculated the implied fair value of goodwill and compared that value to the carrying value of goodwill. Upon completing this assessment, the Company determined that the implied fair value of goodwill was below the carrying value and the entire goodwill balance of $1.8 million was impaired and recorded in the three months ended December 31, 2015, and included in Impairment losses in the Consolidated Statements of Comprehensive Income (Loss).
(7) OTHER INTANGIBLE ASSETS
Other intangible assets which are included in Other long-term assets in the accompanying Consolidated Balance Sheets consisted of the following (in thousands):
Acquisitions Effect of December 31, and Foreign December 31, 2015 Amortization Impairments Adjustments Currency 2016
Customer relationships, gross $ 62,257 $ — $ (17,150) $ 6,588 $ (1,241) $ 50,454 Customer relationships - accumulated amortization (30,180) (7,246) 6,120 5,097 266 (25,943) Other intangible assets, gross 13,750 — (5,566) (3,701) 106 4,589 Other intangible assets - accumulated amortization (8,755) (2,285) 3,956 2,929 177 (3,978) Trade name - indefinite life 14,143 — (8,682) — 204 5,665
Other intangible assets, net $ 51,215 $ (9,531) $ (21,322) $ 10,913 $ (488) $ 30,787
Effect of December 31, Foreign December 31, 2014 Amortization Impairments Acquisitions Currency 2015 Customer relationships, gross $ 63,914 $ — $ — $ (2,982) $ 1,325 $ 62,257 Customer relationships - accumulated amortization (20,326) (7,401) — — (2,453) (30,180) Other intangible assets, gross 13,113 — — 986 (349) 13,750 Other intangible assets - accumulated amortization (6,509) (2,345) — — 99 (8,755) Trade name - indefinite life 9,713 — — 5,544 (1,114) 14,143
Other intangible assets, net $ 59,905 $ (9,746) $ — $ 3,548 $ (2,492) $ 51,215 The acquisitions and adjustments recorded during 2016 relate to the purchase of Atelka (see Note 2 for further information) and the impairment of several intangible assets during the third and fourth quarters of 2016 (see below).
The adjustments recorded during 2015 relate to the finalization of the purchase price valuation for the rogenSi acquisition which resulted in an increase to the trade name and decrease in the customer relationships intangible assets.

TELETECH HOLDINGS, INC. AND SUBSIDIARIES Notes to the Consolidated Financial Statements
F-26
CTS - Avaya
In connection with reduced profitability for the Avaya component of the CTS segment an interim impairment analysis was completed during the third quarter of 2016. The Company has modified the sales focus of the Avaya component away from premise product and services towards cloud solutions. The indefinite-lived intangible asset evaluated for impairment consisted of the TSG trade name. The Company calculated the fair value of the trade name using a relief from royalty method based on forecasted revenues sold under the trade name using significant inputs not observable in the market (Level 3 inputs). The valuation assumptions included an estimated royalty rate of 0.5%, a discount rate specific to the trade name of 19.0%, which was equal to the reporting unit’s equity risk premium adjusted for its size and company specific risk factors. and a perpetuity growth rate of 3.0%. Based on the calculated fair value of $0.4 million, the Company recorded impairment expense of $0.7 million in the three months ended September 30, 2016 which was included in Impairment losses in the Consolidated Statements of Comprehensive Income (Loss).
Additional triggering events occurred related to continued lower than expected financial performance and the bankruptcy filing for Avaya. In connection with this event, the forecasted revenue and operating income for the future years has decreased and thus an impairment analysis was completed during the fourth quarter of 2016 for both the indefinite-lived TSG trade name and the TSG customer relationship asset. The Company completed an asset group recoverability analysis using significant inputs not observable in the market (Level 3 inputs). These included a declining revenue stream from 2017 through 2019 and a negative EBITDA for the next 4 years. The estimated fair value was a negative $0.9 million. Based on this recoverability analysis, an impairment of $9.2 million of customer relationships, $0.4 million of trade name and $0.4 million of non-compete intangible assets was recorded. In addition $1.3 million of fixed assets were also impaired. The total $11.3 million of expense was recorded in the three months ended December 31, 2016 and was included in Impairment losses in the Consolidated Statements of Comprehensive Income (Loss).
CSS - rogenSi
In connection with reduced profitability of the rogenSi component of the CSS segment, an interim impairment analysis was completed during the third quarter of 2016. The indefinite-lived intangible asset evaluated for impairment consisted of the trade name. The Company calculated the fair value of the trade name using a relief from royalty method based on forecasted revenues sold under the trade name using significant inputs not observable in the market (Level 3 inputs). The valuation assumptions included an estimated royalty rate of 2.0%, a discount rate specific to the trade name of 18.2%, which was equal to the reporting unit’s equity risk premium adjusted for its size and company specific risk factors. and a perpetuity growth rate of 3.0%. Based on the calculated fair value of $3.1 million, the Company recorded impairment expense of $1.2 million in the three months ended September 30, 2016 which was included in Impairment losses in the Consolidated Statements of Comprehensive Income (Loss)
During the fourth quarter of 2016 in connection with the full integration of the CSS segment, management has determined that it will no longer be using the name rogenSi and will be transitioning all CSS entities to TeleTech Consulting. Based on this change in branding strategy, an evaluation of the indefinite-lived trade name was completed and it was determined that the fair value of the asset was zero. The Company recorded impairment expense of $3.0 million in the three months ended December 31, 2016 which was included in Impairment losses in the Consolidated Statements of Comprehensive Income (Loss).
CSS – component held-for-sale
The Company calculated the fair value of the trade name using a relief from royalty method based on forecasted revenues sold under the trade name using significant inputs not observable in the market (Level 3 inputs). The valuation assumptions included an estimated royalty rate of 3.75%, a discount rate specific to the trade name of 19.2% and a perpetuity growth rate of 3.0%. Based on the calculated fair value of $2.0 million, the Company recorded impairment expense of $3.3 million in the three months ended September 30, 2016 which was included in Impairment losses in the Consolidated Statements of Comprehensive Income (Loss).

TELETECH HOLDINGS, INC. AND SUBSIDIARIES Notes to the Consolidated Financial Statements
F-27
Customer relationships are being amortized over the remaining weighted average useful life of 5.6 years and other intangible assets are being amortized over the remaining weighted average useful life of 1.7 years. Amortization expense related to intangible assets was $9.5 million, $9.7 million and $9.6 million for the years ended December 31, 2016, 2015 and 2014, respectively.
Expected future amortization of other intangible assets as of December 31, 2016 is as follows (in thousands):
2017 $ 4,806 2018 4,138 2019 4,107 2020 2,920 2021 2,419 Thereafter 7,179
Total $ 25,569
(8) DERIVATIVES
Cash Flow Hedges
The Company enters into foreign exchange and interest rate related derivatives. Foreign exchange derivatives entered into consist of forward and option contracts to reduce the Company’s exposure to foreign currency exchange rate fluctuations that are associated with forecasted revenue earned in foreign locations. Interest rate derivatives consist of interest rate swaps to reduce the Company’s exposure to interest rate fluctuations associated with its variable rate debt. Upon proper qualification, these contracts are designated as cash flow hedges. It is the Company’s policy to only enter into derivative contracts with investment grade counterparty financial institutions, and correspondingly, the fair value of derivative assets consider, among other factors, the creditworthiness of these counterparties. Conversely, the fair value of derivative liabilities reflects the Company’s creditworthiness. As of December 31, 2016, the Company had not experienced, nor does it anticipate, any issues related to derivative counterparty defaults. The following table summarizes the aggregate unrealized net gain or loss in Accumulated other comprehensive income (loss) for the years ended December 31, 2016, 2015 and 2014 (in thousands and net of tax):
Year Ended December 31, 2016 2015 2014 Aggregate unrealized net gain/(loss) at beginning of period $ (26,885) $ (18,345) $ (8,352) Add: Net gain/(loss) from change in fair value of cash flow hedges 11,242 (16,349) (12,121) Less: Net (gain)/loss reclassified to earnings from effective hedges (16,750) 7,809 2,128 Aggregate unrealized net gain/(loss) at end of period $ (32,393) $ (26,885) $ (18,345) The Company’s foreign exchange cash flow hedging instruments as of December 31, 2016 and 2015 are summarized as follows (in thousands). All hedging instruments are forward contracts.
Local Currency U.S. Dollar % Maturing Contracts Notional Notional in the next Maturing
As of December 31, 2016 Amount Amount 12 months Through Philippine Peso 14,315,000 301,134 (1) 42.3 % August 2021 Mexican Peso 2,089,000 129,375 23.7 % May 2021 $ 430,509

TELETECH HOLDINGS, INC. AND SUBSIDIARIES Notes to the Consolidated Financial Statements
F-28
Local Currency U.S. Dollar Notional Notional
As of December 31, 2015 Amount Amount Philippine Peso 16,362,000 361,571 (1) Mexican Peso 2,637,000 173,124 $ 534,695
(1) Includes contracts to purchase Philippine pesos in exchange for New Zealand dollars and Australian
dollars, which are translated into equivalent U.S. dollars on December 31, 2016 and December 31, 2015. The Company’s interest rate swap arrangements as of December 31, 2016 and 2015 were as follows:
Contract Contract Notional Variable Rate Fixed Rate Commencement Maturity As of December 31, 2016: Amount Received Paid Date Date
Swap 2 $ 15 million 1 - month LIBOR 3.14 % May 2012 May 2017 $ 15 million As of December 31, 2015:
Swap 1 $ 25 million 1 - month LIBOR 2.55 % April 2012 April 2016 Swap 2 15 million 1 - month LIBOR 3.14 % May 2012 May 2017
$ 40 million Fair Value Hedges
The Company enters into foreign exchange forward contracts to economically hedge against foreign currency exchange gains and losses on certain receivables and payables of the Company’s foreign operations. Changes in the fair value of derivative instruments designated as fair value hedges are recognized in earnings in Other income (expense), net. As of December 31, 2016 and 2015, the total notional amount of the Company’s forward contracts used as fair value hedges was $227.8 million and $241.0 million, respectively.
Derivative Valuation and Settlements
The Company’s derivatives as of December 31, 2016 and 2015 were as follows (in thousands): December 31, 2016
Designated Not Designated as Hedging as Hedging
Designation: Instruments Instruments
Foreign
Interest
Foreign
Derivative contract type: Exchange Rate Exchange Derivative classification: Cash Flow Cash Flow Fair Value Fair value and location of derivative in the Consolidated Balance
Sheet: Prepaids and other current assets $ 1,178 $ — $ 1,606 Other long-term assets — — — Other current liabilities (23,503) (147) (866) Other long-term liabilities (31,714) — —
Total fair value of derivatives, net $ (54,039) $ (147) $ 740

TELETECH HOLDINGS, INC. AND SUBSIDIARIES Notes to the Consolidated Financial Statements
F-29
December 31, 2015 Designated Not Designated as Hedging as Hedging
Designation: Instruments Instruments Foreign Interest Foreign
Derivative contract type: Exchange Rate Exchange Derivative classification: Cash Flow Cash Flow Fair Value Fair value and location of derivative in the Consolidated Balance
Sheet: Prepaids and other current assets $ 39 $ — $ 2,489 Other long-term assets 66 — — Other current liabilities (20,088) (549) (116) Other long-term liabilities (25,739) (102) —
Total fair value of derivatives, net $ (45,722) $ (651) $ 2,373 The effect of derivative instruments on the Consolidated Statements of Comprehensive Income (Loss) for the years ended December 31, 2016 and 2015 were as follows (in thousands): Year Ended December 31, 2016 2015
Designated as Hedging Designated as Hedging Designation: Instruments Instruments Foreign Interest Foreign Interest Derivative contract type: Exchange Rate Exchange Rate Derivative classification: Cash Flow Cash Flow Cash Flow Cash Flow
Amount of gain or (loss) recognized in Other comprehensive income (loss) - effective portion, net of tax $ (16,438) $ (312) $ (7,198) $ (611)
Amount and location of net gain or (loss) reclassified from
Accumulated OCI to income - effective portion: Revenue $ (28,025) $ — $ (12,410) $ — Interest expense — (534) — (1,053)
Year Ended December 31, 2016 2015 Designation: Not Designated as Hedging Instruments Not Designated as Hedging Instruments Derivative contract type: Foreign Exchange Foreign Exchange Forward Forward Derivative classification: Contracts Fair Value Contracts Fair Value Amount and location of net gain or
(loss) recognized in the Consolidated Statement of Comprehensive Income (Loss):
Cost of services $ — $ — $ — $ — Other income (expense), net — (5,826) — (6,127)

TELETECH HOLDINGS, INC. AND SUBSIDIARIES Notes to the Consolidated Financial Statements
F-30
(9) FAIR VALUE
The authoritative guidance for fair value measurements establishes a three-level fair value hierarchy that prioritizes the inputs used to measure fair value. This hierarchy requires that the Company maximize the use of observable inputs and minimize the use of unobservable inputs. The three levels of inputs used to measure fair value are as follows:
Level 1 — Quoted prices in active markets for identical assets or liabilities. Level 2 — Observable inputs other than quoted prices included in Level 1, such as quoted prices for
similar assets and liabilities in active markets, similar assets and liabilities in markets that are not active or can be corroborated by observable market data.
Level 3 — Unobservable inputs that are supported by little or no market activity and that are significant
to the fair value of the assets or liabilities. This includes certain pricing models, discounted cash flow methodologies and similar techniques that use significant unobservable inputs.
The following presents information as of December 31, 2016 and 2015 of the Company’s assets and liabilities required to be measured at fair value on a recurring basis, as well as the fair value hierarchy used to determine their fair value.
Accounts Receivable and Payable - The amounts recorded in the accompanying balance sheets approximate fair value because of their short-term nature.
Investments – The Company measures investments, including cost and equity method investments, at fair value on a nonrecurring basis when they are deemed to be other-than-temporarily impaired. The fair values of these investments are determined based on valuation techniques using the best information available, and may include market observable inputs and discounted cash flow projections. An impairment charge is recorded when the cost of the investment exceeds its fair value and this condition is determined to be other-than-temporary. As of December 31, 2016, the investment in CaféX Communications, Inc., which consists of the Company’s first quarter 2015 $9.0 million investment and the fourth quarter 2016 $4.3 million investment, is recorded at $13.3 million which approximates fair value.
Debt - The Company’s debt consists primarily of the Company’s Credit Agreement, which permits floating-rate borrowings based upon the current Prime Rate or LIBOR plus a credit spread as determined by the Company’s leverage ratio calculation (as defined in the Credit Agreement). As of December 31, 2016 and 2015, the Company had $217.3 million and $100.0 million, respectively, of borrowings outstanding under the Credit Agreement. During 2016 and 2015, borrowings accrued interest at an average rate of 1.5% and 1.2% per annum, respectively, excluding unused commitment fees. The amounts recorded in the accompanying Balance Sheets approximate fair value due to the variable nature of the debt based on level 2 inputs.
Derivatives - Net derivative assets (liabilities) are measured at fair value on a recurring basis. The portfolio is valued using models based on market observable inputs, including both forward and spot foreign exchange rates, interest rates, implied volatility, and counterparty credit risk, including the ability of each party to execute its obligations under the contract. As of December 31, 2016, credit risk did not materially change the fair value of the Company’s derivative contracts.

TELETECH HOLDINGS, INC. AND SUBSIDIARIES Notes to the Consolidated Financial Statements
F-31
The following is a summary of the Company’s fair value measurements for its net derivative assets (liabilities) as of December 31, 2016 and 2015 (in thousands): As of December 31, 2016 Fair Value Measurements Using Quoted Prices in Significant Active Markets Other Significant for Identical Observable Unobservable Assets Inputs Inputs (Level 1) (Level 2) (Level 3) At Fair Value Cash flow hedges $ — $ (54,039) $ — $ (54,039) Interest rate swaps — (147) — (147) Fair value hedges — 740 — 740
Total net derivative asset (liability) $ — $ (53,446) $ — $ (53,446) As of December 31, 2015 Fair Value Measurements Using Quoted Prices in Significant Active Markets Other Significant for Identical Observable Unobservable Assets Inputs Inputs (Level 1) (Level 2) (Level 3) At Fair Value Cash flow hedges $ — $ (45,722) $ — $ (45,722) Interest rate swaps — (651) — (651) Fair value hedges — 2,373 — 2,373
Total net derivative asset (liability) $ — $ (44,000) $ — $ (44,000)
The following is a summary of the Company’s fair value measurements as of December 31, 2016 and 2015 (in thousands): As of December 31, 2016 Fair Value Measurements Using Quoted Prices in Significant Active Markets for Significant Other Unobservable Identical Assets Observable Inputs Inputs (Level 1) (Level 2) (Level 3) Assets
Derivative instruments, net $ — $ — $ — Total assets $ — $ — $ —
Liabilities
Deferred compensation plan liability $ — $ (10,841) $ — Derivative instruments, net — (53,446) — Contingent consideration — — (1,808)
Total liabilities $ — $ (64,287) $ (1,808)

TELETECH HOLDINGS, INC. AND SUBSIDIARIES Notes to the Consolidated Financial Statements
F-32
As of December 31, 2015 Fair Value Measurements Using Quoted Prices in Significant Active Markets for Significant Other Unobservable Identical Assets Observable Inputs Inputs (Level 1) (Level 2) (Level 3) Assets
Derivative instruments, net $ — $ — $ — Total assets $ — $ — $ —
Liabilities
Deferred compensation plan liability $ — $ (9,821) $ — Derivative instruments, net — (44,000) — Contingent consideration — — (13,450)
Total liabilities $ — $ (53,821) $ (13,450) Deferred Compensation Plan - The Company maintains a non-qualified deferred compensation plan structured as a Rabbi trust for certain eligible employees. Participants in the deferred compensation plan select from a menu of phantom investment options for their deferral dollars offered by the Company each year, which are based upon changes in value of complementary, defined market investments. The deferred compensation liability represents the combined values of market investments against which participant accounts are tracked.
Contingent Consideration — The Company recorded contingent consideration related to the acquisitions of iKnowtion, Guidon, TSG, WebMetro, Sofica, rogenSi, and Atelka. These contingent payables were recognized at fair value using a discounted cash flow approach and a discount rate of 21.0%, 21.0%, 4.6%, 5.3%, 5.0%, 4.6%, or 0%, respectively. The discount rates vary dependent on the specific risks of each acquisition including the country of operation, the nature of services and complexity of the acquired business, and other factors. These measurements were based on significant inputs not observable in the market. The Company recorded interest expense each period using the effective interest method until the future value of these contingent payables reached their expected future value. Interest expense related to all recorded contingent payables is included in Interest expense in the Consolidated Statements of Comprehensive Income (Loss).
The Company recorded contingent consideration related to a revenue servicing agreement with Welltok in the fourth quarter of 2016, in which a maximum of $1.25 million will be paid over eight quarters based on the dollar value of revenue earned by the Company. The contingent payable was recognized at fair value of $1.25 million as of December 31, 2016.
During the second and fourth quarters of 2014, the Company recorded fair value adjustments of the contingent consideration associated with the TSG reporting unit within the CTS segment based on revised estimates noting achievement of the targeted 2014 and 2015 EBITDA was remote. Accordingly, a $4.0 million and $3.9 million, respectively, reductions in the payable were recorded as of June 30, 2014 and December 31, 2014 and were included in Other income (expense) in the Consolidated Statements of Comprehensive Income (Loss).
During the third and fourth quarters of 2014, the Company recorded fair value adjustments of the contingent consideration associated with the Sofica reporting unit within the CMS segment as the Company’s revised estimates reflected Sofica exceeding its EBITDA targets for both 2014 and 2015. Accordingly, the $1.8 million and a $0.6 million increases, respectively, in the payable were recorded as of September 30, 2014 and December 31, 2014 and were included in Other income (expense) in the Consolidated Statements of Comprehensive Income (Loss).
During the third quarter of 2014, the Company recorded a fair value adjustment of the contingent consideration associated with the WebMetro reporting unit within the CGS segment based on revised estimates noting achievement of the targeted 2014 EBITDA was remote. Accordingly, a $1.7 million reduction in the payable was recorded as of September 30, 2014 and was included in Other income (expense) in the Consolidated Statements of Comprehensive Income (Loss).

TELETECH HOLDINGS, INC. AND SUBSIDIARIES Notes to the Consolidated Financial Statements
F-33
During the second quarter of 2015, the Company recorded a fair value adjustment of the contingent consideration associated with the Sofica reporting unit within the CMS segment based on revised estimates reflecting Sofica earnings will be lower than anticipated for 2015. Accordingly a $0.5 million decrease in the payable was recorded as of June 30, 2015 and was included in Other income (expense) in the Consolidated Statements of Comprehensive Income (Loss).
During the fourth quarter of 2014, the third and fourth quarters of 2015, and the third quarter of 2016, the Company recorded fair value adjustments of the contingent consideration associated with the rogenSi reporting unit within the CSS segment based on revised estimates reflecting that rogenSi earnings would be higher and then lower than anticipated for 2015 and 2016. Accordingly a $0.5 million increase, a $0.8 million increase, a $0.3 million decrease, and a $4.3 million decrease to the payable was recorded as of December 31, 2014, September 30, 2015, December 31, 2015, and September 30, 2016, respectively, and were included in Other income (expense) in the Consolidated Statements of Comprehensive Income (Loss). As of September 30, 2016, the fair value of the remaining contingent consideration was reduced to zero given the remote possibility of any additional payments. As of December 31, 2016, the payment was finalized at a value of zero and thus no additional expense was required.
A rollforward of the activity in the Company’s fair value of the contingent consideration is as follows (in thousands): Imputed December 31, Interest / December 31, 2015 Acquisitions Payments Adjustments 2016 iKnowtion $ 500 $ — $ (500) $ — $ — Sofica 3,153 — (3,146) (7) — rogenSi 9,797 — (5,793) (4,004) — Welltok — 1,250 — — 1,250 Atelka — 558 — — 558 Total $ 13,450 $ 1,808 $ (9,439) $ (4,011) $ 1,808
Imputed December 31, Interest / December 31, 2014 Acquisitions Payments Adjustments 2015 iKnowtion $ 2,265 $ — $ (1,800) $ 35 $ 500 Guidon 1,000 — (1,000) — — Sofica 6,317 — (2,838) (326) 3,153 rogenSi 15,162 — (6,372) 1,007 9,797 Total $ 24,744 $ — $ (12,010) $ 716 $ 13,450
(10) INCOME TAXES
The sources of pre-tax operating income are as follows (in thousands): Year Ended December 31, 2016 2015 2014 Domestic $ (6,216) $ 25,402 $ 20,569 Foreign 56,514 60,487 79,890
Total $ 50,298 $ 85,889 $ 100,459

TELETECH HOLDINGS, INC. AND SUBSIDIARIES Notes to the Consolidated Financial Statements
F-34
The components of the Company’s Provision for (benefit from) income taxes are as follows (in thousands): Year Ended December 31, 2016 2015 2014 Current provision for (benefit from)
Federal $ (373) $ 4,094 $ (699) State 372 1,829 270 Foreign 14,447 4,764 13,957
Total current provision for (benefit from) 14,446 10,687 13,528 Deferred provision for (benefit from)
Federal (2,390) (1,895) 10,148 State 103 1,085 423 Foreign 704 10,127 (1,057)
Total deferred provision for (benefit from) (1,583) 9,317 9,514 Total provision for (benefit from) income taxes $ 12,863 $ 20,004 $ 23,042
The following reconciles the Company’s effective tax rate to the federal statutory rate (in thousands): Year Ended December 31, 2016 2015 2014 Income tax per U.S. federal statutory rate (35%) $ 17,605 $ 30,062 $ 35,161
State income taxes, net of federal deduction (158) 1,603 1,525 Change in valuation allowances (129) 3,923 256 Foreign income taxes at different rates than the U.S. (10,206) (14,490) (17,824) Foreign withholding taxes 590 958 257 Losses in international markets without tax benefits 2,474 1,999 1,649 Nondeductible compensation under Section 162(m) 104 512 817 Liabilities for uncertain tax positions (133) 1,756 1,435 Permanent difference related to foreign exchange gains 388 162 (11) (Income) losses of foreign branch operations (635) (517) 225 Non-taxable earnings of noncontrolling interest (1,128) (1,349) (1,141) Foreign dividend less foreign tax credits (4,646) (4,425) (1,428) Increase in deferred tax liability - branch losses in UK — (2,530) (75) Decrease (increase) to deferred tax asset - change in tax rate 443 (526) (443) State income tax credits 100 (1,477) (142) Foreign earnings taxed currently in U.S. 3,673 2,839 2,696 Taxes related to prior year filings 2,554 344 — Other 1,967 1,160 85
Income tax per effective tax rate $ 12,863 $ 20,004 $ 23,042

TELETECH HOLDINGS, INC. AND SUBSIDIARIES Notes to the Consolidated Financial Statements
F-35
The Company’s deferred income tax assets and liabilities are summarized as follows (in thousands): Year Ended December 31, 2016 2015 Deferred tax assets, gross
Accrued workers compensation, deferred compensation and employee benefits $ 11,212 $ 10,509 Allowance for doubtful accounts, insurance and other accruals 3,348 4,860 Amortization of deferred rent liabilities 3,362 2,500 Net operating losses 20,253 19,522 Equity compensation 2,489 3,505 Customer acquisition and deferred revenue accruals 11,739 16,610 Federal and state tax credits, net 7,439 10,057 Depreciation and amortization 4,671 6,265 Unrealized losses on derivatives 13,815 16,644 Contract acquisition costs 1,044 — Other 2,331 2,655
Total deferred tax assets, gross 81,703 93,127 Valuation allowances (9,949) (10,139)
Total deferred tax assets, net 71,754 82,988 Deferred tax liabilities
Contract acquisition costs — (25,667) Intangible assets (17,971) (6,082) Other (357) (2,490)
Total deferred tax liabilities (18,328) (34,239) Net deferred tax assets $ 53,426 $ 48,749 Quarterly, the Company assesses the likelihood by jurisdiction that its net deferred tax assets will be recovered. Based on the weight of all available evidence, both positive and negative, the Company records a valuation allowance against deferred tax assets when it is more-likely-than-not that a future tax benefit will not be realized.
As of December 31, 2016 the Company had approximately $45.0 million of net deferred tax assets in the U.S. and $8.4 million of net deferred tax assets related to certain international locations whose recoverability is dependent upon their future profitability. As of December 31, 2016 the deferred tax valuation allowance was $9.9 million and related primarily to tax losses in foreign jurisdictions and U.S. federal and state tax credits which do not meet the “more-likely-than-not” standard under current accounting guidance. The utilization of these federal and state tax credits are subject to numerous factors including various expiration dates, generation of future taxable income over extended periods of time and state income tax apportionment factors which are subject to change.
When there is a change in judgment concerning the recovery of deferred tax assets in future periods, a valuation allowance is recorded into earnings during the quarter in which the change in judgment occurred. In 2016, the Company made adjustments to its deferred tax assets and corresponding valuation allowances. The net change to the valuation allowance consisted of the following: a $0.1 million increase in certain state credits and NOLs that are now expected to be utilized prior to expiration, a $1.8 million increase in valuation allowance in Canada, Ireland, the Middle East and New Zealand for deferred tax assets that do not meet the “more-likely-than-not” standard, and a $2.1 million release of valuation allowance in the Philippines, United Kingdom and various other jurisdictions related to the utilization or write-off of deferred tax assets.
Activity in the Company’s valuation allowance accounts consists of the following (in thousands): Year Ended December 31, 2016 2015 2014 Beginning balance $ 10,139 $ 10,721 $ 10,792 Additions of deferred income tax expense 1,914 4,300 946 Reductions of deferred income tax expense (2,104) (4,882) (1,017)
Ending balance $ 9,949 $ 10,139 $ 10,721

TELETECH HOLDINGS, INC. AND SUBSIDIARIES Notes to the Consolidated Financial Statements
F-36
As of December 31, 2016, after consideration of all tax loss and tax credit carry back opportunities, the Company had tax affected tax loss carry forwards worldwide expiring as follows (in thousands): 2017 $ — 2018 115 2019 240 2020 375 After 2020 15,114 No expiration 4,409
Total $ 20,253 As of December 31, 2016, domestically, the Company had federal tax credit carry forwards in the amount of $1.8 million that if unused will expire in 2023, $0.9 million that if unused will expire in 2024, $1.7 million that if unused will expire in 2025 and $1.5 million that if unused will expire in 2026. The Company also had state tax credit carry-forwards of $0.3 million that if unused will expire between 2017 and 2023.
As of December 31, 2016 the cumulative amount of foreign earnings considered permanently invested outside the U.S. was $533.6 million. Those earnings do not include earnings from certain subsidiaries which the Company intends to repatriate to the U.S. or are otherwise considered available for distribution to the U.S. Accordingly, no provision for U.S. federal or state income taxes or foreign withholding taxes has been provided on these undistributed earnings. If these earnings become taxable in the U.S, the Company would be subject to incremental tax expense, after any applicable foreign tax credit, and foreign withholding tax expense. It is not practicable to estimate the additional taxes that may become payable if the Company remits these foreign earnings.
The Company has been granted “Tax Holidays” as an incentive to attract foreign investment by the governments of the Philippines and Costa Rica. Generally, a Tax Holiday is an agreement between the Company and a foreign government under which the Company receives certain tax benefits in that country, such as exemption from taxation on profits derived from export-related activities. In the Philippines, the Company has been granted multiple agreements with an initial period of four years and additional periods for varying years, expiring at various times between 2017 and 2019. The aggregate benefit to income tax expense for the years ended December 31, 2016, 2015 and 2014 was approximately $12.4 million, $12.2 million and $20.2 million, respectively, which had a favorable impact on diluted net income per share of $0.27, $0.25 and $0.27, respectively.
Accounting for Uncertainty in Income Taxes
In accordance with ASC 740, the Company has recorded a reserve for uncertain tax positions. The total amount of interest and penalties recognized in the accompanying Consolidated Balance Sheets and Consolidated Statements of Comprehensive Income (Loss) as of December 31, 2016, 2015 and 2014 was approximately $693 thousand, $709 thousand and $132 thousand, respectively.
The Company had a reserve for uncertain tax benefits, on a net basis, of $3.5 million and $3.7 million for the years ended December 31, 2016 and 2015, respectively. The liability for uncertain tax positions was reduced by $1.1 million during 2016 for tax positions that were resolved favorably or expired and increased by $0.8 million for new uncertain tax positions.

TELETECH HOLDINGS, INC. AND SUBSIDIARIES Notes to the Consolidated Financial Statements
F-37
The tabular reconciliation of the reserve for uncertain tax benefits on a gross basis without interest for the three years ended December 31, 2016 is presented below (in thousands): Balance as of December 31, 2013 $ 358
Additions for current year tax positions 1,303 Reductions in prior year tax positions —
Balance as of December 31, 2014 1,661 Additions for current year tax positions 1,048 Reductions in prior year tax positions —
Balance as of December 31, 2015 2,709 Additions for current year tax positions 826 Reductions in prior year tax positions (1,153)
Balance as of December 31, 2016 $ 2,382 At December 31, 2016, the amount of uncertain tax benefits that, if recognized, would reduce tax expense was $3.5 million. Within the next 12 months, it is expected that the amount of unrecognized tax benefits will be reduced by $0.8 million as a result of the expiration of various statutes of limitation.
The Company and its domestic and foreign subsidiaries (including Percepta LLC and its domestic and foreign subsidiaries) file income tax returns as required in the U.S. federal jurisdiction and various state and foreign jurisdictions. The following table presents the major tax jurisdictions and tax years that are open as of December 31, 2016 and subject to examination by the respective tax authorities: Tax Jurisdiction Tax Year Ended United States 2013 to present Argentina 2011 to present Australia 2012 to present Brazil 2011 to present Canada 2009 to present Mexico 2011 to present Philippines 2014 to present Spain 2012 to present In accordance with ASC 740, the Company recorded a liability during the second quarter of 2015 of $1.75 million and during the first quarter of 2016 of $1.1 million, inclusive of penalties and interest, for an uncertain tax position. See Note 1 for further information on these items.
During the second quarter of 2016, $0.3 million of liability was released due to the closing of a statute of limitations.
During the third quarter of 2016, $0.8 million of liability was released due to the favorable outcome of communications with a revenue authority related to site compliance for locations with tax advantaged status.
During the third quarter of 2016, $0.5 million of liability was released due to the closing of a statute of limitations.
The Company’s U.S. income tax returns filed for the tax years ending December 31, 2013 to present, remain open tax years. The Company has been notified of the intent to audit, or is currently under audit of, income taxes for rogenSi in Hong Kong for the tax year 2014, Canada for tax years 2009 and 2010, and the state of Michigan in the United States for tax years 2012 through 2015. Although the outcome of examinations by taxing authorities are always uncertain, it is the opinion of management that the resolution of these audits will not have a material effect on the Company’s Consolidated Financial Statements. The Company has successfully closed their audit in the U.S. during the second quarter of 2016 for the acquired entity Technology Solutions Group for the tax year 2012 (prior to acquisition), with no changes. The Company also closed their audit in the fourth quarter of 2016 in New Zealand for tax years 2013 and 2014 with no changes.

TELETECH HOLDINGS, INC. AND SUBSIDIARIES Notes to the Consolidated Financial Statements
F-38
(11) RESTRUCTURING CHARGES AND IMPAIRMENT LOSSES
Restructuring Charges
During the years ended December 31, 2016, 2015 and 2014, the Company continued restructuring activities primarily associated with reductions in the Company’s capacity, workforce and related management in all of its segments to better align the capacity and workforce with current business needs.
A summary of the expenses recorded in Restructuring, net in the accompanying Consolidated Statements of Comprehensive Income (Loss) for the years ended December 31, 2016, 2015 and 2014, respectively, is as follows (in thousands): Year Ended December 31, 2016 2015 2014 Reduction in force
Customer Management Services $ 2,837 $ 1,482 $ 2,182 Customer Growth Services 147 22 56 Customer Technology Services 324 13 709 Customer Strategy Services 92 297 389
Total $ 3,400 $ 1,814 $ 3,336 Year Ended December 31, 2016 2015 2014 Facility exit and other charges
Customer Management Services $ 959 $ — $ 14 Customer Growth Services — — — Customer Technology Services 33 — — Customer Strategy Services — — —
Total $ 992 $ — $ 14 A rollforward of the activity in the Company’s restructuring accruals for the years ended December 31, 2016 and 2015, respectively, is as follows (in thousands):
Reduction Facility Exit and in Force Other Charges Total Balance as of December 31, 2014 $ 2,071 $ — $ 2,071
Expense 1,814 — 1,814 Payments (2,869) — (2,869) Changes due to foreign currency (210) (210) Changes in estimates — — —
Balance as of December 31, 2015 806 — 806 Expense 3,728 992 4,720 Payments (2,646) (894) (3,540) Changes due to foreign currency (92) — (92) Changes in estimates (328) — (328)
Balance as of December 31, 2016 $ 1,468 $ 98 $ 1,566 The remaining restructuring accruals are expected to be paid or extinguished during 2017 and are all classified as current liabilities within Other accrued expenses in the Consolidated Balance Sheets.

TELETECH HOLDINGS, INC. AND SUBSIDIARIES Notes to the Consolidated Financial Statements
F-39
Impairment Losses
During each of the periods presented, the Company evaluated the recoverability of its leasehold improvement assets at certain customer engagement centers. An asset is considered to be impaired when the anticipated undiscounted future cash flows of its asset group are estimated to be less than the asset group’s carrying value. The amount of impairment recognized is the difference between the carrying value of the asset group and its fair value. To determine fair value, the Company used Level 3 inputs in its discounted cash flows analysis. Assumptions included the amount and timing of estimated future cash flows and assumed discount rates. During 2016, 2015 and 2014, the Company recognized impairment losses related to leasehold improvement assets of zero, $0.4 million, and $0.4 million, respectively, in its Customer Management Services segment.
(12) INDEBTEDNESS
Credit Facility
On February 11, 2016, the Company entered into a First Amendment to our June 3, 2013 Amended and Restated Credit Agreement and Amended and Restated Security Agreement (collectively the “Credit Agreement”) for a senior secured revolving credit facility (the “Credit Facility”) with a syndicate of lenders led by Wells Fargo Bank, National Association. The Credit Agreement provides for a secured revolving credit facility that matures on February 11, 2021 with an initial maximum aggregate commitment of $900.0 million, and an accordion feature of up to $1.2 billion in the aggregate, if certain conditions are satisfied.
Base rate loans bear interest at a rate equal to the greatest of (i) Wells Fargo’s prime rate, (ii) one half of 1% in excess of the federal funds effective rate, and (iii) 1.25% in excess of the one month London Interbank Offered Rate (“LIBOR”); plus in each case a margin of 0% to 0.75 based on our net leverage ratio. Eurodollar loans bear interest at LIBOR plus a margin of 1.0% to 1.75% based on our net leverage ratio. Alternate currency loans bear interest at rates applicable to their respective currencies.
Letter of credit fees are one eighth of 1% of the stated amount of the letter of credit on the date of issuance, renewal or amendment, plus an annual fee equal to the borrowing margin for Eurodollar loans.
The Credit Facility commitment fees are payable to the lenders in an amount equal to the unused portion of the Credit Facility at a rate of 0.125% to 0.250% based on our net leverage ratio.
The Company is obligated to maintain a maximum net leverage ratio of 3.25 to 1.00, and a minimum interest coverage ratio of 2.50 to 1.00.
The Company primarily utilizes its Credit Agreement to fund working capital, general operations, stock repurchases, dividends, and other strategic activities, such as the acquisitions described in Note 2. As of December 31, 2016, and 2015, the Company had borrowings of $217.3 million and $100.0 million, respectively, under its Credit Agreement, and its average daily utilization was $375.3 million and $319.6 million for the years ended December 31, 2016 and 2015, respectively. Based on the current level of availability based on the covenant calculations the Company’s remaining borrowing capacity was approximately $370 million as of December 31, 2016. As of December 31, 2016, the Company was in compliance with all covenants and conditions under its Credit Agreement.
(13) DEFERRED REVENUE AND COSTS Deferred revenue in the accompanying Consolidated Balance Sheets consist of the following (in thousands): December 31, 2016 2015 Deferred Revenue - Current $ 23,318 $ 26,184 Deferred Revenue - Long-term 8,851 17,823
Total Deferred Revenue $ 32,169 $ 44,007

TELETECH HOLDINGS, INC. AND SUBSIDIARIES Notes to the Consolidated Financial Statements
F-40
Deferred costs in the accompanying Consolidated Balance Sheets consist of the following (in thousands): December 31, 2016 2015 Deferred Costs - Current $ 14,755 $ 16,905 Deferred Costs - Long-term 8,124 11,472
Total Deferred Costs $ 22,879 $ 28,377
(14) COMMITMENTS AND CONTINGENCIES
Letters of Credit
As of December 31, 2016, outstanding letters of credit under the Credit Agreement totaled $3.9 million and primarily guaranteed workers’ compensation and other insurance related obligations. As of December 31, 2016, letters of credit and contract performance guarantees issued outside of the Credit Agreement totaled $6.6 million.
Guarantees
Indebtedness under the Credit Agreement is guaranteed by certain of the Company’s present and future domestic subsidiaries.
Legal Proceedings
From time to time, the Company has been involved in legal actions, both as plaintiff and defendant, which arise in the ordinary course of business. The Company accrues for exposures associated with such legal actions to the extent that losses are deemed both probable and reasonably estimable. To the extent specific reserves have not been made for certain legal proceedings, their ultimate outcome, and consequently, an estimate of possible loss, if any, cannot reasonably be determined at this time.
Based on currently available information and advice received from counsel, the Company believes that the disposition or ultimate resolution of any current legal proceedings, except as otherwise specifically reserved for in its financial statements, will not have a material adverse effect on the Company’s financial position, cash flows or results of operations. (15) LEASES
The Company has various operating leases primarily for customer engagement centers, equipment, and office space, which generally contain renewal options. Rent expense under operating leases was approximately $39.5 million, $37.7 million and $33.2 million for the years ended December 31, 2016, 2015 and 2014, respectively.
In 2008, the Company sub-leased one of its customer engagement centers to a third party for the remaining term of the original lease. The sub-lease began on January 1, 2009 and rental income is recognized on a straight-line basis over the term of the sub-lease through 2021. Future minimum sub-lease rental receipts are shown in the table below.

TELETECH HOLDINGS, INC. AND SUBSIDIARIES Notes to the Consolidated Financial Statements
F-41
The future minimum rental payments and receipts required under non-cancelable operating leases as of December 31, 2016 are as follows (in thousands):
Operating
Sub-Lease
Leases Income 2017 $ 39,362 $ (2,234) 2018 34,825 (2,470) 2019 25,776 (2,470) 2020 18,984 (2,470) 2021 15,388 (206) Thereafter 32,364 —
Total $ 166,699 $ (9,850) The Company records operating lease expense on a straight-line basis over the life of the lease as described in Note 1. The deferred lease liability as of December 31, 2016 and 2015 was $15.3 million and $11.8 million, respectively.
Asset Retirement Obligations
The Company records asset retirement obligations (“ARO”) for several of its customer engagement center leases. Capitalized costs related to ARO’s are included in Other long-term assets in the accompanying Consolidated Balance Sheets while the ARO liability is included in Other long-term liabilities in the accompanying Consolidated Balance Sheets. Following is a summary of the amounts recorded (in thousands): Balance at Balance at December 31, Additions and December 31, 2015 Modifications Accretion Settlements 2016 ARO liability total $ 1,641 $ 333 $ 15 $ (128) $ 1,861 Balance at Balance at December 31, Additions and December 31, 2014 Modifications Accretion Settlements 2015 ARO liability total $ 1,941 $ (136) $ 49 $ (213) $ 1,641 Increases to ARO result from a new lease agreement or modifications on an ARO from a preexisting lease agreement. Modifications to ARO liabilities and accumulated accretion occur when lease agreements are amended or when assumptions change, such as the rate of inflation. Modifications are accounted for prospectively as changes in estimates. Settlements occur when leased premises are vacated and the actual cost of restoration is paid. Differences between the actual costs of restoration and the balance recorded as ARO liabilities are recognized as gains or losses in the accompanying Consolidated Statements of Comprehensive Income (Loss).

TELETECH HOLDINGS, INC. AND SUBSIDIARIES Notes to the Consolidated Financial Statements
F-42
(16) MANDATORILY REDEEMABLE NONCONTROLLING INTEREST
The Company held an 80% interest in iKnowtion until January 1, 2016 when the additional 20% was purchased. In the event iKnowtion met certain EBITDA targets for calendar year 2015, the purchase and sale agreement required TeleTech to purchase the remaining 20% interest in iKnowtion in 2016 for an amount equal to a multiple of iKnowtion’s 2015 EBITDA as defined in the purchase and sale agreement. These terms represented a contingent redemption feature which the Company determined was probable of being achieved.
Based on final EBITDA for 2015, the payment for the remaining 20% was completed in April 2016 for the value shown in the table below in accordance with the purchase and sale agreement.
The Company has recorded the mandatorily redeemable noncontrolling interest at the redemption value based on the corresponding EBITDA multiples as prescribed in the purchase and sale agreement at the end of each reporting period. At the end of each reporting period the changes in the redemption value are recorded in retained earnings. Since the EBITDA multiples as defined in the purchase and sale agreement are below the current market multiple, the Company has determined that there is no preferential treatment to the noncontrolling interest shareholders resulting in no impact to earnings per share.
A rollforward of the mandatorily redeemable noncontrolling interest is as follows (in thousands):
Year Ended December 31, 2016 2015 Mandatorily redeemable noncontrolling interest, January 1 $ 4,131 $ 2,814 Net income attributable to mandatorily redeemable noncontrolling interest — 837 Working capital distributed to mandatorily redeemable noncontrolling interest (492) (633) Change in redemption value 466 1,113 Purchase of mandatorily redeemable noncontrolling interest (4,105) — Mandatorily redeemable noncontrolling interest, December 31 $ — $ 4,131

TELETECH HOLDINGS, INC. AND SUBSIDIARIES Notes to the Consolidated Financial Statements
F-43
(17) ACCUMULATED OTHER COMPREHENSIVE INCOME (LOSS)
The following table presents changes in the accumulated balance for each component of Other comprehensive income (loss), including current period other comprehensive income (loss) and reclassifications out of accumulated other comprehensive income (loss) (in thousands):
Foreign Currency Derivative Translation Valuation, Net Other, Net Adjustment of Tax of Tax Totals Accumulated other comprehensive income (loss) at December 31, 2013 $ (10,581) $ (8,352) $ (1,653) $ (20,586)
Other comprehensive income (loss) before reclassifications (22,771) (12,121) 44 (34,848) Amounts reclassified from accumulated other comprehensive
income (loss) — 2,128 1,032 3,160 Net current period other comprehensive (income) loss (22,771) (9,993) 1,076 (31,688)
Accumulated other comprehensive income (loss) at December 31, 2014 $ (33,352) $ (18,345) $ (577) $ (52,274) Accumulated other comprehensive income (loss) at December 31, 2014 $ (33,352) $ (18,345) $ (577) $ (52,274)
Other comprehensive income (loss) before reclassifications (37,844) (16,349) (3,614) (57,807) Amounts reclassified from accumulated other comprehensive
(income) loss — 7,809 907 8,716 Net current period other comprehensive income (loss) (37,844) (8,540) (2,707) (49,091)
Accumulated other comprehensive income (loss) at December 31, 2015 $ (71,196) $ (26,885) $ (3,284) $ (101,365) Accumulated other comprehensive income (loss) at December 31, 2015 $ (71,196) $ (26,885) $ (3,284) $ (101,365)
Other comprehensive income (loss) before reclassifications (20,812) 11,242 1,902 (7,668) Amounts reclassified from accumulated other comprehensive
(income) loss — (16,750) (1,181) (17,931) Net current period other comprehensive income (loss) (20,812) (5,508) 721 (25,599)
Accumulated other comprehensive income (loss) at December 31, 2016 $ (92,008) $ (32,393) $ (2,563) $ (126,964)

TELETECH HOLDINGS, INC. AND SUBSIDIARIES Notes to the Consolidated Financial Statements
F-44
The following table presents the classification and amount of the reclassifications from Accumulated other comprehensive income (loss) to the Statement of Comprehensive Income (Loss) (in thousands):
Statement of For the Year Ended December 31, Comprehensive Income 2016 2015 2014 (Loss) Classification Derivative valuation
Gain (loss) on foreign currency forward exchange contracts $ (28,025) $ (12,410) $ (2,429) Revenue Loss on interest rate swaps (534) (1,053) (1,060) Interest expense Tax effect 11,809 5,654 1,361 Provision for income taxes
$ (16,750) $ (7,809) $ (2,128) Net income (loss) Other
Actuarial loss on defined benefit plan $ (1,310) $ (1,008) $ (1,098) Cost of services Tax effect 129 101 66 Provision for income taxes
$ (1,181) $ (907) $ (1,032) Net income (loss)
(18) NET INCOME PER SHARE
The following table sets forth the computation of basic and diluted shares for the periods indicated (in thousands): Year Ended December 31, 2016 2015 2014 Shares used in basic earnings per share calculation 47,423 48,370 49,297
Effect of dilutive securities: Stock options 10 275 413 Restricted stock units 286 338 392 Performance-based restricted stock units 17 28 —
Total effects of dilutive securities 313 641 805 Shares used in dilutive earnings per share calculation 47,736 49,011 50,102 For the years ended December 31, 2016, 2015 and 2014, 0.1 million, 0.1 million and 0.1 million, respectively, of options to purchase shares of common stock were outstanding but not included in the computation of diluted net income per share because the exercise price exceeded the value of the shares and the effect would have been anti-dilutive. For the years ended December 31, 2016, 2015 and 2014, restricted stock units of 0.1 million, 0.4 million, and 0.2 million, respectively, were outstanding but not included in the computation of diluted net income per share because the effect would have been anti-dilutive. For the years ended December 31, 2016, 2015 and 2014, there were no performance-based restricted stock units outstanding but not included in the computation of diluted net income per share.

TELETECH HOLDINGS, INC. AND SUBSIDIARIES Notes to the Consolidated Financial Statements
F-45
(19) EMPLOYEE COMPENSATION PLANS
Employee Benefit Plan
The Company currently has a 401(k) profit-sharing plan that allows participation by U.S. employees who have completed six months of service, as defined, and are 21 years of age or older. Participants may defer up to 75% of their gross pay, up to a maximum limit determined by U.S. federal law. Participants are also eligible for a matching contribution. The Company may from time to time, at its discretion, make a “matching contribution” based on the amount and rate of the elective deferrals. The Company determines how much, if any, it will contribute for each dollar of elective deferrals. Participants vest in matching contributions over a three-year period. Company matching contributions to the 401(k) plan(s) totaled $5.1 million, $4.6 million and $4.8 million for the years ended December 31, 2016, 2015 and 2014, respectively.
Equity Compensation Plans
In February 1999, the Company adopted the TeleTech Holdings, Inc. 1999 Stock Option and Incentive Plan (the “1999 Plan”). An aggregate of 14.0 million shares of common stock were reserved for issuance under the 1999 Plan, which permitted the award of incentive stock options, non-qualified stock options, stock appreciation rights, shares of restricted common stock and restricted stock units (“RSUs”). The 1999 Plan also provided for annual equity-based compensation grants to members of the Company’s Board of Directors. Options granted to employees generally vested over four to five years and had a contractual life of ten years. Options issued to Directors vested immediately and had a contractual life of ten years. In May 2009, the Company adopted a policy to issue RSUs to Directors, which generally vest over one year.
In May 2010, the Company adopted the 2010 Equity Incentive Plan (the “2010 Plan”). Upon adoption of the 2010 Plan, all authorized and unissued equity in the 1999 Plan was cancelled. An aggregate of 4.0 million shares of common stock has been reserved for issuance under the 2010 Plan, which permits the award of incentive stock options, non-qualified stock options, stock appreciation rights, shares of restricted common stock and RSUs. As of December 31, 2016, a total of 4.0 million shares were authorized and 1.2 million shares were available for issuance under the 2010 Plan.
For the years ended December 31, 2016, 2015, and 2014, the Company recorded total equity-based compensation expense under all equity-based arrangements (stock options and RSUs) of $9.8 million, $11.3 million and $11.3 million, respectively. For 2016, 2015 and 2014, of the total compensation expense, $3.1 million, $2.9 million and $2.3 million was recognized in Cost of services and $6.7 million, $8.4 million and $9.0 million, was recognized in Selling, general and administrative in the Consolidated Statements of Comprehensive Income (Loss), respectively. For the years ended December 31, 2016, 2015, and 2014, the Company recognized a tax benefit under all equity-based arrangements (stock options and RSUs) of $5.0 million, $6.7 million and $6.3 million, respectively.
Restricted Stock Units
2014, 2015 and 2016 RSU Awards: The Company granted RSUs in 2014, 2015 and 2016 to new and existing employees that vest over four or five years. The Company also granted RSUs in 2014, 2015 and 2016 to members of the Board of Directors that vest over one year.
During 2011, the Company granted 100,000 performance-based RSUs to a key employee that vest based on the Company achieving specified revenue and operating income performance in 2014. The Company determined the performance targets were not met; and therefore these RSUs did not vest and were forfeited. During 2014, the Company granted to a different key employee RSUs based on revenue and operating income performance for a reporting segment of the Company; these performance conditions were partially met and therefore 8,394 RSUs were issued. These RSUs vest over a four year period.
During 2015, the Company granted performance-based RSUs to an executive the amount of which is determinable based on a reporting segment of the Company achieving incremental operating income for each year from 2015-2017. During 2015 and 2016, based on operating income performance for a reporting segment of the Company approximately $0.4 million and $0.1 million of RSUs were earned. These RSUs were or will be granted in March 2016 and March 2017, respectively, and will vest 12 months from the grant date.

TELETECH HOLDINGS, INC. AND SUBSIDIARIES Notes to the Consolidated Financial Statements
F-46
Summary of RSUs: Settlement of the RSUs shall be made in shares of the Company’s common stock by delivery of one share of common stock for each RSU then being settled. The Company calculates the fair value for RSUs based on the closing price of the Company’s stock on the date of grant and records compensation expense over the vesting period using a straight-line method. The Company factors an estimated forfeiture rate in calculating compensation expense on RSUs and adjusts for actual forfeitures upon the vesting of each tranche of RSUs. The Company also factors in the present value of the estimated dividend payments that will have accrued as these RSUs are vesting.
The weighted average grant-date fair value of RSUs, including performance-based RSUs, granted during the years ended December 31, 2016, 2015, and 2014 was $26.60, $26.52, and $26.92, respectively. The total intrinsic value and fair value of RSUs vested during the years ended December 31, 2016, 2015, and 2014 was $10.8 million, $13.0 million, and $12.4 million, respectively.
A summary of the status of the Company’s non-vested RSUs and performance-based RSUs and activity for the year ended December 31, 2016 is as follows: Weighted Average Grant Date Shares Fair Value Unvested as of December 31, 2015 1,555,466 $ 25.25
Granted 462,694 $ 26.60 Vested (438,931) $ 24.61 Cancellations/expirations (411,608) $ 26.10
Unvested as of December 31, 2016 1,167,621 $ 25.29 All RSUs vested during the year ended December 31, 2016 were issued out of treasury stock. As of December 31, 2016, there was approximately $20.0 million of total unrecognized compensation expense and approximately $35.6 million in total intrinsic value related to non-vested RSU grants. The unrecognized compensation expense will be recognized over the remaining weighted-average vesting period of 1.5 years using the straight-line method.
Stock Options
During the year ended December 31, 2011, the Company granted 150,000 stock options to a key employee. The stock option award is made up of four separate tranches. Each tranche will vest based on certain stock price targets (market conditions). The grant date fair values of each tranche were calculated using a Monte Carlo simulation model in addition to a time-based binomial lattice model. The following table provides the assumptions used in the time-based binomial lattice model for each tranche granted:
Year Ended December 31, 2011 Risk-free interest rate 2.1 % Expected life in years 1.3 - 2.7 Expected volatility 54.4 % Dividend yield — % Weighted-average volatility 54.4 %
The Company estimated the expected term based on historical averages of option exercises and expirations. The calculation of expected volatility is based on the historical volatility of the Company’s common stock over the expected term. The risk-free interest rate is based on the yield on the grant measurement date of a traded zero-coupon U.S. Treasury bond, as reported by the U.S. Federal Reserve, with a term equal to the expected term of the stock option granted. The Company factored an estimated forfeiture rate and adjusted for actual forfeitures upon the vesting of each tranche of options.

TELETECH HOLDINGS, INC. AND SUBSIDIARIES Notes to the Consolidated Financial Statements
F-47
A summary of stock option activity for the year ended December 31, 2016 is as follows: Weighted Weighted Average Aggregate Average Remaining Intrinsic Exercise Contract Value Shares Price Term in Years (000’s) Outstanding as of December 31, 2015 241,164 $ 21.11
Exercises (29,031) $ 12.98 $ 400 Post-vest cancellations/expirations (20,467) $ 16.46
Outstanding as of December 31, 2016 191,666 $ 22.83 3.23 $ Vested and exercisable as of December 31, 2016 75,000 $ 31.42 0.68 $ (69) During the third quarter of 2015, Mr. Kenneth D. Tuchman, the Chairman and Chief Executive Officer of TeleTech, exercised the option he received from the Company in 2005 to purchase 800,000 shares of TeleTech stock at the strike price of $11.35 per share. To effectuate a “cashless exercise” of the option, on August 24, 2015, Mr. Tuchman entered into a Stock Purchase Agreement with the Company, under the terms of which he exercised the option at the end of business on August 31, 2015 and, upon issuance of the option shares, sold to TeleTech, in a simultaneous transaction, a number of shares necessary to pay the option exercise price plus any tax withholding obligations. The option shares were valued at the market price of the close of business on that date. Mr. Tuchman’s option, granted under TeleTech’s 1999 Stock Option and Incentive Plan, was fully vested and set to expire in November, 2015, The Stock Purchase Agreement was approved by the independent members of TeleTech’s Board of Directors who deemed it to be in the best interest of the Company and all its shareholders.
There were no stock options granted during 2016, 2015 or 2014. The total intrinsic value of options exercised during the years ended December 31, 2016, 2015 and 2014 was $400 thousand, $13.9 million and $0.8 million, respectively. The total fair value of stock options vested during the years ended December 31, 2016, 2015 and 2014 was zero, respectively.
As of December 31, 2016, there was approximately $100 thousand of unrecognized compensation expense related to non-vested stock options. The unrecognized compensation expense will be recognized over the remaining weighted-average derived service period of 1.4 years using the straight-line method.
Cash received from option exercises under the Plans for the years ended December 31, 2016, 2015 and 2014 was $0.4 million, $0.8 million and $0.4 million, respectively. The recognized tax benefit from option exercises for the years ended December 31, 2016, 2015 and 2014 was $0.2 million, $1.0 million and $0.3 million, respectively. Shares issued for options exercised during the year ended December 31, 2016 were issued out of treasury stock. (20) STOCK REPURCHASE PROGRAM Stock Repurchase Program The Company has a stock repurchase program, which was initially authorized by the Company’s Board of Directors in November 2001. As of December 31, 2016, the cumulative authorized repurchase allowance was $737.3 million. During the year ended December 31, 2016, the Company purchased 2.7 million shares for $74.7 million. Since inception of the program, the Company has purchased 45.5 million shares for $717.4 million. As of December 31, 2016, the remaining allowance under the program was approximately $19.9 million. For the period from January 1, 2017 through February 28, 2017, the Company purchased 234 thousand additional shares at a cost of $7.0 million. The stock repurchase program does not have an expiration date. On February 23, 2017, the Board of Directors authorized an increase in the share repurchase allowance of $25 million.

TELETECH HOLDINGS, INC. AND SUBSIDIARIES Notes to the Consolidated Financial Statements
F-48
(21) RELATED PARTY TRANSACTIONS
The Company entered into an agreement under which Avion, LLC (“Avion”) and Airmax LLC (“Airmax”) provide certain aviation flight services as requested by the Company. Such services include the use of an aircraft and flight crew. Kenneth D. Tuchman, Chairman and Chief Executive Officer of the Company, has a direct 100% beneficial ownership interest in Avion and Airmax. During 2016, 2015 and 2014, the Company expensed $1.0 million, $1.7 million and $1.0 million, respectively, to Avion and Airmax for services provided to the Company. There was $80 thousand in payments due and outstanding to Avion and Airmax as of December 31, 2016.
During 2014, the Company entered into a vendor contract with Convercent Inc. to provide learning management and web and telephony based global helpline solutions. This contract was renewed, after an arms-length market pricing review, in the fourth quarter of 2016. The majority owner of Convercent is a company which is owned and controlled by Kenneth D. Tuchman, Chairman and Chief Executive Officer of the Company. During 2016, 2015 and 2014, the Company paid $100 thousand, $100 thousand and $20 thousand, respectively, to Convercent and is expecting to spend another $60 thousand with Convercent during 2017.
During 2015, the Company entered into a vendor contract with Netlink to help the Company develop a key stroke monitoring solution. Shrikant Mehta, one of the Board of Directors, has an ownership interest in Netlink. During 2015, the Company paid $98 thousand to Netlink for these services. The Company did not use Netlink services in 2016 and has no plans to make additional payment to Netlink at this time.
During 2015, the Company entered into a contract to purchase software from CaféX, which is a company that TeleTech holds a 17.0% equity investment in. During the second quarter of 2015, and the fourth quarter of 2016, the Company purchased $0.4 million and $0.25 million, respectively, of software from CaféX. See Note 2 for further information regarding this investment.
(22) OTHER FINANCIAL INFORMATION Self-insurance liabilities of the Company which are included in Accrued employee compensation and benefits and Other accrued expenses in the accompanying Consolidated Balance Sheets were as follows (in thousands): December 31, 2016 2015 Workers compensation $ 1,523 $ 2,320 Employee health and dental insurance 4,908 4,429 Other insurance — 1,202
Total self-insurance liabilities $ 6,431 $ 7,951

TELETECH HOLDINGS, INC. AND SUBSIDIARIES Notes to the Consolidated Financial Statements
F-49
(23) QUARTERLY FINANCIAL DATA (UNAUDITED)
The following tables present certain quarterly financial data for the year ended December 31, 2016 (in thousands except per share amounts). First Second Third Fourth Quarter Quarter Quarter Quarter Revenue $ 312,410 $ 305,105 $ 312,796 $ 344,947 Cost of services 231,340 226,768 233,541 249,943 Selling, general and administrative 45,500 44,774 40,628 44,895 Depreciation and amortization 17,729 17,221 16,811 16,914 Restructuring charges, net 88 114 3,688 502 Impairment losses — — 5,602 26,448
Income from operations 17,753 16,228 12,526 6,245 Other income (expense) (1,320) (734) (690) 290 (Provision for) benefit from income taxes (4,528) (2,952) 813 (6,196) Non-controlling interest (680) (926) (1,198) (953)
Net income (loss) attributable to TeleTech stockholders $ 11,225 $ 11,616 $ 11,451 $ (614) Weighted average shares outstanding
Basic 48,368 47,873 47,081 46,386 Diluted 48,746 48,221 47,315 46,677
Net income per share attributable to TeleTech stockholders
Basic $ 0.23 $ 0.24 $ 0.24 $ (0.01) Diluted $ 0.23 $ 0.24 $ 0.24 $ (0.01)
Included in Other income (expense) in the third quarter is $4.3 million benefit related to fair value adjustments to the contingent consideration related to revised estimates of the performance against the targets for one of the Company’s acquisitions.
Included in Other income (expense) in the third quarter is a $5.3 million expense related to the determination that two business units would be divested and are being reported as Assets Held for Sale.
Included in the Provision for Income Taxes is a $1.3 million benefit in the third quarter and a $0.2 million benefit in the fourth quarter related to restructuring charges. Also included are a $0.1 million of benefit in the first quarter, $1.0 milliion of expense in the second quarter, and $0.4 million of benefit in the fourth quarter related to changes in valuation allowances. Also included are $0.7 million of expense recorded in the second quarter, $0.6 million of expense recorded in the third quarter and $0.4 million of expnse recorded in the fourth quarter related to return to provision adjustments. Additionally, in the fourth quarter there was $1.1 million of expense related to a transfer pricing adjustment for a prior period. Also included are a $0.5 million expense in the fourth quarter related to tax rate changes. Finally, there was a $1.5 million benefit in the third quarter and a $8.3 million benefit in the fourth quarter related to impairments and assets held for sale.

TELETECH HOLDINGS, INC. AND SUBSIDIARIES Notes to the Consolidated Financial Statements
F-50
The following tables present certain quarterly financial data for the year ended December 31, 2015 (in thousands except per share amounts). First Second Third Fourth Quarter Quarter Quarter Quarter Revenue $ 325,521 $ 310,223 $ 309,195 $ 341,816 Cost of services 232,984 223,617 225,978 245,668 Selling, general and administrative 50,237 47,376 48,418 48,575 Depreciation and amortization 15,363 15,680 15,486 17,279 Restructuring charges, net 809 198 622 185 Impairment losses — — 3,066 5,034
Income from operations 26,128 23,352 15,625 25,075 Other income (expense) (1,688) (18) (1,995) (590) Provision for income taxes (4,405) (7,841) (1,192) (6,566) Non-controlling interest (1,263) (797) (1,243) (916)
Net income attributable to TeleTech stockholders $ 18,772 $ 14,696 $ 11,195 $ 17,003 Weighted average shares outstanding
Basic 48,370 48,325 48,345 48,439 Diluted 49,158 49,064 48,936 48,853
Net income per share attributable to TeleTech stockholders
Basic $ 0.39 $ 0.30 $ 0.23 $ 0.35 Diluted $ 0.38 $ 0.30 $ 0.23 $ 0.35
Included in the fourth quarter is an additional $2.9 million expense related to the correction of an error in goodwill impairment annual assessment that should have been recorded in the fourth quarter of 2014 and the third quarter of 2015. See Note 1 for further information.
Included in Other income (expense) in the second, the third and the fourth quarters are a $0.5 million benefit, a $0.8 million expense and a $0.3 million benefit related to fair value adjustments to the contingent consideration related to revised estimates of the performance against the targets for two of the Company’s acquisitions.
Included in the Provision for Income Taxes is a $0.3 million benefit in the first quarter, a $0.1 million benefit in the second quarter, a $0.2 million benefit in the third quarter and a $0.1 million benefit in the fourth quarter related to restructuring charges. Also included are a $0.3 million of benefit in the first quarter, $0.2 million of expense in the second quarter and $1.2 million of expense in the fourth quarter related to changes in valuation allowances. Additionally, in the second quarter there was $1.5 million of expense related to the recording of an uncertain tax position. Finally, there was a $0.5 million benefit in the first quarter related to tax rate changes, a $1.3 million benefit in the third quarter and a $1.3 million benefit in the fourth quarter related to impairments and $1.3 million of expense in the fourth quarter related to various state NOL’s.
Included in the second quarter is a $1.75 million additional estimated tax liability that should have been recorded in prior periods related to ongoing discussions with relevant government authorities related to site compliance with tax advantaged status. See Note 1 for further information.

Table of Contents
F-51
EXHIBIT INDEX
Exhibit No. Description 3.01**
Restated Certificate of Incorporation of TeleTech Holdings, Inc. filed with the State of Delaware on August 1, 1996 (incorporated by reference to Exhibit 3.1 to TeleTech’s Amendment No. 2 to Form S-1 Registration Statement (Registration No. 333-04097) filed on July 5, 1996)
3.02**
Amended and Restated Bylaws of TeleTech Holdings, Inc., effective February 22, 2017 (incorporated by reference to Exhibit 3.02 to TeleTech’s Current Report on Form 8-K filed on February 27, 2017)
10.06**
TeleTech Holdings, Inc. 2010 Equity Incentive Plan (incorporated by reference as Appendix A to TeleTech’s Definitive Proxy Statement, filed April 12, 2010)
10.24**
Form of Restricted Stock Unit Agreement (Section 16 Officers) (incorporated by reference as Exhibit 4.3 to TeleTech’s Form S-8 Registration Statement (Registration No. 333-167300) filed on June 3, 2010)
10.25**
Form of Restricted Stock Unit Agreement (Non-Section 16 Employees) (incorporated by reference as Exhibit 4.4 to TeleTech’s Form S-8 Registration Statement (Registration No. 333-167300) filed on June 3, 2010)
10.27**
Form of Global Restricted Stock Unit Agreement (Operating Committee Member) (incorporated by reference to Exhibit 10.1 to TeleTech’s Quarterly Report on Form 10-Q filed on May 1, 2013)
10.28**
Form of Global Restricted Stock Unit Agreement (Non-Operating Committee Member) (incorporated by reference as Exhibit 10.2 to TeleTech’s Quarterly Report on Form 10-Q filed on May 1, 2013)
10.29**
Form of TeleTech Holdings, Inc. Restricted Stock Unit Award Agreement (other employees) effective July 1, 2014 (incorporated by reference as Exhibit 10.29 to TeleTech’s Annual Report on Form 10-K for the year ended December 31, 2014)
10.30**
Form of TeleTech Holdings, Inc. Restricted Stock Unit Award Agreement (Directors and Executive Committee Members) effective July 1, 2014 (incorporated by reference as Exhibit 10.30 to TeleTech’s Annual Report on Form 10-K for the year ended December 31, 2014)
10.32**
Independent Director Compensation Arrangements (effective January 1, 2016) (incorporated by reference as Exhibit 10.32 to TeleTech’s Annual Report on Form 10-K for the year ended December 31, 2015)
10.33**
Form of Indemnification Agreement with Directors (incorporated by reference as Exhibit 10.1 to TeleTech’s Current Report on Form 8-K filed on February 22, 2010)
10.40**
Employment Agreement between Kenneth D. Tuchman and TeleTech dated October 15, 2001 (incorporated by reference as Exhibit 10.68 to TeleTech’s Annual Report on Form 10-K for the year ended December 31, 2001)

Table of Contents
F-52
Exhibit No. Description 10.41**
Amendment to Employment Agreement between Kenneth D. Tuchman and TeleTech dated December 31, 2008 (incorporated by reference as Exhibit 10.17 to TeleTech’s Annual Report on Form 10-K for the year ended December 31, 2008)
10.60**
Employment Agreement between Regina Paolillo and TeleTech Holdings, Inc. effective as of November 3, 2011 (incorporated by reference as Exhibit 10.1 to TeleTech’s Current Report on Form 8-K filed October 27, 2011)
10.63**
Non-Qualified Stock Option Agreement dated as of November 15, 2011 between TeleTech Holdings, Inc. and Regina Paolillo (Option Agreement)(incorporated by reference as Exhibit 10.3 to TeleTech’s Current Report on Form 8-K/A filed November 21, 2011)
10.81**
Employment Agreement between Robert N. Jimenez and TeleTech Services Corporation effective as of April 20, 2015 (incorporated by reference as Exhibit 10.81 to TeleTech’s Quarterly Report on Form 10-Q for the quarter ended March 31, 2015)
10.82**
Employment Agreement between Judi Hand and TeleTech Services Corporation effective as of July 1, 2016 (incorporated by reference as Exhibit 10.82 to TeleTech’s Quarterly Report on Form 10-Q for the quarter ended June 30, 2016)
10.83**
Employment Agreement between Martin DeGhetto and TeleTech Services Corporation effective as of July 1, 2016 (incorporated by reference as Exhibit 10.83 to TeleTech’s Quarterly Report on Form 10-Q for the quarter ended June 30, 2016)
10.90**
First Amendment to Amended and Restated Credit Agreement and First Amendment to Amended and Restated Security Agreement for the senior secured revolving credit facility with a syndicate of lenders led by Wells Fargo Bank, National Association, as agent, swing line and fronting lender. (Incorporated by reference to Exhibit 10.90 to TeleTech’s Form 8-K filed on February 16, 2016)
- 10.95
Share Purchase Agreement between TeleTech Europe BV and TeleTech Canada and Kilmer Capital Fund II L.P., 8169306 Canada Inc. Bank of Montreal, doing business as BMO Capital Partners, and certain management shareholders of November 9, 2016 (incorporated by reference as Exhibit 10.2 to TeleTech’s Quarterly Report on Form 10-Q for the quarter ended September 30, 2016)
21.1* List of subsidiaries 23.1* Consent of Independent Registered Public Accounting Firm 24.1* Power of Attorney 31.1* Rule 13a-14(a) Certification of CEO of TeleTech 31.2* Rule 13a-14(a) Certification of CFO of TeleTech 32.1*
Written Statement of Chief Executive Officer Pursuant to Section 906 of the Sarbanes-Oxley Act of 2002 (18 U.S.C. Section 1350)
32.2*
Written Statement of Chief Financial Officer Pursuant to Section 906 of the Sarbanes-Oxley Act of 2002 (18 U.S.C. Section 1350)
101.INS***
XBRL Instance Document

Table of Contents
F-53
Exhibit No. Description 101.SCH*** XBRL Taxonomy Extension Schema Document 101.CAL*** XBRL Taxonomy Extension Calculation Linkbase Document. 101.LAB*** XBRL Taxonomy Extension Label Linkbase Document 101.PRE*** XBRL Taxonomy Extension Presentation Linkbase Document 101.DEF*** XBRL Taxonomy Extension Definition Linkbase Document
* Filed or furnished herewith. ** Identifies exhibit that consists of or includes a management contract or compensatory plan or arrangement. *** Attached as Exhibit 101 to this report are the following documents formatted in XBRL (Extensible Business
Reporting Language): (i) Consolidated Balance Sheets as of December 31, 2016 and 2015, (ii) Consolidated Statements of Comprehensive Income (Loss) for the years ended December 31, 2016, 2015 and 2014, (iii) Consolidated Statements of Stockholders’ Equity for the years ended December 31, 2016, 2015 and 2014, (iv) Consolidated Statements of Cash Flows for the years ended December 31, 2016, 2015 and 2014, and (v) Notes to Consolidated Financial Statements.

Table of Contents
Exhibit 31. 1
CERTIFICATION
I, Kenneth D. Tuchman, certify that: 1. I have reviewed this Annual Report on Form 10-K of TeleTech Holdings, Inc.; 2. Based on my knowledge, this report does not contain any untrue statement of a material fact or omit to
state a material fact necessary to make the statements made, in light of the circumstances under which such statements were made, not misleading with respect to the period covered by this report;
3. Based on my knowledge, the financial statements, and other financial information included in this report,
fairly present in all material respects the financial condition, results of operations and cash flows of the registrant as of, and for, the periods presented in this report;
4. The registrant’s other certifying officer(s) and I are responsible for establishing and maintaining disclosure
controls and procedures (as defined in Exchange Act Rules 13a-15(e) and 15d-15(e)) and internal control over financial reporting (as defined in Exchange Act Rules 13a-15(f) and 15d-15(f)) for the registrant and have:
a. Designed such disclosure controls and procedures, or caused such disclosure controls and
procedures to be designed under our supervision, to ensure that material information relating to the registrant, including its consolidated subsidiaries, is made known to us by others within those entities, particularly during the period in which this report is being prepared;
b. Designed such internal control over financial reporting, or caused such internal control over financial
reporting to be designed under our supervision, to provide reasonable assurance regarding the reliability of financial reporting and the preparation of financial statements for external purposes in accordance with generally accepted accounting principles;
c. Evaluated the effectiveness of the registrant’s disclosure controls and procedures and presented in
this report our conclusions about the effectiveness of the disclosure controls and procedures, as of the end of the period covered by this report based on such evaluation; and
d. Disclosed in this report any change in the registrant’s internal control over financial reporting that
occurred during the registrant’s most recent fiscal quarter (the registrant’s fourth fiscal quarter in the case of an annual report) that has materially affected, or is reasonably likely to materially affect, the registrant’s internal control over financial reporting; and
5. The registrant’s other certifying officer(s) and I have disclosed, based on our most recent evaluation of
internal control over financial reporting, to the registrant’s auditors and the audit committee of the registrant’s board of directors (or persons performing the equivalent functions):
a. All significant deficiencies and material weaknesses in the design or operation of internal control over
financial reporting which are reasonably likely to adversely affect the registrant’s ability to record, process, summarize and report financial information; and
b. Any fraud, whether or not material, that involves management or other employees who have a
significant role in the registrant’s internal control over financial reporting.
By: /s/ Kenneth D. Tuchman Kenneth D. Tuchman Chairman and Chief Executive Officer (Principal Executive Officer) Date: March 16, 2017

Table of Contents
Exhibit 31.2
CERTIFICATION
I, Regina M. Paolillo, certify that: 1. I have reviewed this Annual Report on Form 10-K of TeleTech Holdings, Inc.; 2. Based on my knowledge, this report does not contain any untrue statement of a material fact or omit to
state a material fact necessary to make the statements made, in light of the circumstances under which such statements were made, not misleading with respect to the period covered by this report;
3. Based on my knowledge, the financial statements, and other financial information included in this report,
fairly present in all material respects the financial condition, results of operations and cash flows of the registrant as of, and for, the periods presented in this report;
4. The registrant’s other certifying officer(s) and I are responsible for establishing and maintaining disclosure
controls and procedures (as defined in Exchange Act Rules 13a-15(e) and 15d-15(e)) and internal control over financial reporting (as defined in Exchange Act Rules 13a-15(f) and 15d-15(f)) for the registrant and have:
a. Designed such disclosure controls and procedures, or caused such disclosure controls and
procedures to be designed under our supervision, to ensure that material information relating to the registrant, including its consolidated subsidiaries, is made known to us by others within those entities, particularly during the period in which this report is being prepared;
b. Designed such internal control over financial reporting, or caused such internal control over financial
reporting to be designed under our supervision, to provide reasonable assurance regarding the reliability of financial reporting and the preparation of financial statements for external purposes in accordance with generally accepted accounting principles;
c. Evaluated the effectiveness of the registrant’s disclosure controls and procedures and presented in
this report our conclusions about the effectiveness of the disclosure controls and procedures, as of the end of the period covered by this report based on such evaluation; and
d. Disclosed in this report any change in the registrant’s internal control over financial reporting that
occurred during the registrant’s most recent fiscal quarter (the registrant’s fourth fiscal quarter in the case of an annual report) that has materially affected, or is reasonably likely to materially affect, the registrant’s internal control over financial reporting; and
5. The registrant’s other certifying officer(s) and I have disclosed, based on our most recent evaluation of
internal control over financial reporting, to the registrant’s auditors and the audit committee of the registrant’s board of directors (or persons performing the equivalent functions):
a. All significant deficiencies and material weaknesses in the design or operation of internal control over
financial reporting which are reasonably likely to adversely affect the registrant’s ability to record, process, summarize and report financial information; and
b. Any fraud, whether or not material, that involves management or other employees who have a
significant role in the registrant’s internal control over financial reporting.
By: /s/ Regina M. Paolillo Regina M. Paolillo Chief Financial Officer (Principal Financial and Accounting Officer) Date: March 16, 2017

Table of Contents
Exhibit 32.1
Written Statement of Chief Executive Officer Pursuant to Section 906
of the Sarbanes-Oxley Act of 2002 (18 U.S.C. Section 1350)
The undersigned, the Chief Executive Officer of TeleTech Holdings, Inc. (the “Company”), hereby certifies that, to his knowledge on the date hereof:
a. The Annual Report on Form 10-K of the Company for the year ended December 31, 2016 filed on the date hereof with the Securities and Exchange Commission (the “Report”) fully complies with the requirements of Section 13(a) or 15(d) of the Securities Exchange Act of 1934; and
b. The information contained in the Report fairly presents, in all material respects, the financial condition
and results of operations of the Company.
By: /s/ Kenneth D. Tuchman Kenneth D. Tuchman Chief Executive Officer Date: March 16, 2017

Table of Contents
Exhibit 32.2
Written Statement of Chief Financial Officer Pursuant to Section 906
of the Sarbanes-Oxley Act of 2002 (18 U.S.C. Section 1350)
The undersigned, the Chief Financial Officer of TeleTech Holdings, Inc. (the “Company”), hereby certifies that, to his knowledge on the date hereof:
a. The Annual Report on Form 10-K of the Company for the year ended December 31, 2016 filed on the date hereof with the Securities and Exchange Commission (the “Report”) fully complies with the requirements of Section 13(a) or 15(d) of the Securities Exchange Act of 1934; and
b. The information contained in the Report fairly presents, in all material respects, the financial condition
and results of operations of the Company.
By: /s/ Regina M. Paolillo Regina M. Paolillo Chief Financial Officer Date: March 16, 2017

Corporate InformationDirectorsKenneth D. TuchmanFounder, Chairman of the Board
Steven J. AnenenFormer Chief Executive Officer, CDK Global, Inc.; former President of ADP Dealer Services; former Senior Vice President of North America Systems.
Tracy L. BahlExecutive Vice President, Health Plans, CVS Health; former Director, MedExpress; former Executive Chairman, Emdeon; former Chief Executive Officer, Uniprise
Gregory A. ConleyDirector, HaulHound.com; former Chief Executive Officer, Aha! Software; former Chief Executive Officer, Odyssey Group, SA
Robert N. FrerichsDirector, Merkle, Inc.; former International Chairman, Accenture, Inc.; former Chairman, Aricent Group; former Chairman, Avanade
Marc L. HoltzmanChief Executive Officer of Kazkommertsbank; Chairman, Bank of Kigali; former Director, FTI Consulting; former Chairman, Meridian Capital HK; former Vice Chairman, Barclays Capital
Shrikant MehtaChief Executive Officer, Combine International, Inc.; Director, Lenderlive, Little Switzerland and NETLINK
Executive OfficeKenneth D. TuchmanChief Executive Officer
Regina M. PaolilloExecutive Vice President; Chief Administrative and Financial Officer
Martin F. DeGhettoExecutive Vice President; Chief Operating Officer; Customer Management and Customer Growth Services
Judi A. HandExecutive Vice President; Chief Revenue Officer
Robert N. JimenezExecutive Vice President; Customer Strategy Services
Steven C. PollemaSenior Vice President; Customer Technology Services
Margaret B. McLeanSenior Vice President, General Counsel and Chief Risk Officer
Audit CommitteeGregory A. Conley, ChairmanSteven J. AnenenRobert N. Frerichs
Compensation CommitteeTracy L. Bahl, ChairmanGregory A. ConleyRobert N. Frerichs
Nominating and Governance CommitteeRobert N. Frerichs, ChairmanSteven J. AnenenTracy L. Bahl
Executive CommitteeKenneth D. Tuchman, ChairmanTracy L. BahlShrikant Mehta
Stock ListingNASDAQ Global Select MarketSymbol: TTEC
Websiteteletech.com
2017 Annual Meeting of StockholdersThe Annual Meeting of Stockholders will be held Wednesday, May 24, 2017, beginning at 1:00 p.m. MDT at:TeleTech Holdings, Inc.Global Headquarters9197 South Peoria StreetEnglewood, CO 80112-5833
Transfer Agent and RegistrarBroadridge Corporate Issuer Solutions, Inc.1717 Arch Street, Suite 1300Philadelphia, PA 19103Telephone: 855.206.5002Facsimile: 215.553.5402Email: [email protected]
Investor InformationInvestor information, including TeleTech’s Annual Report, press releases and fili gs with the U.S. Securities and Exchange Commission, may be obtained from TeleTech’s website, teletech.com or by contacting TeleTech Investor Relations at:[email protected]
Independent AccountantsPricewaterhouseCoopers LLP, Denver, Colorado
2014 2015 2016Revenue $ 1,241.8 $ 1,286.8 $ 1,275.3
EBITDA $ 157.1 $ 151.9 $ 121.9
Operating income $ 96.5 $ 90.2 $ 52.8
Operating margin 7.8% 7.0% 4.1%
EBIT $ 100.5 $ 88.1 $ 53.3
Net income $ 72.3 $ 61.7 $ 33.7
Average diluted shares outstanding 50.1 49.0 47.7
Net income per diluted share $ 1.44 $ 1.26 $ 0.71
Cash and cash equivalents $ 77.3 $ 60.3 $ 55.3
Total debt $ 105.9 $ 107.3 $ 229.6
Capital expenditures $ 67.6 $ 66.6 $ 50.8
Financial Highlights($ in millions, except per share data)
34%
17%14%
12%
9%
6%4%4%
2016 Revenue by Vertical Market 2016 Revenue by Segment
Telecommunications, Internet, Media and Entertainment
Financial Services
Automotive
Healthcare
Technology
Other
Retail
Government 73%
11%
11%
5%
Customer Management Services
Customer Technology Services
Customer Growth Services
Customer Strategy Services
20152014 20152014 20152014
$1,241.8 $96.5$1.44
2016
$1,286.8
2016
$90.2$1.26
2016
Non-GAAP* $1,241.8 $1,286.8 $100.2 $100.1 $1.43 $1.48
$1,275.3
$1,295.5
$52.8
$83.3
$0.71
$1.32
Revenue Operating Income Net Income Per Diluted Share
*For a reconciliation to Non-GAAP figu es, please see the financial table ollowing the Chairman’s Letter and the information provided in Form 10-K.
281654_2016_AR_cover.indd 2 3/29/17 6:56 AM

9197 South Peoria Street Englewood, CO 80112-5833 +1 303 397-8100 or 1-800 835-3832 teletech.com
TeleTech is a leading global provider of customer experience, engagement, and growth solutions. Founded in 1982, the company helps its clients acquire, retain, and grow profitable customer relationships. Using customer-centric strategy, technology, processes, and operations, TeleTech partners with business leadership across marketing, sales, and customer care to design and deliver a simple, more human customer experience across every interaction channel.
TeleTech’s 48,000 employees live by a set of customer-focused values that guide relationships with clients, their customers, and each other.
To learn more about how TeleTech is bringing humanity to the customer experience, visit us at TeleTech.com.
Experience Matters
2016 ANNUAL REPORT
It’s everywhere we look, touch and interact. As our world becomes more digital, connected and data-driven, our expectations for experiences with brands are skyrocketing. We will no longer accept “please hold” or “page not found.” We expect to be recognized, helped and entertained. Treat us like a number and we are gone. Treat us like individuals and we are yours. For now...
281654_2016_AR_cover.indd 1 3/29/17 6:56 AM