Embed Size (px)
Citation preview
SEPTEMBER 2016
Experience and Satisfaction Levels of Long-Term Care Insurance Customers: A Study of Long-Term Care Insurance Claimants

Experience and Satisfaction Levels of Long-Term Care Insurance Customers 2
Table of Contents Executive Summary 4 Background 7 Purpose 8 Method 9 Findings 11
Claimant Characteristics 11 Demographic Characteristics 11 Disability Status 13 Prior Service Utilization 14
Claims Filing Experience 14
Impact of LTC Insurance on Service Use 16
Satisfaction with Insurance Purchase and Claims Impacts 20
Claimant Experience with Paid Caregivers 22 Policy Design Characteristics 23 Understanding Policy Value and Factors Associated with Satisfaction 25
Conclusions 27 Endnotes 28

Experience and Satisfaction Levels of Long-Term Care Insurance Customers 3
Tables and Figures
Figures Figure 1: Distribution of 2015-2016 Claimants by Service Setting 9 Figure 2: Distribution of 2015-2016 Claimants by Amount of Time Receiving Paid Care 10 Figure 3: Claim Payments for 2015-2016 Claimants by Amount of Time Receiving Paid Care 11 Figure 4: 2015-2016 Claimants Who Previously Received Care in a Different Care Setting 14 Figure 5: Claimant Perceptions of Claim Filing Process 15 Figure 6: 2015-2016 Claimants’ Knowledge of What Their LTC Insurance Policy Covered 15 Figure 7: Without Insurance—Amount of Care (2015-2016 Claimants) 16 Figure 8: Without Insurance—Family Care (2015-16 Claimants) 17 Figure 9: Without Insurance—Choice of Care Setting 17 Figure 10: Without Insurance—Timing of Paid Care (2015-2016 Claimants) 18 Figure 11: Without Insurance—Provider Cost Considerations 19 Figure 12: “LTC Insurance Enables Me to Receive Higher-Quality Care” (2015-2016 Claimants) 19 Figure 13: Satisfied with the Amount of Coverage Purchased (2015-2016 Claimants) 20
Figure 14: Are Policy Benefits Meeting Current Care Needs? 20
Figure 15: LTC Costs Covered by Insurance 21
Figure 16: Satisfaction with Policy (2015-2016 Claimants) 22 Figure 17: Overall Satisfaction with Current Paid Caregiver 23 Figure 18: Relationship Between Total Premiums Paid and Benefits Received by 25 2015-2016 Claimants (in thousands) Tables Table 1: Demographic Characteristics of 2015-2016 and 2005 Claimant Groups 12 Table 2: Disability Status of 2015-2016 and 2005 Claimant Groups, by Ability to Perform ADLs and IADLs 13 Table 3: Comparison of LTC Insurance Policy Designs—2015-2016 Claimants and 2000 Buyers 24 Table 4: Logistic Regression to Determine Relationship Between Claimants’ Level of Satisfaction and 26 Key Socio-Demographic and LTC Insurance Variables

Experience and Satisfaction Levels of Long-Term Care Insurance Customers 4
Executive Summary Currently there are more than seven million people with long-term care (LTC) insurance, and more than a quarter million are receiving benefits. As claims grow, a key question emerges: What is the actual experience of insureds as they seek benefits under their policies? In this study we survey a cross-sectional sample of claimants in 2015 and 2016 to ascertain their experience with the claim filing process, their views about their coverage, the influence they believe it has on their use of services, the quality of the care they are receiving, and their overall level of satisfaction with their policy. In addition, we uncover the relationship between policy characteristics and people’s level of satisfaction. Finally, we analyze the coverage that claimants have in order to provide a coverage profile for in-force policyholders. Where possible, we compare findings in this study with those from a 2005 Department of Health and Human Services (DHHS) study that looked at individuals who were beginning to receive benefits. Eleven major LTC insurance companies participated in the study by providing a random sample of claimants for the research team to interview. A telephonic survey was conducted, consisting of 34 questions and taking roughly 15 minutes; 1,291 surveys were completed (a 37 percent response rate). The sample was comprised of individuals receiving home care (45 percent), in assisted living (31 percent), in nursing homes (17 percent), and in other settings (about 7 percent). On average, individuals had been receiving benefits for two years, and the average value of total claims paid at the time the insurance companies pulled their data was $118,986 per person. The average total payment to individuals in a nursing home totaled $134,731, for those in assisted living $95,589, and for those receiving paid home care services $76,784. Claimant Characteristics
• The average age of 2015-2016 claimants (who have been receiving benefits for some time) is 84 years; for 2005 claimants (who were beginning to receive benefits), it was 79.
• Most claimants are female (70 percent), are not currently married (63 percent), and own their own
home (55 percent). They have multiple limitations in activities of daily living (ADLs)—an average of 3.7 limitations—as well as multiple limitations in instrumental activities of daily living (IADLs).
• Some claimants transition between care sites. In total, 23 percent of claimants had previously been
in a different care setting, with those in nursing homes most likely (36 percent) to have done so and those receiving home care the least likely (10 percent).
Claims Filing Experience
• Today almost eight in 10 claimants (78 percent) found filing a claim to be easy, while in 2005, about 64 percent found it easy; this suggests that claims processing has improved across companies.
• For every 100 people making claims under their LTC insurance policy, only two are likely to have
had a disagreement about coverage that was not solved to their satisfaction.

Experience and Satisfaction Levels of Long-Term Care Insurance Customers 5
• Nearly nine in 10 individuals had no problem knowing what their policy covered, and for the few
who did, many turned to their insurance company or their agent to clarify coverage questions. Impact of LTC Insurance on Service Use
• Roughly three in four claimants indicated that if they did not have LTC insurance, they would receive less care; 64 percent indicated that without insurance, they would not be able to pay for their current levels of care.
• About two in three claimants would have to rely on family, friends, and other volunteers to make up
the care gap if they did not have LTC insurance benefits enabling them to purchase formal care.
• Nearly half of individuals indicated that without insurance they would not be able to receive care in their current setting.
• Most claimants (62 percent) reported that the insurance did not influence their decision about
when to use services. However, roughly one in four said that they would have waited to use paid services had they not had insurance.
• Without insurance, 40 percent of claimants would have chosen a less costly provider; this is in
contrast to 2005 claimants, most of whom indicated that the insurance had no effect on their consideration of costs.
• Slightly more than three in four claimants believed that their insurance has enabled them to access
higher-quality providers.
Satisfaction with Insurance Purchase and Claims Impacts
• Nearly 90 percent of claimants are satisfied with the amount of coverage they purchased.
• Only 11 percent of claimants reported that they needed additional services not covered by the policy.
• More than four in five claimants reported that their insurance was paying for at least 50 percent of
LTC costs, and two in three indicated it paid for all or most costs. When new buyers of insurance are asked whether they expect their insurance to pay for all or most of the costs of any future care they may need, a large majority reply “most of the costs.” Thus, the insurance claims payment pattern is in line with original purchase expectations.
• Roughly 70 percent of claimants are very satisfied with their policy, and less than five percent are
dissatisfied.

Experience and Satisfaction Levels of Long-Term Care Insurance Customers 6
Claimant Experience with Paid Caregivers
• The vast majority of claimants (93 percent) say that the benefits paid by their policy are sufficient to meet their current care needs.
• The majority of claimants report that they assess their caregivers to be reliable (89 percent),
understand their caregivers (82 percent) and feel safe with them (96 percent), get along well with them (91 percent), and believe their caregivers always provide high-quality care (88 percent).
• Roughly four in five claimants are very satisfied with their caregiver, even though there may be
specific components of the care or the relationship with which they are not completely satisfied.
Policy Design Characteristics
• The average daily benefit amount for the LTC insurance that claimants have is $123, and the average policy duration is 5.7 years.
• Almost one-third of claimants have a policy with lifetime coverage.
• A large majority of policies cover care in multiple settings (83 percent), and about 60 percent of
claimants have a policy with built-in inflation protection.
• The average annual premium paid as of the time of the data pull was $3,216, or about $268 per month.
Understanding Policy Value and Factors Associated with Satisfaction
• One indicator of policy value from the point of view of a claimant is the extent to which the benefits paid out by the policy exceeds the total value of premiums paid for the policy. Purchasers between 1986 and 2014 received benefits that far exceeded the premiums paid, and that difference is between $56,000 and $85,000.
• Across the entire claimant sample, for every $1.00 in premium paid, the benefit payout is $2.78.
For individuals who purchased their policies between 1998 and 2002, so far the ratio value is $2.90, and for 2007 to 2014 buyers who became claimants, the ratio value is $5.02.
• Individuals who have been receiving care in their current setting for between one and two years are
1.48 times more likely to be very satisfied with their LTC insurance policy than those who have been receiving care for less than one year.
• Age, gender, disability level, and marital status do not affect whether or not people are very
satisfied with their policy.
Experience and Satisfaction Levels of Long-Term Care Insurance Customers 7
• Individuals’ interaction with their insurance company has a major impact on their satisfaction with their policy; those who found it very easy to file a claim were 17 times more likely to be very satisfied than those who found it difficult or less easy.
• When individuals believe that without insurance they would have to rely more on their family to help
them, they are 1.69 times more likely to be very satisfied with their policy than those for whom reliance on family is not likely to happen without insurance.
• People who are very satisfied with their caregiver are 2.9 times more likely to be very satisfied with
their policy, compared to those who have less positive views of their caregiver. The data provided here indicate that the vast majority of claimants are satisfied with both their policy coverage and their interactions with the insurance company. The insurance is achieving multiple goals for policyholders, including helping them afford services, giving them access to high-quality care, reducing burdens on families, providing choice of service setting, and enabling them to receive care when they need it, without delay. People’s experiences with providers, as well as how smoothly they are able to navigate the claims filing process, are particularly important to their overall level of satisfaction with their policy.
Background Long-term care (LTC) insurance has been selling in the marketplace for more than 35 years. When a small number of carriers began providing insurance in the 1970s, expenditures on LTC—primarily for nursing home care—were less than $20 billion. But they have grown rapidly, reaching $30 billion by 1980 and exceeding $225 billion today.1,2,3 Medicaid, the largest public payer of care, finances about 62 percent of the total bill, but individuals and families have borne most remaining costs.4
Throughout the 1990s a growing number of individuals were purchasing private LTC insurance, in part because policies began covering home and community-based care, making them more attractive to consumers. Sales during that decade were robust, and the reach of LTC insurance was expanding and covering more middle-class Americans. But over the last decade or so, for a variety of reasons, growth in new policy sales has slowed. And as this has occurred, companies have increasingly turned their attention to managing claims, which have been growing rapidly as policyholders age and develop a need for LTC. This trend has resulted in a change in the way insurers allocate their risk management resources. While for many years the focus of risk management efforts was on upfront underwriting, over the last decade or so companies have been paying much closer attention to the management of their claims.
As of 2014, the total number of LTC policies in force was 7.2 million.5 These policies have significant value in terms of their potential to pay for LTC services—they are likely to pay out in excess of $800 billion.6 Today, there are roughly a quarter of a million people receiving benefits under their policies, and the number of individuals filing new claims is in excess of 70,000 a year; moreover, the average growth in annual incurred claims over the past 15 years or so is about 12 percent.7 Clearly, a growing number of people who purchased policies many years ago are now beginning to receive concrete financial benefits from them.
As claims grow, a key question emerges: What is the actual experience of insureds as they seek benefits under their policies? Insureds applying for or receiving benefits—claimants—may actually be viewed as the ultimate customers of LTC insurance. After all, they are the individuals who are experiencing and utilizing

Experience and Satisfaction Levels of Long-Term Care Insurance Customers 8
the benefits that their policies promise to provide. Therefore, to gauge customer experience and satisfaction levels of LTC insurance policyholders, it is important to look at claimants.
Two earlier studies—both sponsored by the U.S. Department of Health and Human Services (DHHS)—explored this and related questions in detail more than a decade ago. The first was conducted in 1997 and documented in a series of published reports; it focused on a cross-section of claimants and examined their service utilization experience as well as their interactions with the insurance company.8 The second DHHS study, conducted from 2004 through 2006, focused on new claimants and followed their experience for up to two years. Results were presented in a series of reports published between 2006 and 2009.9 Both of these studies contributed important new information to the knowledge base and enhanced our understanding of the relationship between private insurance and service utilization; the interactions of claimants with the insurance company; and the attitudes, preferences, and satisfaction levels of claimants with regard to their insurance, their providers, and the choices they made when they purchased their policy.
As claims rates have increased and companies are under increasing pressure to manage their block of business efficiently, it is important to again examine claimant experience and explore whether the insurance that claimants purchased is working for them. To that end, America’s Health Insurance Plans (AHIP) commissioned LifePlans to conduct this updated study of claimant experience with LTC insurance.
Purpose The purpose of this study is three-fold:
1. To obtain a cross-sectional sample of claimants in 2015 and 2016 and interview them to ascertain their experience with the claims filing process, their views about their coverage, the influence they believe it has had on their use of services, the quality of their care, and their overall level of satisfaction with their policy.
2. To uncover the relationship between certain policy characteristics and people’s level of satisfaction and their assessment of the quality of care they are receiving.
3. To analyze the coverage that claimants have, in order to provide a coverage profile for in-force policyholders and estimate the benefits already paid under their policies.
To the extent possible, we will compare findings in this study with those in the most recent prior study of claimants: the 2004-2006 study commissioned by DHHS, which will be referred to in this report as the Admissions Cohort Study or the 2005 study. However, there is a key difference between these studies: While the earlier study is based only on claimants who were at the beginning of their claims experience, the current study looks at claimants at different stages. This was done to compare claimants’ perceptions and experiences at the beginning of their claim with their perceptions and experiences after they have been receiving benefit payments for a significant duration of time.

Experience and Satisfaction Levels of Long-Term Care Insurance Customers 9
Method We solicited major LTC insurance companies to participate in the study, and 11 companies, representing the vast majority of in-force claims, did so. Thus, results should be representative of the industry as a whole. The participating companies include:
Ability Re Bankers Life and Casualty Genworth Financial John Hancock MedAmerica MetLife Mutual of Omaha
New York Life Penn Treaty Prudential Senior Health Insurance Company of
Pennsylvania
Each company was asked to contribute a random sample of up to 600 active claimants. These claimants spanned the continuum of care: They were receiving services in assisted living, at home, in adult day centers, or in a nursing home or other residential care setting. A claimant was defined as a policyholder who had received at least one claim payment and was still considered an active claimant by the company. Companies provided contact information as well as claims payment and policy design information.
The research team reached out to these claimants and/or their proxies to administer a telephonic survey. The survey consisted of 34 questions and took roughly 15 minutes to complete. LifePlans called a total of 5,649 claimants, and was able to complete 1,291 surveys. Another 119 surveys were partially completed. We were unable to reach 1,708 claimants after making multiple call attempts (in most cases, up to six). If we exclude individuals who were deceased, or who were on a “do not call” list, or for whom we confirmed that phone numbers were invalid or disconnected, the total “valid sample” is comprised of 3,536 individuals. Thus, our completion rate for fully completed surveys was 37 percent (1,291/3,536), our
17%
45%
31%
7%
0%
10%
20%
30%
40%
50%
Nursing Home Home Care Assisted Living Other
Figure 1: Distribution of 2015-2016 Claimants by Service Setting

Experience and Satisfaction Levels of Long-Term Care Insurance Customers 10
refusal rate was 12 percent (418/3,536), and we were unable to reach 48 percent (1,708/3,536). The remaining 3 percent (119/3,536) represented incomplete surveys.
As shown in Figure 1, on the previous page, the distribution of active claimants by service setting is heavily weighted toward home and community-based care (including care received in assisted living).
Many of these individuals have been receiving payments under their policy for quite some time. In fact, the average duration of claim for this sample is slightly less than two years. (It is important to note that this does not represent the average amount of time people can expect to spend on claim. This cross-sectional sample will over-represent those individuals who tend to be long-stayers.) Figure 2 shows the distribution of claimants by the amount of time that they have been receiving paid care in their current setting.
Finally, this sample of claimants has received significant payments for LTC services. On average, the value of total claims paid at the time the insurance companies pulled their data was $118,986. Among individuals in the general population, total LTC expenditures from age 65 until death are roughly $140,000, of which $72,000 are paid out-of-pocket.10 Figure 3, on the next page, shows the distribution of payments on the current claim by the amount of time receiving care. Not shown in the figure is the breakdown by care setting: The average payments on current claims to individuals in a nursing home totaled $134,731, for those in assisted living $95,589, and for those receiving paid home care services $76,784.
9%
15%
27%
20%
26%
3%
0%
5%
10%
15%
20%
25%
30%
< 6 mo 6 mo - 1 yr 1 - 2 years 2 - 3 years 3+ years Don't know
Figure 2: Distribution of 2015-2016 Claimants by Amount of Time Receiving Paid Care

Experience and Satisfaction Levels of Long-Term Care Insurance Customers 11
Findings Claimant Characteristics Demographic Characteristics
Table 1 on the next page summarizes the demographic characteristics of this study’s cross-sectional sample of claimants and compares these to the sample of claimants from the 2005 DHSS study (consisting only of those who had just begun receiving benefits).
As shown in Table 1 on the next page, there are two important differences between the two samples. First, age: The average age of the 2005 claimants (who just started receiving benefits) is 79, compared to 84 for the 2015-2016 claimants (who, on average, have been receiving benefits for some time). Over half of the 2015-2016 claimants are over age 85, roughly twice the rate of the 2005 claimants.
Second, 2015-2016 claimants are much less likely to own their own home or condominium. Given that they have been on claim for an average of almost two years, and roughly half of them are in a nursing home or assisted living facility, this is not surprising. Claimants from the 2005 study are just beginning to receive benefits, so they are less likely to know the ultimate course of their disability and are therefore reluctant to sell a home; they may have an expectation that they will improve and be able to continue living in their home.
Differences in gender, marital status and education are not particularly pronounced.
$41,286 $42,456
$74,850
$105,902
$149,359
$0
$20,000
$40,000
$60,000
$80,000
$100,000
$120,000
$140,000
$160,000
< 6 mo 6 mo - 1 yr 1 - 2 years 2 - 3 years 3+ years
Figure 3: Claim Payments for 2015-2016 Claimants by Amount of Time Receiving Paid Care*
*Data in Figure 3 is based on eight of the companies that provided complete claims data to be linked to completed survey data. The figure is based on 1,229 individuals.

Experience and Satisfaction Levels of Long-Term Care Insurance Customers 12
Table 1: Demographic Characteristics of 2015-2016 and 2005 Claimant Groups
Demographic Characteristics 2015-2016 Claimants
(receiving benefits for some time) (Cross-Section)
2005 Claimants (just beginning benefits)
(Admissions Cohort)
Age
Below 65 2% 5% 65 to 74 9% 16% 75 to 79 13% 24% 80 to 84 23% 30% 85 or above 53% 25% Average age 84 79
Gender
Female 70% 68% Male 30% 32%
Marital Status
Married 37% 39% Single (never married) 4% 3% Divorced/separated 6% 7% Widowed 53% 50% Domestic partner <1% 1%
Education
Less than high school 3% 9% High school graduate 32% 26% Post high school 23% 27% College graduate 42% 38%
Currently own a home or condominium
55%
77%

Experience and Satisfaction Levels of Long-Term Care Insurance Customers 13
Disability Status
Claimants in both the 2015-2016 and the 2005 studies were asked about the help they needed with specific activities of daily living (ADLs) and instrumental activities of daily living (IADLs). Table 2 below shows the differences between the two groups.
There are a number of important points to make about Table 2. Not surprisingly, across all ADLs a higher proportion of individuals in the 2015-2016 sample have ADL limitations than do those in the admissions cohort sample. In fact, the average number of ADL limitations among current claimants is 3.7, compared to 3.2 for the 2005 claimants. This suggests that for most claimants, the level of functional impairment increases over time. Regarding IADLs, the pattern is not as clear-cut. A higher proportion of individuals in the 2005 claimant study report IADL limitations, but this may be indicative of the fact that they have not yet received adequate paid care to compensate for their inability to conduct these activities. On the other hand, a much lower proportion of the 2005 sample report having trouble taking medications. This suggests that as functional and cognitive issues grow, medication management becomes a more serious issue. Across both samples, individuals exhibit multiple needs for assistance.
Table 2: Disability Status of 2015-2016 and 2005 Claimant Groups, by Ability to Perform ADLs and IADLs
Disability Status by Ability to Perform ADLs and IADLs
2015-2016 Claimants (receiving benefits for some time)
(Cross-section)
2005 Claimants (just beginning benefits)
(Admissions Cohort)
Percent needing help with ADLs
Bathing 90% 77% Dressing 88% 62% Toileting 62% 45% Transferring 60% 41% Continence 41% 26% Eating 28% 14%
Percent needing help with IADLs*
Mobility inside the house N.A. 45% Mobility outside the house N.A. 67% Transportation 87% 94% Shopping 79% 94% Preparing food 95% 95% Housework/laundry 95% 97% Taking medication 83% 62% Managing money 61% 72% Using the Telephone 34% 41%
* Indoor and outdoor mobility data is not presented because during the data collection process some phone agents did not understand that use of equipment does not constitute incapacity in this IADL (Only hands-on or stand-by human supervision or support suggests incapacity.) As a result, data was not collected consistently, and we do not report findings for these two IADLs.

Experience and Satisfaction Levels of Long-Term Care Insurance Customers 14
Prior Service Utilization Claimants in this study were asked whether they had received care in a different setting before their current one (either of the same setting type or a different type). As shown in Figure 4, many claimants do transition between care sites. In total, 23 percent of claimants had been in a different site. Claimants in nursing homes were most likely (36 percent) to have received care prior to their current setting (most often in an assisted living facility), and those receiving home care were least likely (10 percent). Roughly eight percent of claimants in assisted living had been in another assisted living facility before moving to the current location.
Claims Filing Experience
On average, a claimant in this study had filed his or her claim 24 months before the interview. Figure 5 on the next page summarizes claimant experience with the claims filing process.
Almost eight in 10 of the 2015-2016 claimants found filing a claim to be easy (78 percent). Compared to 2005 claimants, a greater proportion of current claimants found it easy to file claims and fewer found it difficult. This suggests that claims processing across companies has improved over the period. Not shown in the figure is the fact that only six percent of claimants had a disagreement with their insurance company about policy coverage, and the majority of these disagreements (65 percent) were resolved to the satisfaction of the claimant. Put another way, for every 100 people making claims under their insurance policy, only two are likely to have had a disagreement about coverage that was not solved to their satisfaction.
2%
11%
16%
5%
2%
6%
2% 2%3%
16%
8%
6%
3% 3%
7%
11%
0%
2%
4%
6%
8%
10%
12%
14%
16%
18%
Current Setting: Home Care Current Setting: Nursing Home Current Setting: Assisted Living Other
Figure 4: 2015-2016 Claimants Who Previously Received Care in a Different Setting
Prior Home Care Prior Nursing Home Prior Assisted Living Other

Experience and Satisfaction Levels of Long-Term Care Insurance Customers 15
Closely related to the issue of claims filing is whether or not individuals had difficulty knowing what their policy covered. Figure 6 shows that most people have a good idea of what coverage they purchased.
For the roughly one in 10 individuals who did have a problem knowing what their policy covered, about half turned to their insurance company or their agent to clarify coverage questions.
78%
15%7%
64%
23%
4%9%
0%
25%
50%
75%
100%
It was easy It was difficult It was neither easy nor difficult Don't know
Figure 5: Claimant Perceptions of Claim Filing Process
2015-2016 Claimants 2005 Claimants
9%
86%
5%
0%
25%
50%
75%
100%
Had a problem No problem Don't know/refused
Figure 6: 2015-2016 Claimants' Knowledge of What Their LTC Insurance Policy Covered

Experience and Satisfaction Levels of Long-Term Care Insurance Customers 16
Impact of LTC Insurance on Service Use
Clearly, people purchase LTC insurance to ensure that when they require care, the insurance will help them access the type and quantity of services they need. Claimants were asked a series of questions about how having a policy has influenced the care that they receive. Figure 7 summarizes responses to a question about whether the amount of care received by claimants was influenced by the presence of their insurance policy. Specifically, claimants were asked whether in the absence of their policy they would receive a different amount of paid care.
Roughly three in four individuals indicated that without insurance, they would receive less care, and most of these reported that they would receive much less. Thus, from the point of view of these claimants, the insurance is providing them with the financial capacity to access more services than they otherwise could if they had to rely solely on their own resources. When funds are not available for paid services, family and friends must often provide care, so it is reasonable to assume that, without insurance benefits, more such informal care would be needed. And in fact, Figure 8 on the next page shows that about two in three claimants would have to rely on family, friends, and other volunteers to make up the care gap if they did not have LTC insurance benefits enabling them to purchase formal care.
22%
49%
29%
0%
25%
50%
75%
Would receive somewhat less care Would receive much less care Would receive same level of care
Figure 7: Without Insurance--Amount of Care (2015-2016 Claimants)

Experience and Satisfaction Levels of Long-Term Care Insurance Customers 17
A primary motivation for purchasing LTC insurance is to be able to receive care in the setting one prefers. As shown in Figure 9, nearly half of 2015-2016 claimants believed that without insurance they would not receive care in their current setting. A smaller proportion of 2005 claimants felt this way. This is likely because these claimants were just beginning to use LTC and had not yet had to spend significant resources. Individuals who are two to three years into their care have a longer-term view of the importance of insurance in allowing them to remain in a particular service setting.
39%
47%
14%
73%
12% 15%
0%
25%
50%
75%
Would receive care in current setting Would not receive care in current setting Don't know
Figure 9: Without Insurance--Choice of Care Setting
2015-2016 Claimants 2005 Claimants
64%
29%
7%
0%
25%
50%
75%
Would have to rely more on family, friends, and volunteers
Would not have to rely more on family, friends, and volunteers
Don't know
Figure 8: Without Insurance--Family Care (2015-2016 Claimants)

Experience and Satisfaction Levels of Long-Term Care Insurance Customers 18
Another important question is whether people can begin using LTC services when they feel they need to. The need for LTC usually develops over time, and it is typically first addressed by family members. When to begin using paid services is often in part a function of the capacity to afford paid care, along with other factors such as the resiliency of family support structures, the availability of the right kind of service, and individual preferences. Claimants were asked whether having LTC insurance enabled them to access paid care more quickly than they might otherwise have done. As Figure 10 shows, most claimants (62 percent) indicated that insurance did not influence their decision about when to use paid services. However, roughly one in four claimants report that they would have waited to use paid LTC had they not had their policy. For those for whom insurance is a factor, it may be enabling them to access care in a timely fashion and avoid going without needed care, or it may allow them to reduce their reliance on family caregivers more quickly.
One can also surmise that if a person has insurance, the relative cost of different LTC providers would be less of a consideration. We asked claimants whether they would have chosen lower-cost providers were it not for their LTC insurance; Figure 11 on the next page shows that 40 percent of 2015-2016 claimants said yes. This is in contrast to 2005 claimants, most of who indicate that insurance had no effect on their consideration of costs. It may be that the 2005 claimants, who had just started receiving care, did not yet have a full appreciation of all of the costs they were going to incur and so were less sensitive to cost. Those who have been receiving care for some time have a greater understanding of costs and therefore a higher proportion understands that if they did not have insurance, they would have to choose lower-cost providers.
22%
62%
16%
0%
25%
50%
75%
Would have waited longer to receivepaid care
Would not have waited longer to receive paid care
Don't know
Figure 10: Without Insurance--Timing of Paid Care (2015-2016 Claimants)

Experience and Satisfaction Levels of Long-Term Care Insurance Customers 19
Cost is often a proxy variable for quality: The higher the price, the greater the perceived value in the product (in this case, the LTC service provider). We asked current claimants whether they believed that having their insurance enabled them to access higher-quality providers. More than three in four claimants thought so (see Figure 12).
38%41%
11%
5% 5%
0%
10%
20%
30%
40%
50%
Strongly agree Agree Disagree Strongly disagree Don't know
Figure 12: "LTC Insurance Enables Me to Receive Higher-Quality Care" (2015-2016 Claimants)
40%36%
24%
12%
68%
20%
0%
25%
50%
75%
Would choose less costly provider Would not choose less costly provider Don't know
Figure 11: Without Insurance--Provider Cost Considerations
2015-2016 Claimants 2005 Claimants

Experience and Satisfaction Levels of Long-Term Care Insurance Customers 20
Satisfaction with Insurance Purchase and Claim Impacts
Most people who purchase LTC insurance do so well in advance of the need for services. Thus, they are making coverage decisions to address the potential cost of care, the duration of care, and even service settings 20 to 25 years in the future. We asked claimants whether they are satisfied with the level of coverage they chose when they bought their policy. Figure 13 shows that the overwhelming majority of claimants, nearly nine in 10, are satisfied.
Figure 14 shows that the vast majority of claimants assess that the benefits paid by their policy are sufficient to meet their current care needs.
88%
7% 5%
0%
25%
50%
75%
100%
Yes No Don't know
Figure 13: Satisfied with the Amount of Coverage Purchased (2015-2016 Claimants)
93%
7%
89%
11%
0%
25%
50%
75%
100%
Yes No
Figure 14: Are Policy Benefits Meeting Current Care Needs?
2015-2016 Claimants 2005 Claimants

Experience and Satisfaction Levels of Long-Term Care Insurance Customers 21
Among the small number of individuals who were not satisfied with the level of coverage chosen, most felt that they had not purchased a high enough daily benefit and/or a long enough benefit duration. Not shown in the figure is the fact that only 11 percent of claimants reported that they needed additional services that were not covered by the policy. This indicates that insurance contracts have been written or interpreted in a manner that enables the vast majority of individuals to receive the services they believe they need when they become disabled. Part of the reason a person may or may not be satisfied with the level of coverage chosen is related to expectations at the time of policy purchase. For example, if there is a belief that the policy will pay for all of the potential costs of care, then any out-of-pocket expenditures will be viewed negatively. Both current claimants and those surveyed in 2005 were asked what level of cost is covered by their LTC insurance policy. As shown in Figure 15, across both claimant cohorts, for two in three claimants the policy paid all or most costs. Although not shown in the figure below, when new buyers of LTC insurance are asked whether they expect their insurance to pay for all or most of the costs of any future care they may need, the vast majority reply “most of the costs.”11 Thus, the insurance claims payment pattern is in line with original expectations at purchase.
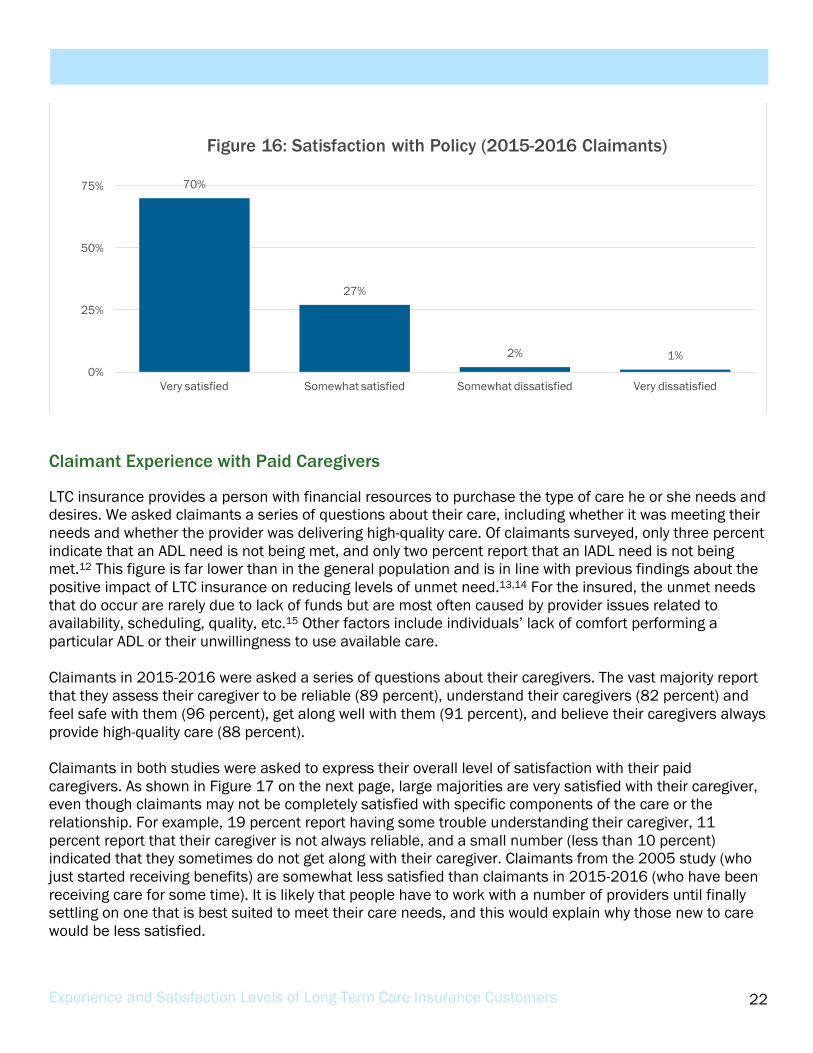
Claimants in 2015-2016 were asked a general question about their overall satisfaction with their LTC insurance policy. Figure 16 on the next page shows that roughly 70 percent are very satisfied with their policy and less than five percent are dissatisfied.
23%
44%
17%12%
4%
29%
39%
16%
7% 8%
0%
10%
20%
30%
40%
50%
All of the cost Most of the cost About half of the cost Some or few of the costs Don't know/refused
Figure 15: LTC Costs Covered by Insurance
2015-2016 Claimants 2005 Claimants
Experience and Satisfaction Levels of Long-Term Care Insurance Customers 22
Claimant Experience with Paid Caregivers
LTC insurance provides a person with financial resources to purchase the type of care he or she needs and desires. We asked claimants a series of questions about their care, including whether it was meeting their needs and whether the provider was delivering high-quality care. Of claimants surveyed, only three percent indicate that an ADL need is not being met, and only two percent report that an IADL need is not being met.12 This figure is far lower than in the general population and is in line with previous findings about the positive impact of LTC insurance on reducing levels of unmet need.13,14 For the insured, the unmet needs that do occur are rarely due to lack of funds but are most often caused by provider issues related to availability, scheduling, quality, etc.15 Other factors include individuals’ lack of comfort performing a particular ADL or their unwillingness to use available care. Claimants in 2015-2016 were asked a series of questions about their caregivers. The vast majority report that they assess their caregiver to be reliable (89 percent), understand their caregivers (82 percent) and feel safe with them (96 percent), get along well with them (91 percent), and believe their caregivers always provide high-quality care (88 percent). Claimants in both studies were asked to express their overall level of satisfaction with their paid caregivers. As shown in Figure 17 on the next page, large majorities are very satisfied with their caregiver, even though claimants may not be completely satisfied with specific components of the care or the relationship. For example, 19 percent report having some trouble understanding their caregiver, 11 percent report that their caregiver is not always reliable, and a small number (less than 10 percent) indicated that they sometimes do not get along with their caregiver. Claimants from the 2005 study (who just started receiving benefits) are somewhat less satisfied than claimants in 2015-2016 (who have been receiving care for some time). It is likely that people have to work with a number of providers until finally settling on one that is best suited to meet their care needs, and this would explain why those new to care would be less satisfied.
70%
27%
2% 1%0%
25%
50%
75%
Very satisfied Somewhat satisfied Somewhat dissatisfied Very dissatisfied
Figure 16: Satisfaction with Policy (2015-2016 Claimants)

Experience and Satisfaction Levels of Long-Term Care Insurance Customers 23
Policy Design Characteristics
We need to ascertain the extent to which the policy designs of the coverage held by surveyed claimants differ substantially from the coverage of their fellow LTC insurance policyholders. To do this, we compare the policies of surveyed claimants with the policies that were sold at the time most of these claimants purchased their coverage (see Table 3). Specifically, we compare the policy designs of surveyed claimants with the policy designs of individuals who purchased insurance in the year 2000. We have chosen this year because roughly half the people in our claimant sample purchased their policies before then and half after. Table 3 shows that, for the great majority of policy characteristics, the coverage of our surveyed claimants is very similar to that of other individuals who purchased a policy in 2000. Premiums are substantially higher for claimants than for purchasers, but it must be kept in mind that for claimants, we are seeing the current premium, whereas for purchasers, we are seeing the premium at purchase—nearly 16 years ago. All companies in the sample requested at least one or even multiple rate increases since 2000, so this difference in premium is not unexpected. Another reason for the higher premiums of claimants is that a greater proportion of them have inflation protection than purchasers. Inflation protection also explains the somewhat higher daily benefit amounts for claimants; for many, these benefits have been increased by inflation protection since purchase.
85%
13%
1% 0% 1%
73%
21%
3% 1% 2%0%
25%
50%
75%
100%
Very satisfied Somewhat satisfied Somewhat dissatisfied Very dissatisfied Don't know/refused
Figure 17: Overall Satisfaction with Current Paid Caregiver
2015-2016 Claimants 2005 Claimants

Experience and Satisfaction Levels of Long-Term Care Insurance Customers 24
Table 3: Comparison of LTC Insurance Policy Designs 2015-2016 Claimants and 2000 Buyers
Policy Characteristics
2015-16 Claimants*
2000 Buyers
Policy type
Nursing home only 11% 14%
Home care only 6% 9%
Nursing home and home care 83% 77%
Daily benefit amount for nursing home care $123 $109
Daily benefit amount for home care $121 $106
Nursing home only elimination period 52 days 65 days
Integrated policy elimination period 78 days 47 days
Nursing home benefit duration 5.7 years 5.5 years
Partnership policy 3% N.A.
Inflation protection 59% 41%
Annual premium $3,216 $1,677
Nursing home duration
1-2 years 11% 17%
3 years 22% 23%
4 years 19% 14%
5 years 8% 11%
6-8 years 10% 5%
Lifetime benefits 30% 30%
Average duration 5.7 years 5.5 years
Nursing home daily benefit
up to $59 7% 6%
$60 to $89 17% 17%
$90 to $119 34% 43%
$120 and Over 42% 34%
Table 3 continued on page 25

Experience and Satisfaction Levels of Long-Term Care Insurance Customers 25
Policy Characteristics
2015-16 Claimants*
2000 Buyers
Average daily benefit $123 $109
Home care duration
1 year 3% 5%
2 years 13% 14%
3 years 21% 22%
4 years 17% 13%
5 years 8% 10%
6 years 8% 7%
7-8 years 4% -
Lifetime benefits 26 30
Average duration 5.4 years 5.4 years * Note that the data in this table are based on claimant information provided for the original sample and not limited to those who chose to answer the survey. Thus, data here represents information derived from 5,305 claimants.
Understanding Policy Value and Factors Associated with Satisfaction
One indicator of policy value from the point of view of a claimant is the extent to which the benefits paid out by the policy exceeds the total value of premiums paid for the policy. In order to gauge this, we looked at the average premiums paid between policy purchase date and claim date and compared this to the benefits that had been paid out at the time the sample was drawn. We look at four different cohorts of buyers and assess the ratio between premiums paid and benefits received. Figure 18 summarizes results.
$49 $45$32
$14
$41
$109
$130
$107
$70
$115
$60
$85$75
$56$74
$0
$25
$50
$75
$100
$125
$150
1986-1997 1998-2002 2003-2007 2008-2014 Total
Purchase Year Period
Figure 18: Relationship Between Total Premiums Paid and Benefits Received by 2015-2016 Claimants (in thousands)
Total Premiums Paid Total Benefits Received Difference

Experience and Satisfaction Levels of Long-Term Care Insurance Customers 26
As shown, the benefits received are quite a bit higher than the premiums paid. The differences range between $56,000 and $85,000. Across the entire claimant sample, for every $1.00 in premium paid, the benefit payout is $2.78. For individuals who purchased their policies between 1998 and 2002 the ratio value is $2.90, and for 2008-2014, the ratio value is $5.02. Note that these values are for individuals who have been receiving benefits for an average of two years. They do not represent the ratio for all claimants, nor the total expected payout for the current sample. They do highlight the point that if LTC services are needed, the benefits paid out almost always exceed the premiums paid in. In Figure 15, we showed that two in three claimants are “very satisfied” with their policy. We wanted to understand the importance of certain variables behind this very positive evaluation. To do this, we conducted a logistic regression analysis to uncover the relative contribution of specific classes of variables to whether or not claimants were very satisfied with their policy. We focused on four sets of variables: socio-demographic characteristics, policy design characteristics, interactions with the insurance company, and experience with providers. Table 4 summarizes results:
Table 4: Logistic Regression to Determine Relationship Between Claimants’ Level of Satisfaction and Key Socio-Demographic and LTC Insurance Variables
B S.E. Sig. Exp (B)
Socio-Demographic Characteristics Age .010 .012 .407 1.010 Number of ADLs .022 .054 .687 1.022 Gender (male) -.011 .195 .954 .989 Marital status (married) .022 .202 .915 1.022 Care in current setting - less than 1 year .385 Care in current setting - 1 year to less than 2 years .393 .230 .088 1.482 Care in current setting - 2 years to less than 3 years .280 .248 .260 1.323 Care in current setting - 3 or more years .263 .240 .273 1.301 Interaction with the Insurer Very easy compared to somewhat easy or difficult to file claim 2.854 .230 .000 17.353 Had a problem determining policy coverage -.774 .256 .003 .461 Policy Design/Impact Information Benefits pay all of the cost .037 Benefits pay most of the cost -.454 .223 .042 .635 Benefits pay about half of the cost -.508 .274 .064 .601 Benefits pay some or few of the cost -.890 .316 .005 .411 Would have to rely more on family in absence of the policy .525 .183 .004 1.690 Experience with Providers In nursing home .377 .223 .092 1.457 Very satisfied with current caregiver 1.052 .233 .000 2.865 Never have trouble understanding caregiver .427 .230 .064 1.532 Constant -2.078 1.135 .067 .125

Experience and Satisfaction Levels of Long-Term Care Insurance Customers 27
Variables whose coefficients “B” are bolded are statistically significant. In the above table, 10 variables are statistically significant at least at the .10 level. The odds ratios for variables are presented in the column labeled Exp (B). Values in the Exp (B) column that are less than one indicate that an individual with that characteristic or attitude is less likely to be very satisfied with their policy than a person without that characteristic. On the other hand, when the value in that column is greater than one, it signifies that an individual with the characteristic is more likely to be very satisfied with their policy than someone without it. For example, individuals who have been receiving care in their current setting for between one and two years are 1.48 times more likely to be very satisfied with their policy than individuals who have been receiving care for less than one year. The analysis indicates that, holding other variables constant, the only socio-demographic variable that affects satisfaction is whether or not an individual has been receiving care for between one and two years compared to less than one year. This variable is statistically significant at the .05 level. Age, gender, disability level, and marital status do not affect whether or not someone is very satisfied with his or her policy. In sharp contrast, the individual’s interaction with the insurance company has a major impact on satisfaction with the policy. In fact, those who found it very easy to file a claim were 17.35 times more likely to be very satisfied with their policy than those who found it difficult or less easy. This variable is most closely associated with being very satisfied with one’s policy. In addition, individuals who had difficulty discerning what their policy covered were only .46 times as likely to be very satisfied as those who did not have such difficulties. One of the important reasons why individuals purchase policies is to ensure that, if they need care, they will not have to rely on family and friends. Findings here suggest that when individuals believe that in the absence of their policy they would have to rely more on their family to help them, they are 1.69 times more likely to be very satisfied with their policy than those for whom reliance on family is not likely to happen in the absence of their policy. Finally, a number of variables related to claimants’ experience with providers influence their feeling about the policy. For example, individuals in a nursing home are 1.46 times more likely to be very satisfied than those in other settings. This may reflect the significant level of financial relief offered by the policy to individuals in nursing homes compared to other settings. Also, people who are very satisfied with their caregiver are 2.87 times more likely to be very satisfied with their policy compared to those who have less positive views of their caregiver.
Conclusions The data provided here indicate that the vast majority of claimants are satisfied with both their coverage and their interactions with the insurance company. Compared to a decade ago, it appears that industry investments in claims management practices have led to greater levels of consumer satisfaction among claimants on a number of parameters. Moreover, the insurance is achieving multiple goals for policyholders, including helping them afford services, giving them access to high-quality care, reducing burdens on families, providing choice of service settings, and enabling them to receive care when they need it, without delay. The logistic regression analysis pointed to a very important fact about how people view their insurance, namely, that coverage parameters comprise only one element of satisfaction, and not

Experience and Satisfaction Levels of Long-Term Care Insurance Customers 28
even the most important one. People’s experiences with providers as well as how smoothly they are able to navigate the claims filing process are particularly important to the overall level of satisfaction with their policy. This suggests that as companies continue to improve their claims filing processes, claimants’ satisfaction will increase. Companies may also want to examine how to empower claimants by providing information about how to choose a caregiver so that the provider selection process can also be improved. Clearly, how people feel about the care that is being purchased by their insurance policy influences their evaluation of the coverage itself. For this reason, companies may also want to explore ways to help claimants navigate the provider system so as to help ensure that the paid caregiver experience is as positive and effective as possible.
Endnotes
1 Congressional Budget Office (1977). “Long-Term Care for the Elderly and
Disabled.”
2 Health Care Financing Administration, Office of the Actuary (1994).
“Data from the Office of National Health Statistics,” in Health Care
Financing Review, Vol. 16, No. 1.
3 Commission on Long-Term Care (2013). Report to Congress, September
30.
4 National Health Policy Forum (2013). Based on data from “2011
National Health Expenditure Accounts,” as reported in Commission on
Long-Term Care (2013), Report to Congress, September 30
5 National Association of Insurance Commissioners (2014). NAIC
Experience Exhibit Reports through 2014.
6 M. Cohen, (2016). The State of the Long-Term Care Insurance Market.
NAIC Center for Insurance and Policy Research, CIPR Study: The State of
Long-Term Care Insurance: The Market, Challenges and Future
Innovations. May:
7 NAIC Experience Exhibit Reports through 2014.
8 U.S. Department of Health and Human Services, Office of Disability,
Aging, and Long-Term Care Policy (1999-2000). “A Descriptive Analysis of
Patterns of Informal and Formal Caregiving Among Privately Insured and
Non-Privately Insured Disabled Elders Living in the Community” (1999);
“The Use of Nursing Home and Assisted Living Facilities Among Privately
Insured and Non-Privately Insured Disabled Elders” (2000); “Multivariate
Analysis of Patterns of Informal and Formal Caregiving Among Privately
Insured and Non-Privately Insured Disabled Elders Living in the Community
(1999).
9 U.S. Department of Health and Human Services, Office of Disability,
Aging, and Long-Term Care Policy (2006 and 2008). “Service Use and
Transitions: Decisions, Choices, and Care Management Among an
Admissions Cohort of Privately Insured Disabled Elders” (2006); “Following
an Admission Cohort over 28 Months to Track Claim Experience, Service
Use, and Transitions” (2008); “Care Management, Claim Experience, and
Transitions Among an Admissions Cohort of Privately Insured Disabled
Elders over a 28-Month Period” (2008).
10 U.S. Department of Health and Human Services, Office of the Assistant
Secretary for Planning and Evaluation and Office of Disability, Aging, and
Long-Term Care Policy (2015). “Long-Term Services and Supports for Older
Americans: Risks and Financing” (ASPE Issue Brief).
11 America’s Health Insurance Plans (2012), Who Buys Long-Term Care
Insurance in 2010-2011? A Twenty Year Study of Buyers and Non-Buyers
(In the Individual Market).
12 Note that due to the measurement issue related to indoor and outdoor
mobility (as described in note 13), these IADLs are excluded from the
analysis.
13 M. Cohen, X. Shi, J. Sandhu, and J. Miller, for America’s Health
Insurance Plans (2014). “The Benefits of Long-Term Care Insurance and
What They Mean for Long-Term Care Financing.”
14 The National Health and Aging Trends Study (2011). Survey data.
15 U.S. Department of Health and Human Services (1999). “A Descriptive
Analysis of Patterns of Informal and Formal Caregiving Among Privately
Insured and Non-Privately Insured Disabled Elders Living in the
Community” (Final Report to the Office of Disability, Aging, and Long-Term
Care Policy and the Robert Wood Johnson Foundation Home Care
Research Initiative).