Embed Size (px)
Citation preview
Expectations of Student Performanceat Davis High School:
Are They Different by the Race/Ethnicity of the Student?
------------------DHS Youth In Focus Student Research Scholars
Davis High School – Davis, CA
Monday, May 17, 2004 Powerpoint Presentation
and
2004 Background Data Concerning Educational Equity
Contact: Jann Murray-García, M.D., M.P.H.
(530) 753-7443 or [email protected]
How do expectations contribute to racial/ethnic differences in academic achievement, class placement, and discipline
patterns?
An Exploratory Study
FOCUS GROUPS
Asian (Northeast) – Chinese, Japanese, Korean Asian (Southeast) – Vietnamese, Filipino, Indonesian
Asian (Western) – Indian, Pakistani, Iranian, etc. Black/African American/African
Latino – English-SpeakingLatino – Spanish-Speaking
Mixed Race Native American
White
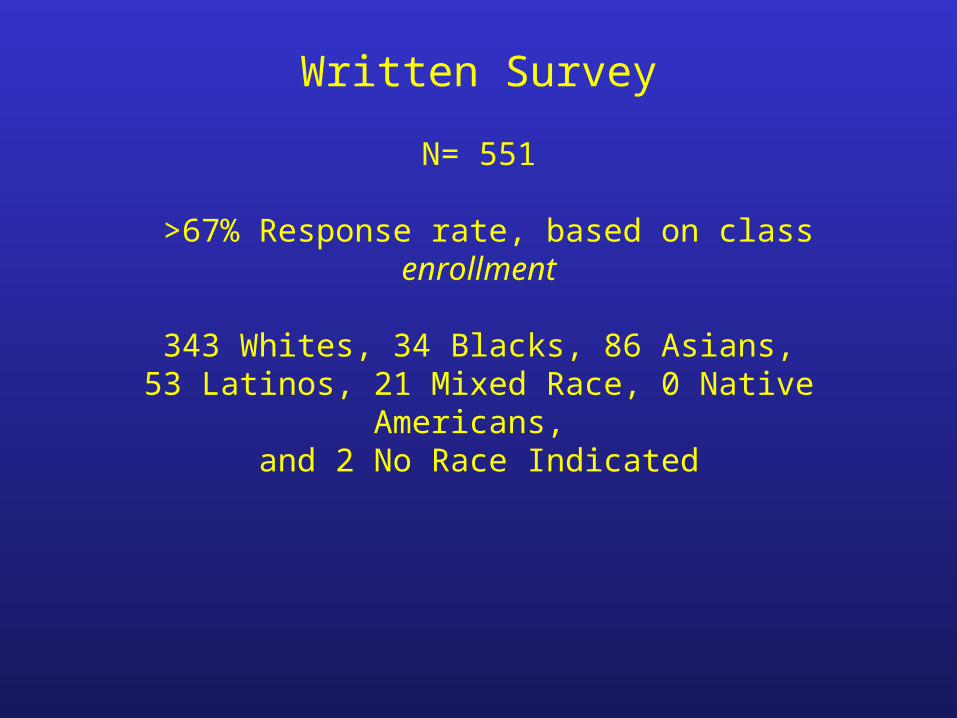
Written Survey
N= 551
>67% Response rate, based on class enrollment
343 Whites, 34 Blacks, 86 Asians,53 Latinos, 21 Mixed Race, 0 Native Americans,
and 2 No Race Indicated
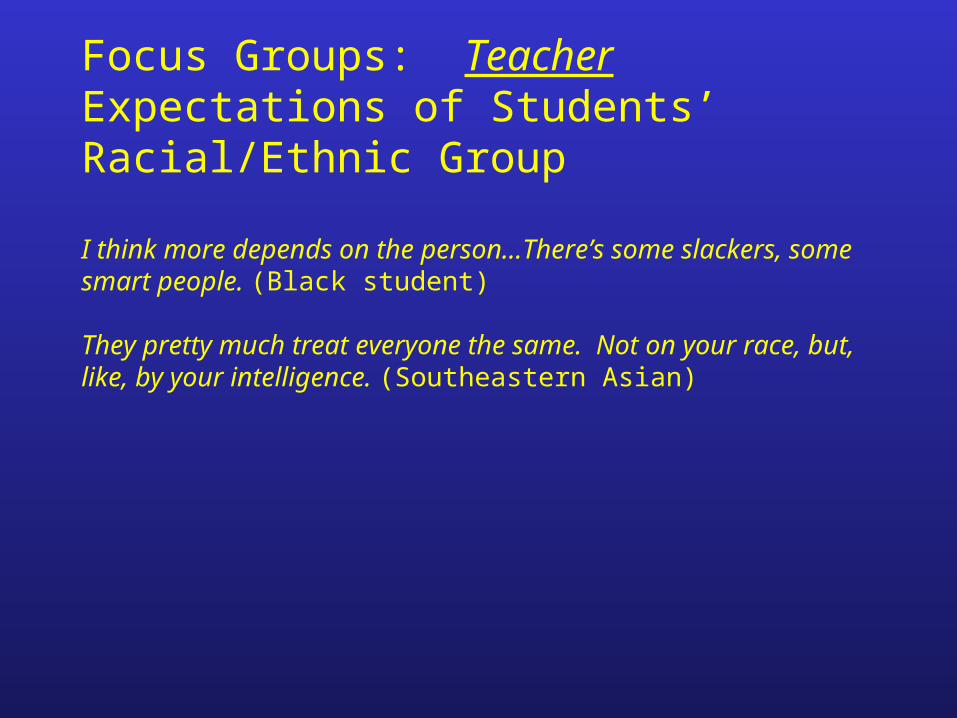
Focus Groups: Teacher Expectations of Students’ Racial/Ethnic Group
I think more depends on the person…There’s some slackers, some smart people. (Black student)
They pretty much treat everyone the same. Not on your race, but, like, by your intelligence. (Southeastern Asian)
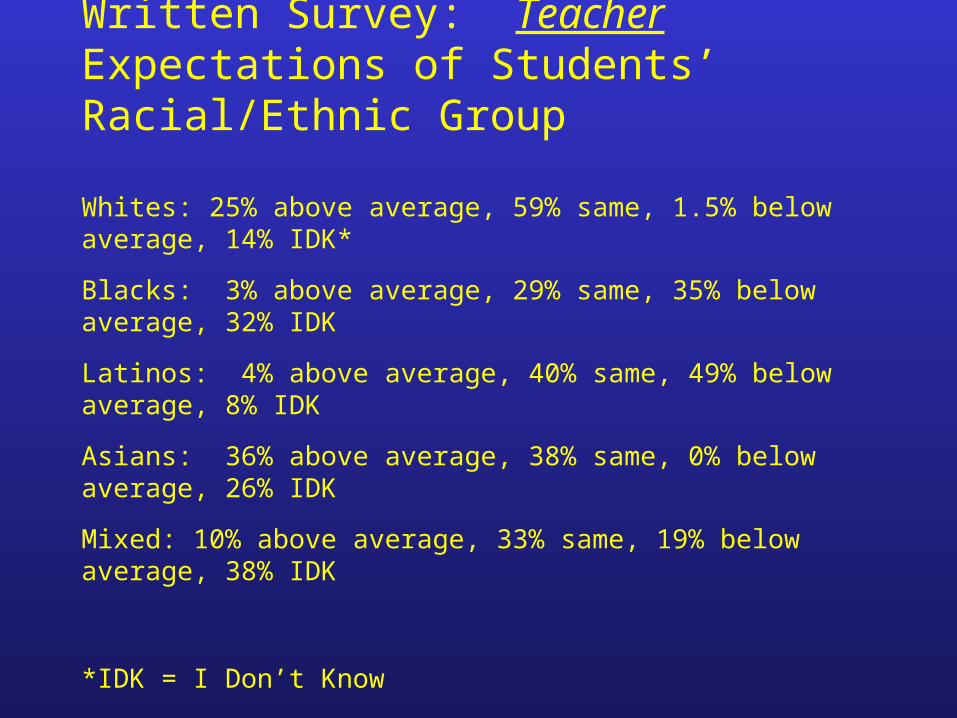
Written Survey: Teacher Expectations of Students’ Racial/Ethnic Group
Whites: 25% above average, 59% same, 1.5% below average, 14% IDK*
Blacks: 3% above average, 29% same, 35% below average, 32% IDK
Latinos: 4% above average, 40% same, 49% below average, 8% IDK
Asians: 36% above average, 38% same, 0% below average, 26% IDK
Mixed: 10% above average, 33% same, 19% below average, 38% IDK
*IDK = I Don’t Know
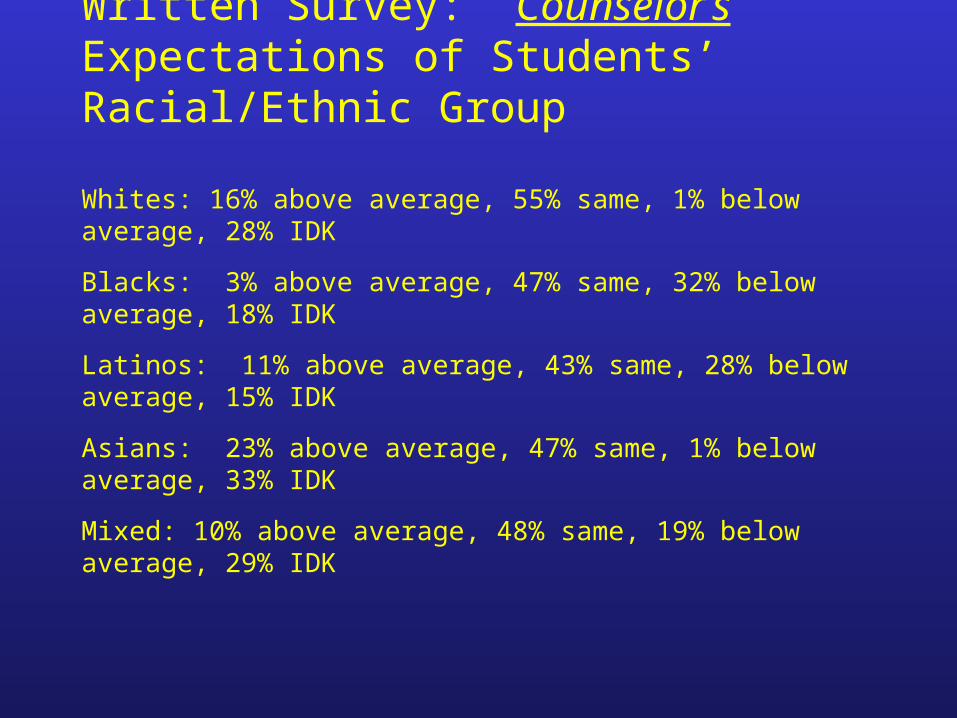
Written Survey: Counselor’s Expectations of Students’ Racial/Ethnic Group
Whites: 16% above average, 55% same, 1% below average, 28% IDK
Blacks: 3% above average, 47% same, 32% below average, 18% IDK
Latinos: 11% above average, 43% same, 28% below average, 15% IDK
Asians: 23% above average, 47% same, 1% below average, 33% IDK
Mixed: 10% above average, 48% same, 19% below average, 29% IDK
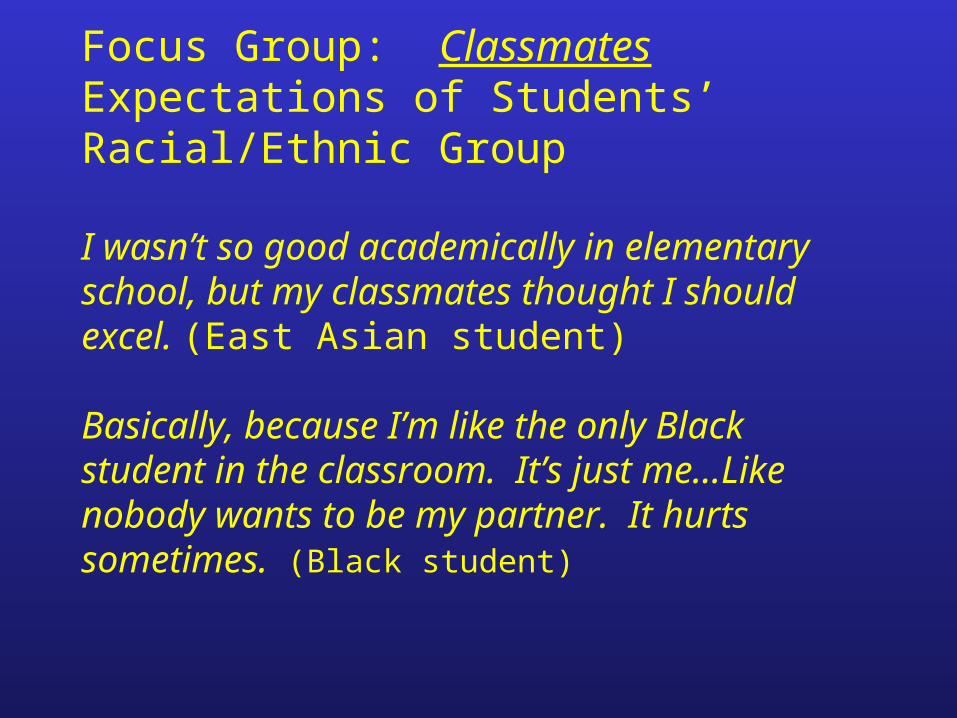
Focus Group: Classmates Expectations of Students’ Racial/Ethnic Group
I wasn’t so good academically in elementary school, but my classmates thought I should excel. (East Asian student)
Basically, because I’m like the only Black student in the classroom. It’s just me…Like nobody wants to be my partner. It hurts sometimes. (Black student)
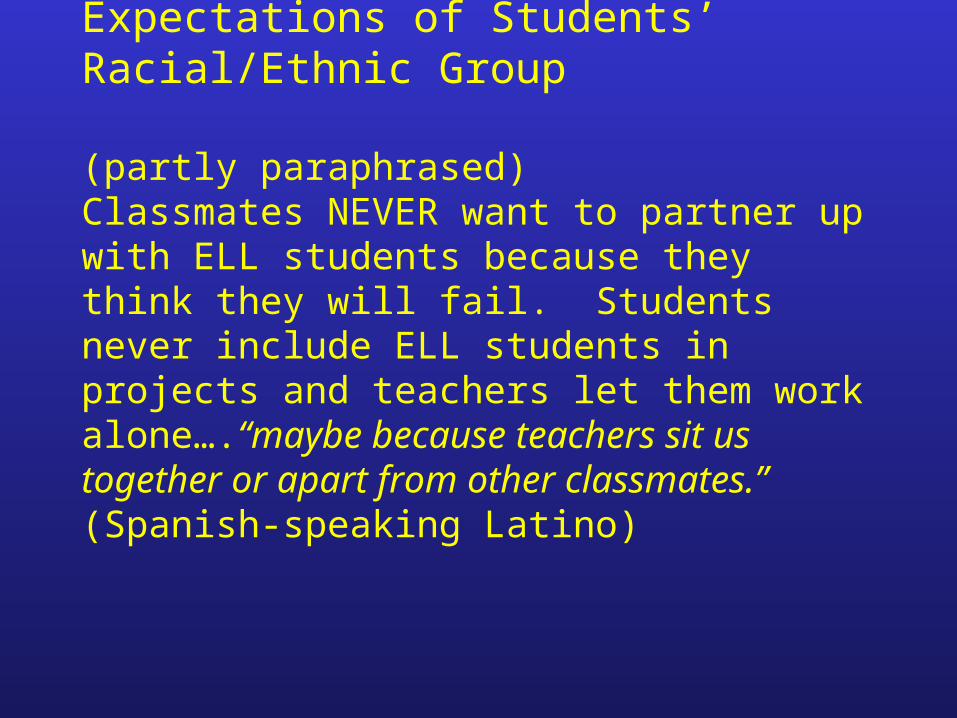
Focus Group: Classmates Expectations of Students’ Racial/Ethnic Group
(partly paraphrased)Classmates NEVER want to partner up with ELL students because they think they will fail. Students never include ELL students in projects and teachers let them work alone….“maybe because teachers sit us together or apart from other classmates.”(Spanish-speaking Latino)
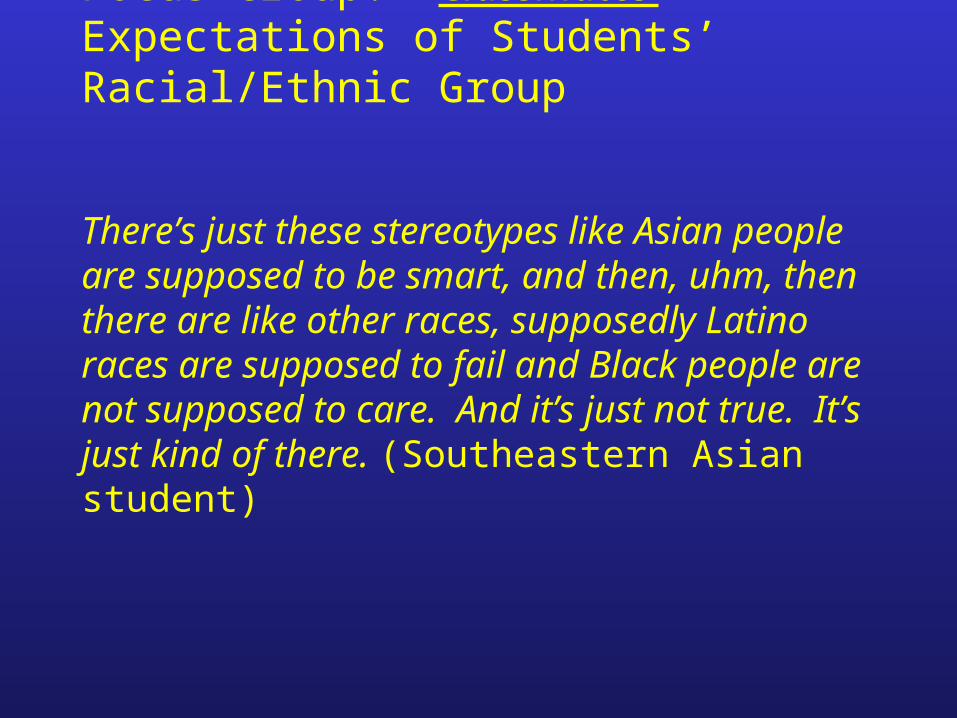
Focus Group: Classmates’ Expectations of Students’ Racial/Ethnic Group
There’s just these stereotypes like Asian people are supposed to be smart, and then, uhm, then there are like other races, supposedly Latino races are supposed to fail and Black people are not supposed to care. And it’s just not true. It’s just kind of there. (Southeastern Asian student)
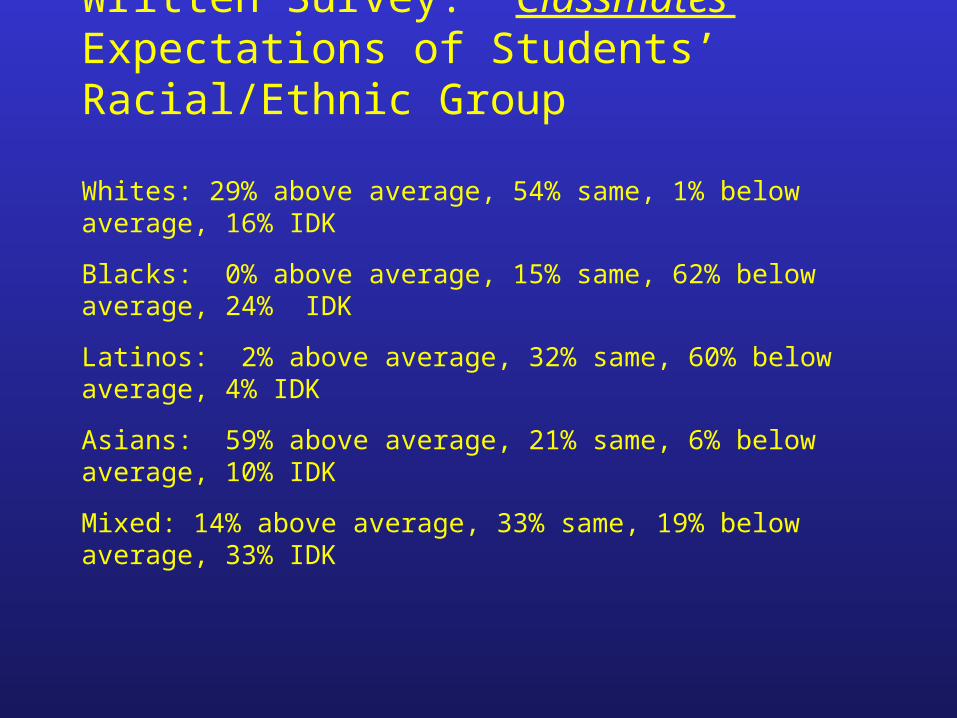
Written Survey: Classmates’ Expectations of Students’ Racial/Ethnic Group
Whites: 29% above average, 54% same, 1% below average, 16% IDK
Blacks: 0% above average, 15% same, 62% below average, 24% IDK
Latinos: 2% above average, 32% same, 60% below average, 4% IDK
Asians: 59% above average, 21% same, 6% below average, 10% IDK
Mixed: 14% above average, 33% same, 19% below average, 33% IDK
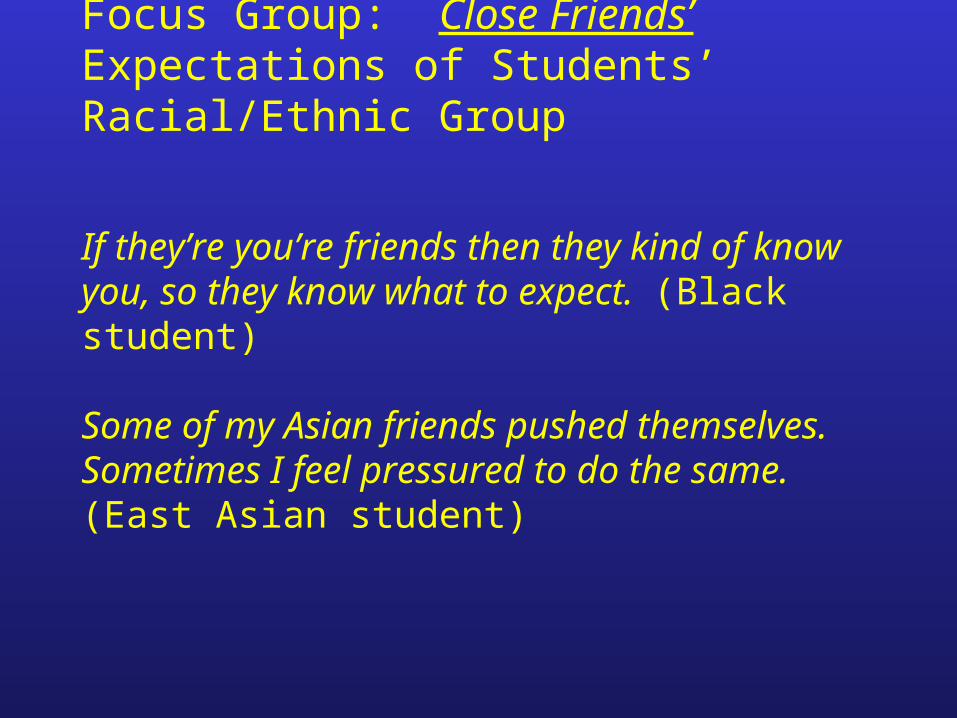
Focus Group: Close Friends’ Expectations of Students’ Racial/Ethnic Group
If they’re you’re friends then they kind of know you, so they know what to expect. (Black student)
Some of my Asian friends pushed themselves. Sometimes I feel pressured to do the same. (East Asian student)
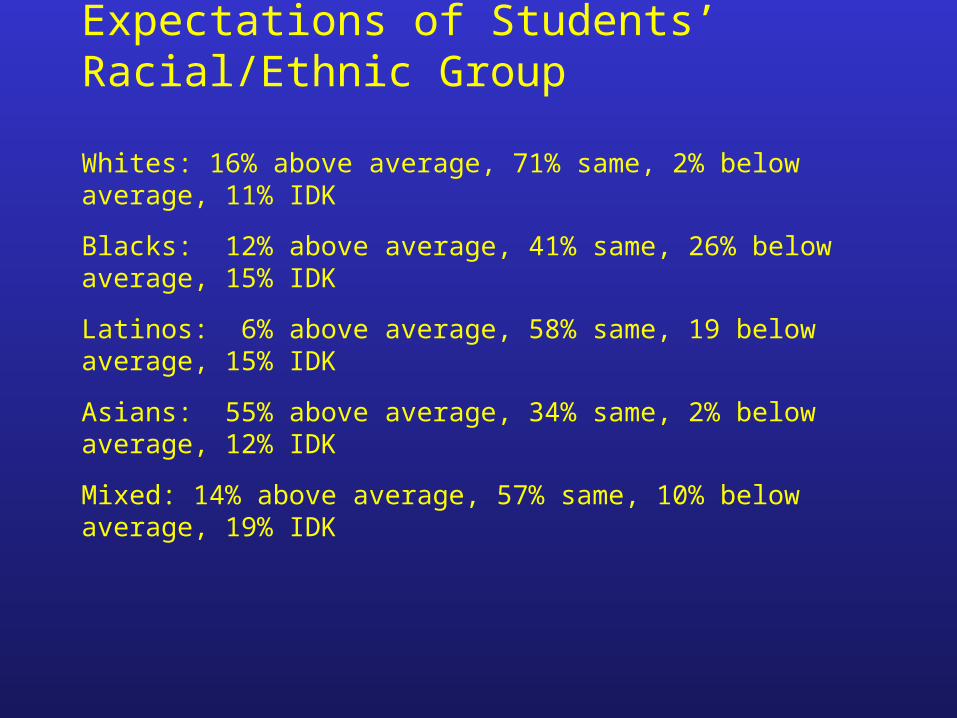
Written Survey: Close Friends’ Expectations of Students’ Racial/Ethnic Group
Whites: 16% above average, 71% same, 2% below average, 11% IDK
Blacks: 12% above average, 41% same, 26% below average, 15% IDK
Latinos: 6% above average, 58% same, 19 below average, 15% IDK
Asians: 55% above average, 34% same, 2% below average, 12% IDK
Mixed: 14% above average, 57% same, 10% below average, 19% IDK
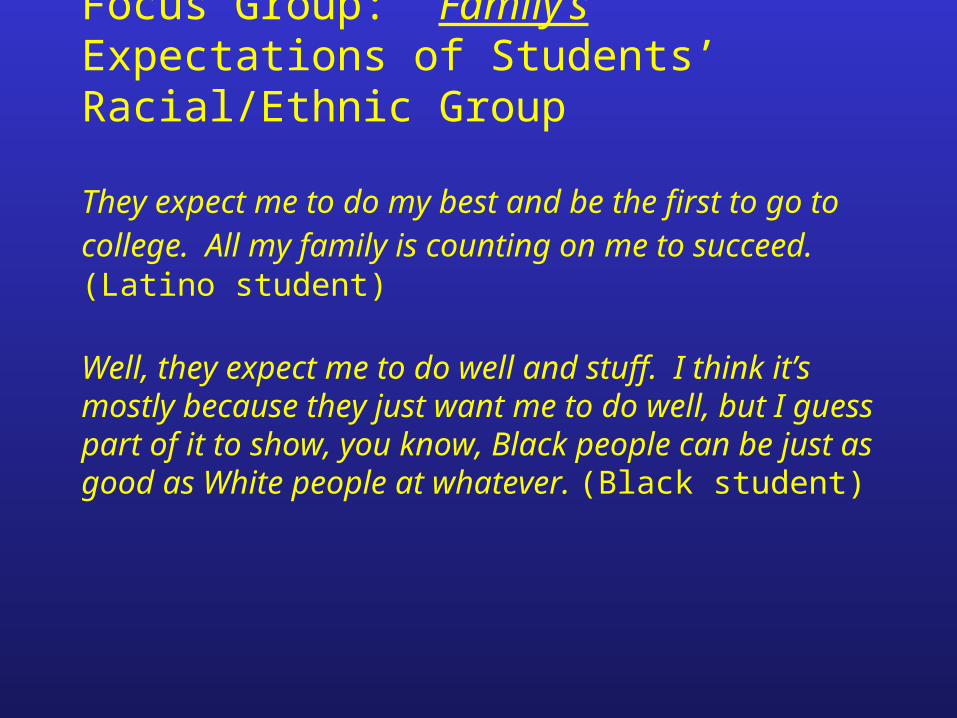
Focus Group: Family’s Expectations of Students’ Racial/Ethnic Group
They expect me to do my best and be the first to go to college. All my family is counting on me to succeed. (Latino student)
Well, they expect me to do well and stuff. I think it’s mostly because they just want me to do well, but I guess part of it to show, you know, Black people can be just as good as White people at whatever. (Black student)
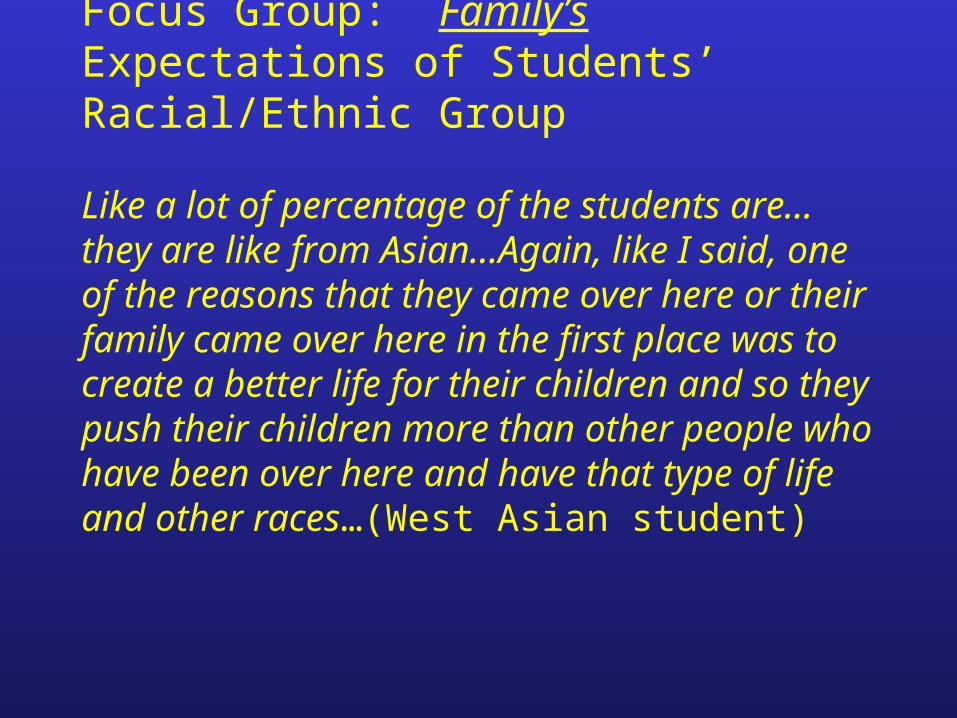
Focus Group: Family’s Expectations of Students’ Racial/Ethnic Group
Like a lot of percentage of the students are…they are like from Asian…Again, like I said, one of the reasons that they came over here or their family came over here in the first place was to create a better life for their children and so they push their children more than other people who have been over here and have that type of life and other races…(West Asian student)
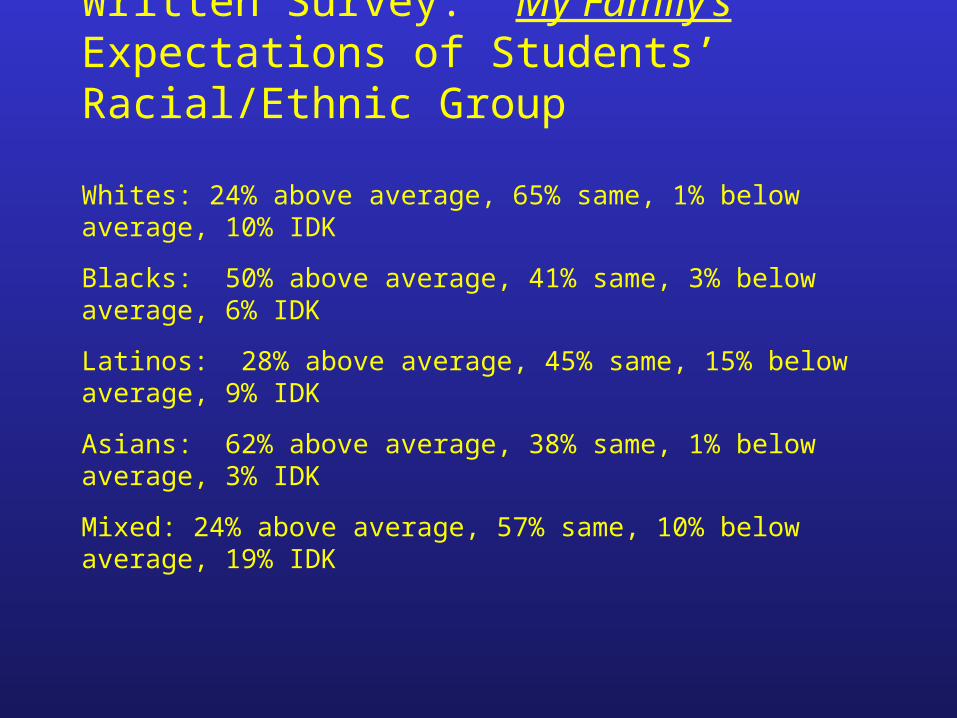
Written Survey: My Family’s Expectations of Students’ Racial/Ethnic Group
Whites: 24% above average, 65% same, 1% below average, 10% IDK
Blacks: 50% above average, 41% same, 3% below average, 6% IDK
Latinos: 28% above average, 45% same, 15% below average, 9% IDK
Asians: 62% above average, 38% same, 1% below average, 3% IDK
Mixed: 24% above average, 57% same, 10% below average, 19% IDK
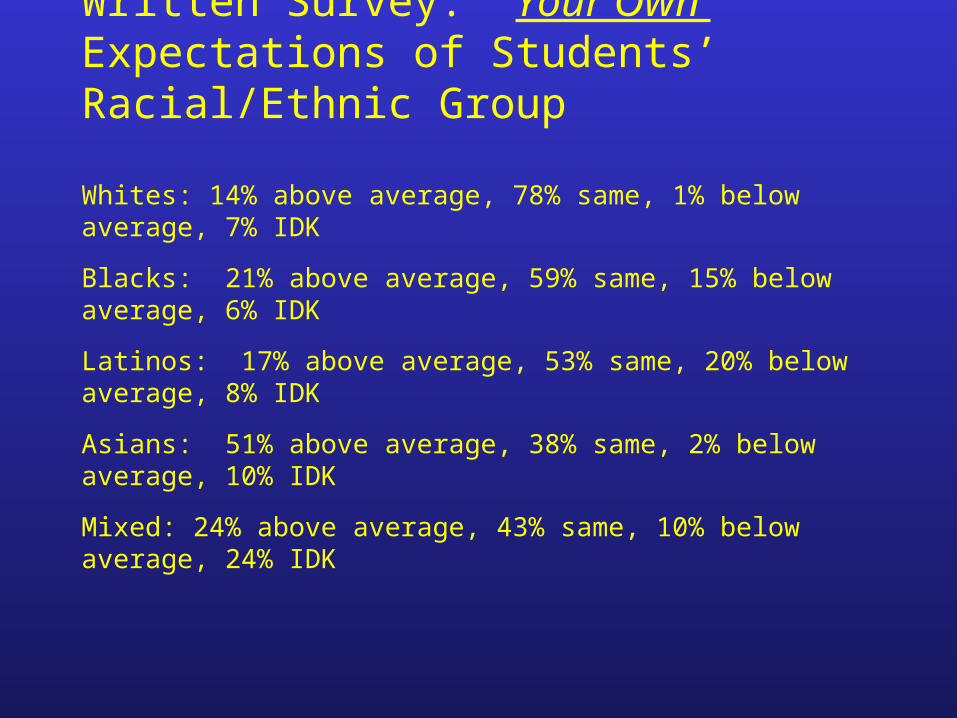
Written Survey: Your Own Expectations of Students’ Racial/Ethnic Group
Whites: 14% above average, 78% same, 1% below average, 7% IDK
Blacks: 21% above average, 59% same, 15% below average, 6% IDK
Latinos: 17% above average, 53% same, 20% below average, 8% IDK
Asians: 51% above average, 38% same, 2% below average, 10% IDK
Mixed: 24% above average, 43% same, 10% below average, 24% IDK
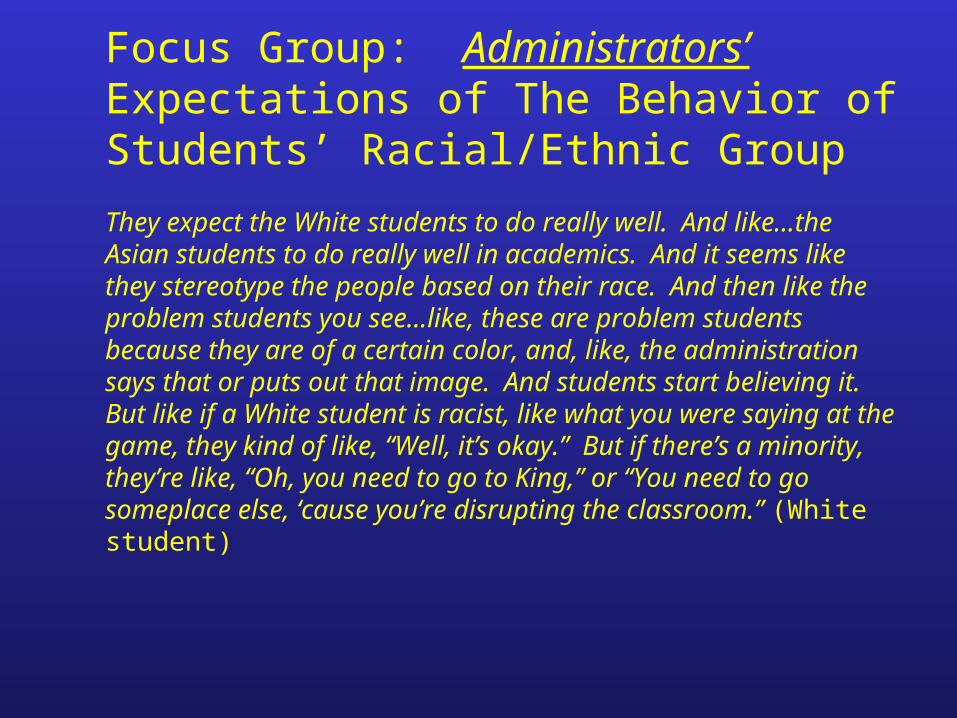
Focus Group: Administrators’ Expectations of The Behavior of Students’ Racial/Ethnic Group
They expect the White students to do really well. And like…the Asian students to do really well in academics. And it seems like they stereotype the people based on their race. And then like the problem students you see…like, these are problem students because they are of a certain color, and, like, the administration says that or puts out that image. And students start believing it. But like if a White student is racist, like what you were saying at the game, they kind of like, “Well, it’s okay.” But if there’s a minority, they’re like, “Oh, you need to go to King,” or “You need to go someplace else, ‘cause you’re disrupting the classroom.” (White student)
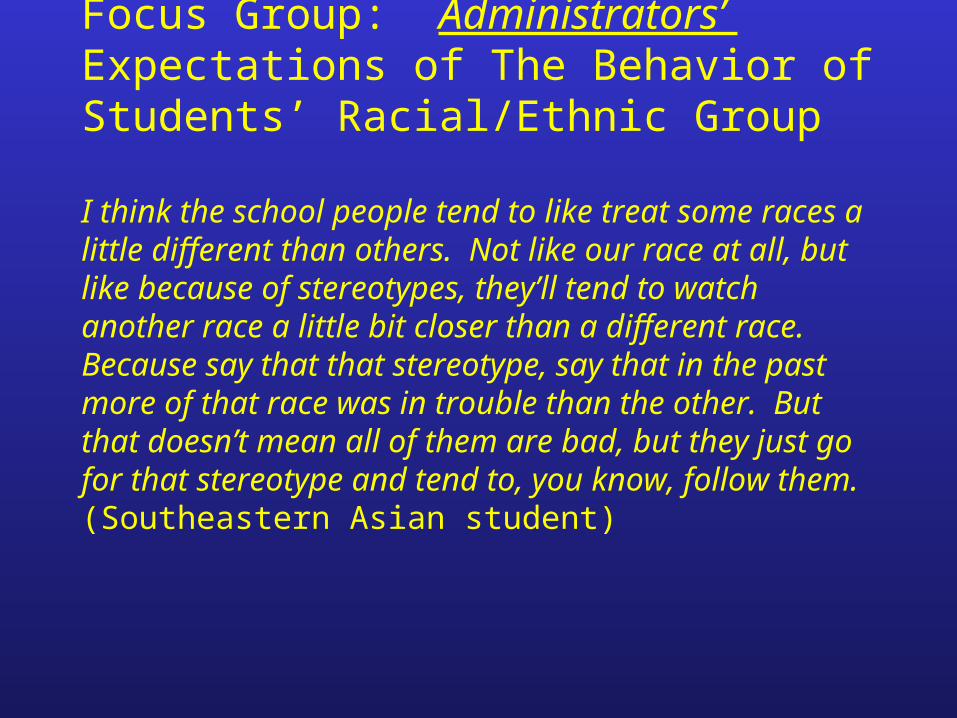
Focus Group: Administrators’ Expectations of The Behavior of Students’ Racial/Ethnic Group
I think the school people tend to like treat some races a little different than others. Not like our race at all, but like because of stereotypes, they’ll tend to watch another race a little bit closer than a different race. Because say that that stereotype, say that in the past more of that race was in trouble than the other. But that doesn’t mean all of them are bad, but they just go for that stereotype and tend to, you know, follow them. (Southeastern Asian student)
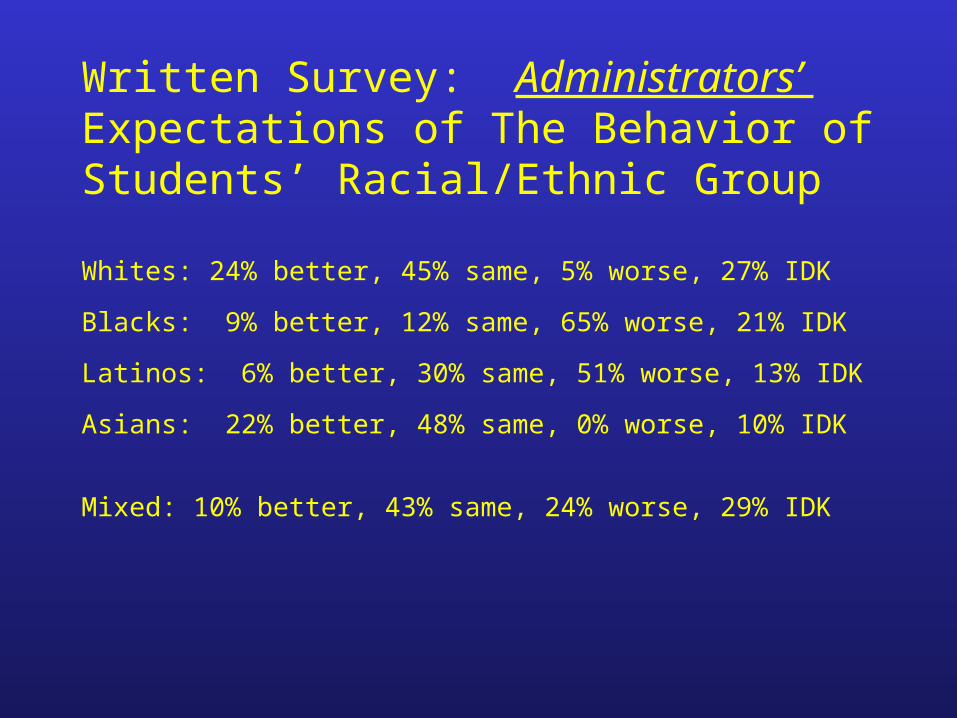
Written Survey: Administrators’ Expectations of The Behavior of Students’ Racial/Ethnic Group
Whites: 24% better, 45% same, 5% worse, 27% IDK
Blacks: 9% better, 12% same, 65% worse, 21% IDK
Latinos: 6% better, 30% same, 51% worse, 13% IDK
Asians: 22% better, 48% same, 0% worse, 10% IDK
Mixed: 10% better, 43% same, 24% worse, 29% IDK
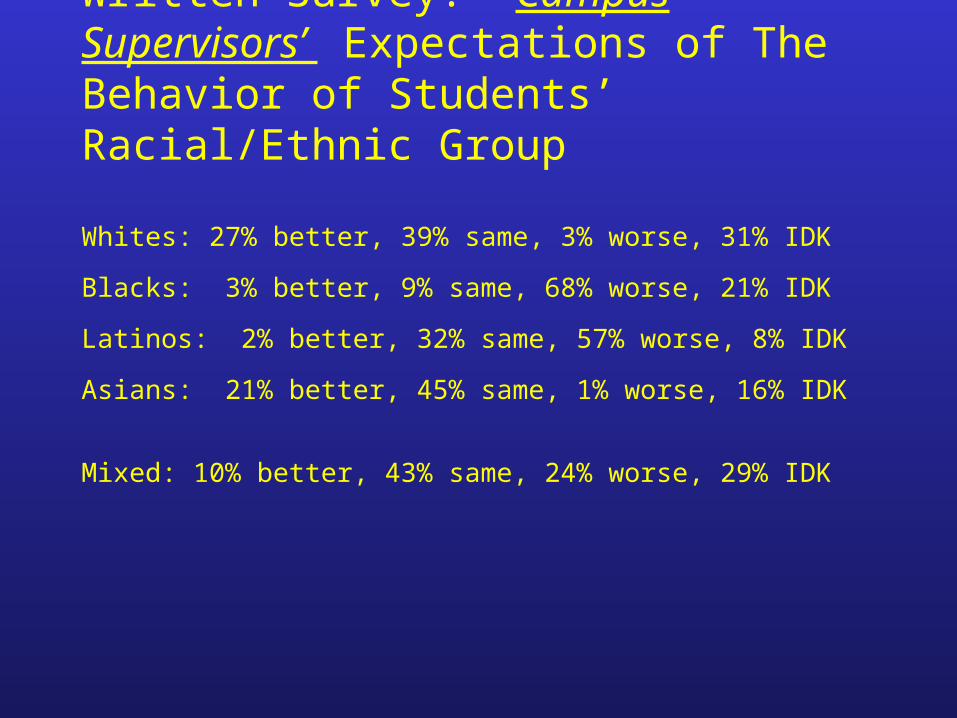
Written Survey: Campus Supervisors’ Expectations of The Behavior of Students’ Racial/Ethnic Group
Whites: 27% better, 39% same, 3% worse, 31% IDK
Blacks: 3% better, 9% same, 68% worse, 21% IDK
Latinos: 2% better, 32% same, 57% worse, 8% IDK
Asians: 21% better, 45% same, 1% worse, 16% IDK
Mixed: 10% better, 43% same, 24% worse, 29% IDK
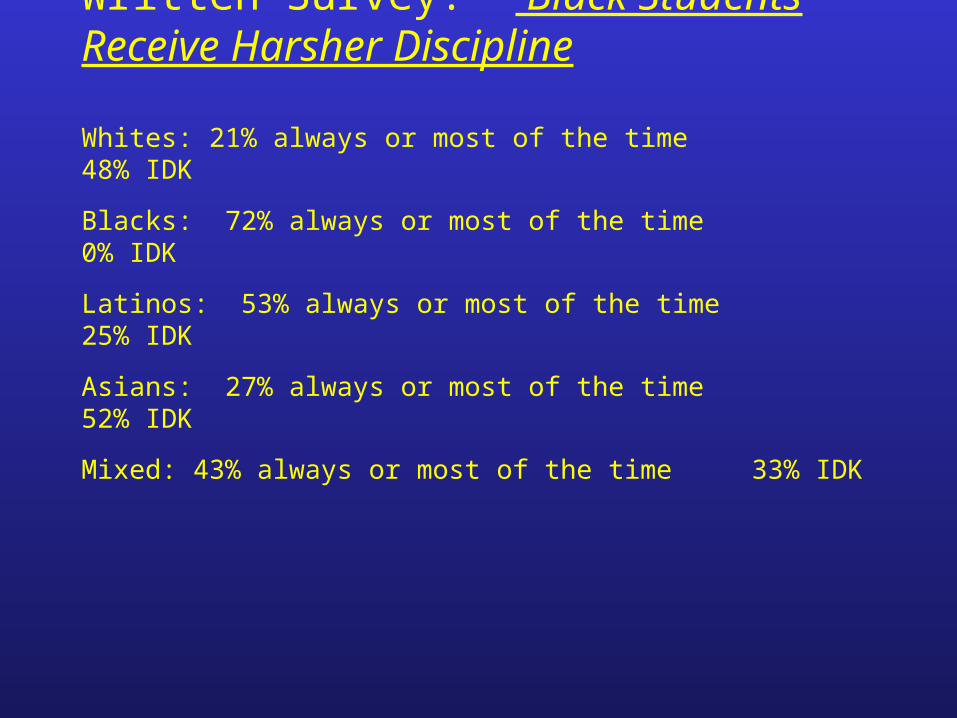
Written Survey: Black Students Receive Harsher Discipline
Whites: 21% always or most of the time 48% IDK
Blacks: 72% always or most of the time 0% IDK
Latinos: 53% always or most of the time 25% IDK
Asians: 27% always or most of the time 52% IDK
Mixed: 43% always or most of the time 33% IDK
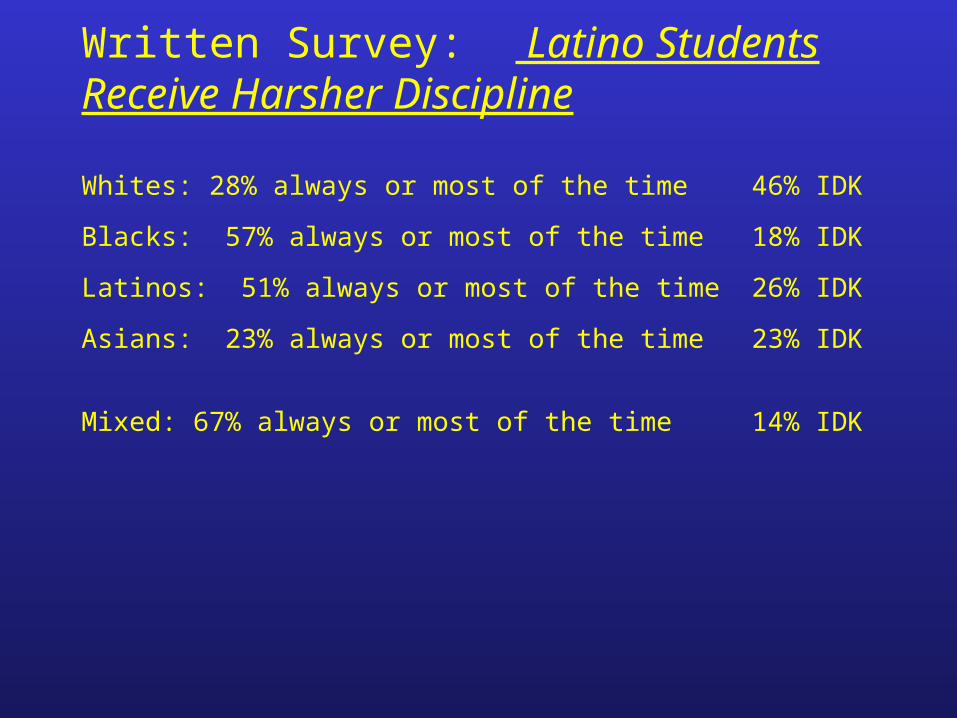
Written Survey: Latino Students Receive Harsher Discipline
Whites: 28% always or most of the time 46% IDK
Blacks: 57% always or most of the time 18% IDK
Latinos: 51% always or most of the time 26% IDK
Asians: 23% always or most of the time 23% IDK
Mixed: 67% always or most of the time 14% IDK
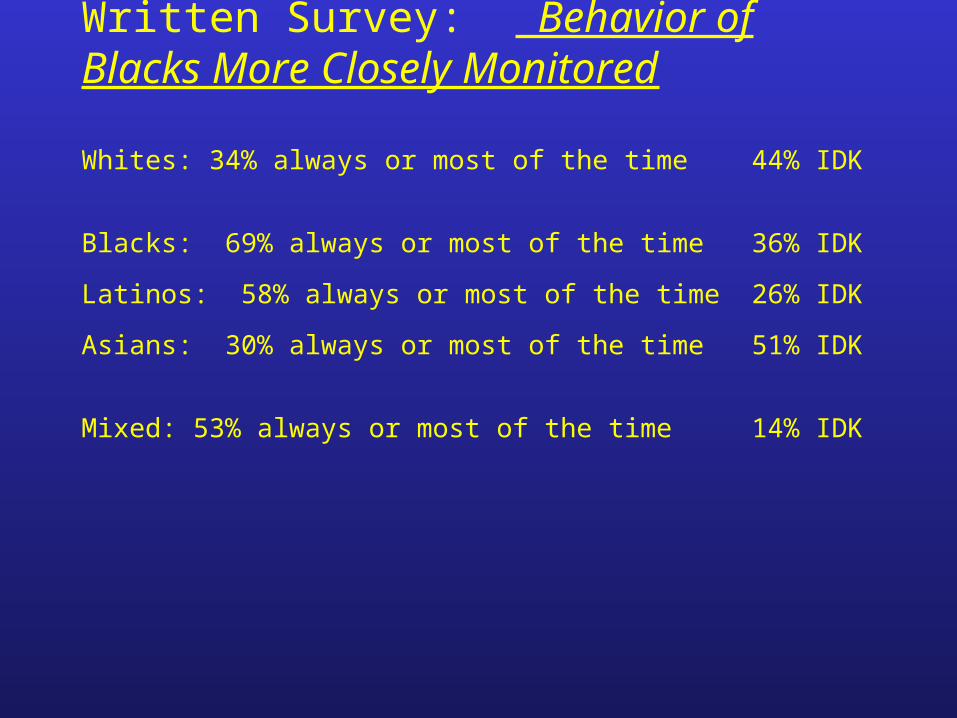
Written Survey: Behavior of Blacks More Closely Monitored
Whites: 34% always or most of the time 44% IDK
Blacks: 69% always or most of the time 36% IDK
Latinos: 58% always or most of the time 26% IDK
Asians: 30% always or most of the time 51% IDK
Mixed: 53% always or most of the time 14% IDK
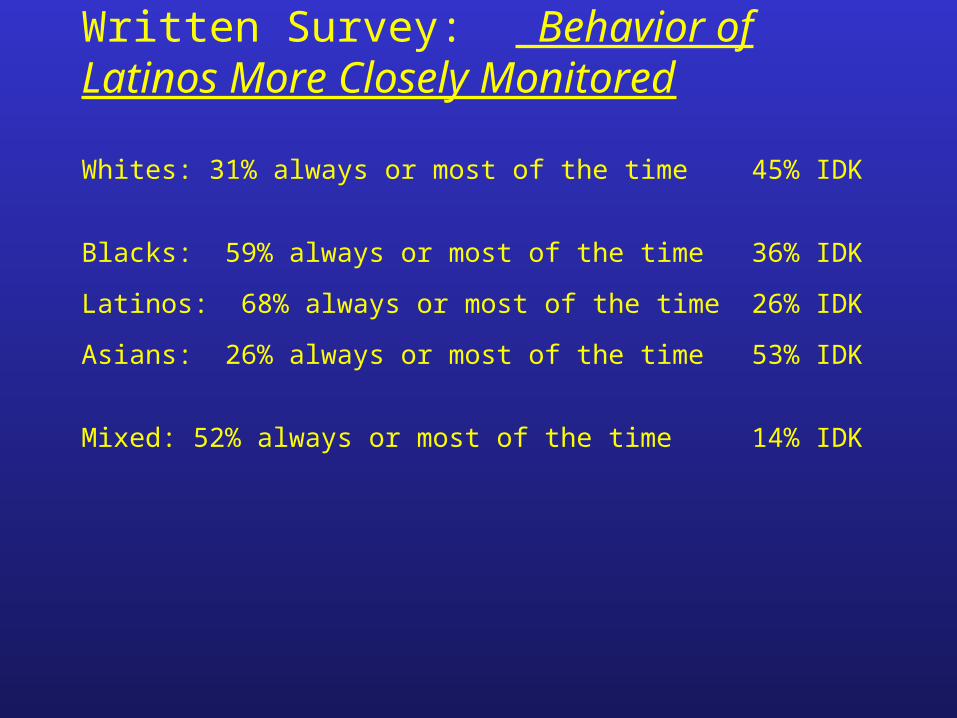
Written Survey: Behavior of Latinos More Closely Monitored
Whites: 31% always or most of the time 45% IDK
Blacks: 59% always or most of the time 36% IDK
Latinos: 68% always or most of the time 26% IDK
Asians: 26% always or most of the time 53% IDK
Mixed: 52% always or most of the time 14% IDK
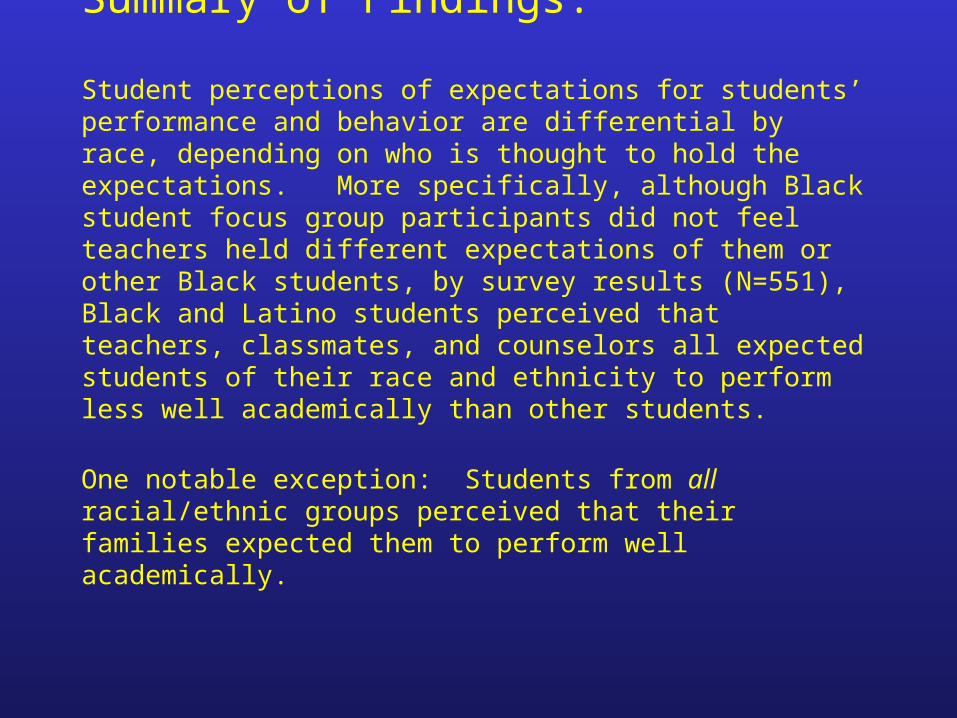
Summary of Findings:
Student perceptions of expectations for students’ performance and behavior are differential by race, depending on who is thought to hold the expectations. More specifically, although Black student focus group participants did not feel teachers held different expectations of them or other Black students, by survey results (N=551), Black and Latino students perceived that teachers, classmates, and counselors all expected students of their race and ethnicity to perform less well academically than other students.
One notable exception: Students from all racial/ethnic groups perceived that their families expected them to perform well academically.
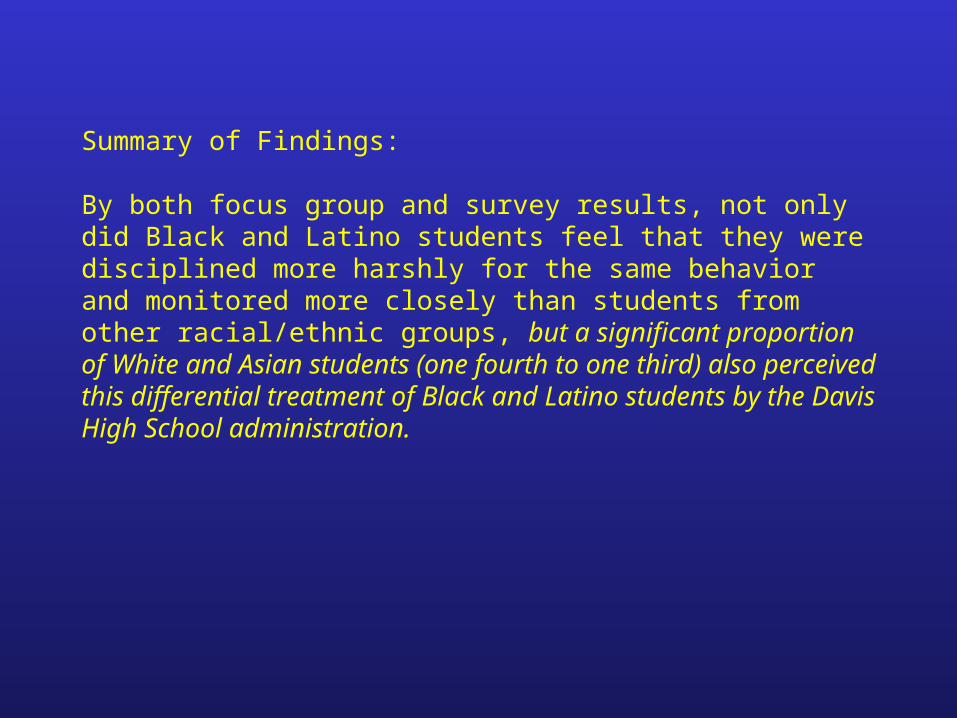
Summary of Findings: By both focus group and survey results, not only did Black and Latino students feel that they were disciplined more harshly for the same behavior and monitored more closely than students from other racial/ethnic groups, but a significant proportion of White and Asian students (one fourth to one third) also perceived this differential treatment of Black and Latino students by the Davis High School administration.
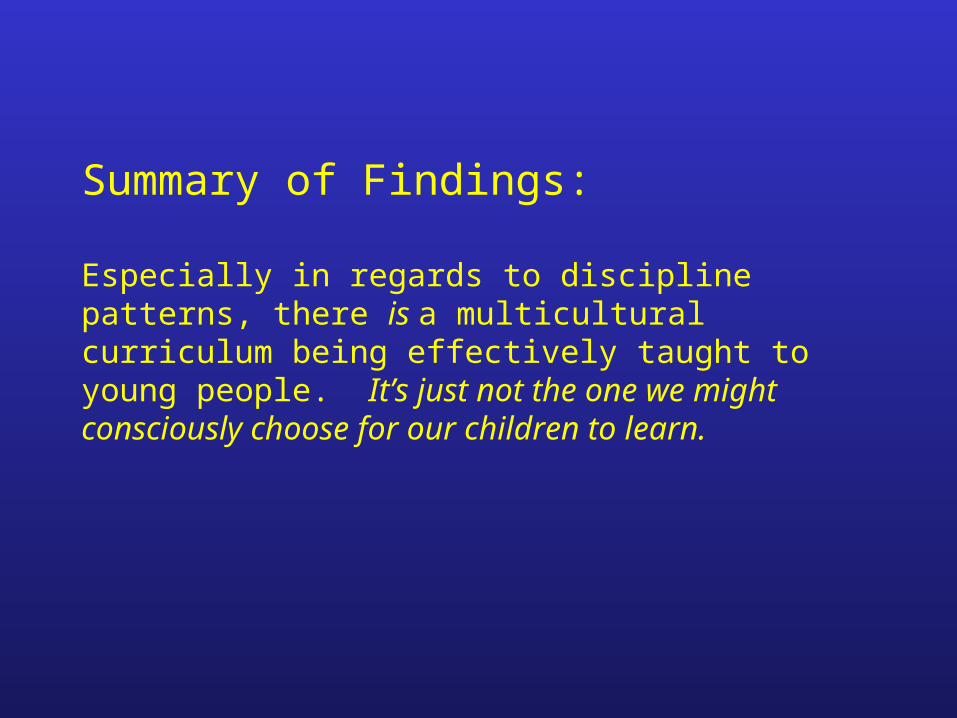
Summary of Findings:
Especially in regards to discipline patterns, there is a multicultural curriculum being effectively taught to young people. It’s just not the one we might consciously choose for our children to learn.
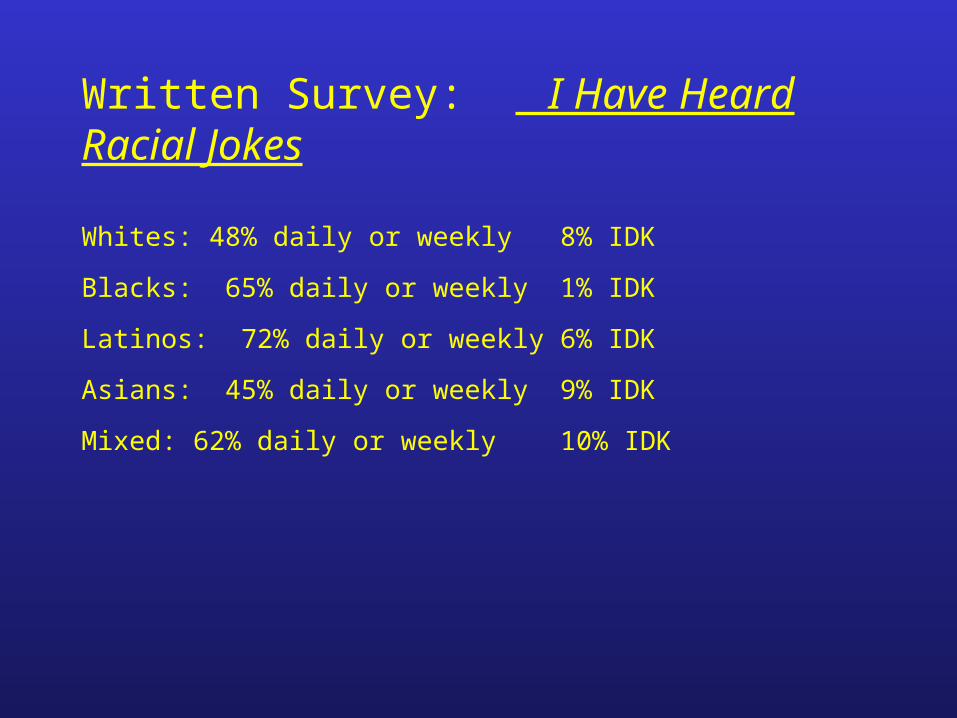
Written Survey: I Have Heard Racial Jokes
Whites: 48% daily or weekly 8% IDK
Blacks: 65% daily or weekly 1% IDK
Latinos: 72% daily or weekly 6% IDK
Asians: 45% daily or weekly 9% IDK
Mixed: 62% daily or weekly 10% IDK
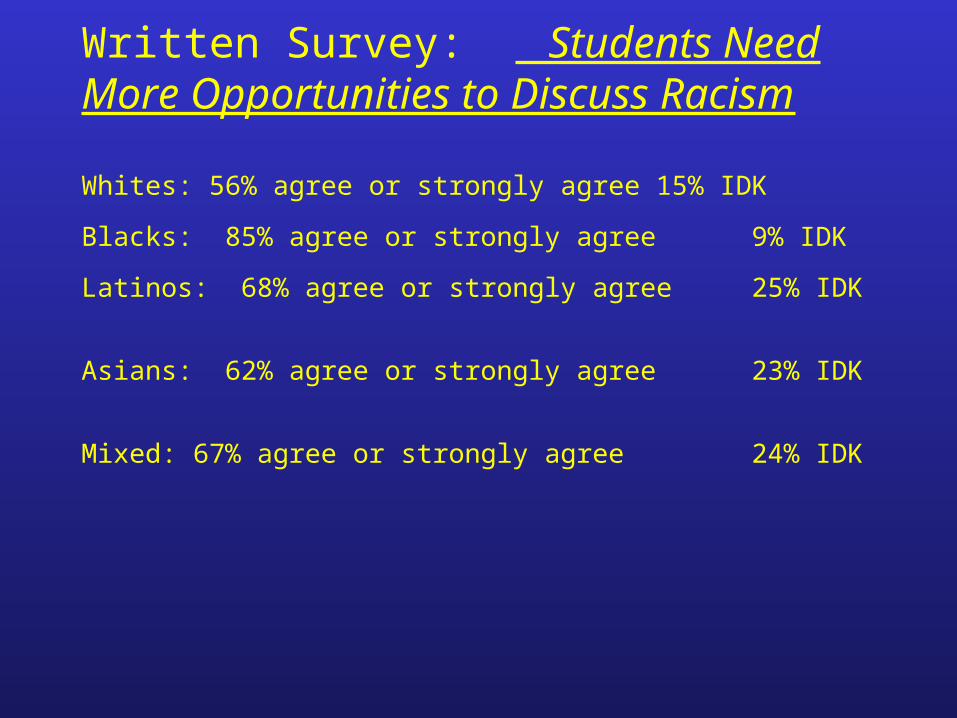
Written Survey: Students Need More Opportunities to Discuss Racism
Whites: 56% agree or strongly agree 15% IDK
Blacks: 85% agree or strongly agree 9% IDK
Latinos: 68% agree or strongly agree 25% IDK
Asians: 62% agree or strongly agree 23% IDK
Mixed: 67% agree or strongly agree 24% IDK
The Action in Action Research Youth In Focus Student Research Scholars
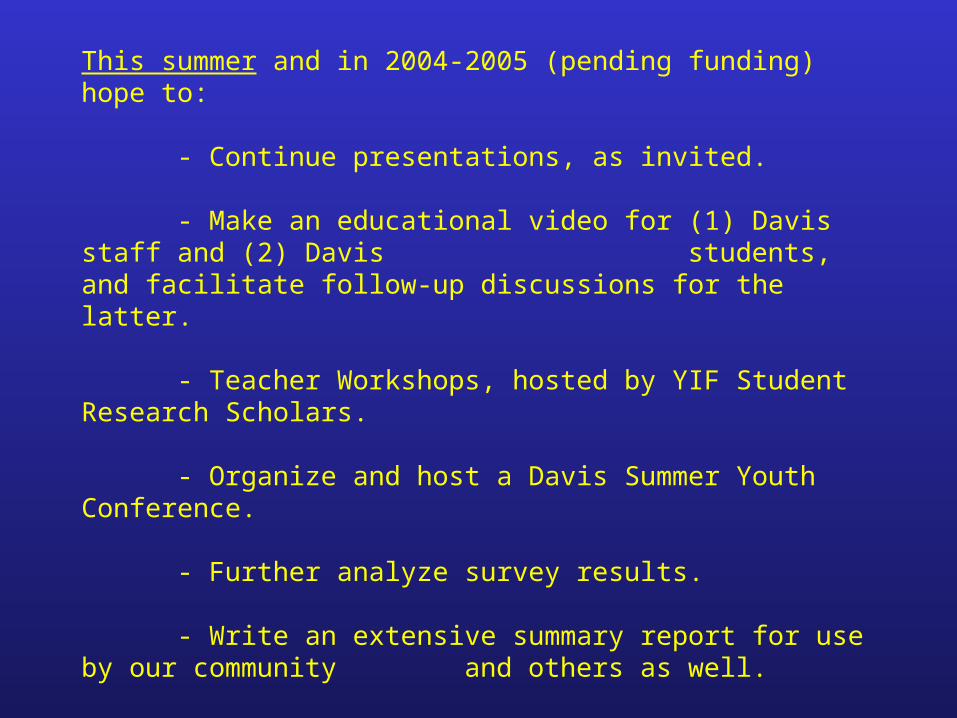
This summer and in 2004-2005 (pending funding) hope to:
- Continue presentations, as invited.
- Make an educational video for (1) Davis staff and (2) Davis students, and facilitate follow-up discussions for the latter.
- Teacher Workshops, hosted by YIF Student Research Scholars.
- Organize and host a Davis Summer Youth Conference.
- Further analyze survey results.
- Write an extensive summary report for use by our community and others as well.
- Continue as Senior Student Research Scholars in 2004-2005.
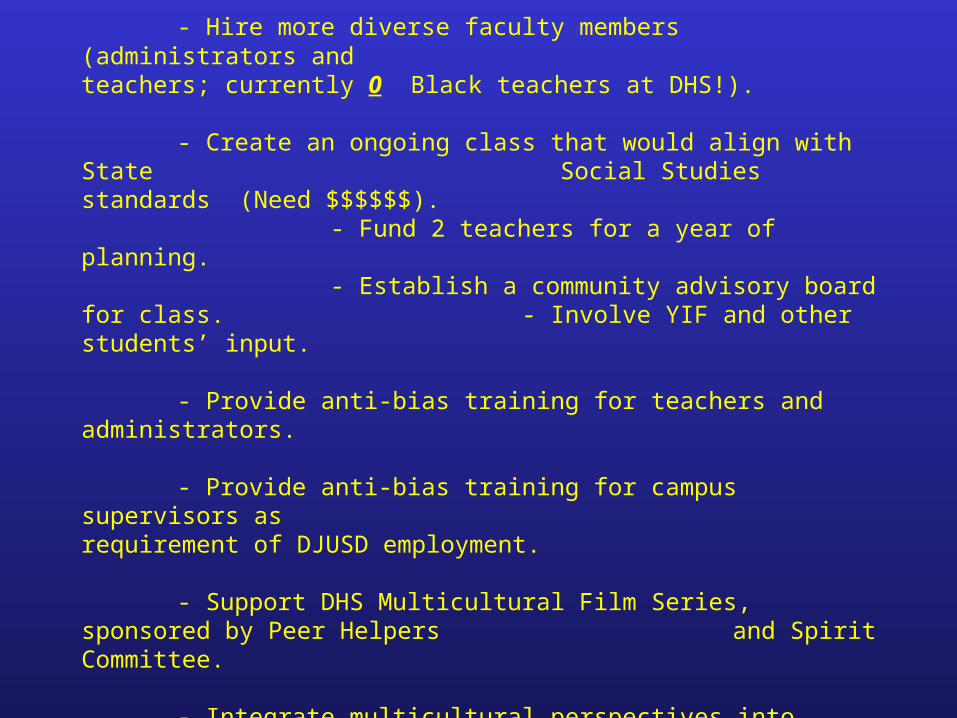
The Action in Action Research DJUSD Administrators, Teachers, and Staff
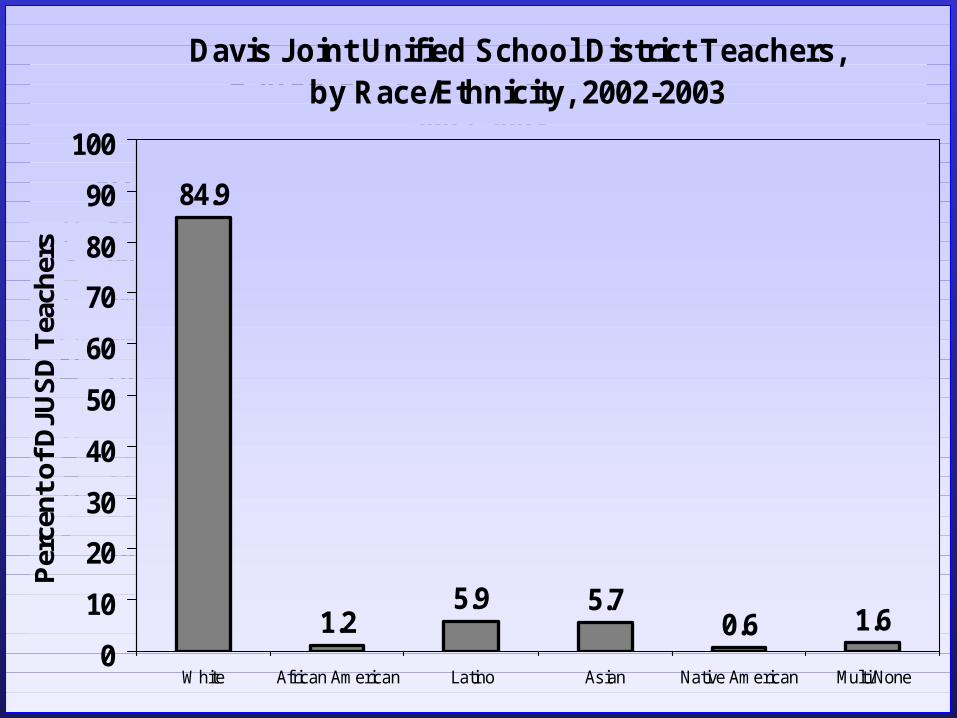
- Hire more diverse faculty members (administrators and teachers; currently 0 Black teachers at DHS!).
- Create an ongoing class that would align with State Social Studies standards (Need $$$$$$).
- Fund 2 teachers for a year of planning. - Establish a community advisory board for class. - Involve YIF and other students’ input.
- Provide anti-bias training for teachers and administrators.
- Provide anti-bias training for campus supervisors as requirement of DJUSD employment.
- Support DHS Multicultural Film Series, sponsored by Peer Helpers and Spirit Committee.
- Integrate multicultural perspectives into current curriculum.
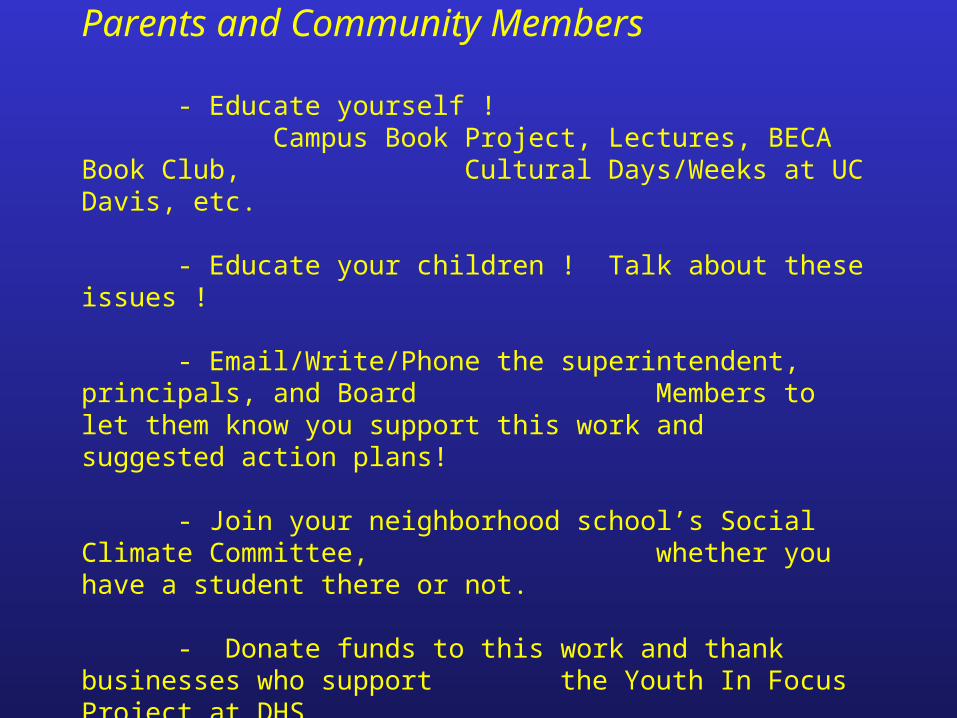
The Action in Action Research Parents and Community Members
- Educate yourself !Campus Book Project, Lectures, BECA Book Club, Cultural Days/Weeks at UC Davis, etc.
- Educate your children ! Talk about these issues !
- Email/Write/Phone the superintendent, principals, and Board Members to let them know you support this
work and suggested action plans!
- Join your neighborhood school’s Social Climate Committee, whether you have a student there or not.
- Donate funds to this work and thank businesses who support the Youth In Focus Project at DHS.

Background DJUSD Data on
Educational Equity,Updated by the Student
Research Scholars – May 2004
DJUSD Students, by Race/Ethnicity 2003-2004
0.8 1
15.710.1
3.6
69.8
0
10
20
30
40
50
60
70
80
90
100
White African American Latino Asian Native American Multi/None
Per
cen
t o
f D
JUS
D S
tud
ents
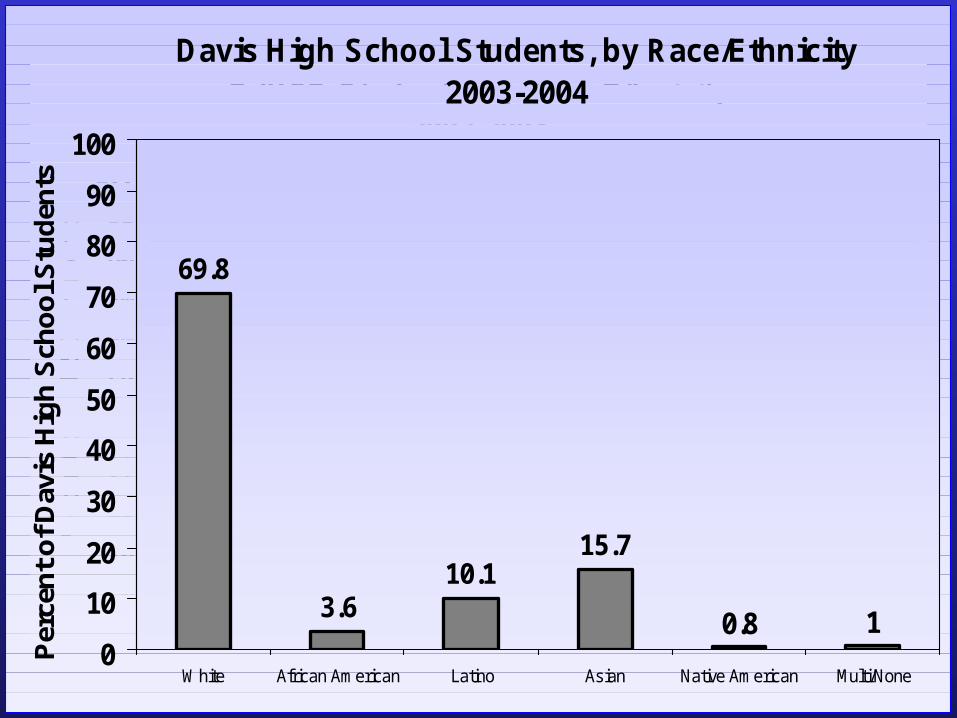
Davis High School Students, by Race/Ethnicity 2003-2004
0.8 1
69.8
3.610.1
15.7
0
10
20
30
40
50
60
70
80
90
100
White African American Latino Asian Native American Multi/None
Per
cen
t o
f D
avis
Hig
h S
cho
ol S
tud
ents
DJUSD Students, by Race/Ethnicity 2003-2004
0.8 1
15.710.1
3.6
69.8
0
10
20
30
40
50
60
70
80
90
100
White African American Latino Asian Native American Multi/None
Per
cen
t o
f D
JUS
D S
tud
ents
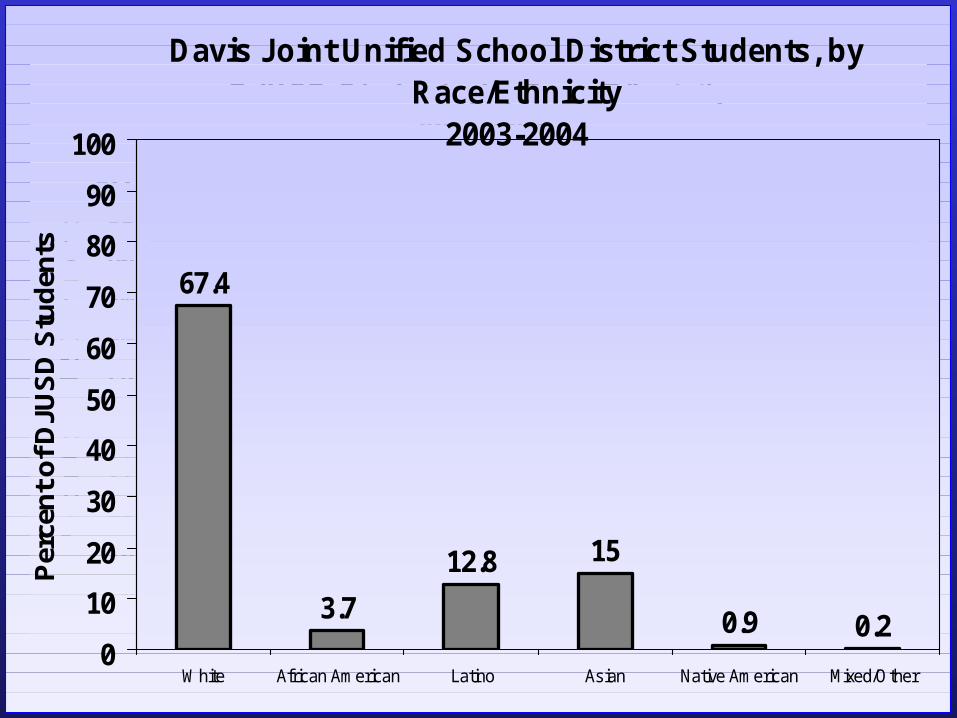
Davis Joint Unified School District Students, by Race/Ethnicity
2003-2004
67.4
3.7
12.8 15
0.9 0.20
10
20
30
40
50
60
70
80
90
100
White African American Latino Asian Native American Mixed/Other
Per
cen
t o
f D
JUS
D S
tud
ents
DJUSD Students, by Race/Ethnicity 2003-2004
0.8 1
15.710.1
3.6
69.8
0
10
20
30
40
50
60
70
80
90
100
White African American Latino Asian Native American Multi/None
Per
cen
t o
f D
JUS
D S
tud
ents
Davis Joint Unified School District Teachers, by Race/Ethnicity, 2002-2003
84.9
1.25.9 5.7
0.6 1.60
10
20
30
40
50
60
70
80
90
100
White African American Latino Asian Native American Multi/None
Per
cen
t o
f D
JUS
D T
each
ers
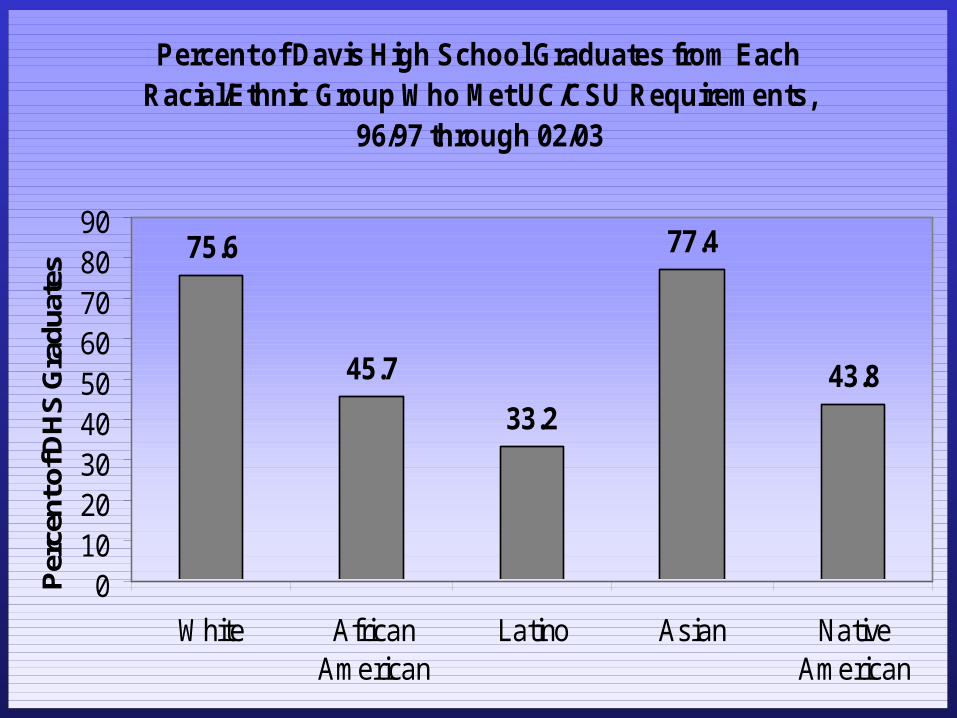
Percent of Davis High School Graduates from Each Racial/Ethnic Group Who Met UC/CSU Requirements,
96/97 through 02/03
75.6
45.7
33.243.8
77.4
0102030405060708090
White AfricanAmerican
Latino Asian NativeAmerican
Per
cent
of D
HS
Gra
duat
es
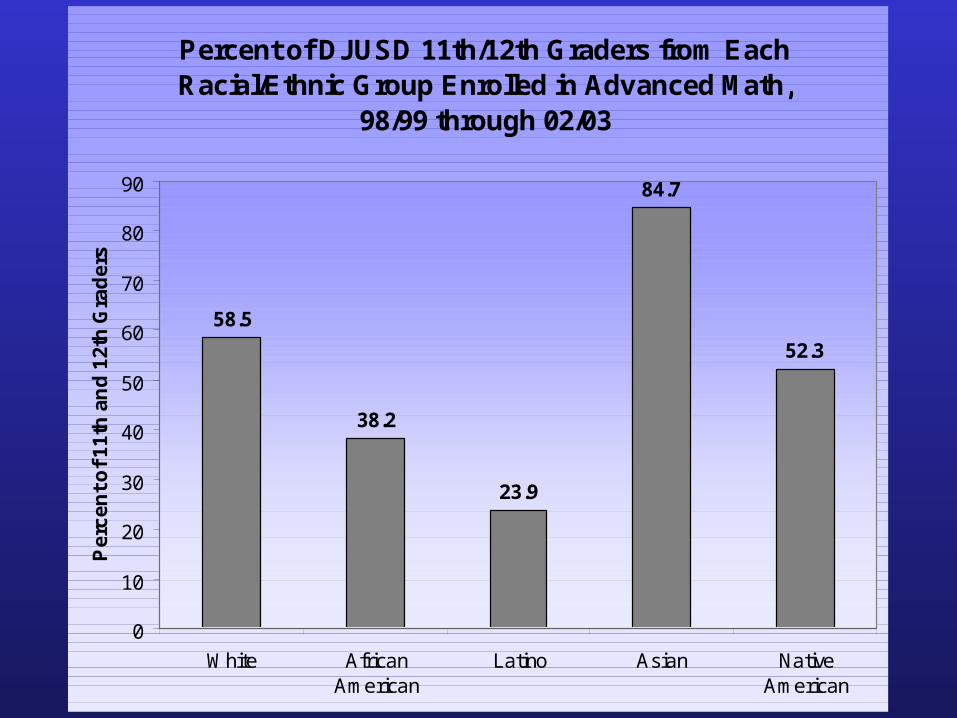
Percent of DJUSD 11th/12th Graders from Each Racial/Ethnic Group Enrolled in Advanced Math,
98/99 through 02/03
23.9
84.7
52.3
38.2
58.5
0
10
20
30
40
50
60
70
80
90
White AfricanAmerican
Latino Asian NativeAmerican
Pe
rce
nt
of
11
th a
nd
12
th G
rad
ers
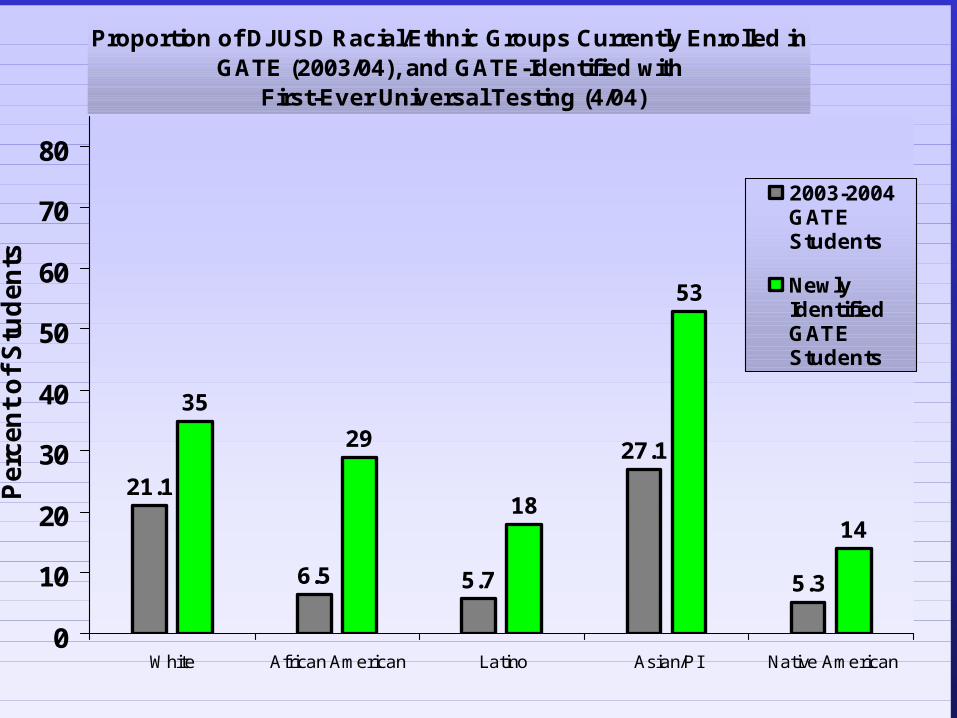
Proportion of DJUSD Racial/Ethnic Groups Currently Enrolled in GATE (2003/04), and GATE-Identified with
First-Ever Universal Testing (4/04)
21.1
6.5 5.7
27.1
5.3
35
29
18
53
14
0
10
20
30
40
50
60
70
80
White African American Latino Asian/PI Native American
Per
cen
t o
f S
tud
ents
2003-2004GATEStudents
NewlyIdentifiedGATEStudents
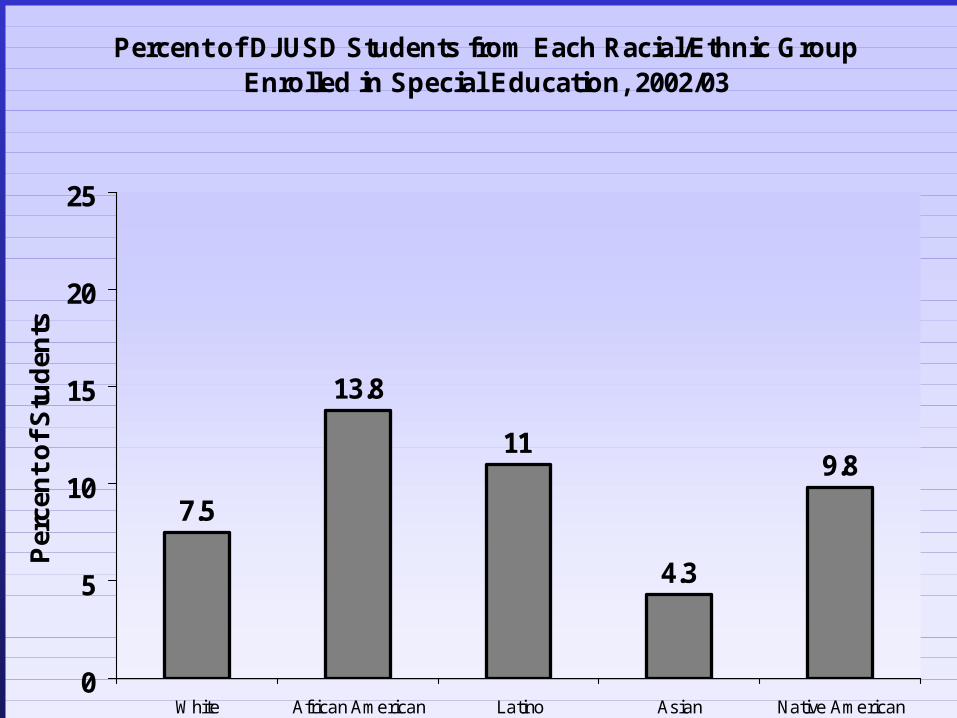
Percent of DJUSD Students from Each Racial/Ethnic Group Enrolled in Special Education, 2002/03
7.5
13.8
11
4.3
9.8
0
5
10
15
20
25
White African American Latino Asian Native American
Per
cen
t o
f S
tud
ents
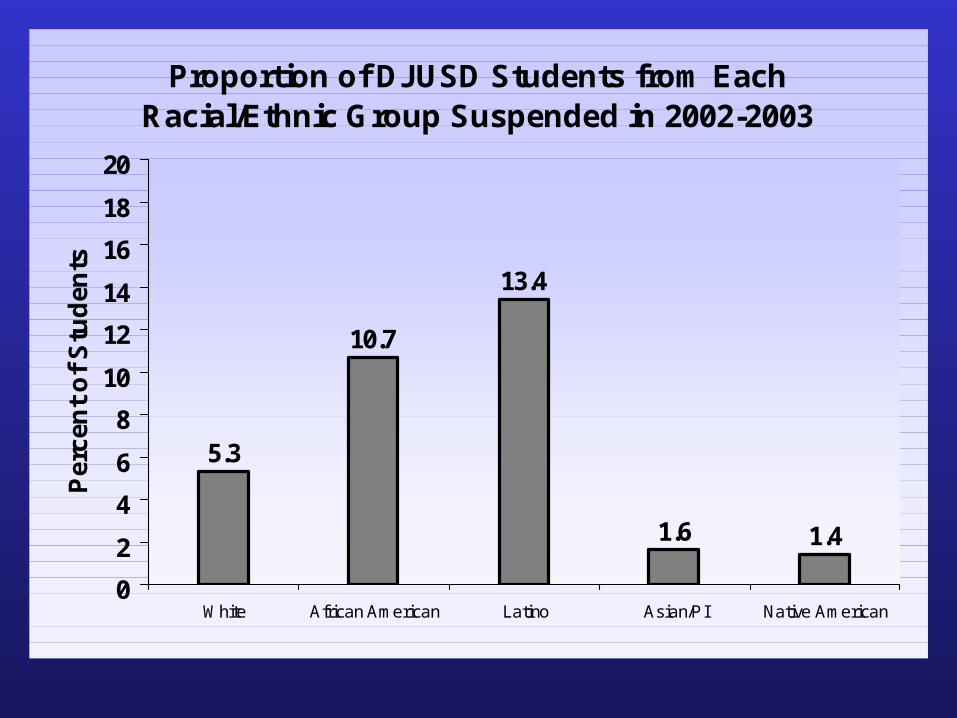
Proportion of DJUSD Students from Each Racial/Ethnic Group Suspended in 2002-2003
5.3
10.7
13.4
1.6 1.4
0
2
4
6
8
10
12
14
16
18
20
White African American Latino Asian/PI Native American
Per
cen
t o
f S
tud
ents
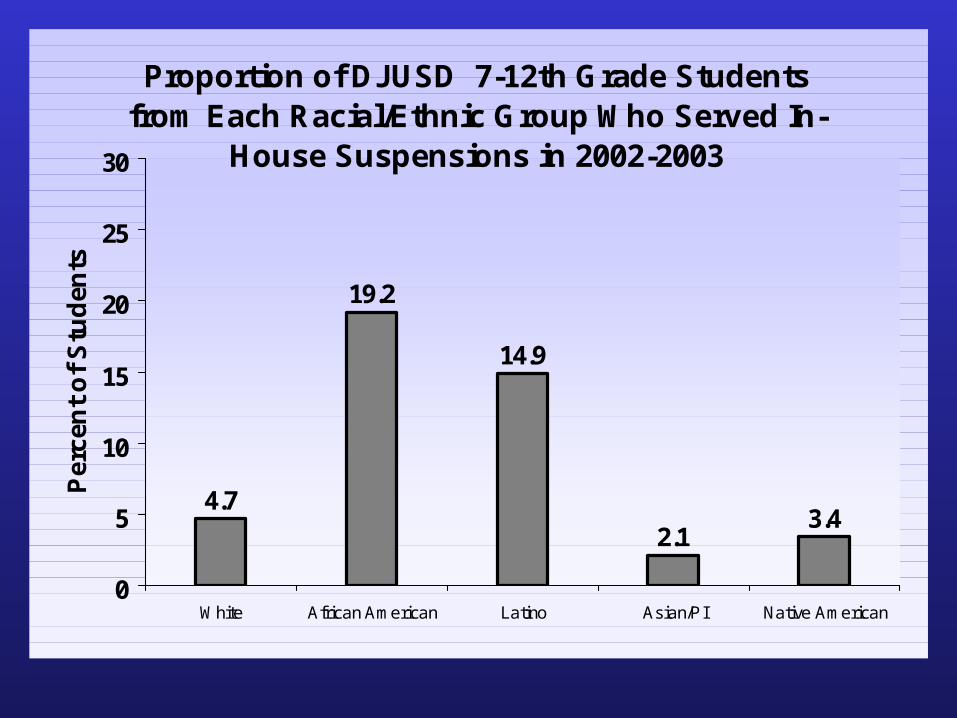
Proportion of DJUSD 7-12th Grade Students from Each Racial/Ethnic Group Who Served In-
House Suspensions in 2002-2003
4.7
19.2
14.9
2.13.4
0
5
10
15
20
25
30
White African American Latino Asian/PI Native American
Per
cen
t o
f S
tud
ents
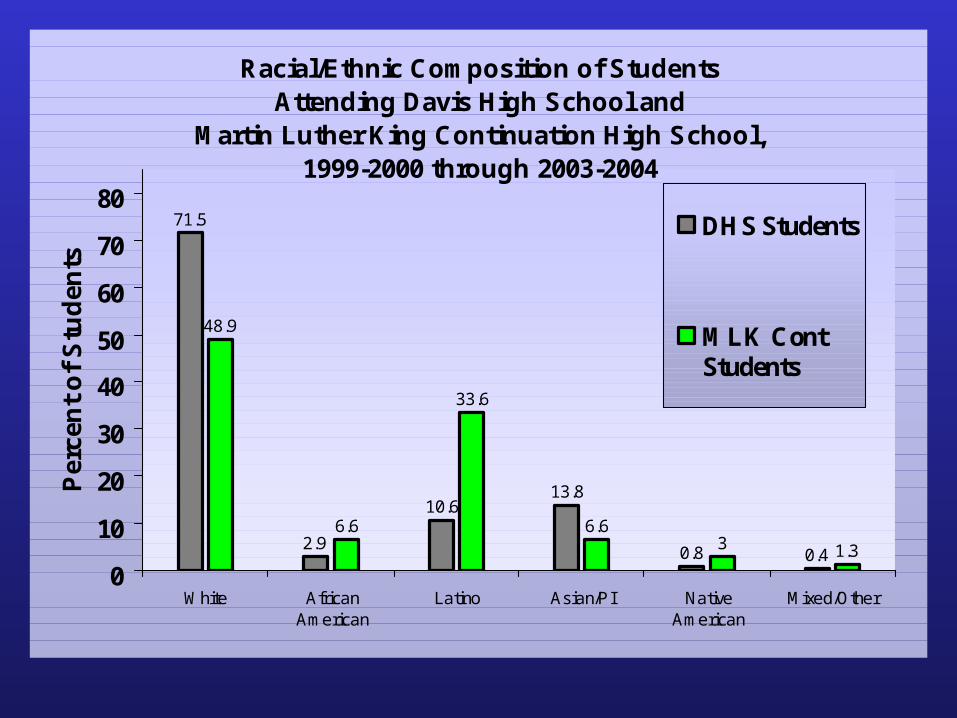
Racial/Ethnic Composition of Students Attending Davis High School and
Martin Luther King Continuation High School, 1999-2000 through 2003-2004
71.5
2.9
10.613.8
0.8 0.4
48.9
6.6
33.6
6.63 1.3
0
10
20
30
40
50
60
70
80
White AfricanAmerican
Latino Asian/PI NativeAmerican
Mixed/Other
Per
cen
t o
f S
tud
ents
DHS Students
MLK ContStudents