Embed Size (px)
Citation preview

EXPANDING TRUCK GPS-BASED PASSIVE ORIGIN-DESTINATION DATA IN IOWA AND TENNESSEE
April 29, 2014
Vince Bernardin, PhD, RSG
Steven Trevino, RSG
Jeff Short, ATRI

2 4/29/14
RSG
ATRI Board of Directors
3 4/29/14
RSG
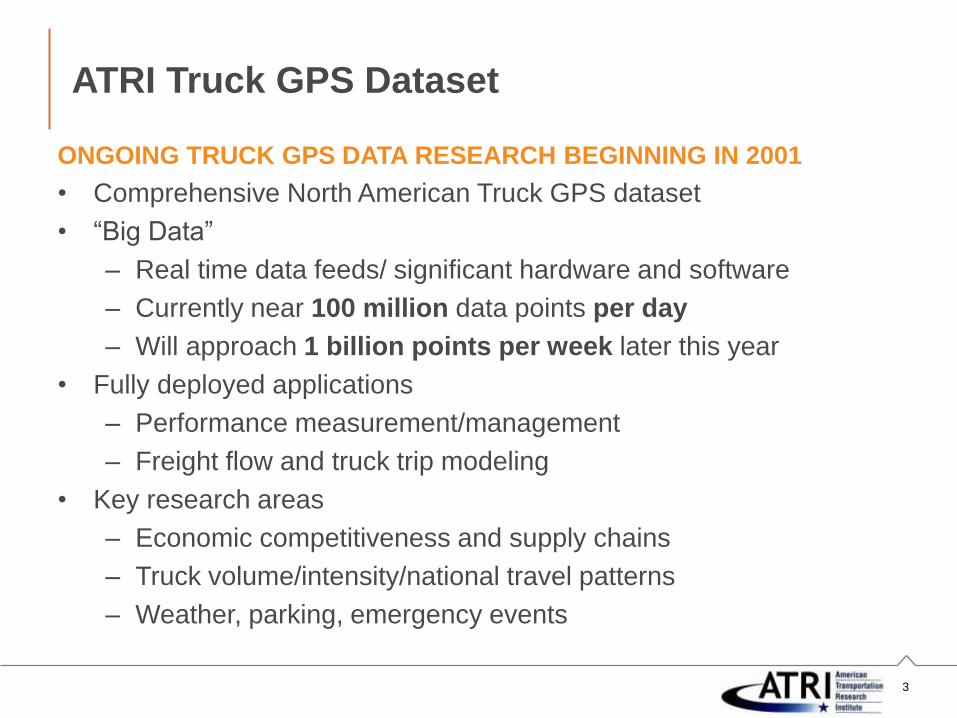
ONGOING TRUCK GPS DATA RESEARCH BEGINNING IN 2001
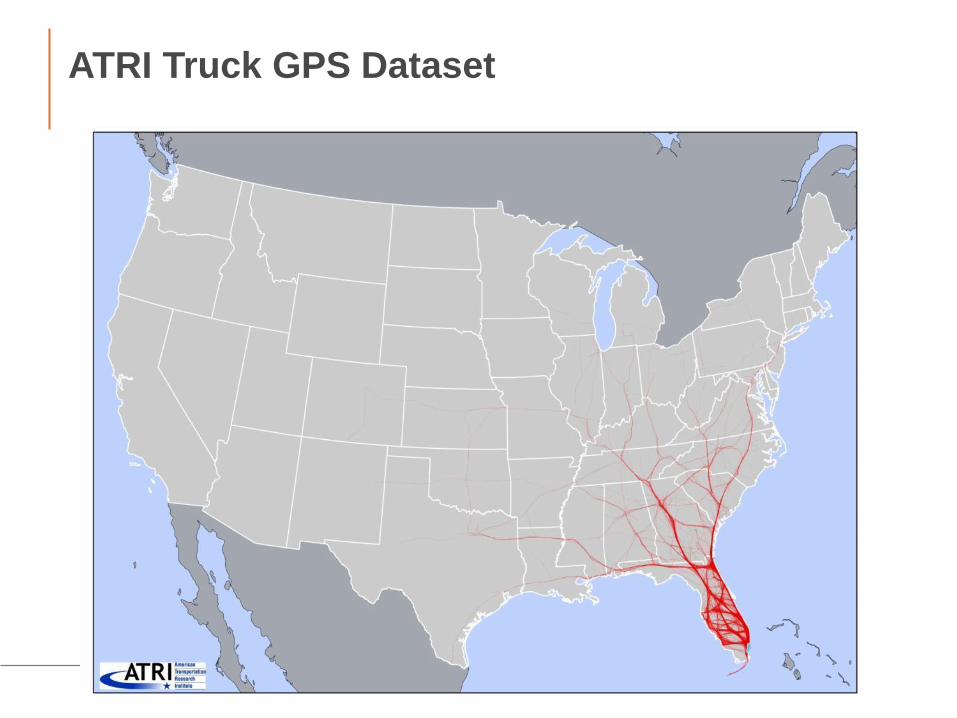
• Comprehensive North American Truck GPS dataset
• “Big Data”
– Real time data feeds/ significant hardware and software
– Currently near 100 million data points per day
– Will approach 1 billion points per week later this year
• Fully deployed applications
– Performance measurement/management
– Freight flow and truck trip modeling
• Key research areas
– Economic competitiveness and supply chains
– Truck volume/intensity/national travel patterns
– Weather, parking, emergency events
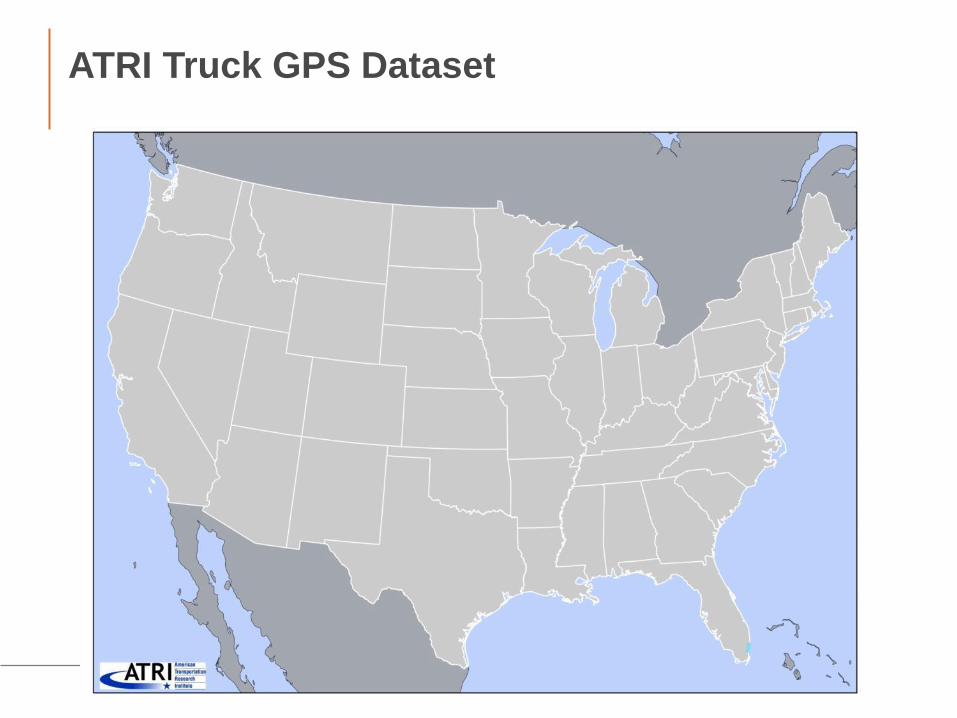
ATRI Truck GPS Dataset

4 4/29/14
RSG
ATRI Truck GPS Dataset – One Day

5 4/29/14
RSG
ATRI Truck GPS Dataset

6 4/29/14
RSG
ATRI Truck GPS Dataset

7 4/29/14
RSG
ATRI Truck GPS Dataset

8 4/29/14
RSG
ATRI Truck GPS Dataset

9 4/29/14
RSG
ATRI Truck GPS Dataset

10 4/29/14
RSG

11 4/29/14
RSG
ATRI Truck GPS Dataset

12 4/29/14
RSG
ATRI Truck GPS Dataset
13 4/29/14
RSG
ATRI Truck GPS Dataset
14 4/29/14
RSG
ATRI Truck GPS Dataset

15 4/29/14
RSG
ATRI Truck GPS Dataset

16 4/29/14
RSG
ATRI Truck GPS Dataset

17 4/29/14
RSG
Modeling Applications
PRIOR USAGE OF ATRI TRUCK GPS DATA
• 2012 Indiana Statewide Travel Demand Model Update
- RMSE: 69.3% to 60.6%
- MAPE: 74% to 42%

18 4/29/14
RSG
Iowa Dataset
DETAILS OF ATRI TRUCK GPS DATA WITHIN IOWA
• Four 2-week samples from each quarter of 2012
• Over 135,000 individual trucks

19 4/29/14
RSG
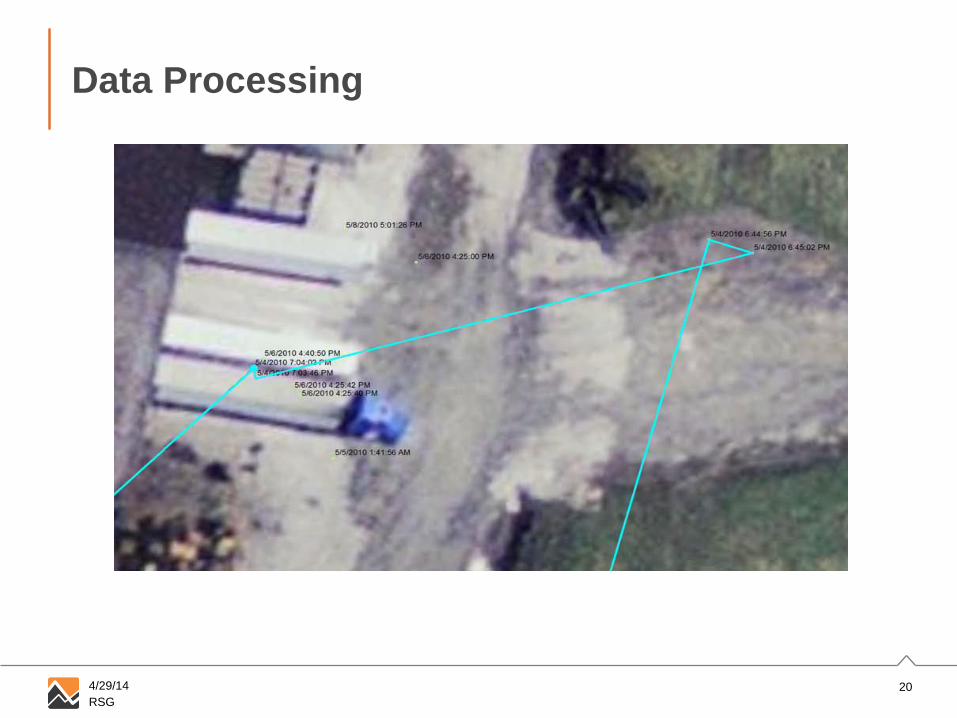
Data Processing
ATRI PING DATASET MUST BE PROCESSED TO TRIP O-D PAIRS
• Identifying movement for all records
• Determine trip O-Ds, travel time, VMT
20 4/29/14
RSG
Data Processing

21 4/29/14
RSG
Data Cleaning
METHODS INTRODUCED TO IMPROVE PROCESSING
• Over 50 million movement records from 135,000 trucks
• Data Filtering:
- GPS jumps – urban canyons, mountains, spatial joins, etc.
- Missing data – spatial joins
- Study period edges – trips in progress
- Duration & OD mismatch – missed stops, GPS jumps
• Applied conservative filtering methods in Iowa
• Working on more intelligent filters

22 4/29/14
RSG
GPS Blips

23 4/29/14
RSG
Circuity

24 4/29/14
RSG
Start & End Time

25 4/29/14
RSG
Processing Results & Scaling
DATA CAPTURES ROUGHLY 10% OF TRUCKS OVER 56 DAYS
• Processed data contains:
- 2.8 million truck trips over 56 days
- 60,656,488 truck VMT within Iowa
- 1,083,152 average daily truck VMT
- 10,731,507 Iowa DOT estimated 2012 daily truck VMT
- Sample rate of 10.1%
• Factored raw data by 0.1769 to represent daily preliminary seed
OD table

26 4/29/14
RSG
Weighting & Expansion
GOAL FOR IOWA TO MOVE BEYOND SIMPLE SCALING
• Initial statewide truck modeling application of ATRI data in
Indiana stopped with scaling, ultimately used ODME
• ATRI data is not a random sample – suspected some biases
• Anecdotal evidence for geographic/regional & trip-length
(short-haul) biases
• Developed a weighting scheme to address these sample
biases by analyzing ODME

27 4/29/14
RSG
Geography
NO EVIDENCE OF SYSTEMATIC GEOGRAPHIC BIAS
• Geographic differences of sample coverage in Iowa / Halo area

28 4/29/14
RSG
Trip Length – Short Haul / Long Haul
BIAS TOWARDS LONG HAUL
• Confirmed suspected bias of long-haul over short-haul truck trips
• Bias was not as strong as some may have supposed
0
0.2
0.4
0.6
0.8
1
1.2
1.4
1.6
0 100 200 300 400 500 600 700 800
Perc
en
t o
f T
rip
s
Trip Length (min)
ATRI ODME

29 4/29/14
RSG
Weighting Scheme
WEIGHTING SCHEME BASED ON TRIP LENGTH
0
0.5
1
1.5
2
2.5
3
10 20 30 40 60 100 140 180 220 260 300 340 420 500 600 1000
Weig
ht
Trip Length (min)

30 4/29/14
RSG
Truck Assignment Tests
TRUCK ASSIGNMENTS MADE FOR TESTING PURPOSES ONLY
• ATRI data used as one component of truck model
• Assignment used to assess count consistency, weighting
effectiveness, goodness-of-fit bounds
• Previous model used ODME to achieved 81% RMSE for trucks
Assignment Type RMSE
Scaled Data 116%
Weighted Data 92%
ODME on Data 58%

31 4/29/14
RSG
Tennessee
ATRI DATA SAMPLE FOR TENNESSEE (PRELIMINARY)
• Similar four 2-week samples over 2013 quarters
• 235,000 unique trucks
• 138 million records processed to 5.8 million trips
• 84,147,030 truck VMT within TN
• Sample rate of 6.5%
32 4/29/14
RSG
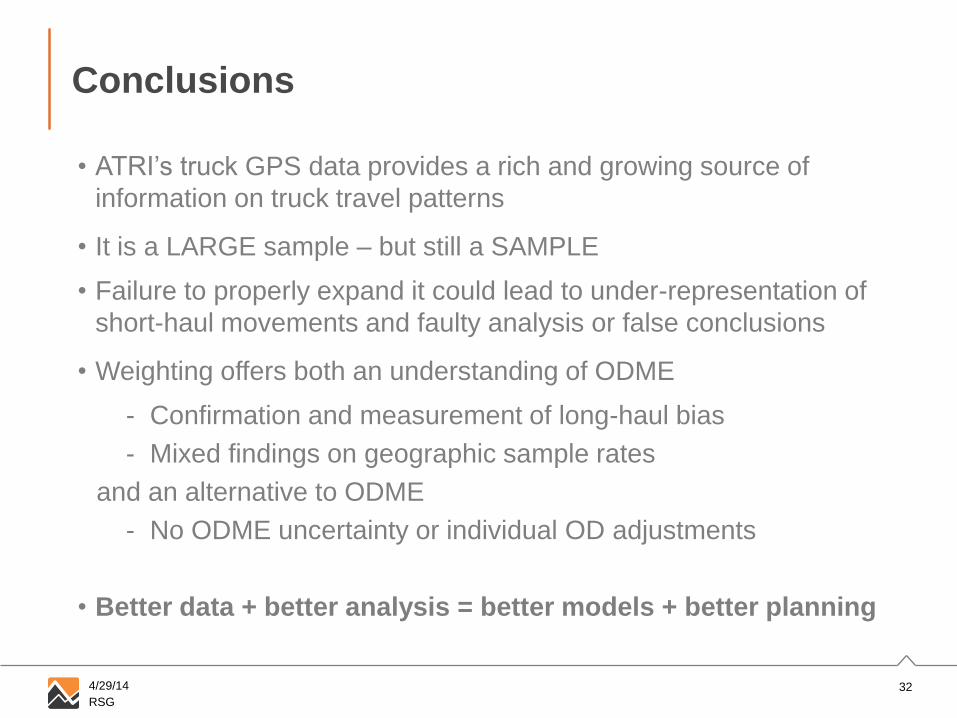
Conclusions
• ATRI’s truck GPS data provides a rich and growing source of
information on truck travel patterns
• It is a LARGE sample – but still a SAMPLE
• Failure to properly expand it could lead to under-representation of
short-haul movements and faulty analysis or false conclusions
• Weighting offers both an understanding of ODME
- Confirmation and measurement of long-haul bias
- Mixed findings on geographic sample rates
and an alternative to ODME
- No ODME uncertainty or individual OD adjustments
• Better data + better analysis = better models + better planning


![The ROI of Real-Time Location Systems and Active RFID in ... · system (GPS) and barcode components [passive RFID]2.” There are two types of RFID technology. The first is passive](https://img.pdfslide.us/doc/110x75/6039cdaa4cb5c07590506fb8/the-roi-of-real-time-location-systems-and-active-rfid-in-system-gps-and-barcode.jpg)