Embed Size (px)
Citation preview
Expanding Our Roots
CONSOLIDATED FINANCIAL STATEMENTS
3
CONSOLIDATED FINANCIAL STATEMENTSFOR THE YEAR ENDED MAY 31, 2017 AND MAY 31, 2016
(Expressed in Canadian Dollars, unless otherwise noted)
MANAGEMENTS RESPONSIBILITY FOR FINANCIAL REPORTING 5
INDEPENDENT AUDITOR’S REPORT 7
CONSOLIDATED STATEMENTS OF FINANCIAL POSITION 9
CONSOLIDATED STATEMENTS OF INCOME AND COMPREHENSIVE INCOME 10
CONSOLIDATED STATEMENTS OF CHANGES IN EQUITY (DEFICIENCY) 11
CONSOLIDATED STATEMENTS OF CASH FLOWS 12
NOTES TO CONSOLIDATED FINANCIAL STATEMENTS 15
APHRIA INC. CONSOLIDATED FINANCIAL STATEMENTSAPHRIA INC. 5
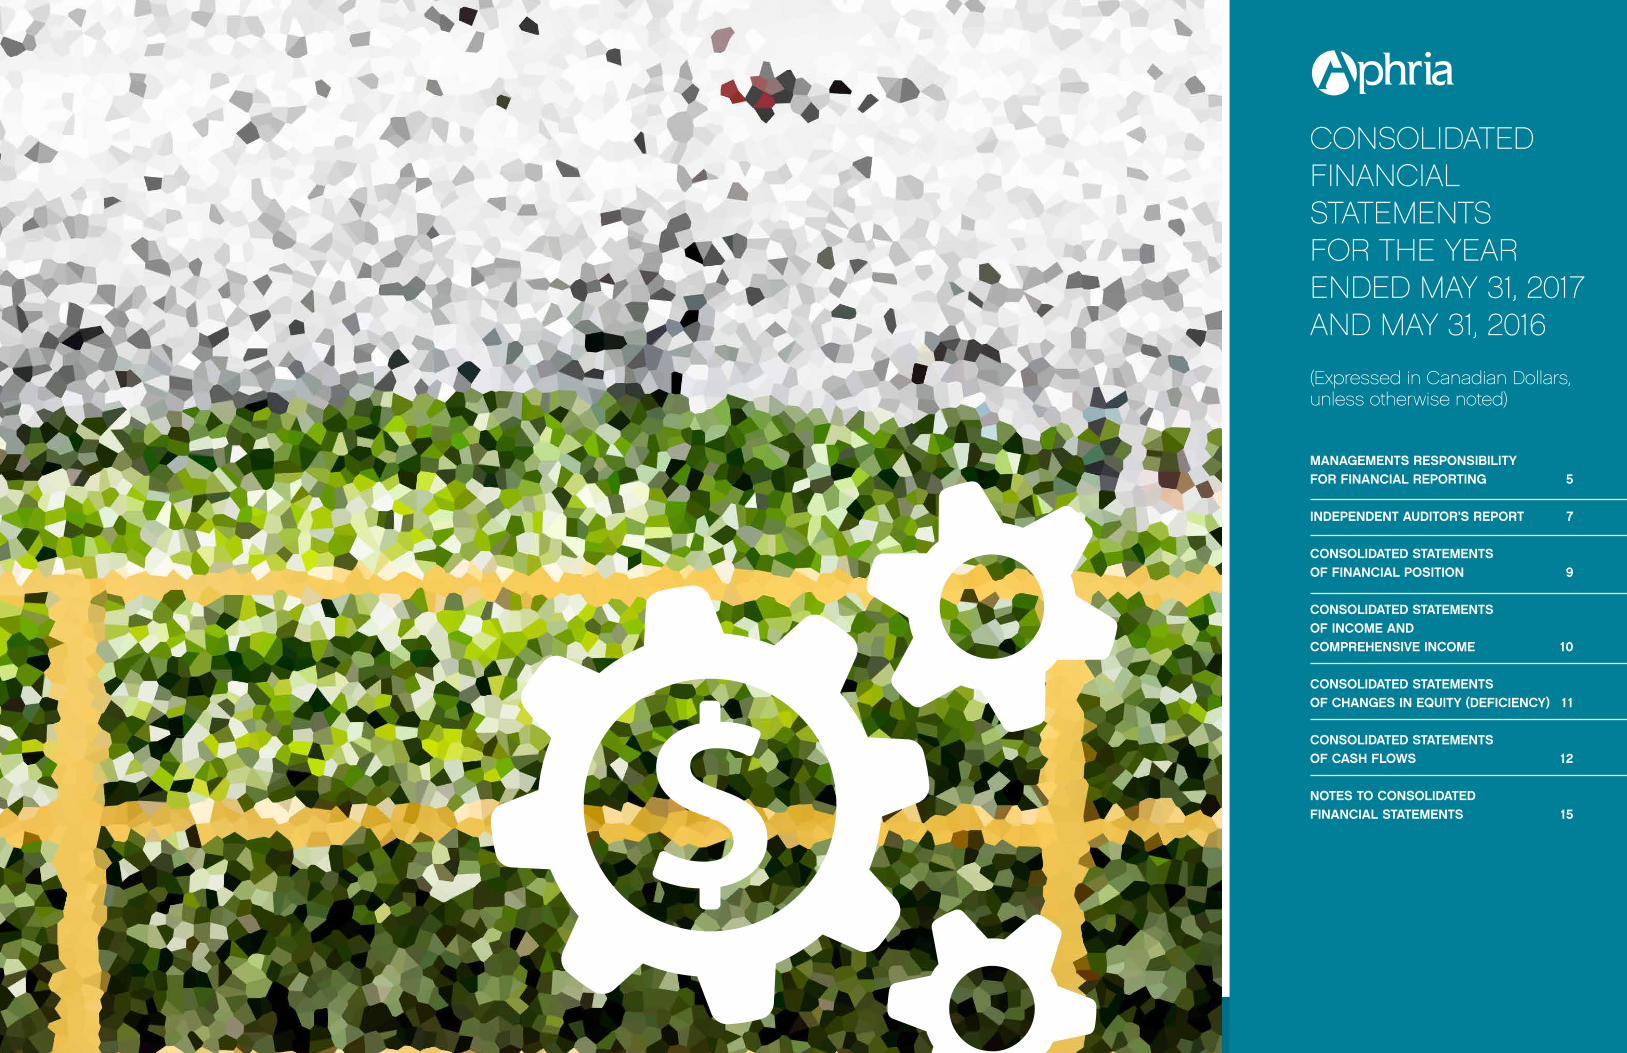
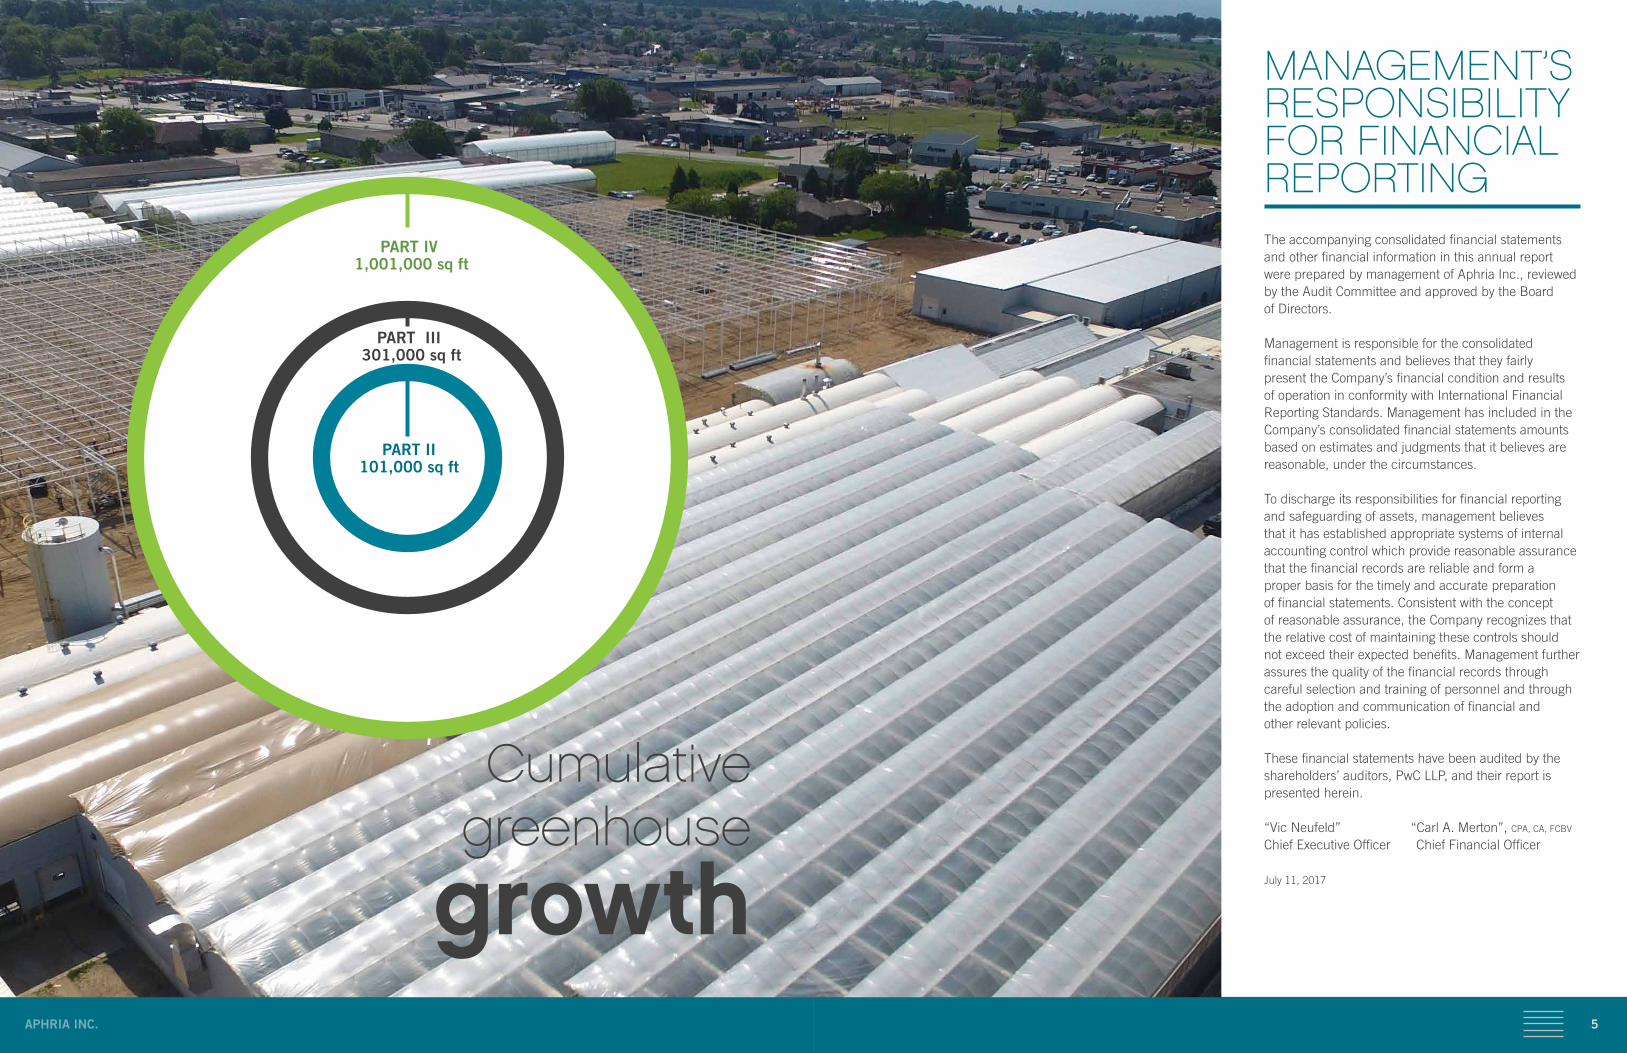
Cumulative greenhouse
growth
MANAGEMENT’S RESPONSIBILITY FOR FINANCIAL REPORTINGThe accompanying consolidated financial statements and other financial information in this annual report were prepared by management of Aphria Inc., reviewed by the Audit Committee and approved by the Board of Directors.
Management is responsible for the consolidated financial statements and believes that they fairly present the Company’s financial condition and results of operation in conformity with International Financial Reporting Standards. Management has included in the Company’s consolidated financial statements amounts based on estimates and judgments that it believes are reasonable, under the circumstances.
To discharge its responsibilities for financial reporting and safeguarding of assets, management believes that it has established appropriate systems of internal accounting control which provide reasonable assurance that the financial records are reliable and form a proper basis for the timely and accurate preparation of financial statements. Consistent with the concept of reasonable assurance, the Company recognizes that the relative cost of maintaining these controls should not exceed their expected benefits. Management further assures the quality of the financial records through careful selection and training of personnel and through the adoption and communication of financial and other relevant policies.
These financial statements have been audited by the shareholders’ auditors, PwC LLP, and their report is presented herein.
“Vic Neufeld” “Carl A. Merton”, CPA, CA, FCBV
Chief Executive Officer Chief Financial Officer
July 11, 2017
PART IV 1,001,000 sq ft
PART III 301,000 sq ft
PART II101,000 sq ft
7APHRIA INC. CONSOLIDATED FINANCIAL STATEMENTS
Opinion
In our opinion, the consolidated financial statements present fairly, in all material respects, the financial
position of Aphria Inc. and its subsidiaries as at May 31, 2017 and their financial performance and their
cash flows for the year then ended in accordance with International Financial Reporting Standards.
Other matter
The financial statements of Aphria Inc. for the year ended May 31, 2016 were audited by another auditor
who expressed an unmodified opinion on those financial statements on July 7, 2016.
Chartered Professional Accountants, Licensed Public Accountants
July 11, 2017
Independent Auditor’s Report
To the Shareholders of Aphria Inc.
We have audited the accompanying consolidated financial statements of Aphria Inc. and its subsidiaries, which comprise the consolidated statements of financial position as at May 31, 2017 and the consolidated statements of earnings, comprehensive earnings, changes in equity (deficiency) and cash flows for the year then ended, and the related notes, which comprise a summary of significant accounting policies and other explanatory information.
MANAGEMENT’S RESPONSIBILITY FOR THE CONSOLIDATED FINANCIAL STATEMENTSManagement is responsible for the preparation and fair presentation of these consolidated financial statements in accordance with International Financial Reporting Standards, and for such internal control as management determines is necessary to enable the preparation of consolidated financial statements that are free from material misstatement, whether due to fraud or error.
AUDITOR’S RESPONSIBILITYOur responsibility is to express an opinion on these consolidated financial statements based on our audit. We conducted our audit in accordance with Canadian generally accepted auditing standards. Those standards require that we comply with ethical requirements and plan and perform the audit to obtain reasonable assurance about whether the consolidated financial statements are free from material misstatement.
An audit involves performing procedures to obtain audit evidence about the amounts and disclosures in the consolidated financial statements. The procedures selected depend on the auditor’s judgment, including the assessment of the risks of material misstatement of the consolidated financial statements, whether due to fraud or error. In making those risk assessments, the auditor considers internal control relevant to the entity’s preparation and fair presentation of the consolidated financial statements in order to design audit procedures that are appropriate in the circumstances, but not for the purpose of expressing an opinion on the effectiveness of the entity’s internal control. An audit also includes evaluating the appropriateness of accounting policies used and the reasonableness of accounting estimates made by management, as well as evaluating the overall presentation of the consolidated financial statements.
We believe that the audit evidence we have obtained in our audit is sufficient and appropriate to provide a basis for our audit opinion.
OPINIONIn our opinion, the consolidated financial statements present fairly, in all material respects, the financial position of Aphria Inc. and its subsidiaries as at May 31, 2017 and their financial performance and their cash flows for the year then ended in accordance with International Financial Reporting Standards.
OTHER MATTERThe financial statements of Aphria Inc. for the year ended May 31, 2016 were audited by another auditor who expressed an unmodified opinion on those financial statements on July 7, 2016.
Chartered Professional Accountants, Licensed Public AccountantsWindsor, Ontario, Canada
9APHRIA INC. CONSOLIDATED FINANCIAL STATEMENTS
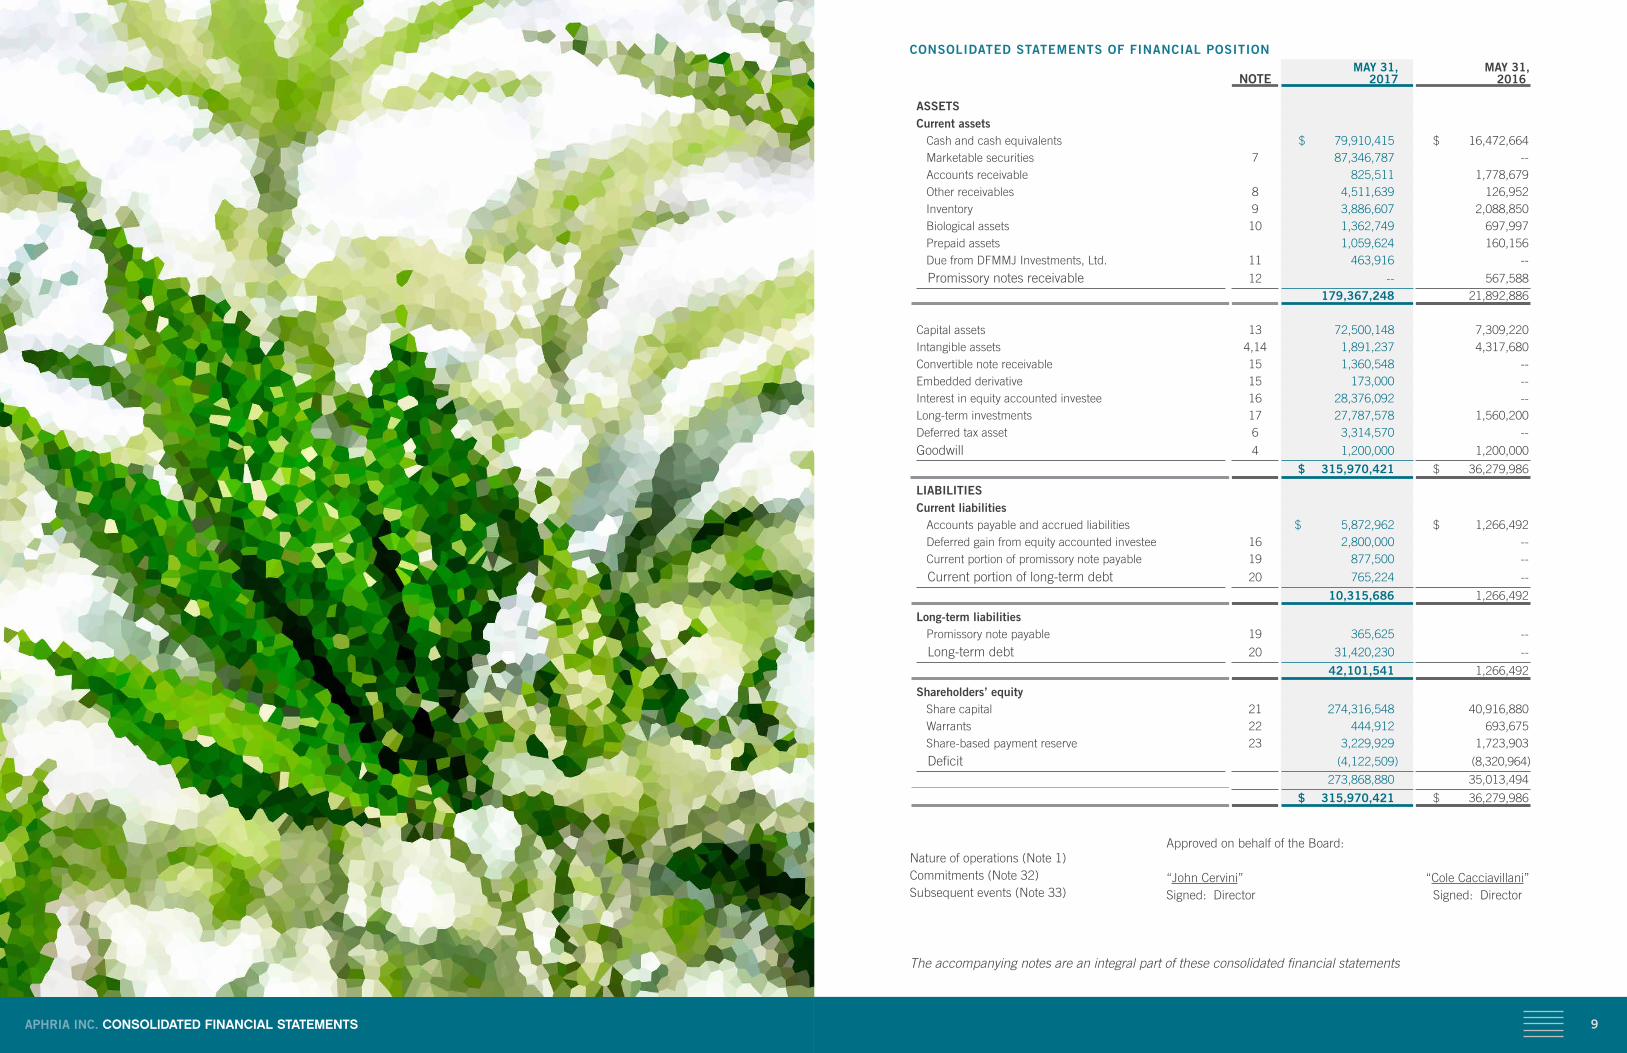
CONSOLIDATED STATEMENTS OF FINANCIAL POSITION
NOTE MAY 31, 2017
MAY 31, 2016
ASSETSCurrent assets Cash and cash equivalents $ 79,910,415 $ 16,472,664 Marketable securities 7 87,346,787 -- Accounts receivable 825,511 1,778,679 Other receivables 8 4,511,639 126,952 Inventory 9 3,886,607 2,088,850 Biological assets 10 1,362,749 697,997 Prepaid assets 1,059,624 160,156 Due from DFMMJ Investments, Ltd. 11 463,916 --
Promissory notes receivable 12 -- 567,588 179,367,248 21,892,886
Capital assets 13 72,500,148 7,309,220Intangible assets 4,14 1,891,237 4,317,680Convertible note receivable 15 1,360,548 --Embedded derivative 15 173,000 --Interest in equity accounted investee 16 28,376,092 --Long-term investments 17 27,787,578 1,560,200Deferred tax asset 6 3,314,570 --
Goodwill 4 1,200,000 1,200,000
$ 315,970,421 $ 36,279,986
LIABILITIESCurrent liabilities Accounts payable and accrued liabilities $ 5,872,962 $ 1,266,492 Deferred gain from equity accounted investee 16 2,800,000 -- Current portion of promissory note payable 19 877,500 --
Current portion of long-term debt 20 765,224 --
10,315,686 1,266,492
Long-term liabilities Promissory note payable 19 365,625 --
Long-term debt 20 31,420,230 --
42,101,541 1,266,492
Shareholders’ equity Share capital 21 274,316,548 40,916,880 Warrants 22 444,912 693,675 Share-based payment reserve 23 3,229,929 1,723,903
Deficit (4,122,509) (8,320,964)
273,868,880 35,013,494
$ 315,970,421 $ 36,279,986
Nature of operations (Note 1) Commitments (Note 32)Subsequent events (Note 33)
Approved on behalf of the Board:
“John Cervini” “Cole Cacciavillani” Signed: Director Signed: Director
The accompanying notes are an integral part of these consolidated financial statements
11APHRIA INC. CONSOLIDATED FINANCIAL STATEMENTS 11
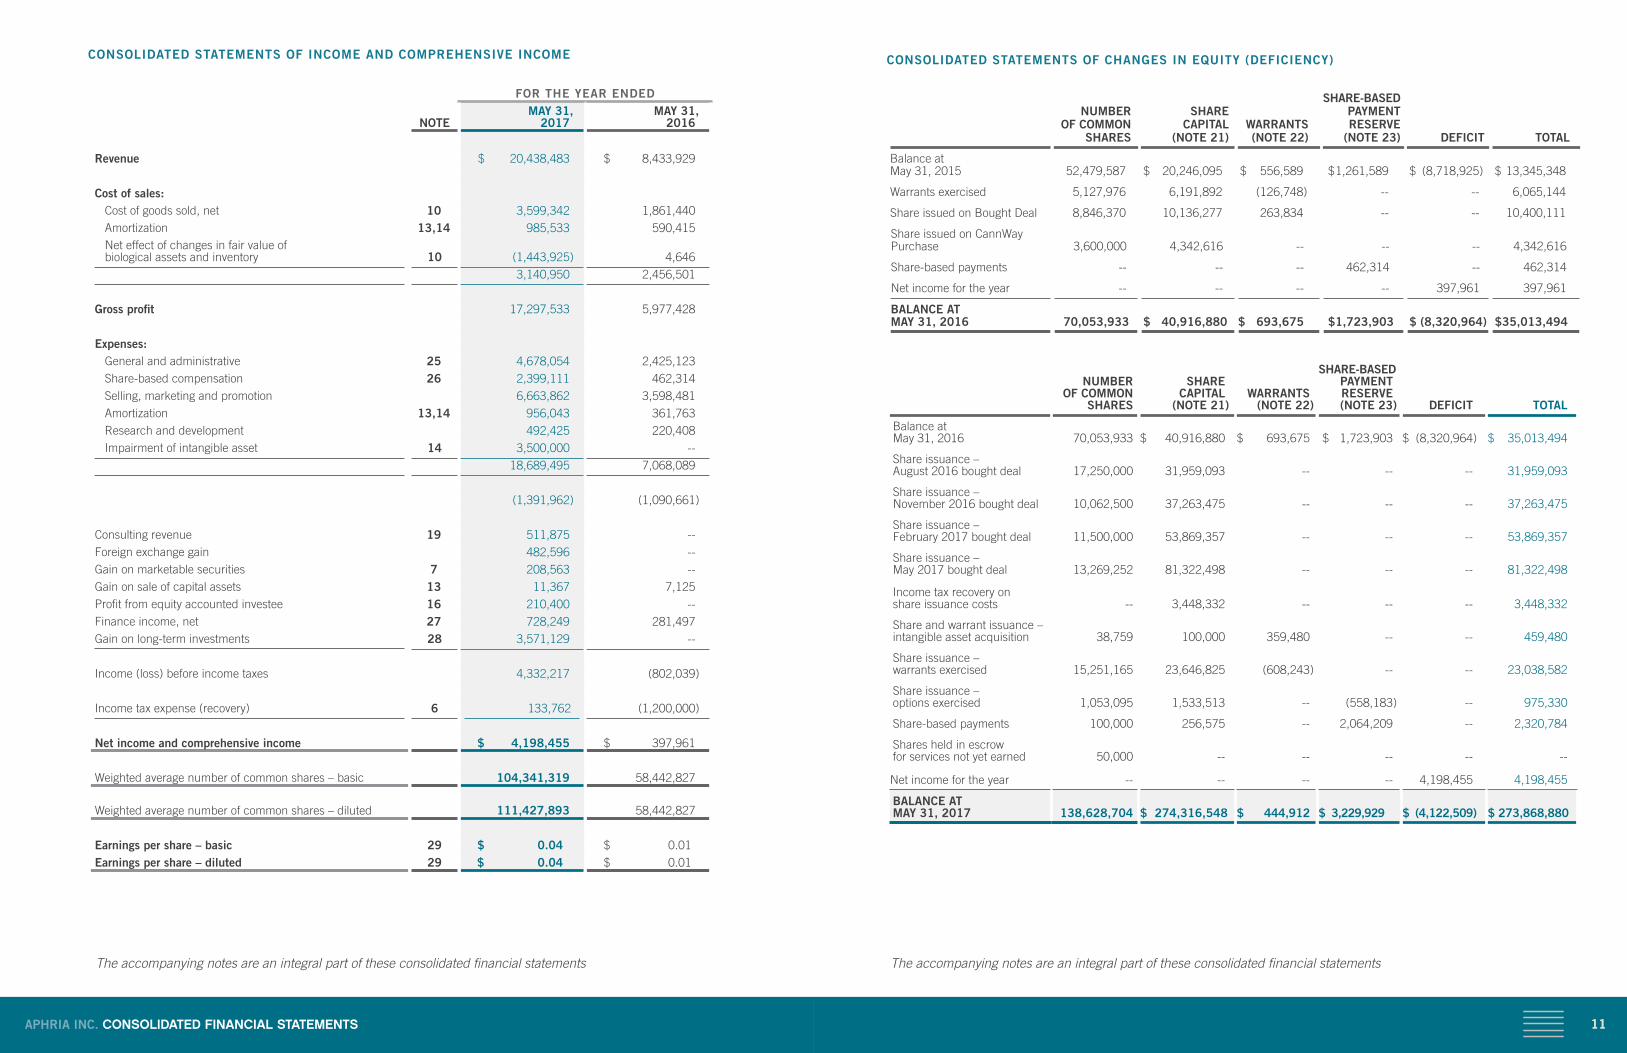
CONSOLIDATED STATEMENTS OF CHANGES IN EQUITY (DEFICIENCY)
NUMBER OF COMMON SHARES
SHARE CAPITAL (NOTE 21)
WARRANTS (NOTE 22)
SHARE-BASED PAYMENT RESERVE (NOTE 23)
DEFICIT TOTAL
Balance at May 31, 2015 52,479,587 $ 20,246,095 $ 556,589 $ 1,261,589 $ (8,718,925) $ 13,345,348
Warrants exercised 5,127,976 6,191,892 (126,748) -- -- 6,065,144
Share issued on Bought Deal 8,846,370 10,136,277 263,834 -- -- 10,400,111
Share issued on CannWay Purchase 3,600,000 4,342,616 -- -- -- 4,342,616
Share-based payments -- -- -- 462,314 -- 462,314
Net income for the year -- -- -- -- 397,961 397,961
BALANCE AT MAY 31, 2016 70,053,933 $ 40,916,880 $ 693,675 $ 1,723,903 $ (8,320,964) $ 35,013,494
NUMBER OF COMMON SHARES
SHARE CAPITAL (NOTE 21)
WARRANTS (NOTE 22)
SHARE-BASED PAYMENT RESERVE (NOTE 23) DEFICIT TOTAL
Balance at May 31, 2016 70,053,933 $ 40,916,880 $ 693,675 $ 1,723,903 $ (8,320,964) $ 35,013,494
Share issuance – August 2016 bought deal 17,250,000 31,959,093 -- -- -- 31,959,093
Share issuance – November 2016 bought deal 10,062,500 37,263,475 -- -- -- 37,263,475
Share issuance – February 2017 bought deal 11,500,000 53,869,357 -- -- -- 53,869,357
Share issuance – May 2017 bought deal 13,269,252 81,322,498 -- -- -- 81,322,498
Income tax recovery on share issuance costs -- 3,448,332 -- -- -- 3,448,332
Share and warrant issuance – intangible asset acquisition 38,759 100,000 359,480 -- -- 459,480
Share issuance – warrants exercised 15,251,165 23,646,825 (608,243) -- -- 23,038,582
Share issuance – options exercised 1,053,095 1,533,513 -- (558,183) -- 975,330
Share-based payments 100,000 256,575 -- 2,064,209 -- 2,320,784
Shares held in escrow for services not yet earned 50,000 -- -- -- -- --
Net income for the year -- -- -- -- 4,198,455 4,198,455
BALANCE AT MAY 31, 2017 138,628,704 $ 274,316,548 $ 444,912 $ 3,229,929 $ (4,122,509) $ 273,868,880
CONSOLIDATED STATEMENTS OF INCOME AND COMPREHENSIVE INCOME
FOR THE YEAR ENDED
NOTE MAY 31, 2017
MAY 31, 2016
Revenue $ 20,438,483 $ 8,433,929
Cost of sales: Cost of goods sold, net 10 3,599,342 1,861,440 Amortization 13,14 985,533 590,415 Net effect of changes in fair value of biological assets and inventory 10 (1,443,925) 4,646 3,140,950 2,456,501
Gross profit 17,297,533 5,977,428
Expenses: General and administrative 25 4,678,054 2,425,123 Share-based compensation 26 2,399,111 462,314 Selling, marketing and promotion 6,663,862 3,598,481 Amortization 13,14 956,043 361,763 Research and development 492,425 220,408 Impairment of intangible asset 14 3,500,000 -- 18,689,495 7,068,089
(1,391,962) (1,090,661)
Consulting revenue 19 511,875 --Foreign exchange gain 482,596 --Gain on marketable securities 7 208,563 --Gain on sale of capital assets 13 11,367 7,125Profit from equity accounted investee 16 210,400 --Finance income, net 27 728,249 281,497Gain on long-term investments 28 3,571,129 --
Income (loss) before income taxes 4,332,217 (802,039)
Income tax expense (recovery) 6 133,762 (1,200,000)
Net income and comprehensive income $ 4,198,455 $ 397,961
Weighted average number of common shares – basic 104,341,319 58,442,827
Weighted average number of common shares – diluted 111,427,893 58,442,827
Earnings per share – basic 29 $ 0.04 $ 0.01Earnings per share – diluted 29 $ 0.04 $ 0.01
The accompanying notes are an integral part of these consolidated financial statementsThe accompanying notes are an integral part of these consolidated financial statements
13APHRIA INC. CONSOLIDATED FINANCIAL STATEMENTS
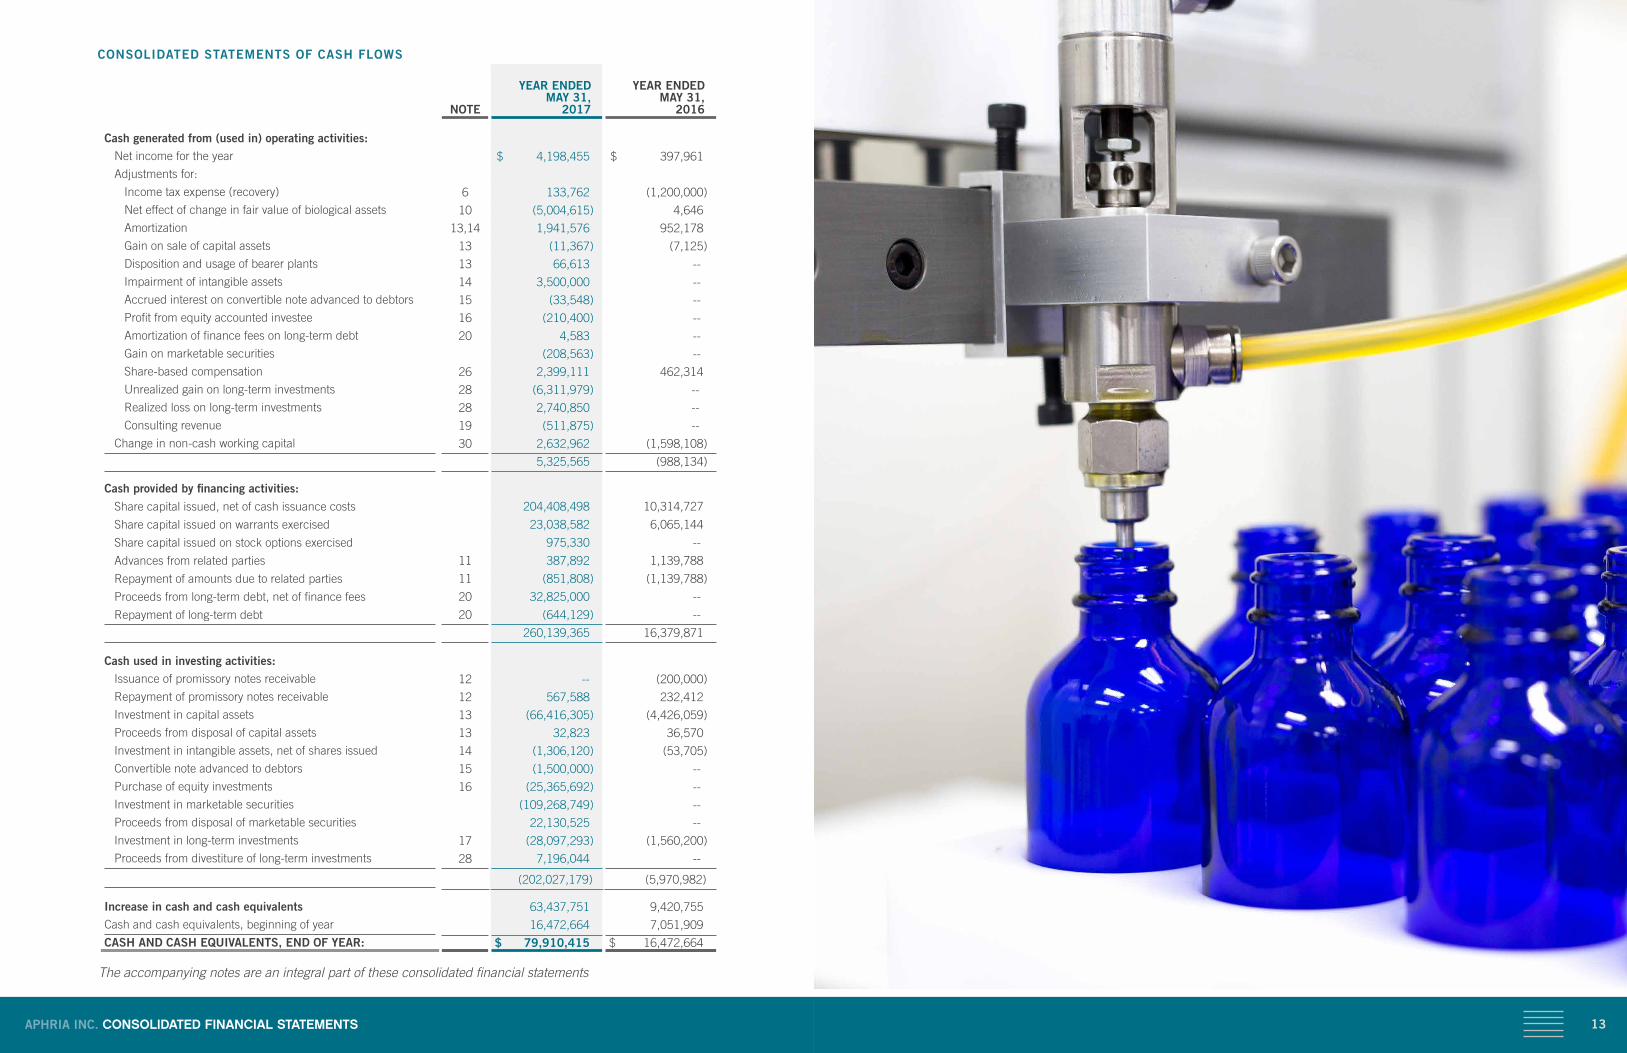
CONSOLIDATED STATEMENTS OF CASH FLOWS
NOTE
YEAR ENDED MAY 31, 2017
YEAR ENDED MAY 31, 2016
Cash generated from (used in) operating activities: Net income for the year $ 4,198,455 $ 397,961
Adjustments for:
Income tax expense (recovery) 6 133,762 (1,200,000)
Net effect of change in fair value of biological assets 10 (5,004,615) 4,646
Amortization 13,14 1,941,576 952,178
Gain on sale of capital assets 13 (11,367) (7,125)
Disposition and usage of bearer plants 13 66,613 --
Impairment of intangible assets 14 3,500,000 --
Accrued interest on convertible note advanced to debtors 15 (33,548) --
Profit from equity accounted investee 16 (210,400) --
Amortization of finance fees on long-term debt 20 4,583 --
Gain on marketable securities (208,563) --
Share-based compensation 26 2,399,111 462,314
Unrealized gain on long-term investments 28 (6,311,979) --
Realized loss on long-term investments 28 2,740,850 --
Consulting revenue 19 (511,875) --
Change in non-cash working capital 30 2,632,962 (1,598,108)
5,325,565 (988,134)
Cash provided by financing activities:
Share capital issued, net of cash issuance costs 204,408,498 10,314,727
Share capital issued on warrants exercised 23,038,582 6,065,144
Share capital issued on stock options exercised 975,330 --
Advances from related parties 11 387,892 1,139,788
Repayment of amounts due to related parties 11 (851,808) (1,139,788)
Proceeds from long-term debt, net of finance fees 20 32,825,000 --
Repayment of long-term debt 20 (644,129) --
260,139,365 16,379,871
Cash used in investing activities: Issuance of promissory notes receivable 12 -- (200,000)
Repayment of promissory notes receivable 12 567,588 232,412
Investment in capital assets 13 (66,416,305) (4,426,059)
Proceeds from disposal of capital assets 13 32,823 36,570
Investment in intangible assets, net of shares issued 14 (1,306,120) (53,705)
Convertible note advanced to debtors 15 (1,500,000) --
Purchase of equity investments 16 (25,365,692) --
Investment in marketable securities (109,268,749) --
Proceeds from disposal of marketable securities 22,130,525 --
Investment in long-term investments 17 (28,097,293) (1,560,200)
Proceeds from divestiture of long-term investments 28 7,196,044 --
(202,027,179) (5,970,982)
Increase in cash and cash equivalents 63,437,751 9,420,755
Cash and cash equivalents, beginning of year 16,472,664 7,051,909
CASH AND CASH EQUIVALENTS, END OF YEAR: $ 79,910,415 $ 16,472,664
The accompanying notes are an integral part of these consolidated financial statements
15APHRIA INC. NOTES TO THE CONSOLIDATED FINANCIAL STATEMENTS For the years ended May 31, 2017 and May 31,2016
1. NATURE OF OPERATIONS
Aphria Inc. (the “Company” or “Aphria”) was continued in Ontario.
Pure Natures Wellness Inc. (o/a Aphria) (“PNW”), a wholly-owned subsidiary of the Company, is licensed to produce and sell medical marijuana under the provisions of the Access to Cannabis for Medical Purposes Regulations (“ACMPR”). The registered office is located at 5300 Commerce Court West, 199 Bay Street, Toronto, Ontario.
The Company’s common shares are listed under the symbol “APH” on the Toronto Stock Exchange (“TSX”) and under the symbol “APHQF” on the United States OTCQB Venture Market exchange.
These consolidated financial statements were approved by the Company’s Board of Directors on July 11, 2017.
2. BASIS OF PREPARATION
(a) Statement of compliance The policies applied in this consolidated financial statements are prepared in accordance with
International Financial Reporting Standards (“IFRS”) as issued by the International Accounting Standards Board (“IASB”) and Interpretations of the IFRS Interpretations Committee (“IFRIC”).
(b) Basis of measurement These financial statements have been prepared on the going concern basis, under the historical
cost convention except for certain financial instruments that are measured at fair value and biological assets that are measured at fair value less costs to sell, as detailed in the Company’s accounting policies.
(c) Functional currency The Company and its subsidiaries’ functional currency, as determined by management, is Canadian
dollars. These consolidated financial statements are presented in Canadian dollars.
(d) Basis of consolidation Subsidiaries are entities controlled by the Company. Control exists when the Company has the power,
directly and indirectly, to govern the financial and operating policies of an entity and be exposed to the variable returns from its activities. The financial statements of subsidiaries are included in the consolidated financial statements from the date that control commences until the date that control ceases.
WHOLLY OWNED SUBSIDIARIES JURISDICTION OF INCORPORATION
Pure Natures Wellness Inc. Ontario
Aphria (Arizona) Inc. Arizona
CannWay Pharmaceuticals Ltd Ontario Intragroup balances, and any unrealized gains and losses or income and expenses arising from
transactions with jointly controlled entities are eliminated to the extent of the Company’s interest in the entity. Unrealized losses are eliminated to the extent of the gains, but only to the extent that there is no evidence of impairment.
17APHRIA INC. NOTES TO THE CONSOLIDATED FINANCIAL STATEMENTS For the years ended May 31, 2017 and May 31,2016
3. SIGNIFICANT ACCOUNTING POLICIES
The significant accounting policies used by the Company are as follows:
a. Revenue Revenue is recognized at the fair value of consideration received or receivable. Revenue from the sale
of goods is recognized when all the following conditions have been satisfied, which are generally met once the products are shipped to customers.
• The Company has transferred the significant risks and rewards of ownership of the goods to the purchaser;
• The Company retains neither continuing managerial involvement to the degree usually associated with ownership nor effective control over the goods sold;
• The amount of revenue can be measured reliably; • It is probable that the economic benefits associated with the transaction will flow to the entity; and • The costs incurred or to be incurred in respect of the transaction can be measured reliably.
The Company recognized revenue from consulting services on a straight-line basis over the term of its consulting agreement with a third party as the services are provided.
Amounts disclosed as revenue are net of allowances, discounts and rebates.
b. Cash and cash equivalents Cash and cash equivalents are comprised of cash and highly liquid investments that are readily
convertible into known amounts of cash with original maturities of three months or less.
c. Marketable securities Marketable securities are comprised of liquid investments in federal, provincial and/or corporate
bonds with maturities less than 3.5 years. Marketable securities are recognized initially at fair value and subsequently adjusted to fair value through profit or loss (“FVTPL”).
d. Inventory Inventory is valued at the lower of cost and net realizable value. Cost is determined using the
weighted average method. Inventories of harvested cannabis are transferred from biological assets into inventory at their fair value at harvest less costs to sell, which is deemed to be their cost. Any subsequent post-harvest costs are capitalized to inventory to the extent that cost is less than net realizable value. Net realizable value is determined as the estimated selling price in the ordinary course of business less estimated costs to sell. Packaging and supplies are initially valued at cost.
e. Biological assets The Company’s biological assets consist of medical cannabis plants which are not yet harvested.
These biological assets are measured at fair value less costs to sell and costs to complete. At the point of harvest, the biological assets are transferred to inventory at fair value less costs to sell and costs to complete.
Gains or losses arising from changes in fair value less cost to sell are included in the results of operations of the related period.
(e) Foreign currency translation All figures presented in the consolidated financial statements are reflected in Canadian dollars,
which is the functional currency of the Company.
Foreign currency transactions are translated into Canadian dollars at exchange rates in effect on the date of the transactions. Monetary assets and liabilities denominated in foreign currencies at the statement of financial position date are translated to Canadian dollars at the foreign exchange rate applicable as at that date. Realized and unrealized exchange gains and losses are recognized through profit or loss.
The assets and liabilities of foreign operations, including marketable securities, long-term investments and promissory note payable, are translated in Canadian dollars at year-end exchange rates. Income and expenses, and cash flows of foreign operations are translated into Canadian dollars using average exchange rates. Exchange differences resulting from translating foreign operations are recognised in other comprehensive income and accumulated in equity.
(f) Interest in equity-accounted investeesThe Company’s interest in equity accounted investees is comprised of its interest in associates.
EQUITY ACCOUNTED INVESTEE JURISDICTION OF INCORPORATION
DFMMJ Investments, Ltd. British Columbia
In accordance with IFRS 10, associates are those in which the Company has significant influence, but not control or joint control over the financial and accounting policies.
Interests in associates are accounted for using the equity method in accordance with IAS 28. They are recognized initially at cost, which includes transaction costs. After initial recognition, the consolidated financial statements include the Company’s share of the profit or loss and other comprehensive income (“OCI”) of equity accounted investees until the date on which significant influence ceases.
If the Company’s share of losses in an equity-accounted investment equals or exceeds its interest in the entity, including any other unsecured long-term receivables, the group does not recognize further losses, unless it has incurred obligations or made payments on behalf of the other entity.
Unrealized gains on transactions between the Company and its associates are eliminated to the extent of the Company’s interest in these entities. Unrealized losses are also eliminated unless the transaction provides evidence of an impairment of the asset transferred.
The carrying amount of equity-accounted investments is tested for impairment in accordance with the policy described in Note 3(i).
The Company treats transactions with non-controlling interests that do not result in a loss of control as transactions with equity owners of the Company. A change in ownership interest results in an adjustment between the carrying amounts of the controlling and non-controlling interests to reflect their relative interests in the subsidiary. Any difference between the amount of the adjustment to non-controlling interests and any consideration paid or received is recognized in a separate reserve within equity attributable to the owners of the Company.
19APHRIA INC. NOTES TO THE CONSOLIDATED FINANCIAL STATEMENTS For the years ended May 31, 2017 and May 31,2016
(being the present value of expected future cash flows of the asset or CGU). Where an impairment loss subsequently reverses, the carrying amount of the asset is increased to the lesser of the revised estimate of recoverable amount and the carrying amount that would have been recorded had no impairment loss been previously recognized.
j. Income taxes Income tax expense consisting of current and deferred tax expense is recognized in the consolidated
statements of income and comprehensive income. Current tax expense is the expected tax payable on the taxable income for the year, using tax rates enacted or substantively enacted at year end, adjusted for amendments to tax payable with regards to previous years.
Deferred tax assets and liabilities and the related deferred income tax expense or recovery are recognized for deferred tax consequences attributable to differences between the financial statement carrying amounts of existing assets and liabilities and their respective tax bases. Deferred tax assets and liabilities are measured using the enacted or substantively enacted tax rates expected to apply when the asset is realized or the liability settled. The effect on deferred tax assets and liabilities of a change in tax rates is recognized in income in the period that substantive enactment occurs.
A deferred tax asset is recognized to the extent that it is probable that future taxable income will be available against which the asset can be utilized.
Deferred tax assets and liabilities are offset when there is a legally enforceable right to set off current tax assets against current tax liabilities and when they relate to income taxes levied by the same taxation authority and the Company intends to settle its current tax assets and liabilities on a net basis.
k. Earnings per share Basic earnings per share is calculated using the weighted average number of common shares
outstanding during the year. The dilutive effect on earnings per share is calculated presuming the exercise of outstanding options, warrants and similar instruments. It assumes that the proceeds of such exercise would be used to repurchase common shares at the average market price during the year. However, the calculation of diluted loss per share excludes the effects of various conversions and exercise of options and warrants that would be anti-dilutive.
l. Share-based compensation The Company has a stock option plan in place. The Company measures equity settled share-based
payments based on their fair value at the grant date and recognizes compensation expense over the vesting period based on the Company’s estimate of equity instruments that will eventually vest. Fair value is measured using the Black-Scholes option pricing model. Expected forfeitures are estimated at the date of grant and subsequently adjusted if further information indicates actual forfeitures may vary from the original estimate. Any revisions are recognized in the consolidated statements of income and comprehensive income such that the cumulative expense reflects the revised estimate.
m. Research and development Research costs are expensed as incurred. Development expenditures are capitalized only if
development costs can be measured reliably, the product or process is technically and commercially feasible, future economic benefits are probable, and the Company intends to and has sufficient resources to complete development to use or sell the asset. Other development expenditures that do not meet the above criteria are recognized in the consolidated statements of income and comprehensive income as incurred.
f. Capital assets Capital assets are stated at cost, net of accumulated amortization and accumulated impairment
losses, if any.
Amortization is calculated using the following terms and methods:
Land Not amortized No term
Greenhouse infrastructure Straight-line 20 years
Bearer plants Unit of Production Number of units
Production equipment Straight-line 5 – 10 years
Office equipment Straight-line 3 – 5 years
Automotive equipment Straight-line 10 years
Leasehold improvements Straight-line over lease term
Construction in progress Not amortized no term
An item of equipment is derecognized upon disposal or when no future economic benefits are expected from its use. Any gain or loss arising on derecognition of the asset (calculated as the difference between the net disposal proceeds and the carrying value of the asset) is included in the consolidated statements of income and comprehensive income in the year the asset is derecognized.
The assets’ residual values, useful lives and methods of amortization are reviewed at each financial year end, and adjusted prospectively if appropriate.
g. Intangible assets Intangible assets are comprised of an e-commerce platform, a purchased private label brand,
licenses and permits as well as a licensing agreement with a third party. All are recorded at cost less accumulated amortization. Amortization of the e-commerce platform is recorded on a straight-line basis over the estimated useful life of 2 years. Amortization of the private label brand is recorded on a straight-line basis over the remaining useful life of 15 months. Amortization for the licenses and permits is recorded on a straight-line basis over the estimated useful life of 90 months. Amortization of the licensing agreement is recorded on a straight-line basis over the estimated useful life of 60 months.
h. Goodwill Goodwill represents the excess of the purchase price paid for the acquisition of subsidiaries over the
fair value of the net tangible and intangible assets acquired. Following initial recognition, goodwill is measured at cost less any accumulated impairment losses.
i. Impairment of non-financial assets Goodwill and intangible assets that have an indefinite useful life are not subject to amortization and
are tested annually for impairment, or more frequently if events or changes in circumstances indicate that they might be impaired. Other assets are tested for impairment whenever events or changes in circumstances indicate that the carrying amount may not be recoverable.
For the purpose of testing impairment, assets are grouped at the lowest levels for which there are separately identifiable cash flows (cash-generating unit, or “CGU”). An impairment loss is recognized for the amount, if any, by which the asset’s carrying amount exceeds its recoverable amount. The recoverable amount is the higher of the asset’s fair value less cost to sell and the value in use
21APHRIA INC. NOTES TO THE CONSOLIDATED FINANCIAL STATEMENTS For the years ended May 31, 2017 and May 31,2016
(vi) Financial liabilities and other financial liabilities Financial liabilities are classified as either financial liabilities at FVTPL or other financial
liabilities. Financial liabilities at FVTPL are stated at fair value, with changes being recognized through the consolidated statements of income and comprehensive income. Other financial liabilities are initially measured at fair value, net of transaction costs, and are subsequently measured at amortized cost using the effective interest method, with interest expense recognized on an effective yield basis.
(vii) Embedded derivatives The Company has convertible loans receivables whereby balances can be converted into equity.
Embedded derivatives are separated from the host contract and accounted for separately if certain criteria are met. Derivatives are initially measured at fair value; any directly attributable transaction costs are recognised in profit or loss as incurred. Subsequent to initial recognition, derivatives are measured at fair value and changes therein are recognised in profit or loss.
(viii) Classification of financial instruments Cash and cash equivalents – FVTPL Marketable securities – FVTPL Accounts receivables – loans and receivables Other receivables – loans and receivables Promissory notes receivable – loans and receivables Convertible note receivable – AFS Embedded derivative – embedded derivatives Long-term investments – FVTPL Accounts payable and accrued liabilities – other financial liabilities Promissory note payable – other financial liabilities Long-term debt – other financial liabilities
(ix) Determination on fair value of long-term investments All long-term investments (other than Level 3 warrants) are initially recorded at the transaction
price, being the fair value at the time of acquisition. Thereafter, at each reporting period, the fair value of an investment may be adjusted using one or more of the valuation indicators described below. These are included in Level 3 in Note 17. Warrants of private companies are carried at their intrinsic value.
o. Critical accounting estimates and judgments The preparation of financial statements requires management to make judgments, estimates and
assumptions that affect the application of policies and reported amounts of assets and liabilities, and revenue and expenses. Actual results may differ from these estimates. The estimates and underlying assumptions are reviewed on an ongoing basis. Revisions to accounting estimates are recognized in the period in which the estimate is revised if the revision affects only that period or in the period of the revision and future periods if the review affects both current and future periods.
The determination of fair value of the Company’s long-term investments at other than initial cost are subject to certain limitations. Financial information for private companies in which the Company has investments may not be available and, even if available, that information may be limited and/or unreliable.
n. Financial instruments
Financial assets and other financial liabilities are classified into one of four categories: • FVTPL; • held-to-maturity (“HTM”); • available for sale (“AFS”); and • loans and receivables.
(i) FVTPL financial assets Financial assets are classified as FVTPL when the financial asset is held for trading or it is
designated as FVTPL. Financial assets classified as FVTPL are stated at fair value with any resulting gain or loss recognized in the consolidated statements of income and comprehensive income. Transaction costs are expensed as incurred.
(ii) HTM investments HTM investments are recognized on a trade-date basis and are initially measured at fair value,
including transaction costs and subsequently at amortized cost.
(iii) AFS financial assets AFS financial assets are those non-derivative financial assets that are designated as available
for sale or are not classified in any of the other categories. Gains and losses arising from changes in fair value are recognized in other comprehensive income.
(iv) Loans and receivables Loans and receivables are financial assets having fixed or determinable payments that are
not quoted in an active market. They are initially recognized at the transaction value and subsequently carried at amortized cost less, when material, a discount to reduce the loans and receivables to fair value.
(v) Impairment of financial assets Financial assets, other than those at FVTPL, are assessed for indicators of impairment at the
end of each reporting period. Financial assets are impaired when there is objective evidence that, as a result of one or more events that occurred after the initial recognition of the financial asset, the estimated future cash flows of the investment have been impacted.
The carrying amount of all financial assets, excluding trade receivables, is directly reduced by the impairment loss. The carrying amount of trade receivables is reduced through the use of an allowance account. When a trade receivable is considered uncollectible, it is written off against the allowance account. Subsequent recoveries of amounts previously written off are credited against the allowance account. Changes in the carrying amount of the allowance account are recognized in the consolidated statements of income and comprehensive income. With the exception of AFS equity instruments, if, in a subsequent period, the amount of the impairment loss decreases and the decrease relates to an event occurring after the impairment was recognized; the previously recognized impairment loss is reversed through the consolidated statements of income and comprehensive income.
23APHRIA INC. NOTES TO THE CONSOLIDATED FINANCIAL STATEMENTS For the years ended May 31, 2017 and May 31,2016
The recoverable value of goodwill, indefinite and definite long-lived assets is determined using discounted future cash flow models, which incorporate assumptions regarding future events, specifically future cash flows, growth rates and discount rates.
SHARE-BASED COMPENSATION The fair value of share-based compensation expenses are estimated using the Black-Scholes option
pricing model and rely on a number of estimates, such as the expected life of the option, the volatility of the underlying share price, the risk free rate of return, and the estimated rate of forfeiture of options granted.
p. New standards and interpretations issued but not yet adopted A number of new standards, amendments to standards and interpretations are not yet effective
for the year ended May 31, 2017 and have not been applied in preparing these consolidated financial statements:
IFRS 9 - Financial Instruments: Classification and Measurement, effective for annual periods beginning on or after January 1, 2018, with early adoption permitted, introduces new requirements for the classification, measurement and derecognition of financial instruments and introduces a new impairment model for financial assets. The Company has performed a preliminary assessment of the potential impact of the adoption of IFRS9 on its consolidated financial statements based on its positions at May 31, 2017, which are discussed below.
CLASSIFICATION AND MEASUREMENT IFRS 9 contains a new classification and measurement approach for financial assets that reflects the business model in which assets are managed and their cash flow characteristics. IFRS9 largely retains the existing requirements in IAS39 for the classification of financial liabilities. Based on its preliminary assessment, the Company does not believe that the new classification requirements will have a significant impact on its consolidated financial statements.
IMPAIRMENT IFRS 9 replaces the ‘incurred loss’ model in IAS 39 with a forward-looking ‘expected credit loss’ (“ECL”) model. Applying the ECL model will require considerable judgment, including consideration of how changes in economic factors affect ECLs, which will be determined on a probability-weighted basis. The new impairment model will apply to financial assets measured at amortized cost or those measured at fair value through other comprehensive income, except for investments in equity instruments, and to contract assets. The Company is currently assessing the impact of this change on its consolidated financial statements and is continuing to assess the impact of the ECL model on its other financial assets.
The new standard also introduces expanded disclosure requirements and changes in presentation. These are expected to change the nature and extent of the Company’s disclosures about its financial instruments particularly in the year of the adoption of the new standard.
The Company will apply the new rules retrospectively from June 1, 2018 with the practical expedients permitted under the standards. Comparatives will not be restated.
Use of the valuation approach described below may involve uncertainties and determinations based on the Company’s judgment and any value estimated from these techniques may not be realized or realizable.
Company-specific information is considered when determining whether the fair value of a long-term investment should be adjusted upward or downward at the end of each reporting period. In addition to company-specific information, the Company will take into account trends in general market conditions and the share performance of comparable publicly-traded companies when valuing long-term investments.
The fair value of long-term investments may be adjusted if:
• There has been a significant subsequent equity financing provided by outside investors at a valuation different than the current value of the investee company, in which case the fair value of the investment is set to the value at which that financing took place;
• There have been significant corporate, political, or operating events affecting the investee company that, in management’s opinion, have a material impact on the investee company’s prospects and therefore its fair value. In these circumstances, the adjustment to the fair value of the investment will be based on management’s judgment and any value estimated may not be realized or realizable;
• The investee company is placed into receivership or bankruptcy; • Based on financial information received from the investee company, it is apparent to the Company
that the investee company is unlikely to be able to continue as a going concern; • Important positive/negative management changes by the investee company that the Company’s
management believes will have a positive/negative impact on the investee company’s ability to achieve its objectives and build value for shareholders.
Adjustment to the fair value of a long-term investment will be based upon management’s judgment and any value estimated may not be realized or realizable. The resulting values for non-publicly traded investments may differ from values that would be realized if a ready market existed.
BIOLOGICAL ASSETS AND INVENTORY Management is required to make a number of estimates in calculating the fair value less costs to
sell of biological assets and harvested cannabis inventory. These estimates include a number of assumptions such as estimating the stage of growth of the cannabis, harvesting costs, sales price, and expected yields.
ESTIMATED USEFUL LIVES, IMPAIRMENT CONSIDERATIONS AND AMORTIZATION OF CAPITAL AND INTANGIBLE ASSETS
Amortization of capital and intangible assets is dependent upon estimates of useful lives based on management’s judgment.
Goodwill and indefinite life intangible asset impairment testing requires management to make critical estimates in the impairment testing model. On an annual basis, the Company tests whether goodwill and indefinite life intangible assets are impaired.
Impairment of definite long-lived assets is influenced by judgment in defining a CGU and determining the indicators of impairment, and estimates used to measure impairment losses.
25APHRIA INC. NOTES TO THE CONSOLIDATED FINANCIAL STATEMENTS For the years ended May 31, 2017 and May 31,2016
4. DISCLOSURE OF BUSINESS TRANSACTION
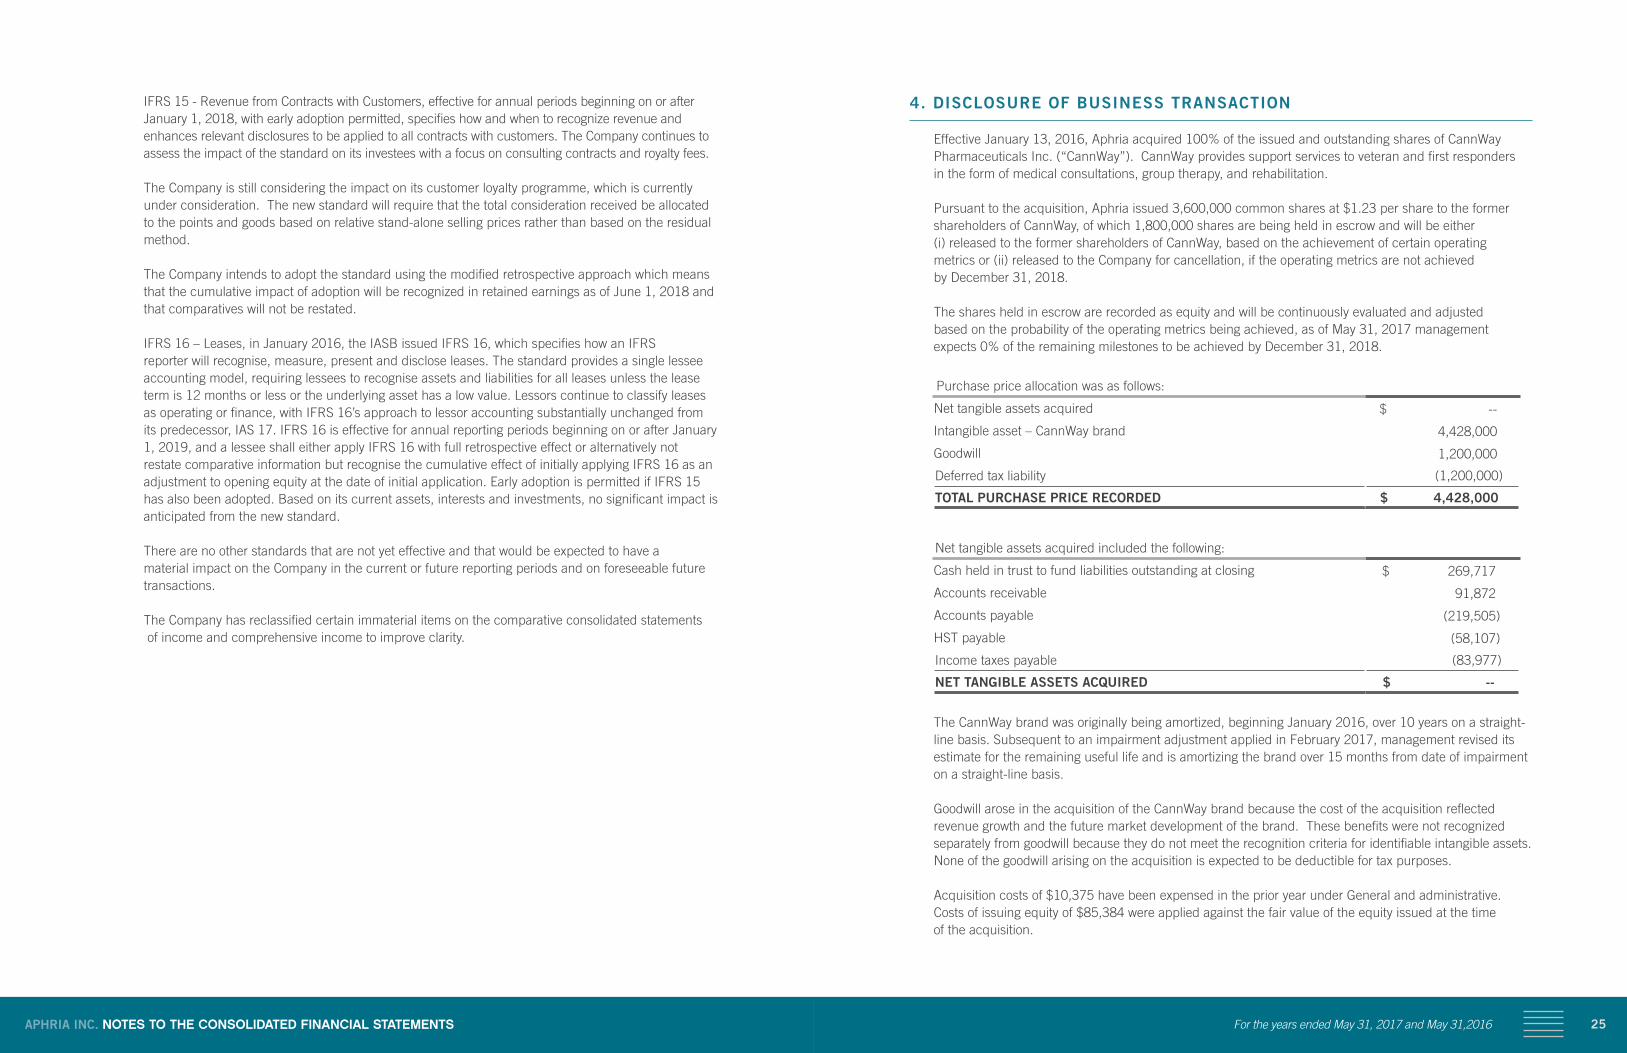
Effective January 13, 2016, Aphria acquired 100% of the issued and outstanding shares of CannWay Pharmaceuticals Inc. (“CannWay”). CannWay provides support services to veteran and first responders in the form of medical consultations, group therapy, and rehabilitation.
Pursuant to the acquisition, Aphria issued 3,600,000 common shares at $1.23 per share to the former shareholders of CannWay, of which 1,800,000 shares are being held in escrow and will be either (i) released to the former shareholders of CannWay, based on the achievement of certain operating metrics or (ii) released to the Company for cancellation, if the operating metrics are not achieved by December 31, 2018.
The shares held in escrow are recorded as equity and will be continuously evaluated and adjusted based on the probability of the operating metrics being achieved, as of May 31, 2017 management expects 0% of the remaining milestones to be achieved by December 31, 2018.
Purchase price allocation was as follows:
Net tangible assets acquired $ --
Intangible asset – CannWay brand 4,428,000
Goodwill 1,200,000
Deferred tax liability (1,200,000)
TOTAL PURCHASE PRICE RECORDED $ 4,428,000
Net tangible assets acquired included the following:
Cash held in trust to fund liabilities outstanding at closing $ 269,717
Accounts receivable 91,872
Accounts payable (219,505)
HST payable (58,107)
Income taxes payable (83,977)
NET TANGIBLE ASSETS ACQUIRED $ --
The CannWay brand was originally being amortized, beginning January 2016, over 10 years on a straight-line basis. Subsequent to an impairment adjustment applied in February 2017, management revised its estimate for the remaining useful life and is amortizing the brand over 15 months from date of impairment on a straight-line basis.
Goodwill arose in the acquisition of the CannWay brand because the cost of the acquisition reflected revenue growth and the future market development of the brand. These benefits were not recognized separately from goodwill because they do not meet the recognition criteria for identifiable intangible assets. None of the goodwill arising on the acquisition is expected to be deductible for tax purposes.
Acquisition costs of $10,375 have been expensed in the prior year under General and administrative. Costs of issuing equity of $85,384 were applied against the fair value of the equity issued at the time of the acquisition.
IFRS 15 - Revenue from Contracts with Customers, effective for annual periods beginning on or after January 1, 2018, with early adoption permitted, specifies how and when to recognize revenue and enhances relevant disclosures to be applied to all contracts with customers. The Company continues to assess the impact of the standard on its investees with a focus on consulting contracts and royalty fees.
The Company is still considering the impact on its customer loyalty programme, which is currently under consideration. The new standard will require that the total consideration received be allocated to the points and goods based on relative stand-alone selling prices rather than based on the residual method.
The Company intends to adopt the standard using the modified retrospective approach which means that the cumulative impact of adoption will be recognized in retained earnings as of June 1, 2018 and that comparatives will not be restated.
IFRS 16 – Leases, in January 2016, the IASB issued IFRS 16, which specifies how an IFRS reporter will recognise, measure, present and disclose leases. The standard provides a single lessee accounting model, requiring lessees to recognise assets and liabilities for all leases unless the lease term is 12 months or less or the underlying asset has a low value. Lessors continue to classify leases as operating or finance, with IFRS 16’s approach to lessor accounting substantially unchanged from its predecessor, IAS 17. IFRS 16 is effective for annual reporting periods beginning on or after January 1, 2019, and a lessee shall either apply IFRS 16 with full retrospective effect or alternatively not restate comparative information but recognise the cumulative effect of initially applying IFRS 16 as an adjustment to opening equity at the date of initial application. Early adoption is permitted if IFRS 15 has also been adopted. Based on its current assets, interests and investments, no significant impact is anticipated from the new standard.
There are no other standards that are not yet effective and that would be expected to have a material impact on the Company in the current or future reporting periods and on foreseeable future transactions.
The Company has reclassified certain immaterial items on the comparative consolidated statements of income and comprehensive income to improve clarity.
27APHRIA INC. NOTES TO THE CONSOLIDATED FINANCIAL STATEMENTS For the years ended May 31, 2017 and May 31,2016
6. INCOME TAXES AND DEFERRED INCOME TAXES
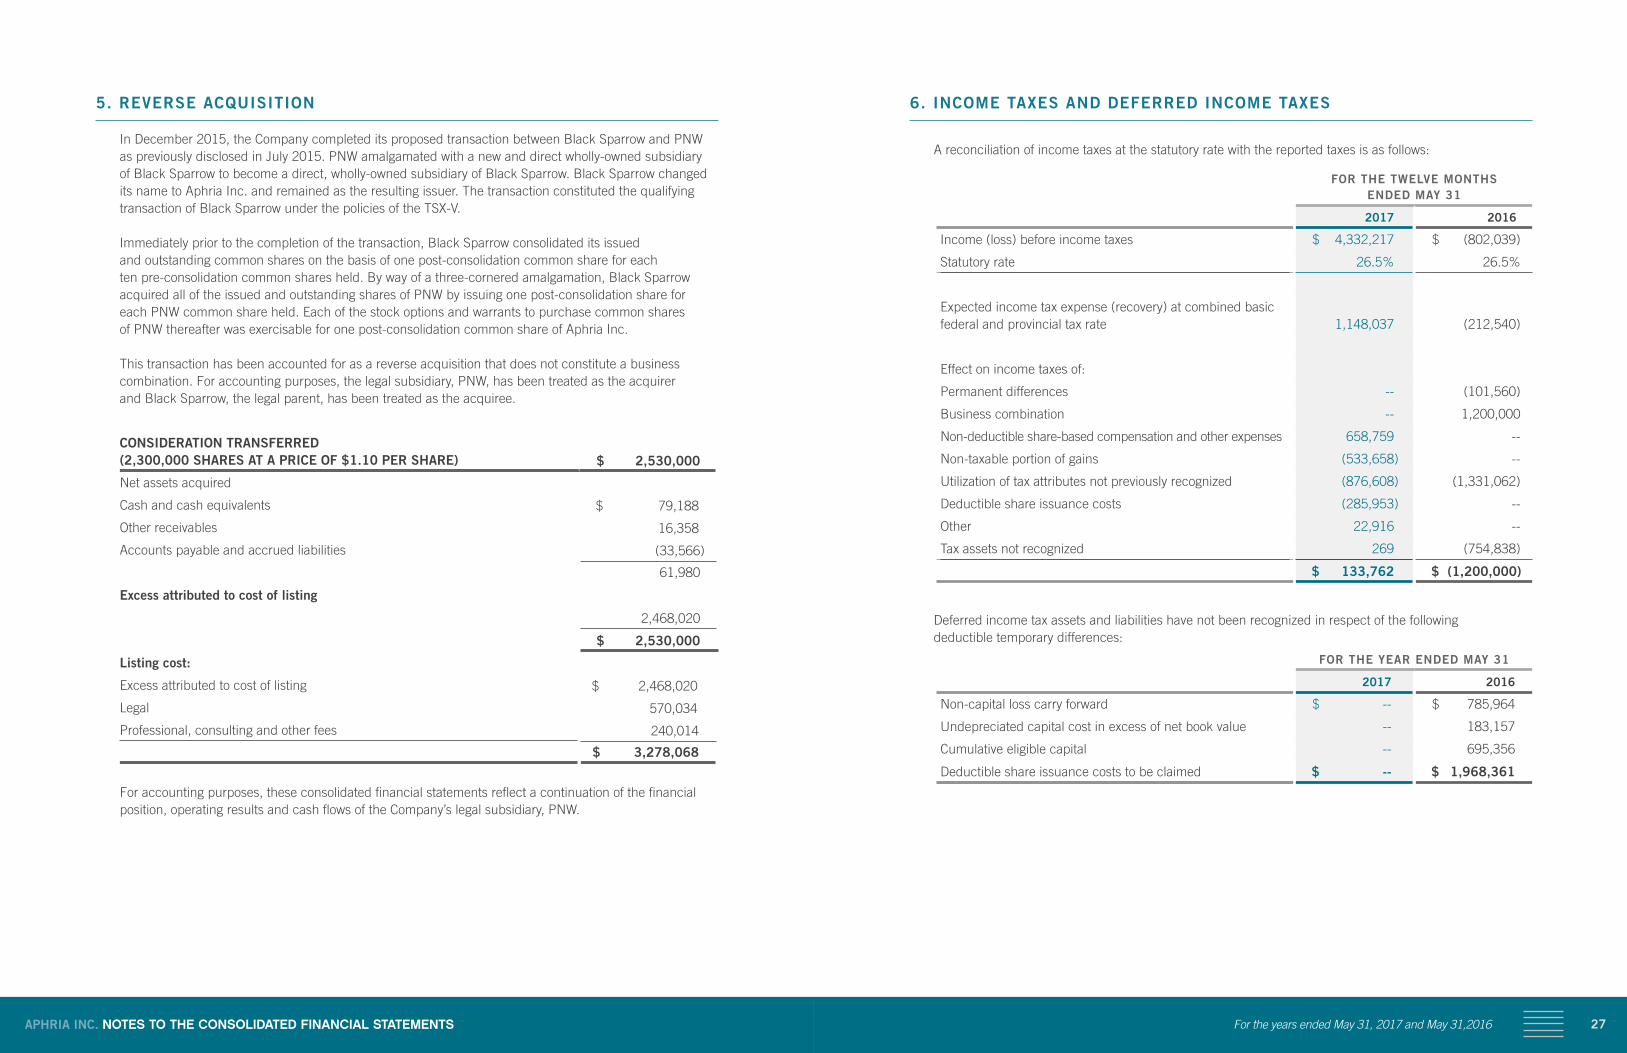
A reconciliation of income taxes at the statutory rate with the reported taxes is as follows:
FOR THE TWELVE MONTHS ENDED MAY 31
2017 2016
Income (loss) before income taxes $ 4,332,217 $ (802,039)
Statutory rate 26.5% 26.5%
Expected income tax expense (recovery) at combined basic federal and provincial tax rate 1,148,037 (212,540)
Effect on income taxes of:
Permanent differences -- (101,560)
Business combination -- 1,200,000
Non-deductible share-based compensation and other expenses 658,759 --
Non-taxable portion of gains (533,658) --
Utilization of tax attributes not previously recognized (876,608) (1,331,062)
Deductible share issuance costs (285,953) --
Other 22,916 --
Tax assets not recognized 269 (754,838)
$ 133,762 $ (1,200,000)
Deferred income tax assets and liabilities have not been recognized in respect of the following deductible temporary differences:
FOR THE YEAR ENDED MAY 31
2017 2016
Non-capital loss carry forward $ -- $ 785,964
Undepreciated capital cost in excess of net book value -- 183,157
Cumulative eligible capital -- 695,356
Deductible share issuance costs to be claimed $ -- $ 1,968,361
5. REVERSE ACQUISITION
In December 2015, the Company completed its proposed transaction between Black Sparrow and PNW as previously disclosed in July 2015. PNW amalgamated with a new and direct wholly-owned subsidiary of Black Sparrow to become a direct, wholly-owned subsidiary of Black Sparrow. Black Sparrow changed its name to Aphria Inc. and remained as the resulting issuer. The transaction constituted the qualifying transaction of Black Sparrow under the policies of the TSX-V.
Immediately prior to the completion of the transaction, Black Sparrow consolidated its issued and outstanding common shares on the basis of one post-consolidation common share for each ten pre-consolidation common shares held. By way of a three-cornered amalgamation, Black Sparrow acquired all of the issued and outstanding shares of PNW by issuing one post-consolidation share for each PNW common share held. Each of the stock options and warrants to purchase common shares of PNW thereafter was exercisable for one post-consolidation common share of Aphria Inc.
This transaction has been accounted for as a reverse acquisition that does not constitute a business combination. For accounting purposes, the legal subsidiary, PNW, has been treated as the acquirer and Black Sparrow, the legal parent, has been treated as the acquiree.
CONSIDERATION TRANSFERRED (2,300,000 SHARES AT A PRICE OF $1.10 PER SHARE) $ 2,530,000
Net assets acquired
Cash and cash equivalents $ 79,188
Other receivables 16,358
Accounts payable and accrued liabilities (33,566)
61,980
Excess attributed to cost of listing
2,468,020
$ 2,530,000
Listing cost:
Excess attributed to cost of listing $ 2,468,020
Legal 570,034
Professional, consulting and other fees 240,014
$ 3,278,068
For accounting purposes, these consolidated financial statements reflect a continuation of the financial position, operating results and cash flows of the Company’s legal subsidiary, PNW.
29APHRIA INC. NOTES TO THE CONSOLIDATED FINANCIAL STATEMENTS For the years ended May 31, 2017 and May 31,2016
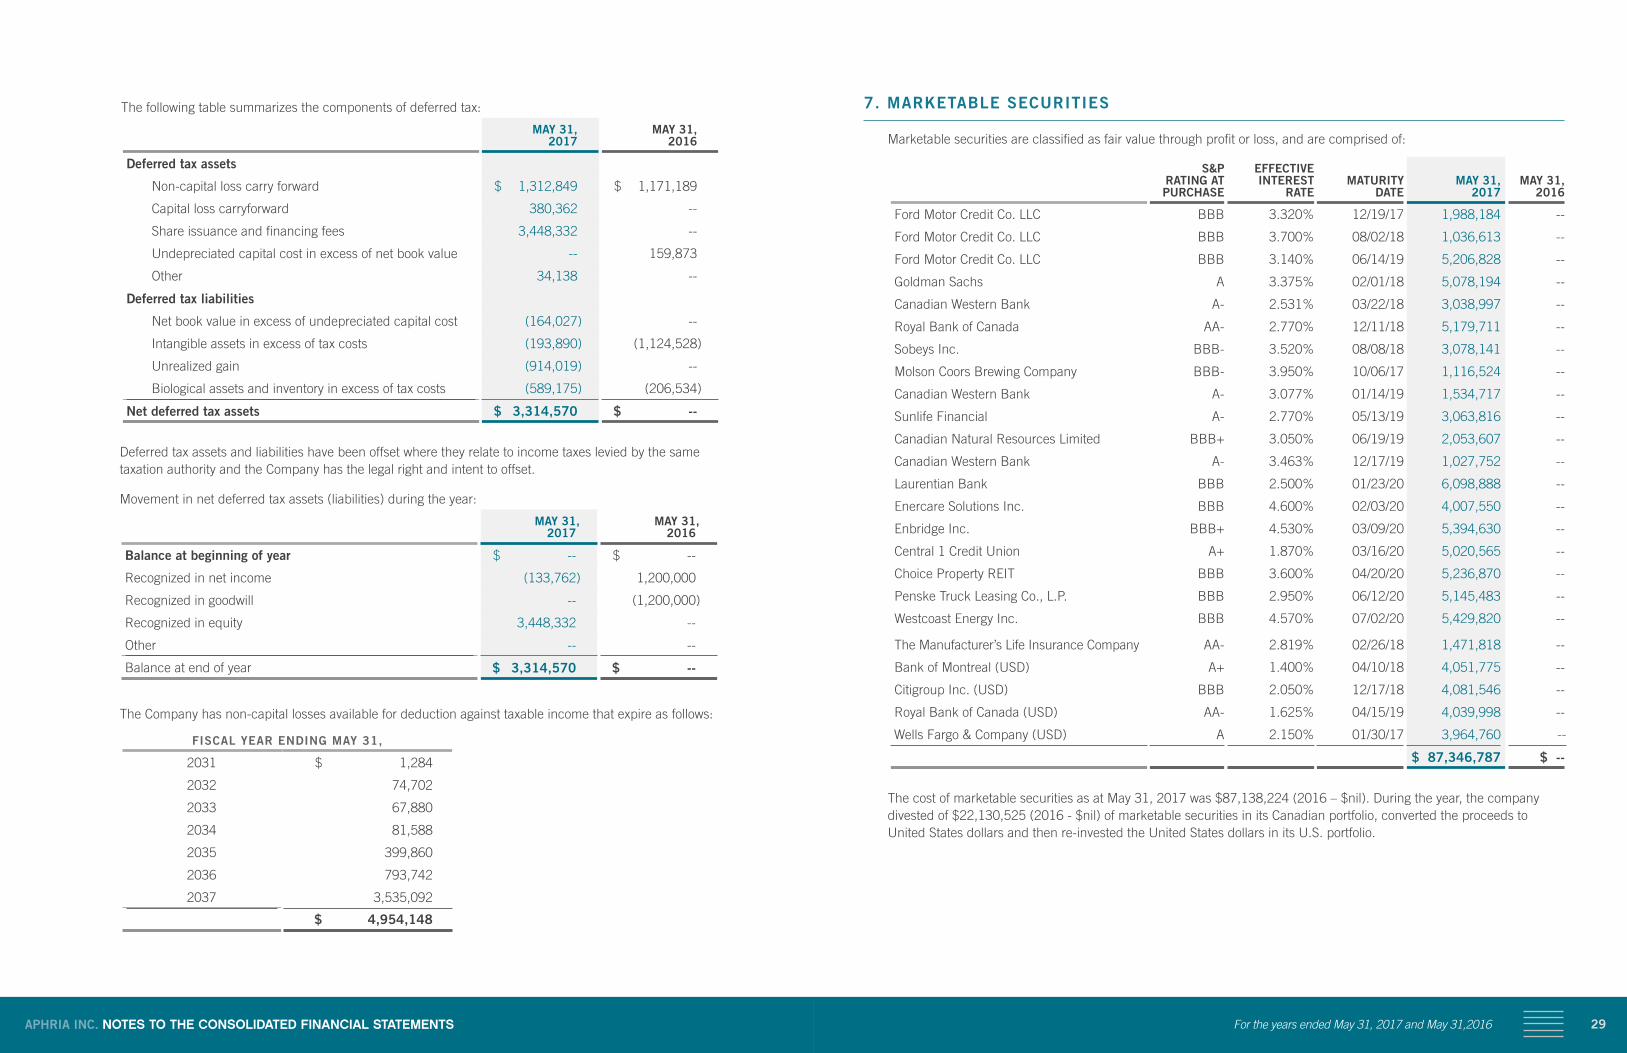
7. MARKETABLE SECURITIES
Marketable securities are classified as fair value through profit or loss, and are comprised of:
S&P RATING AT PURCHASE
EFFECTIVE INTEREST
RATEMATURITY
DATEMAY 31,
2017MAY 31,
2016
Ford Motor Credit Co. LLC BBB 3.320% 12/19/17 1,988,184 --
Ford Motor Credit Co. LLC BBB 3.700% 08/02/18 1,036,613 --
Ford Motor Credit Co. LLC BBB 3.140% 06/14/19 5,206,828 --
Goldman Sachs A 3.375% 02/01/18 5,078,194 --
Canadian Western Bank A- 2.531% 03/22/18 3,038,997 --
Royal Bank of Canada AA- 2.770% 12/11/18 5,179,711 --
Sobeys Inc. BBB- 3.520% 08/08/18 3,078,141 --
Molson Coors Brewing Company BBB- 3.950% 10/06/17 1,116,524 --
Canadian Western Bank A- 3.077% 01/14/19 1,534,717 --
Sunlife Financial A- 2.770% 05/13/19 3,063,816 --
Canadian Natural Resources Limited BBB+ 3.050% 06/19/19 2,053,607 --
Canadian Western Bank A- 3.463% 12/17/19 1,027,752 --
Laurentian Bank BBB 2.500% 01/23/20 6,098,888 --
Enercare Solutions Inc. BBB 4.600% 02/03/20 4,007,550 --
Enbridge Inc. BBB+ 4.530% 03/09/20 5,394,630 --
Central 1 Credit Union A+ 1.870% 03/16/20 5,020,565 --
Choice Property REIT BBB 3.600% 04/20/20 5,236,870 --
Penske Truck Leasing Co., L.P. BBB 2.950% 06/12/20 5,145,483 --
Westcoast Energy Inc. BBB 4.570% 07/02/20 5,429,820 --
The Manufacturer’s Life Insurance Company AA- 2.819% 02/26/18 1,471,818 --
Bank of Montreal (USD) A+ 1.400% 04/10/18 4,051,775 --
Citigroup Inc. (USD) BBB 2.050% 12/17/18 4,081,546 --
Royal Bank of Canada (USD) AA- 1.625% 04/15/19 4,039,998 --
Wells Fargo & Company (USD) A 2.150% 01/30/17 3,964,760 --
$ 87,346,787 $ --
The cost of marketable securities as at May 31, 2017 was $87,138,224 (2016 – $nil). During the year, the company divested of $22,130,525 (2016 - $nil) of marketable securities in its Canadian portfolio, converted the proceeds to United States dollars and then re-invested the United States dollars in its U.S. portfolio.
The following table summarizes the components of deferred tax:
MAY 31, 2017
MAY 31, 2016
Deferred tax assets
Non-capital loss carry forward $ 1,312,849 $ 1,171,189
Capital loss carryforward 380,362 --
Share issuance and financing fees 3,448,332 --
Undepreciated capital cost in excess of net book value -- 159,873
Other 34,138 --
Deferred tax liabilities
Net book value in excess of undepreciated capital cost (164,027) --
Intangible assets in excess of tax costs (193,890) (1,124,528)
Unrealized gain (914,019) --
Biological assets and inventory in excess of tax costs (589,175) (206,534)
Net deferred tax assets $ 3,314,570 $ --
Deferred tax assets and liabilities have been offset where they relate to income taxes levied by the same taxation authority and the Company has the legal right and intent to offset.
Movement in net deferred tax assets (liabilities) during the year:
MAY 31, 2017
MAY 31, 2016
Balance at beginning of year $ -- $ --
Recognized in net income (133,762) 1,200,000
Recognized in goodwill -- (1,200,000)
Recognized in equity 3,448,332 --
Other -- --
Balance at end of year $ 3,314,570 $ --
The Company has non-capital losses available for deduction against taxable income that expire as follows:
FISCAL YEAR ENDING MAY 31,
2031 $ 1,284
2032 74,702
2033 67,880
2034 81,588
2035 399,860
2036 793,742
2037 3,535,092
$ 4,954,148
31APHRIA INC. NOTES TO THE CONSOLIDATED FINANCIAL STATEMENTS For the years ended May 31, 2017 and May 31,2016
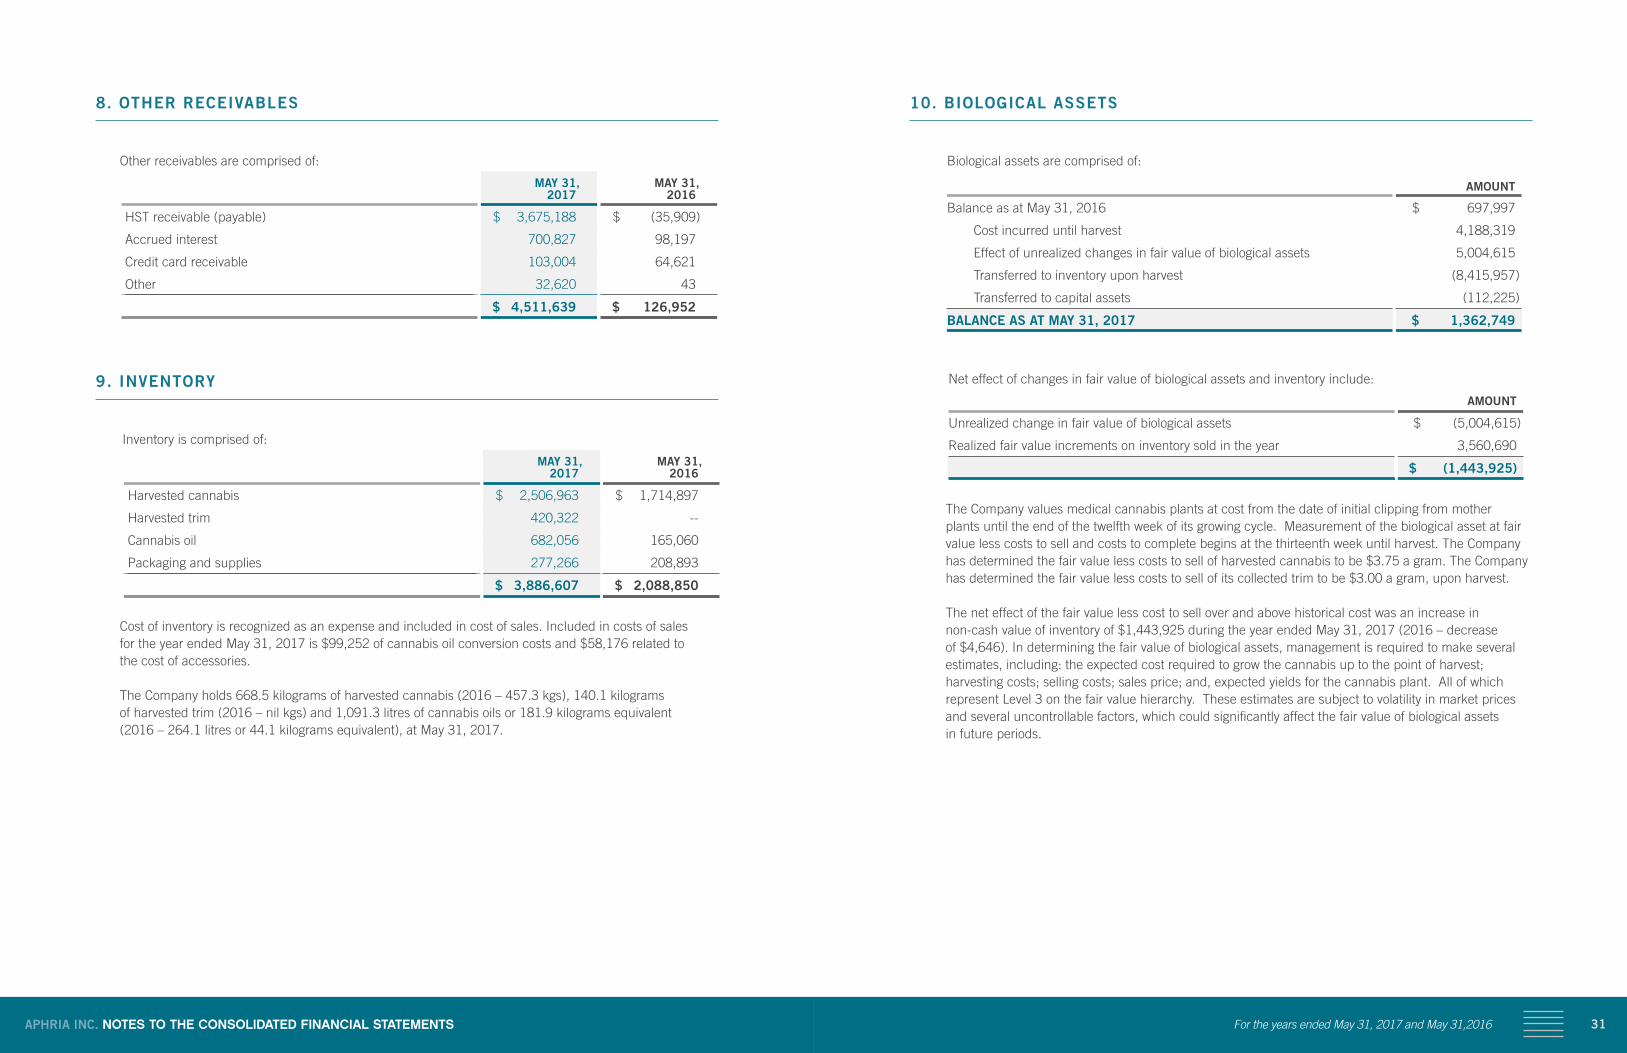
10. BIOLOGICAL ASSETS
Biological assets are comprised of:
AMOUNT
Balance as at May 31, 2016 $ 697,997
Cost incurred until harvest 4,188,319
Effect of unrealized changes in fair value of biological assets 5,004,615
Transferred to inventory upon harvest (8,415,957)
Transferred to capital assets (112,225)
BALANCE AS AT MAY 31, 2017 $ 1,362,749
Net effect of changes in fair value of biological assets and inventory include:
AMOUNT
Unrealized change in fair value of biological assets $ (5,004,615)
Realized fair value increments on inventory sold in the year 3,560,690
$ (1,443,925)
The Company values medical cannabis plants at cost from the date of initial clipping from mother plants until the end of the twelfth week of its growing cycle. Measurement of the biological asset at fair value less costs to sell and costs to complete begins at the thirteenth week until harvest. The Company has determined the fair value less costs to sell of harvested cannabis to be $3.75 a gram. The Company has determined the fair value less costs to sell of its collected trim to be $3.00 a gram, upon harvest.
The net effect of the fair value less cost to sell over and above historical cost was an increase in non-cash value of inventory of $1,443,925 during the year ended May 31, 2017 (2016 – decrease of $4,646). In determining the fair value of biological assets, management is required to make several estimates, including: the expected cost required to grow the cannabis up to the point of harvest; harvesting costs; selling costs; sales price; and, expected yields for the cannabis plant. All of which represent Level 3 on the fair value hierarchy. These estimates are subject to volatility in market prices and several uncontrollable factors, which could significantly affect the fair value of biological assets in future periods.
8. OTHER RECEIVABLES
Other receivables are comprised of:
MAY 31, 2017
MAY 31, 2016
HST receivable (payable) $ 3,675,188 $ (35,909)
Accrued interest 700,827 98,197
Credit card receivable 103,004 64,621
Other 32,620 43
$ 4,511,639 $ 126,952
9. INVENTORY
Inventory is comprised of:
MAY 31, 2017
MAY 31, 2016
Harvested cannabis $ 2,506,963 $ 1,714,897
Harvested trim 420,322 --
Cannabis oil 682,056 165,060
Packaging and supplies 277,266 208,893
$ 3,886,607 $ 2,088,850
Cost of inventory is recognized as an expense and included in cost of sales. Included in costs of sales for the year ended May 31, 2017 is $99,252 of cannabis oil conversion costs and $58,176 related to the cost of accessories.
The Company holds 668.5 kilograms of harvested cannabis (2016 – 457.3 kgs), 140.1 kilograms of harvested trim (2016 – nil kgs) and 1,091.3 litres of cannabis oils or 181.9 kilograms equivalent (2016 – 264.1 litres or 44.1 kilograms equivalent), at May 31, 2017.
33APHRIA INC. NOTES TO THE CONSOLIDATED FINANCIAL STATEMENTS For the years ended May 31, 2017 and May 31,2016
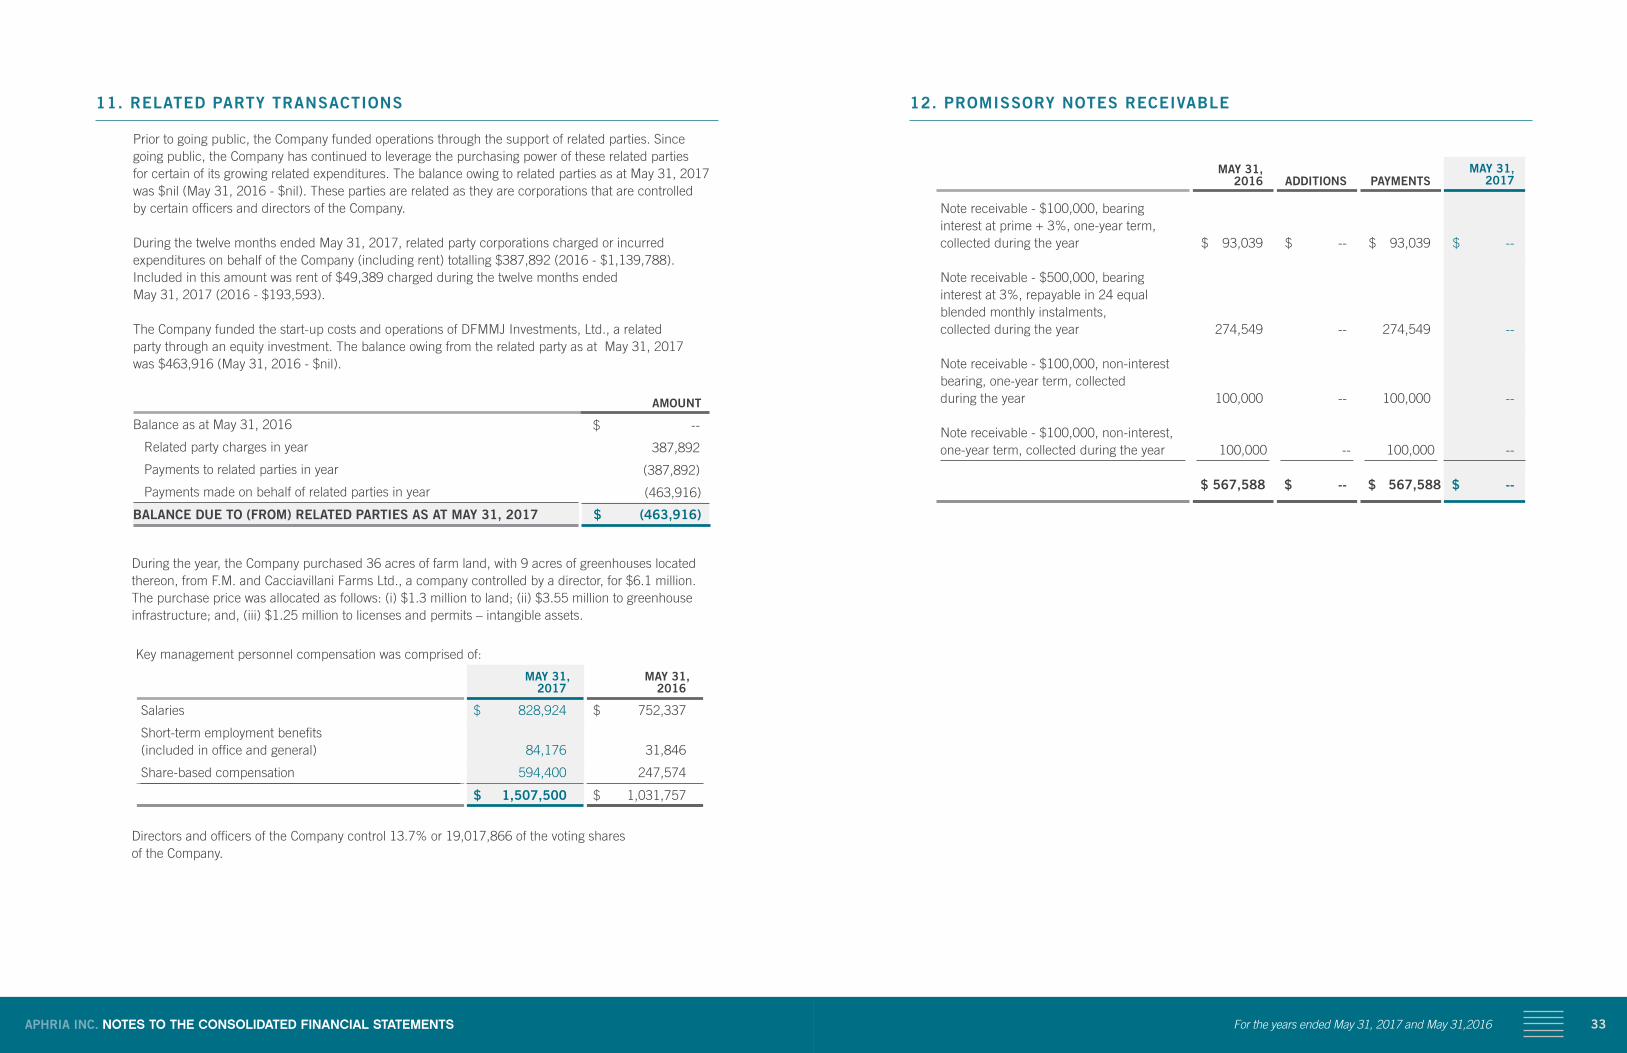
12. PROMISSORY NOTES RECEIVABLE
MAY 31, 2016 ADDITIONS PAYMENTS
MAY 31, 2017
Note receivable - $100,000, bearing interest at prime + 3%, one-year term, collected during the year $ 93,039 $ -- $ 93,039 $ --
Note receivable - $500,000, bearing interest at 3%, repayable in 24 equal blended monthly instalments, collected during the year 274,549 -- 274,549 --
Note receivable - $100,000, non-interest bearing, one-year term, collected during the year 100,000 -- 100,000 --
Note receivable - $100,000, non-interest, one-year term, collected during the year 100,000 -- 100,000 --
$ 567,588 $ -- $ 567,588 $ --
11. RELATED PARTY TRANSACTIONS
Prior to going public, the Company funded operations through the support of related parties. Since going public, the Company has continued to leverage the purchasing power of these related parties for certain of its growing related expenditures. The balance owing to related parties as at May 31, 2017 was $nil (May 31, 2016 - $nil). These parties are related as they are corporations that are controlled by certain officers and directors of the Company.
During the twelve months ended May 31, 2017, related party corporations charged or incurred expenditures on behalf of the Company (including rent) totalling $387,892 (2016 - $1,139,788). Included in this amount was rent of $49,389 charged during the twelve months ended May 31, 2017 (2016 - $193,593).
The Company funded the start-up costs and operations of DFMMJ Investments, Ltd., a related party through an equity investment. The balance owing from the related party as at May 31, 2017 was $463,916 (May 31, 2016 - $nil).
AMOUNT
Balance as at May 31, 2016 $ --
Related party charges in year 387,892
Payments to related parties in year (387,892)
Payments made on behalf of related parties in year (463,916)
BALANCE DUE TO (FROM) RELATED PARTIES AS AT MAY 31, 2017 $ (463,916)
During the year, the Company purchased 36 acres of farm land, with 9 acres of greenhouses located thereon, from F.M. and Cacciavillani Farms Ltd., a company controlled by a director, for $6.1 million. The purchase price was allocated as follows: (i) $1.3 million to land; (ii) $3.55 million to greenhouse infrastructure; and, (iii) $1.25 million to licenses and permits – intangible assets.
Key management personnel compensation was comprised of:
MAY 31, 2017
MAY 31, 2016
Salaries $ 828,924 $ 752,337
Short-term employment benefits (included in office and general) 84,176 31,846
Share-based compensation 594,400 247,574
$ 1,507,500 $ 1,031,757
Directors and officers of the Company control 13.7% or 19,017,866 of the voting shares of the Company.
35APHRIA INC. NOTES TO THE CONSOLIDATED FINANCIAL STATEMENTS For the years ended May 31, 2017 and May 31,2016
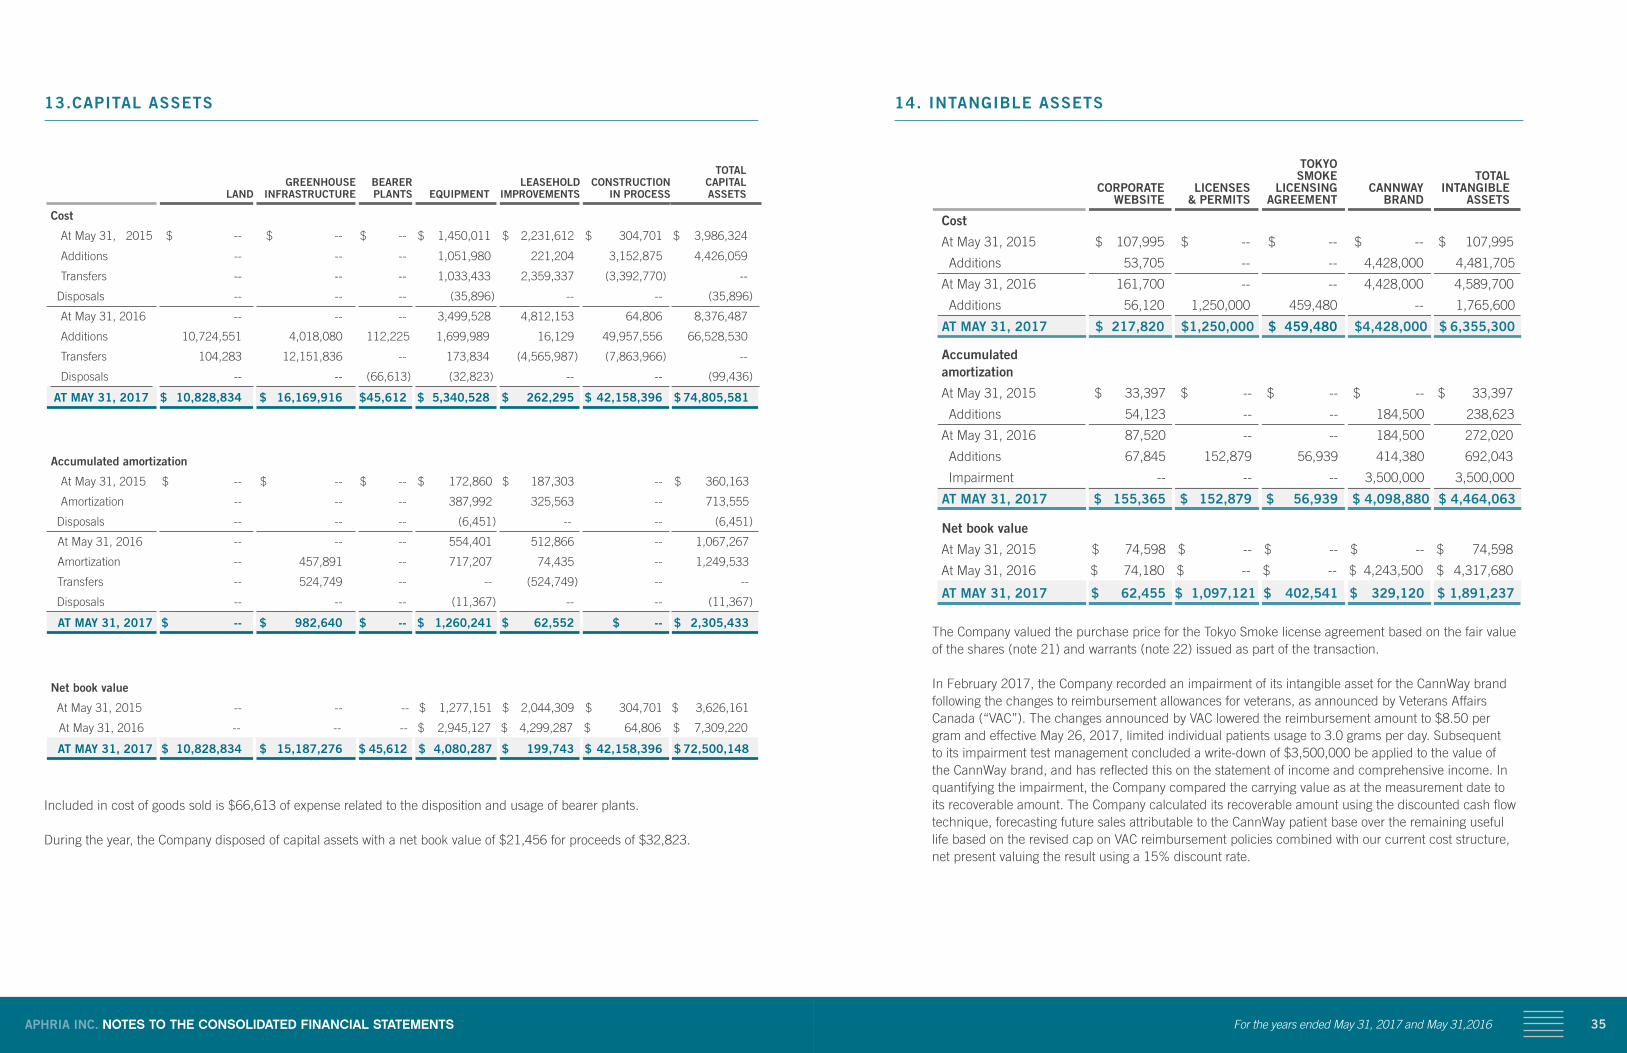
14. INTANGIBLE ASSETS
CORPORATE WEBSITE
LICENSES & PERMITS
TOKYO SMOKE LICENSING AGREEMENT
CANNWAY BRAND
TOTAL INTANGIBLE ASSETS
Cost
At May 31, 2015 $ 107,995 $ -- $ -- $ -- $ 107,995
Additions 53,705 -- -- 4,428,000 4,481,705
At May 31, 2016 161,700 -- -- 4,428,000 4,589,700
Additions 56,120 1,250,000 459,480 -- 1,765,600
AT MAY 31, 2017 $ 217,820 $ 1,250,000 $ 459,480 $ 4,428,000 $ 6,355,300
Accumulated amortization
At May 31, 2015 $ 33,397 $ -- $ -- $ -- $ 33,397
Additions 54,123 -- -- 184,500 238,623
At May 31, 2016 87,520 -- -- 184,500 272,020
Additions 67,845 152,879 56,939 414,380 692,043
Impairment -- -- -- 3,500,000 3,500,000
AT MAY 31, 2017 $ 155,365 $ 152,879 $ 56,939 $ 4,098,880 $ 4,464,063
Net book value
At May 31, 2015 $ 74,598 $ -- $ -- $ -- $ 74,598
At May 31, 2016 $ 74,180 $ -- $ -- $ 4,243,500 $ 4,317,680
AT MAY 31, 2017 $ 62,455 $ 1,097,121 $ 402,541 $ 329,120 $ 1,891,237
The Company valued the purchase price for the Tokyo Smoke license agreement based on the fair value of the shares (note 21) and warrants (note 22) issued as part of the transaction.
In February 2017, the Company recorded an impairment of its intangible asset for the CannWay brand following the changes to reimbursement allowances for veterans, as announced by Veterans Affairs Canada (“VAC”). The changes announced by VAC lowered the reimbursement amount to $8.50 per gram and effective May 26, 2017, limited individual patients usage to 3.0 grams per day. Subsequent to its impairment test management concluded a write-down of $3,500,000 be applied to the value of the CannWay brand, and has reflected this on the statement of income and comprehensive income. In quantifying the impairment, the Company compared the carrying value as at the measurement date to its recoverable amount. The Company calculated its recoverable amount using the discounted cash flow technique, forecasting future sales attributable to the CannWay patient base over the remaining useful life based on the revised cap on VAC reimbursement policies combined with our current cost structure, net present valuing the result using a 15% discount rate.
13.CAPITAL ASSETS
LAND GREENHOUSE
INFRASTRUCTURE BEARER
PLANTS EQUIPMENT LEASEHOLD
IMPROVEMENTSCONSTRUCTION
IN PROCESS
TOTAL CAPITAL ASSETS
Cost
At May 31, 2015 $ -- $ -- $ -- $ 1,450,011 $ 2,231,612 $ 304,701 $ 3,986,324
Additions -- -- -- 1,051,980 221,204 3,152,875 4,426,059
Transfers -- -- -- 1,033,433 2,359,337 (3,392,770) --
Disposals -- -- -- (35,896) -- -- (35,896)
At May 31, 2016 -- -- -- 3,499,528 4,812,153 64,806 8,376,487
Additions 10,724,551 4,018,080 112,225 1,699,989 16,129 49,957,556 66,528,530
Transfers 104,283 12,151,836 -- 173,834 (4,565,987) (7,863,966) --
Disposals -- -- (66,613) (32,823) -- -- (99,436)
AT MAY 31, 2017 $ 10,828,834 $ 16,169,916 $ 45,612 $ 5,340,528 $ 262,295 $ 42,158,396 $ 74,805,581
Accumulated amortization
At May 31, 2015 $ -- $ -- $ -- $ 172,860 $ 187,303 -- $ 360,163
Amortization -- -- -- 387,992 325,563 -- 713,555
Disposals -- -- -- (6,451) -- -- (6,451)
At May 31, 2016 -- -- -- 554,401 512,866 -- 1,067,267
Amortization -- 457,891 -- 717,207 74,435 -- 1,249,533
Transfers -- 524,749 -- -- (524,749) -- --
Disposals -- -- -- (11,367) -- -- (11,367)
AT MAY 31, 2017 $ -- $ 982,640 $ -- $ 1,260,241 $ 62,552 $ -- $ 2,305,433
Net book value
At May 31, 2015 -- -- -- $ 1,277,151 $ 2,044,309 $ 304,701 $ 3,626,161
At May 31, 2016 -- -- -- $ 2,945,127 $ 4,299,287 $ 64,806 $ 7,309,220
AT MAY 31, 2017 $ 10,828,834 $ 15,187,276 $ 45,612 $ 4,080,287 $ 199,743 $ 42,158,396 $ 72,500,148
Included in cost of goods sold is $66,613 of expense related to the disposition and usage of bearer plants.
During the year, the Company disposed of capital assets with a net book value of $21,456 for proceeds of $32,823.
37APHRIA INC. NOTES TO THE CONSOLIDATED FINANCIAL STATEMENTS For the years ended May 31, 2017 and May 31,2016
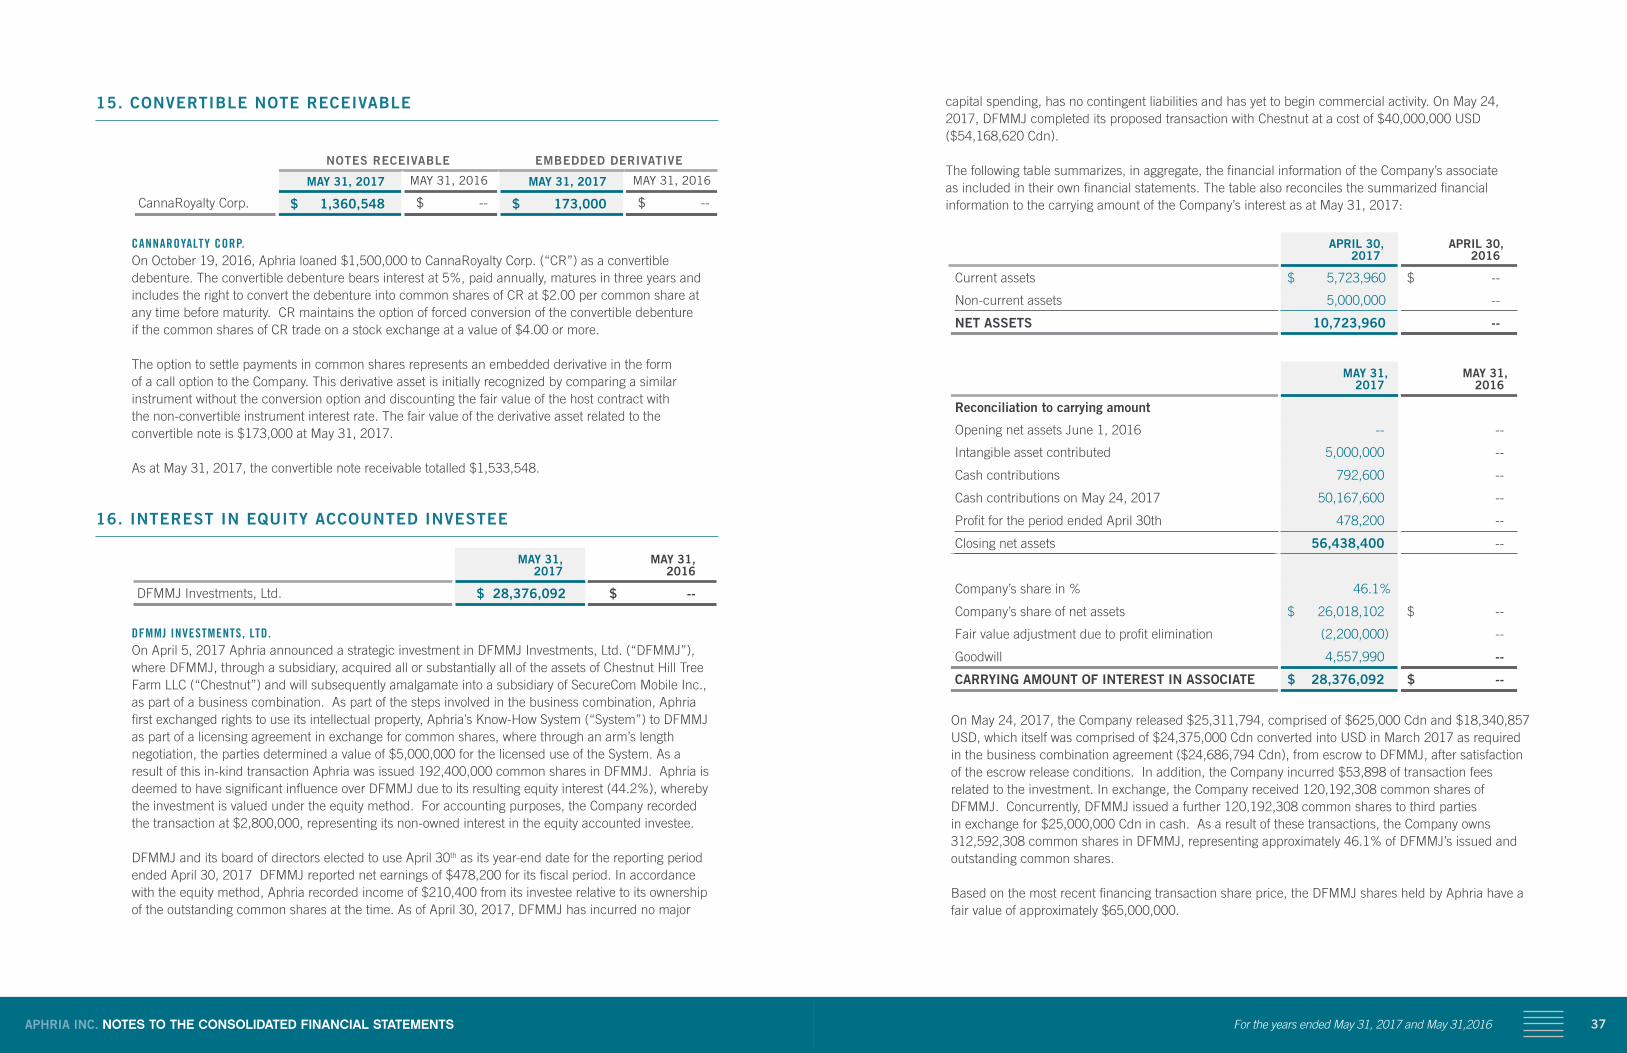
capital spending, has no contingent liabilities and has yet to begin commercial activity. On May 24, 2017, DFMMJ completed its proposed transaction with Chestnut at a cost of $40,000,000 USD ($54,168,620 Cdn).
The following table summarizes, in aggregate, the financial information of the Company’s associate as included in their own financial statements. The table also reconciles the summarized financial information to the carrying amount of the Company’s interest as at May 31, 2017:
APRIL 30, 2017
APRIL 30, 2016
Current assets $ 5,723,960 $ --
Non-current assets 5,000,000 --
NET ASSETS 10,723,960 --
MAY 31, 2017
MAY 31, 2016
Reconciliation to carrying amount
Opening net assets June 1, 2016 -- --
Intangible asset contributed 5,000,000 --
Cash contributions 792,600 --
Cash contributions on May 24, 2017 50,167,600 --
Profit for the period ended April 30th 478,200 --
Closing net assets 56,438,400 --
Company’s share in % 46.1%
Company’s share of net assets $ 26,018,102 $ --
Fair value adjustment due to profit elimination (2,200,000) --
Goodwill 4,557,990 --
CARRYING AMOUNT OF INTEREST IN ASSOCIATE $ 28,376,092 $ --
On May 24, 2017, the Company released $25,311,794, comprised of $625,000 Cdn and $18,340,857 USD, which itself was comprised of $24,375,000 Cdn converted into USD in March 2017 as required in the business combination agreement ($24,686,794 Cdn), from escrow to DFMMJ, after satisfaction of the escrow release conditions. In addition, the Company incurred $53,898 of transaction fees related to the investment. In exchange, the Company received 120,192,308 common shares of DFMMJ. Concurrently, DFMMJ issued a further 120,192,308 common shares to third parties in exchange for $25,000,000 Cdn in cash. As a result of these transactions, the Company owns 312,592,308 common shares in DFMMJ, representing approximately 46.1% of DFMMJ’s issued and outstanding common shares.
Based on the most recent financing transaction share price, the DFMMJ shares held by Aphria have a fair value of approximately $65,000,000.
15. CONVERTIBLE NOTE RECEIVABLE
NOTES RECEIVABLE EMBEDDED DERIVATIVE
MAY 31, 2017 MAY 31, 2016 MAY 31, 2017 MAY 31, 2016
CannaRoyalty Corp. $ 1,360,548 $ -- $ 173,000 $ --
CANNAROYALTY CORP. On October 19, 2016, Aphria loaned $1,500,000 to CannaRoyalty Corp. (“CR”) as a convertible
debenture. The convertible debenture bears interest at 5%, paid annually, matures in three years and includes the right to convert the debenture into common shares of CR at $2.00 per common share at any time before maturity. CR maintains the option of forced conversion of the convertible debenture if the common shares of CR trade on a stock exchange at a value of $4.00 or more.
The option to settle payments in common shares represents an embedded derivative in the form of a call option to the Company. This derivative asset is initially recognized by comparing a similar instrument without the conversion option and discounting the fair value of the host contract with the non-convertible instrument interest rate. The fair value of the derivative asset related to the convertible note is $173,000 at May 31, 2017.
As at May 31, 2017, the convertible note receivable totalled $1,533,548.
16. INTEREST IN EQUITY ACCOUNTED INVESTEE
MAY 31, 2017
MAY 31, 2016
DFMMJ Investments, Ltd. $ 28,376,092 $ --
DFMMJ INVESTMENTS, LTD. On April 5, 2017 Aphria announced a strategic investment in DFMMJ Investments, Ltd. (“DFMMJ”),
where DFMMJ, through a subsidiary, acquired all or substantially all of the assets of Chestnut Hill Tree Farm LLC (“Chestnut”) and will subsequently amalgamate into a subsidiary of SecureCom Mobile Inc., as part of a business combination. As part of the steps involved in the business combination, Aphria first exchanged rights to use its intellectual property, Aphria’s Know-How System (“System”) to DFMMJ as part of a licensing agreement in exchange for common shares, where through an arm’s length negotiation, the parties determined a value of $5,000,000 for the licensed use of the System. As a result of this in-kind transaction Aphria was issued 192,400,000 common shares in DFMMJ. Aphria is deemed to have significant influence over DFMMJ due to its resulting equity interest (44.2%), whereby the investment is valued under the equity method. For accounting purposes, the Company recorded the transaction at $2,800,000, representing its non-owned interest in the equity accounted investee.
DFMMJ and its board of directors elected to use April 30th as its year-end date for the reporting period ended April 30, 2017 DFMMJ reported net earnings of $478,200 for its fiscal period. In accordance with the equity method, Aphria recorded income of $210,400 from its investee relative to its ownership of the outstanding common shares at the time. As of April 30, 2017, DFMMJ has incurred no major
39APHRIA INC. NOTES TO THE CONSOLIDATED FINANCIAL STATEMENTS For the years ended May 31, 2017 and May 31,2016
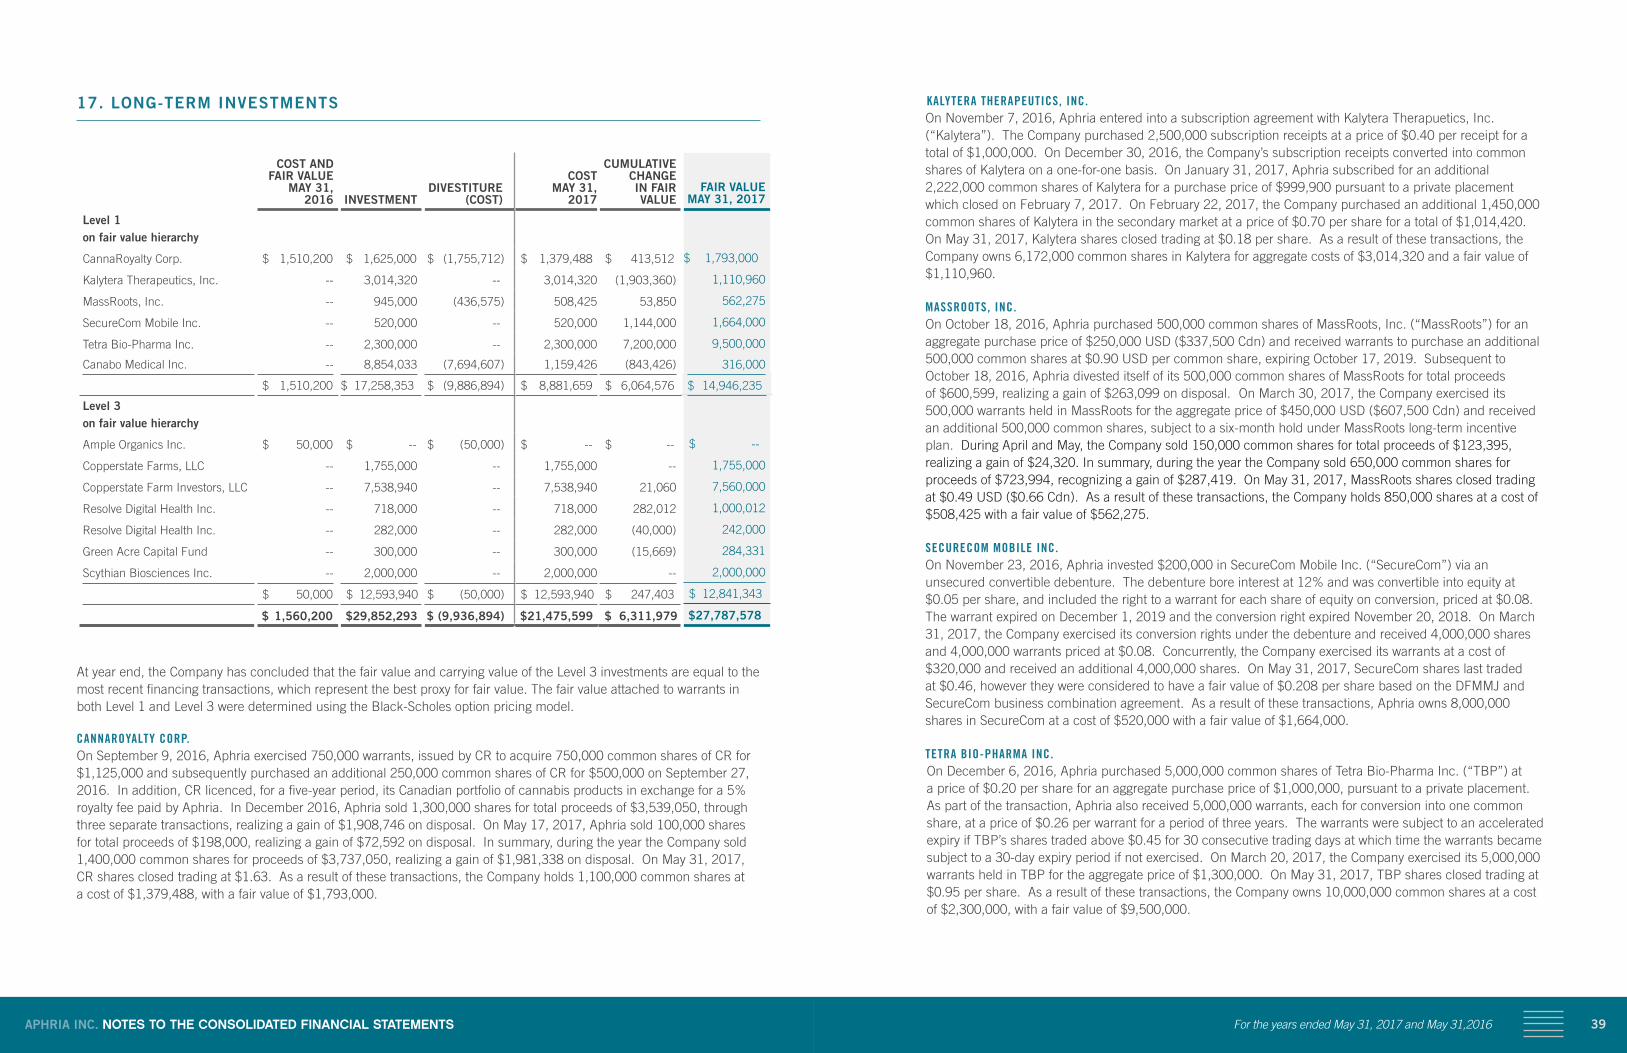
KALYTERA THERAPEUTICS, INC. On November 7, 2016, Aphria entered into a subscription agreement with Kalytera Therapuetics, Inc.
(“Kalytera”). The Company purchased 2,500,000 subscription receipts at a price of $0.40 per receipt for a total of $1,000,000. On December 30, 2016, the Company’s subscription receipts converted into common shares of Kalytera on a one-for-one basis. On January 31, 2017, Aphria subscribed for an additional 2,222,000 common shares of Kalytera for a purchase price of $999,900 pursuant to a private placement which closed on February 7, 2017. On February 22, 2017, the Company purchased an additional 1,450,000 common shares of Kalytera in the secondary market at a price of $0.70 per share for a total of $1,014,420. On May 31, 2017, Kalytera shares closed trading at $0.18 per share. As a result of these transactions, the Company owns 6,172,000 common shares in Kalytera for aggregate costs of $3,014,320 and a fair value of $1,110,960.
MASSROOTS, INC. On October 18, 2016, Aphria purchased 500,000 common shares of MassRoots, Inc. (“MassRoots”) for an
aggregate purchase price of $250,000 USD ($337,500 Cdn) and received warrants to purchase an additional 500,000 common shares at $0.90 USD per common share, expiring October 17, 2019. Subsequent to October 18, 2016, Aphria divested itself of its 500,000 common shares of MassRoots for total proceeds of $600,599, realizing a gain of $263,099 on disposal. On March 30, 2017, the Company exercised its 500,000 warrants held in MassRoots for the aggregate price of $450,000 USD ($607,500 Cdn) and received an additional 500,000 common shares, subject to a six-month hold under MassRoots long-term incentive plan. During April and May, the Company sold 150,000 common shares for total proceeds of $123,395, realizing a gain of $24,320. In summary, during the year the Company sold 650,000 common shares for proceeds of $723,994, recognizing a gain of $287,419. On May 31, 2017, MassRoots shares closed trading at $0.49 USD ($0.66 Cdn). As a result of these transactions, the Company holds 850,000 shares at a cost of $508,425 with a fair value of $562,275.
SECURECOM MOBILE INC. On November 23, 2016, Aphria invested $200,000 in SecureCom Mobile Inc. (“SecureCom”) via an
unsecured convertible debenture. The debenture bore interest at 12% and was convertible into equity at $0.05 per share, and included the right to a warrant for each share of equity on conversion, priced at $0.08. The warrant expired on December 1, 2019 and the conversion right expired November 20, 2018. On March 31, 2017, the Company exercised its conversion rights under the debenture and received 4,000,000 shares and 4,000,000 warrants priced at $0.08. Concurrently, the Company exercised its warrants at a cost of $320,000 and received an additional 4,000,000 shares. On May 31, 2017, SecureCom shares last traded at $0.46, however they were considered to have a fair value of $0.208 per share based on the DFMMJ and SecureCom business combination agreement. As a result of these transactions, Aphria owns 8,000,000 shares in SecureCom at a cost of $520,000 with a fair value of $1,664,000.
TETRA BIO-PHARMA INC. On December 6, 2016, Aphria purchased 5,000,000 common shares of Tetra Bio-Pharma Inc. (“TBP”) at
a price of $0.20 per share for an aggregate purchase price of $1,000,000, pursuant to a private placement. As part of the transaction, Aphria also received 5,000,000 warrants, each for conversion into one common share, at a price of $0.26 per warrant for a period of three years. The warrants were subject to an accelerated expiry if TBP’s shares traded above $0.45 for 30 consecutive trading days at which time the warrants became subject to a 30-day expiry period if not exercised. On March 20, 2017, the Company exercised its 5,000,000 warrants held in TBP for the aggregate price of $1,300,000. On May 31, 2017, TBP shares closed trading at $0.95 per share. As a result of these transactions, the Company owns 10,000,000 common shares at a cost of $2,300,000, with a fair value of $9,500,000.
17. LONG-TERM INVESTMENTS
COST AND FAIR VALUE
MAY 31, 2016 INVESTMENT
DIVESTITURE(COST)
COSTMAY 31,
2017
CUMULATIVECHANGE IN FAIRVALUE
FAIR VALUEMAY 31, 2017
Level 1 on fair value hierarchy
CannaRoyalty Corp. $ 1,510,200 $ 1,625,000 $ (1,755,712) $ 1,379,488 $ 413,512 $ 1,793,000
Kalytera Therapeutics, Inc. -- 3,014,320 -- 3,014,320 (1,903,360) 1,110,960
MassRoots, Inc. -- 945,000 (436,575) 508,425 53,850 562,275
SecureCom Mobile Inc. -- 520,000 -- 520,000 1,144,000 1,664,000
Tetra Bio-Pharma Inc. -- 2,300,000 -- 2,300,000 7,200,000 9,500,000
Canabo Medical Inc. -- 8,854,033 (7,694,607) 1,159,426 (843,426) 316,000
$ 1,510,200 $ 17,258,353 $ (9,886,894) $ 8,881,659 $ 6,064,576 $ 14,946,235
Level 3 on fair value hierarchy
Ample Organics Inc. $ 50,000 $ -- $ (50,000) $ -- $ -- $ --
Copperstate Farms, LLC -- 1,755,000 -- 1,755,000 -- 1,755,000
Copperstate Farm Investors, LLC -- 7,538,940 -- 7,538,940 21,060 7,560,000
Resolve Digital Health Inc. -- 718,000 -- 718,000 282,012 1,000,012
Resolve Digital Health Inc. -- 282,000 -- 282,000 (40,000) 242,000
Green Acre Capital Fund -- 300,000 -- 300,000 (15,669) 284,331
Scythian Biosciences Inc. -- 2,000,000 -- 2,000,000 -- 2,000,000
$ 50,000 $ 12,593,940 $ (50,000) $ 12,593,940 $ 247,403 $ 12,841,343
$ 1,560,200 $ 29,852,293 $ (9,936,894) $ 21,475,599 $ 6,311,979 $ 27,787,578
At year end, the Company has concluded that the fair value and carrying value of the Level 3 investments are equal to the most recent financing transactions, which represent the best proxy for fair value. The fair value attached to warrants in both Level 1 and Level 3 were determined using the Black-Scholes option pricing model.
CANNAROYALTY CORP. On September 9, 2016, Aphria exercised 750,000 warrants, issued by CR to acquire 750,000 common shares of CR for $1,125,000 and subsequently purchased an additional 250,000 common shares of CR for $500,000 on September 27, 2016. In addition, CR licenced, for a five-year period, its Canadian portfolio of cannabis products in exchange for a 5% royalty fee paid by Aphria. In December 2016, Aphria sold 1,300,000 shares for total proceeds of $3,539,050, through three separate transactions, realizing a gain of $1,908,746 on disposal. On May 17, 2017, Aphria sold 100,000 shares for total proceeds of $198,000, realizing a gain of $72,592 on disposal. In summary, during the year the Company sold 1,400,000 common shares for proceeds of $3,737,050, realizing a gain of $1,981,338 on disposal. On May 31, 2017, CR shares closed trading at $1.63. As a result of these transactions, the Company holds 1,100,000 common shares at a cost of $1,379,488, with a fair value of $1,793,000.
41APHRIA INC. NOTES TO THE CONSOLIDATED FINANCIAL STATEMENTS For the years ended May 31, 2017 and May 31,2016
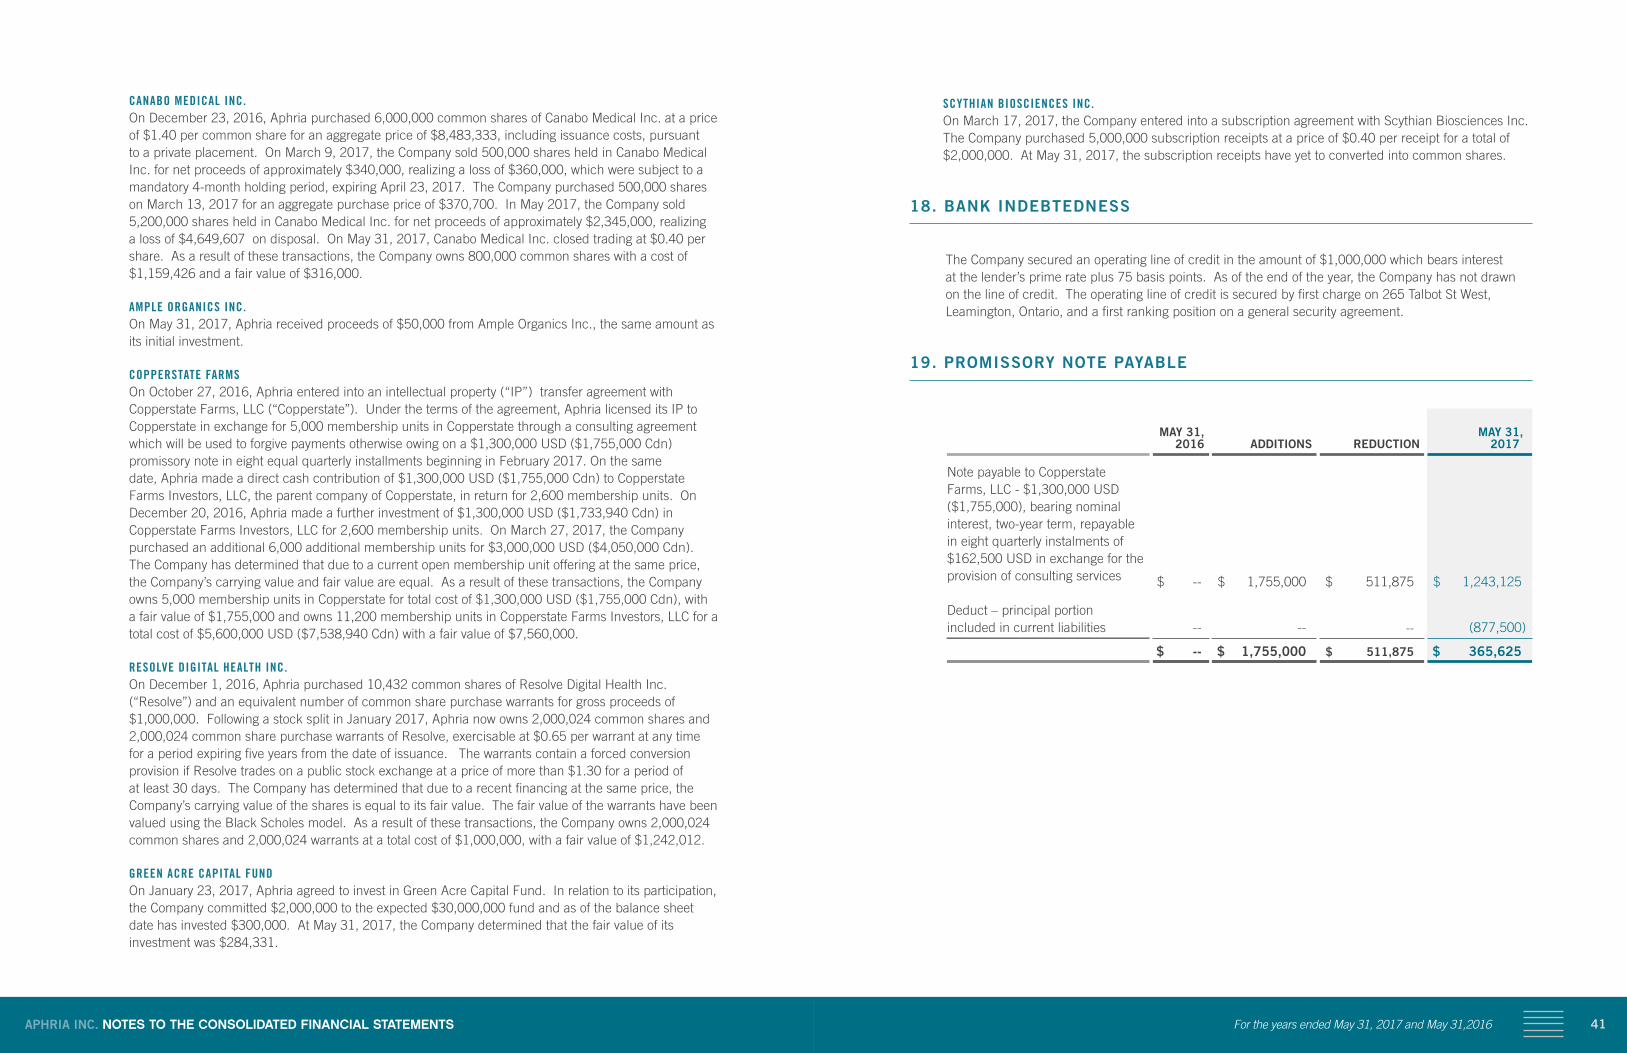
SCYTHIAN BIOSCIENCES INC. On March 17, 2017, the Company entered into a subscription agreement with Scythian Biosciences Inc.
The Company purchased 5,000,000 subscription receipts at a price of $0.40 per receipt for a total of $2,000,000. At May 31, 2017, the subscription receipts have yet to converted into common shares.
18. BANK INDEBTEDNESS
The Company secured an operating line of credit in the amount of $1,000,000 which bears interest at the lender’s prime rate plus 75 basis points. As of the end of the year, the Company has not drawn on the line of credit. The operating line of credit is secured by first charge on 265 Talbot St West, Leamington, Ontario, and a first ranking position on a general security agreement.
19. PROMISSORY NOTE PAYABLE
MAY 31,
2016
ADDITIONS
REDUCTION
MAY 31, 2017
Note payable to Copperstate Farms, LLC - $1,300,000 USD ($1,755,000), bearing nominal interest, two-year term, repayable in eight quarterly instalments of $162,500 USD in exchange for the provision of consulting services $ -- $ 1,755,000 $ 511,875 $ 1,243,125
Deduct – principal portion included in current liabilities -- -- -- (877,500)
$ -- $ 1,755,000 $ 511,875 $ 365,625
CANABO MEDICAL INC. On December 23, 2016, Aphria purchased 6,000,000 common shares of Canabo Medical Inc. at a price
of $1.40 per common share for an aggregate price of $8,483,333, including issuance costs, pursuant to a private placement. On March 9, 2017, the Company sold 500,000 shares held in Canabo Medical Inc. for net proceeds of approximately $340,000, realizing a loss of $360,000, which were subject to a mandatory 4-month holding period, expiring April 23, 2017. The Company purchased 500,000 shares on March 13, 2017 for an aggregate purchase price of $370,700. In May 2017, the Company sold 5,200,000 shares held in Canabo Medical Inc. for net proceeds of approximately $2,345,000, realizing a loss of $4,649,607 on disposal. On May 31, 2017, Canabo Medical Inc. closed trading at $0.40 per share. As a result of these transactions, the Company owns 800,000 common shares with a cost of $1,159,426 and a fair value of $316,000.
AMPLE ORGANICS INC. On May 31, 2017, Aphria received proceeds of $50,000 from Ample Organics Inc., the same amount as
its initial investment.
COPPERSTATE FARMS On October 27, 2016, Aphria entered into an intellectual property (“IP”) transfer agreement with
Copperstate Farms, LLC (‘‘Copperstate’’). Under the terms of the agreement, Aphria licensed its IP to Copperstate in exchange for 5,000 membership units in Copperstate through a consulting agreement which will be used to forgive payments otherwise owing on a $1,300,000 USD ($1,755,000 Cdn) promissory note in eight equal quarterly installments beginning in February 2017. On the same date, Aphria made a direct cash contribution of $1,300,000 USD ($1,755,000 Cdn) to Copperstate Farms Investors, LLC, the parent company of Copperstate, in return for 2,600 membership units. On December 20, 2016, Aphria made a further investment of $1,300,000 USD ($1,733,940 Cdn) in Copperstate Farms Investors, LLC for 2,600 membership units. On March 27, 2017, the Company purchased an additional 6,000 additional membership units for $3,000,000 USD ($4,050,000 Cdn). The Company has determined that due to a current open membership unit offering at the same price, the Company’s carrying value and fair value are equal. As a result of these transactions, the Company owns 5,000 membership units in Copperstate for total cost of $1,300,000 USD ($1,755,000 Cdn), with a fair value of $1,755,000 and owns 11,200 membership units in Copperstate Farms Investors, LLC for a total cost of $5,600,000 USD ($7,538,940 Cdn) with a fair value of $7,560,000.
RESOLVE DIGITAL HEALTH INC. On December 1, 2016, Aphria purchased 10,432 common shares of Resolve Digital Health Inc.
(‘‘Resolve’’) and an equivalent number of common share purchase warrants for gross proceeds of $1,000,000. Following a stock split in January 2017, Aphria now owns 2,000,024 common shares and 2,000,024 common share purchase warrants of Resolve, exercisable at $0.65 per warrant at any time for a period expiring five years from the date of issuance. The warrants contain a forced conversion provision if Resolve trades on a public stock exchange at a price of more than $1.30 for a period of at least 30 days. The Company has determined that due to a recent financing at the same price, the Company’s carrying value of the shares is equal to its fair value. The fair value of the warrants have been valued using the Black Scholes model. As a result of these transactions, the Company owns 2,000,024 common shares and 2,000,024 warrants at a total cost of $1,000,000, with a fair value of $1,242,012.
GREEN ACRE CAPITAL FUND On January 23, 2017, Aphria agreed to invest in Green Acre Capital Fund. In relation to its participation,
the Company committed $2,000,000 to the expected $30,000,000 fund and as of the balance sheet date has invested $300,000. At May 31, 2017, the Company determined that the fair value of its investment was $284,331.
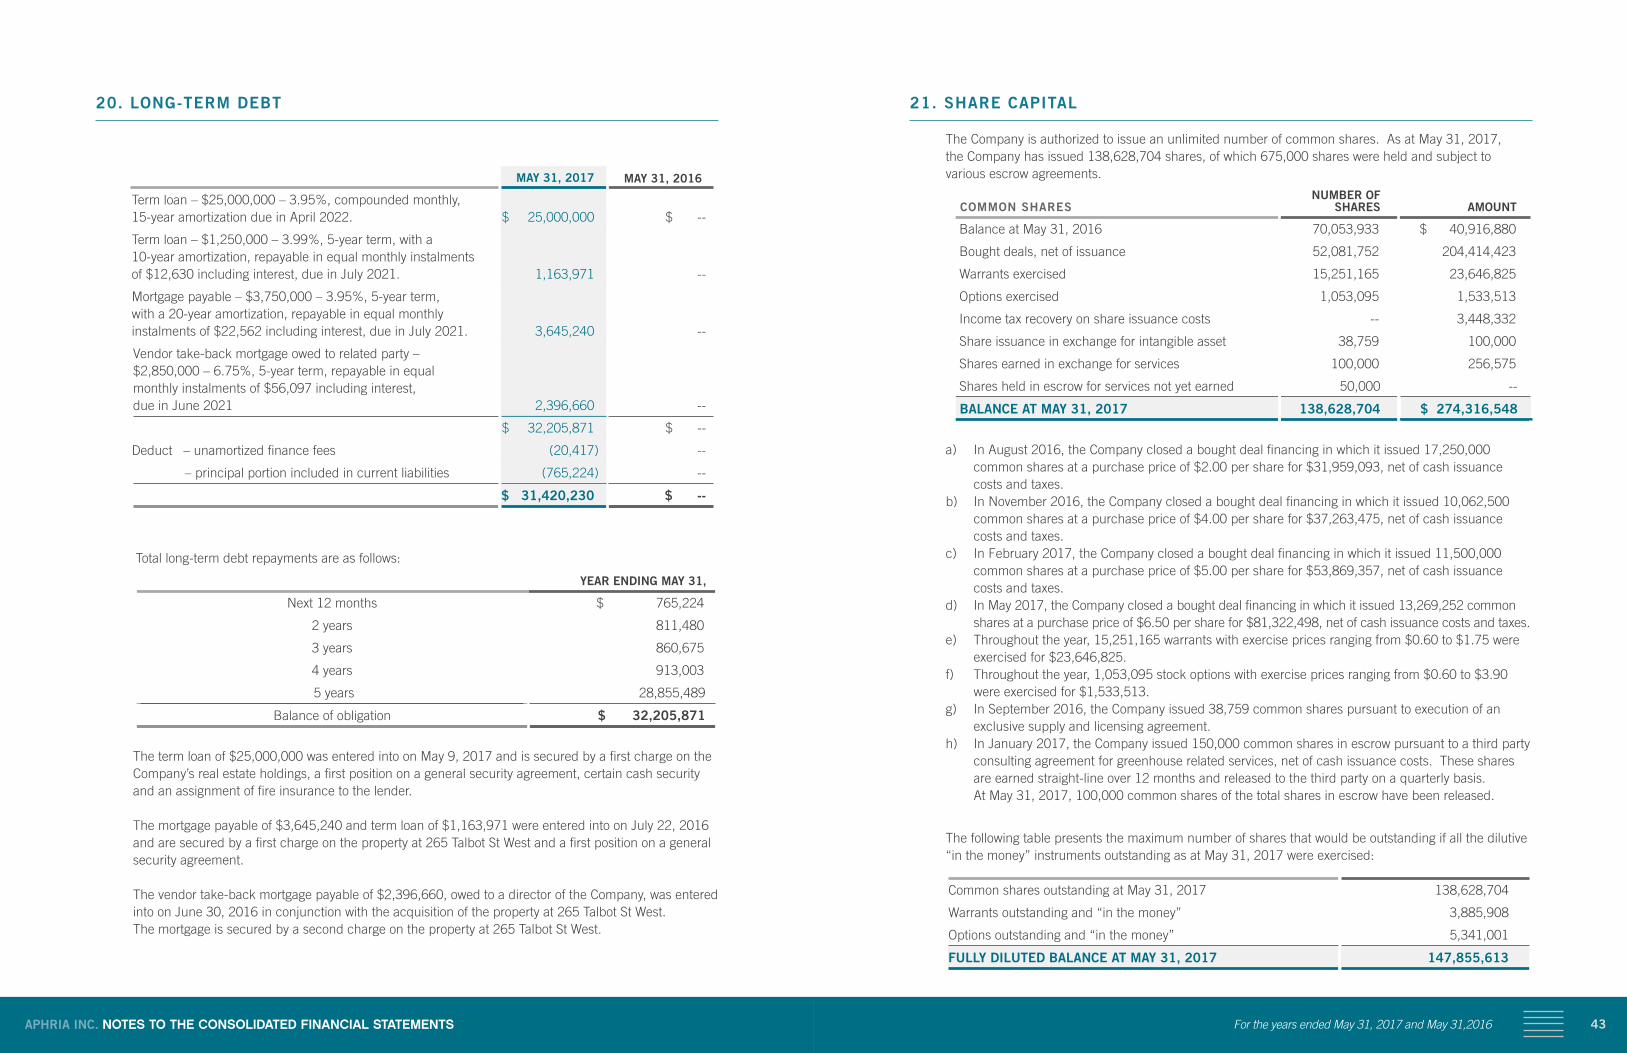
43APHRIA INC. NOTES TO THE CONSOLIDATED FINANCIAL STATEMENTS For the years ended May 31, 2017 and May 31,2016
21. SHARE CAPITAL
The Company is authorized to issue an unlimited number of common shares. As at May 31, 2017,the Company has issued 138,628,704 shares, of which 675,000 shares were held and subject to various escrow agreements.
COMMON SHARES NUMBER OF SHARES AMOUNT
Balance at May 31, 2016 70,053,933 $ 40,916,880
Bought deals, net of issuance 52,081,752 204,414,423
Warrants exercised 15,251,165 23,646,825
Options exercised 1,053,095 1,533,513
Income tax recovery on share issuance costs -- 3,448,332
Share issuance in exchange for intangible asset 38,759 100,000
Shares earned in exchange for services 100,000 256,575
Shares held in escrow for services not yet earned 50,000 --
BALANCE AT MAY 31, 2017 138,628,704 $ 274,316,548
a) In August 2016, the Company closed a bought deal financing in which it issued 17,250,000 common shares at a purchase price of $2.00 per share for $31,959,093, net of cash issuance costs and taxes.
b) In November 2016, the Company closed a bought deal financing in which it issued 10,062,500 common shares at a purchase price of $4.00 per share for $37,263,475, net of cash issuance costs and taxes.
c) In February 2017, the Company closed a bought deal financing in which it issued 11,500,000 common shares at a purchase price of $5.00 per share for $53,869,357, net of cash issuance costs and taxes.
d) In May 2017, the Company closed a bought deal financing in which it issued 13,269,252 common shares at a purchase price of $6.50 per share for $81,322,498, net of cash issuance costs and taxes.
e) Throughout the year, 15,251,165 warrants with exercise prices ranging from $0.60 to $1.75 were exercised for $23,646,825.
f) Throughout the year, 1,053,095 stock options with exercise prices ranging from $0.60 to $3.90 were exercised for $1,533,513.
g) In September 2016, the Company issued 38,759 common shares pursuant to execution of an exclusive supply and licensing agreement.
h) In January 2017, the Company issued 150,000 common shares in escrow pursuant to a third party consulting agreement for greenhouse related services, net of cash issuance costs. These shares are earned straight-line over 12 months and released to the third party on a quarterly basis. At May 31, 2017, 100,000 common shares of the total shares in escrow have been released.
The following table presents the maximum number of shares that would be outstanding if all the dilutive “in the money” instruments outstanding as at May 31, 2017 were exercised:
Common shares outstanding at May 31, 2017 138,628,704
Warrants outstanding and “in the money” 3,885,908
Options outstanding and “in the money” 5,341,001
FULLY DILUTED BALANCE AT MAY 31, 2017 147,855,613
20. LONG-TERM DEBT
MAY 31, 2017 MAY 31, 2016
Term loan – $25,000,000 – 3.95%, compounded monthly, 15-year amortization due in April 2022. $ 25,000,000 $ --
Term loan – $1,250,000 – 3.99%, 5-year term, with a 10-year amortization, repayable in equal monthly instalments of $12,630 including interest, due in July 2021. 1,163,971 --
Mortgage payable – $3,750,000 – 3.95%, 5-year term, with a 20-year amortization, repayable in equal monthly instalments of $22,562 including interest, due in July 2021. 3,645,240 --
Vendor take-back mortgage owed to related party – $2,850,000 – 6.75%, 5-year term, repayable in equal monthly instalments of $56,097 including interest, due in June 2021 2,396,660 --
$ 32,205,871 $ --
Deduct – unamortized finance fees (20,417) --
– principal portion included in current liabilities (765,224) --
$ 31,420,230 $ --
Total long-term debt repayments are as follows:
YEAR ENDING MAY 31,
Next 12 months $ 765,224
2 years 811,480
3 years 860,675
4 years 913,003
5 years 28,855,489
Balance of obligation $ 32,205,871
The term loan of $25,000,000 was entered into on May 9, 2017 and is secured by a first charge on the Company’s real estate holdings, a first position on a general security agreement, certain cash security and an assignment of fire insurance to the lender.
The mortgage payable of $3,645,240 and term loan of $1,163,971 were entered into on July 22, 2016 and are secured by a first charge on the property at 265 Talbot St West and a first position on a general security agreement.
The vendor take-back mortgage payable of $2,396,660, owed to a director of the Company, was entered into on June 30, 2016 in conjunction with the acquisition of the property at 265 Talbot St West. The mortgage is secured by a second charge on the property at 265 Talbot St West.
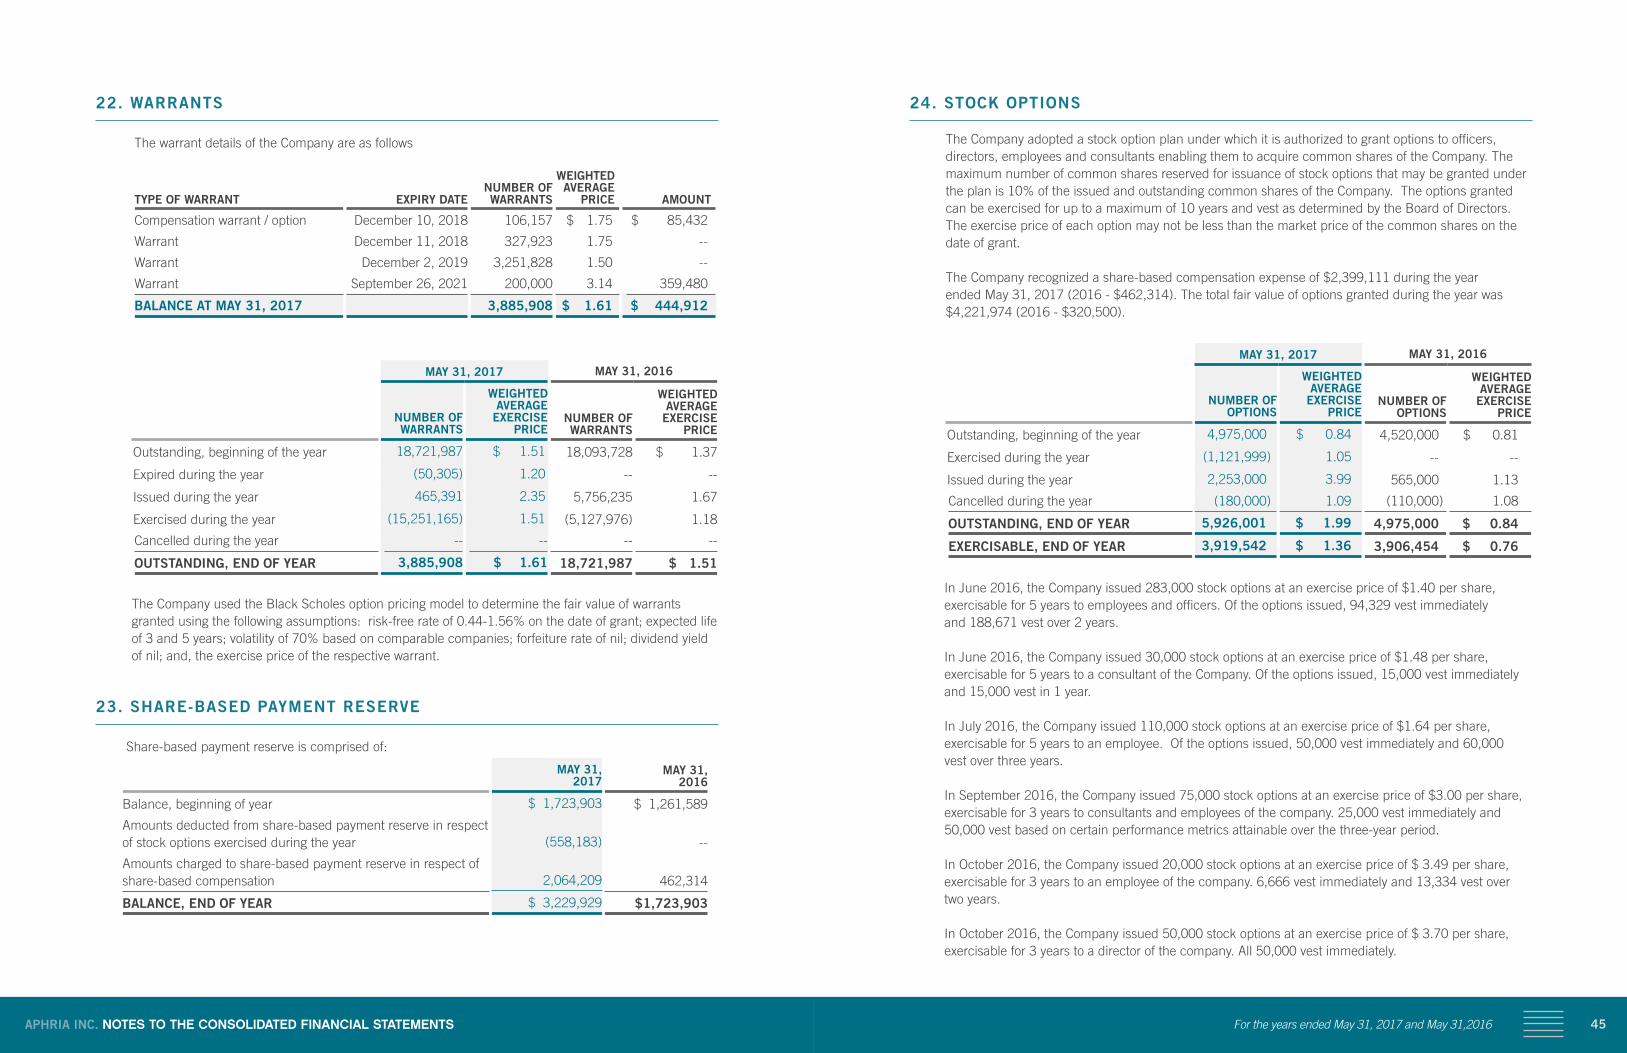
45APHRIA INC. NOTES TO THE CONSOLIDATED FINANCIAL STATEMENTS For the years ended May 31, 2017 and May 31,2016
24. STOCK OPTIONS
The Company adopted a stock option plan under which it is authorized to grant options to officers, directors, employees and consultants enabling them to acquire common shares of the Company. The maximum number of common shares reserved for issuance of stock options that may be granted under the plan is 10% of the issued and outstanding common shares of the Company. The options granted can be exercised for up to a maximum of 10 years and vest as determined by the Board of Directors. The exercise price of each option may not be less than the market price of the common shares on the date of grant.
The Company recognized a share-based compensation expense of $2,399,111 during the year ended May 31, 2017 (2016 - $462,314). The total fair value of options granted during the year was $4,221,974 (2016 - $320,500).
MAY 31, 2017 MAY 31, 2016
NUMBER OF OPTIONS
WEIGHTED AVERAGE
EXERCISE PRICE
NUMBER OF OPTIONS
WEIGHTED AVERAGE
EXERCISE PRICE
Outstanding, beginning of the year 4,975,000 $ 0.84 4,520,000 $ 0.81
Exercised during the year (1,121,999) 1.05 -- --
Issued during the year 2,253,000 3.99 565,000 1.13
Cancelled during the year (180,000) 1.09 (110,000) 1.08
OUTSTANDING, END OF YEAR 5,926,001 $ 1.99 4,975,000 $ 0.84
EXERCISABLE, END OF YEAR 3,919,542 $ 1.36 3,906,454 $ 0.76
In June 2016, the Company issued 283,000 stock options at an exercise price of $1.40 per share, exercisable for 5 years to employees and officers. Of the options issued, 94,329 vest immediately and 188,671 vest over 2 years.
In June 2016, the Company issued 30,000 stock options at an exercise price of $1.48 per share,
exercisable for 5 years to a consultant of the Company. Of the options issued, 15,000 vest immediately and 15,000 vest in 1 year.
In July 2016, the Company issued 110,000 stock options at an exercise price of $1.64 per share, exercisable for 5 years to an employee. Of the options issued, 50,000 vest immediately and 60,000 vest over three years.
In September 2016, the Company issued 75,000 stock options at an exercise price of $3.00 per share, exercisable for 3 years to consultants and employees of the company. 25,000 vest immediately and 50,000 vest based on certain performance metrics attainable over the three-year period.
In October 2016, the Company issued 20,000 stock options at an exercise price of $ 3.49 per share, exercisable for 3 years to an employee of the company. 6,666 vest immediately and 13,334 vest over two years.
In October 2016, the Company issued 50,000 stock options at an exercise price of $ 3.70 per share, exercisable for 3 years to a director of the company. All 50,000 vest immediately.
22. WARRANTS
The warrant details of the Company are as follows
TYPE OF WARRANT EXPIRY DATENUMBER OF WARRANTS
WEIGHTEDAVERAGE
PRICE AMOUNT
Compensation warrant / option December 10, 2018 106,157 $ 1.75 $ 85,432
Warrant December 11, 2018 327,923 1.75 --
Warrant December 2, 2019 3,251,828 1.50 --
Warrant September 26, 2021 200,000 3.14 359,480
BALANCE AT MAY 31, 2017 3,885,908 $ 1.61 $ 444,912
MAY 31, 2017 MAY 31, 2016
NUMBER OF WARRANTS
WEIGHTED AVERAGE
EXERCISE PRICE
NUMBER OF WARRANTS
WEIGHTED AVERAGE
EXERCISE PRICE
Outstanding, beginning of the year 18,721,987 $ 1.51 18,093,728 $ 1.37
Expired during the year (50,305) 1.20 -- --
Issued during the year 465,391 2.35 5,756,235 1.67
Exercised during the year (15,251,165) 1.51 (5,127,976) 1.18
Cancelled during the year -- -- -- --
OUTSTANDING, END OF YEAR 3,885,908 $ 1.61 18,721,987 $ 1.51
The Company used the Black Scholes option pricing model to determine the fair value of warrants
granted using the following assumptions: risk-free rate of 0.44-1.56% on the date of grant; expected life of 3 and 5 years; volatility of 70% based on comparable companies; forfeiture rate of nil; dividend yield of nil; and, the exercise price of the respective warrant.
23. SHARE-BASED PAYMENT RESERVE
Share-based payment reserve is comprised of:
MAY 31, 2017
MAY 31, 2016
Balance, beginning of year $ 1,723,903 $ 1,261,589
Amounts deducted from share-based payment reserve in respect of stock options exercised during the year (558,183) --
Amounts charged to share-based payment reserve in respect of share-based compensation 2,064,209 462,314
BALANCE, END OF YEAR $ 3,229,929 $1,723,903
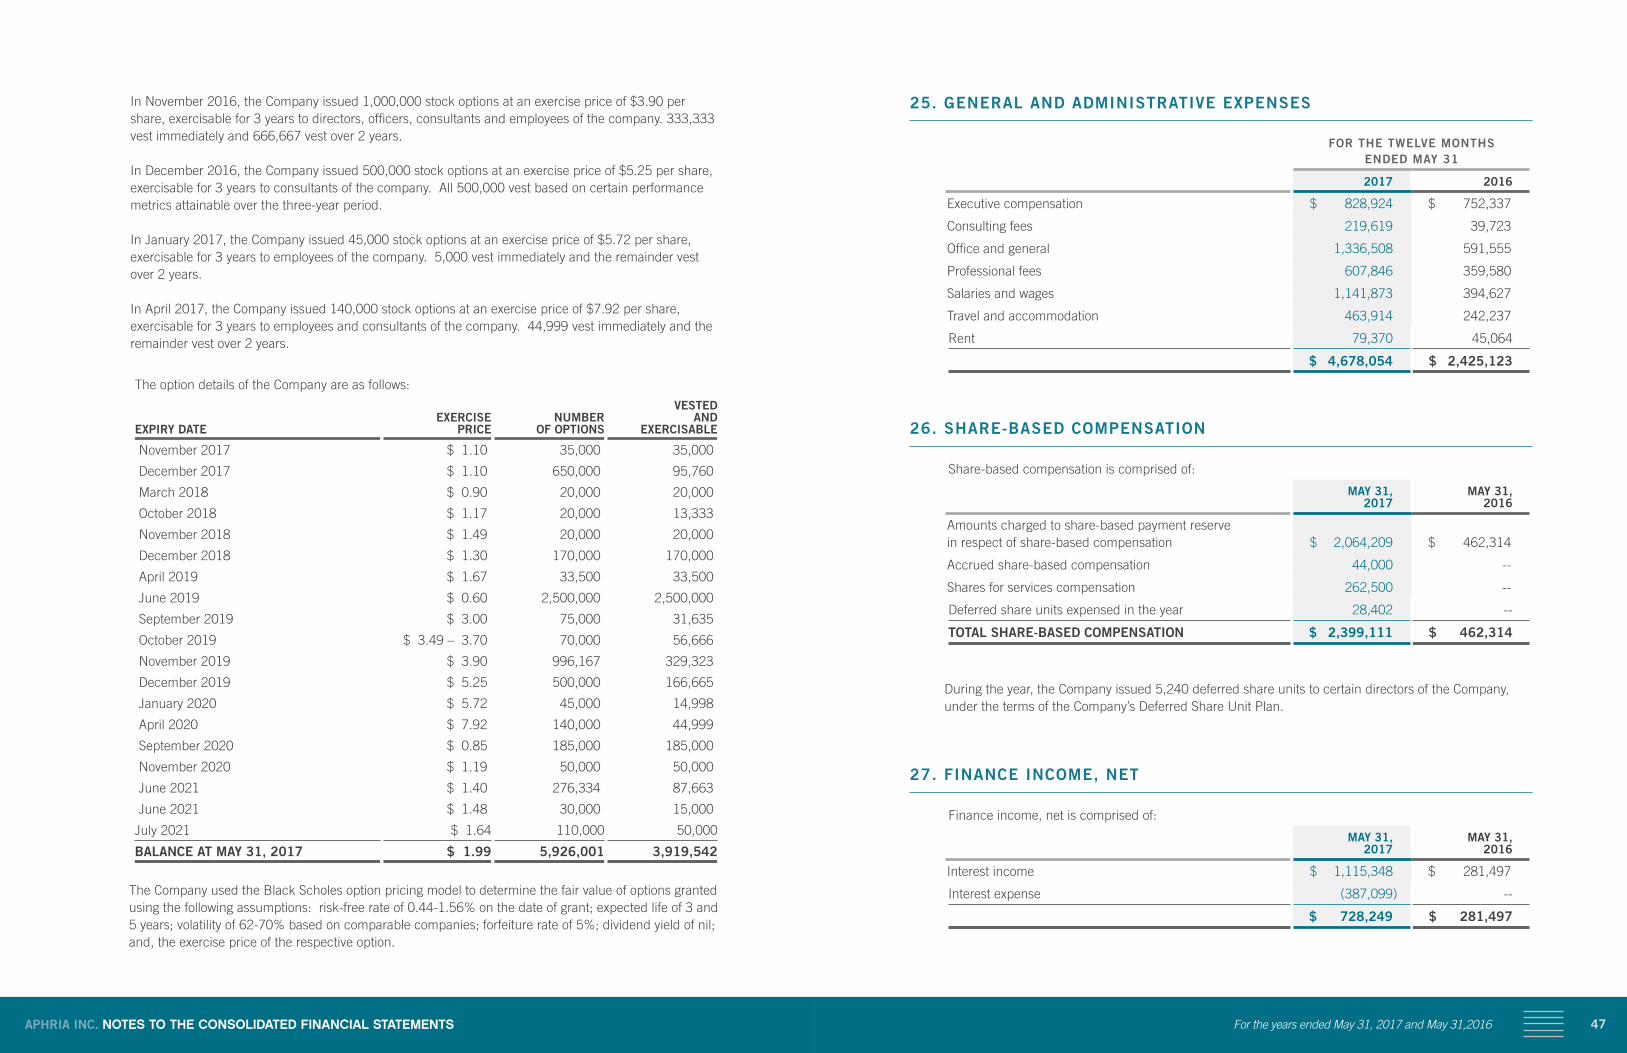
47APHRIA INC. NOTES TO THE CONSOLIDATED FINANCIAL STATEMENTS For the years ended May 31, 2017 and May 31,2016
25. GENERAL AND ADMINISTRATIVE EXPENSES
FOR THE TWELVE MONTHS ENDED MAY 31
2017 2016
Executive compensation $ 828,924 $ 752,337
Consulting fees 219,619 39,723
Office and general 1,336,508 591,555
Professional fees 607,846 359,580
Salaries and wages 1,141,873 394,627
Travel and accommodation 463,914 242,237
Rent 79,370 45,064
$ 4,678,054 $ 2,425,123
26. SHARE-BASED COMPENSATION
Share-based compensation is comprised of:
MAY 31, 2017
MAY 31, 2016
Amounts charged to share-based payment reserve in respect of share-based compensation $ 2,064,209 $ 462,314
Accrued share-based compensation 44,000 --
Shares for services compensation 262,500 --
Deferred share units expensed in the year 28,402 --
TOTAL SHARE-BASED COMPENSATION $ 2,399,111 $ 462,314
During the year, the Company issued 5,240 deferred share units to certain directors of the Company,
under the terms of the Company’s Deferred Share Unit Plan.
27. FINANCE INCOME, NET
Finance income, net is comprised of:
MAY 31, 2017
MAY 31, 2016
Interest income $ 1,115,348 $ 281,497
Interest expense (387,099) --
$ 728,249 $ 281,497
In November 2016, the Company issued 1,000,000 stock options at an exercise price of $3.90 per share, exercisable for 3 years to directors, officers, consultants and employees of the company. 333,333 vest immediately and 666,667 vest over 2 years.
In December 2016, the Company issued 500,000 stock options at an exercise price of $5.25 per share, exercisable for 3 years to consultants of the company. All 500,000 vest based on certain performance metrics attainable over the three-year period.
In January 2017, the Company issued 45,000 stock options at an exercise price of $5.72 per share, exercisable for 3 years to employees of the company. 5,000 vest immediately and the remainder vest over 2 years.
In April 2017, the Company issued 140,000 stock options at an exercise price of $7.92 per share, exercisable for 3 years to employees and consultants of the company. 44,999 vest immediately and the remainder vest over 2 years.
The option details of the Company are as follows:
EXPIRY DATEEXERCISE
PRICENUMBER
OF OPTIONS
VESTED AND
EXERCISABLE
November 2017 $ 1.10 35,000 35,000
December 2017 $ 1.10 650,000 95,760
March 2018 $ 0.90 20,000 20,000
October 2018 $ 1.17 20,000 13,333
November 2018 $ 1.49 20,000 20,000
December 2018 $ 1.30 170,000 170,000
April 2019 $ 1.67 33,500 33,500
June 2019 $ 0.60 2,500,000 2,500,000
September 2019 $ 3.00 75,000 31,635
October 2019 $ 3.49 – 3.70 70,000 56,666
November 2019 $ 3.90 996,167 329,323
December 2019 $ 5.25 500,000 166,665
January 2020 $ 5.72 45,000 14,998
April 2020 $ 7.92 140,000 44,999
September 2020 $ 0.85 185,000 185,000
November 2020 $ 1.19 50,000 50,000
June 2021 $ 1.40 276,334 87,663
June 2021 $ 1.48 30,000 15,000
July 2021 $ 1.64 110,000 50,000
BALANCE AT MAY 31, 2017 $ 1.99 5,926,001 3,919,542
The Company used the Black Scholes option pricing model to determine the fair value of options granted using the following assumptions: risk-free rate of 0.44-1.56% on the date of grant; expected life of 3 and 5 years; volatility of 62-70% based on comparable companies; forfeiture rate of 5%; dividend yield of nil; and, the exercise price of the respective option.
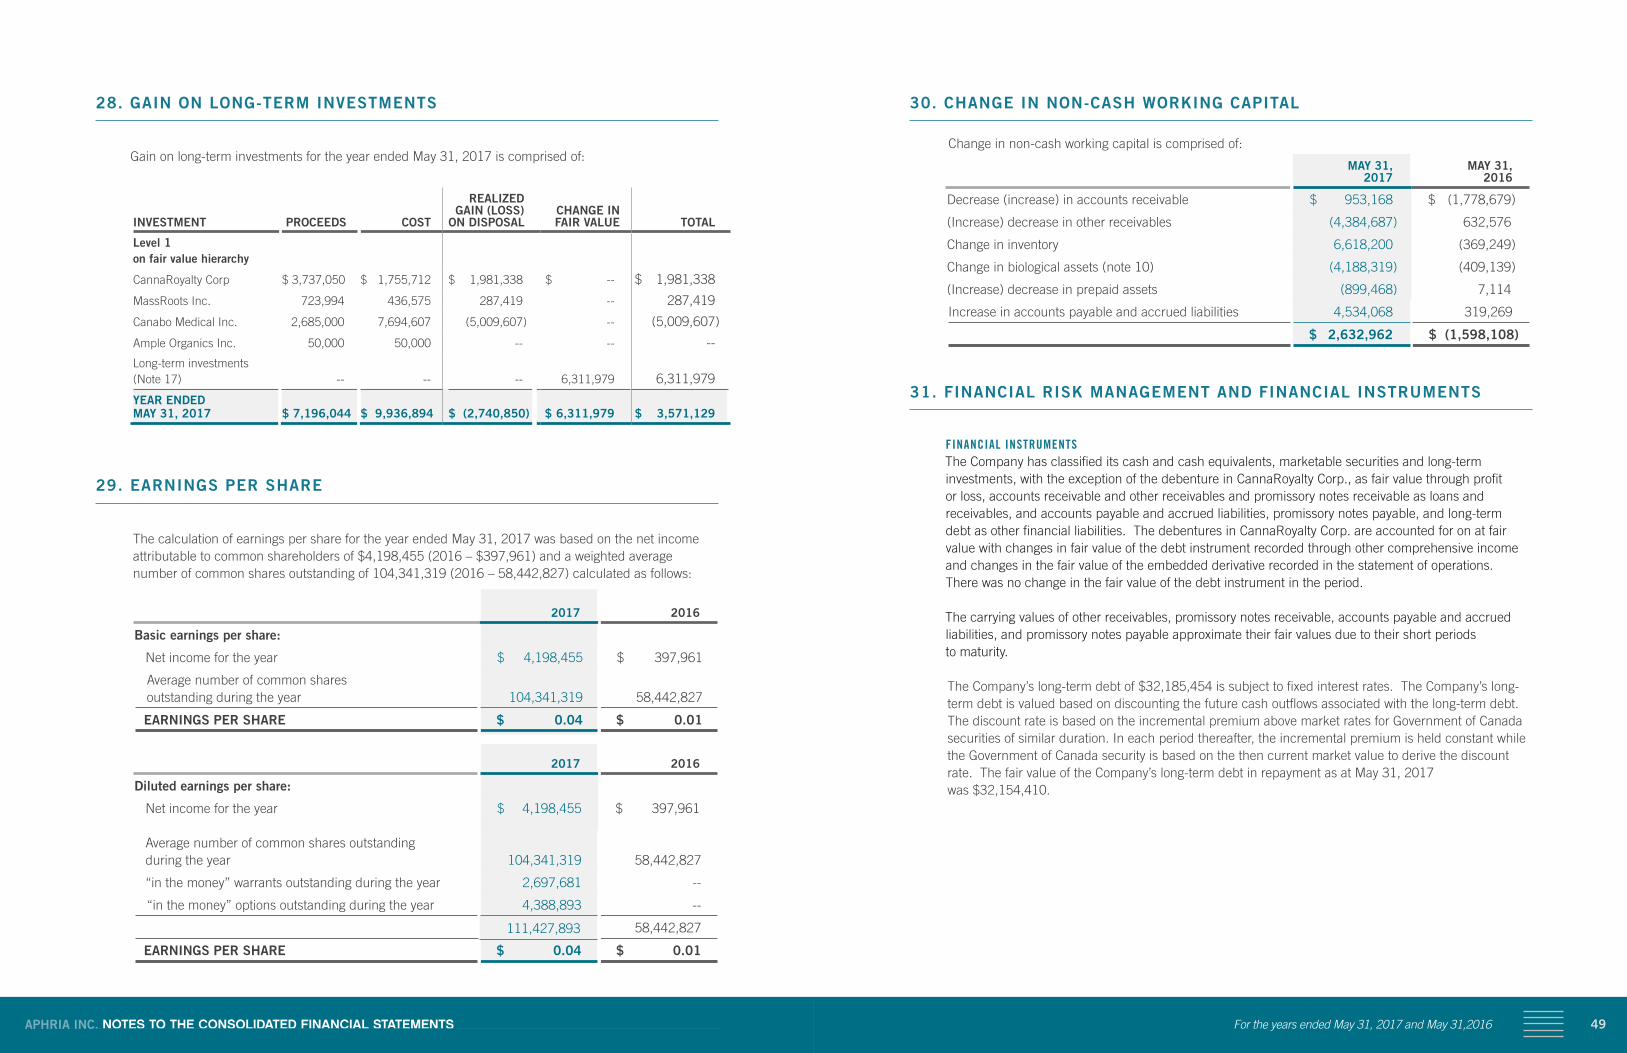
49APHRIA INC. NOTES TO THE CONSOLIDATED FINANCIAL STATEMENTS For the years ended May 31, 2017 and May 31,2016
30. CHANGE IN NON-CASH WORKING CAPITAL
Change in non-cash working capital is comprised of:
MAY 31, 2017
MAY 31, 2016
Decrease (increase) in accounts receivable $ 953,168 $ (1,778,679)
(Increase) decrease in other receivables (4,384,687) 632,576
Change in inventory 6,618,200 (369,249)
Change in biological assets (note 10) (4,188,319) (409,139)
(Increase) decrease in prepaid assets (899,468) 7,114
Increase in accounts payable and accrued liabilities 4,534,068 319,269
$ 2,632,962 $ (1,598,108)
31. FINANCIAL RISK MANAGEMENT AND FINANCIAL INSTRUMENTS
FINANCIAL INSTRUMENTSThe Company has classified its cash and cash equivalents, marketable securities and long-term investments, with the exception of the debenture in CannaRoyalty Corp., as fair value through profit or loss, accounts receivable and other receivables and promissory notes receivable as loans and receivables, and accounts payable and accrued liabilities, promissory notes payable, and long-term debt as other financial liabilities. The debentures in CannaRoyalty Corp. are accounted for on at fair value with changes in fair value of the debt instrument recorded through other comprehensive income and changes in the fair value of the embedded derivative recorded in the statement of operations. There was no change in the fair value of the debt instrument in the period.
The carrying values of other receivables, promissory notes receivable, accounts payable and accrued liabilities, and promissory notes payable approximate their fair values due to their short periods to maturity.
The Company’s long-term debt of $32,185,454 is subject to fixed interest rates. The Company’s long-term debt is valued based on discounting the future cash outflows associated with the long-term debt. The discount rate is based on the incremental premium above market rates for Government of Canada securities of similar duration. In each period thereafter, the incremental premium is held constant while the Government of Canada security is based on the then current market value to derive the discount rate. The fair value of the Company’s long-term debt in repayment as at May 31, 2017 was $32,154,410.
28. GAIN ON LONG-TERM INVESTMENTS
Gain on long-term investments for the year ended May 31, 2017 is comprised of:
INVESTMENT PROCEEDS COST
REALIZED GAIN (LOSS) ON DISPOSAL
CHANGE IN FAIR VALUE TOTAL
Level 1 on fair value hierarchy
CannaRoyalty Corp $ 3,737,050 $ 1,755,712 $ 1,981,338 $ -- $ 1,981,338
MassRoots Inc. 723,994 436,575 287,419 -- 287,419
Canabo Medical Inc. 2,685,000 7,694,607 (5,009,607) -- (5,009,607)
Ample Organics Inc. 50,000 50,000 -- -- --
Long-term investments (Note 17) -- -- -- 6,311,979 6,311,979
YEAR ENDED MAY 31, 2017 $ 7,196,044 $ 9,936,894 $ (2,740,850) $ 6,311,979 $ 3,571,129
29. EARNINGS PER SHARE
The calculation of earnings per share for the year ended May 31, 2017 was based on the net income attributable to common shareholders of $4,198,455 (2016 – $397,961) and a weighted average number of common shares outstanding of 104,341,319 (2016 – 58,442,827) calculated as follows:
2017
2016
Basic earnings per share:
Net income for the year $ 4,198,455 $ 397,961
Average number of common shares outstanding during the year 104,341,319 58,442,827
EARNINGS PER SHARE $ 0.04 $ 0.01
2017
2016
Diluted earnings per share:
Net income for the year $ 4,198,455 $ 397,961
Average number of common shares outstanding during the year 104,341,319 58,442,827
“in the money” warrants outstanding during the year 2,697,681 --
“in the money” options outstanding during the year 4,388,893 --
111,427,893 58,442,827
EARNINGS PER SHARE $ 0.04 $ 0.01
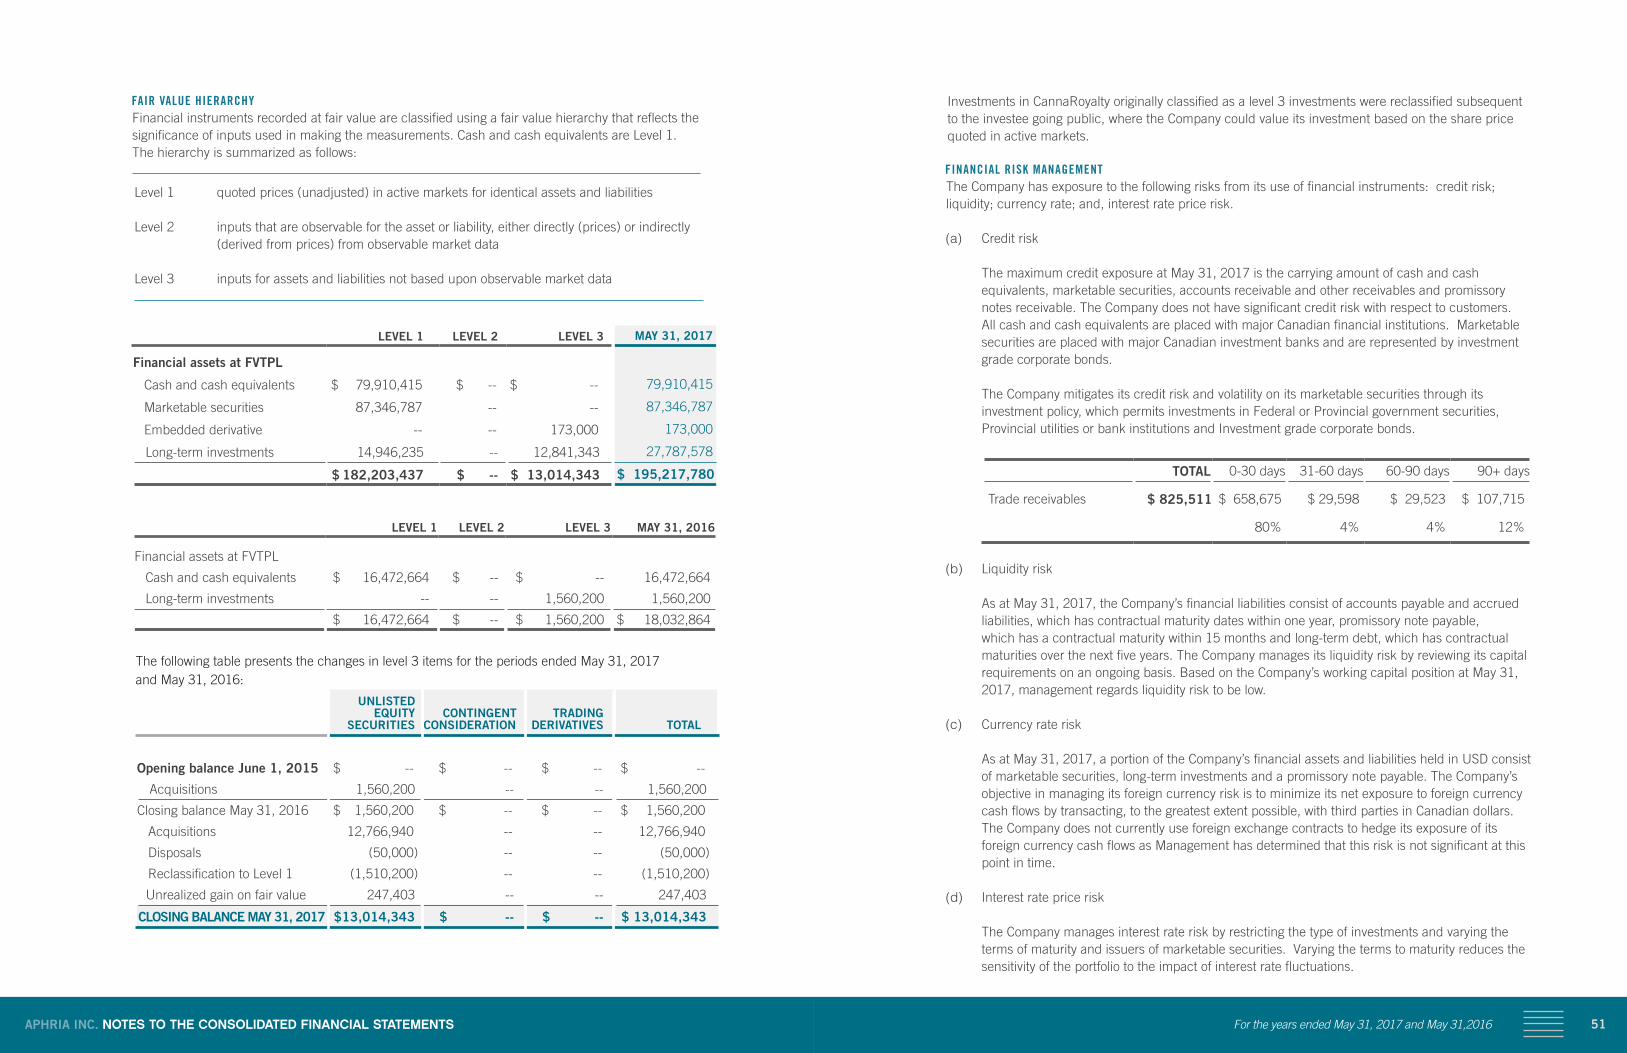
51APHRIA INC. NOTES TO THE CONSOLIDATED FINANCIAL STATEMENTS For the years ended May 31, 2017 and May 31,2016
Investments in CannaRoyalty originally classified as a level 3 investments were reclassified subsequent to the investee going public, where the Company could value its investment based on the share price quoted in active markets.
FINANCIAL RISK MANAGEMENTThe Company has exposure to the following risks from its use of financial instruments: credit risk; liquidity; currency rate; and, interest rate price risk.
(a) Credit risk
The maximum credit exposure at May 31, 2017 is the carrying amount of cash and cash equivalents, marketable securities, accounts receivable and other receivables and promissory notes receivable. The Company does not have significant credit risk with respect to customers. All cash and cash equivalents are placed with major Canadian financial institutions. Marketable securities are placed with major Canadian investment banks and are represented by investment grade corporate bonds.
The Company mitigates its credit risk and volatility on its marketable securities through its investment policy, which permits investments in Federal or Provincial government securities, Provincial utilities or bank institutions and Investment grade corporate bonds.
TOTAL 0-30 days 31-60 days 60-90 days 90+ days
Trade receivables $ 825,511 $ 658,675 $ 29,598 $ 29,523 $ 107,715
80% 4% 4% 12%
(b) Liquidity risk
As at May 31, 2017, the Company’s financial liabilities consist of accounts payable and accrued liabilities, which has contractual maturity dates within one year, promissory note payable, which has a contractual maturity within 15 months and long-term debt, which has contractual maturities over the next five years. The Company manages its liquidity risk by reviewing its capital requirements on an ongoing basis. Based on the Company’s working capital position at May 31, 2017, management regards liquidity risk to be low.
(c) Currency rate risk
As at May 31, 2017, a portion of the Company’s financial assets and liabilities held in USD consist of marketable securities, long-term investments and a promissory note payable. The Company’s objective in managing its foreign currency risk is to minimize its net exposure to foreign currency cash flows by transacting, to the greatest extent possible, with third parties in Canadian dollars. The Company does not currently use foreign exchange contracts to hedge its exposure of its foreign currency cash flows as Management has determined that this risk is not significant at this point in time.
(d) Interest rate price risk
The Company manages interest rate risk by restricting the type of investments and varying the terms of maturity and issuers of marketable securities. Varying the terms to maturity reduces the sensitivity of the portfolio to the impact of interest rate fluctuations.
FAIR VALUE HIERARCHYFinancial instruments recorded at fair value are classified using a fair value hierarchy that reflects the significance of inputs used in making the measurements. Cash and cash equivalents are Level 1. The hierarchy is summarized as follows:
Level 1 quoted prices (unadjusted) in active markets for identical assets and liabilities
Level 2 inputs that are observable for the asset or liability, either directly (prices) or indirectly (derived from prices) from observable market data
Level 3 inputs for assets and liabilities not based upon observable market data
LEVEL 1 LEVEL 2 LEVEL 3 MAY 31, 2017
Financial assets at FVTPL
Cash and cash equivalents $ 79,910,415 $ -- $ -- 79,910,415
Marketable securities 87,346,787 -- -- 87,346,787
Embedded derivative -- -- 173,000 173,000
Long-term investments 14,946,235 -- 12,841,343 27,787,578
$ 182,203,437 $ -- $ 13,014,343 $ 195,217,780
LEVEL 1 LEVEL 2 LEVEL 3 MAY 31, 2016
Financial assets at FVTPL
Cash and cash equivalents $ 16,472,664 $ -- $ -- 16,472,664
Long-term investments -- -- 1,560,200 1,560,200
$ 16,472,664 $ -- $ 1,560,200 $ 18,032,864
The following table presents the changes in level 3 items for the periods ended May 31, 2017 and May 31, 2016:
UNLISTED EQUITY SECURITIES
CONTINGENT CONSIDERATION
TRADING DERIVATIVES TOTAL
Opening balance June 1, 2015 $ -- $ -- $ -- $ --
Acquisitions 1,560,200 -- -- 1,560,200
Closing balance May 31, 2016 $ 1,560,200 $ -- $ -- $ 1,560,200
Acquisitions 12,766,940 -- -- 12,766,940
Disposals (50,000) -- -- (50,000)
Reclassification to Level 1 (1,510,200) -- -- (1,510,200)
Unrealized gain on fair value 247,403 -- -- 247,403
CLOSING BALANCE MAY 31, 2017 $ 13,014,343 $ -- $ -- $ 13,014,343
53APHRIA INC. NOTES TO THE CONSOLIDATED FINANCIAL STATEMENTS For the years ended May 31, 2017 and May 31,2016
33. SUBSEQUENT EVENTS
On June 1, 2017, the Company’s subsidiary, CannWay was amalgamated with Pure Natures Wellness Inc. (o/a Aphria).
On June 22, 2017, the Company purchased land and buildings from a third party for approximately $500,000.
On June 28, 2017, the Company entered into a subscription agreement with Tokyo Smoke for the purchase of 140,845 common shares, for a total cost of $1,000,000.
(e) Capital management
The Company’s objectives when managing its capital are to safeguard its ability to continue as a going concern, to meet its capital expenditures for its continued operations, and to maintain a flexible capital structure which optimizes the cost of capital within a framework of acceptable risk. The Company manages its capital structure and adjusts it in light of changes in economic conditions and the risk characteristics of the underlying assets. To maintain or adjust its capital structure, the Company may issue new shares, issue new debt, or acquire or dispose of assets. The Company is not subject to externally imposed capital requirements.
Management reviews its capital management approach on an ongoing basis and believes that this approach, given the relative size of the Company, is reasonable. There have been no changes to the Company’s capital management approach in the year. The Company considers its cash and cash equivalents and marketable securities as capital.
32. COMMITMENTS
The Company has a lease commitment until December 31, 2018 for rental of office space from a related party. The Company has an option to extend this lease for two additional 5 year periods. In July of 2016, the Company terminated its lease of greenhouse and warehouse property in conjunction with the acquisition of the 265 Talbot Street West property. The Company has a lease commitments for the use of two motor vehicles expiring September 2019 and August 2020 in the amounts payable of $9,313 and $19,599, respectively, annually and leased office space in Toronto for $4,500 per month until September 2017. In April of 2017, the Company indemnified the landlord of the office space leased by DFMMJ Investments, Ltd. at 35 McCaul Street, Toronto. As discussed in note 17, the Company has agreed to contribute an additional $1,700,000 to Green Acre Capital Fund. Minimum payments payable over the next five years are as follows:
FISCAL YEAR ENDING MAY 31,
2018 $ 8,884,858
2019 13,341,325
2020 21,927
2021 3,267
2022 --
$ 22,251,377
The Company has purchase orders outstanding at May 31, 2017 related to capital asset expansion of $20,398,567.