Embed Size (px)
Citation preview
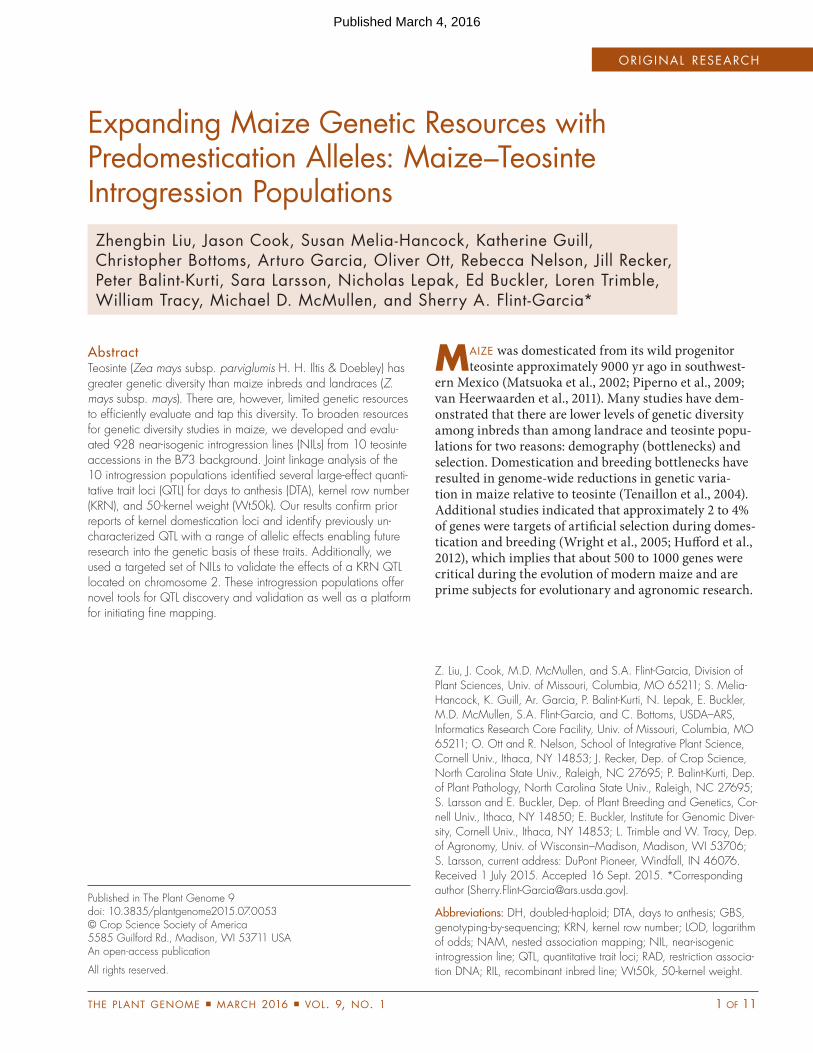
the plant genome march 2016 vol. 9, no. 1 1 of 11
original research
Expanding Maize Genetic Resources with Predomestication Alleles: Maize–Teosinte Introgression PopulationsZhengbin Liu, Jason Cook, Susan Melia-Hancock, Katherine Guill, Christopher Bottoms, Arturo Garcia, Oliver Ott, Rebecca Nelson, Jill Recker, Peter Balint-Kurti, Sara Larsson, Nicholas Lepak, Ed Buckler, Loren Trimble, William Tracy, Michael D. McMullen, and Sherry A. Flint-Garcia*
AbstractTeosinte (Zea mays subsp. parviglumis H. H. Iltis & Doebley) has greater genetic diversity than maize inbreds and landraces (Z. mays subsp. mays). There are, however, limited genetic resources to efficiently evaluate and tap this diversity. To broaden resources for genetic diversity studies in maize, we developed and evalu-ated 928 near-isogenic introgression lines (NILs) from 10 teosinte accessions in the B73 background. Joint linkage analysis of the 10 introgression populations identified several large-effect quanti-tative trait loci (QTL) for days to anthesis (DTA), kernel row number (KRN), and 50-kernel weight (Wt50k). Our results confirm prior reports of kernel domestication loci and identify previously un-characterized QTL with a range of allelic effects enabling future research into the genetic basis of these traits. Additionally, we used a targeted set of NILs to validate the effects of a KRN QTL located on chromosome 2. These introgression populations offer novel tools for QTL discovery and validation as well as a platform for initiating fine mapping.
Maize was domesticated from its wild progenitor teosinte approximately 9000 yr ago in southwest-
ern Mexico (Matsuoka et al., 2002; Piperno et al., 2009; van Heerwaarden et al., 2011). Many studies have dem-onstrated that there are lower levels of genetic diversity among inbreds than among landrace and teosinte popu-lations for two reasons: demography (bottlenecks) and selection. Domestication and breeding bottlenecks have resulted in genome-wide reductions in genetic varia-tion in maize relative to teosinte (Tenaillon et al., 2004). Additional studies indicated that approximately 2 to 4% of genes were targets of artificial selection during domes-tication and breeding (Wright et al., 2005; Hufford et al., 2012), which implies that about 500 to 1000 genes were critical during the evolution of modern maize and are prime subjects for evolutionary and agronomic research.
Published in The Plant Genome 9 doi: 10.3835/plantgenome2015.07.0053 © Crop Science Society of America 5585 Guilford Rd., Madison, WI 53711 USA An open-access publication
All rights reserved.
Z. Liu, J. Cook, M.D. McMullen, and S.A. Flint-Garcia, Division of Plant Sciences, Univ. of Missouri, Columbia, MO 65211; S. Melia-Hancock, K. Guill, Ar. Garcia, P. Balint-Kurti, N. Lepak, E. Buckler, M.D. McMullen, S.A. Flint-Garcia, and C. Bottoms, USDA–ARS, Informatics Research Core Facility, Univ. of Missouri, Columbia, MO 65211; O. Ott and R. Nelson, School of Integrative Plant Science, Cornell Univ., Ithaca, NY 14853; J. Recker, Dep. of Crop Science, North Carolina State Univ., Raleigh, NC 27695; P. Balint-Kurti, Dep. of Plant Pathology, North Carolina State Univ., Raleigh, NC 27695; S. Larsson and E. Buckler, Dep. of Plant Breeding and Genetics, Cor-nell Univ., Ithaca, NY 14850; E. Buckler, Institute for Genomic Diver-sity, Cornell Univ., Ithaca, NY 14853; L. Trimble and W. Tracy, Dep. of Agronomy, Univ. of Wisconsin–Madison, Madison, WI 53706; S. Larsson, current address: DuPont Pioneer, Windfall, IN 46076. Received 1 July 2015. Accepted 16 Sept. 2015. *Corresponding author ([email protected]).
Abbreviations: DH, doubled-haploid; DTA, days to anthesis; GBS, genotyping-by-sequencing; KRN, kernel row number; LOD, logarithm of odds; NAM, nested association mapping; NIL, near-isogenic introgression line; QTL, quantitative trait loci; RAD, restriction associa-tion DNA; RIL, recombinant inbred line; Wt50k, 50-kernel weight.
Published March 4, 2016
2 of 11 the plant genome march 2016 vol. 9, no. 1
Large differences in plant morphology between maize and teosinte make phenotypic comparisons difficult. Unde-sirable traits in teosinte, such as photoperiod sensitivity, may even mask the useful traits such as disease resistance. On the other hand, selected (domestication and breeding) genes cannot be detected in standard biparental (inbred inbred) QTL experiments because modern maize will contain only the selected alleles. Introgression lines or NILs carrying teosinte genomic segments are appropriate tools for evaluating the potential of teosinte alleles to comple-ment the allelic diversity of cultivated maize.
Near-isogenic lines have been used to identify and fine map QTL in several plant species including maize (Graham et al., 1997; Szalma et al., 2007), rice (Oryza sativa L.) (Yu et al., 1991; Tian et al., 2006), soybean [Glycine max (L.) Merr.] (Muehlbauer et al., 1991; Jiang et al., 2009), and tomato (Solanum lycopersicum L.) (Eshed and Zamir, 1995; Frary et al., 2000; Brouwer and St Clair, 2004). Although NIL-based QTL populations have less statistical power for initial QTL identification than recombinant inbred line (RIL) populations of equal size (Kaeppler, 1997), NILs may offer more accurate QTL effect estimates than RILs when several QTL are segre-gating within the population. This is because phenotypic differences between the recurrent parent and NILs are caused by allelic differences only at the introgressed tar-get loci, which make up only a small proportion of the genome. Homogenizing the genetic background elimi-nates epistatic interactions between QTL, which may occur in typical RIL populations. Near-isogenic lines have the additional advantage of being a ready platform for fine mapping the detected QTL.
Photoperiod sensitivity, ear morphology, and ker-nel traits are among the most distinguishing characters between maize and teosinte (Iltis, 2000). The ear and kernel traits are so important that they have been manipulated for thousands of years in agrarian societies. This is due to the fact that yield is determined, in large part, by kernel traits such as kernel number and kernel weight. In maize, kernel number is mainly determined by KRN and ear length, while kernel weight depends on kernel size and shape as well as composition. Kernel row number, or rank number, is dramatically different between maize and teosinte. Vari-ous genetic studies have investigated KRN because it is a domestication trait and has a high heritability, making this trait amenable to genetic analysis (Emerson and Smith, 1950; Doebley and Stec, 1991; Brown et al., 2011).
To examine a broad range of genetic diversity for maize and shed light on the genetic basis of agronomic and domestication traits, we developed NILs from 10 teo-sinte accessions in the B73 background. We first demon-strate the utility of these NIL populations to detect genet-ically-determined variation for flowering time, a trait that has been studied extensively in diverse maize germplasm. We then explore the genetic architecture of traits specifi-cally targeted by domestication such as kernel row number and kernel weight. Finally, we use the NILs to conduct a QTL validation trial for a major KRN QTL.
Materials and Methods
Genetic MaterialsThe inbred line B73 was crossed as the female parent with pollen from 10 teosinte accessions acquired from the North Central Region Plant Introduction Station (Table 1). The teosinte accessions were open-pollinated, geographi-cally distinct collections made between 1967 and 1983 in Mexico (nine accessions from Guerrero and one from Jalisco). More information can be obtained by search-ing for the accession names in the Germplasm Resources Information Network (http://www.ars-grin.gov).
Pollen from a single F1 plant from each accession was crossed onto B73, yielding the backcross-1 (BC1) generation. Backcrossing continued to the BC4 stage before self-pollinating two generations to yield BC4S2 families, which were subsequently sib-mated to increase seed. One of the BC4 populations (Z031) was also inbred via a proprietary (AgReliant Genetics) doubled-haploid (DH) system in addition to inbreeding by self-pollination using the exact same set of BC4 families. Briefly, BC4 plants were pollinated with pollen from a haploid inducer line, which results in 10 to 15% of the progeny kernels being haploid (i.e., the male inducer chromosomes are excluded). The haploid seeds are identified (e.g., using a kernel color marker), germinated, and exposed to a chemical that causes chromosome doubling, resulting in diploids that are completely homozygous.
The NILs were given a ZxxxExxxx name designation following the protocol used for the nested association mapping (NAM) population (McMullen et al., 2009) where the Zxxx represents the population and Exxxx represents the entry within the population. In the Z031 population, the BC4S2 entries are numbered E0001 to E0087, while the BC4DH entries are numbered E0501 to E0595. In this study, we report the phenotypic and genetic analysis of these BC4S2 materials. However, to release a more stable public resource, the BC4S2 lines were self-pollinated two additional generations to increase homozygosity, yielding BC4S4 lines that were sib-mated for seed increase. The S4 entries retained their relationships to the S2 entries by adding 1000 to the entry number (e.g., Z031E0001 became Z031E1001), while the DH entries retained their original entry numbers as they were already completely inbred. Seed of the BC4S4 and BC4DH lines are available from the Maize Genetics Stock Center.
Field Trials and Data CollectionField trials were conducted in Aurora, NY, in 2008; Raleigh, NC, Andrews, NC, and two locations near Columbia, MO, in 2009; and St. Paul, MN, Madison, WI, Aurora, NY, Clayton, NC, Andrews, NC, and Columbia, MO, in 2010. The experiments consisted of 60 lines sam-pled from each of five populations in 2008, 694 lines from eight populations in 2009, and 858 lines from 10 popula-tions in 2010. In all locations, the plants were planted in single-row plots in a randomized complete block design with two replicates (except Madison, WI, and St. Paul, MN,
liu et al.: teosinte introgression populations 3 of 11
in 2010 with one replicate each) where lines were random-ized within population and populations within replicate. B73 check entries were added once every 10 to 20 entries.
The KRN QTL on chromosome 2 was selected as an example to perform a validation experiment. Two lines in each family, including one QTL-containing line and one randomly chosen line as a family control, were grown at four different locations (two Missouri locations and North Carolina and New York) in summer 2012. Each location had five replications with B73 as an experimental control. In winter 2012, five replications of a similar set of materials were grown in Puerto Rico to examine photoperiod effects on KRN.
Three maize–teosinte NILs carrying residual heterozygosity around the target-gene region from different families were selected and self-pollinated to create F2 populations to fine map the chromosome 2 KRN QTL. Within each F2–derived family, progeny were screened to identify recombinants. Each recombinant was self-pollinated again to create homozygous recombinant and nonrecombinant lines for the phenotypic analysis. Paired homozygous recombinant and nonrecombinant line families were evaluated for KRN in Puerto Rico in winter 2012 and 2013, and Columbia, MO, in summer 2013. Significant differences were identified with t-tests.
The trait DTA was measured as the number of days from planting to the initiation of pollen shed for half the plants within a plot. Kernel row number and Wt50k were obtained from three ears per plot.
Genotyping and Genetic Linkage MapA bulk of leaf tissue was harvested from up to 10 plants of each BC4 line and total genomic DNA was extracted with Qiagen 96 Plant Kit. All lines were genotyped using the Illumina 768-SNP chip via a GoldenGate assay (Illu-mina). The 728 SNPs were chosen from the 1106 NAM markers (McMullen et al., 2009) based on polymorphism between B73 and the teosinte parents, with an average of 553 SNPs per population. The BC4 population structure
we employed does not allow for the de novo genetic map construction, as there are simply not enough lines carry-ing overlapping introgressions in a given region to place markers in the appropriate order and accurately estimate genetic distances. Instead, we used the NAM genetic map (McMullen et al., 2009) as a framework for marker order.
Single nucleotide polymorphism genotypes were converted to 0, 1, and 2, which represent homozygous B73, heterozygous, and homozygous teosinte, respectively. Because our QTL mapping procedure does not allow missing data, missing genotypic data (primarily monomorphic markers in specific populations) were imputed based on flanking marker data. For example, when flanking markers were 2 (homozygous teosinte), the missing data were converted to 2. When the two flanking markers were 0 (homozygous B73) and 2 (homozygous for the teosinte allele), the missing data in between were converted to 1 (heterozygous). When the flanking markers were 0 and 1, the missing data were converted to the intermediate value of 0.5.
The advanced stocks (BC4S4 and BC4DH NILs) that are available from the Maize Genetics Stock Center were genotyped at higher density via both genotyping-by-sequencing (GBS) (Elshire et al., 2011) and restriction association DNA (RAD) (Poland et al., 2012). Genotyping-by-sequencing was conducted at the Cornell University Genomic Diversity Facility where the standard maize protocol was employed (Elshire et al., 2011). Briefly, the protocol used the ApeKI restriction enzyme, which cuts more frequently and results in a very large number of sites but a high proportion of missing data. The samples were sequenced at 384-plex on an Illumina HiSeq machine (Illumina), and reads were processed using version 2.4 of the AllZea GBS build.
The RAD protocol was performed at the University of Missouri using a combination of the rare-cutting restriction enzyme PstI and a common-cutting enzyme Msp1 following the protocol of Poland et al. (2012). This protocol results in fewer sites being surveyed but little missing data and more accurate calls for heterozygous
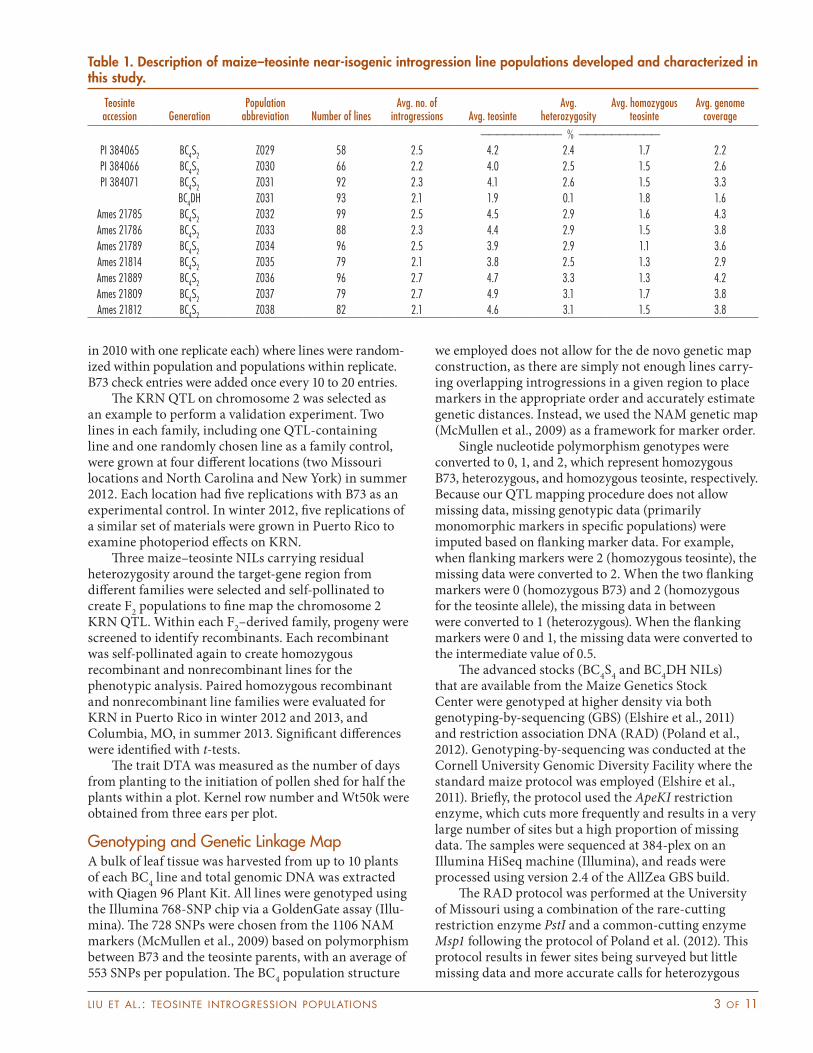
Table 1. Description of maize–teosinte near-isogenic introgression line populations developed and characterized in this study.
Teosinte accession Generation
Population abbreviation Number of lines
Avg. no. of introgressions Avg. teosinte
Avg. heterozygosity
Avg. homozygous teosinte
Avg. genome coverage
—————————— % —————————— PI 384065 BC4S2 Z029 58 2.5 4.2 2.4 1.7 2.2PI 384066 BC4S2 Z030 66 2.2 4.0 2.5 1.5 2.6PI 384071 BC4S2 Z031 92 2.3 4.1 2.6 1.5 3.3
BC4DH Z031 93 2.1 1.9 0.1 1.8 1.6Ames 21785 BC4S2 Z032 99 2.5 4.5 2.9 1.6 4.3Ames 21786 BC4S2 Z033 88 2.3 4.4 2.9 1.5 3.8Ames 21789 BC4S2 Z034 96 2.5 3.9 2.9 1.1 3.6Ames 21814 BC4S2 Z035 79 2.1 3.8 2.5 1.3 2.9Ames 21889 BC4S2 Z036 96 2.7 4.7 3.3 1.3 4.2Ames 21809 BC4S2 Z037 79 2.7 4.9 3.1 1.7 3.8Ames 21812 BC4S2 Z038 82 2.1 4.6 3.1 1.5 3.8
4 of 11 the plant genome march 2016 vol. 9, no. 1
sites. Briefly, DNA from 384 tissue samples was doubly digested and a unique barcode adapter was ligated to each. Ligated products were pooled in four groups of 96 and amplified with 13 cycles of polymerase chain reaction. Equimolar ratios of the four groups were loaded to a single lane of an Illumina flowcell, followed by sequencing on an Illumina HiSeq2000 at the University of Missouri DNA Core Facility. Restriction association DNA data were processed using the TASSEL GBS pipeline (Bradbury et al., 2007), and Burrows–Wheeler alignment (Li and Durbin, 2009) was used to align reads against the B73 genome (RefGen v2). For both GBS and RAD, the SNP calls were converted to a, b, and h representing B73, teosinte, and heterozygous calls, respectively. Genotype data for the advanced materials and the scripts used to process the RAD data are available from the Panzea website (www.panzea.org).
Statistical AnalysisDescriptive statistics analysis and normality tests on the quantitative data were performed by SAS software (SAS 9.2; SAS Institute, 2008). Heritability was calculated using a mixed model with environment, replicates within environment, and entry (NILs) as random effects (Hol-land et al., 2003) in SAS (SAS Institute, 2008). The same model was used to calculate least square means across environments, which were subsequently used as the phe-notypes for QTL mapping.
Joint Linkage MappingLeast square means across environments were used in joint linkage QTL analysis. Joint linkage models were developed in SAS using a stepwise selection procedure in PROC GLMSELECT as previously described (Buckler et al., 2009; Tian et al., 2011). Briefly, a stepwise regression model was used to fit the population term and mark-ers nested within population. This nesting of markers within population allows each population to have its own allele; this is more realistic than assuming that all teosinte accessions carry the same allele. Where an indi-vidual population lacked an introgression covering the test SNP, no test was conducted for that population. The significance level for entry in and exit out of the model was determined by 1000 permutations. PROC GLM was used to fit an additive model, where the allelic effects were considered fixed effects. Significant alleles were determined by a t-test comparison of the parental means vs. the control B73 allele. The QTL support intervals were calculated by adding a single flanking marker for the QTL at a step of 0.1 cM to the full model and testing the significance at the p = 0.05 level.
Results
Population Development and Marker Characterization of IntrogressionsWe developed 10 NIL populations derived from geographi-cally diverse teosinte accessions by backcrossing 10 acces-sions into the B73 background for four generations before inbreeding. In total, 928 BC4–derived NILs were produced, with 58 to 185 lines per population (Table 1). Evaluation of BC4S2 lines is described in this study. Seed of the more advanced generations (BC4S4 and BC4DH) of the teosinte NILs are available from the Maize Genetics Stock Center.
A total of 728 SNP markers were used to genotype the BC4S2 and BC4DH lines (Supplemental Table S1). Because genetic maps cannot be accurately constructed from a BC4 population structure, we used the NAM genetic map (McMullen et al., 2009) to assign chromosome positions to the introgressions. In order to investigate potential problems with using the NAM marker framework, we compared a (W22 parviglumis)BC2S3 genetic map (N = 294 SNPs; Briggs et al., 2007) to our 728-SNP subset of the NAM map. Of the 113 SNPs in common to both maps, all markers mapped to the same chromosome and in the same order on the (W22 parviglumis)BC2S3 and NAM maps; only genetic distance varied, as was expected for different populations and population structures. Thus, any structural variation (inversions and translocations) between NAM and the teosinte NIL founders should be minimal in our population and not hinder our QTL analysis, especially as we are not conducting interval QTL mapping in the current study. Interestingly, we did observe recombination events in the Z034, Z035, Z036, and Z038, populations in the 50-Mb region of chromosome 1 (65–115 Mb; B73, RefGen v2) that contains an inversion, which occurs at high frequency in parviglumis but which is nearly absent in modern maize (Fang et al., 2012). For the other six populations, we had too few individuals and hence too few recombination events to thoroughly investigate the possibility of inversions in this region.
Each NIL contained an average of 2.4 chromosomal segments encompassing about 4% of the teosinte genome. The genotypic ratios for the BC4S2 populations were 95.9% homozygous B73, 2.6% heterozygous, and 1.5% homozygous teosinte, which is very similar to the expected ratios of 95, 3, and 1.5%, respectively.
Introgression coverage across the genome averaged 3.3 across populations. There were many genomic regions with no coverage in specific populations (colored in red on Supplemental Figure S1), with cold spots on the short arms of chromosomes 1 and 4, the long arm of chromosome 3, and the centromeric regions of chromosome 6, 8, and 10. However, teosinte introgressions were present in at least some of the populations for all loci yielding multiple teosinte alleles for all genes. The same set of BC4 families from the PI 384071 (Z031) population was inbred using DH technology and two generations of
liu et al.: teosinte introgression populations 5 of 11
self-pollination. Comparison of the self-pollination and DH methodologies in the PI 384071 population (Z031) showed that less teosinte genome was maintained in the DH population (Table 1; Supplemental Figure S1).
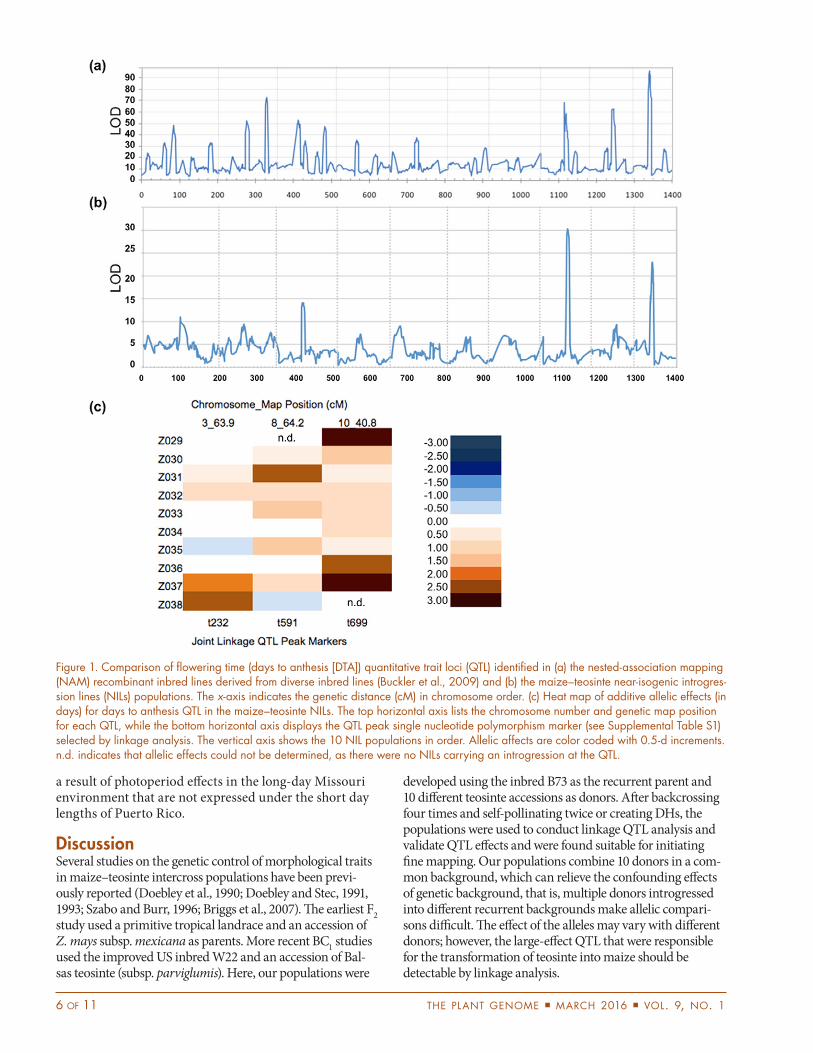
Quantitative Trait Loci Analysis of Days to AnthesisTo demonstrate the robustness of the teosinte NILs for QTL mapping, we used DTA as an example trait as it is well studied in NAM (Buckler et al., 2009). Broad-sense heritability for DTA was 0.76 (Table 2). We identified three QTL for DTA (Fig. 1b; Supplemental Table S2), with the two primary QTL residing on chromosomes 8 and 10, which overlap with the known flowering and photo-period genes vgt1, rap2.7, and ZCN8, and ZmCCT, respec-tively (Salvi et al., 2007; Chardon et al., 2005; Bouchet et al., 2013; Hung et al., 2012). We were unable to estimate the effects of two alleles: Z029 for chromosome 8 and Z038 for chromosome 10. Of the remaining 28 alleles, 14 significantly delayed flowering time, and none decreased flowering time. Together, these three QTL accounted for 25.3% of the phenotypic variation.
The peak of our chromosome 8 DTA QTL (119,832,558 bp) was physically closer to ZCN8 (123,501,085–123,502,873 bp) than the other loci (rap2.7, 132,044,001–132,047,428 bp or vgt1, 132,473,577–132,963,880 bp). To investigate this region more closely, we conducted deeper genotyping via GBS (Elshire et al., 2011) and RAD (Poland et al., 2012) for four BC4DH lines from the Z031 population with teosinte introgressions in this region. The region of interest (112,088,008–135,957,479 bp; B73, RefGen v2) contained nine SNP calls from the original GoldenGate assay, 119 to 153 SNP calls from RAD, and 518 to 753 SNP calls from GBS (Supplemental Table S3). Interestingly, there were no SNPs within ZCN8 from any of the genotyping assays, similar to what was reported in Bouchet et al. (2013). Among the four DH, there were two unique recombination events that separated ZCN8 from rap2.7 and vgt1 (Supplemental Table S3). Of the four NILs, two that were significantly later flowering than B73 carried introgressions including ZCN8 but not rap2.7 or vgt1, strongly suggesting that ZCN8 is the more likely candidate for the Z031 allele.
Quantitative Trait Loci Analysis of Kernel Row Number and Kernel WeightWe used the teosinte NILs to explore the genetic architec-ture of two traits known to be targeted during domestica-tion: KRN and kernel weight. Heritability for these traits
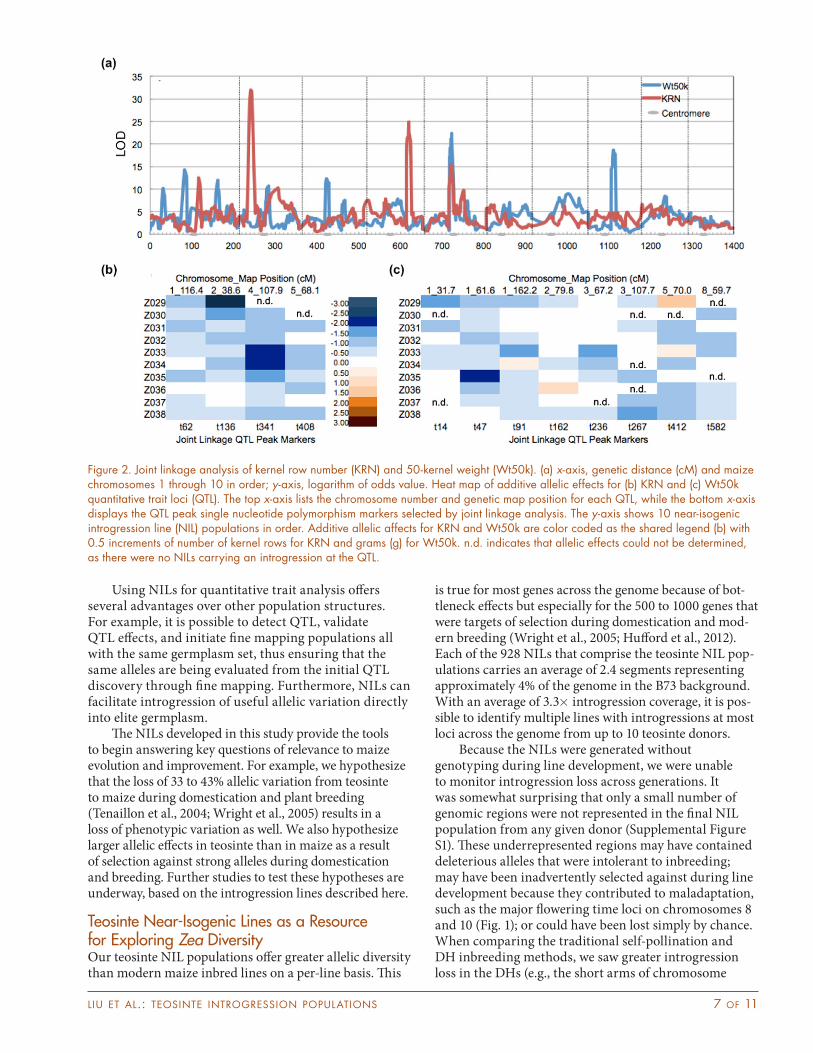
ranged from 0.87 to 0.88 (Table 2). We identified four QTL for KRN located on chromosomes 1, 2, 4, and 5, which accounted for 33.7% of the phenotypic variation (Fig. 2). The two QTL with the highest logarithm of odds (LOD) scores on chromosomes 2 and 4 were reported in previ-ous studies (Doebley et al., 1990; Doebley and Stec, 1991; Brown et al., 2011). We were unable to calculate the effect of two alleles (Z029 allele for chromosome 4, and Z030 allele for chromosome 5) because of lack of introgression of those donors in the QTL region. Of the 38 remaining alleles, 27 alleles (71%) significantly decreased KRN, and no alleles increased KRN (Supplemental Table S4).
For Wt50k, we identified eight QTL for kernel weight (Fig. 2a, 2c) located on chromosomes 1 (three QTL), 2, 3 (two QTL), 5, and 8, which accounted for 38.2% of the phenotypic variation. Several of the QTL overlapped with those observed in NAM (Hirsch et al., 2014), with the exception of the QTL on chromosomes 2, 3, and 8. We were unable to calculate the effect of nine alleles because of lack of introgression in the QTL region. Of the remaining 71 alleles, 30 alleles significantly decreased Wt50k, while one allele (Z036 allele for chromosome 2) significantly increased seed weight (Supplemental Table S4).
Validation of Kernel Row Number Quantitative Trait LociTo examine the accuracy of QTL results and as a prelude to fine mapping, we performed a validation of the KRN QTL on chromosome 2. Lines containing the teosinte allele (TT/TB, homozygous teosinte and heterozygous teosinte–B73, respectively) of the QTL were compared with B73 and family control lines. The KRN for lines containing the QTL ranged from 11.2 to 17.0 in the summer 2012, while the KRN value for B73 was 16.1 (Supplemental Table S5–S7). Of the 15 lines carrying chromosome 2 introgressions in the validation study, 14 were confirmed to have a reduction in or the same KRN in accordance with the estimated allelic effects from the original QTL analysis. For example, the estimated addi-tive allelic effect for the Z030 allele was −1.8, therefore the expected KRN of Z030E0046 (TT) should be 12.5. We observed a KRN of 13.44 in the 2012 summer valida-tion experiment, which was significantly less than B73 (p = 1.2E-11). The allelic effect in the Z037 population indicated a weak positive allele, which was confirmed by inconsistent small increases or decreases in KRN. These results were also confirmed in the winter 2012 experiment grown under short days and in the combined analysis across all locations (Supplemental Table S6, S7). Differences between winter and summer results are likely
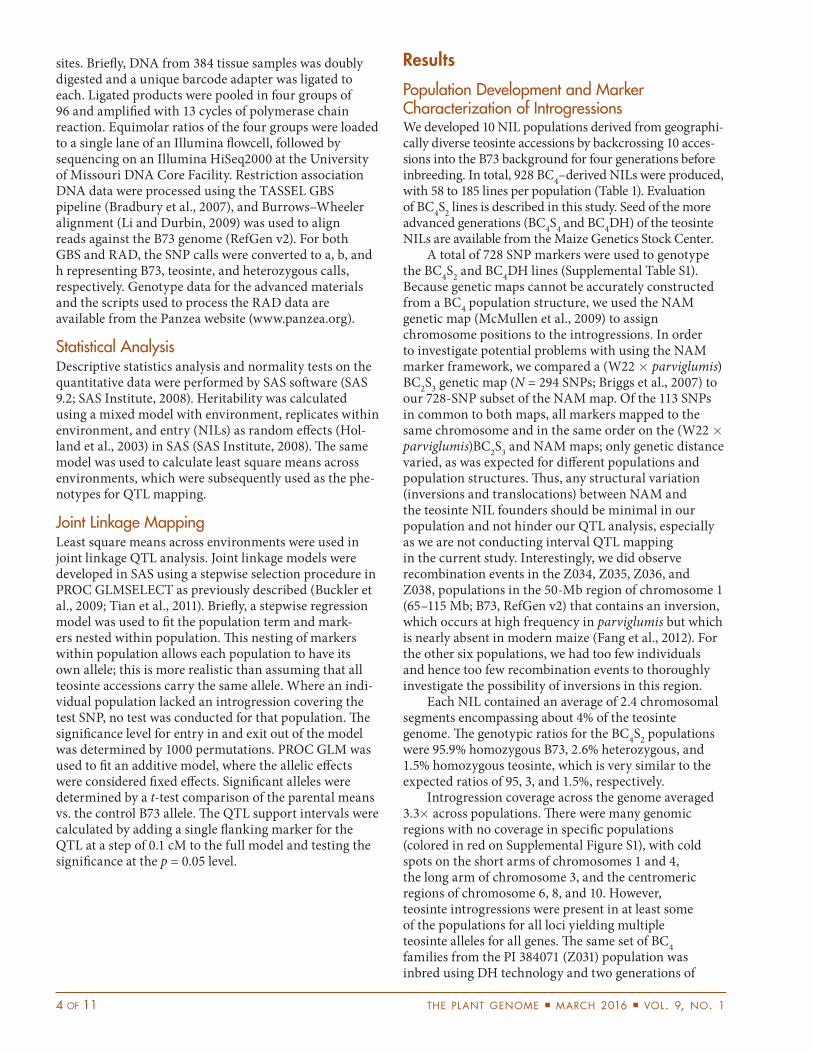
Table 2. Descriptive statistics for the traits in this study.
Traits† Locations (reps) No. samples Mean SD Min. Max. H 2
DTA (d) 11 (20) 858 69.22 1.11 64.69 76.64 0.760KRN 3 (7) 858 16.78 1.13 10.23 19.60 0.880
Wt50k (g) 3 (7) 858 12.16 1.06 7.65 15.32 0.872
† DTA, days to anthesis; KRN, kernel row number; Wt50k, 50-kernel weight.
6 of 11 the plant genome march 2016 vol. 9, no. 1
a result of photoperiod effects in the long-day Missouri environment that are not expressed under the short day lengths of Puerto Rico.
DiscussionSeveral studies on the genetic control of morphological traits in maize–teosinte intercross populations have been previ-ously reported (Doebley et al., 1990; Doebley and Stec, 1991, 1993; Szabo and Burr, 1996; Briggs et al., 2007). The earliest F2 study used a primitive tropical landrace and an accession of Z. mays subsp. mexicana as parents. More recent BC1 studies used the improved US inbred W22 and an accession of Bal-sas teosinte (subsp. parviglumis). Here, our populations were
developed using the inbred B73 as the recurrent parent and 10 different teosinte accessions as donors. After backcrossing four times and self-pollinating twice or creating DHs, the populations were used to conduct linkage QTL analysis and validate QTL effects and were found suitable for initiating fine mapping. Our populations combine 10 donors in a com-mon background, which can relieve the confounding effects of genetic background, that is, multiple donors introgressed into different recurrent backgrounds make allelic compari-sons difficult. The effect of the alleles may vary with different donors; however, the large-effect QTL that were responsible for the transformation of teosinte into maize should be detectable by linkage analysis.
Figure 1. Comparison of flowering time (days to anthesis [DTA]) quantitative trait loci (QTL) identified in (a) the nested-association mapping (NAM) recombinant inbred lines derived from diverse inbred lines (Buckler et al., 2009) and (b) the maize–teosinte near-isogenic introgres-sion lines (NILs) populations. The x-axis indicates the genetic distance (cM) in chromosome order. (c) Heat map of additive allelic effects (in days) for days to anthesis QTL in the maize–teosinte NILs. The top horizontal axis lists the chromosome number and genetic map position for each QTL, while the bottom horizontal axis displays the QTL peak single nucleotide polymorphism marker (see Supplemental Table S1) selected by linkage analysis. The vertical axis shows the 10 NIL populations in order. Allelic affects are color coded with 0.5-d increments. n.d. indicates that allelic effects could not be determined, as there were no NILs carrying an introgression at the QTL.
liu et al.: teosinte introgression populations 7 of 11
Using NILs for quantitative trait analysis offers several advantages over other population structures. For example, it is possible to detect QTL, validate QTL effects, and initiate fine mapping populations all with the same germplasm set, thus ensuring that the same alleles are being evaluated from the initial QTL discovery through fine mapping. Furthermore, NILs can facilitate introgression of useful allelic variation directly into elite germplasm.
The NILs developed in this study provide the tools to begin answering key questions of relevance to maize evolution and improvement. For example, we hypothesize that the loss of 33 to 43% allelic variation from teosinte to maize during domestication and plant breeding (Tenaillon et al., 2004; Wright et al., 2005) results in a loss of phenotypic variation as well. We also hypothesize larger allelic effects in teosinte than in maize as a result of selection against strong alleles during domestication and breeding. Further studies to test these hypotheses are underway, based on the introgression lines described here.
Teosinte Near-Isogenic Lines as a Resource for Exploring Zea DiversityOur teosinte NIL populations offer greater allelic diversity than modern maize inbred lines on a per-line basis. This
is true for most genes across the genome because of bot-tleneck effects but especially for the 500 to 1000 genes that were targets of selection during domestication and mod-ern breeding (Wright et al., 2005; Hufford et al., 2012). Each of the 928 NILs that comprise the teosinte NIL pop-ulations carries an average of 2.4 segments representing approximately 4% of the genome in the B73 background. With an average of 3.3 introgression coverage, it is pos-sible to identify multiple lines with introgressions at most loci across the genome from up to 10 teosinte donors.
Because the NILs were generated without genotyping during line development, we were unable to monitor introgression loss across generations. It was somewhat surprising that only a small number of genomic regions were not represented in the final NIL population from any given donor (Supplemental Figure S1). These underrepresented regions may have contained deleterious alleles that were intolerant to inbreeding; may have been inadvertently selected against during line development because they contributed to maladaptation, such as the major flowering time loci on chromosomes 8 and 10 (Fig. 1); or could have been lost simply by chance. When comparing the traditional self-pollination and DH inbreeding methods, we saw greater introgression loss in the DHs (e.g., the short arms of chromosome
Figure 2. Joint linkage analysis of kernel row number (KRN) and 50-kernel weight (Wt50k). (a) x-axis, genetic distance (cM) and maize chromosomes 1 through 10 in order; y-axis, logarithm of odds value. Heat map of additive allelic effects for (b) KRN and (c) Wt50k quantitative trait loci (QTL). The top x-axis lists the chromosome number and genetic map position for each QTL, while the bottom x-axis displays the QTL peak single nucleotide polymorphism markers selected by joint linkage analysis. The y-axis shows 10 near-isogenic introgression line (NIL) populations in order. Additive allelic affects for KRN and Wt50k are color coded as the shared legend (b) with 0.5 increments of number of kernel rows for KRN and grams (g) for Wt50k. n.d. indicates that allelic effects could not be determined, as there were no NILs carrying an introgression at the QTL.
8 of 11 the plant genome march 2016 vol. 9, no. 1
1 and 10) and sections of chromosomes 4, 5, 6, 8, and 9 (Supplemental Figure S1). This is likely caused by a stronger selection pressure against deleterious alleles during the haploid phase of growth as compared with the less severe and slower inbreeding over several generations of self-pollination.
Contrasting Genetic Architectures for Maize and Teosinte Flowering Quantitative Trait LociWe identified very different QTL profiles for the same traits analyzed in the teosinte NIL population as com-pared with the NAM RIL population, both in terms of number of QTL and allelic effect sizes (Fig. 1). Here we identified only three QTL for DTA in the teosinte NILs, while 36 QTL were identified across the 25 NAM RIL families (Buckler et al., 2009).
The QTL with the highest LOD score in the teosinte NILs was located on chromosome 8, and candidate genes include vgt1, its target gene rap2.7 (Salvi et al., 2007), and ZCN8 and vgt2, which are further upstream of vgt1 (Chardon et al., 2005; Bouchet et al., 2013). To date, the only allele of vgt1 that has been fine mapped contains a MITE transposon insertion that confers early flowering in temperate germplasm (Salvi et al., 2007). For this chromosome 8 region, an allele series was identified in NAM where the three earliest-flowering alleles contained the MITE insertion, while seven of the late-flowering alleles were associated with variation in rap2.7 (Buckler et al., 2009). Because our teosinte alleles confer late flowering (Supplemental Table S4), it is unlikely that a MITE insertion in vgt1 is responsible for our differences in flowering. Unfortunately, we did not have SNPs in the vgt1–rap2.7 region for our initial QTL analysis, and our QTL peak was fairly broad, making it unclear whether our late-flowering alleles are caused by variation in rap2.7 as in NAM or other genes in the region, such as ZCN8. Deep genotyping in a subset of the Z031 NILs and comparison of the DTA phenotypes with recombination events in the interval between ZCN8 and the vgt1–rap2.7 region revealed that ZCN8 is the most likely candidate gene for this allele. However, it is possible that some teosinte accessions carry alleles controlled by ZCN8, while others carry alleles controlled by rap2.7.
The second most significant QTL was located on chromosome 10 and is likely to contain the photoperiod gene, ZmCCT (Hung et al., 2012). Recently, Yang et al. (2013) determined that a CACTA-like insertion in the ZmCCT promoter alleviated photoperiod sensitivity. The chromosome 10 QTL does not segregate in the Z38 population because this NIL population lacks an introgression at this locus, preventing us from testing the Z038 allele. Interestingly, we do have introgressions in the other nine populations; this QTL is not significant in the Z031, Z032, and Z035 populations, but does confer significantly later flowering in the other six populations. These results contradict Yang et al. (2013), where all of the sampled teosinte accessions lack the CACTA-like transposable element insertion, which
reduces photoperiod sensitivity in early flowering materials (Yang et al., 2013). High-density whole-genome sequencing of the B73 teosinte F1 founders is underway and will allow us to determine which teosinte alleles carry the insertion at ZmCCT.
The allelic effects were larger in the teosinte NILs (largest additive effect of 4.3 d; Supplemental Table S4) as compared with NAM (largest additive effect of 1.7 d; Buckler et al., 2009) for two possible reasons. First, phenotypic differences in NILs are mainly caused by the allelic differences of the locus of interest, and the effects of genetic background are greatly reduced, thus allowing accurate effect estimates. The second, and more likely, reason is that teosinte actually has stronger effects than the tropical inbreds in NAM. Even though many of the NAM founder inbreds were developed under short days (e.g., in Mexico or Thailand), there was likely selection against strong alleles during inbred line development than unselected populations of teosinte. The day length of the evaluation environments certainly affects the allelic effect estimates. The estimate of 1.7 d for ZmCCT from NAM was based on 2 yr each of trials in New York, Illinois, Missouri, and North Carolina (Buckler et al., 2009). Our estimate for the 4.3-d effect in the teosinte NILs is based on a similar balance of locations with very similar latitudes (1 yr in Minnesota and Wisconsin, 1 yr in New York, 2 yr in Missouri, and 2 yr in North Carolina), thus, the comparison of NAM with our teosinte NILs is valid. If we had evaluated the NILs exclusively in northern locations, the allelic estimates would certainly be higher and comparable with the stronger effects reported by Salvi et al. (2007).
It is also interesting that the heritability of DTA in our trial (0.76) was considerably less than that reported in NAM (0.94; Buckler et al., 2009). This may be partially due to the limited phenotypic distribution of DTA in the teosinte NILs as compared with the NAM RILs, a difference of 12 d in the NILs as compared with 25 d in the NAM RILs. In addition, we were only able to explain 25% of the phenotypic variation with the three QTL that we identified. We believe the primary reason for the missing heritability is gene–gene interactions (epistasis). While the NAM results report little to no epistasis for all traits analyzed to date (Buckler et al., 2009; Tian et al., 2011; Cook et al., 2012). We have some hypotheses about the importance of epistasis in populations where standing variation is explored (i.e., NAM, IBM, etc.) vs. populations where the parents have diverged as a result of selection (i.e., our teosinte NILs from domestication or the Illinois long-term selection populations). Unfortunately, given the BC4 population structure of the NILs, we do not have the correct combination of teosinte alleles or the statistical power to search for or test specific epistatic interactions. Follow-up studies are underway to search for and test epistatic interactions of teosinte alleles on DTA and other domestication and agronomic traits. Additional reasons for the missing heritability may include genotype
liu et al.: teosinte introgression populations 9 of 11
environment interactions and epigenetic effects, neither of which was explored in the current study.
There are several possible explanations for why we detected fewer QTL in the teosinte NILs than in NAM. First, NIL populations suffer from lower statistical power than RIL populations, as only a small number of NILs per family carry introgressions at any given locus. A second reason is the difference in population size; the NAM population includes 5000 lines, while the teosinte NIL population only contains 928 lines. In addition, our empirically derived threshold (p = 7.6 10−9) was much more stringent in our study than to NAM. This difference in threshold is a function of population structure and our phenotypic dataset.
Kernel Row NumberPhyllotaxy of the ear is one of the major differences between teosinte and maize. Teosinte ears are exclusively two-ranked, while maize ears usually have four or more ranks. An early study reported that a single gene, Two-Ranked (TR), controlled the difference in KRN between maize and teosinte (Langham, 1940). However, more recent studies have identified multiple large-effect QTL for KRN including one on the short arm of chromosome 2 (Magu-ire, 1961; Galinat, 1973; Doebley and Stec, 1991, 1993). We identified four prominent QTL for KRN on chromosomes 1, 2, 4, and 5 (Fig. 2a; Supplemental Table S2).
Similar to what we observed for flowering time, we found a greater range of allelic effects for KRN QTL in the teosinte NILs than maize. Brown et al. (2011) found additive allelic effects that ranged from −0.83 to 0.66 for KRN in the NAM population derived from 25 diverse inbreds, while our teosinte allelic effects varied from −2.33 to 0.24. After follow-up genotyping of specific alleles, we determined that the Z029 allelic effect for the chromosome 2 (originally estimated to be −3.38) was likely overestimated because of allelic drift that occurred between genotyping and phenotyping for KRN. Variation at the chromosome 2 QTL seems to be specific to teosinte, while the other QTL segregate in maize maize populations such as NAM (Brown et al., 2011). Our validation experiment showed large allelic effects for this QTL in almost all introgression populations (Supplemental Table S5–S7) and confirmed our hypothesis that the Z029 allelic effect on chromosome 2 was overestimated.
The QTL located on the short arm of chromosome 2 is the strongest KRN QTL with the candidate genes ZFL2 (Zea FLORICAULA/LEAFY 2) and Abphyl1 near the peak (Supplemental Table S2). We believe this QTL to be the same as that identified in the earliest maize teosinte mapping experiments (Doebley and Stec, 1991). ZFL2, the maize ortholog of LEAFY in Arabidopsis and RFL in rice, has been shown to control the conversion of ear phyllotaxy from distichous, found in teosinte, to polystichous found in maize (Briggs et al., 2007). Abphyl1, another important gene controlling the phyllotaxy development in maize (Jackson and Hake, 1999; Giulini et al., 2004), was also located on the border of our QTL,
though it is not under the original QTL peak. ZFL2 is currently the most plausible candidate gene for the chromosome 2 KRN QTL identified in our study. ZFL2 has been shown to control ear rank differences between maize and teosinte (Bomblies and Doebley, 2006) and has been proposed to underlie the chromosome 2 KRN QTL identified in a maize landrace Z. mays subsp. mexicana population (Doebley and Stec, 1991). Initial fine mapping efforts have narrowed the target region down to between 11,134,513 and 15,343,099 bp (B73, RefGen_v2) on chromosome 2, which excludes the abphyl1 gene (~27 Mb) (data not shown). It is possible that the chromosome 2 KRN QTL will fractionate into multiple QTL, making fine mapping very difficult, as has been recently reported for another KRN QTL located on chromosome 5 (Lemmon and Doebley, 2014).
Kernel WeightThe dramatic enlargement of kernel size during maize domestication undoubtedly resulted in the large increase in kernel weight. Many kernel weight QTL have been reported to date in maize (e.g., Beavis et al., 1994; Messmer et al., 2009; Hirsch et al., 2014). However, few studies were based on maize–teosinte populations (Doebley and Stec, 1993; Briggs et al., 2007). We identified eight QTL for ker-nel weight (Fig. 2a; Supplemental Table S2). The QTL on chromosome 3 is likely the same as that reported by Doe-bley and Stec (1993) in the F2 populations derived from maize and the two different teosinte subspecies, mexicana and parviglumis. Our QTL had a much narrower inter-val (~143,169,742–158,263,760 bp, B73 RefGen_v2). This result also supported the previous results that the genomic region on chromosome 3 was one of several that showed strong effects during maize domestication.
Prolamin binding factor1 (pbf1, located at 153,510,052 bp; B73 RefGen_v2) is a strong a candidate gene underlying the chromosome 2 QTL (peak located at 147,310,722 bp). Unfortunately the support interval for our QTL is very broad (62–172 Mb) because of a lack of recombination in the NIL population, and thus we were unable to characterize this QTL in depth. However, of the 10 teosinte alleles that we surveyed in this population, one of allele significantly increased seed weight in accordance with the results of Lang et al. (2014). These results support our hypothesis that teosinte harbors favorable alleles for agronomically important traits such as seed weight.
The QTL on chromosome 5 is likely the same as identified in NAM (Hirsch et al., 2014). One strong candidate gene for this QTL is ZmGW2. A recent study found that ZmGW2 affected kernel weight by altering kernel size in maize (Li et al., 2010) and the orthologous genes have very similar functions in rice and wheat (Triticum aestivum L.). The GW2 gene, which encodes a RING-type E3 ubiquitin ligase, alters grain width and weight with very little effect on grain length in rice (Song et al., 2007).
10 of 11 the plant genome march 2016 vol. 9, no. 1
Conclusions
Domestication greatly reduced genetic diversity in mod-ern maize compared with teosinte, a reduction that may ultimately limit maize productivity. It is nearly impossible to directly identify traits in teosinte that may be used for maize improvement because of extreme maladaptedness of teosinte in temperate trials. Here, we developed a popula-tion of 928 teosinte NILs derived from 10 teosinte (subsp. parviglumis) accessions in the B73 background. With these NILs, we bridge the gap between teosinte and maize and make it feasible for modern corn breeders to use alleles that were lost during domestication. To understand the impact of domestication on modern maize and unravel the genetic basis of important quantitative traits, we selected several important agronomic traits as examples in this study.
This study combined production of a large maize–teosinte introgression population and the high-density SNP genotyping array together to enhance our ability to understand the genetic basis underlying morphological changes during maize domestication. Important agronomic traits, such as DTA, KRN, and kernel weight, were analyzed in teosinte NILs resulting in the identification of extreme DTA teosinte alleles and a KRN QTL that does not segregate in maize maize populations. Results from this study show that the maize–teosinte NIL population is very useful for mapping genes and subsequent fine-mapping efforts as well as for introducing unique alleles into the maize gene pool. Elucidating the genetic architecture of various agronomic and domestication traits is essential to the positional cloning of important genes and to providing resources for improving the yield potential of maize.
AcknowledgmentsWe wish to thank AgReliant for the production of the doubled-haploid lines from the Z031 population. We also thank Nathan Springer and Natalia de Leon for planting the trial in Minnesota and Wisconsin and the McMullen, Flint-Garcia, Balint-Kurti, and Buckler groups for grow-ing the trials, data collection, and providing ear and seed samples. This research was supported by National Science Foundation (IOS-0820619) and USDA–Agriculture Research Service.
ReferencesBeavis, W.D., O.S. Smith, D. Grant, and R. Fincher. 1994. identification of
quantitative trait loci using a small sample of topcrossed and F4 prog-eny from maize. Crop Sci. 34:882–896. doi:10.2135/cropsci1994.0011183X003400040010x
Bomblies, K., and J.F. Doebley. 2006. Pleiotropic effects of the duplicate maize FLORICAULA/LEAFY genes zfl1 and zfl2 on traits under selec-tion during maize domestication. Genetics 172:519–531. doi:10.1534/genetics.105.048595
Briggs, W.H., M.D. McMullen, B.S. Gaut, and J. Doebley. 2007. Linkage mapping of domestication loci in a large maize teosinte backcross resource. Genetics 177:1915–1928. doi:10.1534/genetics.107.076497
Brouwer, D.J., and D.A. St Clair. 2004. Fine mapping of three quantitative trait loci for late blight resistance in tomato using near isogenic lines (NILs) and sub-NILs. Theor. Appl. Genet. 108:628–638. doi:10.1007/s00122-003-1469-8
Bouchet, S., B. Servin, P. Bertin, D. Madur, V. Combes, F. Dumas, et al. 2013. Adaptation of maize to temperate climates: Mid-density genome-wide association genetics and diversity patterns reveal key genomic regions, with a major contribution of the vgt2 (ZCN8) Locus. PLoS ONE 8:E71377. doi:10.1371/journal.pone.0071377
Bradbury, P.J., Z. Zhang, D.E. Kroon, T.M. Casstevens, Y. Ramdoss, and E.S. Buckler. 2007. TASSEL: Software for association mapping of complex traits in diverse samples. Bioinformatics 23:2633–2635. doi:10.1093/bioinformatics/btm308
Brown, P.J., N. Upadyayula, G.S. Mahone, F. Tian, P.J. Bradbury, et al. 2011. Distinct genetic architectures for male and female inflorescence traits of maize. PLoS Genet. 7:e1002383. doi:10.1371/journal.pgen.1002383
Buckler, E.S., J.B. Holland, P.J. Bradbury, C.B. Acharya, P.J. Brown, et al. 2009. The genetic architecture of maize flowering time. Science 325:714–718. doi:10.1126/science.1174276
Chardon, F., D. Hourcade, V. Combes, and A. Charcosset. 2005. Mapping of a spontaneous mutation for early flowering time in maize highlights contrasting allelic series at two-linked QTL on chromosome 8. Theor. Appl. Genet. 112:1–11. doi:10.1007/s00122-005-0050-z
Cook, J.P., M.D. McMullen, J.B. Holland, F. Tian, P. Bradbury, J. Ross-Ibarra, E.S. Buckler, and S.A. Flint-Garcia. 2012. Genetic architecture of maize kernel composition in the nested association mapping and inbred association panels. Plant Physiol. 158:824–834. doi:10.1104/pp.111.185033
Doebley, J., and A. Stec. 1991. Genetic analysis of the morphological differ-ences between maize and teosinte. Genetics 129:285–295.
Doebley, J., and A. Stec. 1993. Inheritance of the morphological differences between maize and teosinte: Comparison of results for two F2 popula-tions. Genetics 134:559–570.
Doebley, J., A. Stec, J. Wendel, and M. Edwards. 1990. Genetic and morpho-logical analysis of a maize–teosinte F2 population: Implications for the origin of maize. Proc. Natl. Acad. Sci. USA 87:9888–9892. doi:10.1073/pnas.87.24.9888
Elshire, R.J., J.C. Glaubitz, Q. Sun, J.A. Poland, K. Kawamoto, E.S. Buck-ler, et al. 2011. A robust, simple genotyping-by-sequencing (GBS) approach for high diversity species. PLoS ONE 6:e19379. doi:10.1371/journal.pone.0019379
Emerson, R., and H. Smith. 1950. Inheritance of number of kernel rows in maize. Cornell Univ. Agric. Exp. Stn. Memoir 296.
Eshed, Y., and D. Zamir. 1995. An introgression line population of Lycoper-sicon pennellii in the cultivated tomato enables the identification and fine mapping of yield-associated QTL. Genetics 141:1147–1162.
Fang, Z., T. Pyhäjärvi, A.L. Weber, R.K. Dawe, J.C. Glaubitz, J. Gonzalez J. de, C. Ross-Ibarra, J. Doebley, P.L. Morrell, and J. Ross-Ibarra. 2012. Megabase-scale inversion polymorphism in the wild ancestor of maize. Genetics 191:883–894.
Frary, A., T.C. Nesbitt, S. Grandillo, et al. 2000. fw2.2: A quantitative trait locus key to the evolution of tomato fruit size. Science 289:85–88. doi:10.1126/science.289.5476.85
Galinat, W. 1973. Intergenomic mapping of maize, teosinte and Tripsacum. Evolution (N.Y.) 27:644–655. doi:10.2307/2407197
Giulini, A., J. Wang, and D. Jackson. 2004. Control of phyllotaxy by the cytokinin-inducible response regulator homologue ABPHYL1. Nature 430:1031–1034. doi:10.1038/nature02778
Graham, G.I., D.W. Wolff, and C.W. Stuber. 1997. Characterization of a yield quantitative trait locus on chromosome five of maize by fine mapping. Crop Sci. 37:1601. doi:10.2135/cropsci1997.0011183X003700050033x
Hirsch, C.N., S. Flint-Garcia, T. Beissinger, S.R. Eichten, S. Deshpande, K. Barry, M.D. McMullen, J.B. Holland, E. Buckler, N. Springer, R.C. Buell, N. de Leon, and S.M. Kaeppler. 2014. Insights into the effects of long-term artificial selection on seed size in maize. Genetics 198:409–421. doi:10.1534/genetics.114.167155
Holland, J.B., W.E. Nyquist, and C.T. Cervantes-Martinez. 2003. Estimat-ing and interpreting heritability for plant breeding: An update. Plant Breed. Rev. 22:9–111.
Hufford, M.B., X. Xu, J. van Heerwaarden, T. Pyhäjärvi, J.M. Chia, et al. 2012. Comparative population genomics of maize domestication and improvement. Nat. Genet. 44:808–811. doi:10.1038/ng.2309
liu et al.: teosinte introgression populations 11 of 11
Hung, H.Y., L.M. Shannon, F. Tian, P.J. Bradbury, C. Chen, S.A. Flint-Gar-cia, et al. 2012. ZmCCT and the genetic basis of day-length adaptation underlying the postdomestication spread of maize. Proc. Natl. Acad. Sci. USA 109:E1913–E1921. doi:10.1073/pnas.1203189109
Iltis, H.H. 2000. Homeotic sexual translocations and the origin of maize (Zea Mays, Poaceae): A New look at an old problem. Econ. Bot. 54:7–42. doi:10.1007/BF02866598
Jackson, D., and S. Hake. 1999. Control of phyllotaxy in maize by the abphyl1 gene. Development 126:315–323.
Jiang, H.W., C.D. Li, C.Y. Liu, W.B. Zhang, P.C. Qiu, W.F. Li, Y.L. Gao, G.H. Hu, and Q.S. Chen. 2009. Genotype analysis and QTL map-ping for tolerance to low temperature in germination by introgres-sion lines in soybean. Acta Agron. Sin. 35:1268–1273. doi:10.3724/SP.J.1006.2009.01268
Kaeppler, S.M. 1997. Quantitative trait locus mapping using sets of near-isogenic lines: Relative power comparisons and technical consider-ations. Theor. Appl. Genet. 95:384–392. doi:10.1007/s001220050574
Lang, Z., D.M. Wills, Z.H. Lemmon, L.M. Shannon, R. Bukowski, Y. Wu, J. Messing, and J.F. Doebley. 2014. Defining the role of prolamin-box binding factor1 gene during maize domestication. J. Hered. 105:576–582. doi:10.1093/jhered/esu019
Langham, D.G. 1940. The inheritance of intergeneric differences in Zea-Euchlaena hybrids. Genetics 25:88–107.
Lemmon, Z.H., and J. Doebley. 2014. Genetic dissection of a genomic region with pleiotropic effects on domestication traits in maize reveals multiple linked QTL. Genetics 198:345–353. doi:10.1534/genet-ics.114.165845
Li, H., and R. Durbin. 2009. Fast and accurate short read alignment with Burrows–Wheeler transform. Bioinformatics 25:1754–1760. doi:10.1093/bioinformatics/btp324
Li, Q., L. Li, X. Yang, M.L. Warburton, G. Bai, J. Dai, J. Li, and J. Yan. 2010. Relationship, evolutionary fate and function of two maize co-ortho-logs of rice GW2 associated with kernel size and weight. BMC Plant Biol. 10:143. doi:10.1186/1471-2229-10-143
Maguire, M. 1961. Divergence in Tripsacum and Zea chromosomes. Evolu-tion (N.Y) 15:394–400. doi:10.2307/2406307
Matsuoka, Y., Y. Vigouroux, M.M. Goodman, G.J. Sanchez, E. Buckler, and J. Doebley. 2002. A single domestication for maize shown by multi-locus microsatellite genotyping. Proc. Natl. Acad. Sci. USA 99:6080–6084. doi:10.1073/pnas.052125199
McMullen, M.D., S. Kresovich, H.S. Villeda, P. Bradbury, H. Li, Q. Sun, et al. 2009. Genetic properties of the maize nested association mapping population. Science 325:737–740. doi:10.1126/science.1174320
Messmer, R., Y. Fracheboud, M. Bänziger, M. Vargas, P. Stamp, and J.M. Ribaut. 2009. Drought stress and tropical maize: QTL-by-environ-ment interactions and stability of QTLs across environments for yield components and secondary traits. Theor. Appl. Genet. 119:913–930. doi:10.1007/s00122-009-1099-x
Muehlbauer, G.J., P.E. Staswick, J.E. Specht, G.L. Graef, R.C. Shoemaker, and P. Keim. 1991. RFLP mapping using near-isogenic lines in the soybean [Glycine max (L.) Merr.]. Theor. Appl. Genet. 81:189–198. doi:10.1007/BF00215722
Piperno, D.R., A.J. Ranere, I. Holst, J. Iriarte, and R. Dickau. 2009. Starch grain and phytolith evidence for early ninth millennium B.P. maize from the Central Balsas River Valley, Mexico. Proc. Natl. Acad. Sci. USA 106:5019–5024. doi:10.1073/pnas.0812525106
Poland, J.A., P.J. Brown, M.E. Sorrells, and J.L. Jannink. 2012. Development of high-density genetic maps for barley and wheat using a novel two-enzyme genotyping-by-sequencing approach. PLoS ONE 7:e32253. doi:10.1371/journal.pone.0032253
Salvi, S., G. Sponza, M. Morgante, et al. 2007. Conserved noncoding genomic sequences associated with a flowering-time quantitative trait locus in maize. Proc. Natl. Acad. Sci. USA 104:11376–11381. doi:10.1073/pnas.0704145104
SAS Institute. 2008. SAS/STAT 9.2: User’s guide. SAS Inst. Inc., Cary, NC.Song, X.J., W. Huang, M. Shi, M.Z. Zhu, and H.X. Lin. 2007. A QTL for rice
grain width and weight encodes a previously unknown RING-type E3 ubiquitin ligase. Nat. Genet. 39:623–630. doi:10.1038/ng2014
Szabo, V., and B. Burr. 1996. Simple inheritance of key traits distinguish-ing maize and teosinte. Mol. Gen. Genet. 252:33–41. doi:10.1007/BF02173202
Szalma, S.J., B.M. Hostert, J.R. Ledeaux, C.W. Stuber, and J.B. Holland. 2007. QTL mapping with near-isogenic lines in maize. Theor. Appl. Genet. 114:1211–1228. doi:10.1007/s00122-007-0512-6
Tenaillon, M.I., J. U’Ren, O. Tenaillon, and B.S. Gaut. 2004. Selection versus demography: A multilocus investigation of the domestication process in maize. Mol. Biol. Evol. 21:1214–1225. doi:10.1093/molbev/msh102
Tian, F., P.J. Bradbury, P.J. Brown, H. Hung, Q. Sun, S. Flint-Garcia, et al. 2011. Genome-wide association study of leaf architecture in the maize nested association mapping population. Nat. Genet. 43:159–162. doi:10.1038/ng.746
Tian, F., D.J. Li, Q. Fu, Z.F. Zhu, Y.C. Fu, X.K. Wang, and C.Q. Sun. 2006. Construction of introgression lines carrying wild rice (Oryza rufi-pogon Griff.) segments in cultivated rice (Oryza sativa L.) background and characterization of introgressed segments associated with yield-related traits. Theor. Appl. Genet. 112:570–580. doi:10.1007/s00122-005-0165-2
van Heerwaarden, J., J. Doebley, W.H. Briggs, J.C. Glaubitz, M.M. Good-man, J. de Jesus Sanchez Gonzalez, and J. Ross-Ibarra. 2011. Genetic signals of origin, spread, and introgression in a large sample of maize landraces. Proc. Natl. Acad. Sci. USA 108:1088–1092. doi:10.1073/pnas.1013011108
Wright, S.I., I.V. Bi, S.G. Schroeder, M. Yamasaki, J.F. Doebley, M.D. McMullen, and B.S. Gaut. 2005. The effects of artificial selection on the maize genome. Science 308:1310–1314. doi:10.1126/sci-ence.1107891
Yang, Q., Z. Li, W. Li, L. Ku, C. Wang, J. Ye, K. Li, N. Yang, Y. Li, T. Zhong, J. Li, Y. Chen, J. Yan, X. Yang, and M. Xu. 2013. CACTA-like trans-posable element in ZmCCT attenuated photoperiod sensitivity and accelerated the postdomestication spread of maize. Proc. Natl. Acad. Sci. USA 42:16969–16974. doi:10.1073/pnas.1310949110
Yu, Z.H., D.J. Mackill, J.M. Bonman, and S.D. Tanksley. 1991. Tagging genes for blast resistance in rice via linkage to RFLP markers. Theor. Appl. Genet. 81:471–476.