Embed Size (px)
Citation preview
www.exmar.be May 2014
EXMAR GROUP – Leadership through Innovation
EXMAR GROUP – General Assembly May 20th 2014
2 Private & Confidential
Exmar Group
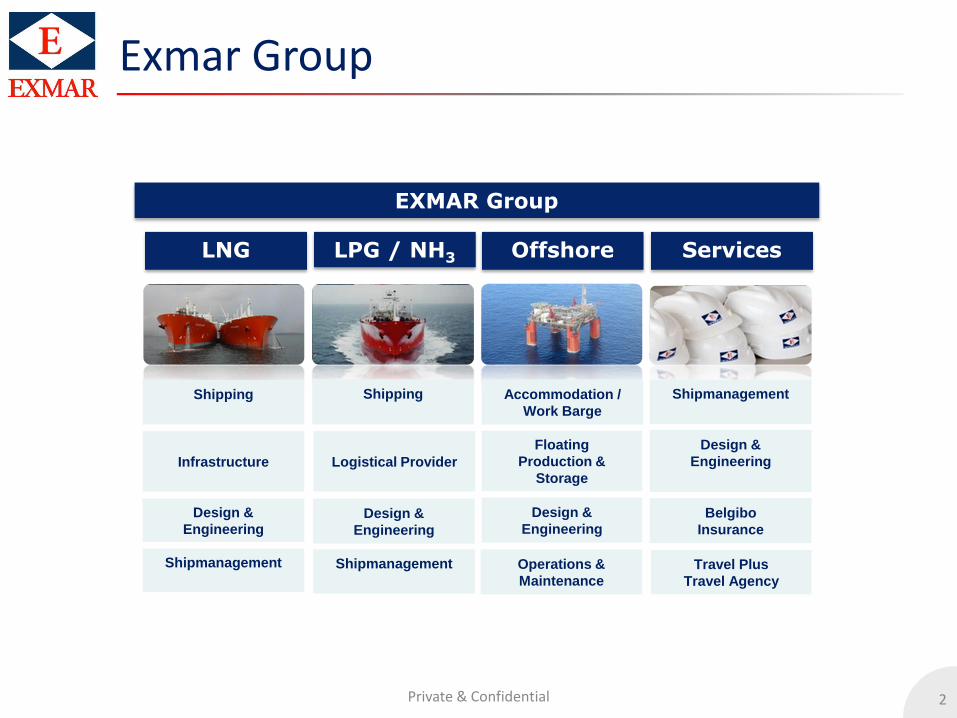
EXMAR Group
LPG / NH3 Offshore
Design &
Engineering
Belgibo
Insurance
Travel Plus
Travel Agency
LNG Services
Shipping
Shipmanagement
Design &
Engineering
Logistical Provider
Design &
Engineering
Floating
Production &
Storage
Design &
Engineering
Shipmanagement
Shipmanagement
Operations &
Maintenance
Shipping
Accommodation /
Work Barge
Infrastructure
3
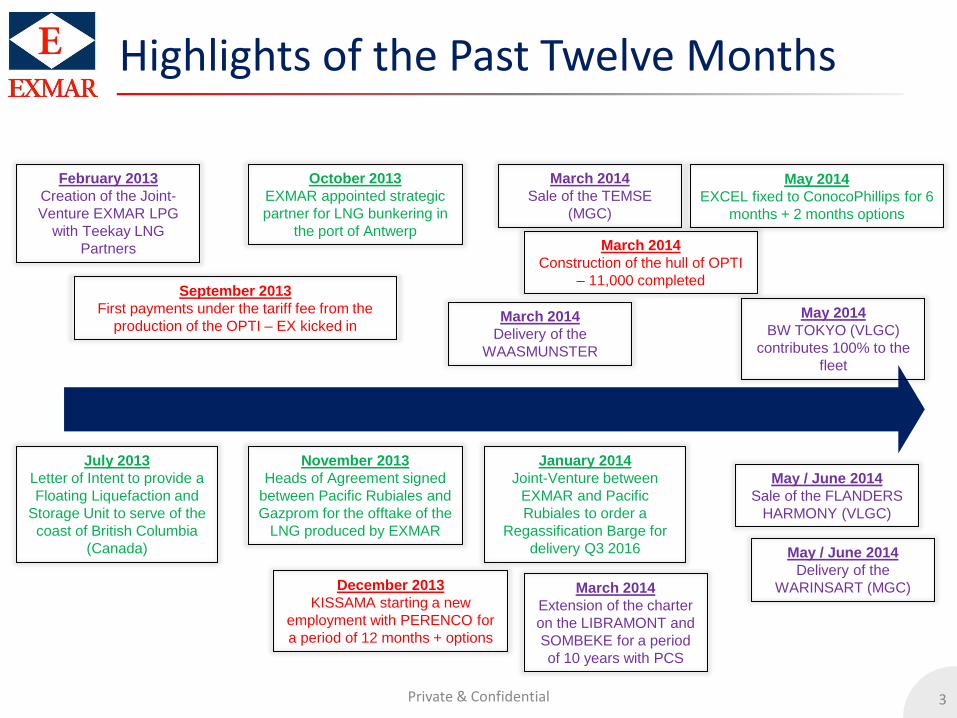
Highlights of the Past Twelve Months
Private & Confidential
March 2014
Construction of the hull of OPTI
– 11,000 completed
November 2013
Heads of Agreement signed
between Pacific Rubiales and
Gazprom for the offtake of the
LNG produced by EXMAR
July 2013
Letter of Intent to provide a
Floating Liquefaction and
Storage Unit to serve of the
coast of British Columbia
(Canada)
May 2014
EXCEL fixed to ConocoPhillips for 6
months + 2 months options
September 2013
First payments under the tariff fee from the
production of the OPTI – EX kicked in
May / June 2014
Sale of the FLANDERS
HARMONY (VLGC)
January 2014
Joint-Venture between
EXMAR and Pacific
Rubiales to order a
Regassification Barge for
delivery Q3 2016
October 2013
EXMAR appointed strategic
partner for LNG bunkering in
the port of Antwerp
December 2013
KISSAMA starting a new
employment with PERENCO for
a period of 12 months + options
March 2014
Sale of the TEMSE
(MGC)
March 2014
Extension of the charter
on the LIBRAMONT and
SOMBEKE for a period
of 10 years with PCS
May 2014
BW TOKYO (VLGC)
contributes 100% to the
fleet
February 2013
Creation of the Joint-
Venture EXMAR LPG
with Teekay LNG
Partners
March 2014
Delivery of the
WAASMUNSTER
May / June 2014
Delivery of the
WARINSART (MGC)
4
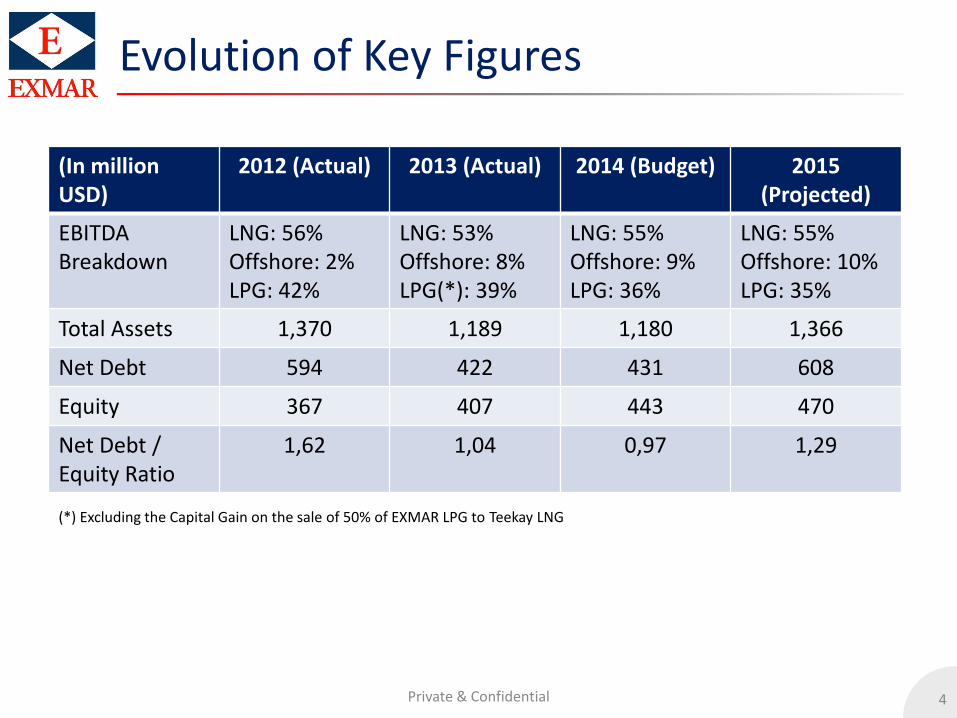
Evolution of Key Figures
Private & Confidential
(*) Excluding the Capital Gain on the sale of 50% of EXMAR LPG to Teekay LNG
(In million USD)
2012 (Actual) 2013 (Actual) 2014 (Budget) 2015 (Projected)
EBITDA Breakdown
LNG: 56% Offshore: 2% LPG: 42%
LNG: 53% Offshore: 8% LPG(*): 39%
LNG: 55% Offshore: 9% LPG: 36%
LNG: 55% Offshore: 10% LPG: 35%
Total Assets 1,370 1,189 1,180 1,366
Net Debt 594 422 431 608
Equity 367 407 443 470
Net Debt / Equity Ratio
1,62 1,04 0,97 1,29
5 5
EXMAR’s LNG Expertise
5 Natural Gas in the Post-Fukushima Age
6
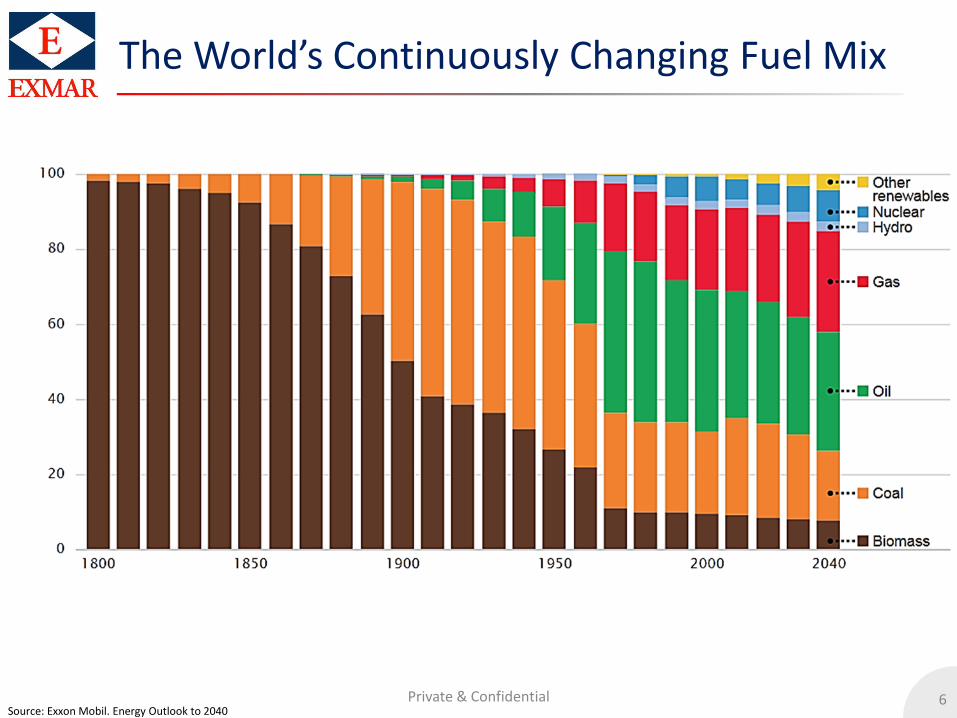
The World’s Continuously Changing Fuel Mix
Private & Confidential Source: Exxon Mobil. Energy Outlook to 2040
7
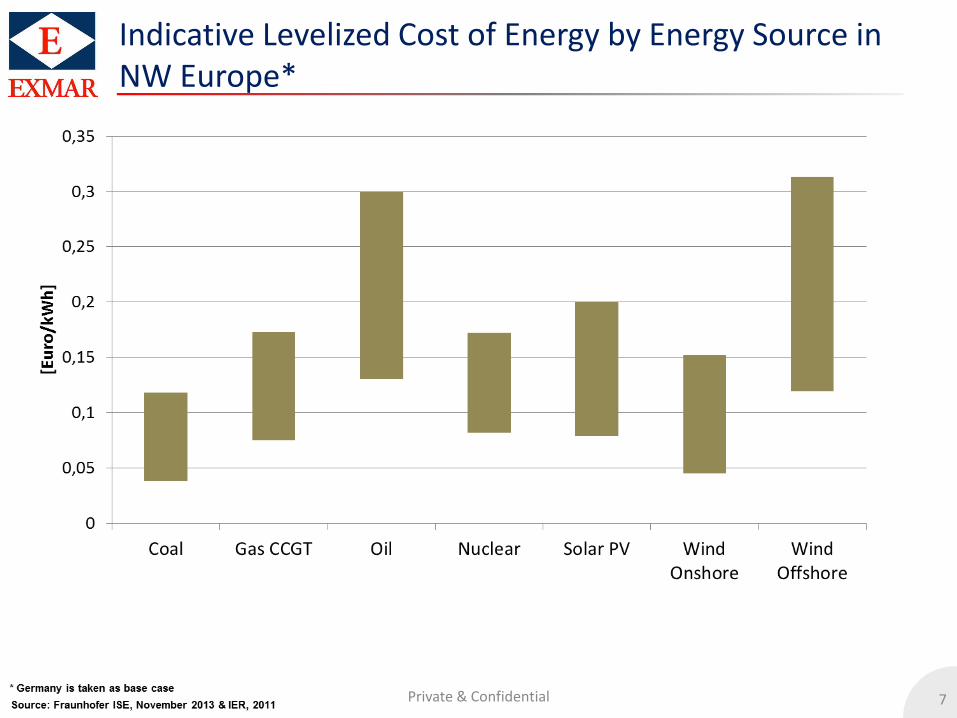
Indicative Levelized Cost of Energy by Energy Source in NW Europe*
Private & Confidential
8 Private & Confidential
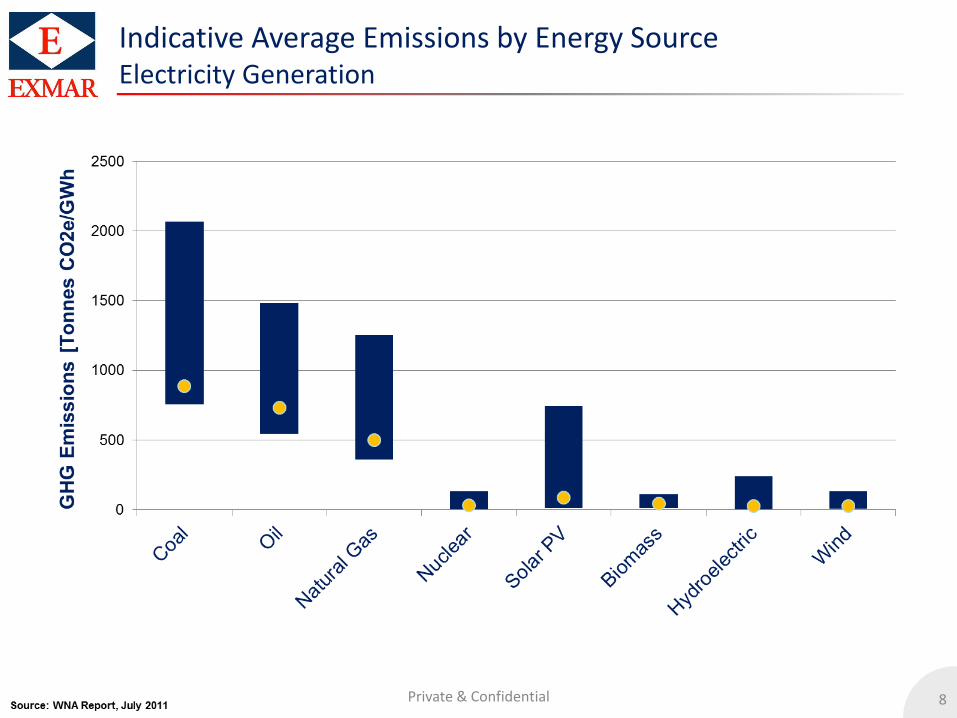
Indicative Average Emissions by Energy Source Electricity Generation
9 Private & Confidential
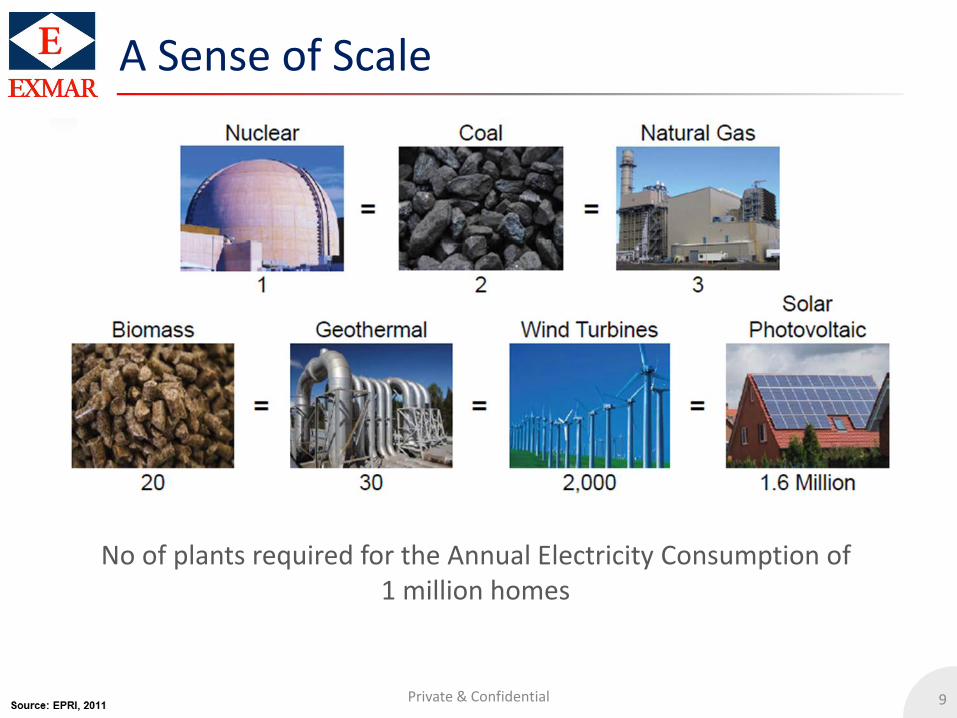
A Sense of Scale
No of plants required for the Annual Electricity Consumption of 1 million homes
10 Private & Confidential
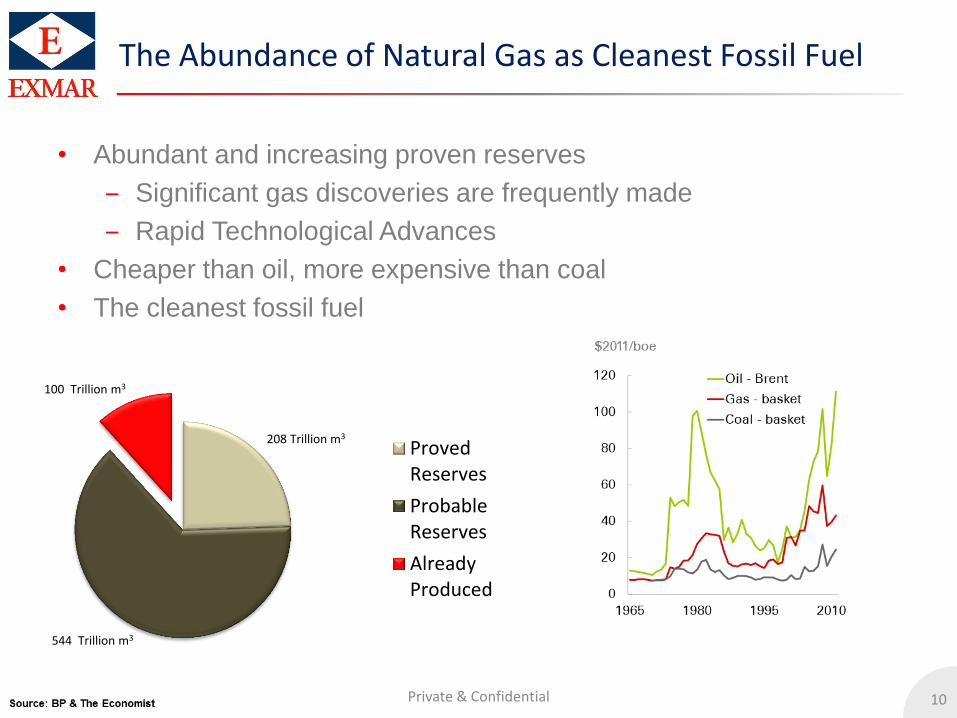
The Abundance of Natural Gas as Cleanest Fossil Fuel
• Abundant and increasing proven reserves
‒ Significant gas discoveries are frequently made
‒ Rapid Technological Advances
• Cheaper than oil, more expensive than coal
• The cleanest fossil fuel
208 Trillion m3
544 Trillion m3
100 Trillion m3
ProvedReserves
ProbableReserves
AlreadyProduced
11 Private & Confidential
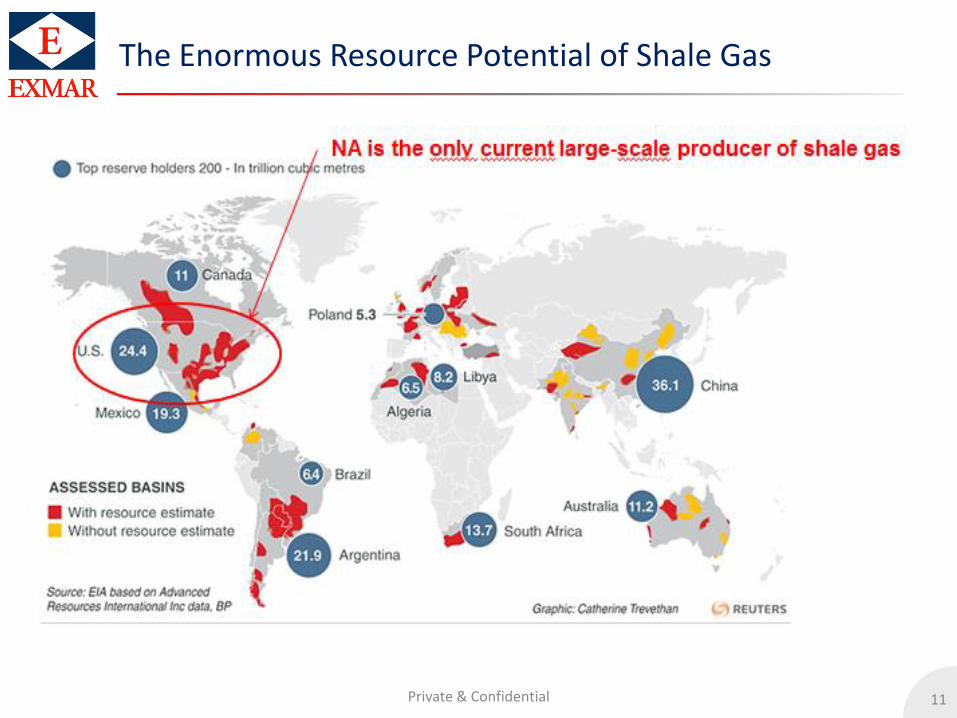
The Enormous Resource Potential of Shale Gas
12
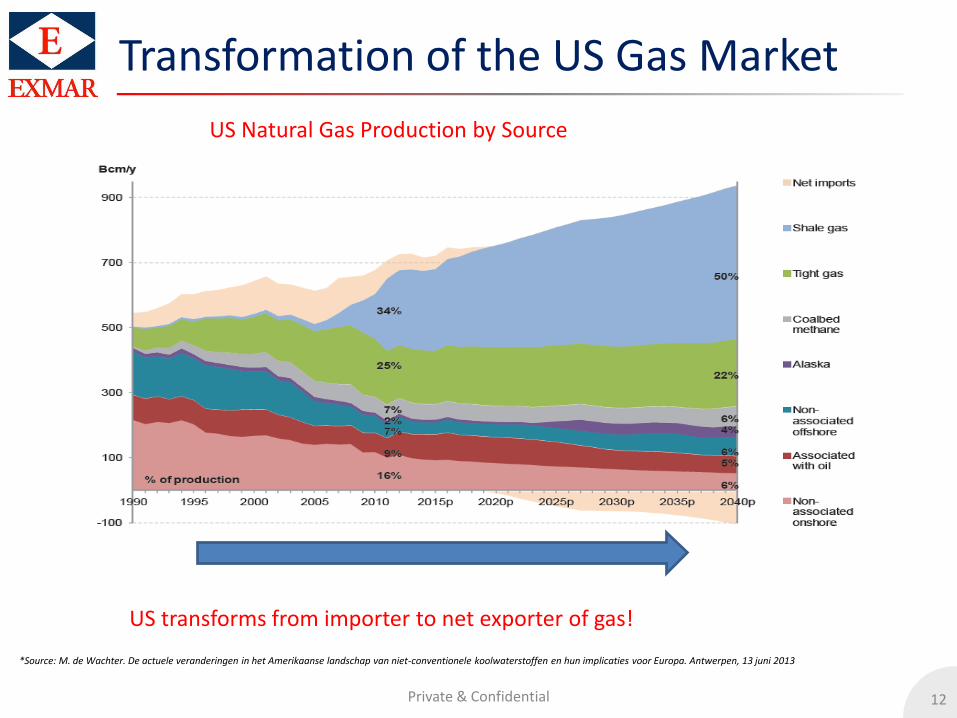
Transformation of the US Gas Market
Private & Confidential
*Source: M. de Wachter. De actuele veranderingen in het Amerikaanse landschap van niet-conventionele koolwaterstoffen en hun implicaties voor Europa. Antwerpen, 13 juni 2013
US Natural Gas Production by Source
US transforms from importer to net exporter of gas!
13 Private & Confidential
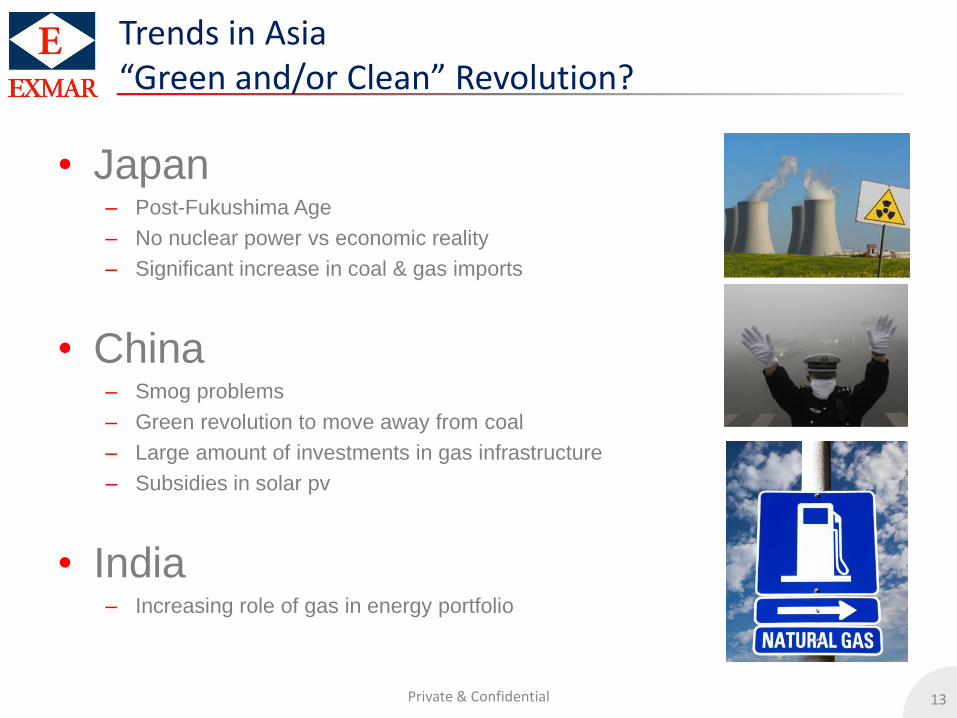
• Japan – Post-Fukushima Age
– No nuclear power vs economic reality
– Significant increase in coal & gas imports
• China – Smog problems
– Green revolution to move away from coal
– Large amount of investments in gas infrastructure
– Subsidies in solar pv
• India – Increasing role of gas in energy portfolio
Trends in Asia “Green and/or Clean” Revolution?
14 Private & Confidential
• Severe economic crisis that is ongoing
• Crisis in Ukraine Holding Back Gas Reserves
• Lower energy consumption due to that crisis
• The move towards green energy - Europe 2020 targets
- 20% lower greenhouse gas emissions compared to 1990
- 20% energy from renewable energy
- 20% increase in energy efficiency
• The only region to have voluntarily submitted to such targets
• But: expensive green energy is being offset by cheaper (and dirtier)
coal consumption!
– Shale gas is consumed in US & US coal is exported to Europe
Current Trends in Europe
15 Private & Confidential
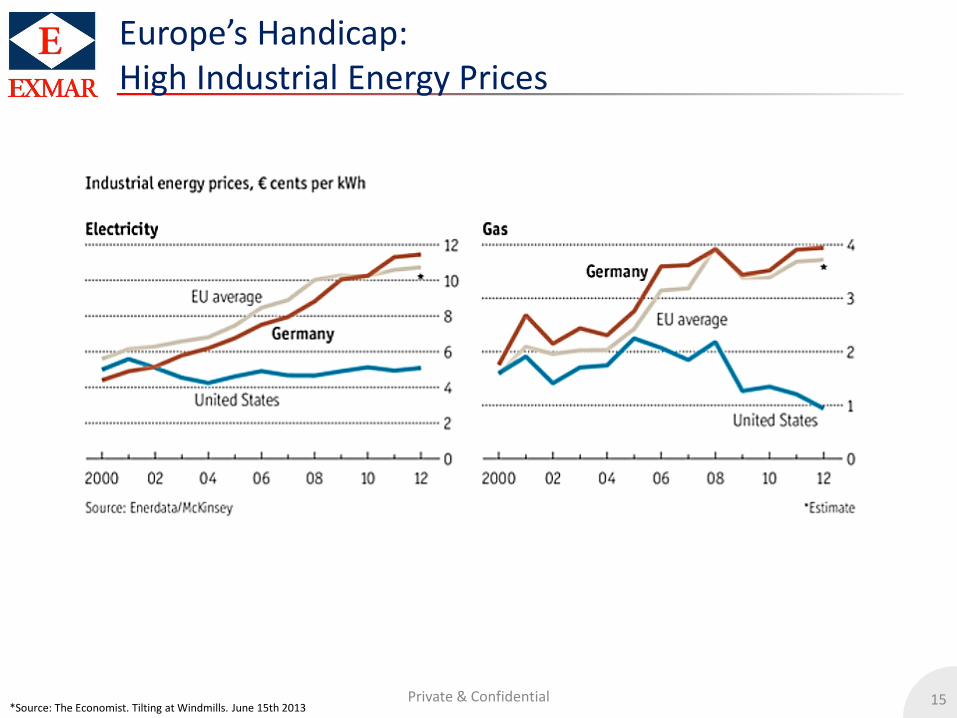
Europe’s Handicap: High Industrial Energy Prices
*Source: The Economist. Tilting at Windmills. June 15th 2013
16 Private & Confidential
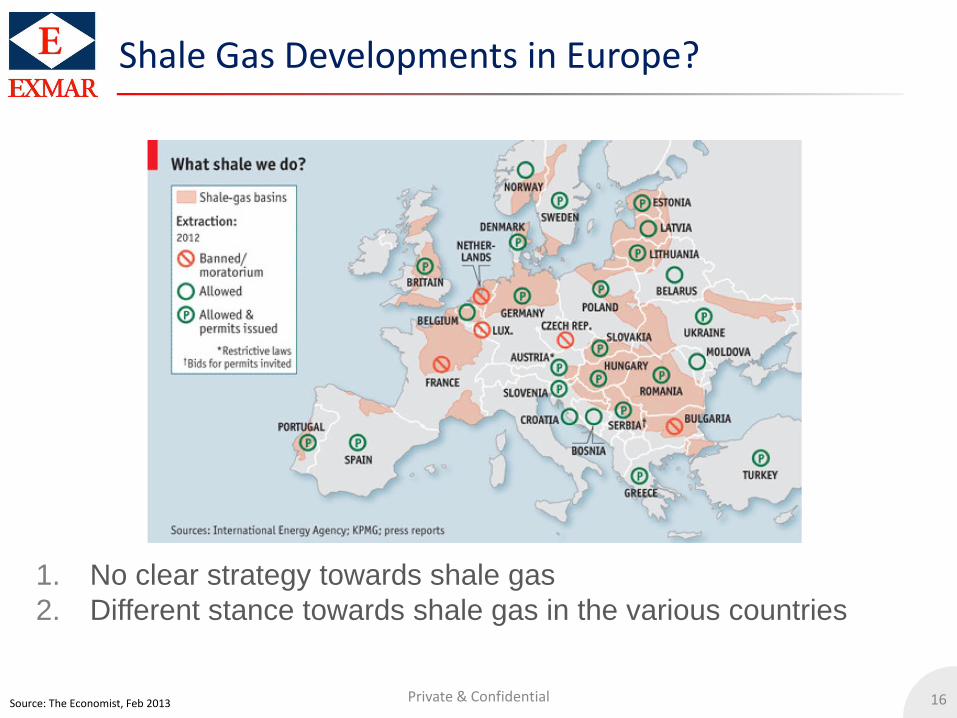
Shale Gas Developments in Europe?
1. No clear strategy towards shale gas
2. Different stance towards shale gas in the various countries
Source: The Economist, Feb 2013
17 Private & Confidential
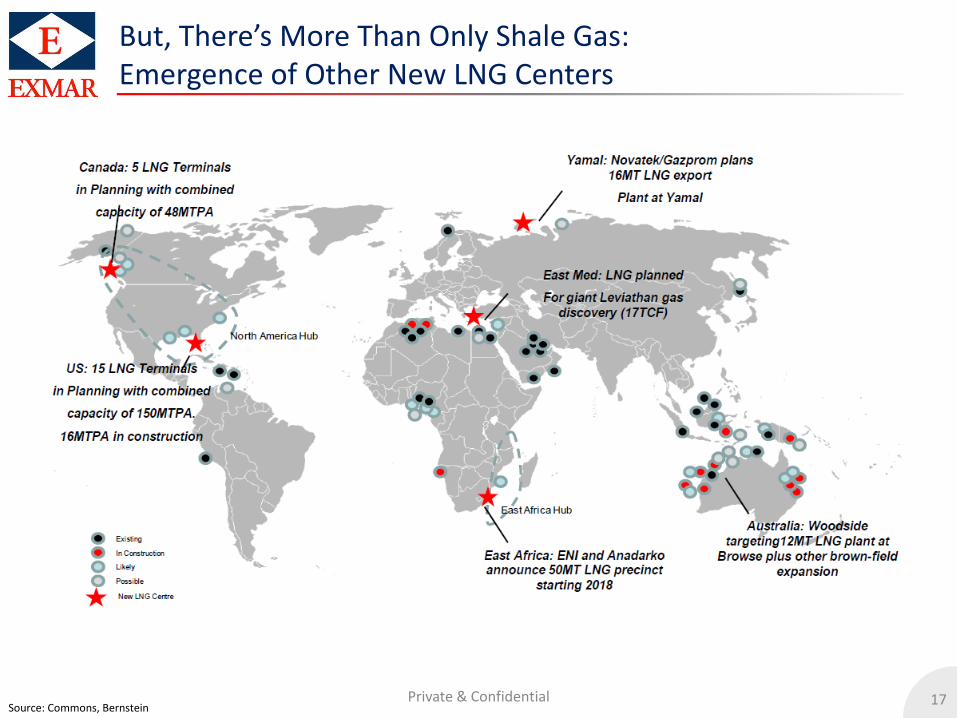
But, There’s More Than Only Shale Gas: Emergence of Other New LNG Centers
Source: Commons, Bernstein
18
18
Thank you for your attention!
The New Dash For Gas - The Big Potential of “Floating Gas Infrastructure”
19 Private & Confidential
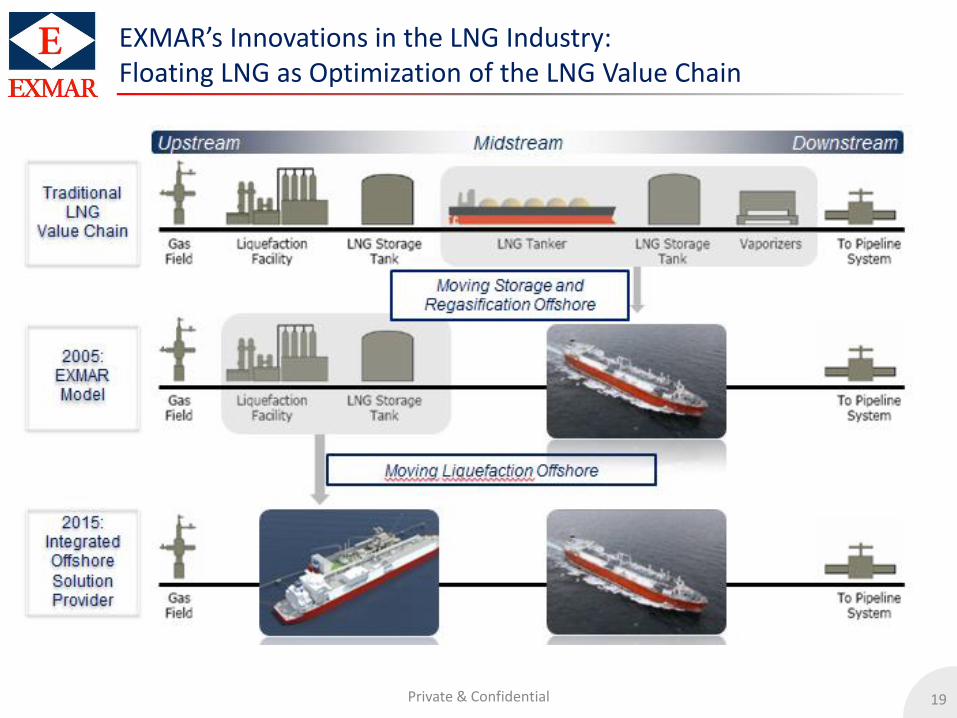
EXMAR’s Innovations in the LNG Industry: Floating LNG as Optimization of the LNG Value Chain
20 Private & Confidential
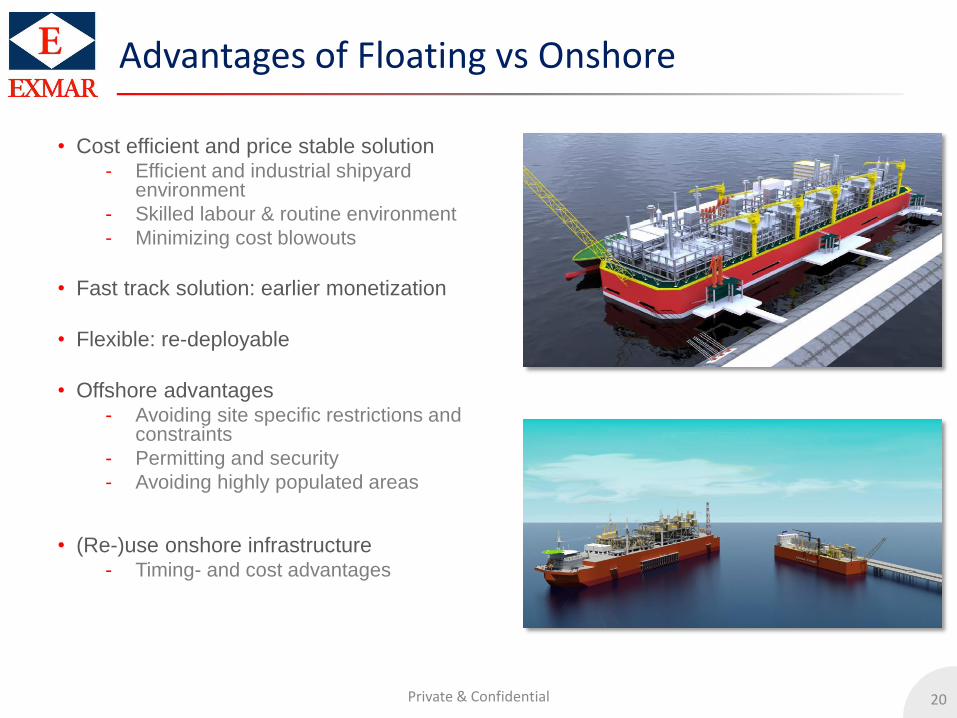
Advantages of Floating vs Onshore
• Cost efficient and price stable solution - Efficient and industrial shipyard
environment
- Skilled labour & routine environment
- Minimizing cost blowouts
• Fast track solution: earlier monetization
• Flexible: re-deployable
• Offshore advantages - Avoiding site specific restrictions and
constraints
- Permitting and security
- Avoiding highly populated areas
• (Re-)use onshore infrastructure - Timing- and cost advantages
21 Private & Confidential
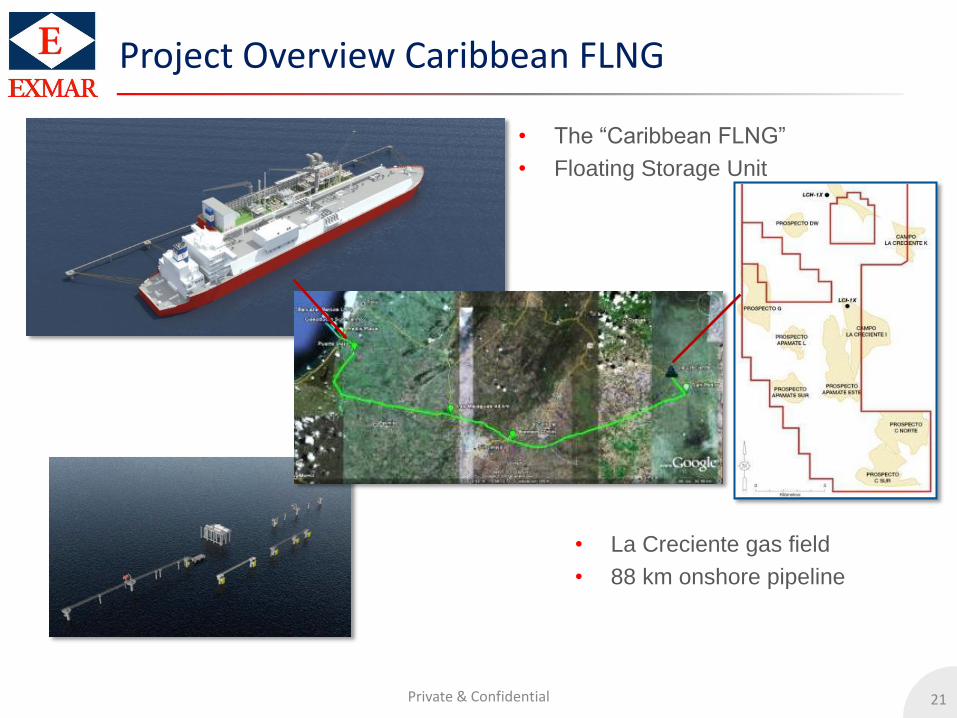
Project Overview Caribbean FLNG
• The “Caribbean FLNG”
• Floating Storage Unit
• La Creciente gas field
• 88 km onshore pipeline
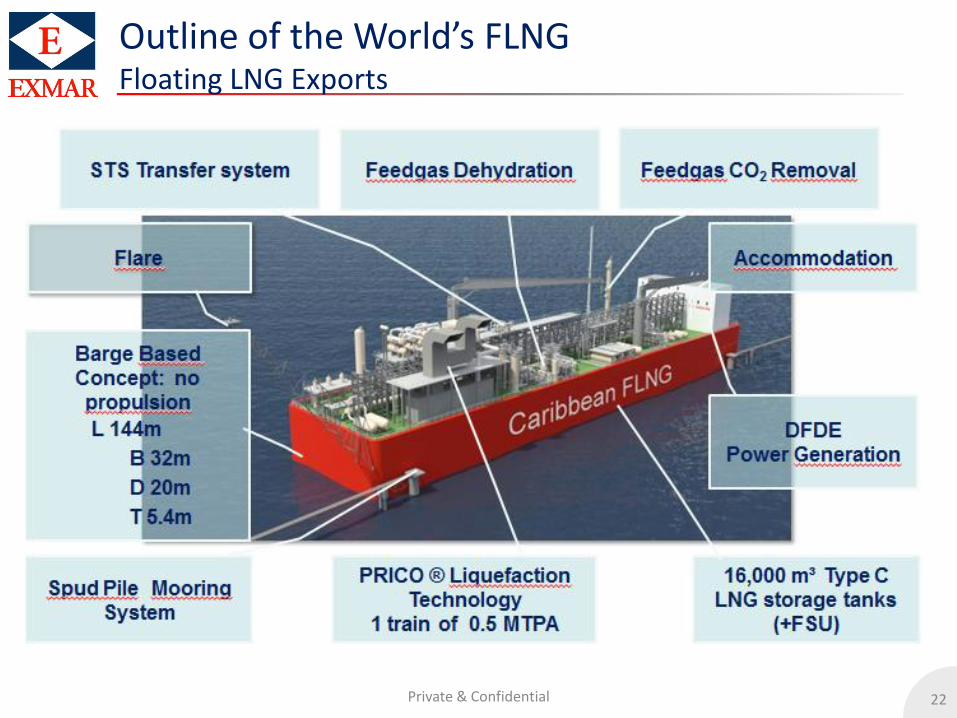
22 Private & Confidential
Outline of the World’s FLNG Floating LNG Exports
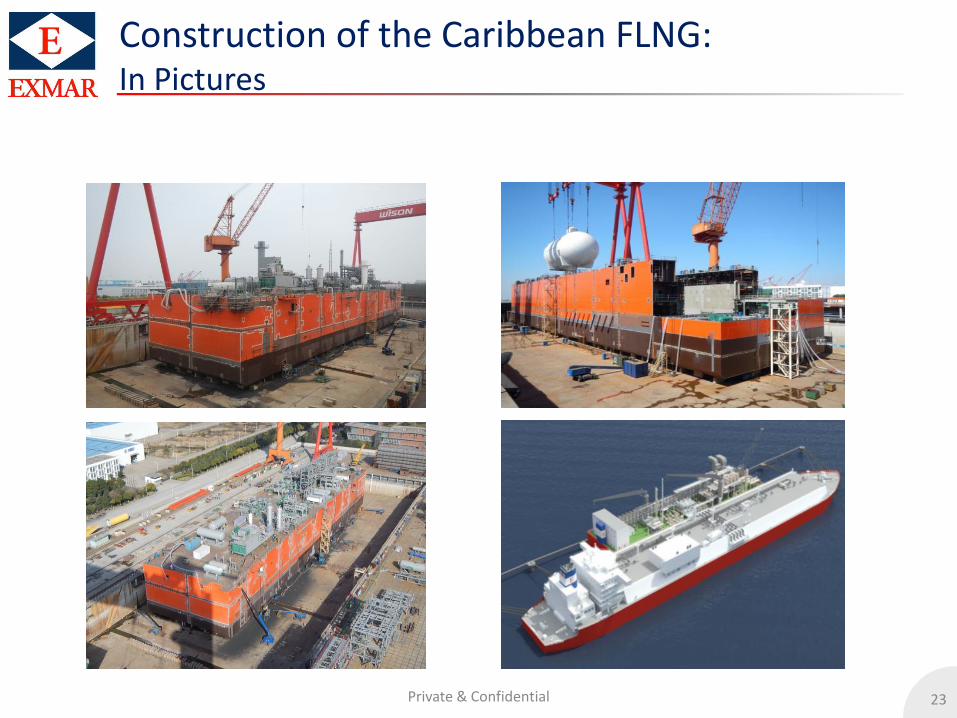
23 Private & Confidential
Construction of the Caribbean FLNG: In Pictures
24 Private & Confidential
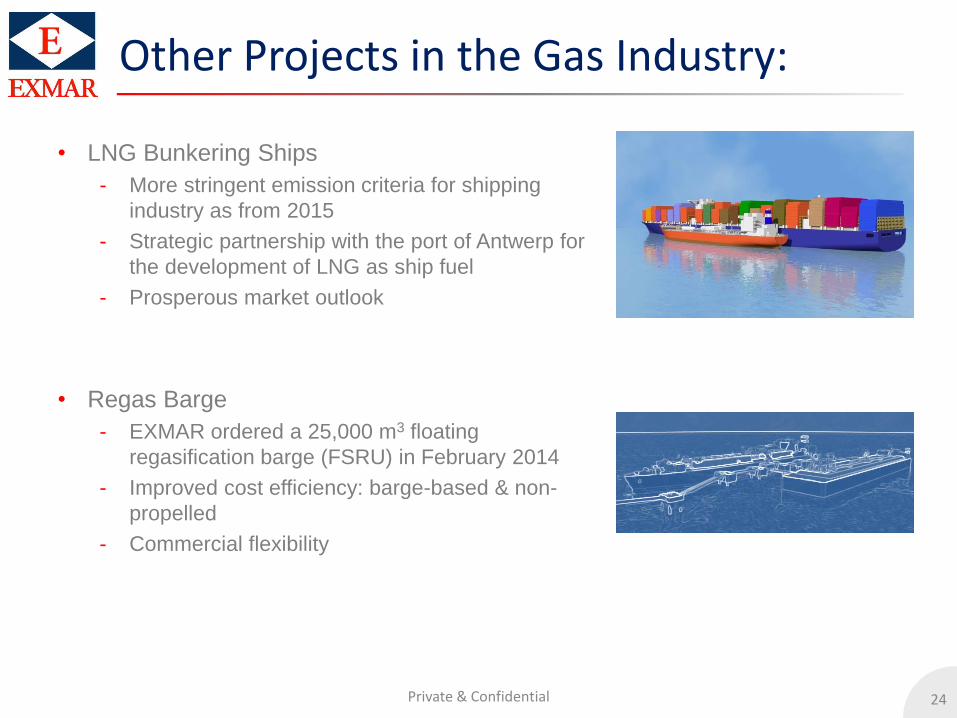
Other Projects in the Gas Industry:
• LNG Bunkering Ships
- More stringent emission criteria for shipping
industry as from 2015
- Strategic partnership with the port of Antwerp for
the development of LNG as ship fuel
- Prosperous market outlook
• Regas Barge
- EXMAR ordered a 25,000 m3 floating
regasification barge (FSRU) in February 2014
- Improved cost efficiency: barge-based & non-
propelled
- Commercial flexibility
25 Private & Confidential
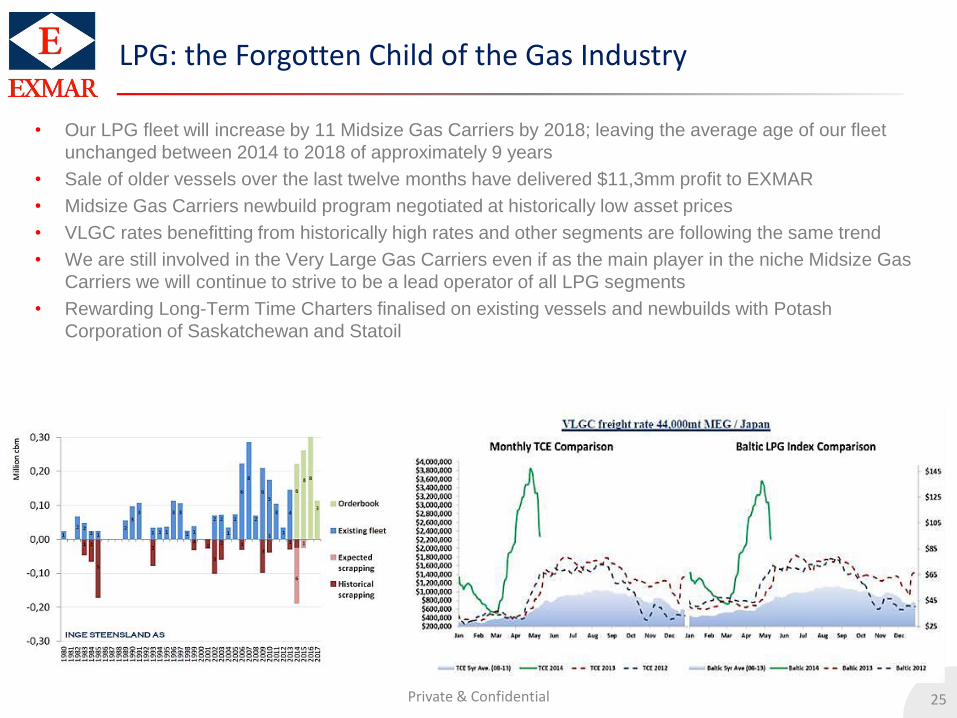
LPG: the Forgotten Child of the Gas Industry
• Our LPG fleet will increase by 11 Midsize Gas Carriers by 2018; leaving the average age of our fleet
unchanged between 2014 to 2018 of approximately 9 years
• Sale of older vessels over the last twelve months have delivered $11,3mm profit to EXMAR
• Midsize Gas Carriers newbuild program negotiated at historically low asset prices
• VLGC rates benefitting from historically high rates and other segments are following the same trend
• We are still involved in the Very Large Gas Carriers even if as the main player in the niche Midsize Gas
Carriers we will continue to strive to be a lead operator of all LPG segments
• Rewarding Long-Term Time Charters finalised on existing vessels and newbuilds with Potash
Corporation of Saskatchewan and Statoil
26
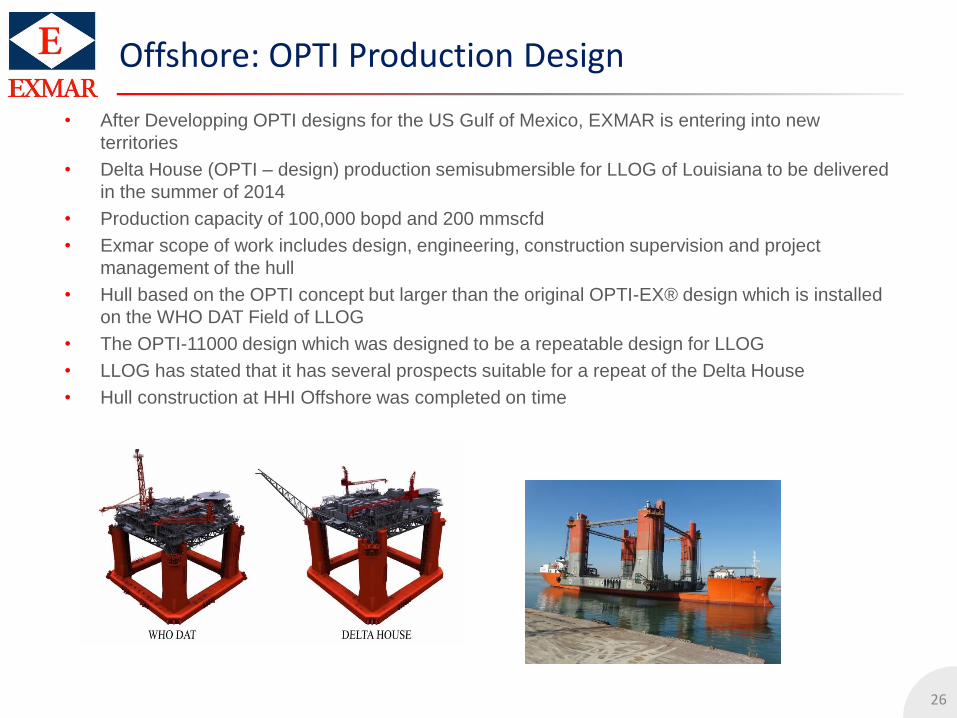
Offshore: OPTI Production Design
• After Developping OPTI designs for the US Gulf of Mexico, EXMAR is entering into new
territories
• Delta House (OPTI – design) production semisubmersible for LLOG of Louisiana to be delivered
in the summer of 2014
• Production capacity of 100,000 bopd and 200 mmscfd
• Exmar scope of work includes design, engineering, construction supervision and project
management of the hull
• Hull based on the OPTI concept but larger than the original OPTI-EX® design which is installed
on the WHO DAT Field of LLOG
• The OPTI-11000 design which was designed to be a repeatable design for LLOG
• LLOG has stated that it has several prospects suitable for a repeat of the Delta House
• Hull construction at HHI Offshore was completed on time
27
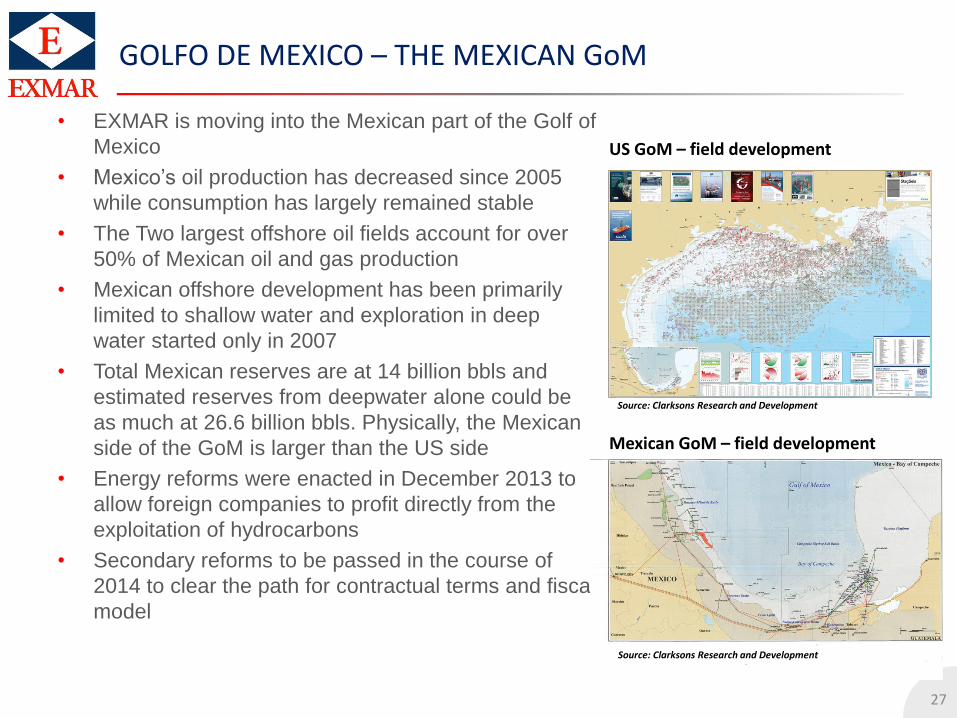
GOLFO DE MEXICO – THE MEXICAN GoM
• EXMAR is moving into the Mexican part of the Golf of
Mexico
• Mexico’s oil production has decreased since 2005
while consumption has largely remained stable
• The Two largest offshore oil fields account for over
50% of Mexican oil and gas production
• Mexican offshore development has been primarily
limited to shallow water and exploration in deep
water started only in 2007
• Total Mexican reserves are at 14 billion bbls and
estimated reserves from deepwater alone could be
as much at 26.6 billion bbls. Physically, the Mexican
side of the GoM is larger than the US side
• Energy reforms were enacted in December 2013 to
allow foreign companies to profit directly from the
exploitation of hydrocarbons
• Secondary reforms to be passed in the course of
2014 to clear the path for contractual terms and fiscal
model
US GoM – field development
Mexican GoM – field development
Source: Clarksons Research and Development
Source: Clarksons Research and Development
28
Floating Production
• Approximately 50 floating production facilities (SPARs, TLPs, Semisubmersibles and
FPSOs) operate in the Gulf of Mexico
• More than 90% are in the US GoM
• Mexico has 1 large FPSO and 4 small single well production vessels (early
production and well test vessels)
• US GoM production facilities vary because of the development of pipeline
infrastructure. A similar pipeline network is not expected to be installed in Mexico
which leaves FPSOs as the likely floating production solution
• Globally, worldwide FPSO demand is expected to be in the range of 65 to 93 units
over the next 5 years whereas all other production solutions are expected to be in the
range of 14 to 27 for the same period not including FLNG and FSRU
29 Private & Confidential
A Strategic Move: Integrating the Energy Value Chain
Transition from pure shipping to a provider of a full value chain of infrastructure and integrated logistics to
address the industry’s need for environmentally friendly and competitively priced energy solutions.
• LNG:
- Building on the production of Natural Gas from LNG through its LNGRV concept to now focus on
providing fully fledged floating LNG value chain services through build, own and operate FLSU and
FSRU to bring LNG as a competitive and greener alternative to the markets.
- Pursuing opportunities in “small scale” LNG vessels for bunkering as well as coastal and domestic
trade
- Structuring and listing an MLP comprised of high-quality LNG and LNGRV assets to achieve a yield
valuation and to facilitate significant future growth in the Floating LNG Infrastructure
• OFFSHORE:
- Building on the success of its proprietary hull designs, Exmar continues to develop projects along
the E&P value chain with a specific focus on offshore floating operations
- Capitalize on the growing Floating Production and Storage Unit Market
• LPG:
- Partnership with Teekay LNG to strengthen EXMAR’s already substantial commercial portfolio in the
Midsize segment and to stay ahead of the upcoming amendments in environmental legislation.
EXMAR wishes to pursue its tradition of providing operational and technical excellence at the
service of its customers with a competitive quality fleet based on innovative designs.
- In order to provide a full package service to its customers EXMAR will continue to pursue projects in
the VLGC, MGC and the pressurized segment as well as developing new opportunities in Very
Large Ethane Carriers (VLEC)
30 Private & Confidential
Key-Figures 2013
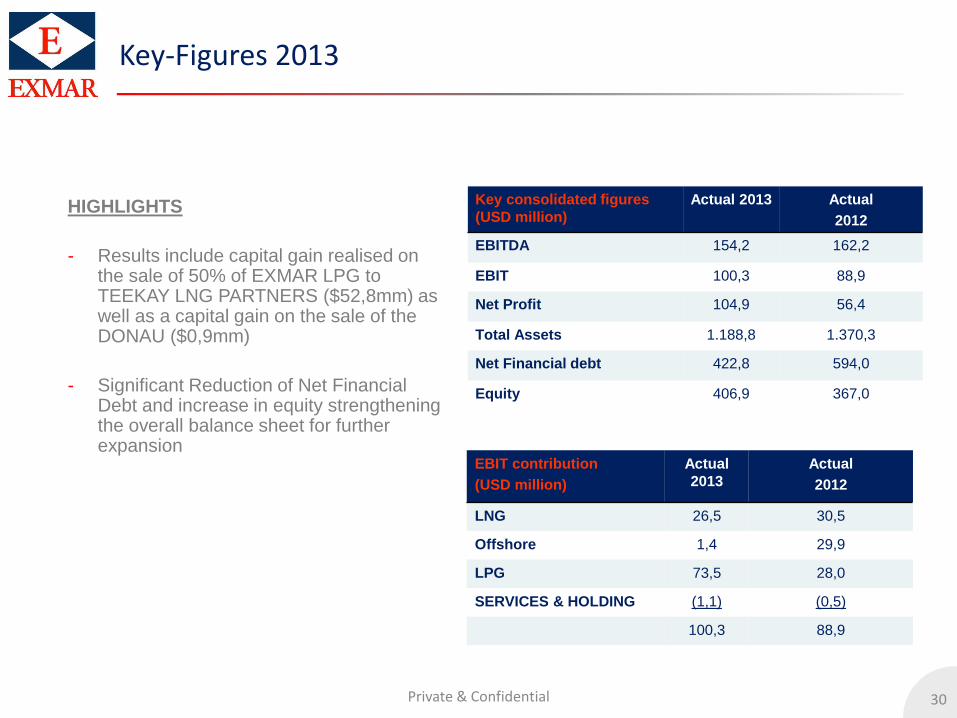
HIGHLIGHTS
- Results include capital gain realised on the sale of 50% of EXMAR LPG to TEEKAY LNG PARTNERS ($52,8mm) as well as a capital gain on the sale of the DONAU ($0,9mm)
- Significant Reduction of Net Financial Debt and increase in equity strengthening the overall balance sheet for further expansion
Key consolidated figures
(USD million)
Actual 2013 Actual
2012
EBITDA 154,2 162,2
EBIT 100,3 88,9
Net Profit 104,9 56,4
Total Assets 1.188,8 1.370,3
Net Financial debt 422,8 594,0
Equity 406,9 367,0
EBIT contribution
(USD million)
Actual
2013
Actual
2012
LNG 26,5 30,5
Offshore 1,4 29,9
LPG 73,5 28,0
SERVICES & HOLDING (1,1) (0,5)
100,3 88,9
31 Private & Confidential
Key-Figures Q1 2014
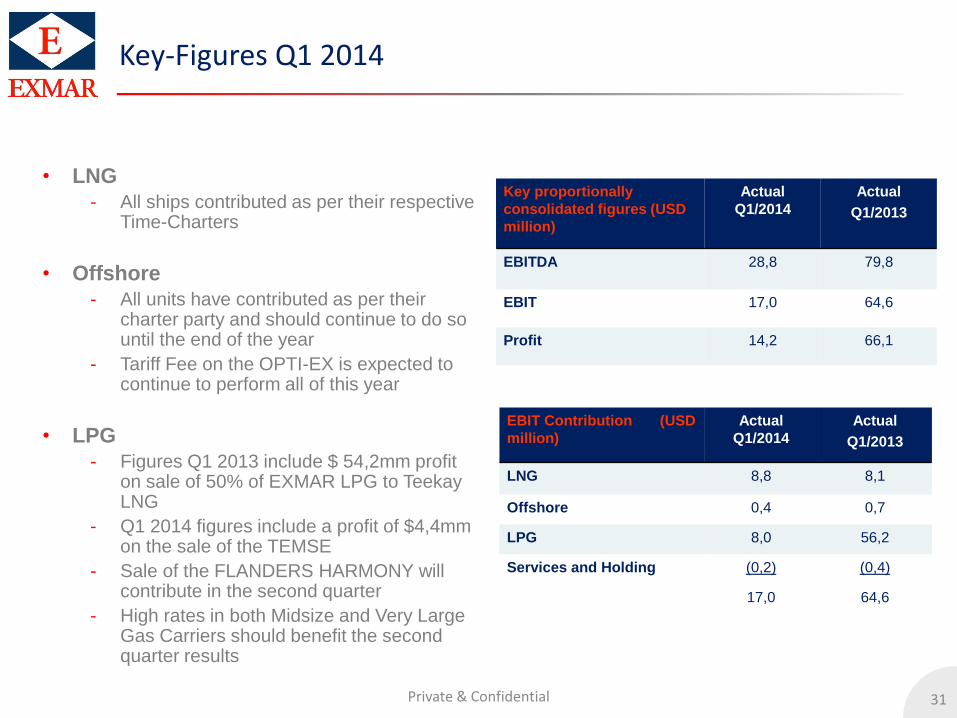
• LNG
- All ships contributed as per their respective Time-Charters
• Offshore
- All units have contributed as per their charter party and should continue to do so until the end of the year
- Tariff Fee on the OPTI-EX is expected to continue to perform all of this year
• LPG
- Figures Q1 2013 include $ 54,2mm profit on sale of 50% of EXMAR LPG to Teekay LNG
- Q1 2014 figures include a profit of $4,4mm on the sale of the TEMSE
- Sale of the FLANDERS HARMONY will contribute in the second quarter
- High rates in both Midsize and Very Large Gas Carriers should benefit the second quarter results
Key proportionally
consolidated figures (USD
million)
Actual
Q1/2014
Actual
Q1/2013
EBITDA 28,8 79,8
EBIT 17,0 64,6
Profit 14,2 66,1
EBIT Contribution (USD
million)
Actual
Q1/2014
Actual
Q1/2013
LNG 8,8 8,1
Offshore 0,4 0,7
LPG 8,0 56,2
Services and Holding (0,2) (0,4)
17,0 64,6
32
EXMAR NV De Gerlachekaai 20 B-2000 Antwerp Belgium www.exmar.be
32