Embed Size (px)
Citation preview
2017EXMAR
02
01
03
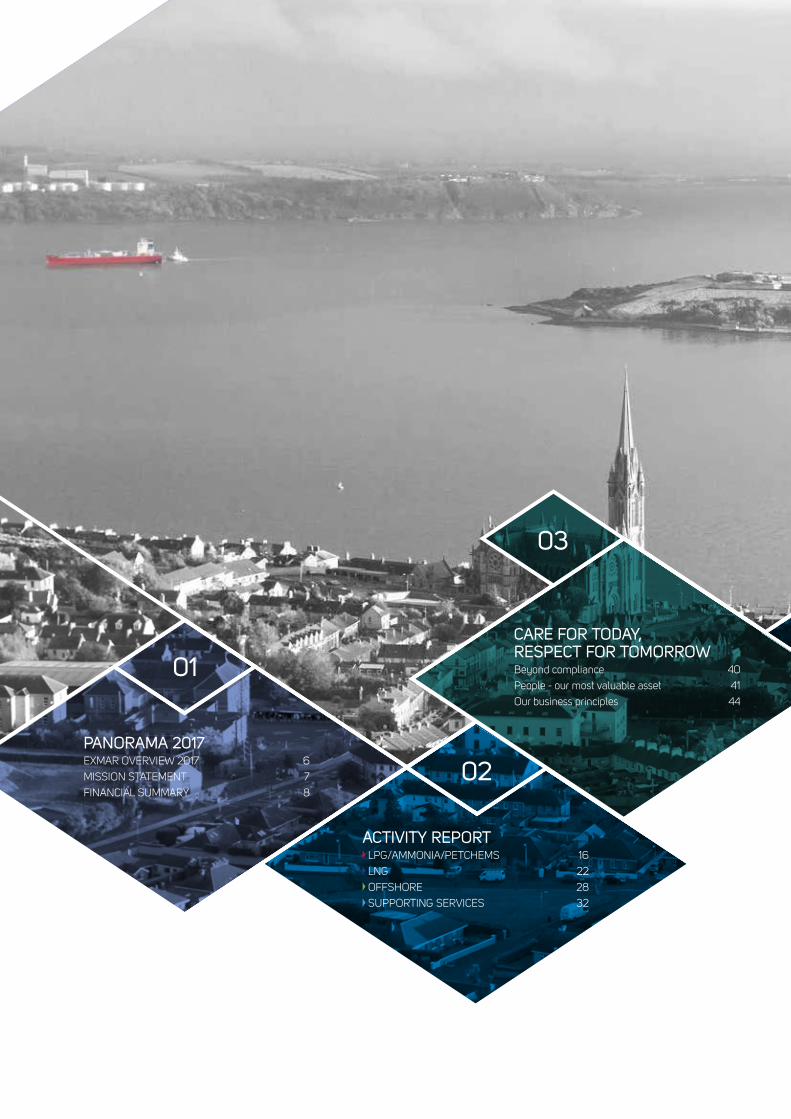
CARE FOR TODAY, RESPECT FOR TOMORROWBeyond compliance 40
People - our most valuable asset 41
Our business principles 44
ACTIVITY REPORT LPG/AMMONIA/PETCHEMS 16
LNG 22
OFFSHORE 28
SUPPORTING SERVICES 32
PANORAMA 2017EXMAR OVERVIEW 2017 6
MISSION STATEMENT 7
FINANCIAL SUMMARY 8

04
CONTENTS
FINANCIAL REPORT Corporate Governance Statement 49
Annual Report 62
Consolidated financial statements 69
Statutory financial statements 131
COLOPHON, GLOSSARY Colophon 133
Glossary 134
05
EXMAR OVERVIEW 2017 MISSION STATEMENT FINANCIAL SUMMARY INFORMATION FOR OUR SHAREHOLDERS EXMAR IN THE WORLD CARGO TRANSPORTED EXMAR FLEET
PANORAMA
01
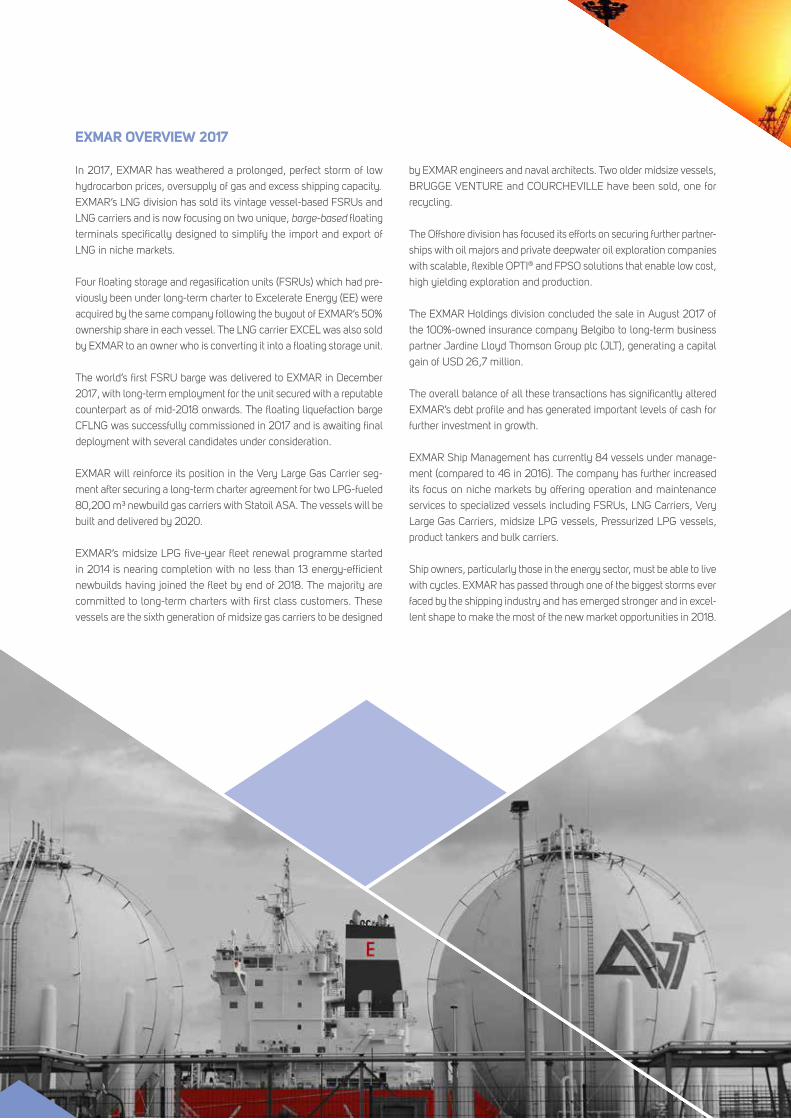
EXMAR OVERVIEW 2017
In 2017, EXMAR has weathered a prolonged, perfect storm of low
hydrocarbon prices, oversupply of gas and excess shipping capacity.
EXMAR’s LNG division has sold its vintage vessel-based FSRUs and
LNG carriers and is now focusing on two unique, barge-based floating
terminals specifically designed to simplify the import and export of
LNG in niche markets.
Four floating storage and regasification units (FSRUs) which had pre-
viously been under long-term charter to Excelerate Energy (EE) were
acquired by the same company following the buyout of EXMAR’s 50%
ownership share in each vessel. The LNG carrier EXCEL was also sold
by EXMAR to an owner who is converting it into a floating storage unit.
The world’s first FSRU barge was delivered to EXMAR in December
2017, with long-term employment for the unit secured with a reputable
counterpart as of mid-2018 onwards. The floating liquefaction barge
CFLNG was successfully commissioned in 2017 and is awaiting final
deployment with several candidates under consideration.
EXMAR will reinforce its position in the Very Large Gas Carrier seg-
ment after securing a long-term charter agreement for two LPG-fueled
80,200 m³ newbuild gas carriers with Statoil ASA. The vessels will be
built and delivered by 2020.
EXMAR’s midsize LPG five-year fleet renewal programme started
in 2014 is nearing completion with no less than 13 energy-efficient
newbuilds having joined the fleet by end of 2018. The majority are
committed to long-term charters with first class customers. These
vessels are the sixth generation of midsize gas carriers to be designed
by EXMAR engineers and naval architects. Two older midsize vessels,
BRUGGE VENTURE and COURCHEVILLE have been sold, one for
recycling.
The Offshore division has focused its efforts on securing further partner-
ships with oil majors and private deepwater oil exploration companies
with scalable, flexible OPTI® and FPSO solutions that enable low cost,
high yielding exploration and production.
The EXMAR Holdings division concluded the sale in August 2017 of
the 100%-owned insurance company Belgibo to long-term business
partner Jardine Lloyd Thomson Group plc (JLT), generating a capital
gain of USD 26,7 million.
The overall balance of all these transactions has significantly altered
EXMAR’s debt profile and has generated important levels of cash for
further investment in growth.
EXMAR Ship Management has currently 84 vessels under manage-
ment (compared to 46 in 2016). The company has further increased
its focus on niche markets by offering operation and maintenance
services to specialized vessels including FSRUs, LNG Carriers, Very
Large Gas Carriers, midsize LPG vessels, Pressurized LPG vessels,
product tankers and bulk carriers.
Ship owners, particularly those in the energy sector, must be able to live
with cycles. EXMAR has passed through one of the biggest storms ever
faced by the shipping industry and has emerged stronger and in excel-
lent shape to make the most of the new market opportunities in 2018.
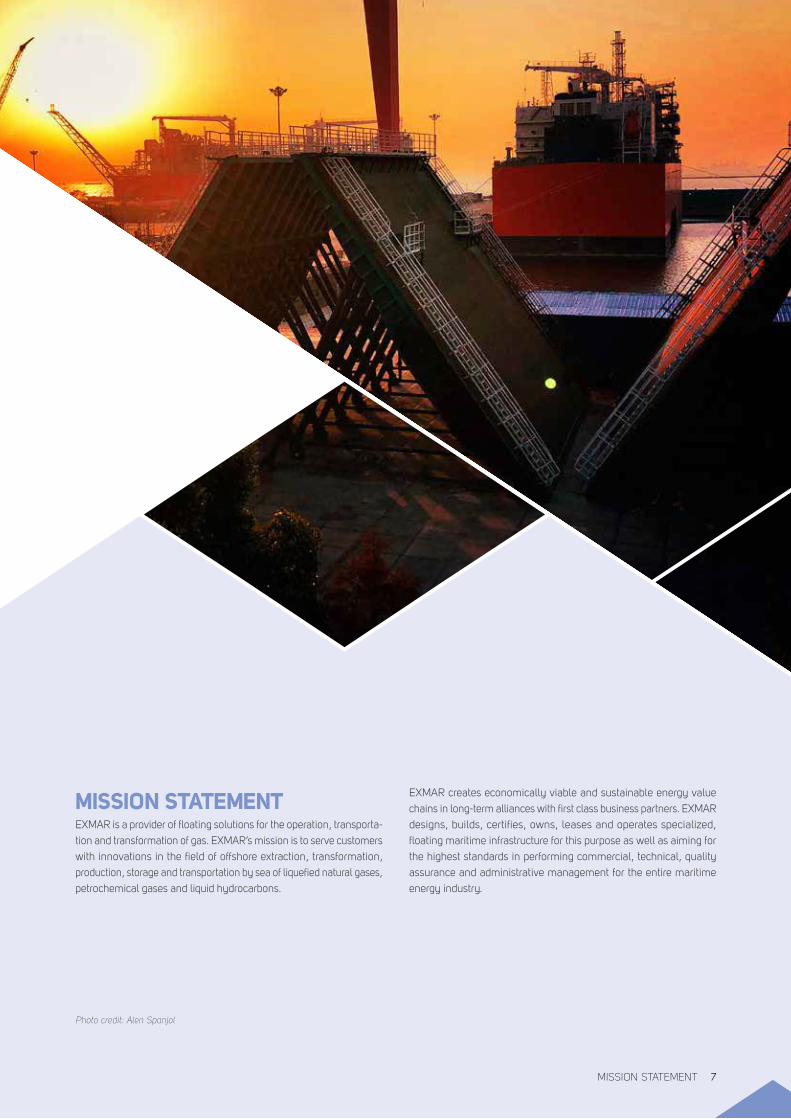
MISSION STATEMENTEXMAR is a provider of floating solutions for the operation, transporta-
tion and transformation of gas. EXMAR’s mission is to serve customers
with innovations in the field of offshore extraction, transformation,
production, storage and transportation by sea of liquefied natural gases,
petrochemical gases and liquid hydrocarbons.
Photo credit: Alen Spanjol
EXMAR creates economically viable and sustainable energy value
chains in long-term alliances with first class business partners. EXMAR
designs, builds, certifies, owns, leases and operates specialized,
floating maritime infrastructure for this purpose as well as aiming for
the highest standards in performing commercial, technical, quality
assurance and administrative management for the entire maritime
energy industry.
MISSION STATEMENT 7
International Financial Reporting Standards (IFRS 11)
(Note 1)
Management reporting basedon proportionate consolidation
(Note 2)
31/12/2017Restated (*)31/12/2016 31/12/2017
Restated (*)31/12/2016
CONSOLIDATED STATEMENT OF PROFIT OR LOSS (IN MILLION USD)Turnover 93.4 96.0 227.6 278.5
EBITDA 58.6 7.8 141.4 116.5
Depreciations and impairment losses -8.0 -6.8 -71.4 -46.1
Operating result (EBIT) 50.6 1.0 70.0 70.4
Net finance result (*) -40.0 4.3 -40.5 -31.2
Share in the result of equity accounted investees (net of income tax) 18.7 34.6 0.1 0.7
Result before tax 29.3 39.9 29.6 39.9
Tax -1.3 0.5 -1.6 0.5
Consolidated result after tax 28.0 40.4 28.0 40.4
of which group share 28.0 40.4 28.0 40.4
INFORMATION PER SHARE (IN USD PER SHARE)Weighted average number of shares of the period 56,832,558 56,751,292 56,832,558 56,751,292
EBITDA 1.03 0.14 2.49 2.05
EBIT (operating result) 0.89 0.02 1.23 1.24
Consolidated result after tax 0.49 0.71 0.49 0.71
INFORMATION PER SHARE (IN EUR PER SHARE)Exchange rate 1.1249 1.1061 1.1249 1.1061
EBITDA 0.92 0.12 2.21 1.86
EBIT (operating result) 0.79 0.02 1.09 1.12
Consolidated result after tax 0.44 0.64 0.44 0.64
FINANCIAL SUMMARY
Note 1: The figures in these columns have been prepared in accordance with IFRS as adopted by the EU.
Note 2: The figures in these columns show joint ventures applying the proportionate consolidation method instead of applying the equity method. The amounts in these columns correspond with the amounts in the ‘Total’ column of Note 2 Segment Reporting in the Financial Report per 31 December 2017. A reconciliation between the amounts applying the proportionate method and the equity method is shown in Note 3 in the Financial Report per 31 December 2017.
(*) IAS 23 requires that borrowing costs which are attributable to the construction of vessels are to be capitalized as part of the asset. As a consequence of the non-application of IAS 23 in prior periods, the opening balances of vessels under construction, the interest cost of the prior period as well as the equity have been restated. We refer to note 11 in the Financial Report per 31 December 2017.
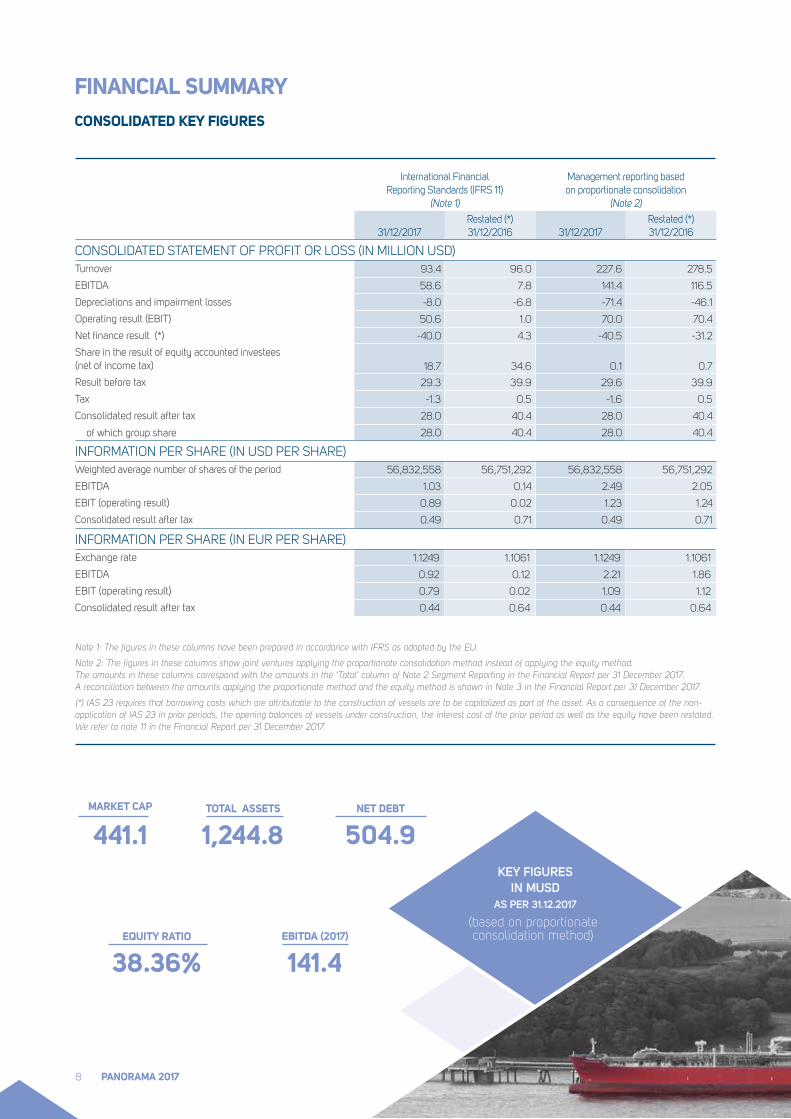
CONSOLIDATED KEY FIGURES
EQUITY RATIO
38.36%EBITDA (2017)
141.4
TOTAL ASSETS
1,244.8NET DEBT
504.9KEY FIGURES
IN MUSDAS PER 31.12.2017
(based on proportionate consolidation method)
MARKET CAP
441.1
PANORAMA 20178
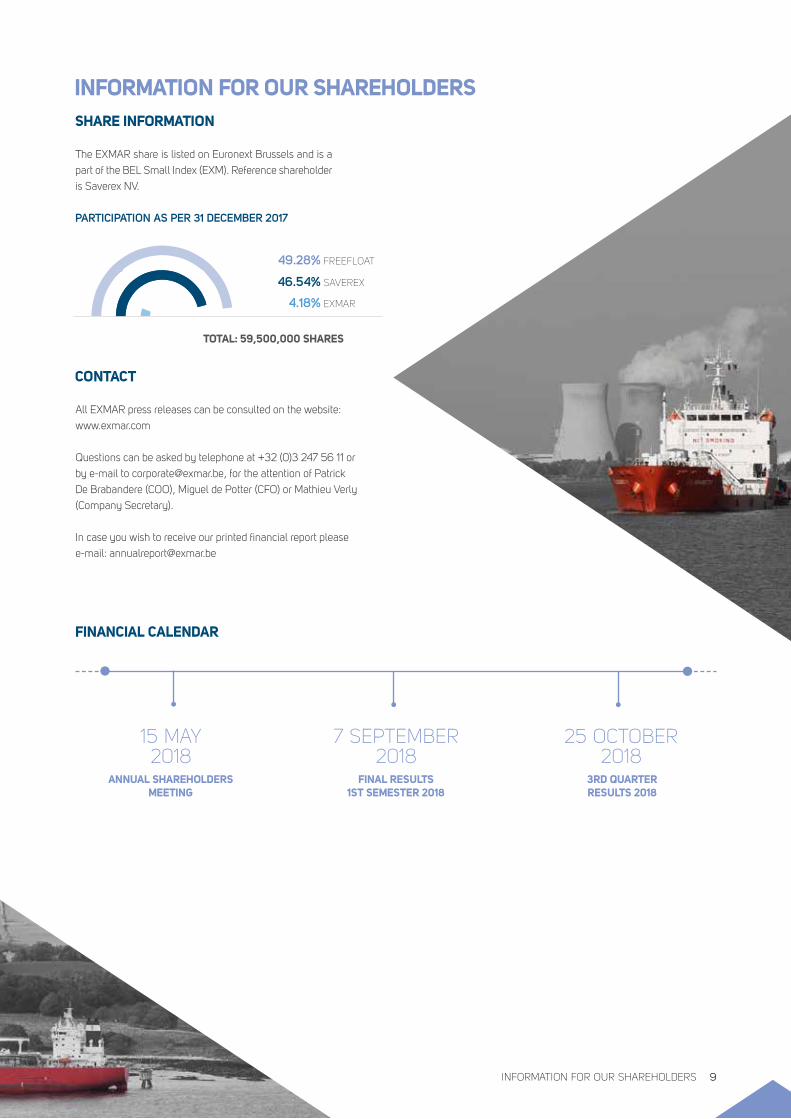
INFORMATION FOR OUR SHAREHOLDERSSHARE INFORMATION
CONTACT
FINANCIAL CALENDAR
The EXMAR share is listed on Euronext Brussels and is a
part of the BEL Small Index (EXM). Reference shareholder
is Saverex NV.
All EXMAR press releases can be consulted on the website:
www.exmar.com
Questions can be asked by telephone at +32 (0)3 247 56 11 or
by e-mail to [email protected], for the attention of Patrick
De Brabandere (COO), Miguel de Potter (CFO) or Mathieu Verly
(Company Secretary).
In case you wish to receive our printed financial report please
e-mail: [email protected] ��������
��
��
��
� 46.54% SAVEREX
4.18% EXMAR
49.28% FREEFLOAT
TOTAL: 59,500,000 SHARES
PARTICIPATION AS PER 31 DECEMBER 2017
ANNUAL SHAREHOLDERS MEETING
FINAL RESULTS 1ST SEMESTER 2018
3RD QUARTER RESULTS 2018
15 MAY 2018
7 SEPTEMBER 2018
25 OCTOBER 2018
INFORMATION FOR OUR SHAREHOLDERS 9
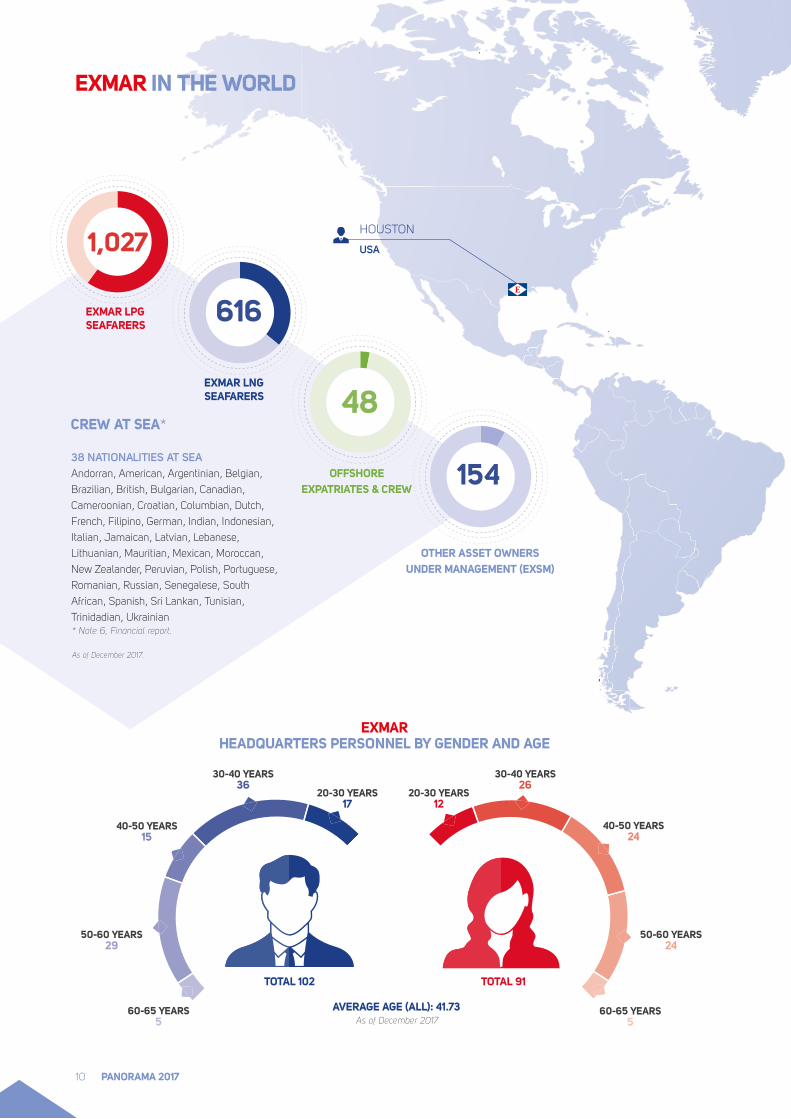
HOUSTON
USA�1,027
�616
�154
20-30 YEARS17
30-40 YEARS36
30-40 YEARS26
40-50 YEARS15
50-60 YEARS29
60-65 YEARS5
TOTAL 102
AVERAGE AGE (ALL): 41.73
TOTAL 91
20-30 YEARS12
40-50 YEARS24
50-60 YEARS24
60-65 YEARS5
EXMAR HEADQUARTERS PERSONNEL BY GENDER AND AGE
EXMAR IN THE WORLD
�4838 NATIONALITIES AT SEAAndorran, American, Argentinian, Belgian,
Brazilian, British, Bulgarian, Canadian,
Cameroonian, Croatian, Columbian, Dutch,
French, Filipino, German, Indian, Indonesian,
Italian, Jamaican, Latvian, Lebanese,
Lithuanian, Mauritian, Mexican, Moroccan,
New Zealander, Peruvian, Polish, Portuguese,
Romanian, Russian, Senegalese, South
African, Spanish, Sri Lankan, Tunisian,
Trinidadian, Ukrainian
CREW AT SEA*
OTHER ASSET OWNERS UNDER MANAGEMENT (EXSM)
EXMAR LNG SEAFARERS
OFFSHORE EXPATRIATES & CREW
EXMAR LPG SEAFARERS
* Note 6, Financial report. As of December 2017.
As of December 2017
PANORAMA 201710
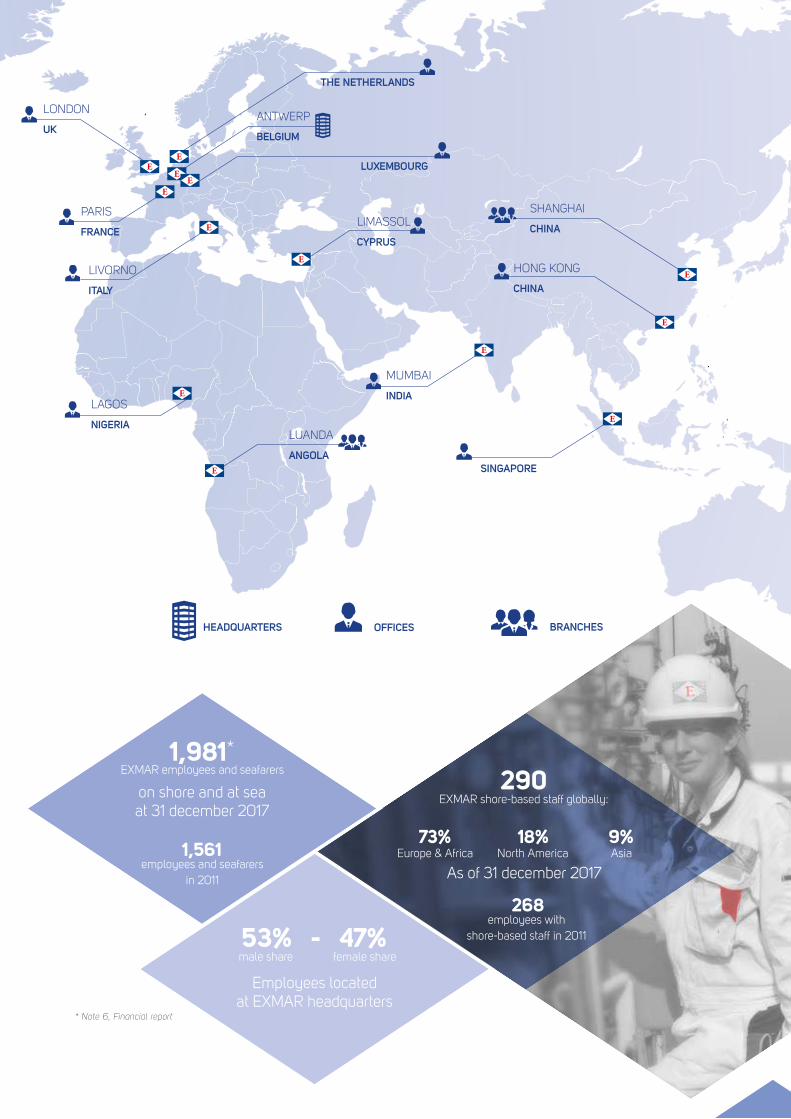
HEADQUARTERS OFFICES BRANCHES
LONDON
UKANTWERP
BELGIUM
THE NETHERLANDS
LUXEMBOURG
PARIS
FRANCE
LIVORNO
ITALY
LIMASSOL
CYPRUS
LUANDA
ANGOLA
MUMBAI
INDIA
SINGAPORE
HONG KONG
CHINA
SHANGHAI
CHINA
LAGOS
NIGERIA
Employees located at EXMAR headquarters
53% - 47%female sharemale share
As of 31 december 2017
290EXMAR shore-based staff globally:on shore and at sea
at 31 december 2017
1,981*
1,561
268
EXMAR employees and seafarers
employees and seafarers in 2011
employees with shore-based staff in 2011
73% 18% 9%Europe & Africa North America Asia
* Note 6, Financial report
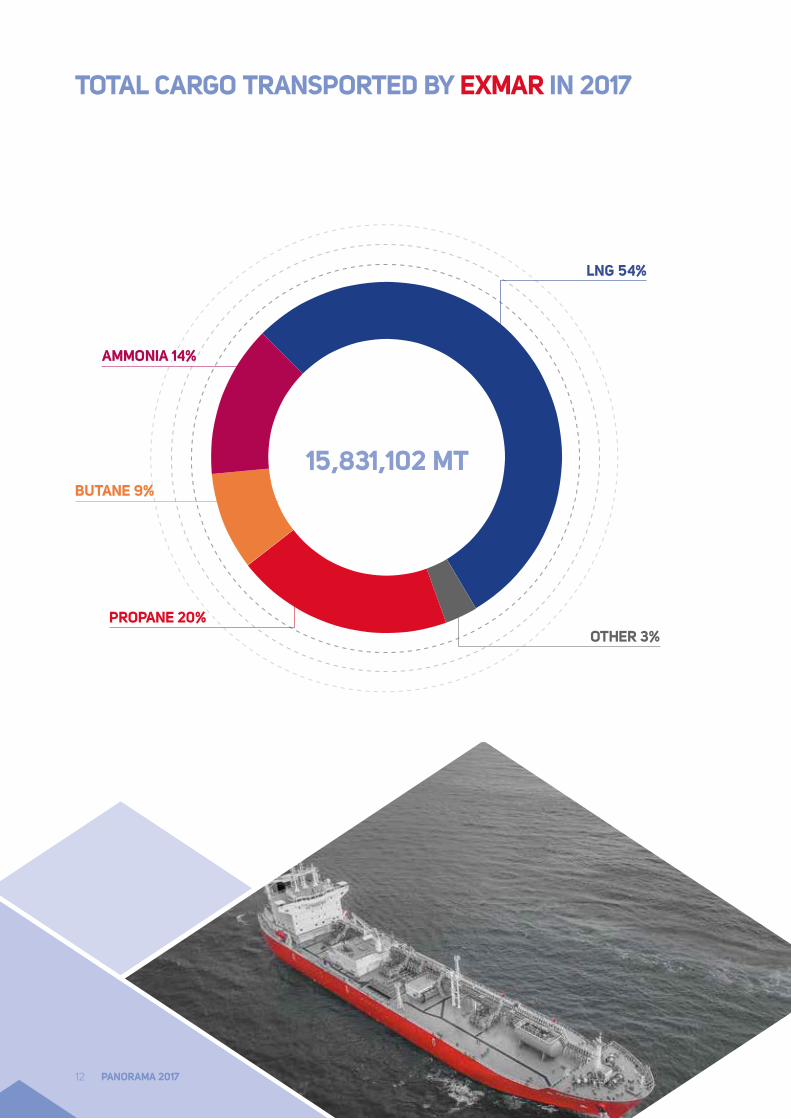
TOTAL CARGO TRANSPORTED BY EXMAR IN 2017
�����15,831,102 MT
LNG 54%
OTHER 3%
BUTANE 9%
AMMONIA 14%
PROPANE 20%
PANORAMA 201712
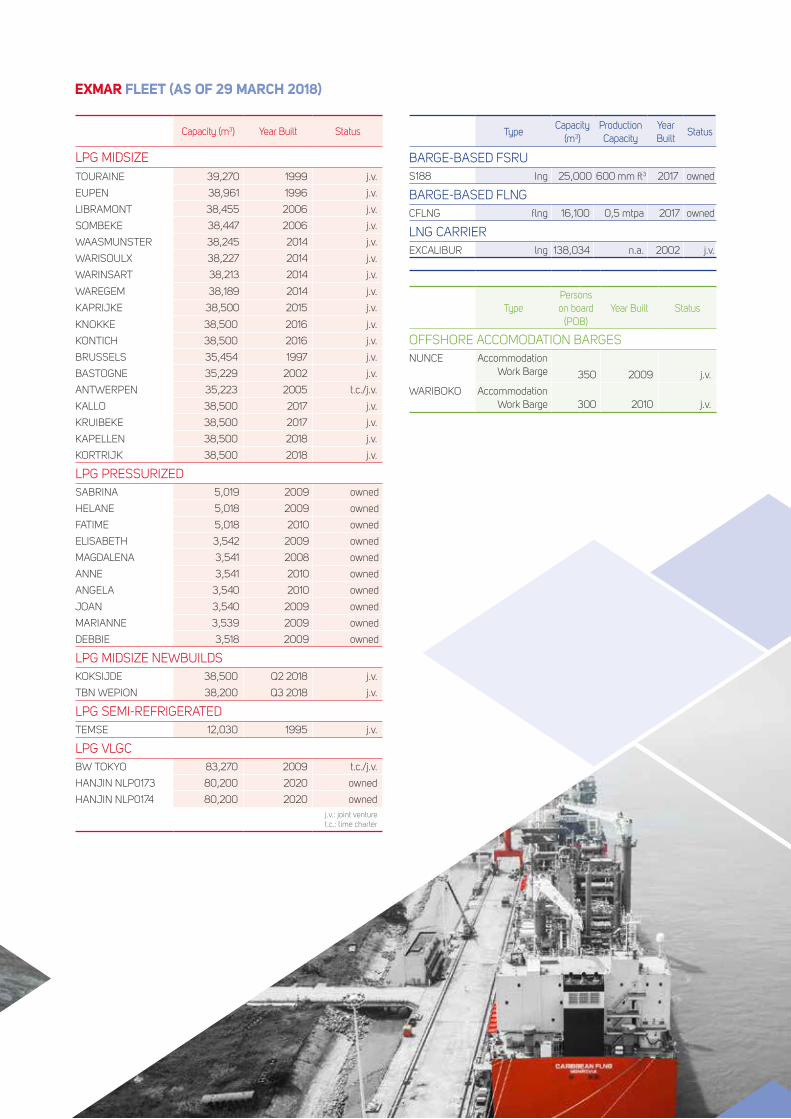
EXMAR FLEET (AS OF 29 MARCH 2018)
Capacity (m3) Year Built Status
LPG MIDSIZETOURAINE 39,270 1999 j.v.
EUPEN 38,961 1996 j.v.
LIBRAMONT 38,455 2006 j.v.
SOMBEKE 38,447 2006 j.v.
WAASMUNSTER 38,245 2014 j.v.
WARISOULX 38,227 2014 j.v.
WARINSART 38,213 2014 j.v.
WAREGEM 38,189 2014 j.v.
KAPRIJKE 38,500 2015 j.v.
KNOKKE 38,500 2016 j.v.
KONTICH 38,500 2016 j.v.
BRUSSELS 35,454 1997 j.v.
BASTOGNE 35,229 2002 j.v.
ANTWERPEN 35,223 2005 t.c./j.v.
KALLO 38,500 2017 j.v.
KRUIBEKE 38,500 2017 j.v.
KAPELLEN 38,500 2018 j.v.
KORTRIJK 38,500 2018 j.v.
LPG PRESSURIZEDSABRINA 5,019 2009 owned
HELANE 5,018 2009 owned
FATIME 5,018 2010 owned
ELISABETH 3,542 2009 owned
MAGDALENA 3,541 2008 owned
ANNE 3,541 2010 owned
ANGELA 3,540 2010 owned
JOAN 3,540 2009 owned
MARIANNE 3,539 2009 owned
DEBBIE 3,518 2009 owned
LPG MIDSIZE NEWBUILDSKOKSIJDE 38,500 Q2 2018 j.v.
TBN WEPION 38,200 Q3 2018 j.v.
LPG SEMI-REFRIGERATEDTEMSE 12,030 1995 j.v.
LPG VLGCBW TOKYO 83,270 2009 t.c./j.v.
HANJIN NLP0173 80,200 2020 owned
HANJIN NLP0174 80,200 2020 ownedj.v.: joint venturet.c.: time charter
TypeCapacity
(m3)Production Capacity
Year Built
Status
BARGE-BASED FSRUS188 Ing 25,000 600 mm ft3 2017 owned
BARGE-BASED FLNGCFLNG flng 16,100 0,5 mtpa 2017 owned
LNG CARRIEREXCALIBUR lng 138,034 n.a. 2002 j.v.
TypePersons on board
(POB)Year Built Status
OFFSHORE ACCOMODATION BARGESNUNCE Accommodation
Work Barge 350 2009 j.v.
WARIBOKO Accommodation Work Barge 300 2010 j.v.
LPG/AMMONIA/ PETCHEMS
LNG OFFSHORE SUPPORTING SERVICES
ACTIVITY REPORT
02
LPG/AMMONIA/ PETCHEMS
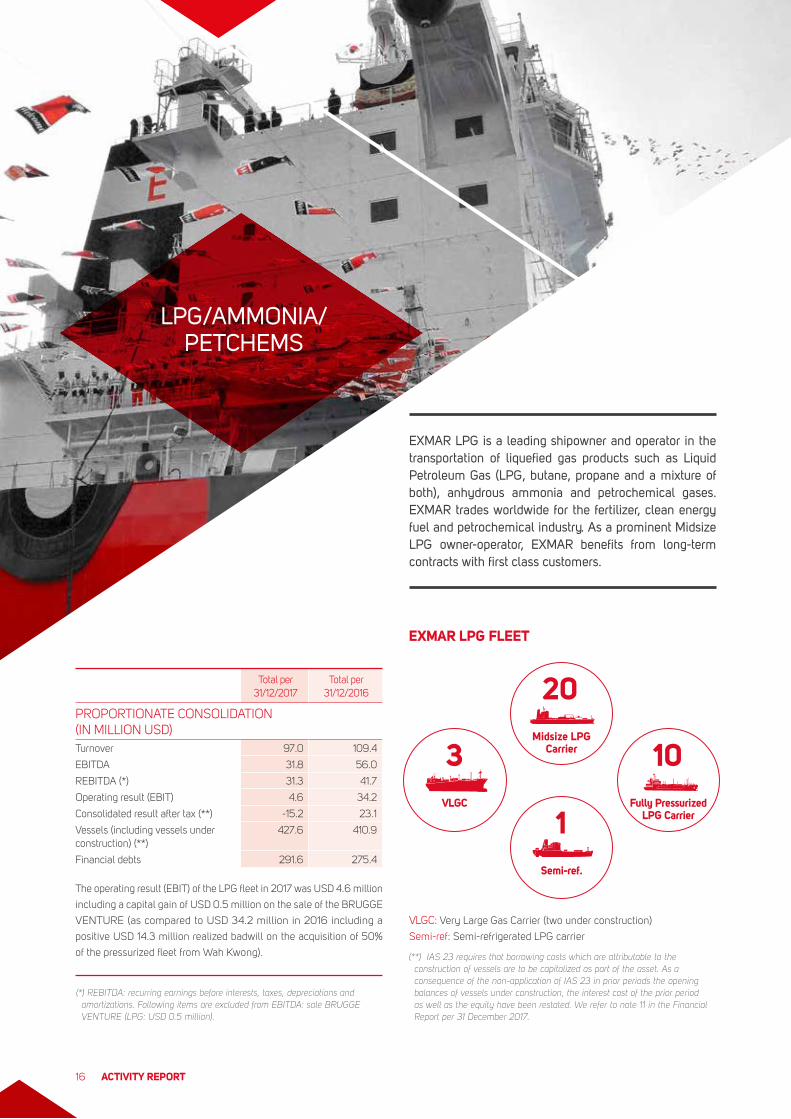
EXMAR LPG is a leading shipowner and operator in the transportation of liquefied gas products such as Liquid Petroleum Gas (LPG, butane, propane and a mixture of both), anhydrous ammonia and petrochemical gases. EXMAR trades worldwide for the fertilizer, clean energy fuel and petrochemical industry. As a prominent Midsize LPG owner-operator, EXMAR benefits from long-term contracts with first class customers.
The operating result (EBIT) of the LPG fleet in 2017 was USD 4.6 million
including a capital gain of USD 0.5 million on the sale of the BRUGGE
VENTURE (as compared to USD 34.2 million in 2016 including a
positive USD 14.3 million realized badwill on the acquisition of 50%
of the pressurized fleet from Wah Kwong).
VLGC: Very Large Gas Carrier (two under construction)
Semi-ref: Semi-refrigerated LPG carrier
Total per31/12/2017
Total per31/12/2016
PROPORTIONATE CONSOLIDATION (IN MILLION USD)Turnover 97.0 109.4
EBITDA 31.8 56.0
REBITDA (*) 31.3 41.7
Operating result (EBIT) 4.6 34.2
Consolidated result after tax (**) -15.2 23.1
Vessels (including vessels under construction) (**)
427.6 410.9
Financial debts 291.6 275.4
EXMAR LPG FLEET
20Midsize LPG
Carrier 10Fully Pressurized
LPG Carrier
3VLGC
1Semi-ref.
(*) REBITDA: recurring earnings before interests, taxes, depreciations and amortizations. Following items are excluded from EBITDA: sale BRUGGE VENTURE (LPG: USD 0.5 million).
(**) IAS 23 requires that borrowing costs which are attributable to the construction of vessels are to be capitalized as part of the asset. As a consequence of the non-application of IAS 23 in prior periods the opening balances of vessels under construction, the interest cost of the prior period as well as the equity have been restated. We refer to note 11 in the Financial Report per 31 December 2017.
ACTIVITY REPORT16
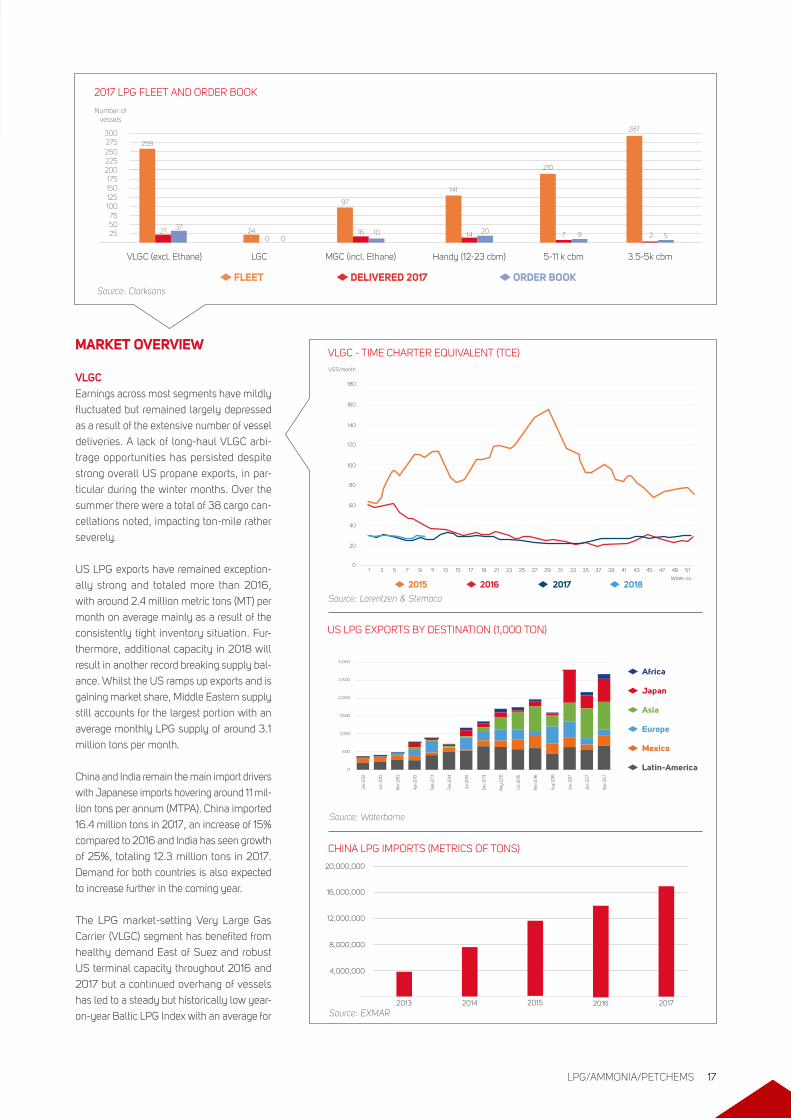
MARKET OVERVIEW
VLGCEarnings across most segments have mildly
fluctuated but remained largely depressed
as a result of the extensive number of vessel
deliveries. A lack of long-haul VLGC arbi-
trage opportunities has persisted despite
strong overall US propane exports, in par-
ticular during the winter months. Over the
summer there were a total of 38 cargo can-
cellations noted, impacting ton-mile rather
severely.
US LPG exports have remained exception-
ally strong and totaled more than 2016,
with around 2.4 million metric tons (MT) per
month on average mainly as a result of the
consistently tight inventory situation. Fur-
thermore, additional capacity in 2018 will
result in another record breaking supply bal-
ance. Whilst the US ramps up exports and is
gaining market share, Middle Eastern supply
still accounts for the largest portion with an
average monthly LPG supply of around 3.1
million tons per month.
China and India remain the main import drivers
with Japanese imports hovering around 11 mil-
lion tons per annum (MTPA). China imported
16.4 million tons in 2017, an increase of 15%
compared to 2016 and India has seen growth
of 25%, totaling 12.3 million tons in 2017.
Demand for both countries is also expected
to increase further in the coming year.
The LPG market-setting Very Large Gas
Carrier (VLGC) segment has benefited from
healthy demand East of Suez and robust
US terminal capacity throughout 2016 and
2017 but a continued overhang of vessels
has led to a steady but historically low year-
on-year Baltic LPG Index with an average for
2017 LPG FLEET AND ORDER BOOK
250
300259
24
97
141
210
287
210
16 14 7 237
010 20 9 5
Number of vessels
Source: Clarksons
225
275
200175150125100755025
LGCVLGC (excl. Ethane) MGC (incl. Ethane) Handy (12-23 cbm) 5-11 k cbm 3.5-5k cbm
FLEET DELIVERED 2017 ORDER BOOK
Source: Lorentzen & Stemoco
VLGC - TIME CHARTER EQUIVALENT (TCE)
1 30
20
40
60
80
100
120
140
160
180
5 7 9 11 13 15 17 19 21 23 25 27 29 31 33 35 37 39 41 43 45 47 49 51
USS/month
Week no2015 2016 2017 2018
Source: Waterborne
US LPG EXPORTS BY DESTINATION (1,000 TON)
0
500
1,000
1,500
2,000
2,500
3,000
Nov
-201
7
Jun-
2017
Jan-
2017
Aug-
2016
Mar
-201
6
Oct
-201
5
May
-201
5
Dec-
2014
Jul-2
014
Feb-
2014
Sep-
2013
Apr-2
013
Nov
-201
2
Jun-
2012
Jan-
2012
Africa
Japan
Asia
Europe
Mexico
Latin-America
CHINA LPG IMPORTS (METRICS OF TONS)
Source: EXMAR
4,000,000
8,000,000
12,000,000
16,000,000
2013
20,000,000
2014 2015 2016 2017
LPG/AMMONIA/PETCHEMS 17
AMMONIA VALUE CHAIN
UPSTREAM MARKET DOWNSTREAM MARKET
MIDSTREAM MARKET
Rich natural gas
Steam reforming
Hydrogen Ammonia Industrial processes
HydrogenSteam reforming
Industrial processes
Fertilizers
Explosives
Synthetic fi bresSynthetic resins
Rich natural gas
AmmoniaHydrogenSteam reforming
Industrial processes
Fertilizers
Explosives
Synthetic fi bresSynthetic resins
Rich natural gas
AmmoniaHydrogenSteam reforming
Industrial processes
Fertilizers
Explosives
Synthetic fi bresSynthetic resins
Rich natural gas
AmmoniaHydrogenSteam reforming
Industrial processes
Fertilizers
Explosives
Synthetic fi bresSynthetic resins
Rich natural gas
AmmoniaHydrogenSteam reforming
Industrial processes
Fertilizers
Explosives
Synthetic fi bresSynthetic resins
Rich natural gas
AmmoniaHydrogenSteam reforming
Industrial processes
Fertilizers
Explosives
Synthetic fi bresSynthetic resins
Rich natural gas
Ammonia
Fertilizers
Explosives
Synthetic fibres Synthetic resins
Source: Clarksons
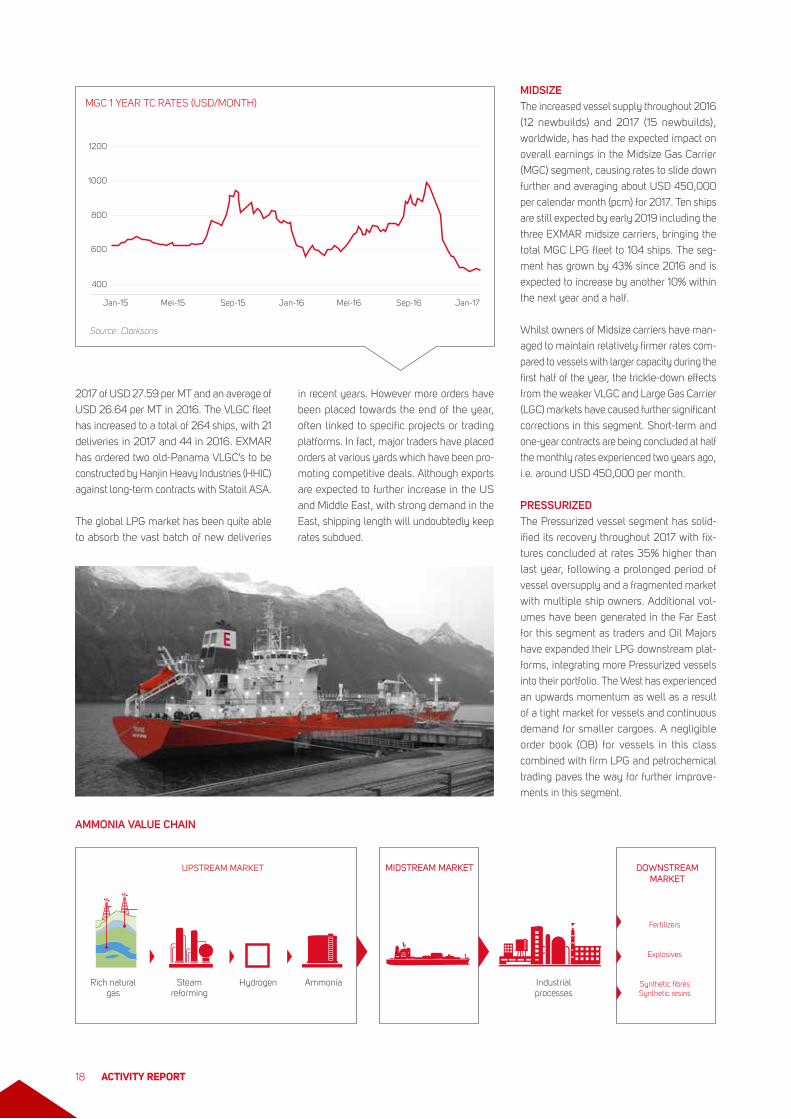
MGC 1 YEAR TC RATES (USD/MONTH)
Jan-15
400
600
800
1000
1200
Mei-15 Sep-15 Jan-16 Mei-16 Sep-16 Jan-17
2017 of USD 27.59 per MT and an average of
USD 26.64 per MT in 2016. The VLGC fleet
has increased to a total of 264 ships, with 21
deliveries in 2017 and 44 in 2016. EXMAR
has ordered two old-Panama VLGC’s to be
constructed by Hanjin Heavy Industries (HHIC)
against long-term contracts with Statoil ASA.
The global LPG market has been quite able
to absorb the vast batch of new deliveries
in recent years. However more orders have
been placed towards the end of the year,
often linked to specific projects or trading
platforms. In fact, major traders have placed
orders at various yards which have been pro-
moting competitive deals. Although exports
are expected to further increase in the US
and Middle East, with strong demand in the
East, shipping length will undoubtedly keep
rates subdued.
MIDSIZE The increased vessel supply throughout 2016
(12 newbuilds) and 2017 (15 newbuilds),
worldwide, has had the expected impact on
overall earnings in the Midsize Gas Carrier
(MGC) segment, causing rates to slide down
further and averaging about USD 450,000
per calendar month (pcm) for 2017. Ten ships
are still expected by early 2019 including the
three EXMAR midsize carriers, bringing the
total MGC LPG fleet to 104 ships. The seg-
ment has grown by 43% since 2016 and is
expected to increase by another 10% within
the next year and a half.
Whilst owners of Midsize carriers have man-
aged to maintain relatively firmer rates com-
pared to vessels with larger capacity during the
first half of the year, the trickle-down effects
from the weaker VLGC and Large Gas Carrier
(LGC) markets have caused further significant
corrections in this segment. Short-term and
one-year contracts are being concluded at half
the monthly rates experienced two years ago,
i.e. around USD 450,000 per month.
PRESSURIZED The Pressurized vessel segment has solid-
ified its recovery throughout 2017 with fix-
tures concluded at rates 35% higher than
last year, following a prolonged period of
vessel oversupply and a fragmented market
with multiple ship owners. Additional vol-
umes have been generated in the Far East
for this segment as traders and Oil Majors
have expanded their LPG downstream plat-
forms, integrating more Pressurized vessels
into their portfolio. The West has experienced
an upwards momentum as well as a result
of a tight market for vessels and continuous
demand for smaller cargoes. A negligible
order book (OB) for vessels in this class
combined with firm LPG and petrochemical
trading paves the way for further improve-
ments in this segment.
ACTIVITY REPORT18
LPG VALUE CHAIN
UPSTREAM MARKET
MIDSTREAM MARKET
DOWNSTREAM MARKET
Rich natural gas
Crude oilRefinery cracking
NaphtaGas oils
LPG
Refinery cracking
EthanePropaneButanes
Condensate
Petrochemicalcracking
Petrochemicalcracking
Rubbers (car tyres, sport shoes, …)
Styrenes (foam, insulations …)
Polypropylene (fi bres, fabrics, injection mouldings, car appliances, toys …)
Polyvinyl chloride (PVC) (pipes, electric cables, signs, clothing, furniture, healthcare, fl ooring, …)
Polyethylene (food packaging, milk, water and juice bottles, power cables, chemical containers, injection mouled products, …)
Petchem gases
PropyleneVCM
Ethylene
Fuel gas C1Hydrogen
PygasBTX
Heavy aromaticsC5/C6 non aromatics
Fuel oil
Crude C4sButadiene
Mixed butylenes
DOWNSTREAM MARKET
LPG VALUE CHAIN
Petchem gases
Propylene VCM
Ethylene
Fuel gas C1 Hydrogen
Pygas BTX
Heavy aromatics C5/C6 non aromatics
Fuel oil
Crude C4s Butadiene
Mixed butylenes
Polypropylene (fibres, fabrics, injection mouldings,
car appliances, toys,...)
Polyvinyl chloride (PVC) (pipes, electric cables, signs,
clothing, furniture, healthcare, flooring,...)
Polyethylene (food packaging, milk, water and juice bottles,
power cables, chemical containers, injection mouled
products,...)
Rubbers (car tyres, sport shoes,...)
Styrenes (foam, insulations,...)
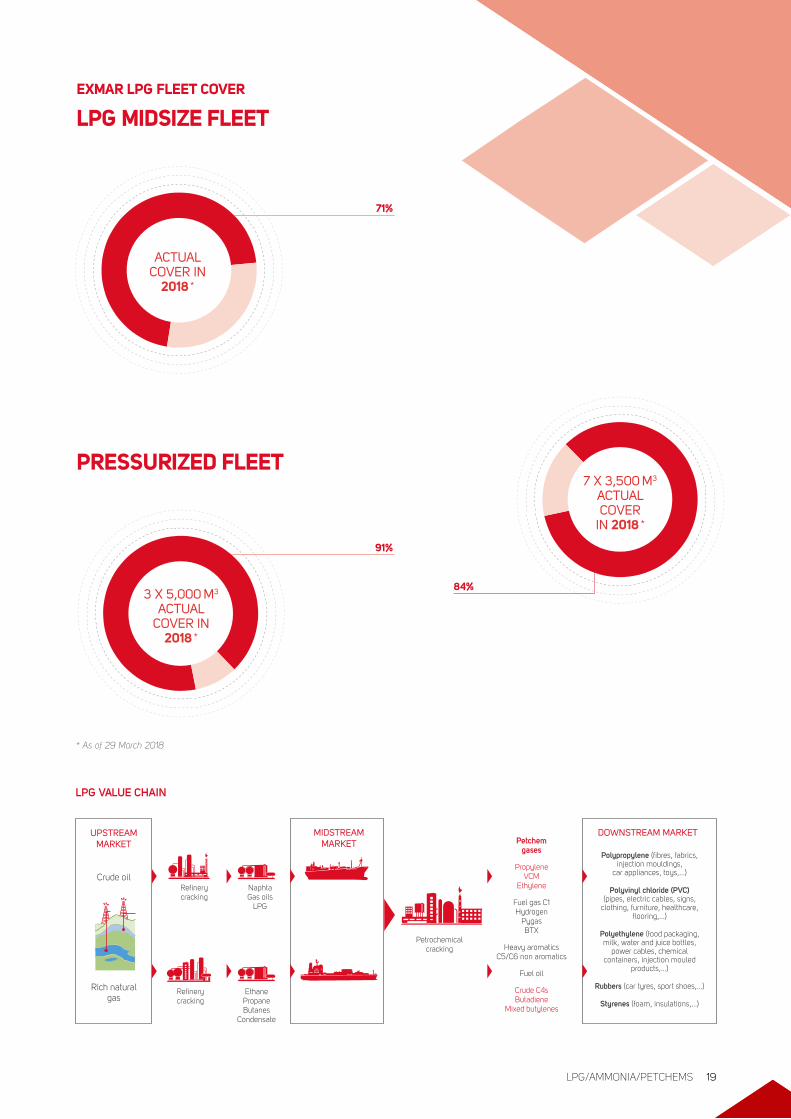
�84%
91%
71%
�3 X 5,000 M3
ACTUAL COVER IN
2018 *
7 X 3,500 M3 ACTUAL COVER
IN 2018 *
EXMAR LPG FLEET COVER�
ACTUAL COVER IN
2018 *
LPG MIDSIZE FLEET
PRESSURIZED FLEET
* As of 29 March 2018
LPG/AMMONIA/PETCHEMS 19
Photo credit: Ernst Schade
VLGCBW TOKYO (83,000 m³, 2009 built) per-
formed according to its contract but earnings
remain under pressure as they are linked
to the depressed Baltic Freight Index (BFI).
EXMAR has re-enforced its position in the VLGC
segment after securing a long-term charter
agreement for two LPG-fueled 80,200 m³
newbuild gas carriers with Statoil ASA. The
vessels will be built at Hanjin Heavy Industries
Corporation in Subic Bay, the Philippines, and
delivered by 2020. Exports of LPG are expected
to further increase in the US and Middle East,
with continuous strong demand in the Far East
and India. The vast supply of newbuild deliv-
eries may add downward pressure on rates in
this segment in 2018. Due to EXMAR’s limited
exposure in the VLGC segment in 2018, the
impact on its earnings will be limited.
MIDSIZEEXMAR’s midsize LPG five-year fleet renewal
programme that started in 2014 is nearing
completion with 11 energy-efficient new-
builds having joined the fleet up until now
with two more expected by the end of 2018.
The majority is committed to long-term char-
ters with first class customers. These ves-
sels are the sixth generation of midsize gas
carriers designed by EXMAR engineers and
naval architects. Two older midsize vessels,
BRUGGE VENTURE (35,440 m³ - 1997 built)
and COURCHEVILLE (28,000 m³ - 1989
built) were sold, the latter for recycling. The
capital gain of approximately USD 1.0 million
on the sale of the COURCHEVILLE will be
recorded in the first quarter of 2018. EXMAR
continues to secure employment but at lower
rates than 2017. Presently its fleet cover for
2018 is 71%.
PRESSURIZEDRates in the small segment continued their
pronounced upwards shift, albeit more
modestly in the 3,500 m³ segment. Five
vessels are positioned West (Atlantic Basin)
and are on charter and five vessels are in the
Far East (China, India, Korea, Japan), also
having secured medium-term employment.
A negligible order book combined with firm
LPG and petrochemical trading paves the
way for further improvements in this seg-
ment. EXMAR is well positioned with its ten
Pressurized vessels to benefit further from
these solid rates. To date 84% of EXMARs
seven 3,500 m³ Pressurized fleet is covered
for 2018, with 91% coverage for its three
5,000 m³ ships.
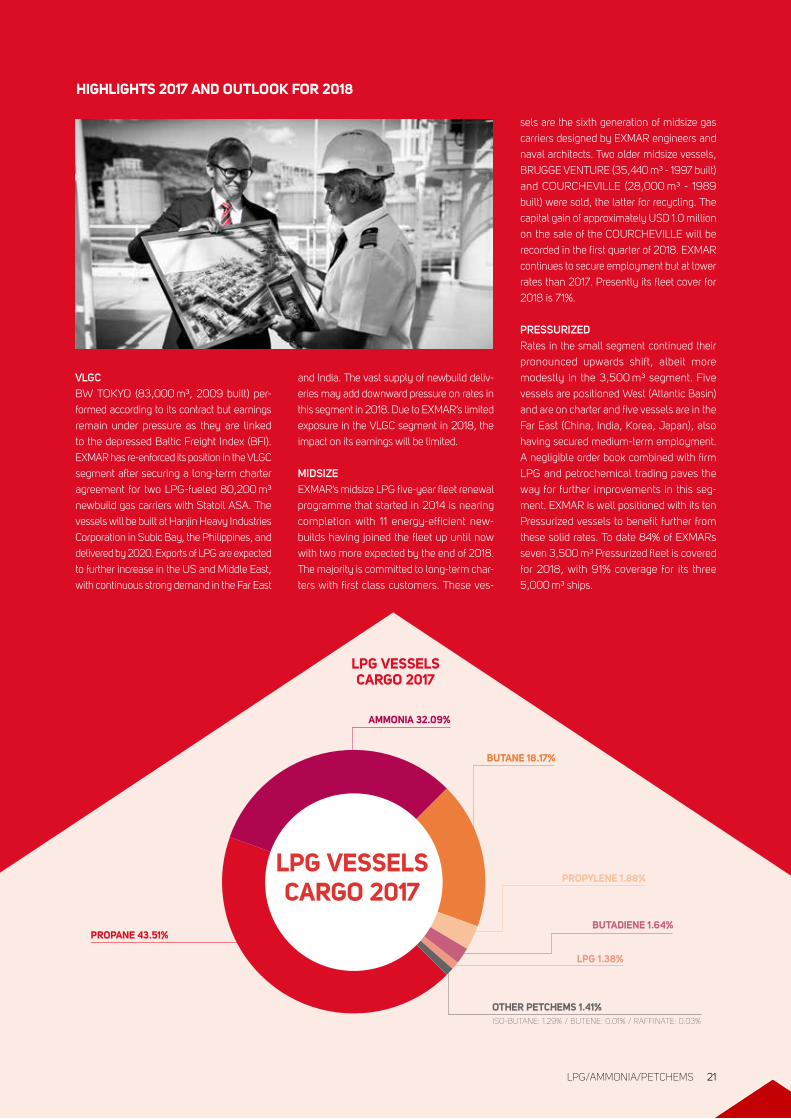
OTHER PETCHEMS 1.41%ISO-BUTANE: 1.29% / BUTENE: 0.01% / RAFFINATE: 0.03%
PROPANE 43.51%
AMMONIA 32.09%
BUTANE 18.17%
PROPYLENE 1.88%
BUTADIENE 1.64%
LPG 1.38%
LPG VESSELS CARGO 2017
HIGHLIGHTS 2017 AND OUTLOOK FOR 2018
LPG VESSELS CARGO 2017
LPG/AMMONIA/PETCHEMS 21
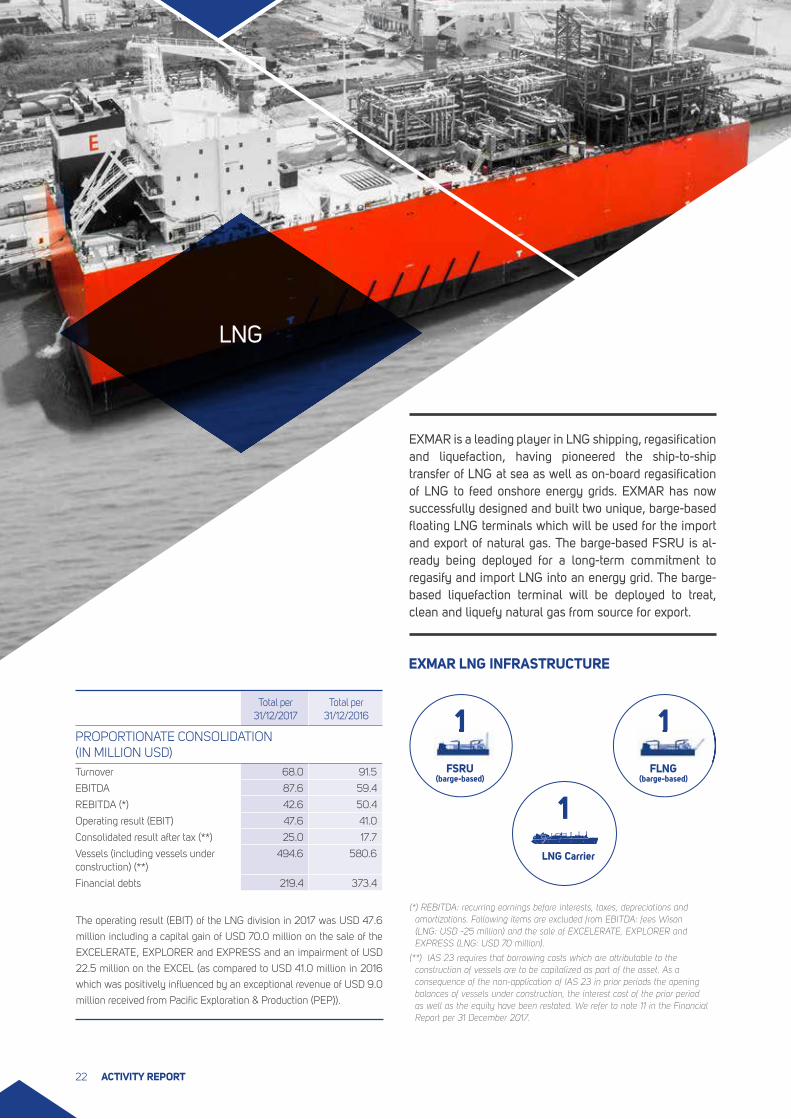
EXMAR is a leading player in LNG shipping, regasification and liquefaction, having pioneered the ship-to-ship transfer of LNG at sea as well as on-board regasification of LNG to feed onshore energy grids. EXMAR has now successfully designed and built two unique, barge-based floating LNG terminals which will be used for the import and export of natural gas. The barge-based FSRU is al-ready being deployed for a long-term commitment to regasify and import LNG into an energy grid. The barge-based liquefaction terminal will be deployed to treat, clean and liquefy natural gas from source for export.
FSRU (barge-based)
11FLNG
(barge-based)
11
EXMAR LNG INFRASTRUCTURE
The operating result (EBIT) of the LNG division in 2017 was USD 47.6
million including a capital gain of USD 70.0 million on the sale of the
EXCELERATE, EXPLORER and EXPRESS and an impairment of USD
22.5 million on the EXCEL (as compared to USD 41.0 million in 2016
which was positively influenced by an exceptional revenue of USD 9.0
million received from Pacific Exploration & Production (PEP)).
Total per31/12/2017
Total per31/12/2016
PROPORTIONATE CONSOLIDATION (IN MILLION USD)Turnover 68.0 91.5
EBITDA 87.6 59.4
REBITDA (*) 42.6 50.4
Operating result (EBIT) 47.6 41.0
Consolidated result after tax (**) 25.0 17.7
Vessels (including vessels under construction) (**)
494.6 580.6
Financial debts 219.4 373.4
LNG Carrier
1
LNG
(*) REBITDA: recurring earnings before interests, taxes, depreciations and amortizations. Following items are excluded from EBITDA: fees Wison (LNG: USD -25 million) and the sale of EXCELERATE, EXPLORER and EXPRESS (LNG: USD 70 million).
(**) IAS 23 requires that borrowing costs which are attributable to the construction of vessels are to be capitalized as part of the asset. As a consequence of the non-application of IAS 23 in prior periods the opening balances of vessels under construction, the interest cost of the prior period as well as the equity have been restated. We refer to note 11 in the Financial Report per 31 December 2017.
ACTIVITY REPORT22
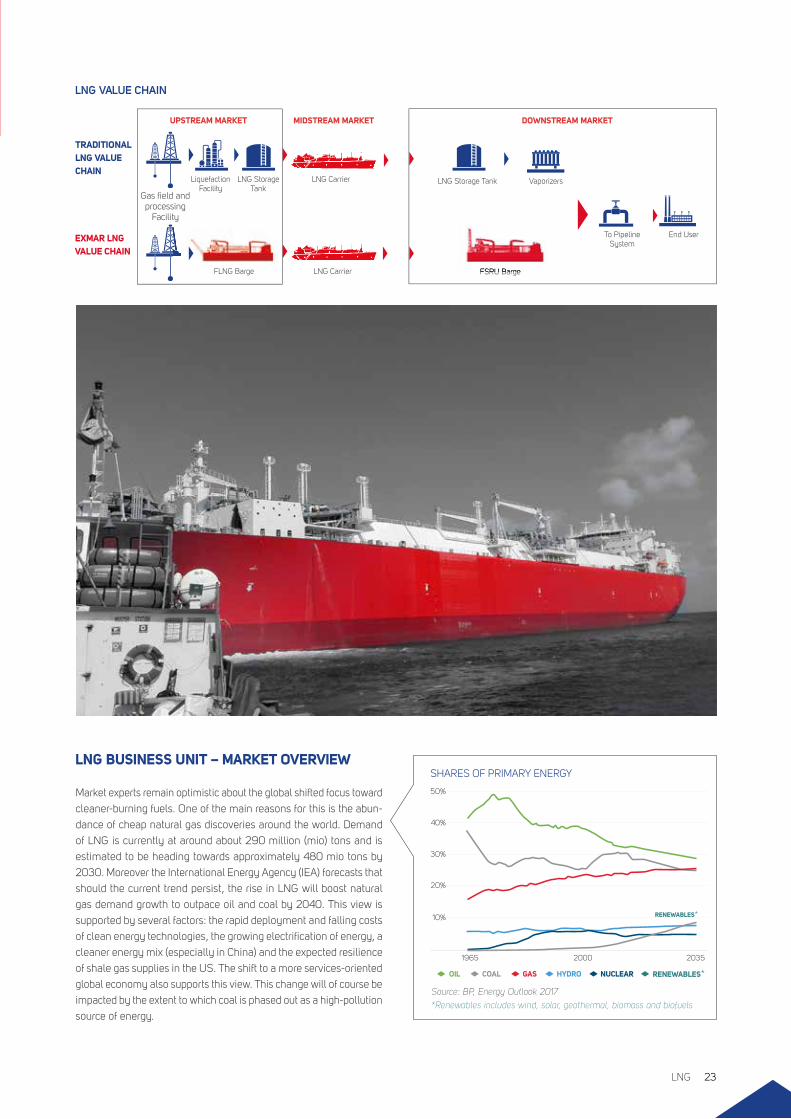
Source: BP, Energy Outlook 2017
LNG BUSINESS UNIT – MARKET OVERVIEW
Market experts remain optimistic about the global shifted focus toward
cleaner-burning fuels. One of the main reasons for this is the abun-
dance of cheap natural gas discoveries around the world. Demand
of LNG is currently at around about 290 million (mio) tons and is
estimated to be heading towards approximately 480 mio tons by
2030. Moreover the International Energy Agency (IEA) forecasts that
should the current trend persist, the rise in LNG will boost natural
gas demand growth to outpace oil and coal by 2040. This view is
supported by several factors: the rapid deployment and falling costs
of clean energy technologies, the growing electrification of energy, a
cleaner energy mix (especially in China) and the expected resilience
of shale gas supplies in the US. The shift to a more services-oriented
global economy also supports this view. This change will of course be
impacted by the extent to which coal is phased out as a high-pollution
source of energy.
LNG VALUE CHAIN
TRADITIONAL LNG VALUE CHAIN
EXMAR LNG VALUE CHAIN
Gas field and processing
Facility
Liquefaction Facility
LNG Storage Tank
LNG Carrier
UPSTREAM MARKET MIDSTREAM MARKET
LNG Storage Tank Vaporizers
To Pipeline System
End User
DOWNSTREAM MARKET
LNG CarrierFLNG Barge FSRU BargeFSRU Barge
SHARES OF PRIMARY ENERGY
1965
10%
20%
30%
40%
50%
2000 2035
GAS NUCLEARHYDRO RENEWABLES OIL COAL *
RENEWABLES *
*Renewables includes wind, solar, geothermal, biomass and biofuels
LNG 23
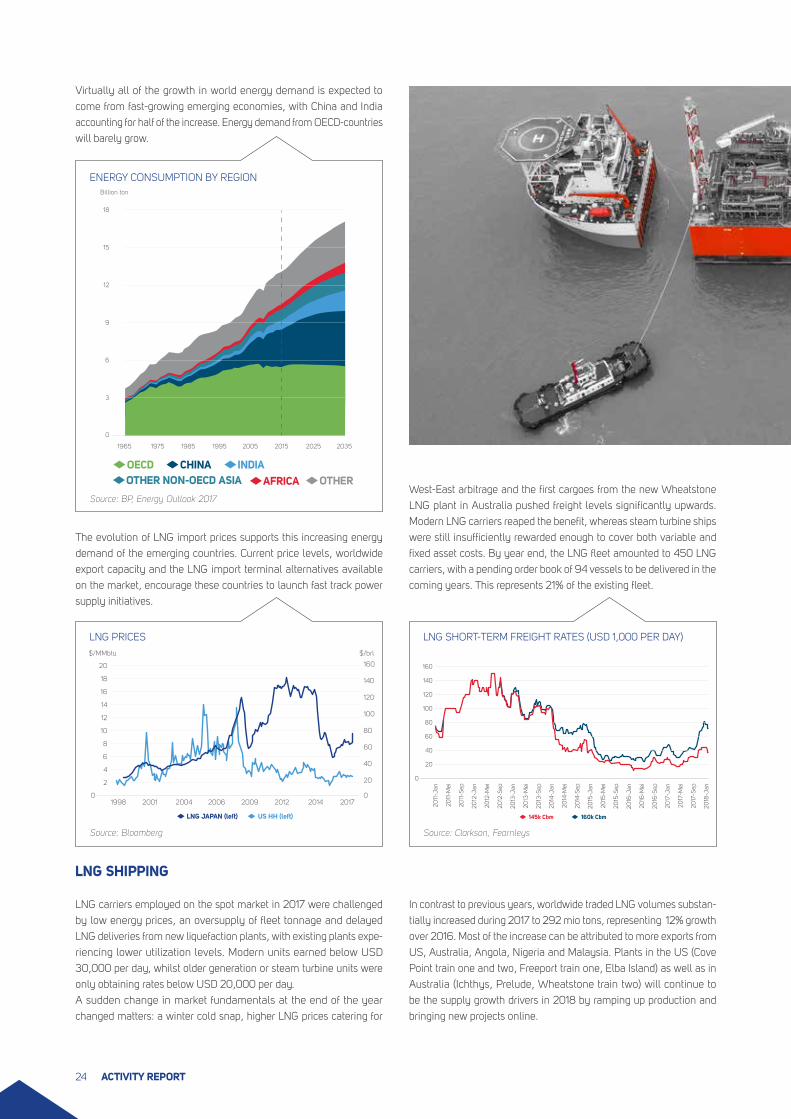
Source: BP, Energy Outlook 2017
Virtually all of the growth in world energy demand is expected to
come from fast-growing emerging economies, with China and India
accounting for half of the increase. Energy demand from OECD-countries
will barely grow.
The evolution of LNG import prices supports this increasing energy
demand of the emerging countries. Current price levels, worldwide
export capacity and the LNG import terminal alternatives available
on the market, encourage these countries to launch fast track power
supply initiatives.
LNG SHIPPING
LNG carriers employed on the spot market in 2017 were challenged
by low energy prices, an oversupply of fleet tonnage and delayed
LNG deliveries from new liquefaction plants, with existing plants expe-
riencing lower utilization levels. Modern units earned below USD
30,000 per day, whilst older generation or steam turbine units were
only obtaining rates below USD 20,000 per day.
A sudden change in market fundamentals at the end of the year
changed matters: a winter cold snap, higher LNG prices catering for
20
40
60
80
100
120
140
160
0
2011
-Jan
2011
-Mei
2011
-Sep
2012
-Jan
2012
-Mei
2012
-Sep
2013
-Jan
2013
-Mei
2013
-Sep
2014
-Jan
2014
-Mei
2014
-Sep
2015
-Jan
2015
-Mei
2015
-Sep
2016
-Jan
2016
-Mei
2016
-Sep
2017
-Jan
2017
-Mei
2017
-Sep
2018
-Jan
145k Cbm 160k Cbm
1998
2
2009 20170
4
6
8
10
12
14
16
18
2001 2004 2006 2012 2014
LNG JAPAN (left) US HH (left)
20
40
60
80
100
120
140
16020
0
$/MMbtu $/brl
West-East arbitrage and the first cargoes from the new Wheatstone
LNG plant in Australia pushed freight levels significantly upwards.
Modern LNG carriers reaped the benefit, whereas steam turbine ships
were still insufficiently rewarded enough to cover both variable and
fixed asset costs. By year end, the LNG fleet amounted to 450 LNG
carriers, with a pending order book of 94 vessels to be delivered in the
coming years. This represents 21% of the existing fleet.
Source: Clarkson, FearnleysSource: Bloomberg
OECD CHINA INDIAOTHER NON-OECD ASIA AFRICA OTHER
0
1965 1975 1985 1995 2005 2015 2025 2035
3
6
9
12
15
18
Billion ton
LNG SHORT-TERM FREIGHT RATES (USD 1,000 PER DAY)LNG PRICES
ENERGY CONSUMPTION BY REGION
In contrast to previous years, worldwide traded LNG volumes substan-
tially increased during 2017 to 292 mio tons, representing 12% growth
over 2016. Most of the increase can be attributed to more exports from
US, Australia, Angola, Nigeria and Malaysia. Plants in the US (Cove
Point train one and two, Freeport train one, Elba Island) as well as in
Australia (Ichthys, Prelude, Wheatstone train two) will continue to
be the supply growth drivers in 2018 by ramping up production and
bringing new projects online.
ACTIVITY REPORT24
10
20
30
40
50
60
70
80
90
0Quatar Australia Malaysia Nigeria Indonesia Trinidad Algeria USA Other
2012 2013 2014 2015 2016 2017
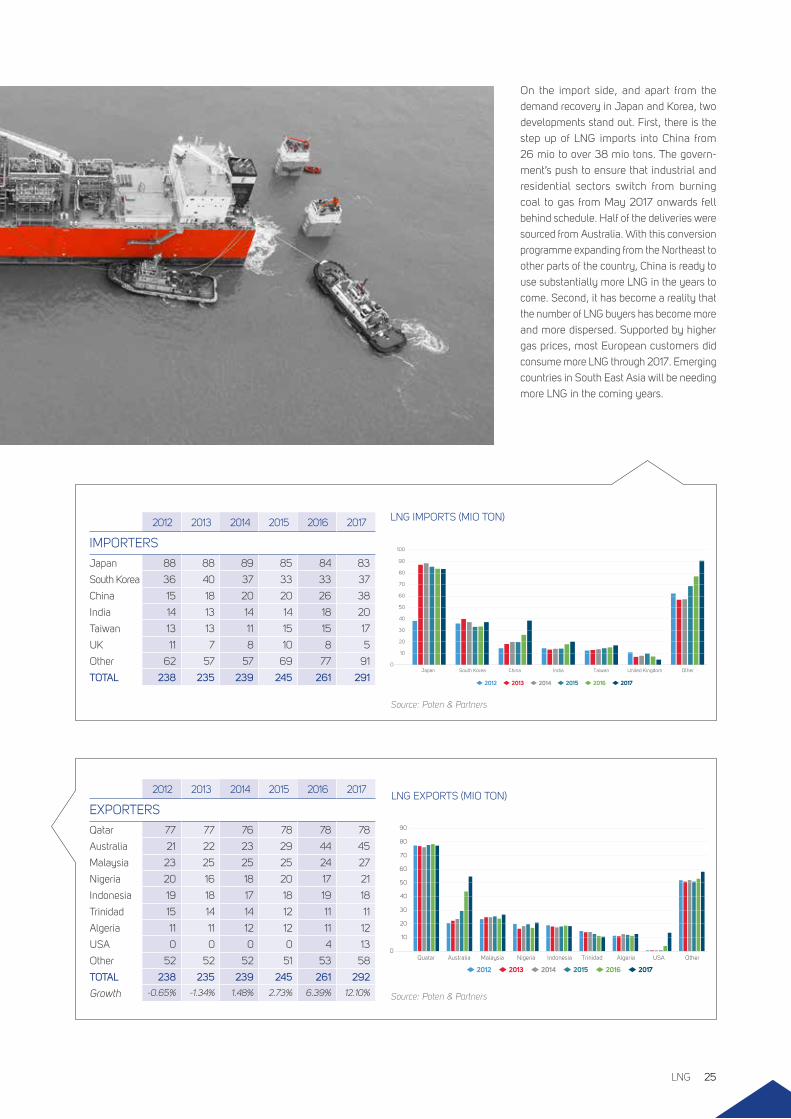
On the import side, and apart from the
demand recovery in Japan and Korea, two
developments stand out. First, there is the
step up of LNG imports into China from
26 mio to over 38 mio tons. The govern-
ment’s push to ensure that industrial and
residential sectors switch from burning
coal to gas from May 2017 onwards fell
behind schedule. Half of the deliveries were
sourced from Australia. With this conversion
programme expanding from the Northeast to
other parts of the country, China is ready to
use substantially more LNG in the years to
come. Second, it has become a reality that
the number of LNG buyers has become more
and more dispersed. Supported by higher
gas prices, most European customers did
consume more LNG through 2017. Emerging
countries in South East Asia will be needing
more LNG in the coming years.
10
20
30
40
50
60
70
80
90
100
0Japan South Korea China India Taiwan United Kingdom Other
2012 2013 2014 2015 2016 2017
Source: Poten & Partners
Source: Poten & Partners
LNG EXPORTS (MIO TON)
LNG IMPORTS (MIO TON)
2012 2013 2014 2015 2016 2017
EXPORTERS
Qatar 77 77 76 78 78 78
Australia 21 22 23 29 44 45
Malaysia 23 25 25 25 24 27
Nigeria 20 16 18 20 17 21
Indonesia 19 18 17 18 19 18
Trinidad 15 14 14 12 11 11
Algeria 11 11 12 12 11 12
USA 0 0 0 0 4 13
Other 52 52 52 51 53 58
TOTAL 238 235 239 245 261 292
Growth -0.65% -1.34% 1.48% 2.73% 6.39% 12.10%
2012 2013 2014 2015 2016 2017
IMPORTERS
Japan 88 88 89 85 84 83
South Korea 36 40 37 33 33 37
China 15 18 20 20 26 38
India 14 13 14 14 18 20
Taiwan 13 13 11 15 15 17
UK 11 7 8 10 8 5
Other 62 57 57 69 77 91
TOTAL 238 235 239 245 261 291
LNG 25
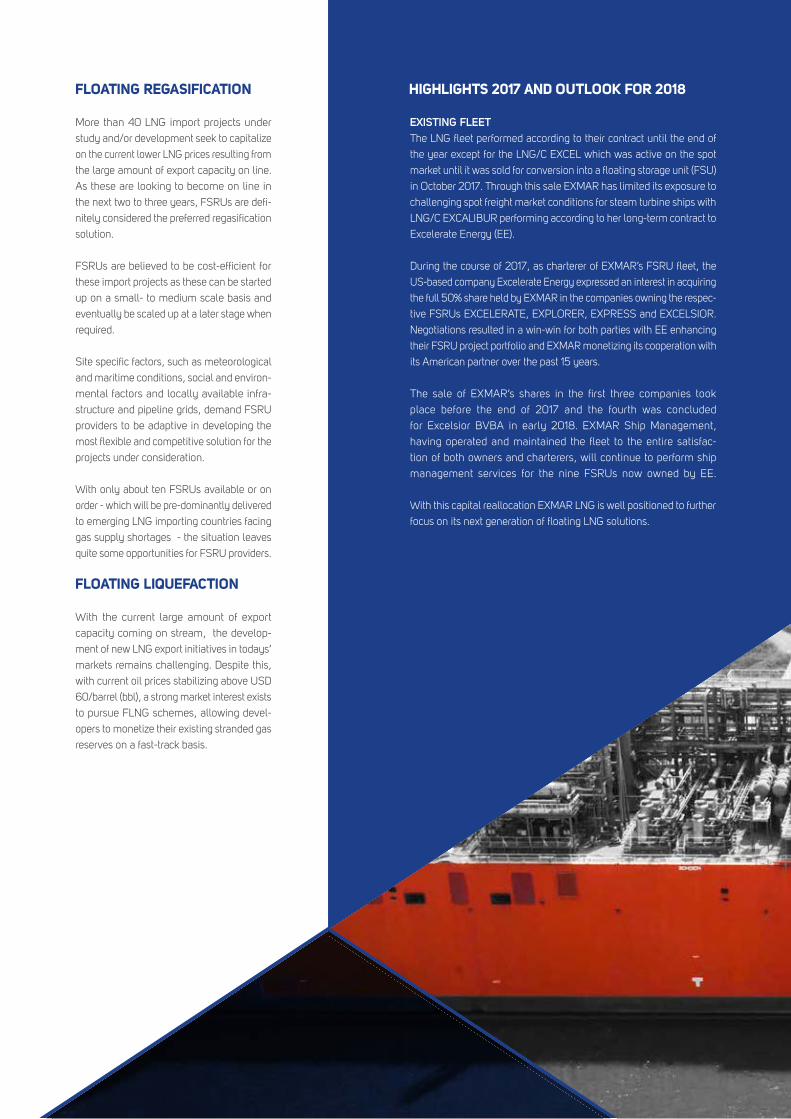
HIGHLIGHTS 2017 AND OUTLOOK FOR 2018
EXISTING FLEETThe LNG fleet performed according to their contract until the end of
the year except for the LNG/C EXCEL which was active on the spot
market until it was sold for conversion into a floating storage unit (FSU)
in October 2017. Through this sale EXMAR has limited its exposure to
challenging spot freight market conditions for steam turbine ships with
LNG/C EXCALIBUR performing according to her long-term contract to
Excelerate Energy (EE).
During the course of 2017, as charterer of EXMAR’s FSRU fleet, the
US-based company Excelerate Energy expressed an interest in acquiring
the full 50% share held by EXMAR in the companies owning the respec-
tive FSRUs EXCELERATE, EXPLORER, EXPRESS and EXCELSIOR.
Negotiations resulted in a win-win for both parties with EE enhancing
their FSRU project portfolio and EXMAR monetizing its cooperation with
its American partner over the past 15 years.
The sale of EXMAR’s shares in the first three companies took
place before the end of 2017 and the fourth was concluded
for Excelsior BVBA in early 2018. EXMAR Ship Management,
having operated and maintained the fleet to the entire satisfac-
tion of both owners and charterers, will continue to perform ship
management services for the nine FSRUs now owned by EE.
With this capital reallocation EXMAR LNG is well positioned to further
focus on its next generation of floating LNG solutions.
FLOATING REGASIFICATION
More than 40 LNG import projects under
study and/or development seek to capitalize
on the current lower LNG prices resulting from
the large amount of export capacity on line.
As these are looking to become on line in
the next two to three years, FSRUs are defi-
nitely considered the preferred regasification
solution.
FSRUs are believed to be cost-efficient for
these import projects as these can be started
up on a small- to medium scale basis and
eventually be scaled up at a later stage when
required.
Site specific factors, such as meteorological
and maritime conditions, social and environ-
mental factors and locally available infra-
structure and pipeline grids, demand FSRU
providers to be adaptive in developing the
most flexible and competitive solution for the
projects under consideration.
With only about ten FSRUs available or on
order - which will be pre-dominantly delivered
to emerging LNG importing countries facing
gas supply shortages - the situation leaves
quite some opportunities for FSRU providers.
FLOATING LIQUEFACTION
With the current large amount of export
capacity coming on stream, the develop-
ment of new LNG export initiatives in todays’
markets remains challenging. Despite this,
with current oil prices stabilizing above USD
60/barrel (bbl), a strong market interest exists
to pursue FLNG schemes, allowing devel-
opers to monetize their existing stranded gas
reserves on a fast-track basis.
HIGHLIGHTS 2017 AND OUTLOOK FOR 2018
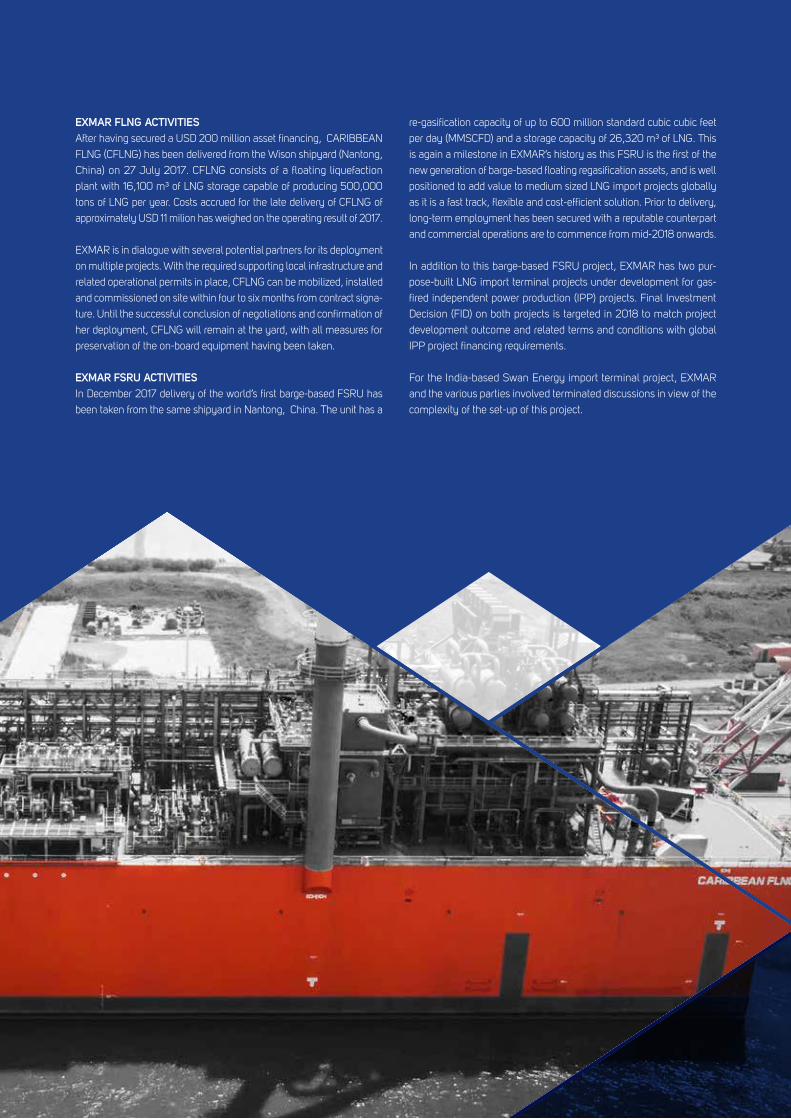
EXMAR FLNG ACTIVITIESAfter having secured a USD 200 million asset financing, CARIBBEAN
FLNG (CFLNG) has been delivered from the Wison shipyard (Nantong,
China) on 27 July 2017. CFLNG consists of a floating liquefaction
plant with 16,100 m³ of LNG storage capable of producing 500,000
tons of LNG per year. Costs accrued for the late delivery of CFLNG of
approximately USD 11 milion has weighed on the operating result of 2017.
EXMAR is in dialogue with several potential partners for its deployment
on multiple projects. With the required supporting local infrastructure and
related operational permits in place, CFLNG can be mobilized, installed
and commissioned on site within four to six months from contract signa-
ture. Until the successful conclusion of negotiations and confirmation of
her deployment, CFLNG will remain at the yard, with all measures for
preservation of the on-board equipment having been taken.
EXMAR FSRU ACTIVITIESIn December 2017 delivery of the world’s first barge-based FSRU has
been taken from the same shipyard in Nantong, China. The unit has a
re-gasification capacity of up to 600 million standard cubic cubic feet
per day (MMSCFD) and a storage capacity of 26,320 m³ of LNG. This
is again a milestone in EXMAR’s history as this FSRU is the first of the
new generation of barge-based floating regasification assets, and is well
positioned to add value to medium sized LNG import projects globally
as it is a fast track, flexible and cost-efficient solution. Prior to delivery,
long-term employment has been secured with a reputable counterpart
and commercial operations are to commence from mid-2018 onwards.
In addition to this barge-based FSRU project, EXMAR has two pur-
pose-built LNG import terminal projects under development for gas-
fired independent power production (IPP) projects. Final Investment
Decision (FID) on both projects is targeted in 2018 to match project
development outcome and related terms and conditions with global
IPP project financing requirements.
For the India-based Swan Energy import terminal project, EXMAR
and the various parties involved terminated discussions in view of the
complexity of the set-up of this project.
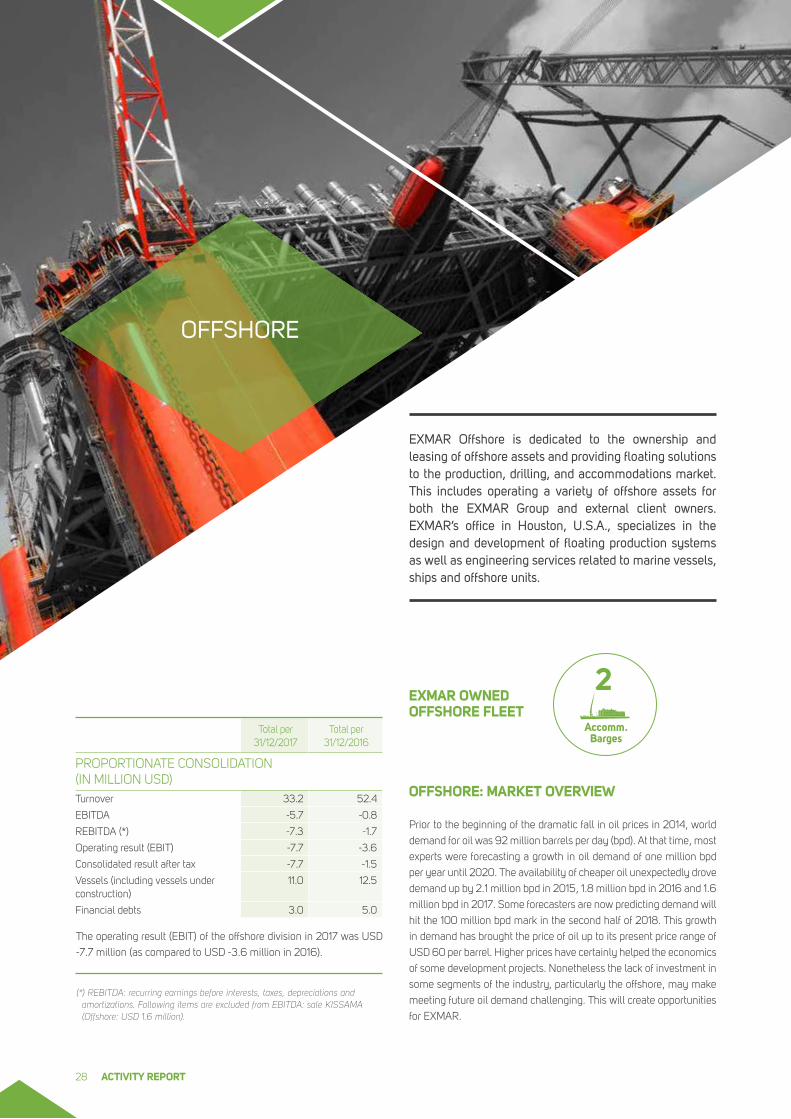
OFFSHORE
OFFSHORE: MARKET OVERVIEW
Prior to the beginning of the dramatic fall in oil prices in 2014, world
demand for oil was 92 million barrels per day (bpd). At that time, most
experts were forecasting a growth in oil demand of one million bpd
per year until 2020. The availability of cheaper oil unexpectedly drove
demand up by 2.1 million bpd in 2015, 1.8 million bpd in 2016 and 1.6
million bpd in 2017. Some forecasters are now predicting demand will
hit the 100 million bpd mark in the second half of 2018. This growth
in demand has brought the price of oil up to its present price range of
USD 60 per barrel. Higher prices have certainly helped the economics
of some development projects. Nonetheless the lack of investment in
some segments of the industry, particularly the offshore, may make
meeting future oil demand challenging. This will create opportunities
for EXMAR.
EXMAR Offshore is dedicated to the ownership and leasing of offshore assets and providing floating solutions to the production, drilling, and accommodations market. This includes operating a variety of offshore assets for both the EXMAR Group and external client owners. EXMAR’s office in Houston, U.S.A., specializes in the design and development of floating production systems as well as engineering services related to marine vessels, ships and offshore units.
2Accomm.
Barges
EXMAR OWNED OFFSHORE FLEET
The operating result (EBIT) of the offshore division in 2017 was USD
-7.7 million (as compared to USD -3.6 million in 2016).
Total per31/12/2017
Total per31/12/2016
PROPORTIONATE CONSOLIDATION (IN MILLION USD)Turnover 33.2 52.4
EBITDA -5.7 -0.8
REBITDA (*) -7.3 -1.7
Operating result (EBIT) -7.7 -3.6
Consolidated result after tax -7.7 -1.5
Vessels (including vessels under construction)
11.0 12.5
Financial debts 3.0 5.0
(*) REBITDA: recurring earnings before interests, taxes, depreciations and amortizations. Following items are excluded from EBITDA: sale KISSAMA (Offshore: USD 1.6 million).
ACTIVITY REPORT28
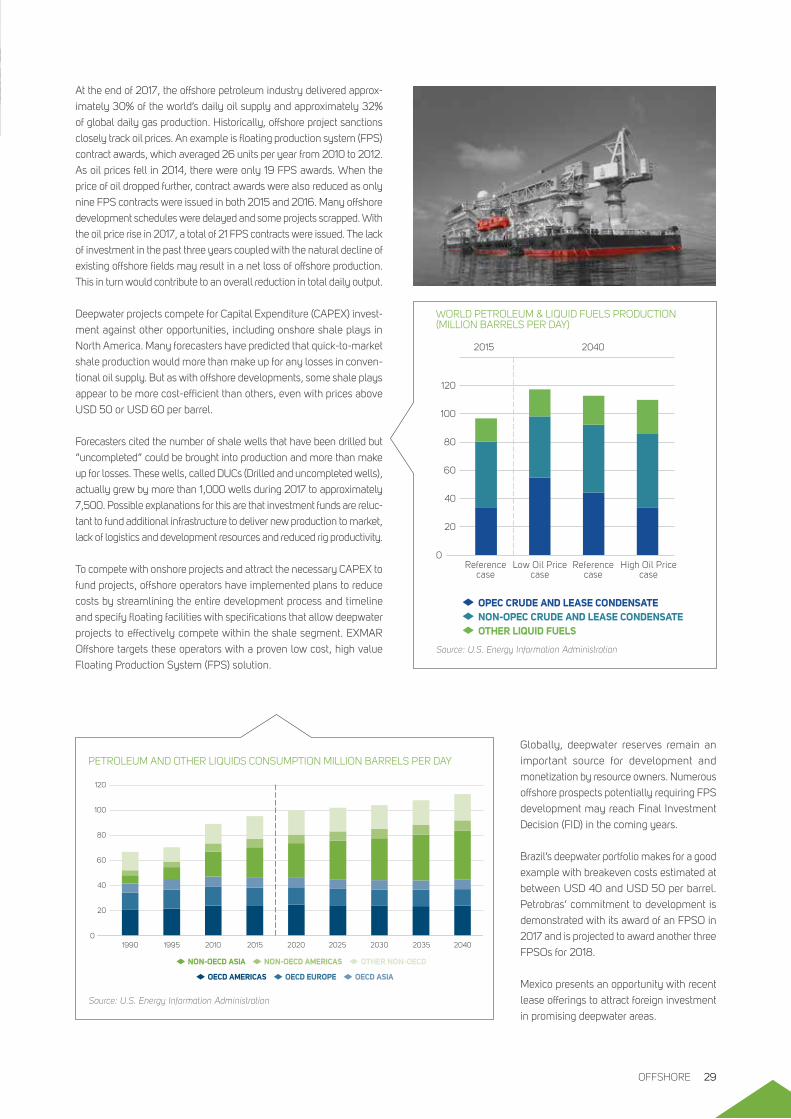
At the end of 2017, the offshore petroleum industry delivered approx-
imately 30% of the world’s daily oil supply and approximately 32%
of global daily gas production. Historically, offshore project sanctions
closely track oil prices. An example is floating production system (FPS)
contract awards, which averaged 26 units per year from 2010 to 2012.
As oil prices fell in 2014, there were only 19 FPS awards. When the
price of oil dropped further, contract awards were also reduced as only
nine FPS contracts were issued in both 2015 and 2016. Many offshore
development schedules were delayed and some projects scrapped. With
the oil price rise in 2017, a total of 21 FPS contracts were issued. The lack
of investment in the past three years coupled with the natural decline of
existing offshore fields may result in a net loss of offshore production.
This in turn would contribute to an overall reduction in total daily output.
Deepwater projects compete for Capital Expenditure (CAPEX) invest-
ment against other opportunities, including onshore shale plays in
North America. Many forecasters have predicted that quick-to-market
shale production would more than make up for any losses in conven-
tional oil supply. But as with offshore developments, some shale plays
appear to be more cost-efficient than others, even with prices above
USD 50 or USD 60 per barrel.
Forecasters cited the number of shale wells that have been drilled but
“uncompleted” could be brought into production and more than make
up for losses. These wells, called DUCs (Drilled and uncompleted wells),
actually grew by more than 1,000 wells during 2017 to approximately
7,500. Possible explanations for this are that investment funds are reluc-
tant to fund additional infrastructure to deliver new production to market,
lack of logistics and development resources and reduced rig productivity.
To compete with onshore projects and attract the necessary CAPEX to
fund projects, offshore operators have implemented plans to reduce
costs by streamlining the entire development process and timeline
and specify floating facilities with specifications that allow deepwater
projects to effectively compete within the shale segment. EXMAR
Offshore targets these operators with a proven low cost, high value
Floating Production System (FPS) solution.
Globally, deepwater reserves remain an
important source for development and
monetization by resource owners. Numerous
offshore prospects potentially requiring FPS
development may reach Final Investment
Decision (FID) in the coming years.
Brazil’s deepwater portfolio makes for a good
example with breakeven costs estimated at
between USD 40 and USD 50 per barrel.
Petrobras’ commitment to development is
demonstrated with its award of an FPSO in
2017 and is projected to award another three
FPSOs for 2018.
Mexico presents an opportunity with recent
lease offerings to attract foreign investment
in promising deepwater areas.
Source: U.S. Energy Information Administration
PETROLEUM AND OTHER LIQUIDS CONSUMPTION MILLION BARRELS PER DAY
OECD AMERICAS OECD EUROPE OECD ASIA
NON-OECD ASIA NON-OECD AMERICAS OTHER NON-OECD
1990 1995 2010 2015 2020 2025 2030 2035 20400
20
40
60
80
100
120
0Reference
caseReference
caseLow Oil Price
caseHigh Oil Price
case
20
40
60
80
100
120
2015 2040
OPEC CRUDE AND LEASE CONDENSATENON-OPEC CRUDE AND LEASE CONDENSATEOTHER LIQUID FUELS
Source: U.S. Energy Information Administration
WORLD PETROLEUM & LIQUID FUELS PRODUCTION (MILLION BARRELS PER DAY)
OFFSHORE 29
However exploration drilling is yet to commence and FID for production
is foreseen past 2020.
Offshore development following discoveries in developing countries
such as Mozambique, Cyprus and Guyana will give these nations an
opportunity for export revenue and possible energy independence.
EXMAR competes to win these projects through an OPTI® FPS or
FPSO application through experience, technical expertise, and oper-
ational skill.
By the same token, existing offshore projects will remain necessary to
sustain the aforementioned increase in oil and gas demand. EXMAR
accommodation units serve the need for offshore workers who perform
operations and maintenance of these projects. While maintenance
overhauls have been postponed in the last two years, oil companies
cannot continue deferring the work necessary to maintain production
levels. We see a recovery of offshore projects starting in 2018 – 2019,
with the need to accommodate more offshore workers.
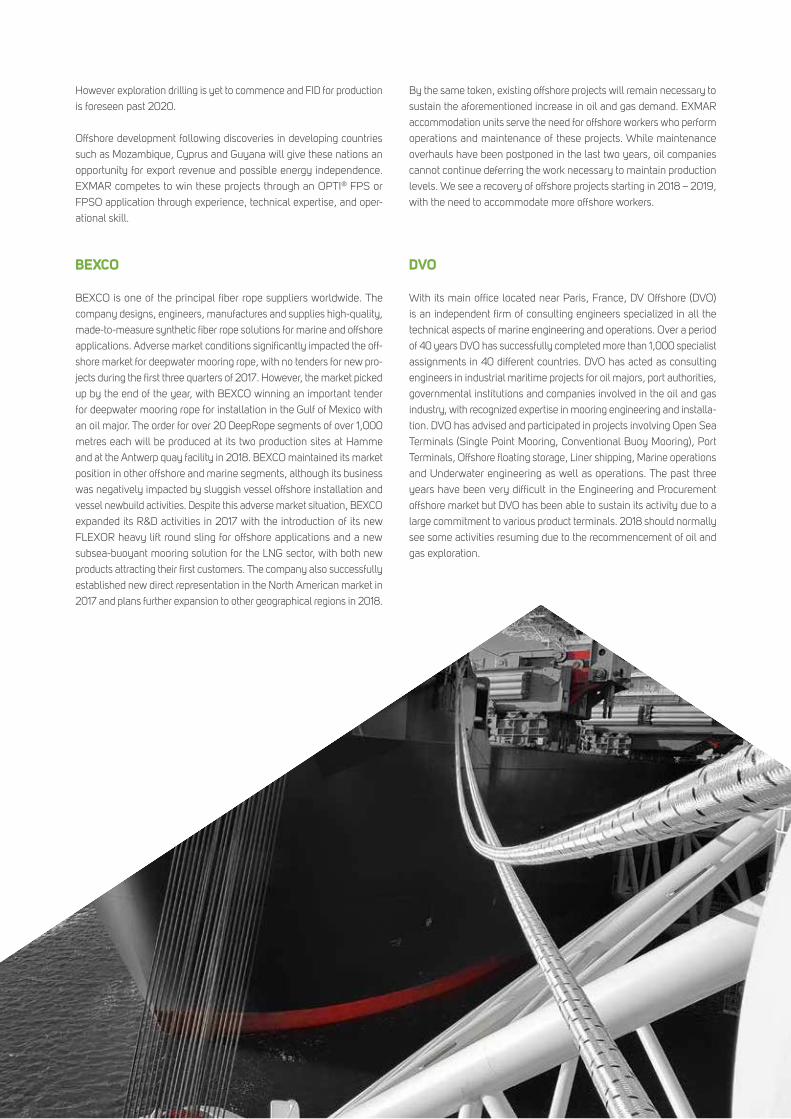
BEXCO
BEXCO is one of the principal fiber rope suppliers worldwide. The
company designs, engineers, manufactures and supplies high-quality,
made-to-measure synthetic fiber rope solutions for marine and offshore
applications. Adverse market conditions significantly impacted the off-
shore market for deepwater mooring rope, with no tenders for new pro-
jects during the first three quarters of 2017. However, the market picked
up by the end of the year, with BEXCO winning an important tender
for deepwater mooring rope for installation in the Gulf of Mexico with
an oil major. The order for over 20 DeepRope segments of over 1,000
metres each will be produced at its two production sites at Hamme
and at the Antwerp quay facility in 2018. BEXCO maintained its market
position in other offshore and marine segments, although its business
was negatively impacted by sluggish vessel offshore installation and
vessel newbuild activities. Despite this adverse market situation, BEXCO
expanded its R&D activities in 2017 with the introduction of its new
FLEXOR heavy lift round sling for offshore applications and a new
subsea-buoyant mooring solution for the LNG sector, with both new
products attracting their first customers. The company also successfully
established new direct representation in the North American market in
2017 and plans further expansion to other geographical regions in 2018.
DVO
With its main office located near Paris, France, DV Offshore (DVO)
is an independent firm of consulting engineers specialized in all the
technical aspects of marine engineering and operations. Over a period
of 40 years DVO has successfully completed more than 1,000 specialist
assignments in 40 different countries. DVO has acted as consulting
engineers in industrial maritime projects for oil majors, port authorities,
governmental institutions and companies involved in the oil and gas
industry, with recognized expertise in mooring engineering and installa-
tion. DVO has advised and participated in projects involving Open Sea
Terminals (Single Point Mooring, Conventional Buoy Mooring), Port
Terminals, Offshore floating storage, Liner shipping, Marine operations
and Underwater engineering as well as operations. The past three
years have been very difficult in the Engineering and Procurement
offshore market but DVO has been able to sustain its activity due to a
large commitment to various product terminals. 2018 should normally
see some activities resuming due to the recommencement of oil and
gas exploration.
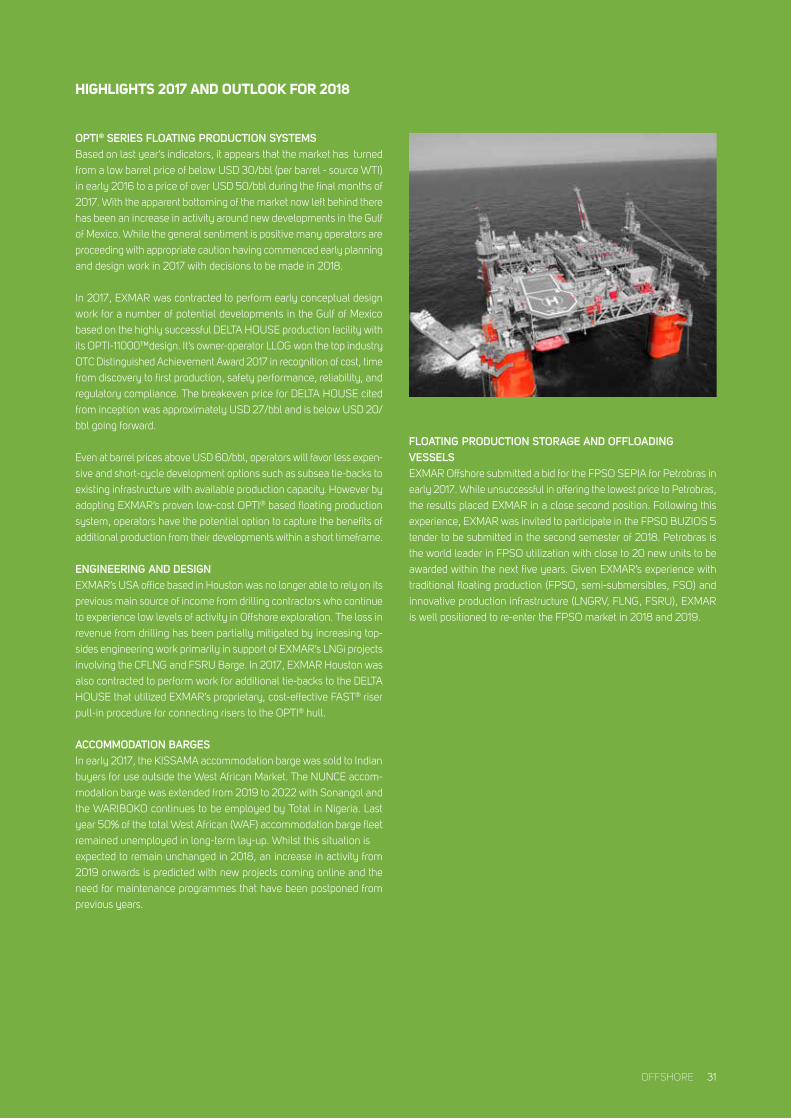
OPTI® SERIES FLOATING PRODUCTION SYSTEMSBased on last year’s indicators, it appears that the market has turned
from a low barrel price of below USD 30/bbl (per barrel - source WTI)
in early 2016 to a price of over USD 50/bbl during the final months of
2017. With the apparent bottoming of the market now left behind there
has been an increase in activity around new developments in the Gulf
of Mexico. While the general sentiment is positive many operators are
proceeding with appropriate caution having commenced early planning
and design work in 2017 with decisions to be made in 2018.
In 2017, EXMAR was contracted to perform early conceptual design
work for a number of potential developments in the Gulf of Mexico
based on the highly successful DELTA HOUSE production facility with
its OPTI-11000™design. It’s owner-operator LLOG won the top industry
OTC Distinguished Achievement Award 2017 in recognition of cost, time
from discovery to first production, safety performance, reliability, and
regulatory compliance. The breakeven price for DELTA HOUSE cited
from inception was approximately USD 27/bbl and is below USD 20/
bbl going forward.
Even at barrel prices above USD 60/bbl, operators will favor less expen-
sive and short-cycle development options such as subsea tie-backs to
existing infrastructure with available production capacity. However by
adopting EXMAR’s proven low-cost OPTI® based floating production
system, operators have the potential option to capture the benefits of
additional production from their developments within a short timeframe.
ENGINEERING AND DESIGN EXMAR’s USA office based in Houston was no longer able to rely on its
previous main source of income from drilling contractors who continue
to experience low levels of activity in Offshore exploration. The loss in
revenue from drilling has been partially mitigated by increasing top-
sides engineering work primarily in support of EXMAR’s LNGi projects
involving the CFLNG and FSRU Barge. In 2017, EXMAR Houston was
also contracted to perform work for additional tie-backs to the DELTA
HOUSE that utilized EXMAR’s proprietary, cost-effective FAST® riser
pull-in procedure for connecting risers to the OPTI® hull.
ACCOMMODATION BARGESIn early 2017, the KISSAMA accommodation barge was sold to Indian
buyers for use outside the West African Market. The NUNCE accom-
modation barge was extended from 2019 to 2022 with Sonangol and
the WARIBOKO continues to be employed by Total in Nigeria. Last
year 50% of the total West African (WAF) accommodation barge fleet
remained unemployed in long-term lay-up. Whilst this situation is
expected to remain unchanged in 2018, an increase in activity from
2019 onwards is predicted with new projects coming online and the
need for maintenance programmes that have been postponed from
previous years.
FLOATING PRODUCTION STORAGE AND OFFLOADINGVESSELSEXMAR Offshore submitted a bid for the FPSO SEPIA for Petrobras in
early 2017. While unsuccessful in offering the lowest price to Petrobras,
the results placed EXMAR in a close second position. Following this
experience, EXMAR was invited to participate in the FPSO BUZIOS 5
tender to be submitted in the second semester of 2018. Petrobras is
the world leader in FPSO utilization with close to 20 new units to be
awarded within the next five years. Given EXMAR’s experience with
traditional floating production (FPSO, semi-submersibles, FSO) and
innovative production infrastructure (LNGRV, FLNG, FSRU), EXMAR
is well positioned to re-enter the FPSO market in 2018 and 2019.
HIGHLIGHTS 2017 AND OUTLOOK FOR 2018
OFFSHORE 31
SUPPORTING SERVICES
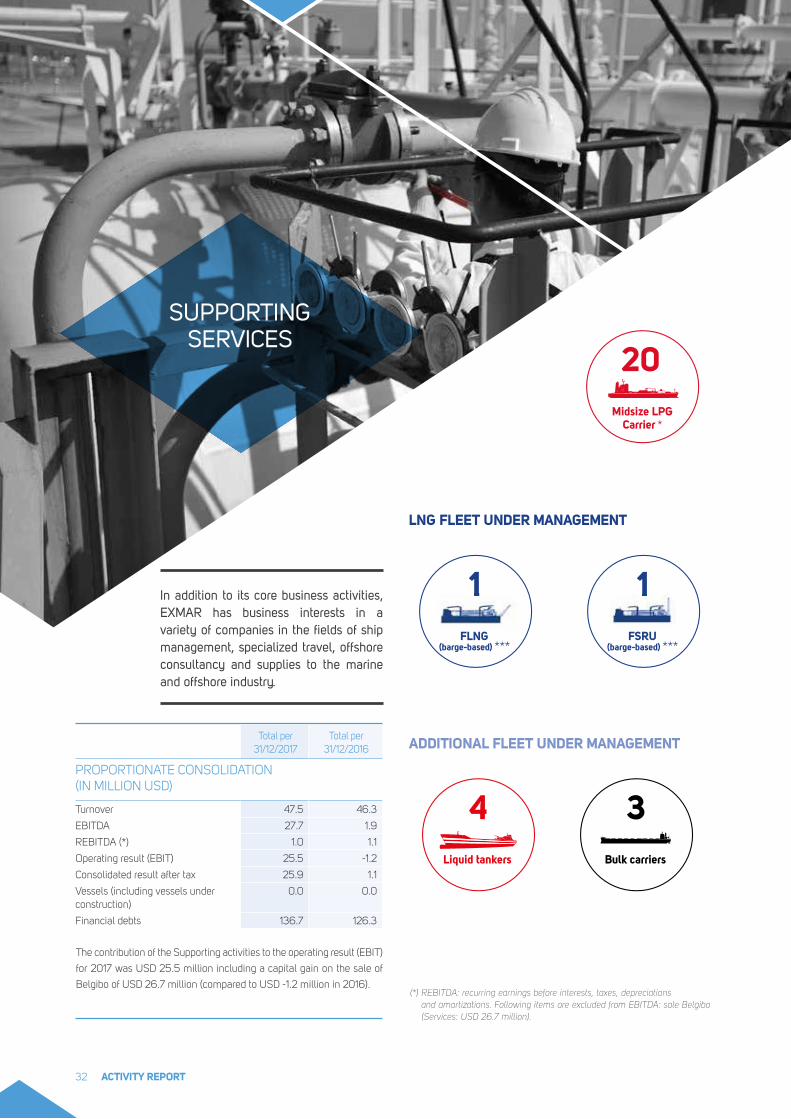
In addition to its core business activities, EXMAR has business interests in a variety of companies in the fields of ship management, specialized travel, offshore consultancy and supplies to the marine and offshore industry.
The contribution of the Supporting activities to the operating result (EBIT)
for 2017 was USD 25.5 million including a capital gain on the sale of
Belgibo of USD 26.7 million (compared to USD -1.2 million in 2016).
Total per31/12/2017
Total per31/12/2016
PROPORTIONATE CONSOLIDATION (IN MILLION USD)
Turnover 47.5 46.3
EBITDA 27.7 1.9
REBITDA (*) 1.0 1.1
Operating result (EBIT) 25.5 -1.2
Consolidated result after tax 25.9 1.1
Vessels (including vessels under construction)
0.0 0.0
Financial debts 136.7 126.3
LNG FLEET UNDER MANAGEMENT
ADDITIONAL FLEET UNDER MANAGEMENT
Bulk carriers
3Liquid tankers
4
FSRU (barge-based) ***
11FLNG
(barge-based) ***
11
20Midsize LPG
Carrier *
(*) REBITDA: recurring earnings before interests, taxes, depreciations and amortizations. Following items are excluded from EBITDA: sale Belgibo (Services: USD 26.7 million).
ACTIVITY REPORT32
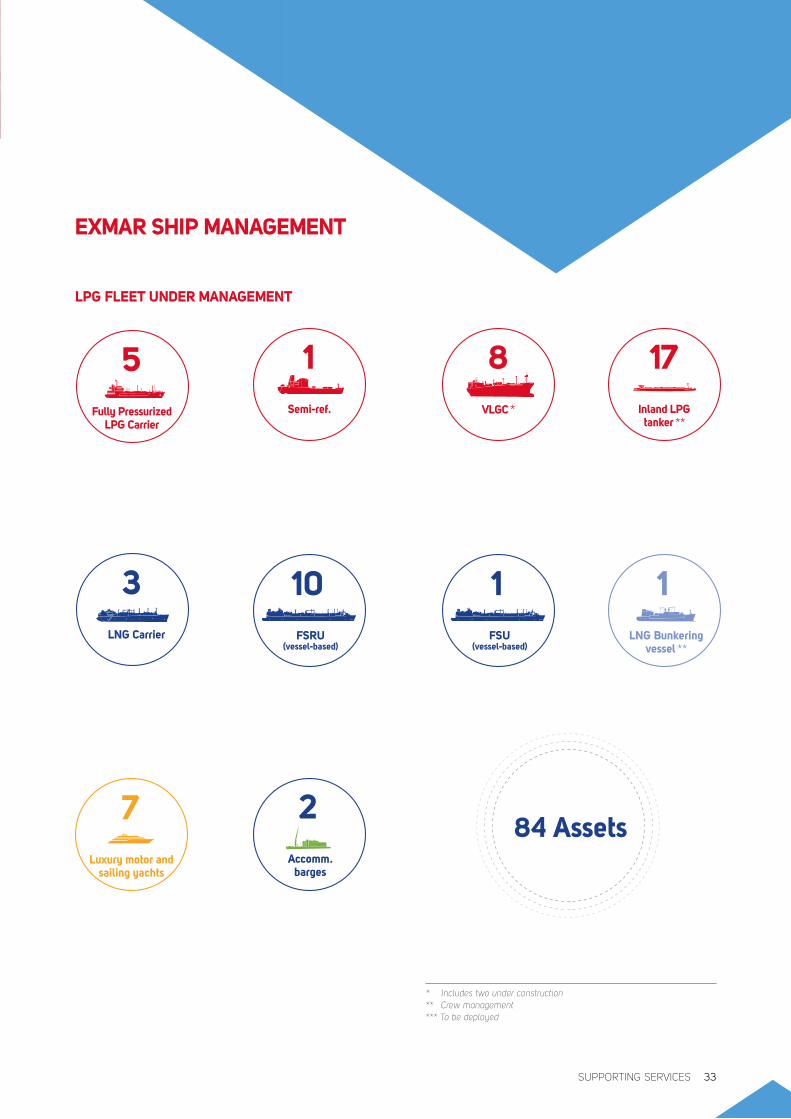
5Fully Pressurized
LPG Carrier
8VLGC *
1Semi-ref.
17Inland LPG tanker **
LPG FLEET UNDER MANAGEMENT
EXMAR SHIP MANAGEMENT
FSRU (vessel-based)
10
Accomm. barges
2
FSU (vessel-based)
1LNG Bunkering
vessel **
1LNG Carrier
3
Luxury motor and sailing yachts
784 Assets
* Includes two under construction** Crew management*** To be deployed
SUPPORTING SERVICES 33
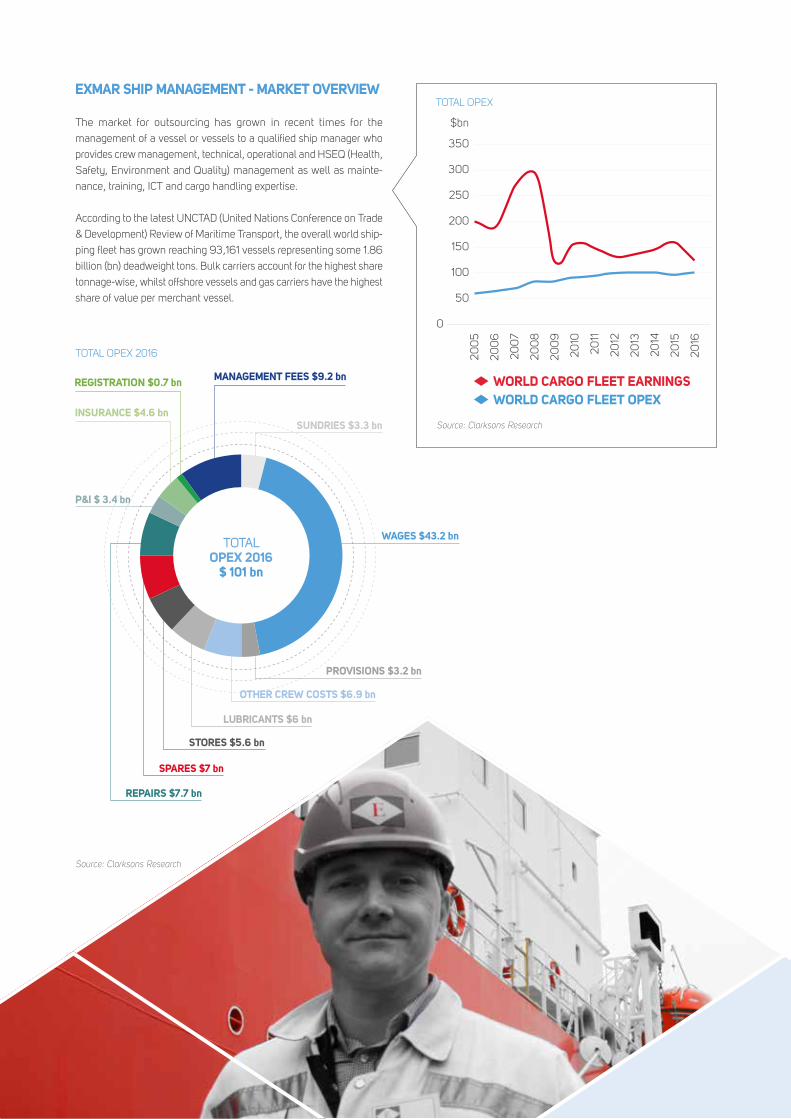
EXMAR SHIP MANAGEMENT - MARKET OVERVIEW
The market for outsourcing has grown in recent times for the
management of a vessel or vessels to a qualified ship manager who
provides crew management, technical, operational and HSEQ (Health,
Safety, Environment and Quality) management as well as mainte-
nance, training, ICT and cargo handling expertise.
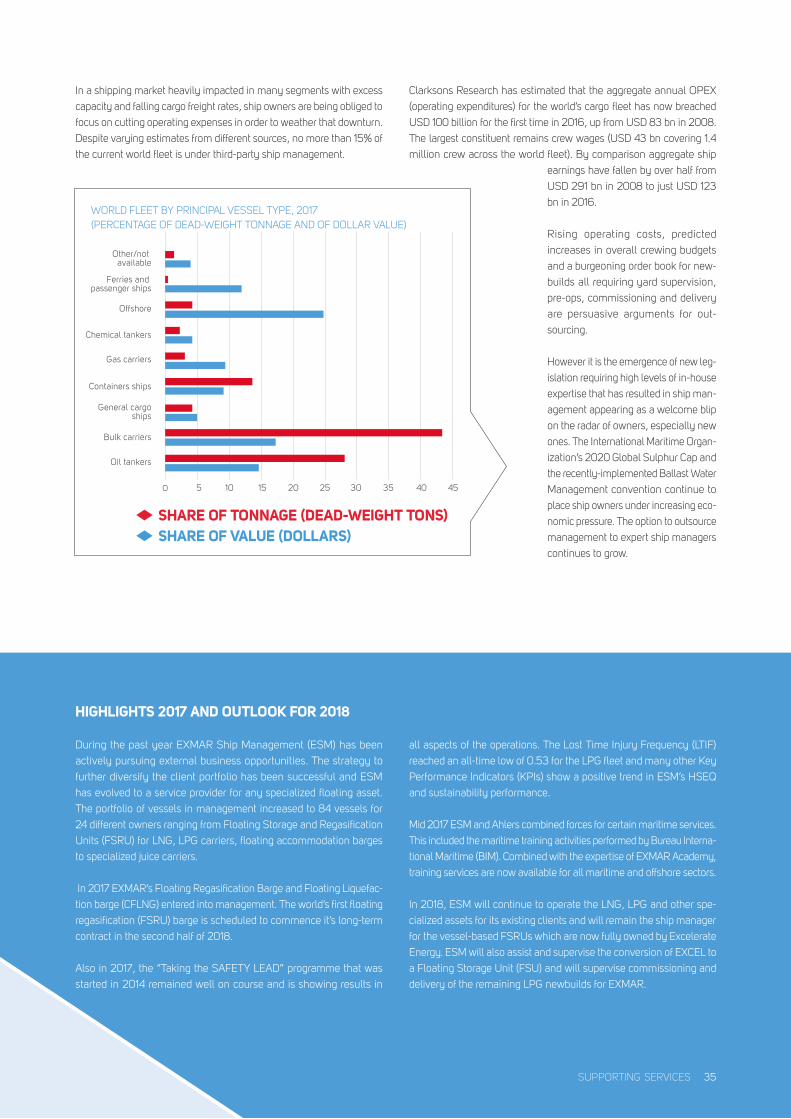
According to the latest UNCTAD (United Nations Conference on Trade
& Development) Review of Maritime Transport, the overall world ship-
ping fleet has grown reaching 93,161 vessels representing some 1.86
billion (bn) deadweight tons. Bulk carriers account for the highest share
tonnage-wise, whilst offshore vessels and gas carriers have the highest
share of value per merchant vessel.
Source: Clarksons Research
TOTAL OPEX
50
100
150
200
250
300
350
0
200
5
200
6
200
7
200
8
200
9
2010
2011
2012
2013
2014
2015
2016
$bn
WORLD CARGO FLEET OPEXWORLD CARGO FLEET EARNINGS
�����������������������PROVISIONS $3.2 bn
WAGES $43.2 bn
REPAIRS $7.7 bn
P&I $ 3.4 bn
SUNDRIES $3.3 bn
OTHER CREW COSTS $6.9 bn
LUBRICANTS $6 bn
STORES $5.6 bn
SPARES $7 bn
INSURANCE $4.6 bn
REGISTRATION $0.7 bn MANAGEMENT FEES $9.2 bn
TOTAL OPEX 2016
$ 101 bn
Source: Clarksons Research
TOTAL OPEX 2016
In a shipping market heavily impacted in many segments with excess
capacity and falling cargo freight rates, ship owners are being obliged to
focus on cutting operating expenses in order to weather that downturn.
Despite varying estimates from different sources, no more than 15% of
the current world fleet is under third-party ship management.
Clarksons Research has estimated that the aggregate annual OPEX
(operating expenditures) for the world’s cargo fleet has now breached
USD 100 billion for the first time in 2016, up from USD 83 bn in 2008.
The largest constituent remains crew wages (USD 43 bn covering 1.4
million crew across the world fleet). By comparison aggregate ship
SHARE OF VALUE (DOLLARS)SHARE OF TONNAGE (DEAD-WEIGHT TONS)
0 5 10 15 20 25 30 35 40 45
Oil tankers
Bulk carriers
General cargoships
Containers ships
Gas carriers
Chemical tankers
Offshore
Ferries and passenger ships
Other/not available
WORLD FLEET BY PRINCIPAL VESSEL TYPE, 2017(PERCENTAGE OF DEAD-WEIGHT TONNAGE AND OF DOLLAR VALUE)
HIGHLIGHTS 2017 AND OUTLOOK FOR 2018
During the past year EXMAR Ship Management (ESM) has been
actively pursuing external business opportunities. The strategy to
further diversify the client portfolio has been successful and ESM
has evolved to a service provider for any specialized floating asset.
The portfolio of vessels in management increased to 84 vessels for
24 different owners ranging from Floating Storage and Regasification
Units (FSRU) for LNG, LPG carriers, floating accommodation barges
to specialized juice carriers.
In 2017 EXMAR’s Floating Regasification Barge and Floating Liquefac-
tion barge (CFLNG) entered into management. The world’s first floating
regasification (FSRU) barge is scheduled to commence it’s long-term
contract in the second half of 2018.
Also in 2017, the “Taking the SAFETY LEAD” programme that was
started in 2014 remained well on course and is showing results in
all aspects of the operations. The Lost Time Injury Frequency (LTIF)
reached an all-time low of 0.53 for the LPG fleet and many other Key
Performance Indicators (KPIs) show a positive trend in ESM’s HSEQ
and sustainability performance.
Mid 2017 ESM and Ahlers combined forces for certain maritime services.
This included the maritime training activities performed by Bureau Interna-
tional Maritime (BIM). Combined with the expertise of EXMAR Academy,
training services are now available for all maritime and offshore sectors.
In 2018, ESM will continue to operate the LNG, LPG and other spe-
cialized assets for its existing clients and will remain the ship manager
for the vessel-based FSRUs which are now fully owned by Excelerate
Energy. ESM will also assist and supervise the conversion of EXCEL to
a Floating Storage Unit (FSU) and will supervise commissioning and
delivery of the remaining LPG newbuilds for EXMAR.
earnings have fallen by over half from
USD 291 bn in 2008 to just USD 123
bn in 2016.
Rising operating costs, predicted
increases in overall crewing budgets
and a burgeoning order book for new-
builds all requiring yard supervision,
pre-ops, commissioning and delivery
are persuasive arguments for out-
sourcing.
However it is the emergence of new leg-
islation requiring high levels of in-house
expertise that has resulted in ship man-
agement appearing as a welcome blip
on the radar of owners, especially new
ones. The International Maritime Organ-
ization’s 2020 Global Sulphur Cap and
the recently-implemented Ballast Water
Management convention continue to
place ship owners under increasing eco-
nomic pressure. The option to outsource
management to expert ship managers
continues to grow.
SUPPORTING SERVICES 35
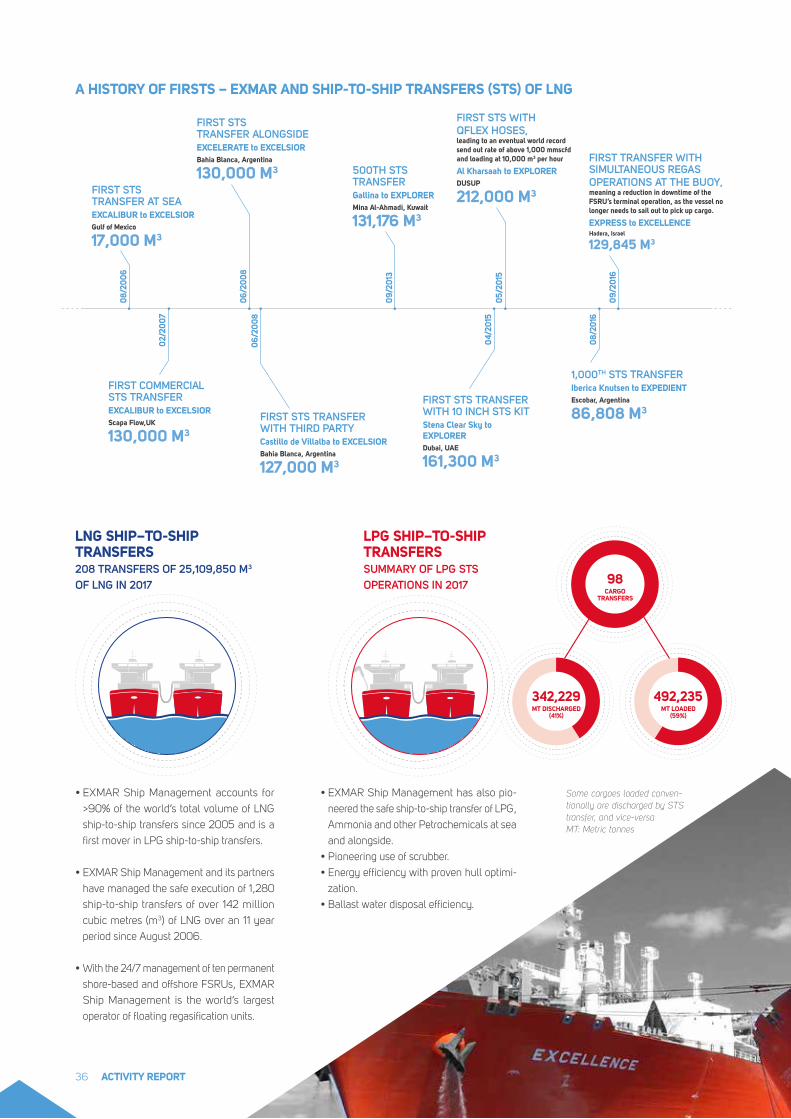
A HISTORY OF FIRSTS – EXMAR AND SHIP-TO-SHIP TRANSFERS (STS) OF LNG
08/2
006
02/
200
7
04/2
015
08/2
016
06/2
008
06/2
008
09/2
013
05/2
015
09/
2016
FIRST STS TRANSFER AT SEAEXCALIBUR to EXCELSIORGulf of Mexico
17,000 M3
FIRST STS TRANSFER ALONGSIDEEXCELERATE to EXCELSIOR Bahia Blanca, Argentina
130,000 M3 500TH STS TRANSFERGallina to EXPLORER Mina Al-Ahmadi, Kuwait
131,176 M3
FIRST STS WITH QFLEX HOSES,leading to an eventual world record send out rate of above 1,000 mmscfd and loading at 10,000 m3 per hour
Al Kharsaah to EXPLORER DUSUP
212,000 M3
FIRST TRANSFER WITH SIMULTANEOUS REGAS OPERATIONS AT THE BUOY, meaning a reduction in downtime of the FSRU’s terminal operation, as the vessel no longer needs to sail out to pick up cargo.
EXPRESS to EXCELLENCEHadera, Israel
129,845 M3
FIRST COMMERCIAL STS TRANSFEREXCALIBUR to EXCELSIOR Scapa Flow,UK
130,000 M3
FIRST STS TRANSFER WITH THIRD PARTYCastillo de Villalba to EXCELSIOR Bahia Blanca, Argentina
127,000 M3
FIRST STS TRANSFER WITH 10 INCH STS KITStena Clear Sky to EXPLORERDubai, UAE
161,300 M3
1,000TH STS TRANSFERIberica Knutsen to EXPEDIENTEscobar, Argentina
86,808 M3
208 TRANSFERS OF 25,109,850 M3
OF LNG IN 2017
• EXMAR Ship Management accounts for
>90% of the world’s total volume of LNG
ship-to-ship transfers since 2005 and is a
first mover in LPG ship-to-ship transfers.
• EXMAR Ship Management and its partners
have managed the safe execution of 1,280
ship-to-ship transfers of over 142 million
cubic metres (m3) of LNG over an 11 year
period since August 2006.
• With the 24/7 management of ten permanent
shore-based and offshore FSRUs, EXMAR
Ship Management is the world’s largest
operator of floating regasification units.
LNG SHIP–TO-SHIP TRANSFERS
Some cargoes loaded conven-tionally are discharged by STS transfer, and vice-versa MT: Metric tonnes
• EXMAR Ship Management has also pio-
neered the safe ship-to-ship transfer of LPG,
Ammonia and other Petrochemicals at sea
and alongside.
• Pioneering use of scrubber.
• Energy efficiency with proven hull optimi-
zation.
• Ballast water disposal efficiency.
LPG SHIP–TO-SHIP TRANSFERSSUMMARY OF LPG STS OPERATIONS IN 2017 98
CARGO TRANSFERS
� ���342,229 MT DISCHARGED
(41%)
492,235 MT LOADED
(59%)
ACTIVITY REPORT36
LNG SHIP–TO-SHIP TRANSFERS
LPG SHIP–TO-SHIP TRANSFERS
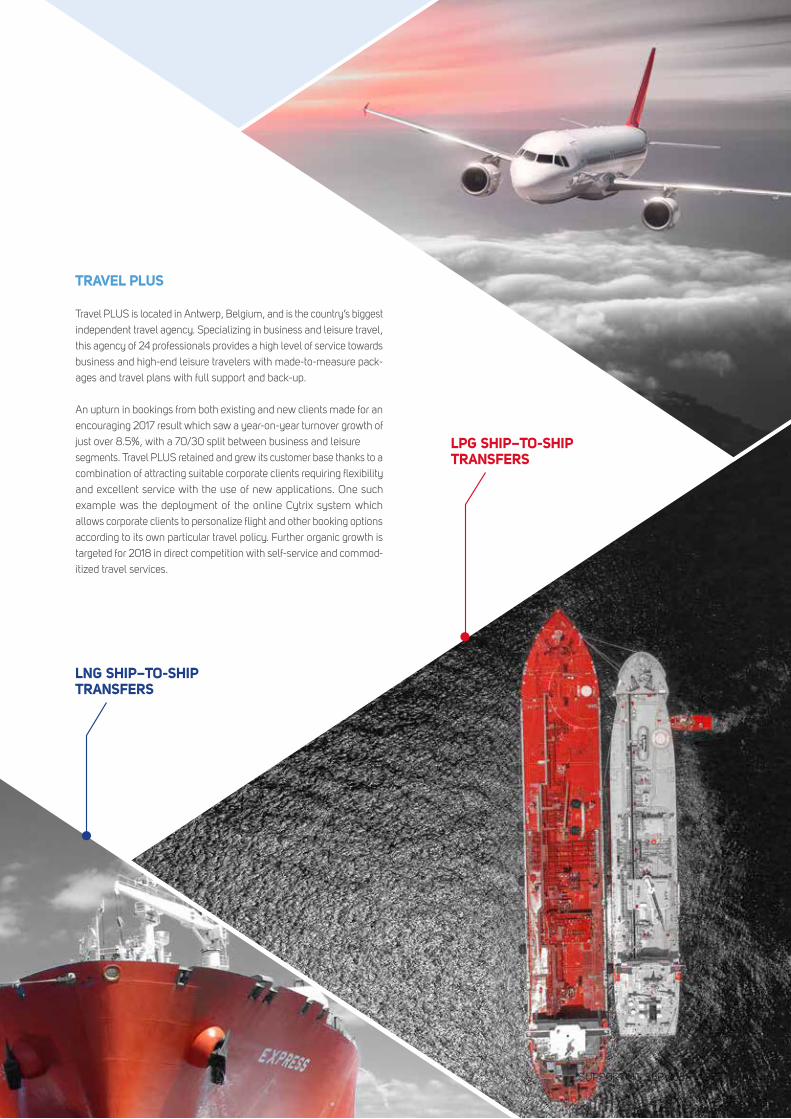
TRAVEL PLUS
Travel PLUS is located in Antwerp, Belgium, and is the country’s biggest
independent travel agency. Specializing in business and leisure travel,
this agency of 24 professionals provides a high level of service towards
business and high-end leisure travelers with made-to-measure pack-
ages and travel plans with full support and back-up.
An upturn in bookings from both existing and new clients made for an
encouraging 2017 result which saw a year-on-year turnover growth of
just over 8.5%, with a 70/30 split between business and leisure
segments. Travel PLUS retained and grew its customer base thanks to a
combination of attracting suitable corporate clients requiring flexibility
and excellent service with the use of new applications. One such
example was the deployment of the online Cytrix system which
allows corporate clients to personalize flight and other booking options
according to its own particular travel policy. Further organic growth is
targeted for 2018 in direct competition with self-service and commod-
itized travel services.
SUPPORTING SERVICES 37


BEYOND COMPLIANCE PEOPLE - OUR MOST VALUABLE ASSET
OUR BUSINESS PRINCIPLES
CARE FOR TODAY,RESPECT FOR TOMORROW
03
BEYOND COMPLIANCE
The emphasis “care for today, respect for tomorrow” has been at the
forefront of EXMAR’s approach towards how it conducts business
worldwide since its inception back in 2003.
EXMAR goes beyond compliance with legislation, having earned its
certification as a floating asset owner-operator according to the ISO14001
standard (obtained in 2011) for its environmental management system as
well as ISO50001 (obtained in 2014) for its energy management system.
EXMAR’s Ship Management operations also has its quality man-
agement system recognized by the industry ISO29001 standard, its
occupational health and safety management system is OHSAS 18001
certified and it has worked carefully with the local classification society
RINA to ensure its operations off the Italian coast and with Italian
partners to meet and exceed local legislation demands.
Anyone who has worked with these rigorous certification processes will
be aware that the biggest challenge is not to attain these standards but
to retain them by constantly demonstrating continuous improvement
through innovation, respect and care. The Group’s compliance, HSEEQ,
Technical and legal teams work on a daily basis with each other as well
as in industry forums to ensure performance is continuously improved.
The Company has now turned its attention to fully applying the Global
Reporting Initiative (GRI) Sustainability Reporting Standards, which are
designed to be used by organizations to report about their impacts on
the economy, the environment, and society.
In terms of reducing vessel emissions, EXMAR has installed both closed
and open loop exhaust gas scrubbers in its new midsize LPG fleet, and
has also retrofitted its first midsize newbuild WAASMUNSTER with a
scrubber. These scrubbers are capable of reducing more than 95% of
SOx emissions and 60% of particulate emissions in air.
As a further step beyond compliance, the two EXMAR VLGC newbuilds
for delivery in 2020 will be powered by LPG, the first of their kind in
the industry. Gas fuel reduces more than 99% of SOx emissions and
80% of particulate emissions. In addition, LPG as a fuel reduces 17%
of CO2 emissions as compared to Heavy Fuel Oil (HFO).
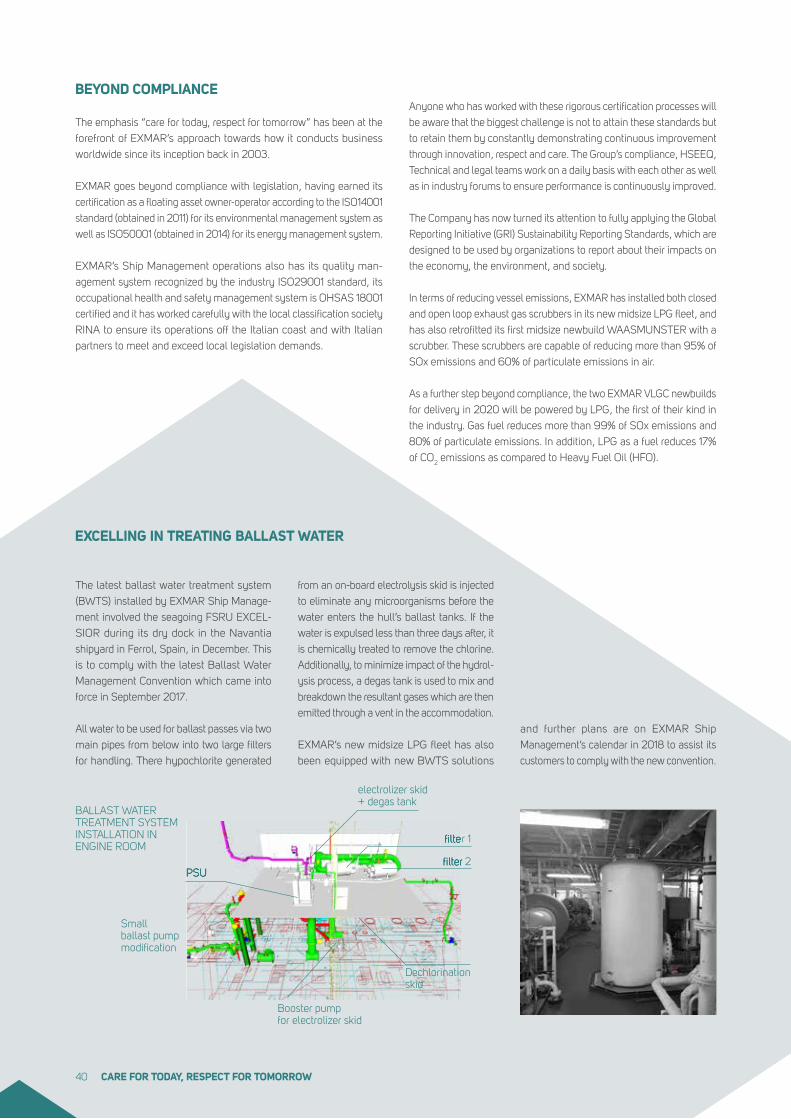
The latest ballast water treatment system
(BWTS) installed by EXMAR Ship Manage-
ment involved the seagoing FSRU EXCEL-
SIOR during its dry dock in the Navantia
shipyard in Ferrol, Spain, in December. This
is to comply with the latest Ballast Water
Management Convention which came into
force in September 2017.
All water to be used for ballast passes via two
main pipes from below into two large filters
for handling. There hypochlorite generated
EXCELLING IN TREATING BALLAST WATER
from an on-board electrolysis skid is injected
to eliminate any microorganisms before the
water enters the hull’s ballast tanks. If the
water is expulsed less than three days after, it
is chemically treated to remove the chlorine.
Additionally, to minimize impact of the hydrol-
ysis process, a degas tank is used to mix and
breakdown the resultant gases which are then
emitted through a vent in the accommodation.
EXMAR’s new midsize LPG fleet has also
been equipped with new BWTS solutions
and further plans are on EXMAR Ship
Management’s calendar in 2018 to assist its
customers to comply with the new convention.
BALLAST WATER TREATMENT SYSTEM INSTALLATION IN ENGINE ROOM
PSU
electrolizer skid+ degas tank
filter 1
filter 1
filter 2filter 2PSU filter 1
filter 1
filter 2filter 2
Booster pumpfor electrolizer skid
Dechlorination skid
Small ballast pump modification
CARE FOR TODAY, RESPECT FOR TOMORROW40
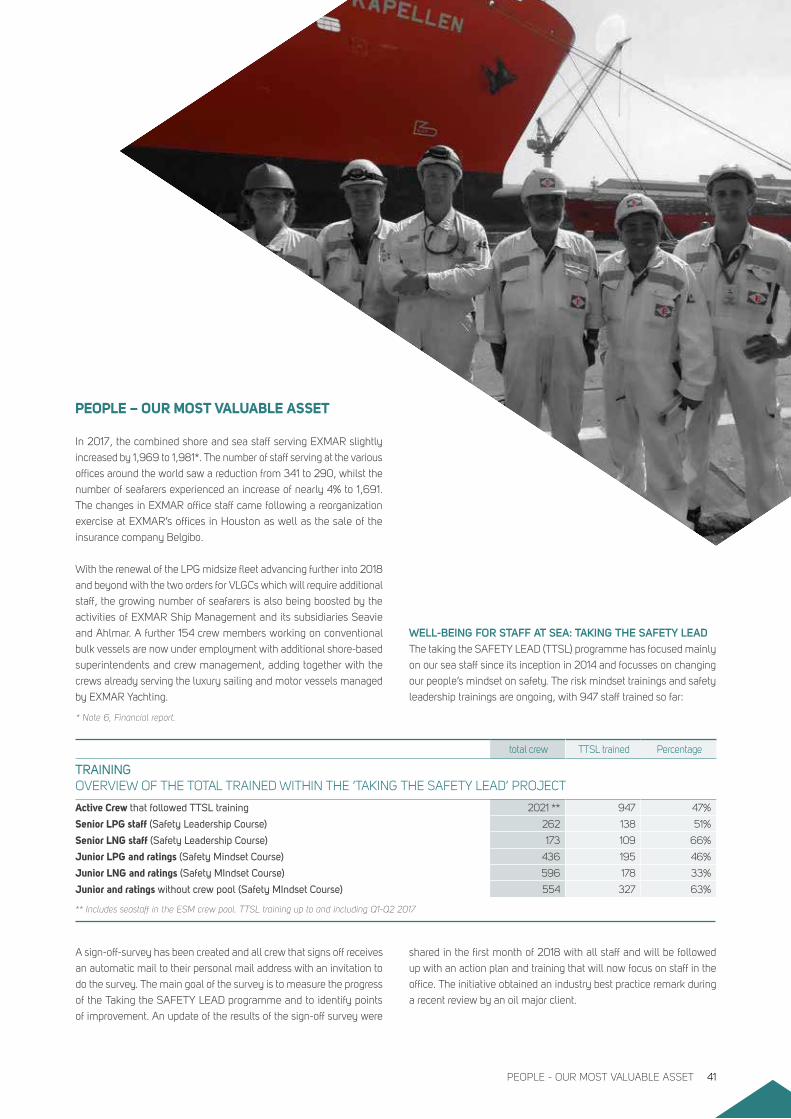
PEOPLE – OUR MOST VALUABLE ASSET
In 2017, the combined shore and sea staff serving EXMAR slightly
increased by 1,969 to 1,981*. The number of staff serving at the various
offices around the world saw a reduction from 341 to 290, whilst the
number of seafarers experienced an increase of nearly 4% to 1,691.
The changes in EXMAR office staff came following a reorganization
exercise at EXMAR’s offices in Houston as well as the sale of the
insurance company Belgibo.
With the renewal of the LPG midsize fleet advancing further into 2018
and beyond with the two orders for VLGCs which will require additional
staff, the growing number of seafarers is also being boosted by the
activities of EXMAR Ship Management and its subsidiaries Seavie
and Ahlmar. A further 154 crew members working on conventional
bulk vessels are now under employment with additional shore-based
superintendents and crew management, adding together with the
crews already serving the luxury sailing and motor vessels managed
by EXMAR Yachting.
total crew TTSL trained Percentage
TRAININGOVERVIEW OF THE TOTAL TRAINED WITHIN THE ‘TAKING THE SAFETY LEAD’ PROJECT
Active Crew that followed TTSL training 2021 ** 947 47%
Senior LPG staff (Safety Leadership Course) 262 138 51%
Senior LNG staff (Safety Leadership Course) 173 109 66%
Junior LPG and ratings (Safety Mindset Course) 436 195 46%
Junior LNG and ratings (Safety MIndset Course) 596 178 33%
Junior and ratings without crew pool (Safety MIndset Course) 554 327 63%
A sign-off-survey has been created and all crew that signs off receives
an automatic mail to their personal mail address with an invitation to
do the survey. The main goal of the survey is to measure the progress
of the Taking the SAFETY LEAD programme and to identify points
of improvement. An update of the results of the sign-off survey were
shared in the first month of 2018 with all staff and will be followed
up with an action plan and training that will now focus on staff in the
office. The initiative obtained an industry best practice remark during
a recent review by an oil major client.
** Includes seastaff in the ESM crew pool. TTSL training up to and including Q1-Q2 2017
WELL-BEING FOR STAFF AT SEA: TAKING THE SAFETY LEADThe taking the SAFETY LEAD (TTSL) programme has focused mainly
on our sea staff since its inception in 2014 and focusses on changing
our people’s mindset on safety. The risk mindset trainings and safety
leadership trainings are ongoing, with 947 staff trained so far:
* Note 6, Financial report.
PEOPLE - OUR MOST VALUABLE ASSET 41
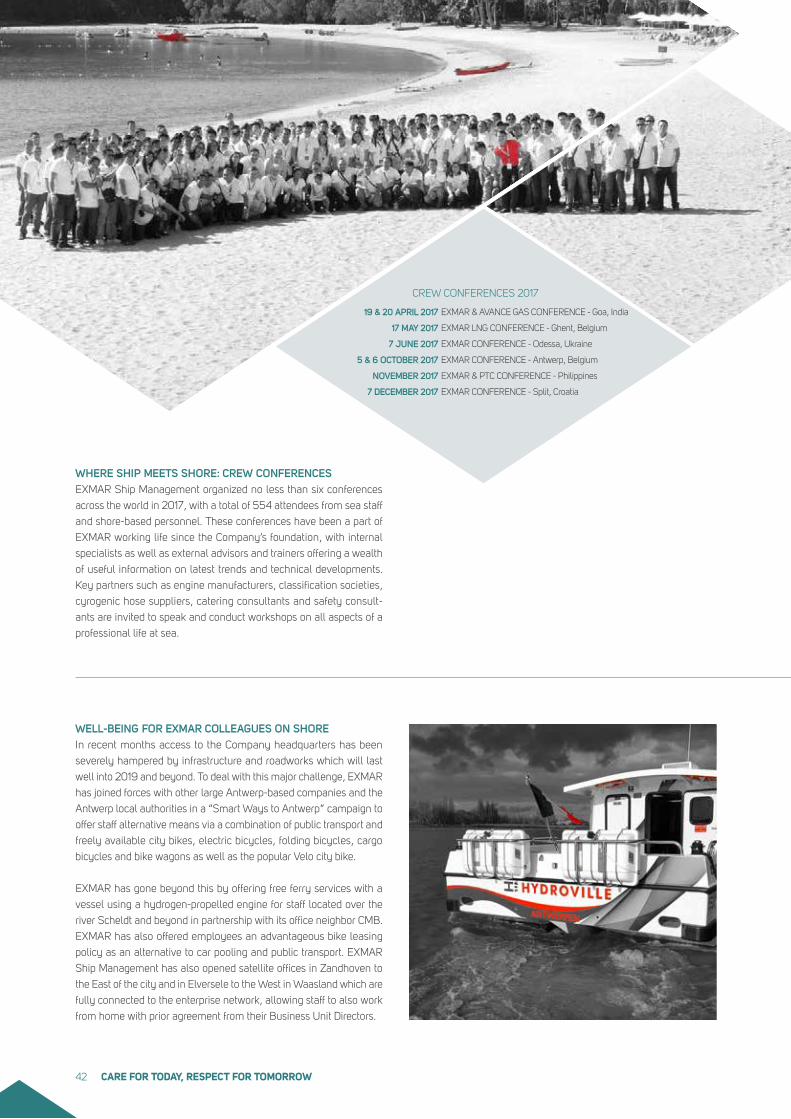
WHERE SHIP MEETS SHORE: CREW CONFERENCESEXMAR Ship Management organized no less than six conferences
across the world in 2017, with a total of 554 attendees from sea staff
and shore-based personnel. These conferences have been a part of
EXMAR working life since the Company’s foundation, with internal
specialists as well as external advisors and trainers offering a wealth
of useful information on latest trends and technical developments.
Key partners such as engine manufacturers, classification societies,
cyrogenic hose suppliers, catering consultants and safety consult-
ants are invited to speak and conduct workshops on all aspects of a
professional life at sea.
WELL-BEING FOR EXMAR COLLEAGUES ON SHORE In recent months access to the Company headquarters has been
severely hampered by infrastructure and roadworks which will last
well into 2019 and beyond. To deal with this major challenge, EXMAR
has joined forces with other large Antwerp-based companies and the
Antwerp local authorities in a “Smart Ways to Antwerp” campaign to
offer staff alternative means via a combination of public transport and
freely available city bikes, electric bicycles, folding bicycles, cargo
bicycles and bike wagons as well as the popular Velo city bike.
EXMAR has gone beyond this by offering free ferry services with a
vessel using a hydrogen-propelled engine for staff located over the
river Scheldt and beyond in partnership with its office neighbor CMB.
EXMAR has also offered employees an advantageous bike leasing
policy as an alternative to car pooling and public transport. EXMAR
Ship Management has also opened satellite offices in Zandhoven to
the East of the city and in Elversele to the West in Waasland which are
fully connected to the enterprise network, allowing staff to also work
from home with prior agreement from their Business Unit Directors.
EXMAR & AVANCE GAS CONFERENCE - Goa, India
EXMAR LNG CONFERENCE - Ghent, Belgium
EXMAR CONFERENCE - Odessa, Ukraine
EXMAR CONFERENCE - Antwerp, Belgium
EXMAR & PTC CONFERENCE - Philippines
EXMAR CONFERENCE - Split, Croatia
19 & 20 APRIL 2017
17 MAY 2017
7 JUNE 2017
5 & 6 OCTOBER 2017
NOVEMBER 2017
7 DECEMBER 2017
CREW CONFERENCES 2017
CARE FOR TODAY, RESPECT FOR TOMORROW42
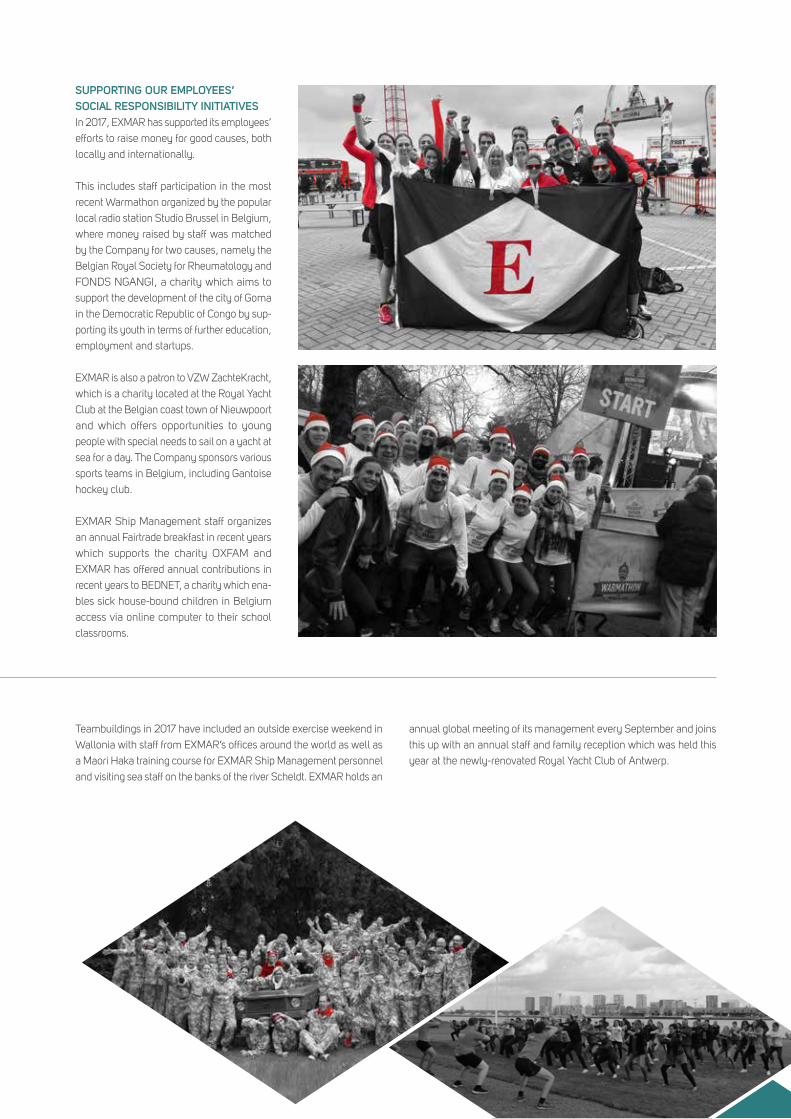
Teambuildings in 2017 have included an outside exercise weekend in
Wallonia with staff from EXMAR’s offices around the world as well as
a Maori Haka training course for EXMAR Ship Management personnel
and visiting sea staff on the banks of the river Scheldt. EXMAR holds an
annual global meeting of its management every September and joins
this up with an annual staff and family reception which was held this
year at the newly-renovated Royal Yacht Club of Antwerp.
SUPPORTING OUR EMPLOYEES’ SOCIAL RESPONSIBILITY INITIATIVESIn 2017, EXMAR has supported its employees’
efforts to raise money for good causes, both
locally and internationally.
This includes staff participation in the most
recent Warmathon organized by the popular
local radio station Studio Brussel in Belgium,
where money raised by staff was matched
by the Company for two causes, namely the
Belgian Royal Society for Rheumatology and
FONDS NGANGI, a charity which aims to
support the development of the city of Goma
in the Democratic Republic of Congo by sup-
porting its youth in terms of further education,
employment and startups.
EXMAR is also a patron to VZW ZachteKracht,
which is a charity located at the Royal Yacht
Club at the Belgian coast town of Nieuwpoort
and which offers opportunities to young
people with special needs to sail on a yacht at
sea for a day. The Company sponsors various
sports teams in Belgium, including Gantoise
hockey club.
EXMAR Ship Management staff organizes
an annual Fairtrade breakfast in recent years
which supports the charity OXFAM and
EXMAR has offered annual contributions in
recent years to BEDNET, a charity which ena-
bles sick house-bound children in Belgium
access via online computer to their school
classrooms.
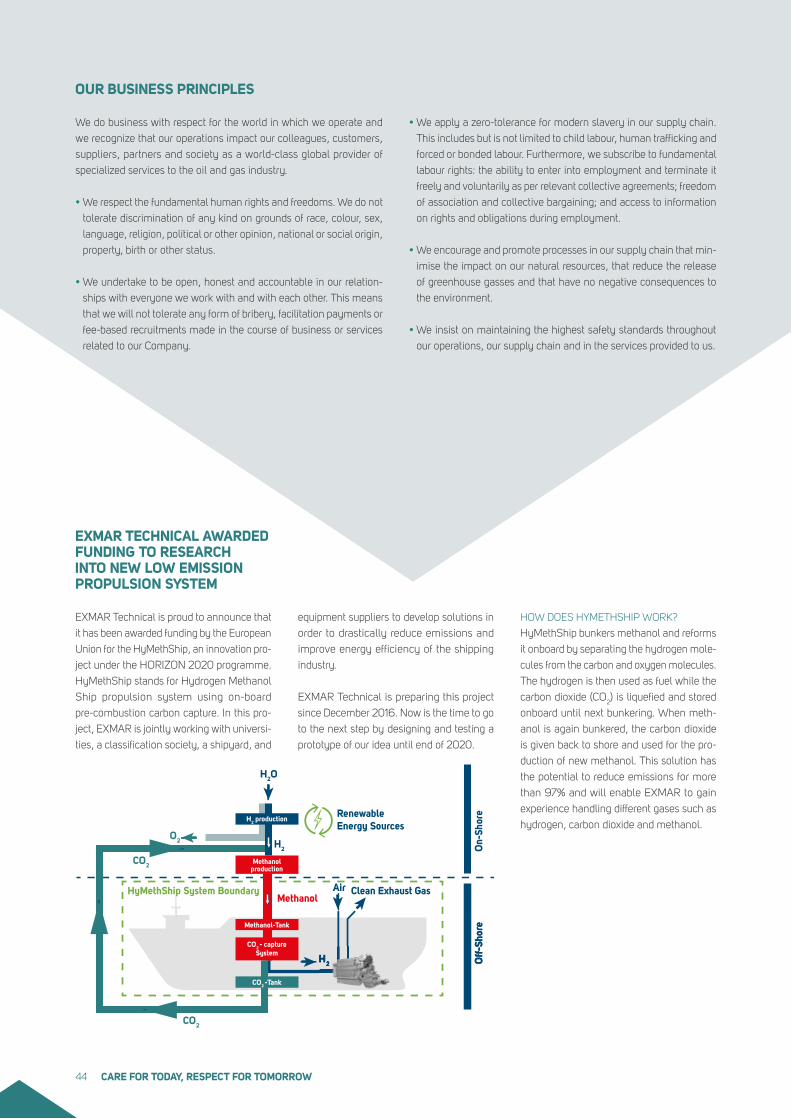
EXMAR Technical is proud to announce that
it has been awarded funding by the European
Union for the HyMethShip, an innovation pro-
ject under the HORIZON 2020 programme.
HyMethShip stands for Hydrogen Methanol
Ship propulsion system using on-board
pre-combustion carbon capture. In this pro-
ject, EXMAR is jointly working with universi-
ties, a classification society, a shipyard, and
HOW DOES HYMETHSHIP WORK?
HyMethShip bunkers methanol and reforms
it onboard by separating the hydrogen mole-
cules from the carbon and oxygen molecules.
The hydrogen is then used as fuel while the
carbon dioxide (CO2) is liquefied and stored
onboard until next bunkering. When meth-
anol is again bunkered, the carbon dioxide
is given back to shore and used for the pro-
duction of new methanol. This solution has
the potential to reduce emissions for more
than 97% and will enable EXMAR to gain
experience handling different gases such as
hydrogen, carbon dioxide and methanol.
equipment suppliers to develop solutions in
order to drastically reduce emissions and
improve energy efficiency of the shipping
industry.
EXMAR Technical is preparing this project
since December 2016. Now is the time to go
to the next step by designing and testing a
prototype of our idea until end of 2020.
OUR BUSINESS PRINCIPLES
We do business with respect for the world in which we operate and
we recognize that our operations impact our colleagues, customers,
suppliers, partners and society as a world-class global provider of
specialized services to the oil and gas industry.
• We respect the fundamental human rights and freedoms. We do not
tolerate discrimination of any kind on grounds of race, colour, sex,
language, religion, political or other opinion, national or social origin,
property, birth or other status.
• We undertake to be open, honest and accountable in our relation-
ships with everyone we work with and with each other. This means
that we will not tolerate any form of bribery, facilitation payments or
fee-based recruitments made in the course of business or services
related to our Company.
• We apply a zero-tolerance for modern slavery in our supply chain.
This includes but is not limited to child labour, human trafficking and
forced or bonded labour. Furthermore, we subscribe to fundamental
labour rights: the ability to enter into employment and terminate it
freely and voluntarily as per relevant collective agreements; freedom
of association and collective bargaining; and access to information
on rights and obligations during employment.
• We encourage and promote processes in our supply chain that min-
imise the impact on our natural resources, that reduce the release
of greenhouse gasses and that have no negative consequences to
the environment.
• We insist on maintaining the highest safety standards throughout
our operations, our supply chain and in the services provided to us.
EXMAR TECHNICAL AWARDED FUNDING TO RESEARCH INTO NEW LOW EMISSION PROPULSION SYSTEM
H2O
H2
O2
CO2
CO2
H2
Air Clean Exhaust GasHyMethShip System BoundaryMethanol
RenewableEnergy Sources
Off-
Shor
eO
ff-Sh
ore
On-
Shor
e
H2 production
Methanolproduction
Methanol-Tank
CO2 - captureSystem
CO2 -Tank
H2
CARE FOR TODAY, RESPECT FOR TOMORROW44
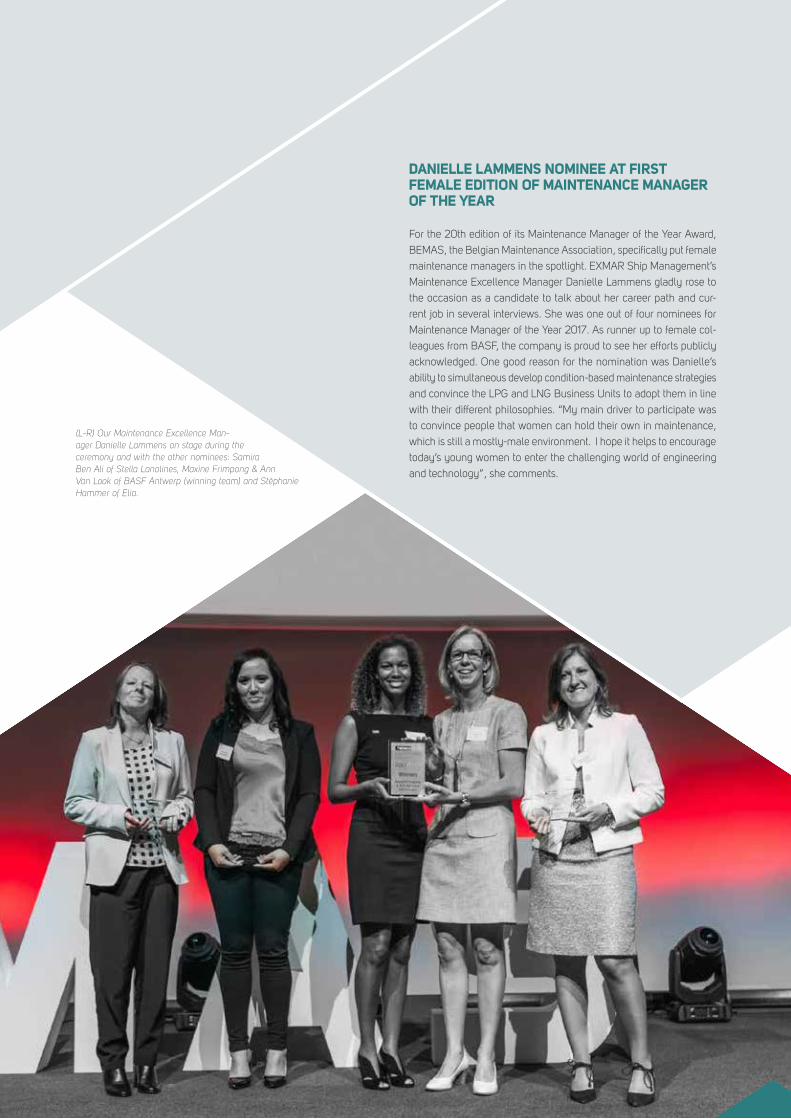
DANIELLE LAMMENS NOMINEE AT FIRST FEMALE EDITION OF MAINTENANCE MANAGER OF THE YEAR
For the 20th edition of its Maintenance Manager of the Year Award,
BEMAS, the Belgian Maintenance Association, specifically put female
maintenance managers in the spotlight. EXMAR Ship Management’s
Maintenance Excellence Manager Danielle Lammens gladly rose to
the occasion as a candidate to talk about her career path and cur-
rent job in several interviews. She was one out of four nominees for
Maintenance Manager of the Year 2017. As runner up to female col-
leagues from BASF, the company is proud to see her efforts publicly
acknowledged. One good reason for the nomination was Danielle’s
ability to simultaneous develop condition-based maintenance strategies
and convince the LPG and LNG Business Units to adopt them in line
with their different philosophies. “My main driver to participate was
to convince people that women can hold their own in maintenance,
which is still a mostly-male environment. I hope it helps to encourage
today’s young women to enter the challenging world of engineering
and technology”, she comments.
(L-R) Our Maintenance Excellence Man-ager Danielle Lammens on stage during the ceremony and with the other nominees: Samira Ben Ali of Stella Lanolines, Maxine Frimpong & Ann Van Look of BASF Antwerp (winning team) and Stéphanie Hammer of Elia.
FINANCIAL REPORT
04
CORPORATE GOVERNANCE STATEMENT 49
ANNUAL REPORT OF THE BOARD OF DIRECTORS 62
CONSOLIDATED FINANCIAL STATEMENTS 69
CONSOLIDATED STATEMENT OF FINANCIAL POSITION 69
CONSOLIDATED STATEMENT OF PROFIT OR LOSS AND CONSOLIDATED STATEMENT OF OTHER COMPREHENSIVE INCOME 70
CONSOLIDATED STATEMENT OF CASH FLOWS 71
CONSOLIDATED STATEMENT OF CHANGES IN EQUITY 72
NOTES
1. Accounting policies 74 2. Segment reporting 84 3. Reconciliation segment reporting 88 4. Operating income 90 5. Goods and services 90 6. Personnel expenses 91 7. Other operating expenses 91 8. Finance income / expenses 91 9. Income taxes 92 10. Disposal of a subsidiary / equity accounted investee 93 11. Vessels 95 12. Other property, plant and equipment 97 13. Intangible assets 97 14. Equity accounted investees 98 15. Financial information equity accounted investees 99 16. Borrowings to equity accounted investees 104 17. Equity accounted investee held for sale 105 18. Available-for-sale financial assets 105 19. Trade and other receivables 105 20. Deferred tax assets and liabilities 106 21. Restricted cash and cash and cash equivalents 106 22. Share capital and reserves 107 23. Earnings per share 108 24. Borrowings 109 25. Share based payments 112 26. Employee benefits 113 27. Provisions 115 28. Trade and other payables 115 29. Financial risks and financial instruments 115 30. Leases 121 31. Capital commitments 122 32. Contingencies 122 33. Related parties 122 34. Group entities 125 35. Major exchange rates used 126 36. Fees statutory auditor 12737. Subsequent events 127 Significant judgements and estimates 127
Statement on the true and fair view 127
Report of the statutory auditor 128
STATUTORY ACCOUNTS 131
CONTENTS
FINANCIAL REPORT48
CORPORATE GOVERNANCE STATEMENT
REFERENCE CODEThis Corporate Governance Statement is covered by the provisions of the Belgian 2009 Corporate Governance Code. The Royal Decree of 6 June 2010 recognized the Code of 2009 as the only applicable Code. This Code is published in the Belgian Official Gazette (Moniteur Belge/Belgisch Staatsblad) on 23 April 2010 (www.staatsblad.be), as well as on the website www.corporategovernancecommittee.be.
As a result of the publication of the 2009 Belgian Corporate Governance Code (“Code 2009”), EXMAR has Code 2009 as a reference code.
PRINCIPLES CODE 2009Pursuant to article 96 §2, 1° of the Belgian Companies Code, EXMAR
follows the principles of the 2009 Belgian Code on Corporate
Governance:
1) The Company adopts a clear governance structure;
2) The Company has an effective and efficient Board of Directors that
will make decisions in the interest of the Company;
3) All directors show integrity and dedication;
4) The Company has a rigorous and transparent procedure for the
appointment and the evaluation of its Board and the members
thereof;
5) The Board of Directors creates specialized Committees;
6) The Company develops a clear structure for executive management;
7) The Company compensates the directors and the members of the
Executive Management in a fair and responsible manner;
8) The Company enters into a dialogue with shareholders and potential
shareholders, based on mutual understanding of each other’s
objectives and expectations;
9) The Company guarantees suitable disclosure of its Corporate
Governance.
CORPORATE GOVERNANCE CHARTER AND CORPORATE GOVERNANCE STATEMENTAs a Belgian-headquartered Company with a commitment to the
highest standards of corporate governance, the Board of Directors
adopted a Corporate Governance Charter.
EXMAR’s Corporate Governance Charter was approved by the Board
on 31 March 2010 and updated and approved by the Board of Directors
on 2 September 2016. This Charter is also applicable to all affiliates
of EXMAR.
The Corporate Governance Charter contains a summary of the rules
and principles on which EXMAR’s Corporate Governance is organized
and is based on the provisions of EXMAR’s Articles of Association, the
Belgian Code of Companies and the most recent version of the Belgian
Corporate Governance Code.
The Belgian Corporate Governance Code is based on a ‘comply or
explain’ principle.
The Company aims to comply with most provisions of the Belgian
Corporate Governance Code, but the Board is of the opinion that
deviation from provisions may be justified in light of the Company’s
specific situation. If applicable, an explanation is provided in the
Corporate Governance Statement about the deviations during the
past financial year on specific provisions of the Code in accordance
with the “comply or explain” principle.
The Corporate Governance Charter describes the Company’s profile,
capital shares and shareholders and the applied principles related to
the shareholders’ meetings.
The roles and responsibilities of the different organs within the Company
are described:
- The power, responsibilities and functioning of the Board are
elaborated. The Corporate Governance Charter defines the rules
in operation of the Board, dealing with Conflicts of Interest,
remuneration and evaluation.
- The functioning of the Audit Committee and Nomination and
Remuneration Committee, set up in delegation of the Board is
described in detail.
- The roles and rules in the organization of the day-to-day
management, the power and responsibilities of the Chief
Executive Officer and Executive Committee are elaborated.
This Corporate Governance Statement describes the measures taken
by EXMAR to ensure compliance with laws and regulations relating to
insider trading, corruption, money-laundering practices, competition,
sanctions and suchlike.
The Corporate Governance Charter and Corporate Governance
Statement of EXMAR can be consulted on the website
http://exmar.be/en/investors/corporate-governance.
CORPORATE GOVERNANCE STATEMENT 49
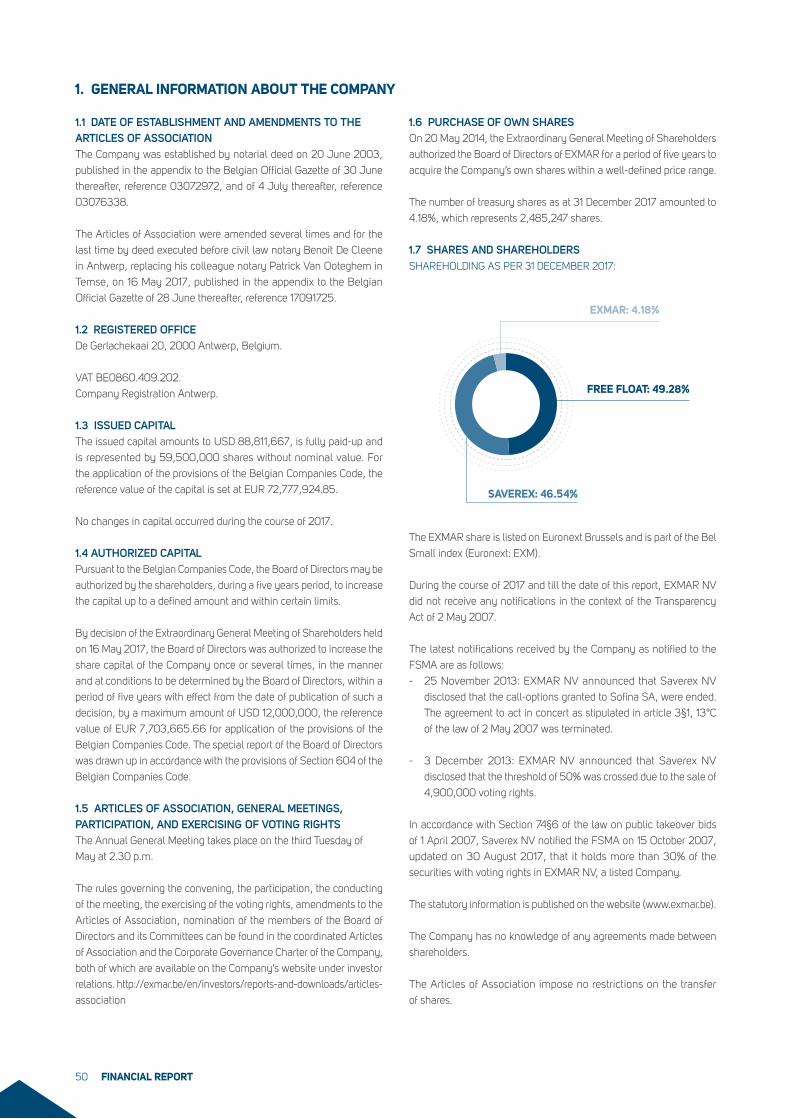
1. GENERAL INFORMATION ABOUT THE COMPANY
1.1 DATE OF ESTABLISHMENT AND AMENDMENTS TO THE ARTICLES OF ASSOCIATIONThe Company was established by notarial deed on 20 June 2003,
published in the appendix to the Belgian Official Gazette of 30 June
thereafter, reference 03072972, and of 4 July thereafter, reference
03076338.
The Articles of Association were amended several times and for the
last time by deed executed before civil law notary Benoit De Cleene
in Antwerp, replacing his colleague notary Patrick Van Ooteghem in
Temse, on 16 May 2017, published in the appendix to the Belgian
Official Gazette of 28 June thereafter, reference 17091725.
1.2 REGISTERED OFFICEDe Gerlachekaai 20, 2000 Antwerp, Belgium.
VAT BE0860.409.202.
Company Registration Antwerp.
1.3 ISSUED CAPITALThe issued capital amounts to USD 88,811,667, is fully paid-up and
is represented by 59,500,000 shares without nominal value. For
the application of the provisions of the Belgian Companies Code, the
reference value of the capital is set at EUR 72,777,924.85.
No changes in capital occurred during the course of 2017.
1.4 AUTHORIZED CAPITALPursuant to the Belgian Companies Code, the Board of Directors may be
authorized by the shareholders, during a five years period, to increase
the capital up to a defined amount and within certain limits.
By decision of the Extraordinary General Meeting of Shareholders held
on 16 May 2017, the Board of Directors was authorized to increase the
share capital of the Company once or several times, in the manner
and at conditions to be determined by the Board of Directors, within a
period of five years with effect from the date of publication of such a
decision, by a maximum amount of USD 12,000,000, the reference
value of EUR 7,703,665.66 for application of the provisions of the
Belgian Companies Code. The special report of the Board of Directors
was drawn up in accordance with the provisions of Section 604 of the
Belgian Companies Code.
1.5 ARTICLES OF ASSOCIATION, GENERAL MEETINGS, PARTICIPATION, AND EXERCISING OF VOTING RIGHTSThe Annual General Meeting takes place on the third Tuesday of
May at 2.30 p.m.
The rules governing the convening, the participation, the conducting
of the meeting, the exercising of the voting rights, amendments to the
Articles of Association, nomination of the members of the Board of
Directors and its Committees can be found in the coordinated Articles
of Association and the Corporate Governance Charter of the Company,
both of which are available on the Company’s website under investor
relations. http://exmar.be/en/investors/reports-and-downloads/articles-
association
1.6 PURCHASE OF OWN SHARESOn 20 May 2014, the Extraordinary General Meeting of Shareholders
authorized the Board of Directors of EXMAR for a period of five years to
acquire the Company’s own shares within a well-defined price range.
The number of treasury shares as at 31 December 2017 amounted to
4.18%, which represents 2,485,247 shares.
1.7 SHARES AND SHAREHOLDERSSHAREHOLDING AS PER 31 DECEMBER 2017:
The EXMAR share is listed on Euronext Brussels and is part of the Bel
Small index (Euronext: EXM).
During the course of 2017 and till the date of this report, EXMAR NV
did not receive any notifications in the context of the Transparency
Act of 2 May 2007.
The latest notifications received by the Company as notified to the
FSMA are as follows:
- 25 November 2013: EXMAR NV announced that Saverex NV
disclosed that the call-options granted to Sofina SA, were ended.
The agreement to act in concert as stipulated in article 3§1, 13°C
of the law of 2 May 2007 was terminated.
- 3 December 2013: EXMAR NV announced that Saverex NV
disclosed that the threshold of 50% was crossed due to the sale of
4,900,000 voting rights.
In accordance with Section 74§6 of the law on public takeover bids
of 1 April 2007, Saverex NV notified the FSMA on 15 October 2007,
updated on 30 August 2017, that it holds more than 30% of the
securities with voting rights in EXMAR NV, a listed Company.
The statutory information is published on the website (www.exmar.be).
The Company has no knowledge of any agreements made between
shareholders.
The Articles of Association impose no restrictions on the transfer
of shares.
EXMAR: 4.18%
FREE FLOAT: 49.28%
SAVEREX: 46.54%
��
FINANCIAL REPORT50
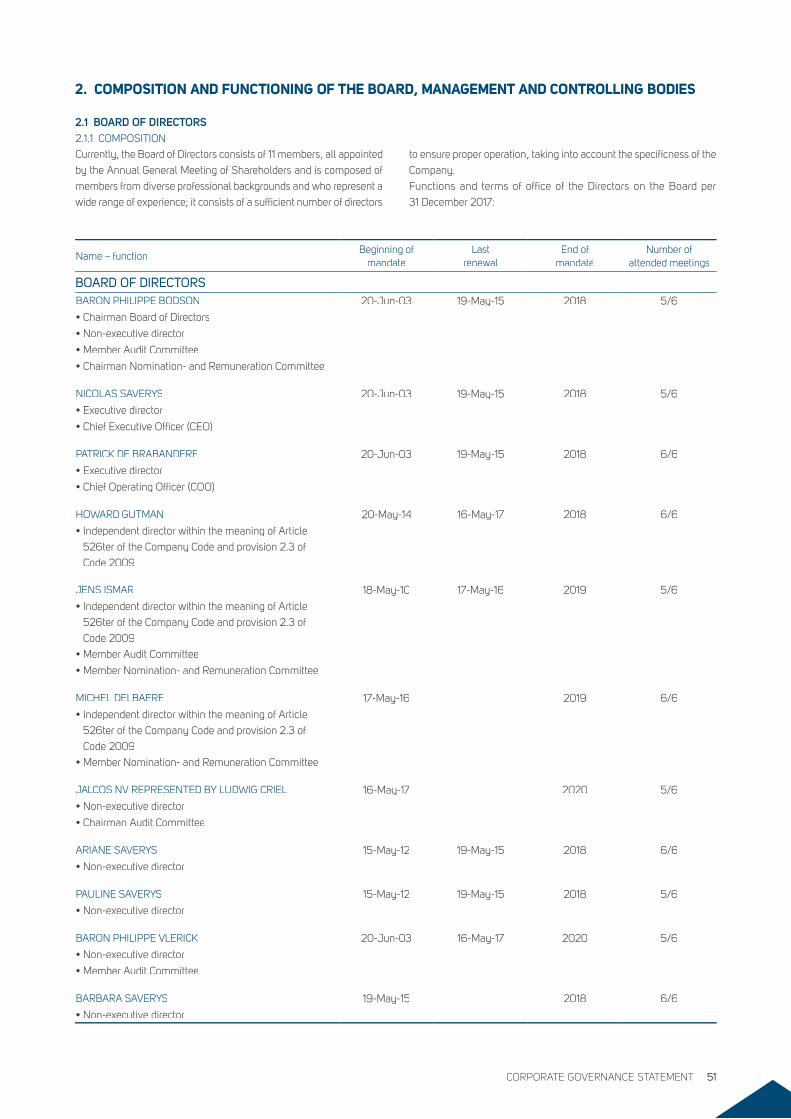
2. COMPOSITION AND FUNCTIONING OF THE BOARD, MANAGEMENT AND CONTROLLING BODIES
2.1 BOARD OF DIRECTORS2.1.1 COMPOSITION
Currently, the Board of Directors consists of 11 members, all appointed
by the Annual General Meeting of Shareholders and is composed of
members from diverse professional backgrounds and who represent a
wide range of experience; it consists of a sufficient number of directors
to ensure proper operation, taking into account the specificness of the
Company.
Functions and terms of office of the Directors on the Board per
31 December 2017:
Name – functionBeginning of
mandateLast
renewalEnd of
mandateNumber of
attended meetings
BOARD OF DIRECTORSBARON PHILIPPE BODSON 20-Jun-03 19-May-15 2018 5/6
• Chairman Board of Directors
• Non-executive director
• Member Audit Committee
• Chairman Nomination- and Remuneration Committee
NICOLAS SAVERYS 20-Jun-03 19-May-15 2018 5/6
• Executive director
• Chief Executive Officer (CEO)
PATRICK DE BRABANDERE 20-Jun-03 19-May-15 2018 6/6
• Executive director
• Chief Operating Officer (COO)
HOWARD GUTMAN 20-May-14 16-May-17 2018 6/6
• Independent director within the meaning of Article
526ter of the Company Code and provision 2.3 of
Code 2009
JENS ISMARJENS ISMAR 18-May-10 17-May-16 2019 5/6
• Independent director within the meaning of Article
526ter of the Company Code and provision 2.3 of
Code 2009
• Member Audit Committee
• Member Nomination- and Remuneration Committee
MICHEL DELBAERE 17-May-16 2019 6/6
• Independent director within the meaning of Article
526ter of the Company Code and provision 2.3 of
Code 2009
• Member Nomination- and Remuneration Committee
JALCOS NV REPRESENTED BY LUDWIG CRIELJALCOS NV REPRESENTED BY LUDWIG CRIEL 16-May-17 2020 5/6
• Non-executive director
• Chairman Audit Committee
ARIANE SAVERYS 15-May-12 19-May-15 2018 6/6
• Non-executive director
PAULINE SAVERYS 15-May-12 19-May-15 2018 5/6
• Non-executive director
BARON PHILIPPE VLERICK 20-Jun-03 16-May-17 2020 5/6
• Non-executive director
• Member Audit Committee
BARBARA SAVERYS 19-May-15 2018 6/6
• Non-executive director 96,026
CORPORATE GOVERNANCE STATEMENT 51
2.1.2 POSITION AND MANDATE
The Board of Directors is the ultimate decision-making body of the
Company. The powers and the operation of the Board are described
extensively in the Corporate Governance Charter. The Board has all
the powers with the exception of matters reserved by the Belgian
Companies Code or the coordinated Articles of Association for the
General Meeting of Shareholders.
The Board of Directors strives for the success of the Company in the
long-term, provides the necessary leadership for this, and ensures that
risks can be identified and managed. It is responsible for the overall
strategy and values of EXMAR, based on the social, economic and
ecological responsibility, gender diversity, and diversity in general.
The directors will be provided in good time with a file containing all
the information for the deliberations on the agenda items. Decisions
are taken at Board of Directors meetings in accordance with Article 22
of the Articles of Association, which includes the stipulation that the
Chairman’s vote is decisive in the event of a tied vote. To date, such a
tied vote has never occurred.
2.1.3 ACTIVITIES
During 2017 the Board held six meetings; all the meetings were held
under the chairmanship of Mr. Bodson, except the meeting of 30 March
2017. Each in the presence of all members, except at the following
meetings:
• 23 March 2017, where Ms. Pauline Saverys was represented by
proxy;
• 30 March 2017, where Mr. Philippe Bodson, Mr. Jens Ismar, Mr.
Nicolas Saverys and Ms. Pauline Saverys were excused;
• 16 May 2017, where Ms. Pauline Saverys was represented by proxy;
• 27 June 2017, where Mr. Philippe Vlerick was excused;
• 8 September 2017, where Jalcos NV, represented by Mr. Ludwig
Criel, was excused.
In addition to exercising the powers provided by law, the Articles
of Association and the Corporate Governance Charter, the Board of
Directors deals with reviewing and deciding on the long-term strategy,
key policies and structure of the Group and its assets and closing the
accounts and financial statements of the Group. Other topics were:
- General market developments
- Vopak project
- Finances
- Employment FSRU-platform
- Sale of Belgian insurance broker Belgibo
2.2 AUDIT COMMITTEE2.2.1 COMPOSITION
The Audit Committee is founded by the Board of Directors.
The Corporate Governance Code stipulates that at least half of the
members of the Audit Committee must be independent. Section 526bis
of the Belgian Companies Code and the EXMAR Corporate Governance
Charter stipulate that at least one member be independent; the Board
of Directors confirms that the composition of the Audit Committee
meets the purpose of the law.
2.2.2 POSITION AND MANDATE
The Board of Directors has granted the Audit Committee the broadest
powers of investigation within its area.
The Audit Committee assists the Board of Directors with the fulfilment
of its supervisory task and to ensure monitoring in the broadest sense.
It is the main point of liaison for the Internal Auditor and the External
Auditor. All the members of the Audit Committee possess the necessary
expertise concerning accounting and auditing, and are familiar with
financial reporting, accounting standards and risks, because of their
qualifications, their careers in various multinational groups and their
current professional activities.
With the entry into force of the EU General Data Protection Regulation
2016/679 (GDPR) as of 25 May 2018, a Data Protection Committee
(DPC) is appointed.
The role of the DPC is to propose the changes to the Company’s policies
and procedures as required by the GDPR, coordinate and oversee their
implementation and monitor compliance with GDPR.
The DPC will report to the Risk Committee.
2.2.3 ACTIVITIES
The specific responsibilities of the Audit Committee are set out in an
Audit Charter, approved by the Board of Directors on 31 March 2011
and modified on 25 March 2015.
In 2017, four meetings were held each in the presence of all members,
except at the following meetings:
• 27 June 2017, where Mr. Philippe Vlerick was excused;
• 5 December 2017, where Mr. Philippe Bodson was excused.
The Statutory Auditor and the Internal Auditor were both present during
two meetings.
The Audit Committee deliberated on specific financial matters that arose
during the year, made recommendations to the Board of Directors,
other agenda items included:
- Recommendations to the Board of Directors in relation to
re-appointments
- Compliance and Risks
On Information Management and IT Security, awareness training on
cybersecurity and GDPR is done. On Privacy, the assessment regarding
implementation of the GDPR is completed.
The Compliance policies confirm EXMAR’s commitment to comply
with applicable laws and rules.
A specific Risk Committee is set up with the task of continuously
supervising the effective functioning of the Compliance Model and
respect of the applicable legislation.
The EXMAR Risk Committee performs these tasks for all entities within
the EXMAR group, reporting to the Audit Committee.
The Risk Committee comprises the COO (as the Compliance Officer), the
Chairman of the Audit Committee and a third person appointed by the
Board on the recommendation of the Audit Committee (who shall be the
chairman of the Risk Committee). EXMAR has built a Compliance Risk
FINANCIAL REPORT52
Universe containing all risk themes for legal/regulatory and business
requirements. For each theme a Key Risk Officer has been designated.
The Risk Committee shall at least once per year submit to the Audit
Committee a report on the risk assessment carried out by the Key Risk
Officers who are instructed and authorized to assess the risks as set
out in the Compliance Model and on complaints or questions received
by the Risk Committee. At least once per year the Risk Committee
shall report on non-compliance complaints it has received in the form
requested and within the appropriate timeframe. It will also report the
action taken to the Audit Committee (unless the complaint concerns
a member of the Audit Committee in which case the complaint shall
be directed to the Chairman of the Board). The Audit Committee will
report to the Board on the functioning of the Risk Committee at least
once a year.
2.3 NOMINATION AND REMUNERATION COMMITTEE2.3.1 COMPOSITION
The Nomination and Remuneration Committee was founded by the
Board of Directors and operates in compliance with Section 526quater
of the Belgian Companies Code:
• Composed out of a majority of independent directors
• Chaired by the Chairman of the Board of Directors
• Other members are non-executive
The Nomination and Remuneration Committee was composed of three
members on 31 December 2017.
2.3.2 POSITION AND MANDATE
All the members of the Nomination and Remuneration Committee
possess the necessary expertise in the area of remuneration policy
based on exercising their positions during their careers.
The Committee assists the Board of Directors with the exercising of
its responsibilities concerning the determination of the Company’s
remuneration policy and the nomination procedures.
2.3.3 ACTIVITIES
The specific responsibilities have been set out in a Nomination and
Remuneration Committee Charter, approved by the Board of Directors
on 29 November 2011. The Board of Directors also approved the
procedure for the nomination and reappointment of directors and
members of the Executive Committee.
The Nomination and Remuneration Committee met twice during the
past year; all the members were present at each meeting.
With respect to remuneration, the following items were discussed:
- Remuneration package for 2018
- Draft the remuneration report
With respect to the nominations, the following items were discussed:
- Composition of the Board of Directors
- Evaluation of the independence criteria of Directors
2.4 EXECUTIVE COMMITTEE – CEO2.4.1 COMPOSITION
The Board of Directors delegated its management powers to an
Executive Committee in accordance with Section 524bis of the Belgian
Companies Code.
NICOLAS SAVERYS
• Executive director
• Chief Executive Officer (CEO)
PATRICK DE BRABANDERE
• Executive director
• Chief Operating Officer (COO)
MIGUEL dE POTTER
• Chief Financial Officer (CFO)
PIERRE DINCQ
• Managing Director Shipping
BART LAVENT
• Managing Director LNG Infrastructure
DAVID LIM
• Managing Director EXMAR Offshore
MARC NUYTEMANS
• CEO EXMAR Shipmanagement
2.4.2 POSITION AND MANDATE
The Executive Committee is responsible for the day-to-day management
of EXMAR and the EXMAR group, under supervision of the Board of
Directors.
The operating rules of the Executive Committee are set out in a Charter,
approved by the Board of Directors on 29 November 2011.
The Executive Committee meets on a regular basis. The CEO is the
chairman of the Executive Committee.
The role of the Executive Committee consists of leading EXMAR
according to the values, strategies, policies, schedules and budgets
set by the Board of Directors.
CORPORATE GOVERNANCE STATEMENT 53
3. POLICY REGARDING GENDER DIVERSITY
3.1 LEGISLATIONThe Board of Directors took note of the Belgian law of 28 July 2011
regarding to gender diversity on the level of the Board of Directors, the
members of the Executive Committee and persons entrusted with the
daily management of the Company.
In accordance with provision 2.1 of the Belgian Corporate Governance
Code, the Board of Directors needs to be composed based on gender
diversity and diversity in general.
Regarding the gender diversity at the level of the Board of Directors,
Section 7 of the Law of 28 July 2011 stipulates that companies with a
free float of less than 50% have a period of eight years rather than six
years to regularise themselves.
3.2 CURRENT SITUATIONThe Board of Directors consists of three female members out of a
total of 11 members. The necessary measures will be taken for future
appointments to ensure that the required quotas (one third female
directors) are reached. EXMAR aims to reach this goal before the
imposed term (2019) included in the law.
A 47/53 female to male ratio was recorded for 2017 for the overall total
of 193 employees working at Group headquarters (all the companies
– see EXMAR in the world section on page 10). The appointment of a
total of 15 female officers including two Captains and one Chief Officer
serving in the EXMAR fleet has been a consequence of internal training
and development combined with practical experience, with this same
philosophy being applied on shore to develop female staff (see Care
for today – Respect for tomorrow, page 45).
4. PERFORMANCE EVALUATION
In order to assess the effectiveness of the Board and its Committees,
the Board introduced an evaluation process in 2011 (renewed in 2014).
In the course of 2017, a new Board evaluation plan was set up which
will be implemented in 2018 and consists of a questionnaire followed
by a conduction of one-to-one interviews, an analysis of results and
a formulation of recommendations which will result in an action plan
with the necessary follow-up.
The Board holds a closed session after every meeting.
Each Committee reports on its activities to the Board.
During the meeting of the Board of Directors that prepares the Annual
General Meeting of Shareholders, the Board of Directors will decide on
the discharge to be granted to the members of the Executive Committee.
5. SUPERVISION
5.1 EXTERNAL AUDITDeloitte Belgium, represented by Mr. Gert Vanhees: Statutory Auditor.
By decision of the Annual General Meeting of 16 May 2017, on the
basis of the proposal formulated by the Board of Directors and in line
with the recommendation and preference of the Audit Committee in
application of article 16 §2 and §5 of regulation number 537/2014,
Deloitte Belgium was appointed as Statutory Auditor of the Company
for a period of three years.
The auditor conducts the external audit of both the consolidated and
statutory figures of EXMAR. The Audit Committee in its meeting of 1
September 2017 proposed and the Board of Directors agreed, to the
Board to no longer review the half-year results, in line with other listed
companies’ policies. The auditor however was requested to review
the updated version of the interim condensed consolidated financial
statements to ensure consistency with the adjustments proposed by
the Committee.
5.2 INTERNAL AUDITEY has been appointed to assist the Company in the conducting of
its internal audit activities. The internal auditor was reappointed for a
new term of three years ending at the meeting of the Audit Committee
in March 2019.
5.3 SECRETARYMr. Mathieu Verly, Secretary, appointed since 1 July 2015.
The Secretary shall ensure that Board procedures are complied with
and that the Board acts in accordance with its statutory obligations
and its obligations under the Articles of Association. He shall advise
the Board on all governance matters and assist the Chairman of the
Board in fulfilling his duties as detailed above, as well as in the logistics
associated with the affairs of the Board (information, agenda, etc.).
5.4 COMPLIANCE OFFICERMr. Patrick De Brabandere, COO, Compliance officer, appointed on the
recommendation of the Audit Committee, by the Board of Directors on
25 March 2015 with effect from 1 July 2015.
He is responsible for the implementation of and the supervision on
compliance with the Dealing Code and the tasks described in the
Compliance Model as member of the Risk Committee.
6. GUBERNA
EXMAR joined Guberna as institutional member, because EXMAR
believes in the merits of corporate governance principles and is keen
on further developing its corporate governance structure. Guberna is
a knowledge centre promoting corporate governance in all its forms
and offers a platform for the exchange of experiences, knowledge
and best practices.
Guberna organizes several activities such as workshops, round tables
and seminars. EXMAR promotes directors and management of the
Company to participate in these activities.
7. RULES AND PROCEDURES
7.1 CONFLICTS OF INTERESTEach member of the Board of Directors and of the Executive Committee
is encouraged to organize their personal and business interests in such a
way that there is no direct or indirect Conflict of Interest with the Company.
FINANCIAL REPORT54
Transactions, if any, between EXMAR or an affiliated company and a
Board member will take place at arm’s length. The same applies for
transactions between the Company or an Affiliate and a person closely
related to a member of the Board.
The provisions of the Belgian Companies Code will apply in the event
of a Conflict of Interest.
In accordance with article 523 of the Belgian Companies Code, the
Board of Directors is required to adhere to a special procedure if one or
more directors have a direct or indirect conflict of proprietary interest
with any decision or transaction belonging within the powers of the
Board of Directors.
Article 524 of the Belgian Companies Code provides for a special
procedure applicable to transactions within a group or transactions
with affiliated companies. This procedure applies to decisions and
transactions between the Company and affiliated companies that are
not subsidiaries of the Company.
In accordance with article 524ter of the Belgian Companies Code,
the Executive Committee is required to adhere to a special procedure
if one or more members of the Executive Committee have a direct or
indirect conflict of proprietary interest with any decision or transaction
belonging within the powers of the Executive Committee.
7.2 TRANSACTIONS EXMAR has no knowledge of any potential Conflicts of Interest
among the members of the Board of Directors and the members of
the Executive Committee in the meaning of articles 523 or 524ter,
except those that may be described in the Annual Report from the
Board of Directors.
Currently Saverbel NV and Saverex NV, companies controlled by Mr.
Nicolas Saverys, CEO, provide administrative services to the EXMAR
Group. These services are invoiced and are at arm’s length conditions.
8. POLITICAL CONTRIBUTIONS
EXMAR did not make contributions or payments or otherwise give any
endorsement, directly or indirectly, to political parties or committees
or to individual politicians.
The employees of EXMAR may not make any political contribution on
behalf of EXMAR or through the use of corporate funds or resources.
RISKSSTRATEGIC RISKS
DESCRIPTION OF RISK POTENTIAL IMPACT LIMITING FACTORS AND CONTROL
MARKET RISKS
The overall gas and oil market and the
worldwide market for the transportation of
gas is cyclical.
A decline in the overall oil and gas
market could impact the freight rates for
transportation of gas and would affect our
income and cash flows and could affect the
value of our fleet.
Diversified client base and a significant
coverage with a mix of long-term and
short-term charters. The value of our fleet
is continuously monitored and assessed by
using internal and external information.
Lower demand for gas carriers, FSRU's as
well as other floating assets including our LNG
infrastructure assets.
A lower demand would impact the freight
rates and the number of off-hire days of our
fleet. This would impact our business and
cash flows as well as the value of our fleet
and our financial position.
A significant part of our fleet is secured
on long-term charters. Geographical
diversification and a qualitative client portfolio
and network through integration in the
markets thanks to years of experience. We
are a flexible shipping company aiming for
structural quality and durability for our clients.
POLITICAL ENVIRONMENT IN FOREIGN COUNTRIES
The overall gas and oil market and the
worldwide market for the transportation of
gas is cyclical.
A decline in the overall oil and gas
market could impact the freight rates for
transportation of gas and would affect our
income and cash flows and could affect the
value of our fleet.
Diversified client base and a significant
coverage with a mix of long-term and
short-term charters. The value of our fleet
is continuously monitored and assessed by
using internal and external information.
CORPORATE GOVERNANCE STATEMENT 55
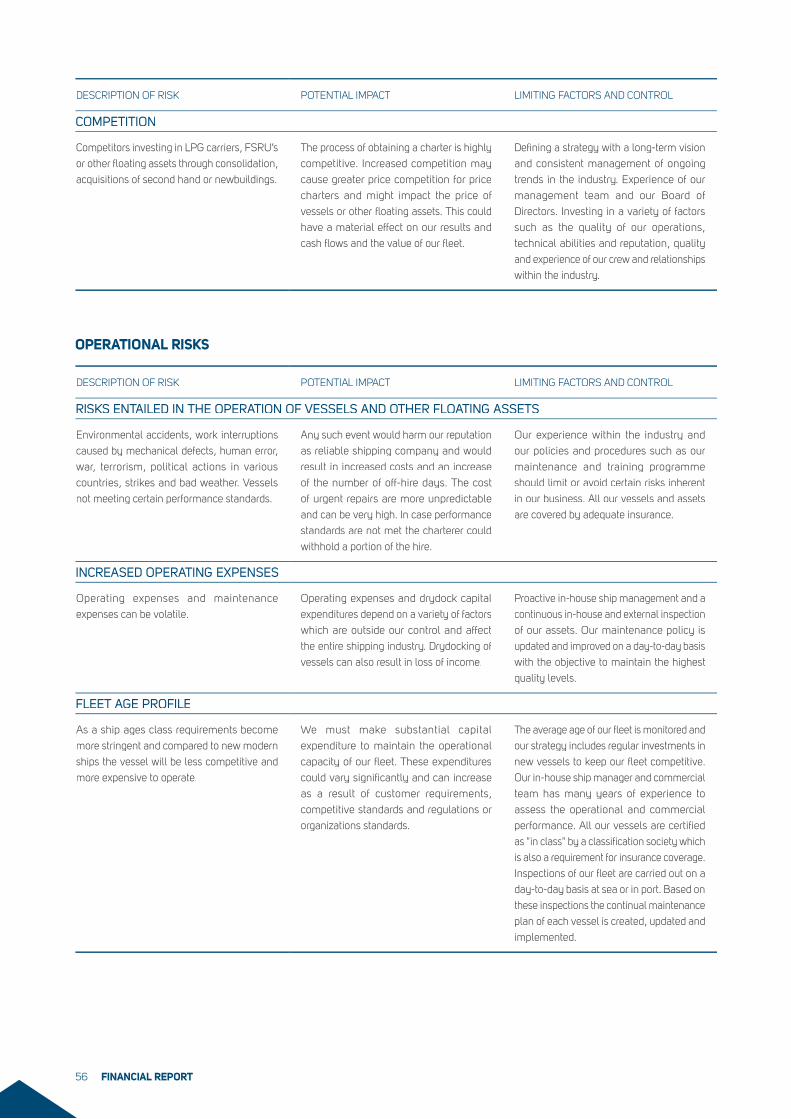
OPERATIONAL RISKS
DESCRIPTION OF RISK POTENTIAL IMPACT LIMITING FACTORS AND CONTROL
COMPETITION
Competitors investing in LPG carriers, FSRU’s
or other floating assets through consolidation,
acquisitions of second hand or newbuildings.
The process of obtaining a charter is highly
competitive. Increased competition may
cause greater price competition for price
charters and might impact the price of
vessels or other floating assets. This could
have a material effect on our results and
cash flows and the value of our fleet.
Defining a strategy with a long-term vision
and consistent management of ongoing
trends in the industry. Experience of our
management team and our Board of
Directors. Investing in a variety of factors
such as the quality of our operations,
technical abilities and reputation, quality
and experience of our crew and relationships
within the industry.
DESCRIPTION OF RISK POTENTIAL IMPACT LIMITING FACTORS AND CONTROL
RISKS ENTAILED IN THE OPERATION OF VESSELS AND OTHER FLOATING ASSETS
Environmental accidents, work interruptions
caused by mechanical defects, human error,
war, terrorism, political actions in various
countries, strikes and bad weather. Vessels
not meeting certain performance standards.
Any such event would harm our reputation
as reliable shipping company and would
result in increased costs and an increase
of the number of off-hire days. The cost
of urgent repairs are more unpredictable
and can be very high. In case performance
standards are not met the charterer could
withhold a portion of the hire.
Our experience within the industry and
our policies and procedures such as our
maintenance and training programme
should limit or avoid certain risks inherent
in our business. All our vessels and assets
are covered by adequate insurance.
INCREASED OPERATING EXPENSES
Operating expenses and maintenance
expenses can be volatile.
Operating expenses and drydock capital
expenditures depend on a variety of factors
which are outside our control and affect
the entire shipping industry. Drydocking of
vessels can also result in loss of income.
Proactive in-house ship management and a
continuous in-house and external inspection
of our assets. Our maintenance policy is
updated and improved on a day-to-day basis
with the objective to maintain the highest
quality levels.
FLEET AGE PROFILE
As a ship ages class requirements become
more stringent and compared to new modern
ships the vessel will be less competitive and
more expensive to operate.
We must make substantial capital
expenditure to maintain the operational
capacity of our fleet. These expenditures
could vary significantly and can increase
as a result of customer requirements,
competitive standards and regulations or
organizations standards.
The average age of our fleet is monitored and
our strategy includes regular investments in
new vessels to keep our fleet competitive.
Our in-house ship manager and commercial
team has many years of experience to
assess the operational and commercial
performance. All our vessels are certified
as "in class" by a classification society which
is also a requirement for insurance coverage.
Inspections of our fleet are carried out on a
day-to-day basis at sea or in port. Based on
these inspections the continual maintenance
plan of each vessel is created, updated and
implemented.
FINANCIAL REPORT56
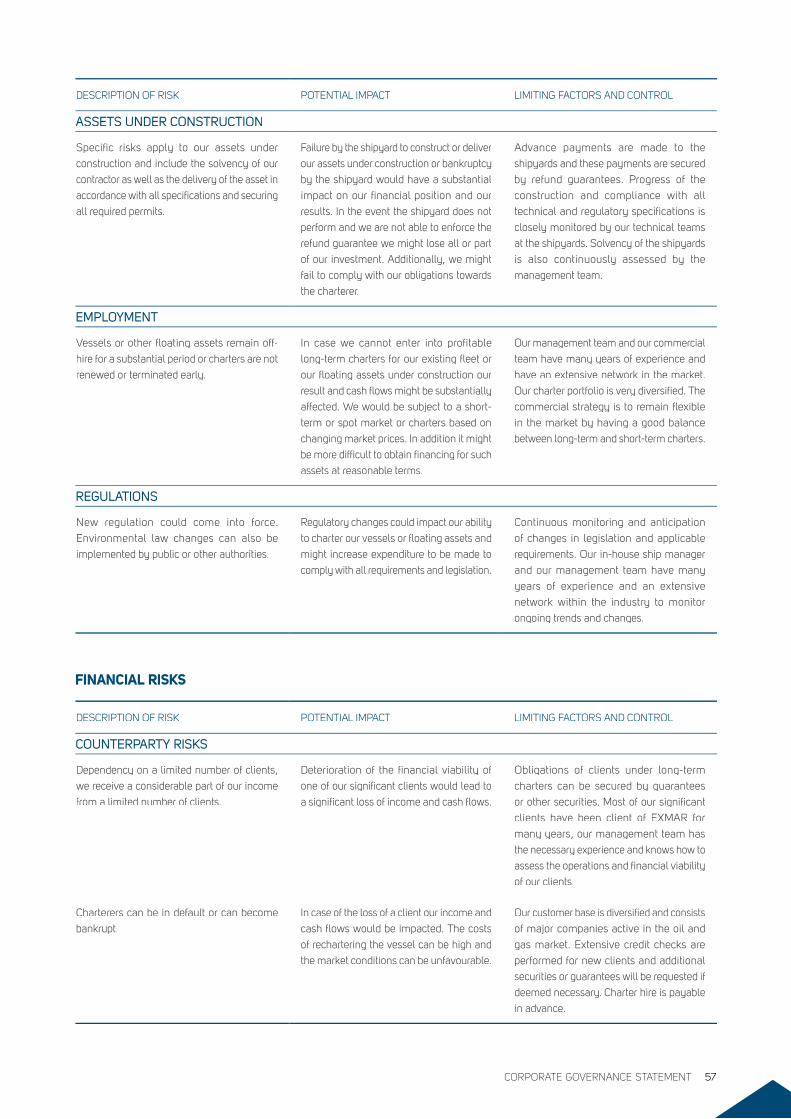
FINANCIAL RISKS
DESCRIPTION OF RISK POTENTIAL IMPACT LIMITING FACTORS AND CONTROL
COUNTERPARTY RISKS
Dependency on a limited number of clients,
we receive a considerable part of our income
from a limited number of clients.
Deterioration of the financial viability of
one of our significant clients would lead to
a significant loss of income and cash flows.
Obligations of clients under long-term
charters can be secured by guarantees
or other securities. Most of our significant
clients have been client of EXMAR for
many years, our management team has
the necessary experience and knows how to
assess the operations and financial viability
of our clients.
Charterers can be in default or can become
bankrupt.
In case of the loss of a client our income and
cash flows would be impacted. The costs
of rechartering the vessel can be high and
the market conditions can be unfavourable.
Our customer base is diversified and consists
of major companies active in the oil and
gas market. Extensive credit checks are
performed for new clients and additional
securities or guarantees will be requested if
deemed necessary. Charter hire is payable
in advance.
DESCRIPTION OF RISK POTENTIAL IMPACT LIMITING FACTORS AND CONTROL
ASSETS UNDER CONSTRUCTIONASSETS UNDER CONSTRUCTION
Specific risks apply to our assets under
construction and include the solvency of our
contractor as well as the delivery of the asset in
accordance with all specifications and securing
all required permits.
Failure by the shipyard to construct or deliver
our assets under construction or bankruptcy
by the shipyard would have a substantial
impact on our financial position and our
results. In the event the shipyard does not
perform and we are not able to enforce the
refund guarantee we might lose all or part
of our investment. Additionally, we might
fail to comply with our obligations towards
the charterer.
Advance payments are made to the
shipyards and these payments are secured
by refund guarantees. Progress of the
construction and compliance with all
technical and regulatory specifications is
closely monitored by our technical teams
at the shipyards. Solvency of the shipyards
is also continuously assessed by the
management team.
EMPLOYMENT
Vessels or other floating assets remain off-
hire for a substantial period or charters are not
renewed or terminated early.
In case we cannot enter into profitable
long-term charters for our existing fleet or
our floating assets under construction our
result and cash flows might be substantially
affected. We would be subject to a short-
term or spot market or charters based on
changing market prices. In addition it might
be more difficult to obtain financing for such
assets at reasonable terms.
Our management team and our commercial
team have many years of experience and
have an extensive network in the market.
Our charter portfolio is very diversified. The
commercial strategy is to remain flexible
in the market by having a good balance
between long-term and short-term charters.
REGULATIONS
New regulation could come into force.
Environmental law changes can also be
implemented by public or other authorities.
Regulatory changes could impact our ability
to charter our vessels or floating assets and
might increase expenditure to be made to
comply with all requirements and legislation.
Continuous monitoring and anticipation
of changes in legislation and applicable
requirements. Our in-house ship manager
and our management team have many
years of experience and an extensive
network within the industry to monitor
ongoing trends and changes.
CORPORATE GOVERNANCE STATEMENT 57
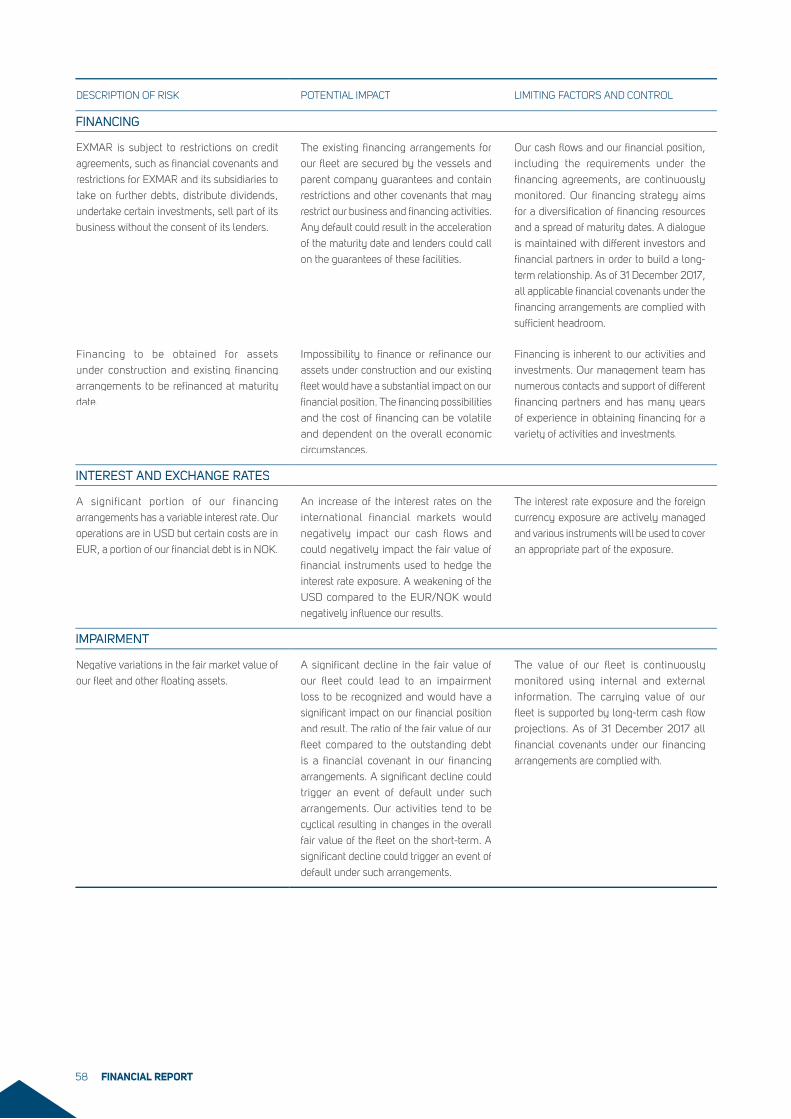
DESCRIPTION OF RISK POTENTIAL IMPACT LIMITING FACTORS AND CONTROL
FINANCING
EXMAR is subject to restrictions on credit
agreements, such as financial covenants and
restrictions for EXMAR and its subsidiaries to
take on further debts, distribute dividends,
undertake certain investments, sell part of its
business without the consent of its lenders.
The existing financing arrangements for
our fleet are secured by the vessels and
parent company guarantees and contain
restrictions and other covenants that may
restrict our business and financing activities.
Any default could result in the acceleration
of the maturity date and lenders could call
on the guarantees of these facilities.
Our cash flows and our financial position,
including the requirements under the
financing agreements, are continuously
monitored. Our financing strategy aims
for a diversification of financing resources
and a spread of maturity dates. A dialogue
is maintained with different investors and
financial partners in order to build a long-
term relationship. As of 31 December 2017,
all applicable financial covenants under the
financing arrangements are complied with
sufficient headroom.
Financing to be obtained for assets
under construction and existing financing
arrangements to be refinanced at maturity
date.
Impossibility to finance or refinance our
assets under construction and our existing
fleet would have a substantial impact on our
financial position. The financing possibilities
and the cost of financing can be volatile
and dependent on the overall economic
circumstances.
Financing is inherent to our activities and
investments. Our management team has
numerous contacts and support of different
financing partners and has many years
of experience in obtaining financing for a
variety of activities and investments.
INTEREST AND EXCHANGE RATES
A significant portion of our financing
arrangements has a variable interest rate. Our
operations are in USD but certain costs are in
EUR, a portion of our financial debt is in NOK.
An increase of the interest rates on the
international financial markets would
negatively impact our cash flows and
could negatively impact the fair value of
financial instruments used to hedge the
interest rate exposure. A weakening of the
USD compared to the EUR/NOK would
negatively influence our results.
The interest rate exposure and the foreign
currency exposure are actively managed
and various instruments will be used to cover
an appropriate part of the exposure.
IMPAIRMENT
Negative variations in the fair market value of
our fleet and other floating assets.
A significant decline in the fair value of
our fleet could lead to an impairment
loss to be recognized and would have a
significant impact on our financial position
and result. The ratio of the fair value of our
fleet compared to the outstanding debt
is a financial covenant in our financing
arrangements. A significant decline could
trigger an event of default under such
arrangements. Our activities tend to be
cyclical resulting in changes in the overall
fair value of the fleet on the short-term. A
significant decline could trigger an event of
default under such arrangements.
The value of our fleet is continuously
monitored using internal and external
information. The carrying value of our
fleet is supported by long-term cash flow
projections. As of 31 December 2017 all
financial covenants under our financing
arrangements are complied with.
FINANCIAL REPORT58
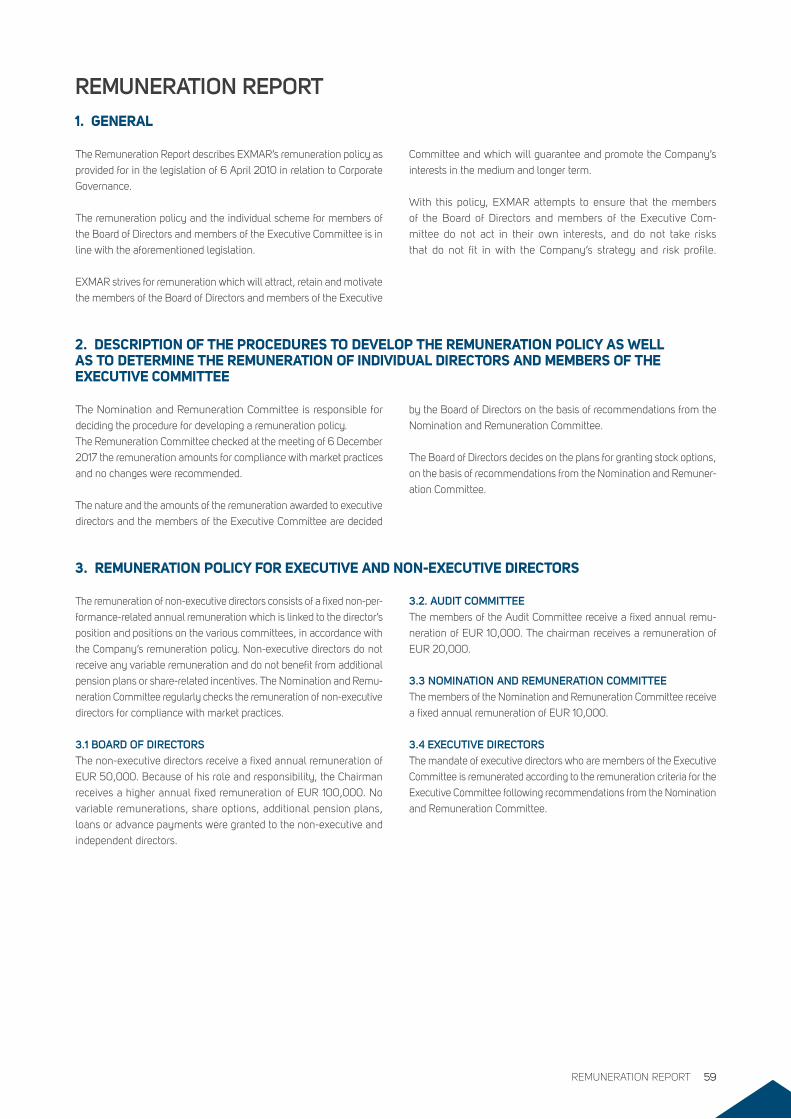
REMUNERATION REPORT1. GENERAL
The Remuneration Report describes EXMAR’s remuneration policy as
provided for in the legislation of 6 April 2010 in relation to Corporate
Governance.
The remuneration policy and the individual scheme for members of
the Board of Directors and members of the Executive Committee is in
line with the aforementioned legislation.
EXMAR strives for remuneration which will attract, retain and motivate
the members of the Board of Directors and members of the Executive
Committee and which will guarantee and promote the Company’s
interests in the medium and longer term.
With this policy, EXMAR attempts to ensure that the members
of the Board of Directors and members of the Executive Com-
mittee do not act in their own interests, and do not take risks
that do not fit in with the Company’s strategy and risk profile.
2. DESCRIPTION OF THE PROCEDURES TO DEVELOP THE REMUNERATION POLICY AS WELL AS TO DETERMINE THE REMUNERATION OF INDIVIDUAL DIRECTORS AND MEMBERS OF THE EXECUTIVE COMMITTEE
The Nomination and Remuneration Committee is responsible for
deciding the procedure for developing a remuneration policy.
The Remuneration Committee checked at the meeting of 6 December
2017 the remuneration amounts for compliance with market practices
and no changes were recommended.
The nature and the amounts of the remuneration awarded to executive
directors and the members of the Executive Committee are decided
by the Board of Directors on the basis of recommendations from the
Nomination and Remuneration Committee.
The Board of Directors decides on the plans for granting stock options,
on the basis of recommendations from the Nomination and Remuner-
ation Committee.
3. REMUNERATION POLICY FOR EXECUTIVE AND NON-EXECUTIVE DIRECTORS
The remuneration of non-executive directors consists of a fixed non-per-
formance-related annual remuneration which is linked to the director’s
position and positions on the various committees, in accordance with
the Company’s remuneration policy. Non-executive directors do not
receive any variable remuneration and do not benefit from additional
pension plans or share-related incentives. The Nomination and Remu-
neration Committee regularly checks the remuneration of non-executive
directors for compliance with market practices.
3.1 BOARD OF DIRECTORSThe non-executive directors receive a fixed annual remuneration of
EUR 50,000. Because of his role and responsibility, the Chairman
receives a higher annual fixed remuneration of EUR 100,000. No
variable remunerations, share options, additional pension plans,
loans or advance payments were granted to the non-executive and
independent directors.
3.2. AUDIT COMMITTEEThe members of the Audit Committee receive a fixed annual remu-
neration of EUR 10,000. The chairman receives a remuneration of
EUR 20,000.
3.3 NOMINATION AND REMUNERATION COMMITTEEThe members of the Nomination and Remuneration Committee receive
a fixed annual remuneration of EUR 10,000.
3.4 EXECUTIVE DIRECTORSThe mandate of executive directors who are members of the Executive
Committee is remunerated according to the remuneration criteria for the
Executive Committee following recommendations from the Nomination
and Remuneration Committee.
REMUNERATION REPORT 59
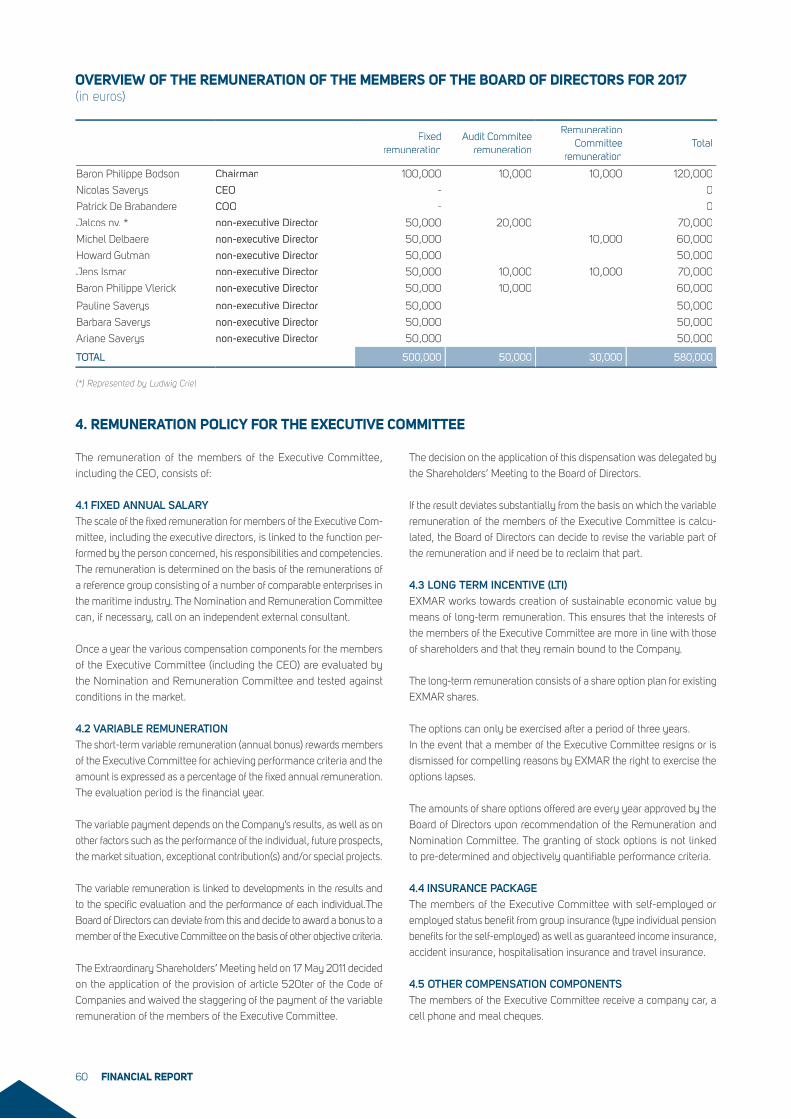
4. REMUNERATION POLICY FOR THE EXECUTIVE COMMITTEE
The remuneration of the members of the Executive Committee,
including the CEO, consists of:
4.1 FIXED ANNUAL SALARY The scale of the fixed remuneration for members of the Executive Com-
mittee, including the executive directors, is linked to the function per-
formed by the person concerned, his responsibilities and competencies.
The remuneration is determined on the basis of the remunerations of
a reference group consisting of a number of comparable enterprises in
the maritime industry. The Nomination and Remuneration Committee
can, if necessary, call on an independent external consultant.
Once a year the various compensation components for the members
of the Executive Committee (including the CEO) are evaluated by
the Nomination and Remuneration Committee and tested against
conditions in the market.
4.2 VARIABLE REMUNERATIONThe short-term variable remuneration (annual bonus) rewards members
of the Executive Committee for achieving performance criteria and the
amount is expressed as a percentage of the fixed annual remuneration.
The evaluation period is the financial year.
The variable payment depends on the Company’s results, as well as on
other factors such as the performance of the individual, future prospects,
the market situation, exceptional contribution(s) and/or special projects.
The variable remuneration is linked to developments in the results and
to the specific evaluation and the performance of each individual.The
Board of Directors can deviate from this and decide to award a bonus to a
member of the Executive Committee on the basis of other objective criteria.
The Extraordinary Shareholders’ Meeting held on 17 May 2011 decided
on the application of the provision of article 520ter of the Code of
Companies and waived the staggering of the payment of the variable
remuneration of the members of the Executive Committee.
The decision on the application of this dispensation was delegated by
the Shareholders’ Meeting to the Board of Directors.
If the result deviates substantially from the basis on which the variable
remuneration of the members of the Executive Committee is calcu-
lated, the Board of Directors can decide to revise the variable part of
the remuneration and if need be to reclaim that part.
4.3 LONG TERM INCENTIVE (LTI)EXMAR works towards creation of sustainable economic value by
means of long-term remuneration. This ensures that the interests of
the members of the Executive Committee are more in line with those
of shareholders and that they remain bound to the Company.
The long-term remuneration consists of a share option plan for existing
EXMAR shares.
The options can only be exercised after a period of three years.
In the event that a member of the Executive Committee resigns or is
dismissed for compelling reasons by EXMAR the right to exercise the
options lapses.
The amounts of share options offered are every year approved by the
Board of Directors upon recommendation of the Remuneration and
Nomination Committee. The granting of stock options is not linked
to pre-determined and objectively quantifiable performance criteria.
4.4 INSURANCE PACKAGEThe members of the Executive Committee with self-employed or
employed status benefit from group insurance (type individual pension
benefits for the self-employed) as well as guaranteed income insurance,
accident insurance, hospitalisation insurance and travel insurance.
4.5 OTHER COMPENSATION COMPONENTSThe members of the Executive Committee receive a company car, a
cell phone and meal cheques.
Fixed remuneration
Audit Commitee remuneration
Remuneration Committee
remunerationTotal
Baron Philippe Bodson Chairman 100,000 10,000 10,000 120,000
Nicolas Saverys CEO - 0
Patrick De Brabandere COO - 0
Jalcos nv. * non-executive Director 50,000 20,000 70,000
Michel Delbaere non-executive Director 50,000 10,000 60,000
Howard Gutman non-executive Director 50,000 50,000
Jens Ismar non-executive Director 50,000 10,000 10,000 70,000
Baron Philippe Vlerick non-executive Director 50,000 10,000 60,000
Pauline Saverys non-executive Director 50,000 50,000
Barbara Saverys non-executive Director 50,000 50,000
Ariane Saverys non-executive Director 50,000 50,000
TOTAL 500,000 50,000 30,000 580,000
(*) Represented by Ludwig Criel
OVERVIEW OF THE REMUNERATION OF THE MEMBERS OF THE BOARD OF DIRECTORS FOR 2017 (in euros)
FINANCIAL REPORT60
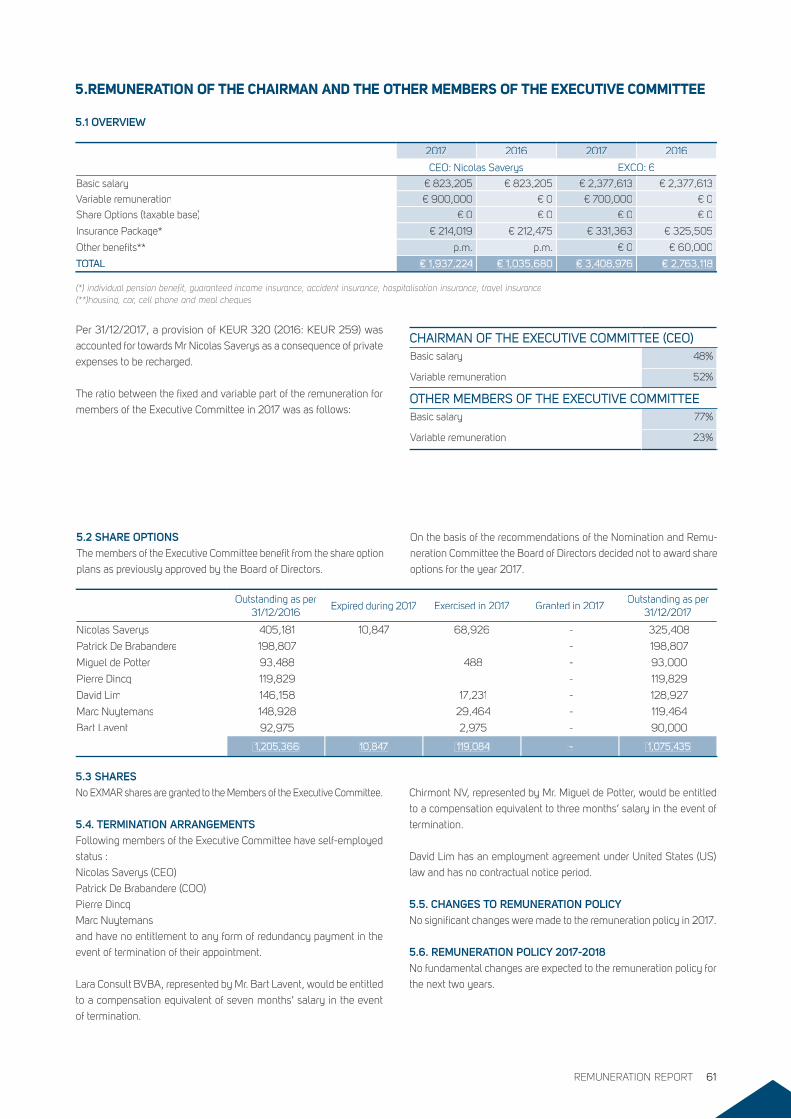
5.REMUNERATION OF THE CHAIRMAN AND THE OTHER MEMBERS OF THE EXECUTIVE COMMITTEE
5.1 OVERVIEW
Per 31/12/2017, a provision of KEUR 320 (2016: KEUR 259) was
accounted for towards Mr Nicolas Saverys as a consequence of private
expenses to be recharged.
The ratio between the fixed and variable part of the remuneration for
members of the Executive Committee in 2017 was as follows:
2017 2016 2017 2016
CEO: Nicolas Saverys EXCO: 6
Basic salary € 823,205 € 823,205 € 2,377,613 € 2,377,613
Variable remuneration € 900,000 € 0 € 700,000 € 0
Share Options (taxable base) € 0 € 0 € 0 € 0
Insurance Package* € 214,019 € 212,475 € 331,363 € 325,505
Other benefits** p.m. p.m. € 0 € 60,000
TOTAL € 1,937,224 € 1,035,680 € 3,408,976 € 2,763,118
(*) individual pension benefit, guaranteed income insurance, accident insurance, hospitalisation insurance, travel insurance (**)housing, car, cell phone and meal cheques
CHAIRMAN OF THE EXECUTIVE COMMITTEE (CEO)Basic salary 48%
Variable remuneration 52%
OTHER MEMBERS OF THE EXECUTIVE COMMITTEEBasic salary 77%
Variable remuneration 23%
5.2 SHARE OPTIONSThe members of the Executive Committee benefit from the share option
plans as previously approved by the Board of Directors.
On the basis of the recommendations of the Nomination and Remu-
neration Committee the Board of Directors decided not to award share
options for the year 2017.
5.3 SHARESNo EXMAR shares are granted to the Members of the Executive Committee.
5.4. TERMINATION ARRANGEMENTSFollowing members of the Executive Committee have self-employed
status :
Nicolas Saverys (CEO)
Patrick De Brabandere (COO)
Pierre Dincq
Marc Nuytemans
and have no entitlement to any form of redundancy payment in the
event of termination of their appointment.
Lara Consult BVBA, represented by Mr. Bart Lavent, would be entitled
to a compensation equivalent of seven months’ salary in the event
of termination.
Chirmont NV, represented by Mr. Miguel de Potter, would be entitled
to a compensation equivalent to three months’ salary in the event of
termination.
David Lim has an employment agreement under United States (US)
law and has no contractual notice period.
5.5. CHANGES TO REMUNERATION POLICYNo significant changes were made to the remuneration policy in 2017.
5.6. REMUNERATION POLICY 2017-2018No fundamental changes are expected to the remuneration policy for
the next two years.
Outstanding as per 31/12/2016
Expired during 2017 Exercised in 2017 Granted in 2017Outstanding as per
31/12/2017
Nicolas Saverys 405,181 10,847 68,926 - 325,408
Patrick De Brabandere 198,807 - 198,807
Miguel de Potter 93,488 488 - 93,000
Pierre Dincq 119,829 - 119,829
David Lim 146,158 17,231 - 128,927
Marc Nuytemans 148,928 29,464 - 119,464
Bart Lavent 92,975 2,975 - 90,000
1,205,366 10,847 119,084 - 1,075,435
REMUNERATION REPORT 61
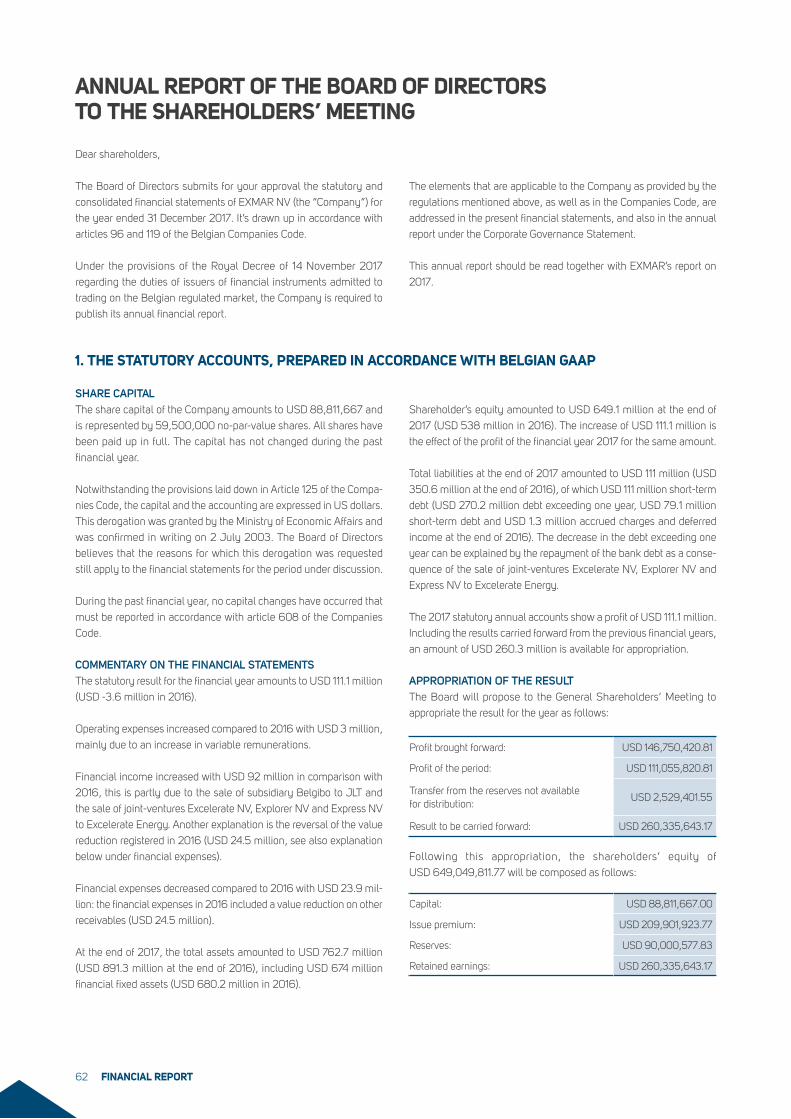
ANNUAL REPORT OF THE BOARD OF DIRECTORS TO THE SHAREHOLDERS’ MEETING
Dear shareholders,
The Board of Directors submits for your approval the statutory and
consolidated financial statements of EXMAR NV (the “Company”) for
the year ended 31 December 2017. It’s drawn up in accordance with
articles 96 and 119 of the Belgian Companies Code.
Under the provisions of the Royal Decree of 14 November 2017
regarding the duties of issuers of financial instruments admitted to
trading on the Belgian regulated market, the Company is required to
publish its annual financial report.
The elements that are applicable to the Company as provided by the
regulations mentioned above, as well as in the Companies Code, are
addressed in the present financial statements, and also in the annual
report under the Corporate Governance Statement.
This annual report should be read together with EXMAR’s report on
2017.
1. THE STATUTORY ACCOUNTS, PREPARED IN ACCORDANCE WITH BELGIAN GAAP
SHARE CAPITALThe share capital of the Company amounts to USD 88,811,667 and
is represented by 59,500,000 no-par-value shares. All shares have
been paid up in full. The capital has not changed during the past
financial year.
Notwithstanding the provisions laid down in Article 125 of the Compa-
nies Code, the capital and the accounting are expressed in US dollars.
This derogation was granted by the Ministry of Economic Affairs and
was confirmed in writing on 2 July 2003. The Board of Directors
believes that the reasons for which this derogation was requested
still apply to the financial statements for the period under discussion.
During the past financial year, no capital changes have occurred that
must be reported in accordance with article 608 of the Companies
Code.
COMMENTARY ON THE FINANCIAL STATEMENTSThe statutory result for the financial year amounts to USD 111.1 million
(USD -3.6 million in 2016).
Operating expenses increased compared to 2016 with USD 3 million,
mainly due to an increase in variable remunerations.
Financial income increased with USD 92 million in comparison with
2016, this is partly due to the sale of subsidiary Belgibo to JLT and
the sale of joint-ventures Excelerate NV, Explorer NV and Express NV
to Excelerate Energy. Another explanation is the reversal of the value
reduction registered in 2016 (USD 24.5 million, see also explanation
below under financial expenses).
Financial expenses decreased compared to 2016 with USD 23.9 mil-
lion: the financial expenses in 2016 included a value reduction on other
receivables (USD 24.5 million).
At the end of 2017, the total assets amounted to USD 762.7 million
(USD 891.3 million at the end of 2016), including USD 674 million
financial fixed assets (USD 680.2 million in 2016).
Shareholder’s equity amounted to USD 649.1 million at the end of
2017 (USD 538 million in 2016). The increase of USD 111.1 million is
the effect of the profit of the financial year 2017 for the same amount.
Total liabilities at the end of 2017 amounted to USD 111 million (USD
350.6 million at the end of 2016), of which USD 111 million short-term
debt (USD 270.2 million debt exceeding one year, USD 79.1 million
short-term debt and USD 1.3 million accrued charges and deferred
income at the end of 2016). The decrease in the debt exceeding one
year can be explained by the repayment of the bank debt as a conse-
quence of the sale of joint-ventures Excelerate NV, Explorer NV and
Express NV to Excelerate Energy.
The 2017 statutory annual accounts show a profit of USD 111.1 million.
Including the results carried forward from the previous financial years,
an amount of USD 260.3 million is available for appropriation.
APPROPRIATION OF THE RESULTThe Board will propose to the General Shareholders’ Meeting to
appropriate the result for the year as follows:
Following this appropriation, the shareholders’ equity of
USD 649,049,811.77 will be composed as follows:
Profit brought forward: USD 146,750,420.81
Profit of the period: USD 111,055,820.81
Transfer from the reserves not available for distribution:
USD 2,529,401.55
Result to be carried forward: USD 260,335,643.17
Capital: USD 88,811,667.00
Issue premium: USD 209,901,923.77
Reserves: USD 90,000,577.83
Retained earnings: USD 260,335,643.17
FINANCIAL REPORT62
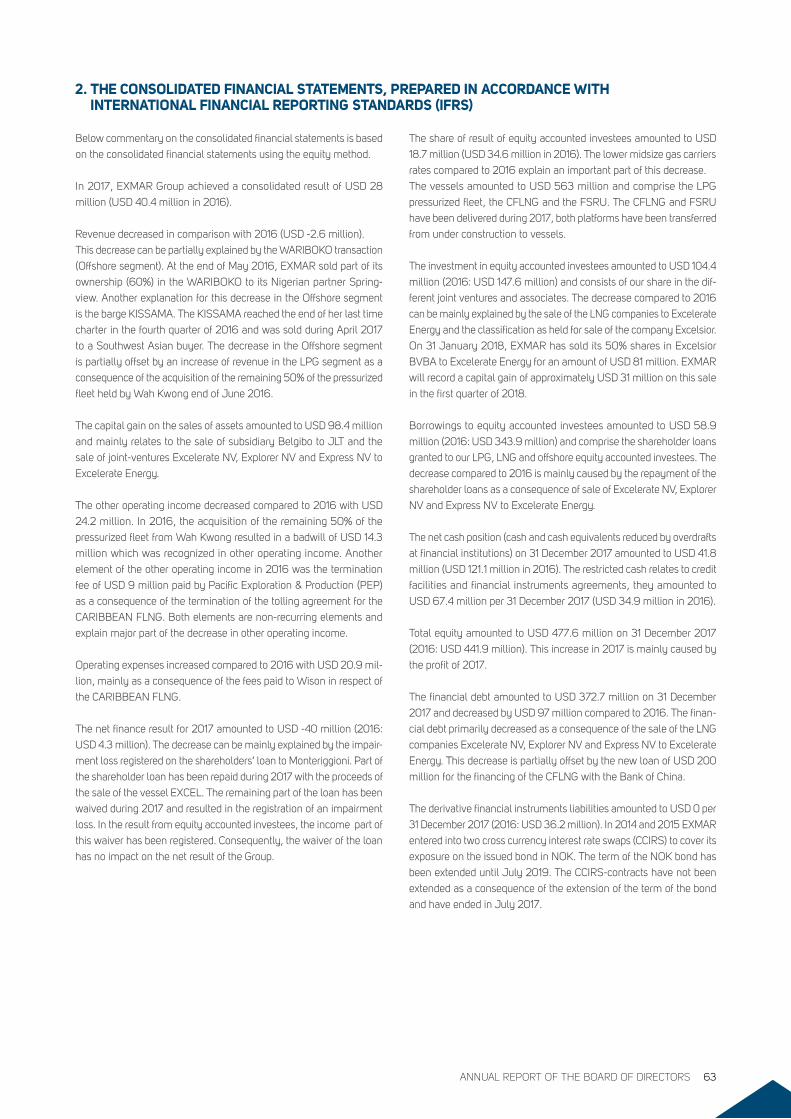
2. THE CONSOLIDATED FINANCIAL STATEMENTS, PREPARED IN ACCORDANCE WITH INTERNATIONAL FINANCIAL REPORTING STANDARDS (IFRS)
Below commentary on the consolidated financial statements is based
on the consolidated financial statements using the equity method.
In 2017, EXMAR Group achieved a consolidated result of USD 28
million (USD 40.4 million in 2016).
Revenue decreased in comparison with 2016 (USD -2.6 million).
This decrease can be partially explained by the WARIBOKO transaction
(Offshore segment). At the end of May 2016, EXMAR sold part of its
ownership (60%) in the WARIBOKO to its Nigerian partner Spring-
view. Another explanation for this decrease in the Offshore segment
is the barge KISSAMA. The KISSAMA reached the end of her last time
charter in the fourth quarter of 2016 and was sold during April 2017
to a Southwest Asian buyer. The decrease in the Offshore segment
is partially offset by an increase of revenue in the LPG segment as a
consequence of the acquisition of the remaining 50% of the pressurized
fleet held by Wah Kwong end of June 2016.
The capital gain on the sales of assets amounted to USD 98.4 million
and mainly relates to the sale of subsidiary Belgibo to JLT and the
sale of joint-ventures Excelerate NV, Explorer NV and Express NV to
Excelerate Energy.
The other operating income decreased compared to 2016 with USD
24.2 million. In 2016, the acquisition of the remaining 50% of the
pressurized fleet from Wah Kwong resulted in a badwill of USD 14.3
million which was recognized in other operating income. Another
element of the other operating income in 2016 was the termination
fee of USD 9 million paid by Pacific Exploration & Production (PEP)
as a consequence of the termination of the tolling agreement for the
CARIBBEAN FLNG. Both elements are non-recurring elements and
explain major part of the decrease in other operating income.
Operating expenses increased compared to 2016 with USD 20.9 mil-
lion, mainly as a consequence of the fees paid to Wison in respect of
the CARIBBEAN FLNG.
The net finance result for 2017 amounted to USD -40 million (2016:
USD 4.3 million). The decrease can be mainly explained by the impair-
ment loss registered on the shareholders’ loan to Monteriggioni. Part of
the shareholder loan has been repaid during 2017 with the proceeds of
the sale of the vessel EXCEL. The remaining part of the loan has been
waived during 2017 and resulted in the registration of an impairment
loss. In the result from equity accounted investees, the income part of
this waiver has been registered. Consequently, the waiver of the loan
has no impact on the net result of the Group.
The share of result of equity accounted investees amounted to USD
18.7 million (USD 34.6 million in 2016). The lower midsize gas carriers
rates compared to 2016 explain an important part of this decrease.
The vessels amounted to USD 563 million and comprise the LPG
pressurized fleet, the CFLNG and the FSRU. The CFLNG and FSRU
have been delivered during 2017, both platforms have been transferred
from under construction to vessels.
The investment in equity accounted investees amounted to USD 104.4
million (2016: USD 147.6 million) and consists of our share in the dif-
ferent joint ventures and associates. The decrease compared to 2016
can be mainly explained by the sale of the LNG companies to Excelerate
Energy and the classification as held for sale of the company Excelsior.
On 31 January 2018, EXMAR has sold its 50% shares in Excelsior
BVBA to Excelerate Energy for an amount of USD 81 million. EXMAR
will record a capital gain of approximately USD 31 million on this sale
in the first quarter of 2018.
Borrowings to equity accounted investees amounted to USD 58.9
million (2016: USD 343.9 million) and comprise the shareholder loans
granted to our LPG, LNG and offshore equity accounted investees. The
decrease compared to 2016 is mainly caused by the repayment of the
shareholder loans as a consequence of sale of Excelerate NV, Explorer
NV and Express NV to Excelerate Energy.
The net cash position (cash and cash equivalents reduced by overdrafts
at financial institutions) on 31 December 2017 amounted to USD 41.8
million (USD 121.1 million in 2016). The restricted cash relates to credit
facilities and financial instruments agreements, they amounted to
USD 67.4 million per 31 December 2017 (USD 34.9 million in 2016).
Total equity amounted to USD 477.6 million on 31 December 2017
(2016: USD 441.9 million). This increase in 2017 is mainly caused by
the profit of 2017.
The financial debt amounted to USD 372.7 million on 31 December
2017 and decreased by USD 97 million compared to 2016. The finan-
cial debt primarily decreased as a consequence of the sale of the LNG
companies Excelerate NV, Explorer NV and Express NV to Excelerate
Energy. This decrease is partially offset by the new loan of USD 200
million for the financing of the CFLNG with the Bank of China.
The derivative financial instruments liabilities amounted to USD 0 per
31 December 2017 (2016: USD 36.2 million). In 2014 and 2015 EXMAR
entered into two cross currency interest rate swaps (CCIRS) to cover its
exposure on the issued bond in NOK. The term of the NOK bond has
been extended until July 2019. The CCIRS-contracts have not been
extended as a consequence of the extension of the term of the bond
and have ended in July 2017.
ANNUAL REPORT OF THE BOARD OF DIRECTORS 63
3. RISK FACTORS
The risks and uncertainties are described in the Corporate Governance Statement.
4. NON-FINANCIAL INFORMATION
EXMAR recognizes the need for clear codes of conduct, structures and
procedures to ensure compliance with the globally applicable stand-
ards, laws and practices relating to Corporate Governance.
EXMAR’s Code of Business Ethics sets out the way in which our Com-
pany works, bringing together the values and setting out the rules and
guiding principles.
The Code of Business Ethics describes rules and responsibilities of indi-
viduals and employees collectively when acting on behalf of EXMAR,
as well as EXMAR’s responsibilities towards employees, customers,
shareholders and other stakeholders, to ensure that each and every
one of our colleagues understands what is expected from them and
allowed when acting on behalf of EXMAR.
Compliance belongs to the overall business strategy and operations
of the whole organization.
To ensure even better compliance with rules and laws, and to reduce
the risks of infringements and the adverse consequences for EXMAR
and all the stakeholders, the Board of Directors implemented a Com-
pliance Programme for EXMAR.
In order to comply with the EU Regulation (596/2014) on Market
Abuse of 16 April 2014 effective in Belgium on 3 July 2016 a revised
Dealing Code was and is included in the Corporate Governance Charter
as Appendix 3. This Code summarizes the rules that must be observed
in case of dealing in the Company’s financial instruments.
Directive 2014/95/EU of the European Parliament obliges certain large
companies to disclose non-financial information. EXMAR is subject
to this Directive and relies on some of the frameworks named in the
directive to disclose following info in the annual report.
DESCRIPTION OF THE ACTIVITIES
POLICY ACTIONS TAKEN RISKS AND MITIGATION
Human Rights
(see Business
Principles)
The EXMAR code of Business Ethics
specifically refers to respect for all
national and international laws and
regulations that govern Human
Rights, Forced labour, Child Labour
and discrimination of all kinds both
in letter and in spirit of the law.
This code is translated into practice
through several policies such as
through sustainable procurement
and procedures and processes for
the Fleet Personnel management in
line with and beyond Maritime Labour
Convention.
Control on the application of these
policies and procedures is realised
through careful selection of our key
suppliers and internal and external
verifications. Audits have also been
conducted on key suppliers.
As a result of the policy, internal
investigations have been conducted
in cases where a risk for violation had
been identified. Although none of
the investigations were conclusive,
procedures and processes
were reviewed and internal
communication was enhanced to
ensure a more effective prevention
of potential violations.
The main risks for violations related to
Human Rights must be sought within
subcontractors of our suppliers.
Therefore, suppliers’ contracts
contain the necessary clauses and in
addition, a Sustainable Procurement
Policy is being developed and is now
being actively communicated to our
business partners.
Anti-Corruption
(see Business
Principles)
The EXMAR code of Business
Ethics contains a clear policy on
business gifts, bribes and facilitation
payments. This is supported by a
procedure on Bribery and Facilitation
payments for the use on board of the
fleet and onshore.
Control on the application is ensured
through compliance officers, the Risk
Committee and ultimately the Audit
Committee.
All possible cases of facilitation
payments are reported through the
management system, which allows
adequate follow up and response. In
addition, internal communications
via specific campaigns have been
communicated on board.
The most frequent risks for violations
against anti-corruption laws find
themselves on board of vessels
calling ports where corruption
among civil servants is prevalent
and systemic.
FINANCIAL REPORT64
DESCRIPTION OF THE ACTIVITIES
POLICY ACTIONS TAKEN RISKS AND MITIGATION
Environment
(see Care for
today , Respect for
tomorrow)
Within the framework of its ISO 14001
and ISO 50001 certification, EXMAR
Ship Management has developed
an Environmental and Energy
management manual which includes
policies, procedures and records to
support the mission of EXMAR
Ship Management to contribute to
a cleaner and more efficient energy
supply for the world, as a world-class
global provider of specialized services
to the oil and gas industry.
These include procedures to ensure
compliance of the operations with
the international conventions and
national legislations and a continuous
improvement approach.
A younger fleet with more efficient
propulsion and machinery, a more
effective hull form and the retrofitting
of exhaust gas treatment systems
guarantee a continuous improvement
on the emissions of our fleet.
In line with the European Monitoring,
Reduction and Verification
legislation, a detailed measuring plan
was developed which over the next
years will allow us to analyse and
to take focused measures to further
reduce the impact of our operations
on the environment. This includes
implementing the IMO global limit
for sulphur in fuel oil used on board
ships set for January 2020.
A fully developed Ballast Water
Management plan is in force which
includes the roll out of Ballast
Water Treatment Systems including
retrospective installations on board.
The reduction of our energy footprint
is taken care of by optimizing the
entire operation and management of
the ships for Energy Cost Efficiency
by measuring and improving on
our Nautical Mile per Fuel ratio and
increasing the efficiency of the cargo
handling and conditioning processes.
The adoption of both closed and open
circuit scrubbers on board a number
of the EXMAR LPG newbuilds to
comply with the IMO 2020 global
sulfur cap has yielded positive results.
EXMAR has also retrofitted one of its
newbuilds with a scrubber and plans
further energy-saving innovations
with its two VLGC newbuilds
For a recent recycling of a midsize
LPG vessel, EXMAR has undertaken
a careful and thorough due diligence
and has selected a recycling yard
that implements measures and
policies in line with the Hong Kong
Convention as adopted by the UN in
2009. EXMAR will further perform
audits during the recycling to
ensure that the agreed policies and
standards are being respected.
The VLGC newbuild programme
EXMAR charter agreement foresees
the use of LPG as fuel.
Whereas Ballast Water Treatment
systems are being retrofitted
throughout the fleet; the different
regional legislations and the
application of new and unproven
technologies are a concern.
In order to ensure correct
implementation of the environmental
and energy management system,
environmental awareness trainings
are being provided to all relevant
staff members, weather routing
is applied and ship performance
enhancement tools are in use on
board, the effective use of which is
monitored by dedicated shore office
staff grouped in the Energy Efficiency
Team.
Finally, while accidental pollution
cannot be ruled out, EXMAR has
all the necessary systems in place
to ensure a rapid and adequate
emergency response to rapidly
control any potential spill and
effectively reduce its impact on the
marine life.
ANNUAL REPORT OF THE BOARD OF DIRECTORS 65
DESCRIPTION OF THE ACTIVITIES
POLICY ACTIONS TAKEN RISKS AND MITIGATION
Social & Personnel
(see Care for
today , Respect for
tomorrow)
A safe environment for our personnel
to work in, is our top priority. With
a diverse workforce of over 15
nationalities both on board and
ashore, effective leadership is
considered the key to operating
to the highest safety standards.
To this extent, a safety vision was
developed which was translated
into the Company’s HSEQ policy,
an extensive HSEQ manual and a
training programme. “Taking the
SAFETY LEAD” is our roadmap to
a strong and resilient safety culture,
empowering every individual to take
up his or her responsibility to make
safety a natural part of their life, to
stop unsafe acts or conditions and to
be a role model to their colleagues
and beyond.
Taking the SAFETY LEAD
programme was launched several
years ago with the first steps into
creating the safety vision, the training
programme and the development of
a shared model.
Now, four years later, Taking the
SAFETY LEAD is a mature concept
adopted by our seafaring and office
staff, demonstrated by leading and
lagging indicators, ranging from
reporting and understanding of
the concept to the factual accident
statistics. The initiative will be
further promoted using training and
seminars at the various EXMAR
offices around the world with a
focus on how Taking the SAFETY
LEAD can be further adopted in daily
working life on shore.
The overall success of any safety
programme is dependent of the
implementation by individuals and
individual senior staff members in
particular. The recently enhanced
evaluation process of our fleet
personnel and shore staff is the core
of the Leadership development.
Some recent navigational incidents,
often involving port services such
as pilots or Vessel Traffic Control
Centres, cause a concern in the
way bridge teams interact during
the final stretches of their voyage
towards port. To mitigate this risk,
navigational procedures, training
on board and control over their
application is improved.
5. SUPPLEMENTARY INFORMATION
RESEARCH AND DEVELOPMENTThe activities carried out or planned in the area of research and devel-
opment are described in the first part of this report and should be read
together.
STAFF EMPLOYEDOn 31 December 2017, EXMAR employed 1,981 people worldwide,
including 1,691 seagoing staff (2016: 1,969 of which 1,628 are sea-
going personnel).
Almost all seagoing personnel are employed on the assets held by our
equity accounted investees. As a consequence, the related expenses
are not included in the personnel expenses of the consolidated financial
statements.
ACQUISITION OF OWN SHARES The authorization to acquire shares was granted to the Board of Direc-
tors by decision of the Extraordinary Shareholders’ Meeting held on
20 May 2014, renewing the authorization of the Board of Directors ,
on 19 May 2015, to proceed, in case of a takeover bid for the securities
of EXMAR NV, to a capital increase in accordance to the provisions
and within the limits of Article 607 of the Companies Code. The Board
of Directors is authorised to apply these measures if the notice of a
takeover bid is given by the Financial Services and Markets Authority
to the Company, not later than three years after the date of the above-
mentioned Extraordinary General Meeting.
On 31 December 2017, EXMAR held 2,485,247 own shares, repre-
senting 4.18% of the total number of issued shares.
STOCK OPTION PLANSo far, the Board of Directors has decided on ten occasions to offer
options on existing shares to a number of employees of the EXMAR
Group.
Plan 1, 5 and 6 have been removed from below table as the plans
matured. Plan 5 matured at the end of 2016, plans 1 and 6 matured
at the end of 2017.
Date of offerNumber of outstanding
options Exercise period Exerciseprice in
euros
PLAN 2 - 09.12.2005 309,089 Between 01.04.2009 and 15.10.2018 (*) 10.73 (°)
PLAN 3 - 15.12.2006 396,855 Between 01.01.2010 and 15.10.2019 (*) 15.96(°)
PLAN 4 - 04.12.2007 224,529 Between 01.01.2011 and 15.10.2020 (*) 14.64(°)
PLAN 7 - 09.12.2010 216,005 Between 01.01.2014 and 28.12.2018 4.71
PLAN 8 - 03.12.2013 503,600 Between 01.01.2017 and 02.12.2021 10.54
PLAN 9 - 02.12.2014 420,350 Between 01.01.2018 and 02.12.2022 10.54
PLAN 10 - 04.12.2015 415,250 Between 01.01.2019 and 03.12.2023 9.62
(*) The Board of Directors meeting of 23 March 2009 decided to extend the original exercise period for the first four option plans by five years, by virtue of the decision by the Belgian Government to extend the Act of 26 March 1999, in particular regarding stock option plans.(°) As a result of the capital increase of November 2009, the dilution protection and extra dividend of May 2012 and September 2013, the number and exercise price of the stock options was modified.
FINANCIAL REPORT66
JUSTIFICATION OF THE ACCOUNTING PRINCIPLESThe accounting principles applied at the closing of the annual financial
statements do not differ from the accounting principles that were applied
in the previous financial year.
The summary of the accounting principles is attached to the annual
financial statements.
EVENTS AFTER BALANCE SHEET DATEThe significant events occurred after the closing of the financial year
2017 are disclosed in note 37 of the consolidated financial statements.
OFFICES AND BRANCHESBesides the Head Office in Antwerp (Belgium), EXMAR has offices in
Hong Kong, Houston, London, Limassol, Luxembourg, Mumbai, Paris,
Singapore, the Netherlands and Livorno.
EXMAR has branches in Shanghai and Angola.
ADDITIONAL ACTIVITIES OF THE STATUTORY AUDITORThe Statutory Auditor did not carry out any exceptional activities or
special assignments during the past financial year.
USE OF FINANCIAL INSTRUMENTSThe long-term vision, that is typical of EXMAR’s activities, is accompa-
nied by long-term financing and therefore EXMAR’s activities are also
exposed to floating interest rates. EXMAR actively manages this expo-
sure and if deemed appropriate could cover itself for rising interest rates.
EXMAR successfully closed a NOK 700 million senior unsecured bond
issue in 2014 and issued an additional NOK 300 million in 2015. In 2014
and 2015 EXMAR entered into two cross currency interest rate swaps
(CCIRS) to cover its exposure on the issued bond in NOK. The term of
the NOK bond has been extended until July 2019. The CCIRS-contracts
have not been extended as a consequence of the extension of the term
of the bond and have ended in July 2017. As per 31 December 2017,
a forward exchange contract was outstanding to cover the NOK/USD
exposure. The FV of this contract per 31 December 2017 has been
registered in the consolidated profit or loss (USD 1.1 million).
EXMAR operates in USD but has to settle certain annual costs in Euros.
The EUR/USD exposure is managed by means of hedging instruments
if deemed necessary. At the date of this report EXMAR has no cover
of EUR/USD exposure.
APPLICATION OF ARTICLE 523 OF THE CODE OF COMPANIESDuring the meeting of the Board of Directors held on 6 December 2017,
the directors had the item “Report of the Meeting of the Remuneration
Committee” on the agenda.
Extract from the minutes:
“Prior to discussion of this agenda item and in compliance with Article
523 of the Code of Companies, CEO Nicolas Saverys and COO Patrick
De Brabandere inform the other Board members that, as members of
the Executive Committee and as beneficiaries of the proposed remu-
neration, they have a pecuniary interest that conflicts with that of the
Company.
Nicolas Saverys and Patrick De Brabandere will not participate in
the discussion or voting on the recommendations of the Remuner-
ation Committee with respect to the remuneration of the Executive
Committee.
Both gentlemen will inform the auditors in writing in compliance with
Art 523 of the Code of Companies.”
There were no conflicts of interest as far as the Executive Committee
is concerned.
ANNUAL REPORT OF THE BOARD OF DIRECTORS 67
OUTLOOK 2018
Exports of LPG are expected to further increase in the US and Middle
East, with stronger demand in the Far East and India. Due to EXMARs
limited exposure in the VLGC segment in 2018, the impact on its earn-
ings will be limited.
EXMAR continues to secure employment but at lower rates than 2017.
Presently its MGC fleet cover for 2018 is 71% and 86% of EXMAR’s
pressurized fleet is covered for 2018.
EXMAR will start to benefit from the contribution of the FSRU contract
in the second half 2018.
EXMAR Offshore Company (EOC) has been preselected for a FPSO
(Floating Production Storage and Offloading) project in Brazil.
Confirmation of selection of the contenders is expected in the second
semester of 2018. Furthermore, the Company continues to make
progress on several OPTI®-designed semisubmersible prospects.
All information which pursuant to Article 96(2) of the Companies
Code must be included in the present annual report of the Board of
Directors, more particularly the Corporate Governance Statement and
the requirements of Article 34 of the Royal Decree of 14 November
2007, is shown under the chapter ‘Corporate Governance Statement’.
6. APPROVAL OF FINANCIAL STATEMENTS
We request the General Meeting of Shareholders to approve the finan-
cial statements for the year ended 31 December 2017 in their entirety,
and to appropriate the result as provided in this report.
7. DISCHARGE
We also request the Meeting to grant discharge to the directors and
the Statutory Auditor for the performance of their mandates during the
above-mentioned financial year.
Pursuant to the law and the Articles of Association, the shareholders
will be requested on the Annual General Meeting of Shareholders on 15
May 2018 to grant discharge to the directors and the Statutory Auditor
for the execution of their mandates during the past financial year.
The Board of Directors
29 March 2018
FINANCIAL REPORT68
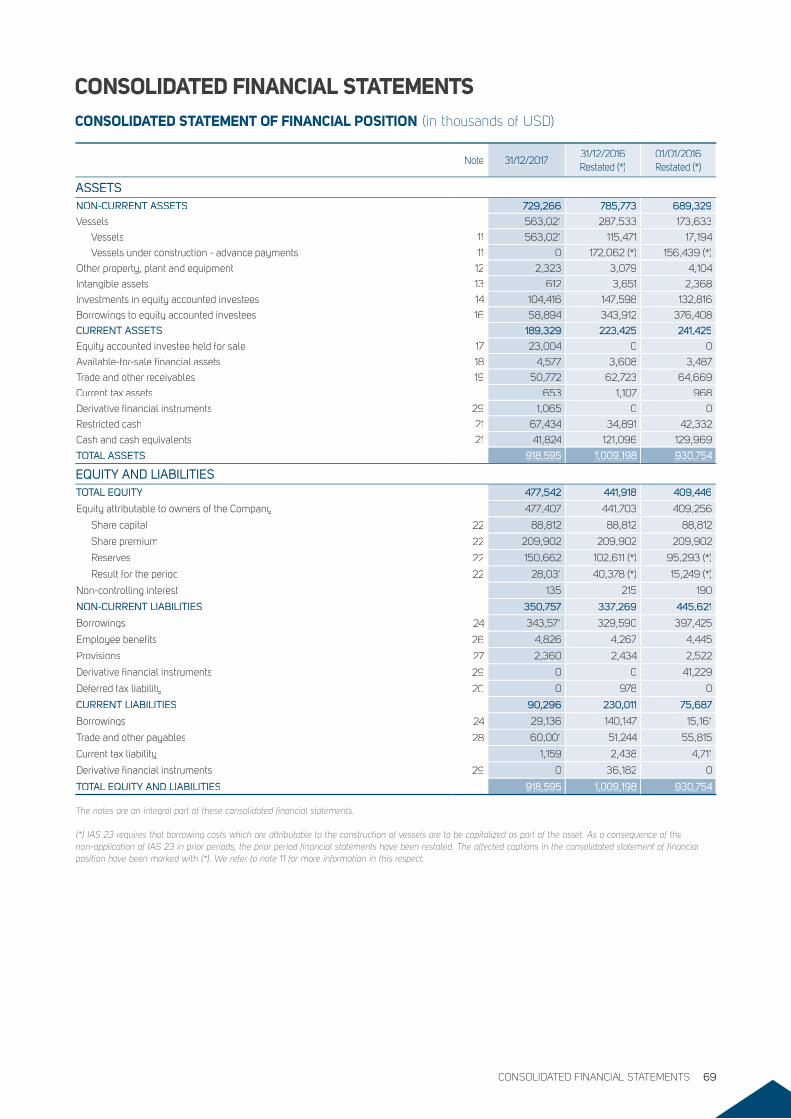
CONSOLIDATED FINANCIAL STATEMENTSCONSOLIDATED STATEMENT OF FINANCIAL POSITION (in thousands of USD)
Note 31/12/201731/12/2016Restated (*)
01/01/2016Restated (*)
ASSETSASSETSNON-CURRENT ASSETS 729,266 785,773 689,329
Vessels 563,021 287,533 173,633
Vessels 11 563,021 115,471 17,194
Vessels under construction - advance payments 11 0 172,062 (*) 156,439 (*)
Other property, plant and equipment 12 2,323 3,079 4,104
Intangible assets 13 612 3,651 2,368
Investments in equity accounted investees 14 104,416 147,598 132,816
Borrowings to equity accounted investees 16 58,894 343,912 376,408
CURRENT ASSETS 189,329 223,425 241,425
Equity accounted investee held for sale 17 23,004 0 0
Available-for-sale financial assets 18 4,577 3,608 3,487
Trade and other receivables 19 50,772 62,723 64,669
Current tax assets 653 1,107 968
Derivative financial instruments 29 1,065 0 0
Restricted cash 21 67,434 34,891 42,332
Cash and cash equivalents 21 41,824 121,096 129,969
TOTAL ASSETS 918,595 1,009,198 930,754
EQUITY AND LIABILITIESTOTAL EQUITY 477,542 441,918 409,446
Equity attributable to owners of the Company 477,407 441,703 409,256
Share capital 22 88,812 88,812 88,812
Share premium 22 209,902 209,902 209,902
Reserves 22 150,662 102,611 (*) 95,293 (*)
Result for the period 22 28,031 40,378 (*) 15,249 (*)
Non-controlling interest 135 215 190
NON-CURRENT LIABILITIES 350,757 337,269 445,621
Borrowings 24 343,571 329,590 397,425
Employee benefits 26 4,826 4,267 4,445
Provisions 27 2,360 2,434 2,522
Derivative financial instruments 29 0 0 41,229
Deferred tax liability 20 0 978 0
CURRENT LIABILITIES 90,296 230,011 75,687
Borrowings 24 29,136 140,147 15,161
Trade and other payables 28 60,001 51,244 55,815
Current tax liability 1,159 2,438 4,711
Derivative financial instruments 29 0 36,182 0
TOTAL EQUITY AND LIABILITIES 918,595 1,009,198 930,754
The notes are an integral part of these consolidated financial statements.
(*) IAS 23 requires that borrowing costs which are attributable to the construction of vessels are to be capitalized as part of the asset. As a consequence of the non-application of IAS 23 in prior periods, the prior period financial statements have been restated. The affected captions in the consolidated statement of financial position have been marked with (*). We refer to note 11 for more information in this respect.
CONSOLIDATED FINANCIAL STATEMENTS 69
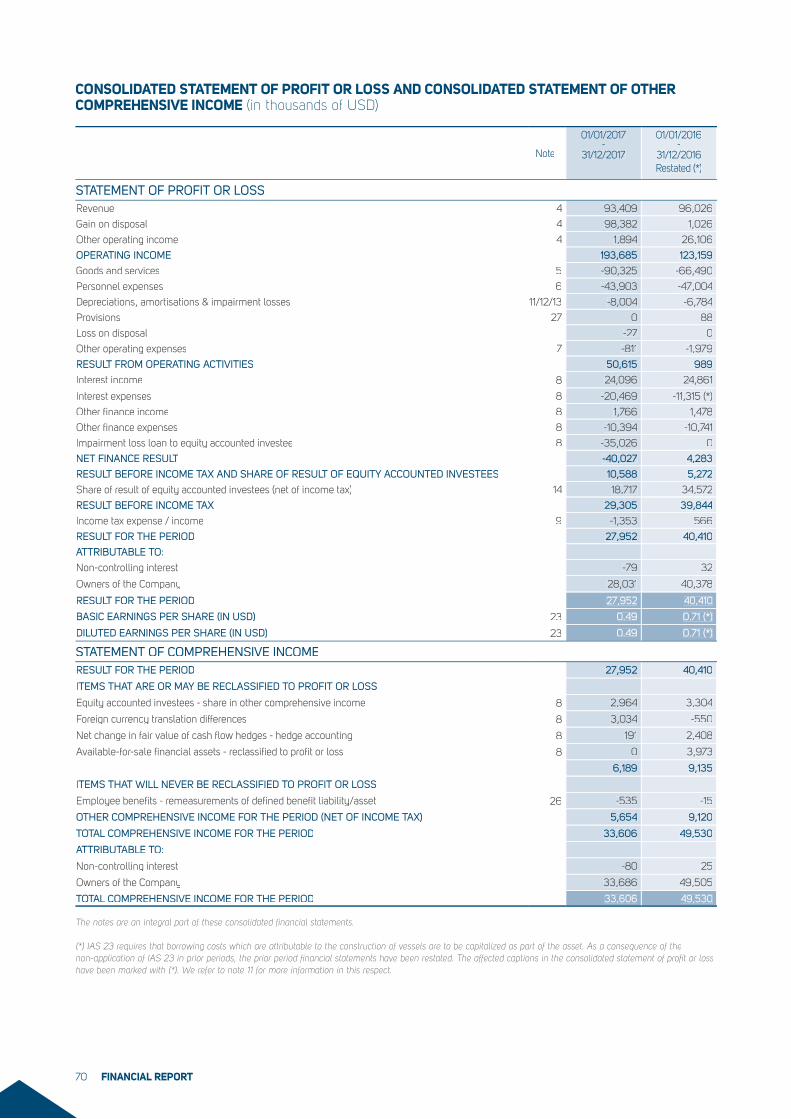
Note
01/01/2017-
31/12/2017
01/01/2016-
31/12/2016Restated (*)
STATEMENT OF PROFIT OR LOSSRevenue 4 93,409 96,026
Gain on disposal 4 98,382 1,026
Other operating income 4 1,894 26,106
OPERATING INCOME 193,685 123,159
Goods and services 5 -90,325 -66,490
Personnel expenses 6 -43,903 -47,004
Depreciations, amortisations & impairment losses 11/12/13 -8,004 -6,784
Provisions 27 0 88
Loss on disposal -27 0
Other operating expenses 7 -811 -1,979
RESULT FROM OPERATING ACTIVITIES 50,615 989
Interest income 8 24,096 24,861
Interest expenses 8 -20,469 -11,315 (*)
Other finance income 8 1,766 1,478
Other finance expenses 8 -10,394 -10,741
Impairment loss loan to equity accounted investee 8 -35,026 0
NET FINANCE RESULT 8 -40,027 4,283
RESULT BEFORE INCOME TAX AND SHARE OF RESULT OF EQUITY ACCOUNTED INVESTEES 10,588 5,272
Share of result of equity accounted investees (net of income tax) 14 18,717 34,572
RESULT BEFORE INCOME TAX 29,305 39,844
Income tax expense / income 9 -1,353 566
RESULT FOR THE PERIOD 27,952 40,410
ATTRIBUTABLE TO:ATTRIBUTABLE TO:
Non-controlling interest -79 32
Owners of the Company 28,031 40,378
RESULT FOR THE PERIOD 27,952 40,410
BASIC EARNINGS PER SHARE (IN USD) 23 0.49 0.71 (*)
DILUTED EARNINGS PER SHARE (IN USD) 23 0.49 0.71 (*)
STATEMENT OF COMPREHENSIVE INCOMERESULT FOR THE PERIOD 27,952 40,410
ITEMS THAT ARE OR MAY BE RECLASSIFIED TO PROFIT OR LOSS
Equity accounted investees - share in other comprehensive income 8 2,964 3,304
Foreign currency translation differences 8 3,034 -550
Net change in fair value of cash flow hedges - hedge accounting 8 191 2,408
Available-for-sale financial assets - reclassified to profit or loss 8 0 3,973
6,189 9,135
ITEMS THAT WILL NEVER BE RECLASSIFIED TO PROFIT OR LOSS
Employee benefits - remeasurements of defined benefit liability/asset 26 -535 -15
OTHER COMPREHENSIVE INCOME FOR THE PERIOD (NET OF INCOME TAX) 5,654 9,120
TOTAL COMPREHENSIVE INCOME FOR THE PERIOD 33,606 49,530
ATTRIBUTABLE TO:ATTRIBUTABLE TO:
Non-controlling interest -80 25
Owners of the Company 33,686 49,505
TOTAL COMPREHENSIVE INCOME FOR THE PERIOD 33,606 49,530
The notes are an integral part of these consolidated financial statements.
(*) IAS 23 requires that borrowing costs which are attributable to the construction of vessels are to be capitalized as part of the asset. As a consequence of the non-application of IAS 23 in prior periods, the prior period financial statements have been restated. The affected captions in the consolidated statement of profit or loss have been marked with (*). We refer to note 11 for more information in this respect.
CONSOLIDATED STATEMENT OF PROFIT OR LOSS AND CONSOLIDATED STATEMENT OF OTHER COMPREHENSIVE INCOME (in thousands of USD)
FINANCIAL REPORT70
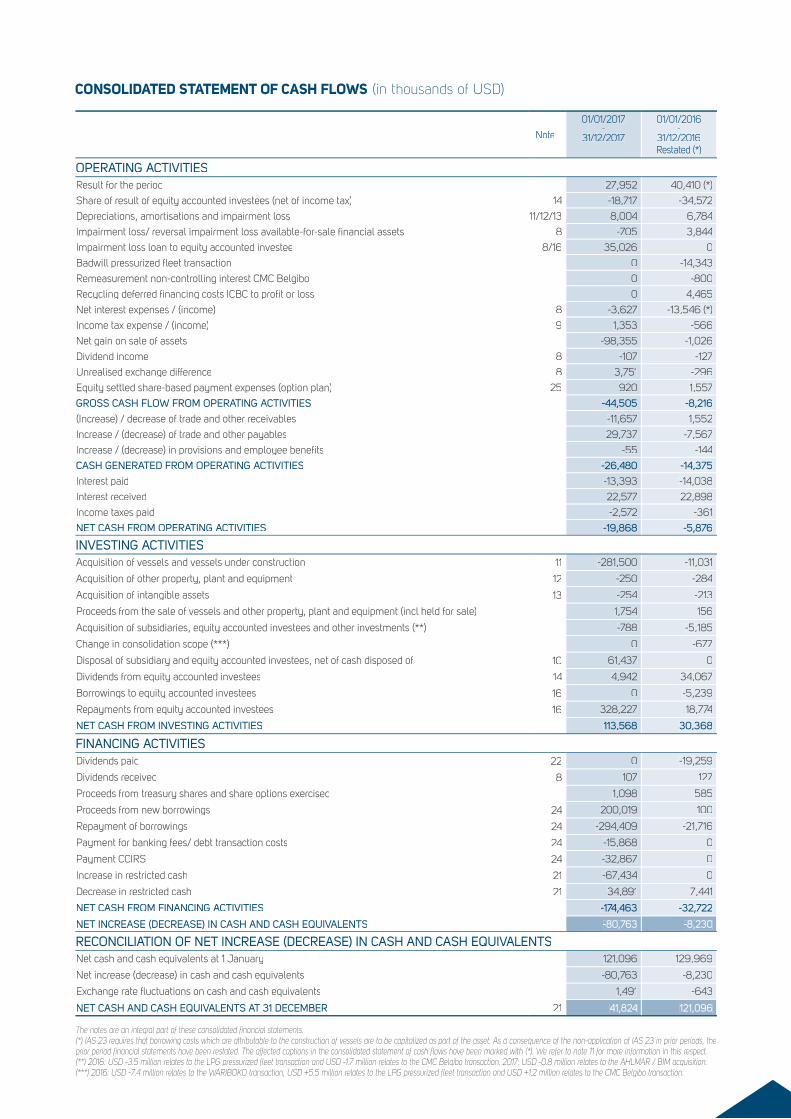
CONSOLIDATED STATEMENT OF CASH FLOWS (in thousands of USD)
Note
01/01/2017-
31/12/2017
01/01/2016-
31/12/2016Restated (*)
OPERATING ACTIVITIESResult for the period 27,952 40,410 (*)
Share of result of equity accounted investees (net of income tax) 14 -18,717 -34,572
Depreciations, amortisations and impairment loss 11/12/13 8,004 6,784
Impairment loss/ reversal impairment loss available-for-sale financial assets 8 -705 3,844
Impairment loss loan to equity accounted investee 8/16 35,026 0
Badwill pressurized fleet transaction 0 -14,343
Remeasurement non-controlling interest CMC Belgibo 0 -800
Recycling deferred financing costs ICBC to profit or loss 0 4,465
Net interest expenses / (income) 8 -3,627 -13,546 (*)
Income tax expense / (income) 9 1,353 -566
Net gain on sale of assets -98,355 -1,026
Dividend income 8 -107 -127
Unrealised exchange difference 8 3,751 -296
Equity settled share-based payment expenses (option plan) 25 920 1,557
GROSS CASH FLOW FROM OPERATING ACTIVITIES -44,505 -8,216
(Increase) / decrease of trade and other receivables -11,657 1,552
Increase / (decrease) of trade and other payables 29,737 -7,567
Increase / (decrease) in provisions and employee benefits -55 -144
CASH GENERATED FROM OPERATING ACTIVITIES -26,480 -14,375
Interest paid -13,393 -14,038
Interest received 22,577 22,898
Income taxes paid -2,572 -361
NET CASH FROM OPERATING ACTIVITIES -19,868 -5,876
INVESTING ACTIVITIESAcquisition of vessels and vessels under construction 11 -281,500 -11,031
Acquisition of other property, plant and equipment 12 -250 -284
Acquisition of intangible assets 13 -254 -213
Proceeds from the sale of vessels and other property, plant and equipment (incl held for sale) 1,754 156
Acquisition of subsidiaries, equity accounted investees and other investments (**) -788 -5,185
Change in consolidation scope (***) 0 -677
Disposal of subsidiary and equity accounted investees, net of cash disposed of 10 61,437 0
Dividends from equity accounted investees 14 4,942 34,067
Borrowings to equity accounted investees 16 0 -5,239
Repayments from equity accounted investees 16 328,227 18,774
NET CASH FROM INVESTING ACTIVITIES 113,568 30,368
FINANCING ACTIVITIESDividends paid 22 0 -19,259
Dividends received 8 107 127
Proceeds from treasury shares and share options exercised 1,098 585
Proceeds from new borrowings 24 200,019 100
Repayment of borrowings 24 -294,409 -21,716
Payment for banking fees/ debt transaction costs 24 -15,868 0
Payment CCIRS 24 -32,867 0
Increase in restricted cash 21 -67,434 0
Decrease in restricted cash 21 34,891 7,441
NET CASH FROM FINANCING ACTIVITIES -174,463 -32,722
NET INCREASE (DECREASE) IN CASH AND CASH EQUIVALENTS -80,763 -8,230
RECONCILIATION OF NET INCREASE (DECREASE) IN CASH AND CASH EQUIVALENTSNet cash and cash equivalents at 1 January 121,096 129,969
Net increase (decrease) in cash and cash equivalents -80,763 -8,230
Exchange rate fluctuations on cash and cash equivalents 1,491 -643
NET CASH AND CASH EQUIVALENTS AT 31 DECEMBER 21 41,824 121,096
The notes are an integral part of these consolidated financial statements. (*) IAS 23 requires that borrowing costs which are attributable to the construction of vessels are to be capitalized as part of the asset. As a consequence of the non-application of IAS 23 in prior periods, the prior period financial statements have been restated. The affected captions in the consolidated statement of cash flows have been marked with (*). We refer to note 11 for more information in this respect. (**) 2016: USD -3.5 million relates to the LPG pressurized fleet transaction and USD -1.7 million relates to the CMC Belgibo transaction. 2017: USD -0.8 million relates to the AHLMAR / BIM acquisition. (***) 2016: USD -7.4 million relates to the WARIBOKO transaction, USD +5.5 million relates to the LPG pressurized fleet transaction and USD +1.2 million relates to the CMC Belgibo transaction.
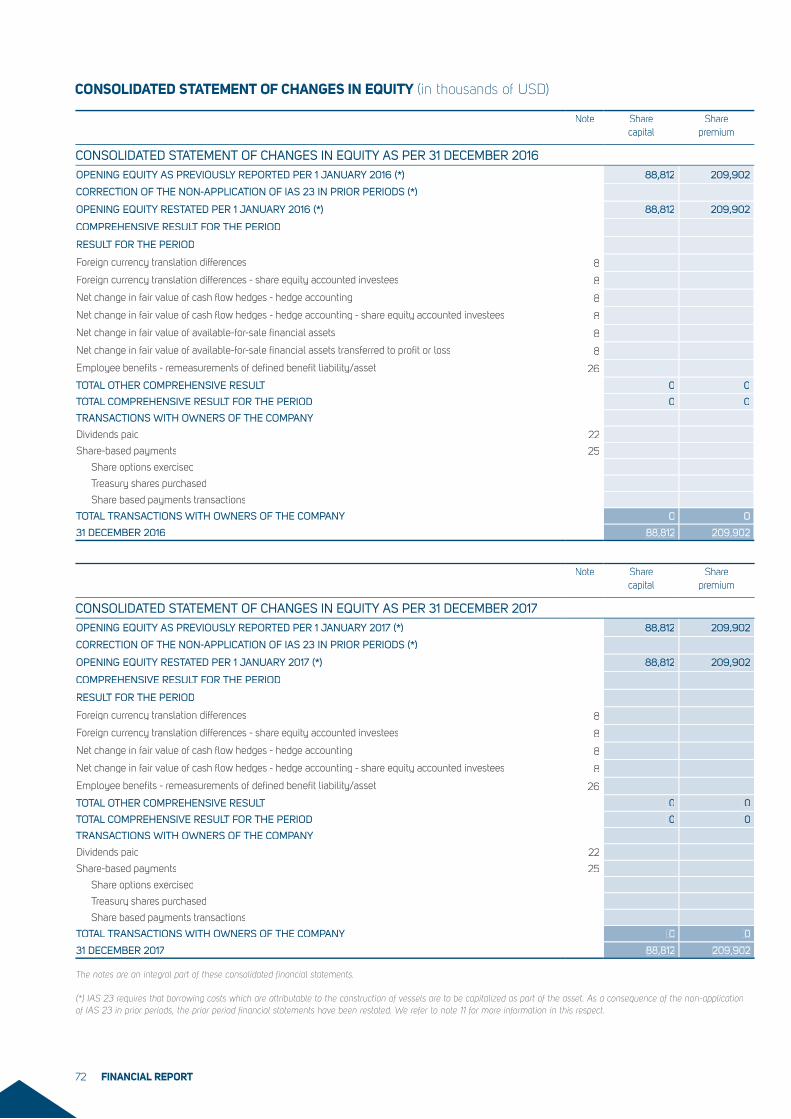
CONSOLIDATED STATEMENT OF CHANGES IN EQUITY (in thousands of USD)
Note Share capital
Share premium
CONSOLIDATED STATEMENT OF CHANGES IN EQUITY AS PER 31 DECEMBER 2016OPENING EQUITY AS PREVIOUSLY REPORTED PER 1 JANUARY 2016 (*) 88,812 209,902
CORRECTION OF THE NON-APPLICATION OF IAS 23 IN PRIOR PERIODS (*)
OPENING EQUITY RESTATED PER 1 JANUARY 2016 (*) 88,812 209,902
COMPREHENSIVE RESULT FOR THE PERIOD
RESULT FOR THE PERIOD
Foreign currency translation differences 8
Foreign currency translation differences - share equity accounted investees 8
Net change in fair value of cash flow hedges - hedge accounting 8
Net change in fair value of cash flow hedges - hedge accounting - share equity accounted investees 8
Net change in fair value of available-for-sale financial assets 8
Net change in fair value of available-for-sale financial assets transferred to profit or loss 8
Employee benefits - remeasurements of defined benefit liability/asset 26
TOTAL OTHER COMPREHENSIVE RESULT 0 0
TOTAL COMPREHENSIVE RESULT FOR THE PERIOD 0 0
TRANSACTIONS WITH OWNERS OF THE COMPANY
Dividends paid 22
Share-based payments 25
Share options exercised
Treasury shares purchased
Share based payments transactions
TOTAL TRANSACTIONS WITH OWNERS OF THE COMPANY 0 0
31 DECEMBER 2016 88,812 209,902
Note Share capital
Share premium
CONSOLIDATED STATEMENT OF CHANGES IN EQUITY AS PER 31 DECEMBER 2017OPENING EQUITY AS PREVIOUSLY REPORTED PER 1 JANUARY 2017 (*) 88,812 209,902
CORRECTION OF THE NON-APPLICATION OF IAS 23 IN PRIOR PERIODS (*)
OPENING EQUITY RESTATED PER 1 JANUARY 2017 (*) 88,812 209,902
COMPREHENSIVE RESULT FOR THE PERIOD
RESULT FOR THE PERIOD
Foreign currency translation differences 8
Foreign currency translation differences - share equity accounted investees 8
Net change in fair value of cash flow hedges - hedge accounting 8
Net change in fair value of cash flow hedges - hedge accounting - share equity accounted investees 8
Employee benefits - remeasurements of defined benefit liability/asset 26
TOTAL OTHER COMPREHENSIVE RESULT 0 0
TOTAL COMPREHENSIVE RESULT FOR THE PERIOD 0 0
TRANSACTIONS WITH OWNERS OF THE COMPANY
Dividends paid 22
Share-based payments 25
Share options exercised
Treasury shares purchased
Share based payments transactions
TOTAL TRANSACTIONS WITH OWNERS OF THE COMPANY 0 0
31 DECEMBER 2017 88,812 209,902
The notes are an integral part of these consolidated financial statements.
(*) IAS 23 requires that borrowing costs which are attributable to the construction of vessels are to be capitalized as part of the asset. As a consequence of the non-application of IAS 23 in prior periods, the prior period financial statements have been restated. We refer to note 11 for more information in this respect.
FINANCIAL REPORT72
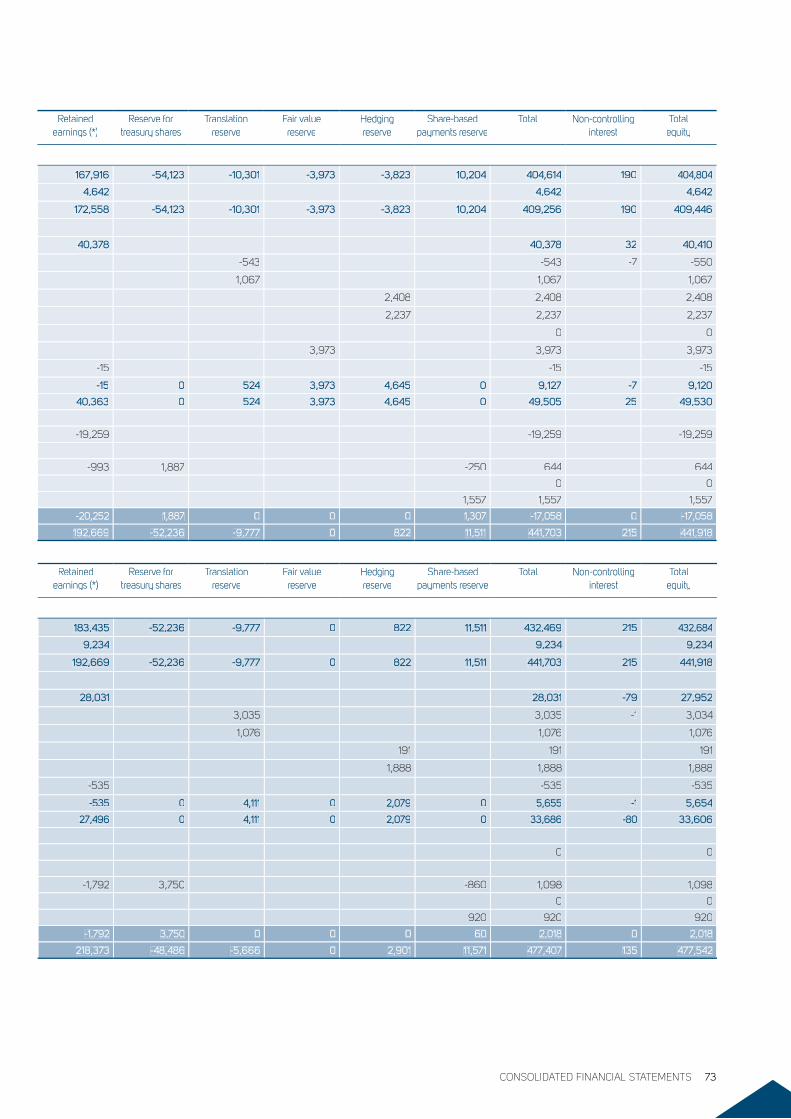
Retained earnings (*)
Reserve for treasury shares
Translation reserve
Fair value reserve
Hedging reserve
Share-based payments reserve
Total Non-controlling interest
Total equity
167,916 -54,123 -10,301 -3,973 -3,823 10,204 404,614 190 404,804
4,642 4,642 4,642
172,558 -54,123 -10,301 -3,973 -3,823 10,204 409,256 190 409,446
40,378 40,378 32 40,410
-543 -543 -7 -550
1,067 1,067 1,067
2,408 2,408 2,408
2,237 2,237 2,237
0 0
3,973 3,973 3,973
-15 -15 -15
-15 0 524 3,973 4,645 0 9,127 -7 9,120
40,363 0 524 3,973 4,645 0 49,505 25 49,530
-19,259 -19,259 -19,259
-993 1,887 -250 644 644
0 0
1,557 1,557 1,557
-20,252 1,887 0 0 0 1,307 -17,058 0 -17,058
192,669 -52,236 -9,777 0 822 11,511 441,703 215 441,918
Retained earnings (*)
Reserve for treasury shares
Translation reserve
Fair value reserve
Hedging reserve
Share-based payments reserve
Total Non-controlling interest
Total equity
183,435 -52,236 -9,777 0 822 11,511 432,469 215 432,684
9,234 9,234 9,234
192,669 -52,236 -9,777 0 822 11,511 441,703 215 441,918
28,031 28,031 -79 27,952
3,035 3,035 -1 3,034
1,076 1,076 1,076
191 191 191
1,888 1,888 1,888
-535 -535 -535
-535 0 4,111 0 2,079 0 5,655 -1 5,654
27,496 0 4,111 0 2,079 0 33,686 -80 33,606
0 0
-1,792 3,750 -860 1,098 1,098
0 0
920 920 920
-1,792 3,750 0 0 0 60 2,018 0 2,018
218,373 -48,486 -5,666 0 2,901 11,571 477,407 135 477,542
CONSOLIDATED FINANCIAL STATEMENTS 73
1. ACCOUNTING POLICIES
A. REPORTING ENTITYEXMAR nv (“the Company”) is a company domiciled in Belgium whose
shares are publicly traded (Euronext – EXM). The consolidated financial
statements of the Group comprise the Company, its subsidiaries, and
the Group’s interest in associates and joint arrangements (referred to as
“The Group”). The Group is active in the industrial shipping business.
B. BASIS OF PREPARATIONThe consolidated financial statements have been prepared in accord-
ance with International Financial Reporting Standards (IFRS) issued
by the International Accounting Standards Board (IASB) as adopted
by EU on 31/12/2017.
The group has adopted the following new standards, amendments to standards, including any consequential amendments to other stand-ards, and new interpretations with a date of initial application of 1 January 2017. These new standards and amendments did not have a material impact on our financial statements.
• Amendments to IAS 7 (disclosure initiative).
• Recognition of Deferred Tax Asset for Unrealized Losses (Amend-
ments to IAS 12).
• Amendments to IFRS 12 included in the 2014-2016 Annual Improve-
ments Cycle.
A number of new standards, amendments to standards and interpre-tations are not yet effective for the year ended 31 December 2017, and have not been applied in preparing these consolidated financial statements:
IFRS 9 Financial Instruments published in July 2014 replaces the
existing guidance in IAS 39 Financial Instruments: Recognition and
Measurement. IFRS 9 includes revised guidance on the classification
and measurement of financial assets and financial liabilities, including
a new expected credit loss model for calculating impairment on finan-
cial assets, and new general hedge accounting requirements, which
align hedge accounting more closely with risk management. IFRS 9 is
effective for annual periods beginning on or after 1 January 2018, with
early adoption permitted. This new standard has been endorsed by the
EU. The Group does not plan to early adopt the Standard.
PHASE 1: CLASSIFICATION AND MEASUREMENT OF FINANCIAL
ASSETS AND FINANCIAL LIABILITIES
With respect to the classification and measurement, the number of
categories of financial assets under IFRS has been reduced; all rec-
ognized financial assets that are currently within the scope of IAS 39
will be subsequently measured at either amortized cost or fair value
under IFRS 9.
Specially:
• A debt instrument that (i) is held within a business model whose
objective is to collect the contractual cash flows and (ii) has contrac-
tual cash flows that are solely payments of principal and interest on
the principal amount outstanding must be measured at amortized
costs (net of any write down of impairment), unless the asset is
designated at fair value through profit or loss (FVTPL) under the
fair value option.
• A debt instrument that (i) is held within a business model whose
objective is achieved both by collecting contractual cash flows and
selling financial assets and (ii) has contractual terms that give rise
on specific dates to cash flows that are solely payments of principal
and interest on the principal amount outstanding must be measured
at fair value through other comprehensive income (FVTOCI), unless
the asset is designated at fair value through profit or loss (FVTPL)
under the fair value option.
• All other debt instruments must be measured at FTPL.
• All equity instruments are to be measured in the statement of financial
position at fair value, with gains and losses recognized in profit or
loss except that if an equity investment is not held for trading, nor
contingent consideration recognized by an acquirer in a business
combination to which IFRS 3 applies, an irrevocable election can
be made at initial recognition to measure the investment at FVTOCI,
with dividend income recognized in profit or loss.
IFRS 9 eliminates the existing IAS 39 categories of held to maturity,
loans and receivables and available for sales.
Based on its assessment, the Group does not believe that the new
classification and measurement requirements for financial assets will
have a material impact on its consolidated financial statements. At
31 December 2017, the Group had equity investments classified as
available-for-sales with a fair value of USD 4.6 million. Under IAS 39
the fair value reserve in respect of these shares has been recycled to
the statement of profit or loss in 2016 as a result of a significant and
prolonged decline in the fair value of these shares. The current year’s
change in fair value has also been registered in the statement of profit
or loss. This will also be the case for future changes in fair value. Con-
sequently, under IFRS 9, the Group has designated these investments
as measured at FVTPL.
IFRS 9 also contains requirements for the classification and measure-
ment of financial liabilities and derecognition requirements. One major
difference from IAS 39 relates to the presentation of changes in the
fair value of a financial liability designated as at FVTPL attributable to
changes in the credit risk of that liability. Under IFRS 9, such changes
are presented in other comprehensive income, unless the presentation
of the effect of the change in the liability’s credit risk in other compre-
hensive income would create or enlarge an accounting mismatch in
profit or loss. Changes in fair value attributable to a financial liability’s
credit risk are not subsequently reclassified to profit or loss. Under IAS
39, the entire amount of the change in fair value of the financial liability
designated as FVTPL is presented in profit or loss.
The Group has not designated any financial liability at FVTPL and it has
no current intention to do so. The Group’s assessment did not indicate
any material impact regarding the classification and measurement of
financial liabilities per 1 January 2018.
PHASE 2: IMPAIRMENT OF FINANCIAL ASSETS
The impairment model under IFRS 9 reflects expected credit losses, as
opposed to incurred credit losses under IAS 39. Under the impairment
approach in IFRS 9, it is no longer necessary for a credit event to have
occurred before credit losses are recognised. Instead, an entity always
accounts for expected credit losses and changes in those expected credit
losses. The amount of expected credit losses should be updated at each
reporting date to reflect changes in credit risk since initial recognition.
FINANCIAL REPORT74
Based on its assessment, the Group does not believe that the new
impairment model will have a significant impact on the consolidated
financial statements. As discussed in note 29 of the consolidated
financial statements, no important impairment losses have occurred in
the past and no important credit losses are expected by management.
PHASE 3: HEDGE ACCOUNTING
The general hedge accounting requirements of IFRS 9 retain the
three types of hedge accounting mechanisms under IAS 39. How-
ever, greater flexibility has been introduced to the types of transac-
tions eligible for hedge accounting, specially broadening the types
of instruments that qualify as hedging instruments and the types of
risk components of non-financial items that are eligible for hedge
accounting. In addition, the effectiveness test has been overhauled
and replaced with the principle of an “economic relationship”. Ret-
rospective assessment of hedge effectiveness is no longer required.
More disclosure requirements about an entity’s risk management
activities have been introduced.
When initially applying IFRS 9, the Group may choose as its accounting
policy to continue to apply the hedge accounting requirements of IAS
39 instead of the requirements in IFRS 9. The Group has chosen to
apply the new requirements of IFRS 9.
The types of hedge accounting relationships that the Group currently
designates meet the requirements of IFRS 9 and are aligned with the
entity’s risk management strategy and objective.
Based on its assessment, the Group does not anticipate that the appli-
cation of IFRS 9 hedge accounting will have a material impact on the
Group’s consolidated financial statements.
IFRS 15 Revenue from Contracts with Customers establishes a com-
prehensive framework for determining whether, how much and when
revenue is recognized. It replaces existing revenue recognition guidance,
including IAS 18 Revenue, IAS 11 Construction Contracts and the related
interpretations. IFRS 15 is effective for the annual reports beginning
on or after 1 January 2018, with early adoption permitted. This new
standard and Clarifications to IFRS 15 Revenue from contracts with
customers (issued on 12 April 2016) have been endorsed by the EU.
The Group does not plan to early adopt the Standard.
The core principle of IFRS 15 is that an entity should recognize revenue
to depict the transfer of promised goods or services to customers in
an amount that reflects the consideration to which the entity expects
to be entitled in exchange for those goods or services. Specifically,
the Standard introduces a 5-step approach for revenue recognition:
• Step 1: Identify the contract(s) with a customer
• Step 2: Identify the performance obligations in the contract
• Step 3: Determine the transaction price
• Step 4: Allocate the transaction price to the performance obligations
in the contract
• Step 5: Recognize revenue when (or as) the entity satisfies a per-
formance obligation
Under IFRS 15, an entity recognizes revenue when (or as) a perfor-
mance obligation is satisfied, i.e. when ‘control’ of the goods or services
underlying the particular performance obligation is transferred to the
customer.
The Group recognizes revenue from the following major sources:
• Time or bareboat charter revenue: revenue is recognized on an
accrual basis and in recorded over the term of the charter as the
service is provided. This type of revenue falls within the scope of
IAS 17/ IFRS 16 Leasing (see below).
• Service revenue: the Group is involved in performing specialized
supporting services to the oil and gas industry:
- Shipmanagement services: in accordance with IFRS 15, the per-
formance obligations are satisfied over time as the customer
simultaneously receives and consumes the benefits provided by
the entity’s performance as the entity performs (recurring services).
- Travel agency services: in accordance with IFRS 15, the Group
acts as an agent for the services provided. As a consequence,
the Group recognizes revenue not on a gross basis, but only
recognizes to which it expects to be entitled to.
Apart from providing more extensive disclosure’s on the Group’s rev-
enue transactions, the Group does not anticipate that the application
of IFRS 15 will have a significant impact on the consolidated financial
statements of the Group.
The Group plans to adapt IFRS 15 using the cumulative effect method,
with the effect of initially applying this standard recognized at the date
of initial application (i.e. 1 January 2018). As a result, the Group will not
apply the requirements of IFRS 15 to the comparative period presented.
IFRS 16 Leasing: In January 2016, the IASB issued a new standard
for lease accounting, applicable for annual periods beginning on or
after January 1, 2019. The standard has been endorsed by the Euro-
pean Union. IFRS 16 replaces existing leases guidance including IAS
17 Leases, IFRIC 4 Determining whether an Arrangement contains a
Lease, SIC-15 Operating Leases-Incentives and SIC-27 Evaluating the
Substance of Transactions Involving the Legal Form of a Lease. IFRS
16 eliminates the classification of leases as either operating or finance
leases for a lessee and introduces a single lease accounting model for
lessees. All leases, except leases with a term of lease less than twelve
months or low-value leases, are capitalized by recognizing the present
value of the lease payments and presenting them as a right of use asset
in the statement of financial position of the lessee. Lease payments that
are paid over time should be presented as a financial liability. In the
statement of profit or loss, the depreciation charge of the lease asset
will be presented separately from the interest expense on the lease
liability. IFRS 16 does not change substantially lease accounting for
lessors. A lessor will continue to classify leases as either operational
or finance lease and account for those two types of leases differently.
The group is currently investigating the impact that the application of
the new standard will have on the consolidated financial statements.
As the Group is mainly lessor in respect of time or bareboat charter
revenue, the Group does not expect that IFRS 16 will have a significant
impact on the consolidated financial statements.
The following new or amended standards or interpretations are not
expected to have a significant impact on the Group’s consolidated
financial statements.
• Sale or Contribution of Assets between an Investor and its Associate
or Joint Venture (Amendments to IFRS 10 and IAS 28).
NOTES 75
• Classification and measurement of Share-based Payment Transac-
tions (Amendments to IFRS 2).
• Annual improvements to IFRS’s 2014-2016 Cycle – amendments
to IFRS 1 and IAS 28.
• Transfer of investment property (Amendments to IAS 40).
• Foreign currency transactions and Advance consideration (IFRIC 22).
• IFRS 17 Insurance Contracts.
• Uncertainty over Income Tax Treatments (IFRIC 23).
• Long-term interest in Associates and Joint Ventures (Amendments
to IAS 28).
• Annual improvements to IFRS 2015-2017 cycle
The consolidated financial statements were approved and were author-
ised for issue by the Board of Directors on March 29, 2018.
C. FUNCTIONAL AND PRESENTATION CURRENCY
The consolidated accounts are presented in USD in accordance with
the deviation granted by the Financial Services and Markets Authority
(FSMA) by letter of 2 July 2003, and all values are rounded to the
nearest thousand. USD is the Company’s functional currency. They are
prepared on the historical cost basis except for the following material
assets and liabilities that have been measured on an alternative basis on
each reporting date: derivative financial instruments, available-for-sale
financial assets and the net defined benefit liability. Assets held for sale
are stated at the lower of carrying amount and fair value less cost to sell.
D. USE OF JUDGEMENTS AND ESTIMATES
The preparation of the consolidated financial statements in accordance
with IFRS requires management to make judgments, estimates and
assumptions that affect the application of the accounting policies and
the reported amounts of assets and liabilities, income and expenses.
The estimates and related assumptions are based on historical experi-
ence and various other factors that are believed to be reasonable under
the circumstances. Actual results may differ from these estimates.
The estimates and the underlying assumptions are reviewed on an
ongoing basis. Revisions to accounting estimates are recognised in
the period in which the estimate is revised if the revision only affects
that period, or in the period of the revision and future periods, if the
revision affects both current and future periods.
Preparing the consolidated financial statements, the Group has made
judgements, estimates and assumptions regarding the fair value for the
share options, the employee benefit plans, provisions and contingencies
and the classification of new lease commitments and time charter
agreements.On a yearly basis the residual value and the useful life of
the vessels is reviewed. The carrying values of the vessels may not
represent the fair market value at any point in time since the market
prices of second-hand vessels tend to fluctuate with changes in charter
rates and the cost of new buildings. Historically, both charter rates and
vessel values tend to be cyclical. The carrying amounts of each specific
fleet are reviewed for potential impairment whenever events or changes
in circumstances indicate that the carrying amount of a specific fleet
may not be fully recoverable. The recoverable amount is the highest of
the fair value less cost to sell and the value in use. The fair value less
cost to sell is determined based upon independent valuation reports.
The value in use is based upon future cash flows discounted to their
present value. In developing estimates of future cash flows, we must
make assumptions about future charter rates, ship operating expenses,
the estimated remaining useful lives of the fleet and the WACC. These
assumptions are based on historical trends as well as future expecta-
tions. Although management believes that the assumptions used to
evaluate potential impairment are reasonable and appropriate, such
assumptions are highly subjective. The vessels are mainly registered
within our equity accounted investees.
A number of the Group’s accounting policies and disclosures require
the measurement of fair values, for both financial and non-financial
assets and liabilities. When measuring the fair value, the Group uses
observable market data as far as possible. Fair values are categorized
into different levels in a fair value hierarchy based on the inputs used
in the valuation techniques:
• Level 1: quoted prices (unadjusted) in active markets for identical
assets or liabilities.
• Level 2: inputs other than quoted prices included in Level 1 that are
observable for the assets or liability, either directly (i.e. as prices) or
indirectly (i.e. derived from prices).
• Level 3: inputs for the asset or liability that are not based on observable
market data (unobservable inputs).
E. CHANGES IN ACCOUNTING POLICIES
The group has consistently applied the accounting policies to all periods
presented in the consolidated financial statements.
F. SIGNIFICANT ACCOUNTING POLICIES
a) Basis of consolidation
Business combinations
The Group accounts for business combinations using the acquisition
method when control is transferred to the Group.
A business is an integrated set of activities and assets that is capable
of being conducted and managed to provide a return to investors (or
other owners, members or participants) by way of dividends, lower costs
or other economic benefits. A business generally consists of inputs,
processes applied on those inputs and the ability to create outputs. This
can for instance be the case when the acquisition also contains the
transfer of current contracts in respect of chartering, crew,…
The consideration transferred in the acquisition is generally measured
at fair value, as are the identifiable net assets acquired. Any goodwill
that arises is tested annually for impairment. Any gain on a bargain
purchase is recognised in profit or loss immediately. Transaction costs
are expensed as incurred, except if related to the issue of debt or equity
securities.
The consideration transferred does not include amounts related to the
settlement of pre-existing relationships. Such amounts are generally
recognised in profit or loss.
Any contingent consideration is measured at fair value at the date
of acquisition. If an obligation to pay contingent consideration that
meets the definition of a financial instrument is classified as equity,
then it is not remeasured and settlement is accounted for within equity.
Otherwise, other contingent consideration is remeasured at fair value
at each reporting date and subsequent changes in fair value are rec-
ognised in profit or loss.
FINANCIAL REPORT76
Subsidiaries
Subsidiaries are those entities controlled by the Group. The group con-
trols an entity when it is exposed to, or has rights to, variable returns
from its involvement with the entity and has the ability to affect those
returns through its power over the entity.
The financial statements of subsidiaries are included in the consolidated
financial statements from the date on which control commences until
the date on which control ceases. All intra-Group balances, income
and expenses, unrealized gains and losses and dividends resulting
from intra-Group transactions are eliminated in full.
Loss of control
Upon the loss of control, the Group derecognizes the assets and lia-
bilities of the subsidiary, and non-controlling interests and the other
components of equity related to the subsidiary. Any surplus or deficit
arising on the loss of control is recognized in profit and loss. If the Group
retains any interest in the previous subsidiary, then such interest is
measured at fair value at the date the control is lost.
Interests in equity-accounted investees
The Group’s interest in equity accounted investees comprises interests
in associates and joint ventures.
Associates are those entities in which the Group has significant influ-
ence, but not control or joint control, over the financial and operating
policies. Significant influence is presumed to exist when the Group
holds between 20% and 50% of the voting power.
A joint venture is an arrangement in which the Group has joint control,
whereby the Group has rights to the net assets of the arrangement,
rather than rights to its assets and obligations for its liabilities.
Investments in associates and joint ventures are accounted for using
the equity method and are recognised initially at cost. The cost of the
investment includes transaction costs. Subsequent to initial recognition,
the consolidated financial statements include the Group’s share of the
profit or loss and OCI of equity accounted investees, from the date that
significant influence or joint control commences until the date that
significant influence or joint control ceases.
When the share of the Group in the losses exceeds its interest in an
equity accounted investee, the carrying amount of that interest is
reduced to zero, and the recognition of future losses is discontinued,
except to the extent that the Group has an obligation or has made pay-
ments on behalf of the investee. In such case the negative investment
in equity accounted investees is deducted from other components of
the investor’s interest in the equity accounted investee (borrowings
to equity accounted investees). If the negative investment in equity
accounted investees exceeds the investor’s interest, a liability is rec-
ognized for the net amount. Unrealised gains arising from transactions
with equity-accounted investees are eliminated against the investment
to the extent of the Group’s interest in the investee. Unrealised losses
are eliminated in the same way as unrealised gains, but only to the
extent that there is no evidence of impairment.
b) Foreign currency
Foreign currency transactions
Foreign currency transactions are converted to the respective functional
currencies at the exchange rate applicable at the date of the transaction.
Monetary assets and liabilities denominated in foreign currencies at the
reporting date are translated to USD at the exchange rate applicable at
that date. The non-monetary assets and liabilities that are measured
in terms of historical cost are translated to USD at the exchange rate
at the date of the initial transactions. Non-monetary items that are
measured at fair value in a foreign currency are translated using the
exchange rates at the date the fair value was determined. Foreign
exchange differences arising on translation are recognised in the profit
or loss statement, except for qualified cash flow hedges to the extent
that the hedges are effective, which are recognised in other compre-
hensive income.
Financial statements of foreign operations
Assets and liabilities of foreign operations, including goodwill and fair
value adjustments arising on acquisition, are translated to USD using
the closing rate at reporting date.
The income and expenses of the foreign operations are converted to
USD at the exchange rate at he date of the transaction (the average
exchange rate during the relevant period is used in case the date of
transaction approximates this average rate).
Foreign currency differences are recognized directly in other compre-
hensive income. These foreign currency differences are presented within
the translation reserve. However, if the operation is a non-wholly-owned
subsidiary, then the relevant proportionate share of the translation
difference is allocated to the non-controlling interests.When a foreign
operation is disposed of such that control, significant influence or joint
control is lost, the cumulative amount in the translation reserve related
to that foreign operation is reclassified to profit and loss as part of the
gain or loss on disposal. When the Group disposes of only part of its
interest in a subsidiary that includes a foreign operation while retaining
control, the relevant proportion of the cumulative amount is reattributed
to non-controlling interests. When the Group disposes of only part of its
investment in an associate or joint venture that includes a foreign oper-
ation while retaining significant influence or joint control, the relevant
proportion of the cumulative amount is reclassified to profit and loss.
c) Financial instruments
Non-derivative financial assets
Loans and receivables and deposits are initially recognised on the date
that they are originated. All other financial assets are recognised initially
at trade date. The Group derecognises a financial asset when the con-
tractual rights to the cash flow from the assets expire, or it transfers the
rights to receive the contractual cash flows on the financial asset in a
transaction in which substantially all risks and rewards of ownership are
transferred, or it neither transfers nor retains substantially all of the risks
and rewards of ownership and does not retain control over the transferred
asset. Any interest in such transferred financial assets that is created
or retained by the Group is recognised as a separate asset or liability.
Financial assets and liabilities are offset when and only when, the Group
has a legal right to offset the amounts and intends either to settle on a
net basis or to realise the asset and settle the liability simultaneously.
NOTES 77
Financial assets at fair value through profit and lossA financial asset is classified at fair value through profit and loss if it is
classified as held for trading or designated as such on initial recognition.
Upon initial recognition attributable transaction costs are recognised in
the profit or loss statement as incurred. Financial assets at fair value
through profit and loss are measured at fair value and changes therein
are recognised in the profit or loss statement.
Held-to maturity financial assets/other investmentsIf the Group has the positive intent and ability to hold debt securities to
maturity, then such financial assets are classified as held-to-maturity.
Held-to-maturity financial assets are recognised initially at fair value
plus any directly attributable transaction costs. Subsequent to initial
recognition held-to-maturity financial assets are measured at amortised
cost, using the effective interest method, less any impairment losses.
Loans and receivablesLoans and receivables are financial assets with fixed or determinable
payments that are not quoted in an active market. Such assets are
recognised initially at fair value (normally equals transaction price)
plus any directly attributable transaction costs. Subsequent to initial
recognition loans and receivables are measured at amortised cost, using
the effective interest method, less any impairment losses. Cash and
cash equivalents comprise cash balances and demand deposits. Bank
overdrafts that are repayable on demand and form an integral part of
the Group’s cash management are included as a component of cash
and cash equivalents for the purpose of the statement of the cash flows.
Available-for-sale financial assetsAvailable-for-sale financial assets include equity securities, which are
not classified as held for trading, designated at fair value through profit
and loss or held to maturity. Available-for-sale financial assets are
recognised initially at fair value plus any directly attributable transac-
tion costs. Available-for-sale financial assets are, subsequent to initial
recognition, measured at fair value and changes therein, other than
impairment losses, are recognised in other comprehensive income and
presented within the fair value reserve. When an investment is derec-
ognised, the cumulative gain or loss in other comprehensive income is
transferred to the profit or loss statement. Once an investment in equity
instruments has been impaired, all subsequent results are recognized
in profit or loss until the asset is derecognized.
Non-derivative financial liabilities
The Group initially recognises debt securities issued and subordinated
liabilities on the date that they are originated. All other financial liabilities
are recognised initially at trade date at which the Group becomes a party
to the contractual provisions of the instrument. The Group derecognises
a financial liability when its contractual obligations are discharged or
cancelled or expire. The Group has the following non-derivative financial
liabilities: loans and borrowings, bank overdrafts and trade and other
payables. Such financial liabilities are recognised initially at fair value
(normally equals the transaction price for trade and other payables)
plus any directly attributable transaction costs for loans and borrowings.
Subsequent to initial recognition these financial liabilities are measured
at amortised cost using the effective interest method.
Share Capital
Ordinary shares are classified as equity. Incremental costs directly
attributable to the issue of ordinary shares and share options are recog-
nised as a deduction from equity, net of tax effects. When share capital
recognised as equity is repurchased, the amount of the consideration
paid, including directly attributable costs net of tax, is recognised as
a deduction from equity. When treasury shares are sold, the amount
received is recognised as an increase in equity and the resulting surplus
or deficit on the transaction is presented in retained earnings.
Derivative financial instruments & hedge accounting
The Group holds derivative financial instruments to hedge its foreign
currency and interest rate risk exposures.
Embedded derivatives are separated from the host contract and
accounted for separately if the economic characteristics and risks of
the host contract and the embedded derivative are not closely related,
a separate instrument with the same terms as the embedded derivative
would meet the definition of a derivative and the combined instrument
is not measured at fair value through profit and loss.
On initial designation of the hedge, the Group formally documents the
relationship between the hedging instrument(s) and the hedged item(s),
including the risk management objectives and strategy in undertaking
the hedge transaction, together with the methods that will be used to
assess the effectiveness of the hedging relationship. The Group makes
an assessment, both at the inception of the hedge relationship as well
as on an ongoing basis, whether the hedging instruments are expected
to be “highly effective” in offsetting the changes in the fair value or
cash flows of the respective hedged items during the period for which
the hedge is designated, and whether the actual results of each hedge
are within the range of 80-125%.
Derivatives are recognised initially at fair value; attributable transaction
costs are recognised in the profit or loss statement as incurred. Subse-
quent to initial recognition, derivatives are recognized at fair value and
changes therein are generally recognized in profit and loss, except for:
When a derivative is designated as the hedging instrument in a hedge
of the variability in cash flows attributable to a particular risk associated
with a recognized asset or liability, the effective portion of changes in the
fair value of the derivative is recognized in other comprehensive income
and presented in the hedging reserve in equity. The amount recognized
in other comprehensive income is removed and included in the profit
or loss statement in the same period as the hedged cash flows affect
the profit or loss statement under the same line item as the hedged
item. Any ineffective portion of changes in fair value of the derivative
is recognized immediately in the profit or loss statement. If the hedging
instrument no longer meets the criteria for hedge accounting, expires
or is sold, terminated, exercised, or the designation is revoked, then
the hedge accounting is discontinued prospectively. The cumulative
gain or loss previously recognized in other comprehensive income
remains there until the forecast transaction affects the profit or loss
statement. If the forecast transaction is no longer expected to occur,
than the amount accumulated in equity is reclassified to profit or loss.
d) Goodwill
Goodwill arising upon the acquisition of subsidiaries is included in
intangible assets.
For acquisitions on or after 1 January 2010, the Company measures
goodwill at the acquisition date as: the fair value of the consideration
FINANCIAL REPORT78
transferred; plus the carrying amount of any non-controlling interests
in the acquiree; plus if the business combination is achieved in stages,
the fair value of the existing equity interest in the acquiree; less the
net recognised amount (generally fair value) of the identifiable assets
acquired and liabilities assumed. When the excess is negative, a bargain
purchase gain is recognised immediately in the statement of profit or
loss. The consideration transferred does not include amounts related
to the settlement of pre-existing relationships. Such amounts are gen-
erally recognised in the statement of profit or loss. Costs related to the
acquisition, other than those associated with the issue of debt or equity
securities, that the Company incurs in connection with a business com-
bination are expensed as incurred. Any contingent consideration pay-
able is recognised at fair value at the acquisition date. If the contingent
consideration is classified as equity, it is not remeasured and settlement
is accounted for within equity. Otherwise, subsequent changes to the
fair value of the contingent consideration are recognised in profit or loss.
For acquisitions prior to 1 January 2010, goodwill represents the
excess of the cost of the acquisition over the Company’s interest in
the recognized amount (generally fair value) of the identifiable assets,
liabilities and contingent liabilities of the acquiree. When the excess
was negative, a bargain purchase gain was recognized immediately
in the statement of comprehensive income. Transaction costs, other
than those associated with the issue of debt or equity securities, that
the Company incurred in connection with business combinations were
capitalized as part of the cost of the acquisition.
Subsequently goodwill is measured at cost less accumulated impair-
ment losses. In respect of equity accounted investees, the carrying
amount of goodwill is included in the carrying amount of the investment
and an impairment loss on such an investment is allocated to the
carrying amount of the equity accounted investee as a whole.
e) Intangible assets
Research and development
Expenditure on research activities, undertaken with the prospect of
gaining new scientific or technical knowledge and understanding, is
recognised in profit or loss as incurred. Development activities involve a
plan or design for the production of new or substantially new improved
products and processes.
Development cost is capitalised only if development costs can be
measured reliably, the product or process is technically and commer-
cially feasible, future economic benefits are probable and the Group
intends to and has sufficient resources to complete development and
to use or sell the asset. Otherwise, it is recognised in profit or loss as
incurred. Capitalised development expenditure is measured at cost
less accumulated amortisation and accumulated impairment losses.
Other intangible assets
Other intangible assets (e.g. software,…) acquired by the Group that have
finite useful lives are measured at cost less accumulated amortisations
and accumulated impairment losses. The amortisation is recognized
in the profit or loss statement, and is spread over the useful life of the
relevant intangible assets following the straight-line depreciation
method. The amortization starts from the date that they are available
for use. Amortization methods, useful lives and residual values are
reviewed at each financial year-end and adjusted if appropriate.
Intangible assets with an indefinite useful life or that are not yet avail-
able for use, are subject to an annual impairment test.
Subsequent expenditure
Subsequent expenditure is capitalized only when it increases the future
economic benefits embodied in the specific assets to which it relates.
All other expenditure is recognized in profit or loss as incurred.
f) Property, plant and equipment
Owned assets
Items of property, plant and equipment are stated at cost, which
includes capitalised borrowing costs, less accumulated depreciation
and impairment losses. Cost includes expenditure that is directly attrib-
utable to the acquisition of the asset and to bringing the asset to the
location and condition necessary for its intended use. The cost of
self-constructed assets includes the cost of materials and direct labor,
any other costs directly attributable to bringing the asset to a working
condition for its intended use and capitalized borrowing costs.
Subsequent expenses associated with items of property, plant and
equipment are capitalised only if a future economic advantage will
result from this expenditure and its cost can be measured reliably.
If a part of an item of property, plant and equipment is replaced, the
replacement cost is capitalised and the carrying amount of the replaced
part is derecognized. The costs of the day-today servicing of property,
plant and equipment are recognised in the profit or loss statement as
incurred.
When parts of an item of property, plant and equipment have different
useful lives, they are accounted for as separate items (major compo-
nents) of property, plant and equipment.
Depreciation is calculated over the depreciable amount, which is the
cost of an asset, less its residual value and is recognized in profit or loss.
Vessels or units in the construction process are separately classified on
the balance sheet as vessels under construction. These vessels under
construction are not depreciated, depreciation starts at the moment that
the vessels are delivered. As from the moment of delivery, the vessels
are no longer classified as under construction. The business model of
the Group aims to rent or operate the constructed assets.
The vessels are depreciated on a straight-line basis to their residual
value over their estimated useful life in the Group. The residual value
amounts to USD 0 for all vessels and platforms.
Gas vessels LPG: 30 years
Gas vessels LNG: 35 years
Accommodation platform, second hand: 10-12 years
Accommodation platform, newbuild;- Hull, machinery & deck outfitting- Accommodation
20 years 10 years
NOTES 79
Dry-docking expenses are capitalised when they occur and depreciated
over a period until the next dry-dock.
Other property, plant and equipment are depreciated over their esti-
mated useful life using the straight-line depreciation method. Land is
not depreciated. The estimated depreciation percentages of the various
types of assets are as follows:
The method of depreciation, the residual value, and the useful life values
are reviewed at each financial year-end and adjusted if appropriate.
Leased assets
Lease agreements substantially assigning all risks and rewards inherent
to ownership to the Group, are classified as finance leases. The leased
assets measured at an amount equal to the lower of its fair value and
the present value of the minimum lease payments at inception of the
lease, are subsequently reduced by the accumulated depreciation and
possible impairment losses. The depreciation period matches the useful
life. If there is uncertainty with respect to the transfer of ownership to
the Group at the end of the contract, the asset is fully depreciated over
the shorter of the lease term and its useful life.
g) Investment property
Investment property is measured at historical cost less accumulated
depreciation and accumulated impairment losses.
The depreciation is recognized in the profit or loss statement on a
straight-line basis over the estimated useful lives of the investment
properties.
h) Impairment of assets
Financial assets
Financial assets measured at costFinancial assets measured at cost are assessed, at both individual
and collective level, each reporting date to determine whether there
is objective evidence of impairment. A financial asset is impaired if
objective evidence indicates that a loss event has occurred after initial
recognition of the asset and that the loss event had a negative effect
on the estimated future cash flows of that asset that can be estimated
reliably. When there are no realistic prospects of recovery of the asset,
the relevant amount is written off. In assessing impairment, historical
information on the timing of recoveries and the amount of loss incurred
is used.
An impairment loss in respect of a financial asset measured at amor-
tised cost is calculated as the difference between its carrying amount
and the present value of the estimated future cash flows discounted
Buildings: 3%
Leased real estate: 3%
Plant and equipment: 20%
Furniture: 10%
Cars: 20%
Airplane: 10%
IT equipment: 33%
at the asset’s original effective interest rate. Losses are recognised in
the profit or loss statement. When a subsequent event causes the
amount of impairment loss to decrease, the decrease in impairment
loss is reversed through profit and loss.
Available for sale financial assetsImpairment losses on available-for-sale investment securities are rec-
ognised by transferring the cumulative loss that has been recognised
in other comprehensive income and presented in the fair value reserve
in equity to profit and loss. An impairment loss is recognized in the
profit or loss statement if there is objective evidence of impairment as
a result of one or more events that occurred after the initial recognition
of the asset. The amount reclassified is the difference between the
acquisition cost (net of any principal repayment and amortisation) and
the current fair value, less any impairment loss previously recognised in
profit or loss. If the fair value of an impaired available for sale security
subsequently increases and the increase can be related objectively
to an event occurring after the impairment loss was recognised, than
the impairment loss is reversed through profit or loss, otherwise it is
reversed through OCI.
Equity accounted investeesAfter application of the equity method, the entity applies IAS 39 to
determine whether it is necessary to recognise an impairment loss
with respect to its net investment in the associate or joint venture. An
impairment loss in respect of an equity-accounted investee is meas-
ured by comparing the recoverable amount of the investment with its
carrying amount. An impairment loss is recognised in profit and loss
and is reversed when there is a favourable change in the estimates
used to determine the recoverable amount.
Non-financial assets
The carrying value of non-financial assets, other than deferred tax
assets, are reviewed at each balance sheet date to determine whether
there is an indication of impairment. If any such indication exists, the
asset’s recoverable amount is estimated.
For goodwill and intangible assets that have indefinite lives or that
are not yet available for use the recoverable amount is estimated on
each balance sheet date.
The recoverable amount of an asset or cash-generating unit (CGU)
is the greater of its value in use and its fair value less costs to sell. In
assessing value in use, the estimated future cash flows are discounted
to their present value using a pre-tax discount rate that reflects current
market assessments of the time value of money and the risks spe-
cific to the asset. For the purpose of impairment testing, assets that
cannot be tested individually are grouped together into the smallest
group of assets that generates cash inflows from continuing use that
are largely independent of the cash inflows of other assets or CGUs.
The goodwill acquired in a business combination, for the purpose
of impairment testing, is allocated to cash-generating units that are
expected to benefit from the synergies of the combination.
An impairment loss is recognised if the carrying amount of an
asset or its cash-generating unit exceeds its estimated recoverable
amount. All impairment losses are recognised in the profit or loss
statement.
FINANCIAL REPORT80
Impairment losses recognized in respect of cash-generating units are
allocated first to reduce the carrying amount of any goodwill allocated
to the units and then to reduce the carrying amount of the other assets
in the unit (group of units) on a pro rata basis.
An impairment loss in respect of goodwill is not reversed. In respect
of other assets, impairment losses in prior periods are assessed at
each reporting date for indications that the loss has decreased or
no longer exists. An impairment loss is reversed if there has been a
change in the estimates used to determine the recoverable amount. An
impairment loss is reversed only to the extent that the asset’s carrying
amount does not exceed the carrying amount that would have been
determined, net of depreciation or amortisation, if no impairment loss
had been recognised.
i) Assets held for sale
Non-current assets, or disposal groups comprising assets and liabilities,
that are expected to be recovered primarily through sale rather than
through continuing use, are classified as held for sale. Immediately
before classification as held for sale, the assets (or components of a dis-
posal group) are remeasured in accordance with the Group’s accounting
policies. Thereafter the assets (or disposal group) are measured at the
lower of their carrying amount and fair value less cost to sell. Any
impairment loss on a disposal group is allocated first to goodwill, and
then to the remaining assets and liabilities on a pro rata basis except
that no loss is allocated to assets not in the measurement scope of IFRS
5, which continue to be measured in accordance with the Group’s other
accounting policies. Intangible assets, property, plant and equipment
and investment property once classified as held for sale or distribution
are not amortised or depreciated. In addition, equity accounting of
equity-accounted investees ceases once classified as held for sale
or distribution.
j) Employee benefits
Defined contribution plans
Obligations for contributions to defined contribution pension plans are
recognised as an expense in the profit or loss statement as the related
service is provided.
Defined benefit plans
The Group’s net obligation in respect of defined benefit pension plans is
calculated separately for each plan by estimating the amount of future
benefit that employees have earned in return for their service in the
current and prior periods; discounting that amount and deducting the
fair value of any plan assets. The calculation is performed annually by
a qualified actuary using the projected unit credit method. When the
calculation results in a potential asset for the Group, the recognized
asset is limited to the present value of economic benefits available in
the form of any future refunds from the plan or reductions in future
contributions to the plan. To calculate the present value of economic
benefits, consideration is given to any applicable minimum funding
requirements.
Remeasurements of the net defined benefit liability, which comprise
actuarial gains and losses, the return on plan assets (excluding interest)
and the effect of the asset ceiling (if any, excluding interest), are rec-
ognised immediately in OCI. The Group determines the net interest
expense (income) on the net defined benefit liability (asset) for the
period by applying the discount rate used to measure the defined
benefit obligation at the beginning of the annual period to the then net
defined benefit liability (asset), taking into account any changes in
the net defined benefit liability (asset) during the period as a result of
contributions and benefit payments. Net Interest expense and other
expenses related to defined benefit plans are recognised in profit or loss.
When the benefits of a plan are changed or when a plan is curtailed,
the resulting change in benefit that relates to past service or the gain
or loss on curtailment is recognised immediately in profit or loss. The
Group recognises gains and losses on the settlement of a defined
benefit plan when the settlement occurs.
Belgian defined contribution plans with return guaranteed by law
Belgian defined contribution plans are subject to the Law of April
28, 2003 on occupational pensions (hereafter ‘the WAP’). According
to article 24 of this Law, the employer has to guarantee an average
minimum return of 3.75% on employee contributions and of 3.25% on
employer contributions and this for contributions paid until 31/12/2015.
As from January 2016, the employer has to guarantee an average
minimum return of 1,75% on both employer and employee contributions
(as changed by the Law of 18 December 2015). This guaranteed
mini mum return generally exceeds the return that is normally guaran-
teed by the insurer. Because the employer has to guarantee the statu-
tory minimum return on these plans, not all actuarial and investment
risks relating to these plans are transferred to the insurance company
managing the plans. Therefore these plans do not meet the definition of
defined contribution plan under IFRS and have to be classified by default
as defined benefit plans. An actuarial calculation has been performed
in accordance with IAS 19 based on the projected unit credit method.
Termination benefits
Termination benefits are recognised as an expense when the Group is
demonstrably committed, without realistic possibility or withdrawal,
to a formal detailed plan to either terminate employment before the
normal retirement date, or to provide termination benefits as a result
of an offer made to encourage voluntary redundancy. Termination
benefits for voluntary redundancies are recognised as an expense if
the Group has made an offer of voluntary redundancy, it is probable
that the offer will be accepted, and the number of acceptances can be
estimated reliably. If benefits are payable more than 12 months after
the reporting date, then they are discounted to their present value.
Short-term employee benefit
Short-term employee benefit obligations are measured on an undis-
counted basis and are expensed as the related service is provided. A
liability is recognised for the amount expected to be paid under
short-term cash bonus or profit-sharing plans if the Group has a present
legal or constructive obligation to pay this amount as a result of past
service provided by the employee, and the obligation can be estimated
reliably.
Share-based payment transactions
The grant date fair value of options granted to employees is recognised
as an employee expense, with a corresponding increase in equity,
over the period that the employees unconditionally become entitled
to the options. The amounts recognised as an expense is adjusted to
reflect the actual number of options for which the related service and
non-market vesting conditions are expected to be met, such that the
NOTES 81
amount ultimately recognised as an expense is based on the number of
awards that do meet the related service and non-market performance
conditions at vesting date.
k) Provisions
A provision is recognised in the statement of financial position when the
Group has a legal or constructive obligation as result of a past event,
that can be estimated reliably and it is probable that an outflow of
benefits will be required to settle the obligation. If the effect is material,
provisions are determined by discounting the expected future cash
flows at a pre-tax rate that reflects current market assessments of
the time value of money and, where appropriate, the risks specific
to the liability.
Restructuring provisions
Provisions for restructuring are recognised when the Group has approved
a detailed and formal restructuring plan, and the restructuring has either
commenced or has been announced publicly. Future operating costs
are not provided for.
Onerous contracts
A provision for onerous contracts is recognised when the expected
benefits to be derived by the Group from a contract are lower than
the unavoidable cost of meeting its obligations under the contract.
The provision is measured at the present value of the lower of the
expected cost of terminating the contract and the expected net cost
of continuing with the contract. Before a provision is established, the
Group recognises any impairment loss on the assets associated with
that contract.
l) Income
Revenues from assets sold and services rendered
The company and/ or its joint ventures generate revenues from char-
terers for the use of its assets. Assets are chartered using voyage/
spot, time or bareboat charters. For voyage/spot charters, a contract is
closed in the spot market for the use of an asset for a specific voyage
at a contractual agreed rate per metric tonnes transported. For time
or bareboat charters, a contract is entered into for the use of an asset
for a specific period of time at a contractual agreed daily or monthly
rate. Revenue is recognised on a straight line basis over the duration
of each voyage, time or bareboat charter.
Revenue from the sale of assets is recognised in the profit or loss
statement when the significant risks and rewards of ownership have
been transferred to the buyer, recovery of the consideration is probable,
the associated costs and possible return of goods can be estimated
reliably, there is no continuing management involvement with the
assets, and the amount of revenue can be measured reliably. The
timing of the transfer of risks and rewards can vary depending on the
individual terms of the sales agreement.
Revenue from services rendered is recognised in the profit or loss
statement in proportion to the stage of completion of the transaction
at the balance sheet date.
No revenue is recognised if there are significant uncertainties regarding
recovery of the consideration due and associated costs.
Commissions: if the group acts in the capacity of an agent rather than
as a principal in the transaction, then the revenue recognised is the
net amount of commission made by the Group.
Rental income from investment property is recognised in the profit
or loss statement on a straightline basis over the term of the lease
agreement.
m) Leases
Determining whether an arrangement contains a lease
At inception of an arrangement, the Group determines whether the
arrangement is or contains a lease.
At inception or on reassessment of an arrangement that contains a
lease, the Group separates payments and other considerations required
by the arrangement into those for the lease and those for other elements
on the basis of their relative fair value. If the Group concludes for a
finance lease that it is impractible to separate the payments reliably,
than an asset and a liability are recognised at an amount equal to
the fair value of the underlying asset. Subsequently, the liability is
reduced as payments are made and an imputed finance cost on the
liability is recognised.
Leased assets
Leases of assets that transfer to the Group substantially all of the risks
and rewards of ownership are classified as finance leases. The leased
assets are measured initially at the lower of fair value and the present
value of the minimum lease payments. Subsequent to initial recogni-
tion, the assets are accounted for in accordance with the accounting
policy applicable to that asset. Assets held under other leases are
classified as an operating lease and are not recognised in the statement
of financial position.
Operating lease payments
Payments made under operating leases are recognised in the statement
of profit or loss on a straight-line basis over the term of the lease. Lease
incentives received are recognised as an integral part of the total lease
expense, over the term of the lease.
Finance lease payments
Minimum lease payments made as lessee under finance leases are
apportioned between the finance expense and the reduction of the
outstanding liability. The finance expense is allocated to each period
during the lease term so as to produce a constant periodic rate of
interest on the remaining balance of the liability. The Group does not
have financial lease contracts acting as lessor.
Contingent lease payments are accounted for in profit or loss except
when they relate to future benefits in which case the minimum lease
payments are revised over the remaining term of the lease when the
lease adjustment is confirmed.
n) Government grants
Government grants are recognised initially as deferred income at fair
value when there is a reasonable assurance that they will be received
and the Group will comply with the conditions associated with the grant
FINANCIAL REPORT82
and are then recognised in profit and loss as other income on a sys-
tematic basis over the useful life of the asset. Grants that compensate
the Group for expenses incurred are recognised in profit or loss on a
systematic basis in the periods in which the expenses are recognised.
o) Finance income and expenses
Finance income consists of interests received, dividend income, gains
on the disposal of availablefor-sale financial assets, changes in the
fair value of financial assets at fair value through profit or loss, and
gains on hedging instruments that are recognised in profit or loss and
exchange rate gains. Interest income is recognised in the profit or loss
statement as it accrues, taking into account the effective yield on the
asset. Dividend income is recognised in the profit or loss statement on
the date that the dividend is declared.
Finance expenses consist of interest expense on borrowings, unwinding
of the discount on provisions, changes in the fair value of financial assets
at fair value through profit or loss, impairment losses recognised on
financial assets, exchange rate losses and losses on hedging instru-
ments that are recognised in profit or loss.
Borrowing costs that are not directly attributable to the acquisition,
construction or production of a qualifying asset are recognised in profit
or loss using the effective interest method. Foreign currency gains and
losses are reported on a net basis per currency as either other finance
income or finance expense.
p) Taxes
Income tax expense consists of current and deferred taxes. Current and
deferred tax is recognized in the profit or loss statement, except to the
extent it relates to a business combination, or when they relate to items
that are recognised directly in equity or in other comprehensive income.
Current tax is the expected tax payable or receivable on the taxable
income or loss of the year, using tax rates enacted or substantively
enacted at the reporting date, and any adjustment to tax payable in
respect of previous years. Current tax assets and liabilities are offset
only if certain criteria are met.
Deferred tax is recognised on all temporary differences between the
carrying amounts of assets and liabilities for reporting purposes and the
amounts used for taxation purposes. The following temporary differ-
ences are not provided for: the initial recognition of goodwill, the initial
recognition of assets or liabilities in a transaction that is not a business
combination and that affects neither accounting, nor taxable profit,
and differences relating to investments in subsidiaries, associates and
joint arrangements to the extent that the Group is able to control the
timing of reversal and it is probable that they will not reverse in the
foreseeable future.
Deferred tax is measured at the tax rates that are expected to be
applied to temporary differences when they reverse, based on the
laws that have been enacted or substantively enacted by the reporting
date. Deferred tax assets are recognised for unused tax losses, tax
credits and deductible temporary differences, to the extent that it is
probable that future taxable profits will be available against which
they can be utilised.
Deferred tax assets are reduced when it is no longer probable that the
related tax benefits will be realized. Unrecognized deferred tax assets
are reassessed at each reporting date and recognized to the extent
that is has become probable that future taxable profits will be available
against which they can be used. Deferred tax assets and liabilities are
offset only if certain conditions are met.
Tonnage tax is not accounted for as income taxes in accordance with
IAS 12 and is not presented as part of income tax expense in the profit
or loss statement but is shown under other operating expenses.
q) Segment reporting
An operating segment is a component of the Group that engages
in business activities from which it may earn revenues and incur
expenses, including revenues and expenses that relate to transactions
with any of the Group’s other components. All operating segments’
operating results are reviewed regularly by management to make
decisions about resources to be allocated to the segment and assess
its performance.
The result for each segment includes all income and expenses gene-
rated directly by this segment, as well as part of the income and
expenses that can reasonably be allocated to this segment. The assets
and liabilities allocated to a segment include as a minimum the assets
and liabilities which are periodically reported to the Chief operating
decision maker, being the Group’s CEO and the Executive Committee.
Segment capital expenditure is the total cost incurred during the period
to acquire property, plant and equipment and intangible assets other
than goodwill.
r) Earnings per share
The Group presents basic and diluted earnings per share for its ordi-
nary shares. Basic earnings per share is calculated by dividing the
profit or loss attributable to ordinary shareholders of the Company by
the weighted average number of ordinary shares outstanding during
the period, adjusted for treasury shares held. Diluted earnings per
share is determined by adjusting the profit and loss attributable to
ordinary shareholders and the weighted average of ordinary shares
outstanding, adjusted for treasury shares held and for the effects of
all dilutive potential ordinary shares such as share options granted
to employees.
s) Discontinued operations
A discontinued operation is a component of the Group’s business, the
operations and cash flows of which can be clearly distinguished from
the rest of the Group and which represents a separate major line of
business or geographical area of operations that has been disposed
of or is held for sale; is part of a single co-ordinated plan to dispose
of a separate major line of business or geographic area of operations
or is a subsidiary acquired exclusively with a view to re-sale. Clas-
sification of a discontinued operation occurs upon disposal or when
the operation meets the criteria to be classified as held for sale, if
earlier. When an operation is classified as a discontinued operation,
the comparative profit or loss statement is restated as if the operation
had been discontinued from the start of the comparative period.
NOTES 83
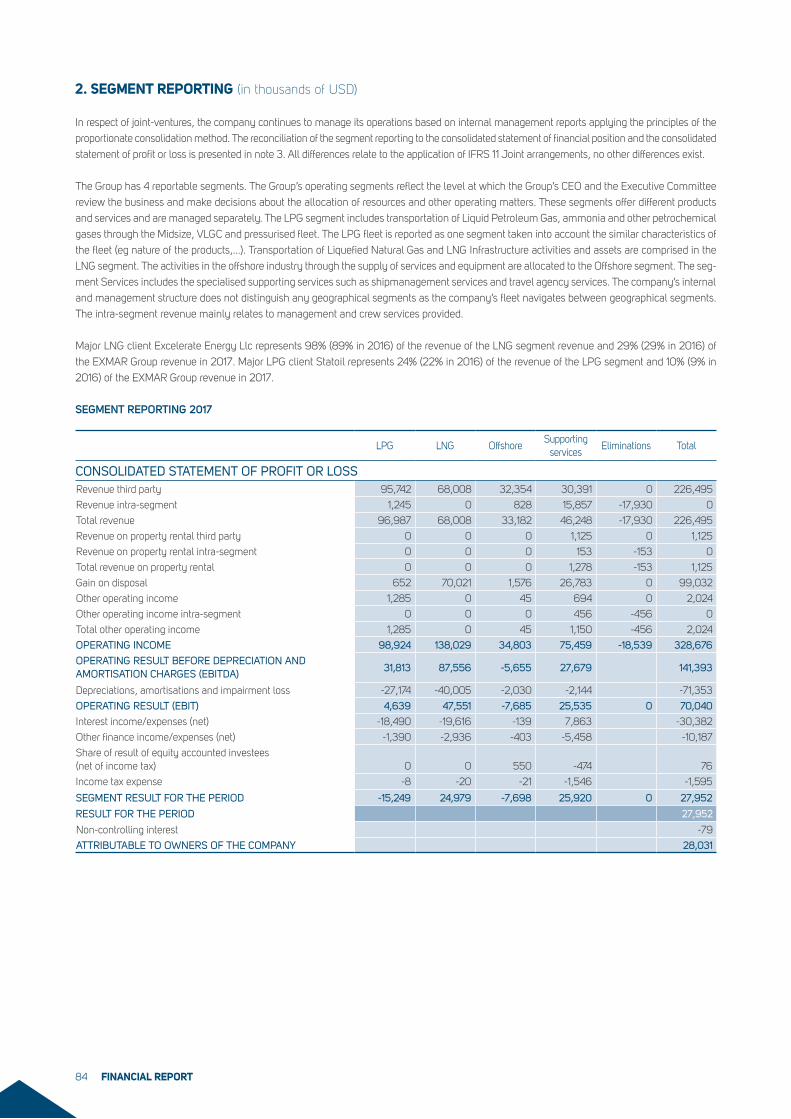
2. SEGMENT REPORTING (in thousands of USD)
In respect of joint-ventures, the company continues to manage its operations based on internal management reports applying the principles of the
proportionate consolidation method. The reconciliation of the segment reporting to the consolidated statement of financial position and the consolidated
statement of profit or loss is presented in note 3. All differences relate to the application of IFRS 11 Joint arrangements, no other differences exist.
The Group has 4 reportable segments. The Group’s operating segments reflect the level at which the Group’s CEO and the Executive Committee
review the business and make decisions about the allocation of resources and other operating matters. These segments offer different products
and services and are managed separately. The LPG segment includes transportation of Liquid Petroleum Gas, ammonia and other petrochemical
gases through the Midsize, VLGC and pressurised fleet. The LPG fleet is reported as one segment taken into account the similar characteristics of
the fleet (eg nature of the products,...). Transportation of Liquefied Natural Gas and LNG Infrastructure activities and assets are comprised in the
LNG segment. The activities in the offshore industry through the supply of services and equipment are allocated to the Offshore segment. The seg-
ment Services includes the specialised supporting services such as shipmanagement services and travel agency services. The company’s internal
and management structure does not distinguish any geographical segments as the company’s fleet navigates between geographical segments.
The intra-segment revenue mainly relates to management and crew services provided.
Major LNG client Excelerate Energy Llc represents 98% (89% in 2016) of the revenue of the LNG segment revenue and 29% (29% in 2016) of
the EXMAR Group revenue in 2017. Major LPG client Statoil represents 24% (22% in 2016) of the revenue of the LPG segment and 10% (9% in
2016) of the EXMAR Group revenue in 2017.
SEGMENT REPORTING 2017
LPG LNG OffshoreSupporting
servicesEliminations Total
CONSOLIDATED STATEMENT OF PROFIT OR LOSSRevenue third party 95,742 68,008 32,354 30,391 0 226,495
Revenue intra-segment 1,245 0 828 15,857 -17,930 0
Total revenue 96,987 68,008 33,182 46,248 -17,930 226,495
Revenue on property rental third party 0 0 0 1,125 0 1,125
Revenue on property rental intra-segment 0 0 0 153 -153 0
Total revenue on property rental 0 0 0 1,278 -153 1,125
Gain on disposal 652 70,021 1,576 26,783 0 99,032
Other operating income 1,285 0 45 694 0 2,024
Other operating income intra-segment 0 0 0 456 -456 0
Total other operating income 1,285 0 45 1,150 -456 2,024
OPERATING INCOME 98,924 138,029 34,803 75,459 -18,539 328,676
OPERATING RESULT BEFORE DEPRECIATION AND AMORTISATION CHARGES (EBITDA)
31,813 87,556 -5,655 27,679 141,393
Depreciations, amortisations and impairment loss -27,174 -40,005 -2,030 -2,144 -71,353
OPERATING RESULT (EBIT) 4,639 47,551 -7,685 25,535 0 70,040
Interest income/expenses (net) -18,490 -19,616 -139 7,863 -30,382
Other finance income/expenses (net) -1,390 -2,936 -403 -5,458 -10,187
Share of result of equity accounted investees (net of income tax) 0 0 550 -474 76
Income tax expense -8 -20 -21 -1,546 -1,595
SEGMENT RESULT FOR THE PERIOD -15,249 24,979 -7,698 25,920 0 27,952
RESULT FOR THE PERIOD 27,952
Non-controlling interest -79
ATTRIBUTABLE TO OWNERS OF THE COMPANY 28,031
FINANCIAL REPORT84
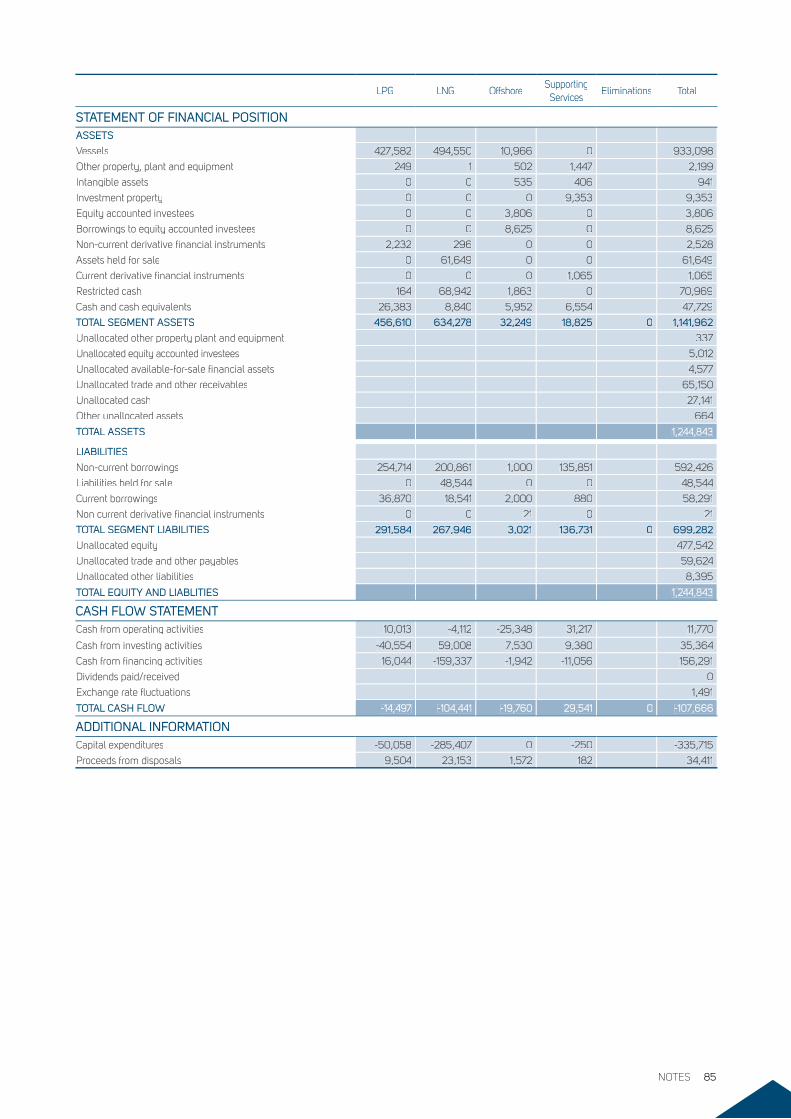
LPG LNG OffshoreSupporting
ServicesEliminations Total
STATEMENT OF FINANCIAL POSITIONASSETSASSETS
Vessels 427,582 494,550 10,966 0 933,098
Other property, plant and equipment 249 1 502 1,447 2,199
Intangible assets 0 0 535 406 941
Investment property 0 0 0 9,353 9,353
Equity accounted investees 0 0 3,806 0 3,806
Borrowings to equity accounted investees 0 0 8,625 0 8,625
Non-current derivative financial instruments 2,232 296 0 0 2,528
Assets held for sale 0 61,649 0 0 61,649
Current derivative financial instruments 0 0 0 1,065 1,065
Restricted cash 164 68,942 1,863 0 70,969
Cash and cash equivalents 26,383 8,840 5,952 6,554 47,729
TOTAL SEGMENT ASSETSTOTAL SEGMENT ASSETS 456,610 634,278 32,249 18,825 0 1,141,962
Unallocated other property plant and equipment 337
Unallocated equity accounted investees 5,012
Unallocated available-for-sale financial assets 4,577
Unallocated trade and other receivables 65,150
Unallocated cash 27,141
Other unallocated assets 664
TOTAL ASSETS 1,244,843
LIABILITIES
Non-current borrowings 254,714 200,861 1,000 135,851 592,426
Liabilities held for sale 0 48,544 0 0 48,544
Current borrowings 36,870 18,541 2,000 880 58,291
Non current derivative financial instruments 0 0 21 0 21
TOTAL SEGMENT LIABILITIESTOTAL SEGMENT LIABILITIES 291,584 267,946 3,021 136,731 0 699,282
Unallocated equity 477,542
Unallocated trade and other payables 59,624
Unallocated other liabilities 8,395
TOTAL EQUITY AND LIABLITIESTOTAL EQUITY AND LIABLITIES 1,244,843
CASH FLOW STATEMENTCash from operating activities 10,013 -4,112 -25,348 31,217 11,770
Cash from investing activities -40,554 59,008 7,530 9,380 35,364
Cash from financing activities 16,044 -159,337 -1,942 -11,056 156,291
Dividends paid/received 0
Exchange rate fluctuations 1,491
TOTAL CASH FLOWTOTAL CASH FLOW -14,497 -104,441 -19,760 29,541 0 -107,666
ADDITIONAL INFORMATIONADDITIONAL INFORMATIONCapital expenditures -50,058 -285,407 0 -250 -335,715
Proceeds from disposals 9,504 23,153 1,572 182 34,411
NOTES 85
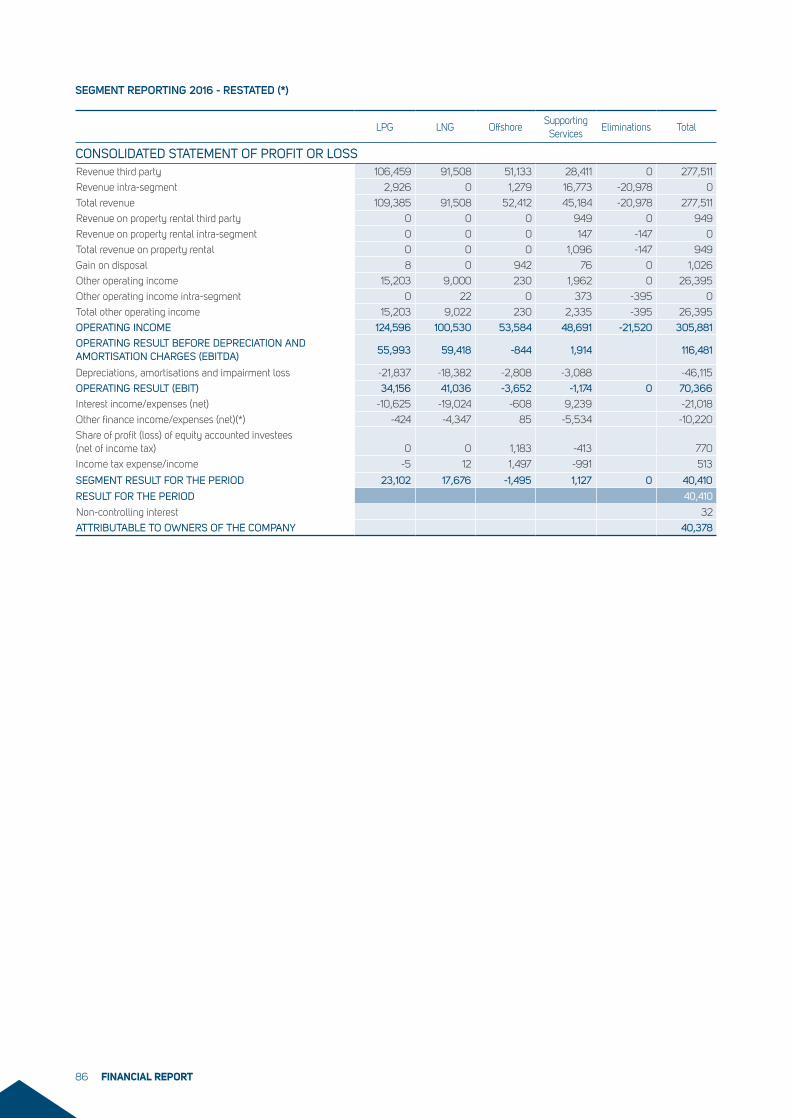
SEGMENT REPORTING 2016 - RESTATED (*)
LPG LNG OffshoreSupporting
ServicesEliminations Total
CONSOLIDATED STATEMENT OF PROFIT OR LOSSRevenue third party 106,459 91,508 51,133 28,411 0 277,511
Revenue intra-segment 2,926 0 1,279 16,773 -20,978 0
Total revenue 109,385 91,508 52,412 45,184 -20,978 277,511
Revenue on property rental third party 0 0 0 949 0 949
Revenue on property rental intra-segment 0 0 0 147 -147 0
Total revenue on property rental 0 0 0 1,096 -147 949
Gain on disposal 8 0 942 76 0 1,026
Other operating income 15,203 9,000 230 1,962 0 26,395
Other operating income intra-segment 0 22 0 373 -395 0
Total other operating income 15,203 9,022 230 2,335 -395 26,395
OPERATING INCOME 124,596 100,530 53,584 48,691 -21,520 305,881
OPERATING RESULT BEFORE DEPRECIATION AND AMORTISATION CHARGES (EBITDA)
55,993 59,418 -844 1,914 116,481
Depreciations, amortisations and impairment loss -21,837 -18,382 -2,808 -3,088 -46,115
OPERATING RESULT (EBIT) 34,156 41,036 -3,652 -1,174 0 70,366
Interest income/expenses (net) -10,625 -19,024 -608 9,239 -21,018
Other finance income/expenses (net)(*) -424 -4,347 85 -5,534 -10,220
Share of profit (loss) of equity accounted investees (net of income tax) 0 0 1,183 -413 770
Income tax expense/income -5 12 1,497 -991 513
SEGMENT RESULT FOR THE PERIOD 23,102 17,676 -1,495 1,127 0 40,410
RESULT FOR THE PERIOD 40,410
Non-controlling interest 32
ATTRIBUTABLE TO OWNERS OF THE COMPANY 40,378
FINANCIAL REPORT86
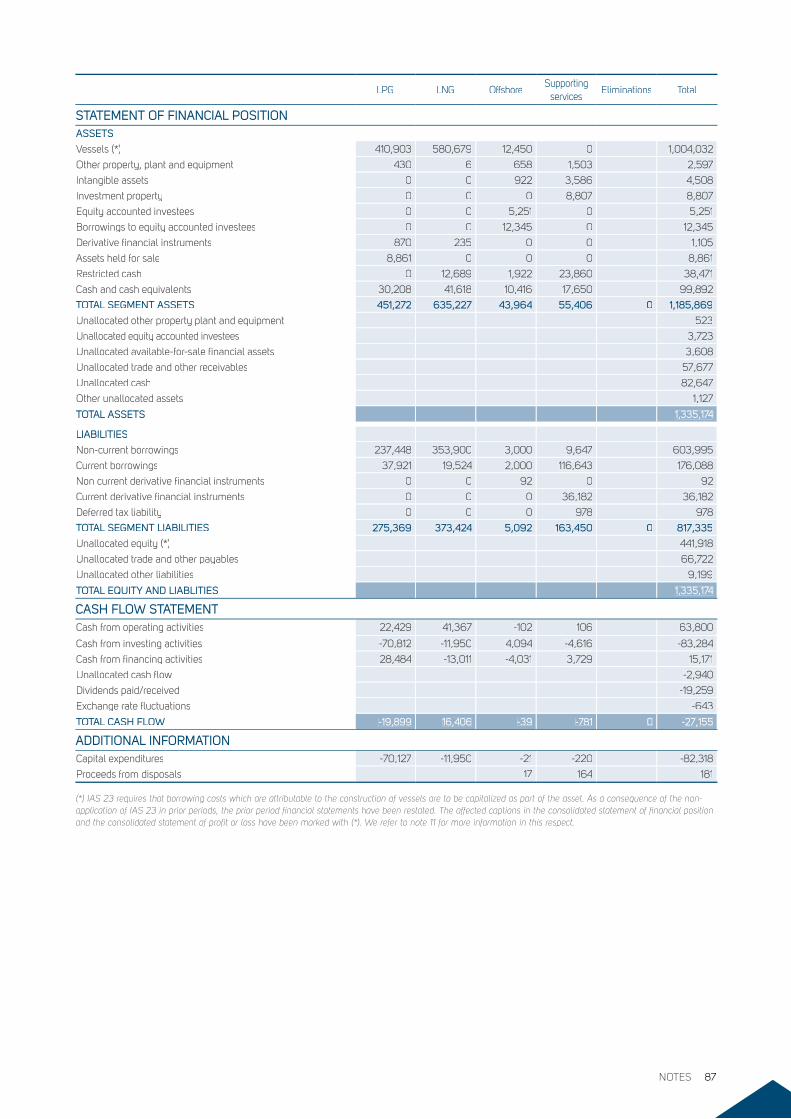
LPG LNG OffshoreSupporting
servicesEliminations Total
STATEMENT OF FINANCIAL POSITIONASSETSASSETS
Vessels (*) 410,903 580,679 12,450 0 1,004,032
Other property, plant and equipment 430 6 658 1,503 2,597
Intangible assets 0 0 922 3,586 4,508
Investment property 0 0 0 8,807 8,807
Equity accounted investees 0 0 5,251 0 5,251
Borrowings to equity accounted investees 0 0 12,345 0 12,345
Derivative financial instruments 870 235 0 0 1,105
Assets held for sale 8,861 0 0 0 8,861
Restricted cash 0 12,689 1,922 23,860 38,471
Cash and cash equivalents 30,208 41,618 10,416 17,650 99,892
TOTAL SEGMENT ASSETSTOTAL SEGMENT ASSETS 451,272 635,227 43,964 55,406 0 1,185,869
Unallocated other property plant and equipment 523
Unallocated equity accounted investees 3,723
Unallocated available-for-sale financial assets 3,608
Unallocated trade and other receivables 57,677
Unallocated cash 82,647
Other unallocated assets 1,127
TOTAL ASSETS 1,335,174
LIABILITIES
Non-current borrowings 237,448 353,900 3,000 9,647 603,995
Current borrowings 37,921 19,524 2,000 116,643 176,088
Non current derivative financial instruments 0 0 92 0 92
Current derivative financial instruments 0 0 0 36,182 36,182
Deferred tax liability 0 0 0 978 978
TOTAL SEGMENT LIABILITIESTOTAL SEGMENT LIABILITIES 275,369 373,424 5,092 163,450 0 817,335
Unallocated equity (*) 441,918
Unallocated trade and other payables 66,722
Unallocated other liabilities 9,199
TOTAL EQUITY AND LIABLITIESTOTAL EQUITY AND LIABLITIES 1,335,174
CASH FLOW STATEMENTCash from operating activities 22,429 41,367 -102 106 63,800
Cash from investing activities -70,812 -11,950 4,094 -4,616 -83,284
Cash from financing activities 28,484 -13,011 -4,031 3,729 15,171
Unallocated cash flow -2,940
Dividends paid/received -19,259
Exchange rate fluctuations -643
TOTAL CASH FLOW -19,899 16,406 -39 -781 0 -27,155
ADDITIONAL INFORMATIONADDITIONAL INFORMATIONCapital expenditures -70,127 -11,950 -21 -220 -82,318
Proceeds from disposals 17 164 181
(*) IAS 23 requires that borrowing costs which are attributable to the construction of vessels are to be capitalized as part of the asset. As a consequence of the non-application of IAS 23 in prior periods, the prior period financial statements have been restated. The affected captions in the consolidated statement of financial position and the consolidated statement of profit or loss have been marked with (*). We refer to note 11 for more information in this respect.
NOTES 87
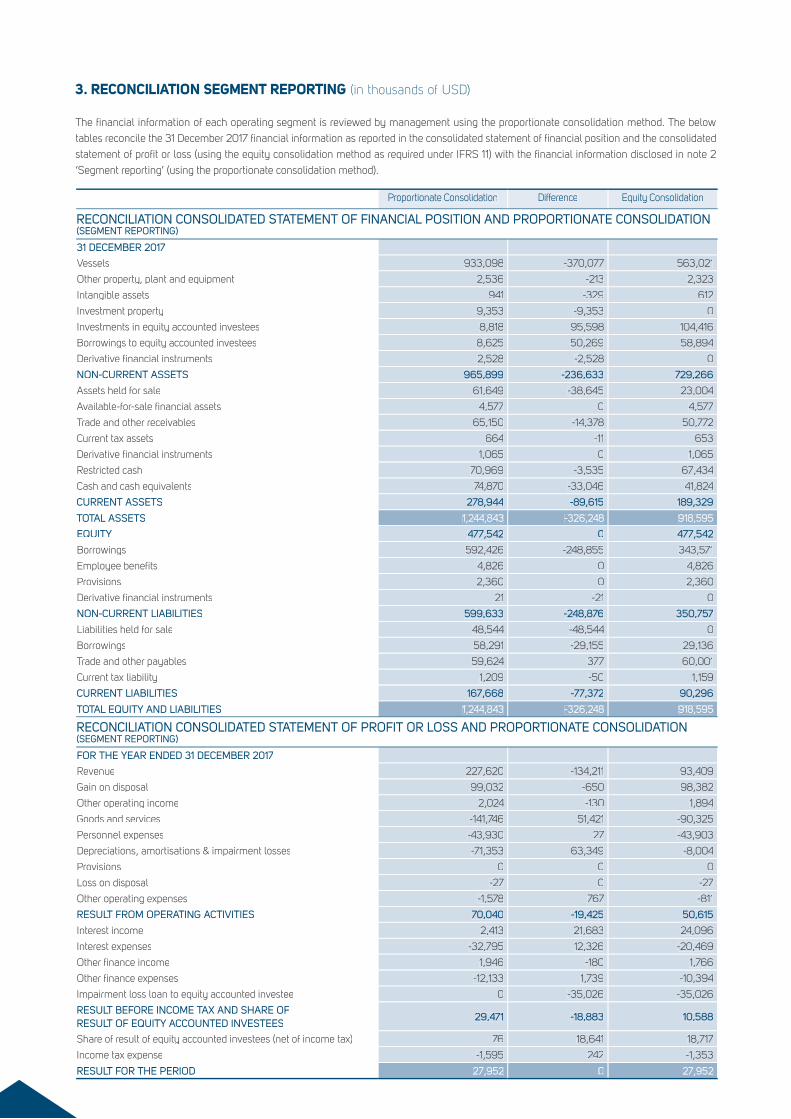
3. RECONCILIATION SEGMENT REPORTING (in thousands of USD)
The financial information of each operating segment is reviewed by management using the proportionate consolidation method. The below
tables reconcile the 31 December 2017 financial information as reported in the consolidated statement of financial position and the consolidated
statement of profit or loss (using the equity consolidation method as required under IFRS 11) with the financial information disclosed in note 2
‘Segment reporting’ (using the proportionate consolidation method).
Proportionate Consolidation Difference Equity Consolidation
RECONCILIATION CONSOLIDATED STATEMENT OF FINANCIAL POSITION AND PROPORTIONATE CONSOLIDATION (SEGMENT REPORTING)
31 DECEMBER 2017
Vessels 933,098 -370,077 563,021
Other property, plant and equipment 2,536 -213 2,323
Intangible assets 941 -329 612
Investment property 9,353 -9,353 0
Investments in equity accounted investees 8,818 95,598 104,416
Borrowings to equity accounted investees 8,625 50,269 58,894
Derivative financial instruments 2,528 -2,528 0
NON-CURRENT ASSETS 965,899 -236,633 729,266
Assets held for sale 61,649 -38,645 23,004
Available-for-sale financial assets 4,577 0 4,577
Trade and other receivables 65,150 -14,378 50,772
Current tax assets 664 -11 653
Derivative financial instruments 1,065 0 1,065
Restricted cash 70,969 -3,535 67,434
Cash and cash equivalents 74,870 -33,046 41,824
CURRENT ASSETS 278,944 -89,615 189,329
TOTAL ASSETSTOTAL ASSETS 1,244,843 -326,248 918,595
EQUITY 477,542 0 477,542
Borrowings 592,426 -248,855 343,571
Employee benefits 4,826 0 4,826
Provisions 2,360 0 2,360
Derivative financial instruments 21 -21 0
NON-CURRENT LIABILITIES 599,633 -248,876 350,757
Liabilities held for sale 48,544 -48,544 0
Borrowings 58,291 -29,155 29,136
Trade and other payables 59,624 377 60,001
Current tax liability 1,209 -50 1,159
CURRENT LIABILITIES 167,668 -77,372 90,296
TOTAL EQUITY AND LIABILITIESTOTAL EQUITY AND LIABILITIES 1,244,843 -326,248 918,595
RECONCILIATION CONSOLIDATED STATEMENT OF PROFIT OR LOSS AND PROPORTIONATE CONSOLIDATION (SEGMENT REPORTING)
FOR THE YEAR ENDED 31 DECEMBER 2017
Revenue 227,620 -134,211 93,409
Gain on disposal 99,032 -650 98,382
Other operating income 2,024 -130 1,894
Goods and services -141,746 51,421 -90,325
Personnel expenses -43,930 27 -43,903
Depreciations, amortisations & impairment losses -71,353 63,349 -8,004
Provisions 0 0 0
Loss on disposal -27 0 -27
Other operating expenses -1,578 767 -811
RESULT FROM OPERATING ACTIVITIES 70,040 -19,425 50,615
Interest income 2,413 21,683 24,096
Interest expenses -32,795 12,326 -20,469
Other finance income 1,946 -180 1,766
Other finance expenses -12,133 1,739 -10,394
Impairment loss loan to equity accounted investee 0 -35,026 -35,026
RESULT BEFORE INCOME TAX AND SHARE OF RESULT OF EQUITY ACCOUNTED INVESTEES
29,471 -18,883 10,588
Share of result of equity accounted investees (net of income tax) 76 18,641 18,717
Income tax expense -1,595 242 -1,353
RESULT FOR THE PERIOD 27,952 0 27,952
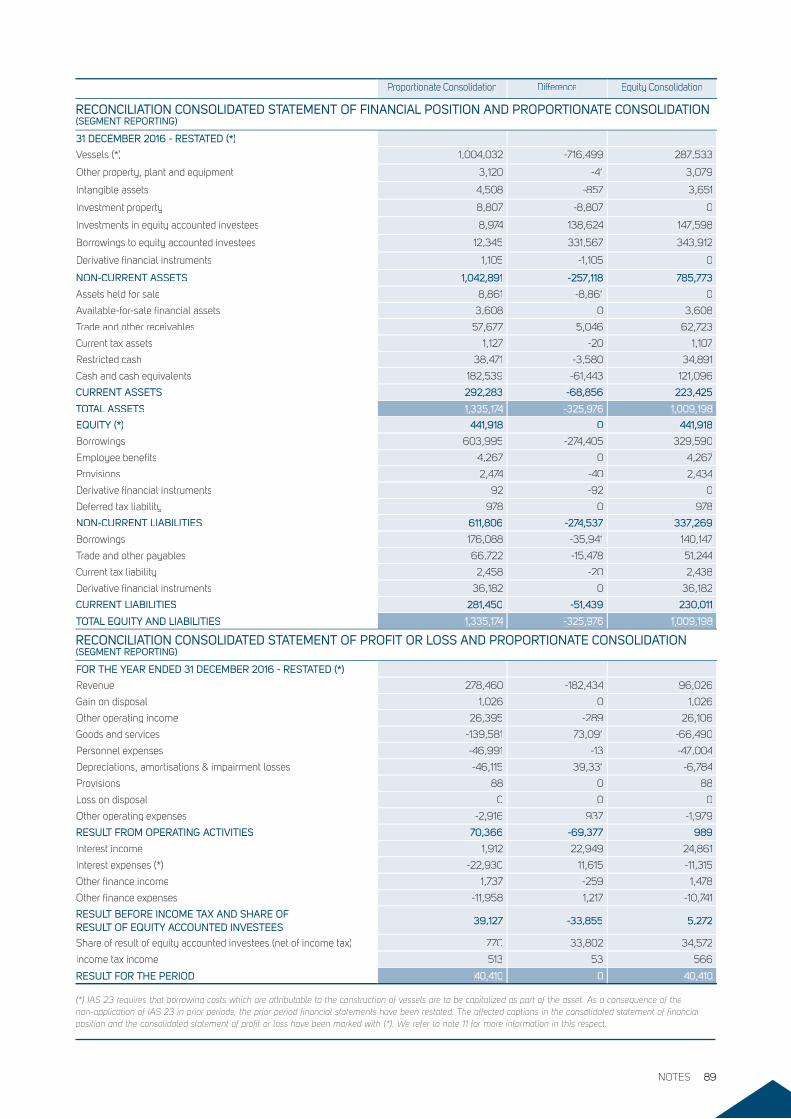
Proportionate Consolidation Difference Equity Consolidation
RECONCILIATION CONSOLIDATED STATEMENT OF FINANCIAL POSITION AND PROPORTIONATE CONSOLIDATION (SEGMENT REPORTING)
31 DECEMBER 2016 - RESTATED (*)
Vessels (*) 1,004,032 -716,499 287,533
Other property, plant and equipment 3,120 -41 3,079
Intangible assets 4,508 -857 3,651
Investment property 8,807 -8,807 0
Investments in equity accounted investees 8,974 138,624 147,598
Borrowings to equity accounted investees 12,345 331,567 343,912
Derivative financial instruments 1,105 -1,105 0
NON-CURRENT ASSETS 1,042,891 -257,118 785,773
Assets held for sale 8,861 -8,861 0
Available-for-sale financial assets 3,608 0 3,608
Trade and other receivables 57,677 5,046 62,723
Current tax assets 1,127 -20 1,107
Restricted cash 38,471 -3,580 34,891
Cash and cash equivalents 182,539 -61,443 121,096
CURRENT ASSETS 292,283 -68,856 223,425
TOTAL ASSETSTOTAL ASSETS 1,335,174 -325,976 1,009,198
EQUITY (*) 441,918 0 441,918
Borrowings 603,995 -274,405 329,590
Employee benefits 4,267 0 4,267
Provisions 2,474 -40 2,434
Derivative financial instruments 92 -92 0
Deferred tax liability 978 0 978
NON-CURRENT LIABILITIES 611,806 -274,537 337,269
Borrowings 176,088 -35,941 140,147
Trade and other payables 66,722 -15,478 51,244
Current tax liability 2,458 -20 2,438
Derivative financial instruments 36,182 0 36,182
CURRENT LIABILITIES 281,450 -51,439 230,011
TOTAL EQUITY AND LIABILITIESTOTAL EQUITY AND LIABILITIES 1,335,174 -325,976 1,009,198
RECONCILIATION CONSOLIDATED STATEMENT OF PROFIT OR LOSS AND PROPORTIONATE CONSOLIDATION (SEGMENT REPORTING)
FOR THE YEAR ENDED 31 DECEMBER 2016 - RESTATED (*)
Revenue 278,460 -182,434 96,026
Gain on disposal 1,026 0 1,026
Other operating income 26,395 -289 26,106
Goods and services -139,581 73,091 -66,490
Personnel expenses -46,991 -13 -47,004
Depreciations, amortisations & impairment losses -46,115 39,331 -6,784
Provisions 88 0 88
Loss on disposal 0 0 0
Other operating expenses -2,916 937 -1,979
RESULT FROM OPERATING ACTIVITIES 70,366 -69,377 989
Interest income 1,912 22,949 24,861
Interest expenses (*) -22,930 11,615 -11,315
Other finance income 1,737 -259 1,478
Other finance expenses -11,958 1,217 -10,741
RESULT BEFORE INCOME TAX AND SHARE OF RESULT OF EQUITY ACCOUNTED INVESTEES
39,127 -33,855 5,272
Share of result of equity accounted investees (net of income tax) 770 33,802 34,572
Income tax income 513 53 566
RESULT FOR THE PERIOD 40,410 0 40,410
(*) IAS 23 requires that borrowing costs which are attributable to the construction of vessels are to be capitalized as part of the asset. As a consequence of the non-application of IAS 23 in prior periods, the prior period financial statements have been restated. The affected captions in the consolidated statement of financial position and the consolidated statement of profit or loss have been marked with (*). We refer to note 11 for more information in this respect.
NOTES 89
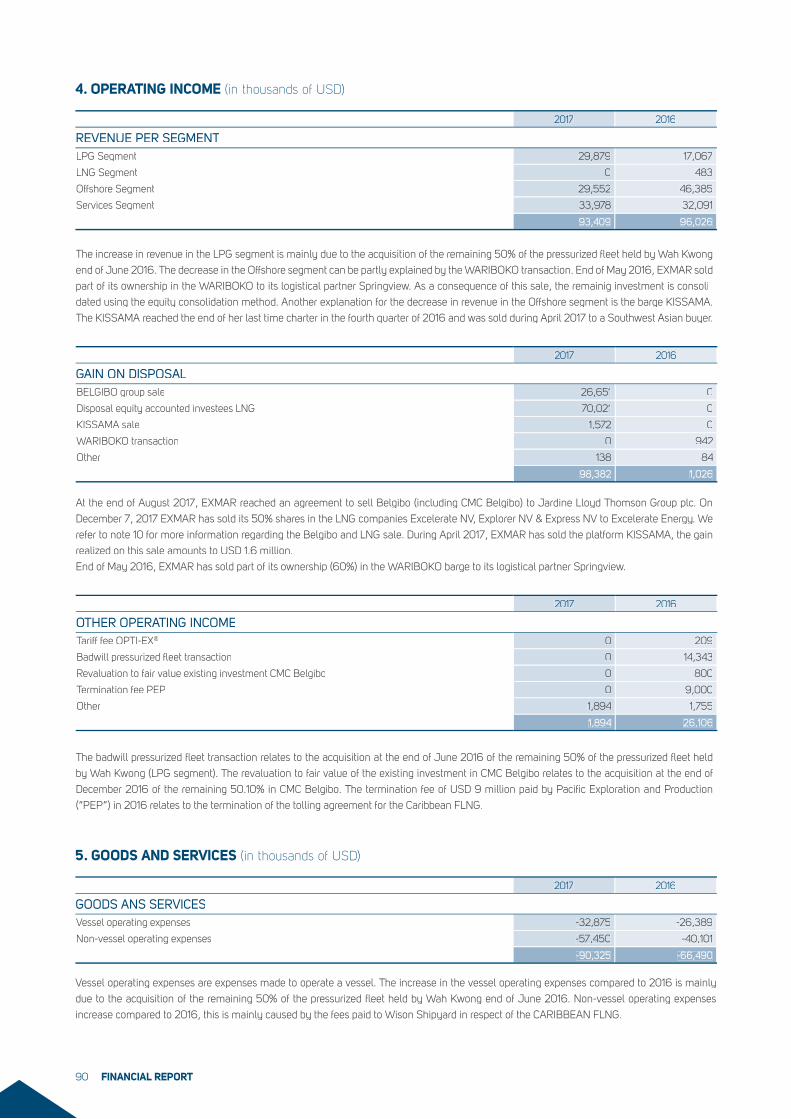
4. OPERATING INCOME (in thousands of USD)
5. GOODS AND SERVICES (in thousands of USD)
2017 2016
REVENUE PER SEGMENTLPG Segment 29,879 17,067
LNG Segment 0 483
Offshore Segment 29,552 46,385
Services Segment 33,978 32,091
93,409 96,026
The increase in revenue in the LPG segment is mainly due to the acquisition of the remaining 50% of the pressurized fleet held by Wah Kwong
end of June 2016. The decrease in the Offshore segment can be partly explained by the WARIBOKO transaction. End of May 2016, EXMAR sold
part of its ownership in the WARIBOKO to its logistical partner Springview. As a consequence of this sale, the remainig investment is consoli-
dated using the equity consolidation method. Another explanation for the decrease in revenue in the Offshore segment is the barge KISSAMA.
The KISSAMA reached the end of her last time charter in the fourth quarter of 2016 and was sold during April 2017 to a Southwest Asian buyer.
2017 2016
GAIN ON DISPOSALBELGIBO group sale 26,651 0
Disposal equity accounted investees LNG 70,021 0
KISSAMA sale 1,572 0
WARIBOKO transaction 0 942
Other 138 84
98,382 1,026
At the end of August 2017, EXMAR reached an agreement to sell Belgibo (including CMC Belgibo) to Jardine Lloyd Thomson Group plc. On
December 7, 2017 EXMAR has sold its 50% shares in the LNG companies Excelerate NV, Explorer NV & Express NV to Excelerate Energy. We
refer to note 10 for more information regarding the Belgibo and LNG sale. During April 2017, EXMAR has sold the platform KISSAMA, the gain
realized on this sale amounts to USD 1.6 million.
End of May 2016, EXMAR has sold part of its ownership (60%) in the WARIBOKO barge to its logistical partner Springview.
2017 2016
OTHER OPERATING INCOMETariff fee OPTI-EX® 0 209
Badwill pressurized fleet transaction 0 14,343
Revaluation to fair value existing investment CMC Belgibo 0 800
Termination fee PEP 0 9,000
Other 1,894 1,755
1,894 26,106
The badwill pressurized fleet transaction relates to the acquisition at the end of June 2016 of the remaining 50% of the pressurized fleet held
by Wah Kwong (LPG segment). The revaluation to fair value of the existing investment in CMC Belgibo relates to the acquisition at the end of
December 2016 of the remaining 50.10% in CMC Belgibo. The termination fee of USD 9 million paid by Pacific Exploration and Production
(“PEP”) in 2016 relates to the termination of the tolling agreement for the Caribbean FLNG.
2017 2016
GOODS ANS SERVICESVessel operating expenses -32,875 -26,389
Non-vessel operating expenses -57,450 -40,101
-90,325 -66,490
Vessel operating expenses are expenses made to operate a vessel. The increase in the vessel operating expenses compared to 2016 is mainly
due to the acquisition of the remaining 50% of the pressurized fleet held by Wah Kwong end of June 2016. Non-vessel operating expenses
increase compared to 2016, this is mainly caused by the fees paid to Wison Shipyard in respect of the CARIBBEAN FLNG.
FINANCIAL REPORT90
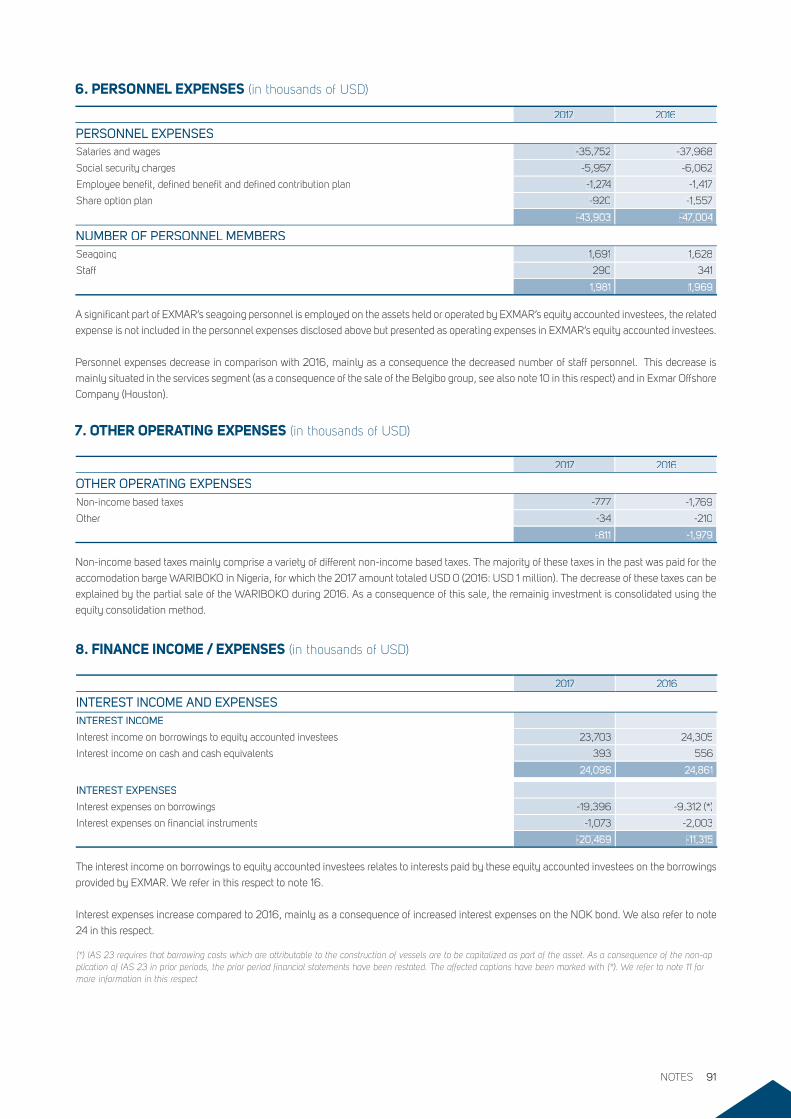
6. PERSONNEL EXPENSES (in thousands of USD)
2017 2016
PERSONNEL EXPENSESSalaries and wages -35,752 -37,968
Social security charges -5,957 -6,062
Employee benefit, defined benefit and defined contribution plan -1,274 -1,417
Share option plan -920 -1,557
-43,903 -47,004
NUMBER OF PERSONNEL MEMBERSSeagoing 1,691 1,628
Staff 290 341
1,981 1,969
A significant part of EXMAR’s seagoing personnel is employed on the assets held or operated by EXMAR’s equity accounted investees, the related
expense is not included in the personnel expenses disclosed above but presented as operating expenses in EXMAR’s equity accounted investees.
Personnel expenses decrease in comparison with 2016, mainly as a consequence the decreased number of staff personnel. This decrease is
mainly situated in the services segment (as a consequence of the sale of the Belgibo group, see also note 10 in this respect) and in Exmar Offshore
Company (Houston).
7. OTHER OPERATING EXPENSES (in thousands of USD)
8. FINANCE INCOME / EXPENSES (in thousands of USD)
2017 2016
OTHER OPERATING EXPENSESNon-income based taxes -777 -1,769
Other -34 -210
-811 -1,979
Non-income based taxes mainly comprise a variety of different non-income based taxes. The majority of these taxes in the past was paid for the
accomodation barge WARIBOKO in Nigeria, for which the 2017 amount totaled USD 0 (2016: USD 1 million). The decrease of these taxes can be
explained by the partial sale of the WARIBOKO during 2016. As a consequence of this sale, the remainig investment is consolidated using the
equity consolidation method.
2017 2016
INTEREST INCOME AND EXPENSESINTEREST INCOME
Interest income on borrowings to equity accounted investees 23,703 24,305
Interest income on cash and cash equivalents 393 556
24,096 24,861
INTEREST EXPENSES
Interest expenses on borrowings -19,396 -9,312 (*)
Interest expenses on financial instruments -1,073 -2,003
-20,469 -11,315
The interest income on borrowings to equity accounted investees relates to interests paid by these equity accounted investees on the borrowings
provided by EXMAR. We refer in this respect to note 16.
Interest expenses increase compared to 2016, mainly as a consequence of increased interest expenses on the NOK bond. We also refer to note
24 in this respect.
(*) IAS 23 requires that borrowing costs which are attributable to the construction of vessels are to be capitalized as part of the asset. As a consequence of the non-ap-plication of IAS 23 in prior periods, the prior period financial statements have been restated. The affected captions have been marked with (*). We refer to note 11 for more information in this respect.
NOTES 91
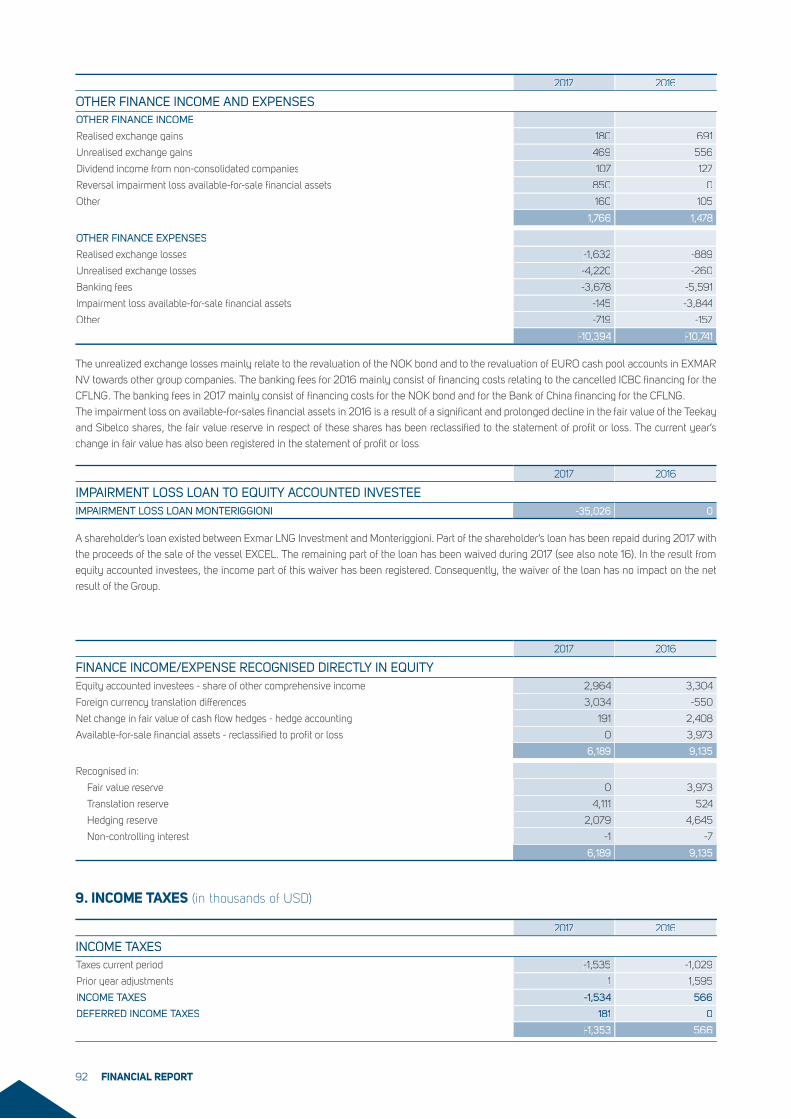
2017 2016
INCOME TAXESTaxes current period -1,535 -1,029
Prior year adjustments 1 1,595
INCOME TAXES -1,534 566
DEFERRED INCOME TAXES 181 0
-1,353 566
2017 2016
FINANCE INCOME/EXPENSE RECOGNISED DIRECTLY IN EQUITYEquity accounted investees - share of other comprehensive income 2,964 3,304
Foreign currency translation differences 3,034 -550
Net change in fair value of cash flow hedges - hedge accounting 191 2,408
Available-for-sale financial assets - reclassified to profit or loss 0 3,973
6,189 9,135
Recognised in:
Fair value reserve 0 3,973
Translation reserve 4,111 524
Hedging reserve 2,079 4,645
Non-controlling interest -1 -7
6,189 9,135
2017 2016
IMPAIRMENT LOSS LOAN TO EQUITY ACCOUNTED INVESTEEIMPAIRMENT LOSS LOAN MONTERIGGIONI -35,026 0
A shareholder’s loan existed between Exmar LNG Investment and Monteriggioni. Part of the shareholder’s loan has been repaid during 2017 with
the proceeds of the sale of the vessel EXCEL. The remaining part of the loan has been waived during 2017 (see also note 16). In the result from
equity accounted investees, the income part of this waiver has been registered. Consequently, the waiver of the loan has no impact on the net
result of the Group.
9. INCOME TAXES (in thousands of USD)
2017 2016
OTHER FINANCE INCOME AND EXPENSESOTHER FINANCE INCOME
Realised exchange gains 180 691
Unrealised exchange gains 469 556
Dividend income from non-consolidated companies 107 127
Reversal impairment loss available-for-sale financial assets 850 0
Other 160 105
1,766 1,478
OTHER FINANCE EXPENSES
Realised exchange losses -1,632 -889
Unrealised exchange losses -4,220 -260
Banking fees -3,678 -5,591
Impairment loss available-for-sale financial assets -145 -3,844
Other -719 -157
-10,394 -10,741
The unrealized exchange losses mainly relate to the revaluation of the NOK bond and to the revaluation of EURO cash pool accounts in EXMAR
NV towards other group companies. The banking fees for 2016 mainly consist of financing costs relating to the cancelled ICBC financing for the
CFLNG. The banking fees in 2017 mainly consist of financing costs for the NOK bond and for the Bank of China financing for the CFLNG.
The impairment loss on available-for-sales financial assets in 2016 is a result of a significant and prolonged decline in the fair value of the Teekay
and Sibelco shares, the fair value reserve in respect of these shares has been reclassified to the statement of profit or loss. The current year’s
change in fair value has also been registered in the statement of profit or loss.
FINANCIAL REPORT92
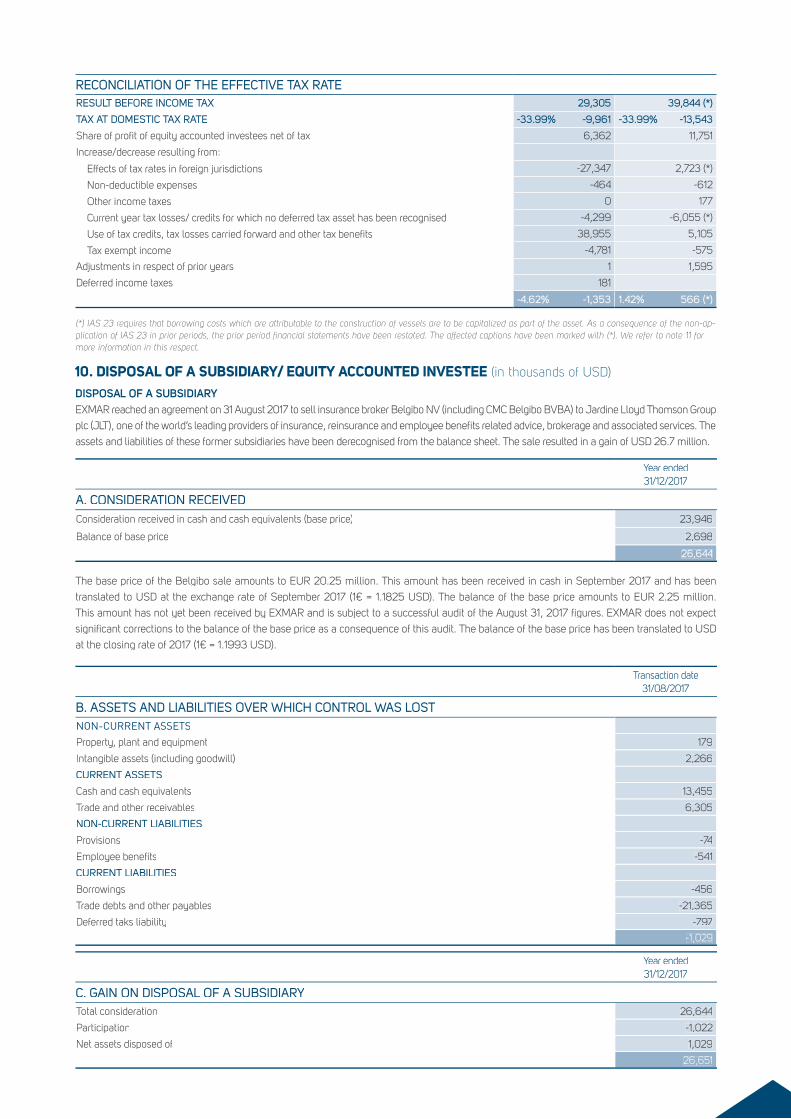
RECONCILIATION OF THE EFFECTIVE TAX RATERESULT BEFORE INCOME TAX 29,305 39,844 (*)
TAX AT DOMESTIC TAX RATE -33.99% -9,961 -33.99% -13,543
Share of profit of equity accounted investees net of tax 6,362 11,751
Increase/decrease resulting from:
Effects of tax rates in foreign jurisdictions -27,347 2,723 (*)
Non-deductible expenses -464 -612
Other income taxes 0 177
Current year tax losses/ credits for which no deferred tax asset has been recognised -4,299 -6,055 (*)
Use of tax credits, tax losses carried forward and other tax benefits 38,955 5,105
Tax exempt income -4,781 -575
Adjustments in respect of prior years 1 1,595
Deferred income taxes 181
-4.62% -1,353 1.42% 566 (*)
(*) IAS 23 requires that borrowing costs which are attributable to the construction of vessels are to be capitalized as part of the asset. As a consequence of the non-ap-plication of IAS 23 in prior periods, the prior period financial statements have been restated. The affected captions have been marked with (*). We refer to note 11 for more information in this respect.
10. DISPOSAL OF A SUBSIDIARY/ EQUITY ACCOUNTED INVESTEE (in thousands of USD)
DISPOSAL OF A SUBSIDIARYEXMAR reached an agreement on 31 August 2017 to sell insurance broker Belgibo NV (including CMC Belgibo BVBA) to Jardine Lloyd Thomson Group
plc (JLT), one of the world’s leading providers of insurance, reinsurance and employee benefits related advice, brokerage and associated services. The
assets and liabilities of these former subsidiaries have been derecognised from the balance sheet. The sale resulted in a gain of USD 26.7 million.
Year ended 31/12/2017
A. CONSIDERATION RECEIVEDA. CONSIDERATION RECEIVEDConsideration received in cash and cash equivalents (base price) 23,946
Balance of base price 2,698
26,644
The base price of the Belgibo sale amounts to EUR 20.25 million. This amount has been received in cash in September 2017 and has been
translated to USD at the exchange rate of September 2017 (1€ = 1.1825 USD). The balance of the base price amounts to EUR 2.25 million.
This amount has not yet been received by EXMAR and is subject to a successful audit of the August 31, 2017 figures. EXMAR does not expect
significant corrections to the balance of the base price as a consequence of this audit. The balance of the base price has been translated to USD
at the closing rate of 2017 (1€ = 1.1993 USD).
Transaction date 31/08/2017
B. ASSETS AND LIABILITIES OVER WHICH CONTROL WAS LOSTNON-CURRENT ASSETSProperty, plant and equipment 179
Intangible assets (including goodwill) 2,266
CURRENT ASSETS
Cash and cash equivalents 13,455
Trade and other receivables 6,305
NON-CURRENT LIABILITIES
Provisions -74
Employee benefits -541
CURRENT LIABILITIES
Borrowings -456
Trade debts and other payables -21,365
Deferred taks liability -797
-1,029
Year ended 31/12/2017
C. GAIN ON DISPOSAL OF A SUBSIDIARYTotal consideration 26,644
Participation -1,022
Net assets disposed of 1,029
26,651
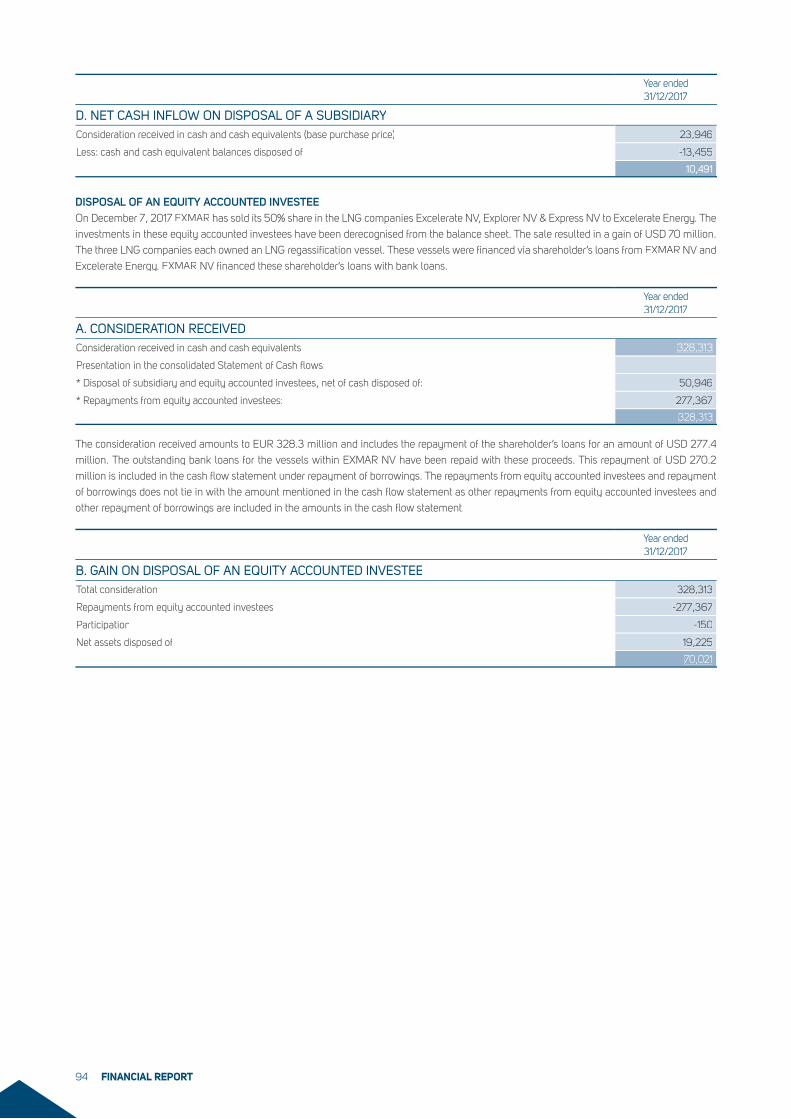
Year ended 31/12/2017
D. NET CASH INFLOW ON DISPOSAL OF A SUBSIDIARYConsideration received in cash and cash equivalents (base purchase price) 23,946
Less: cash and cash equivalent balances disposed of -13,455
10,491
DISPOSAL OF AN EQUITY ACCOUNTED INVESTEEOn December 7, 2017 EXMAR has sold its 50% share in the LNG companies Excelerate NV, Explorer NV & Express NV to Excelerate Energy. The
investments in these equity accounted investees have been derecognised from the balance sheet. The sale resulted in a gain of USD 70 million.
The three LNG companies each owned an LNG regassification vessel. These vessels were financed via shareholder’s loans from EXMAR NV and
Excelerate Energy. EXMAR NV financed these shareholder’s loans with bank loans.
Year ended 31/12/2017
A. CONSIDERATION RECEIVEDA. CONSIDERATION RECEIVEDConsideration received in cash and cash equivalents 328,313
Presentation in the consolidated Statement of Cash flows:
* Disposal of subsidiary and equity accounted investees, net of cash disposed of: 50,946
* Repayments from equity accounted investees: 277,367
328,313
The consideration received amounts to EUR 328.3 million and includes the repayment of the shareholder’s loans for an amount of USD 277.4
million. The outstanding bank loans for the vessels within EXMAR NV have been repaid with these proceeds. This repayment of USD 270.2
million is included in the cash flow statement under repayment of borrowings. The repayments from equity accounted investees and repayment
of borrowings does not tie in with the amount mentioned in the cash flow statement as other repayments from equity accounted investees and
other repayment of borrowings are included in the amounts in the cash flow statement.
Year ended 31/12/2017
B. GAIN ON DISPOSAL OF AN EQUITY ACCOUNTED INVESTEETotal consideration 328,313
Repayments from equity accounted investees -277,367
Participation -150
Net assets disposed of 19,225
70,021
FINANCIAL REPORT94
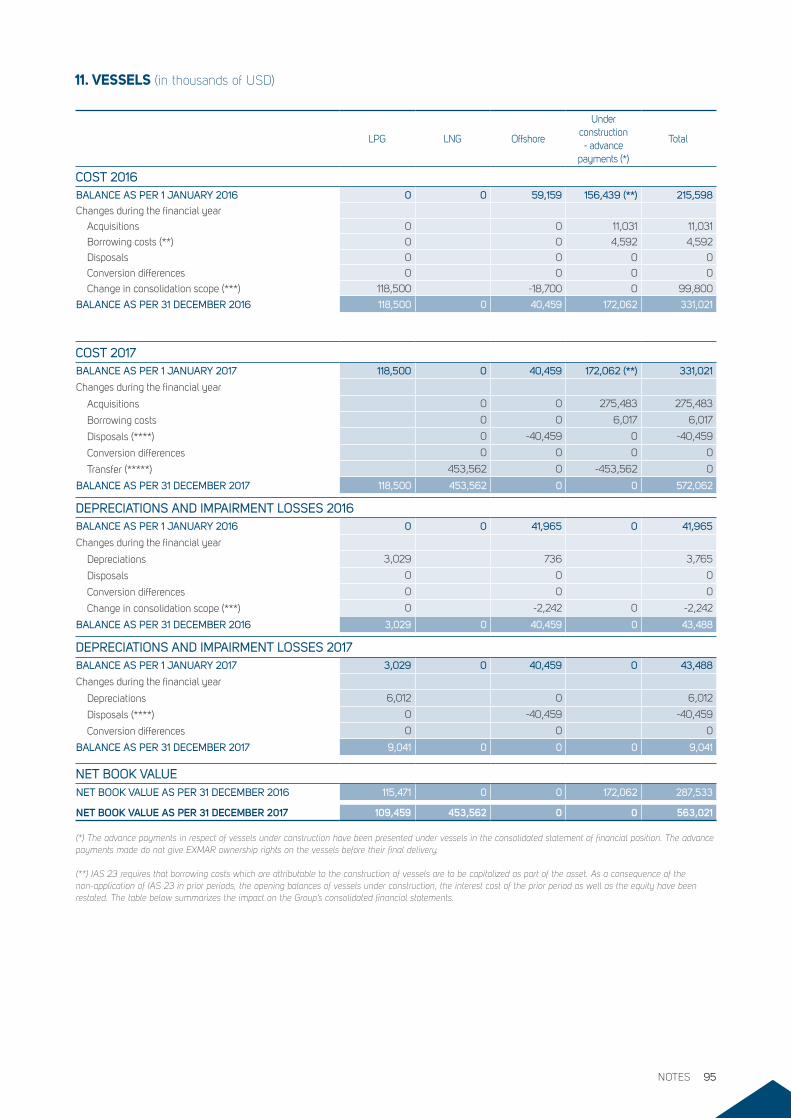
11. VESSELS (in thousands of USD)
LPG LNG Offshore
Under construction - advance
payments (*)
Total
COST 2016BALANCE AS PER 1 JANUARY 2016 0 0 59,159 156,439 (**) 215,598
Changes during the financial year
Acquisitions 0 0 11,031 11,031
Borrowing costs (**) 0 0 4,592 4,592
Disposals 0 0 0 0
Conversion differences 0 0 0 0
Change in consolidation scope (***) 118,500 -18,700 0 99,800
BALANCE AS PER 31 DECEMBER 2016 118,500 0 40,459 172,062 331,021
COST 2017BALANCE AS PER 1 JANUARY 2017 118,500 0 40,459 172,062 (**) 331,021
Changes during the financial year
Acquisitions 0 0 275,483 275,483
Borrowing costs 0 0 6,017 6,017
Disposals (****) 0 -40,459 0 -40,459
Conversion differences 0 0 0 0
Transfer (*****) 453,562 0 -453,562 0
BALANCE AS PER 31 DECEMBER 2017 118,500 453,562 0 0 572,062
DEPRECIATIONS AND IMPAIRMENT LOSSES 2016BALANCE AS PER 1 JANUARY 2016 0 0 41,965 0 41,965
Changes during the financial year
Depreciations 3,029 736 3,765
Disposals 0 0 0
Conversion differences 0 0 0
Change in consolidation scope (***) 0 -2,242 0 -2,242
BALANCE AS PER 31 DECEMBER 2016 3,029 0 40,459 0 43,488
DEPRECIATIONS AND IMPAIRMENT LOSSES 2017BALANCE AS PER 1 JANUARY 2017 3,029 0 40,459 0 43,488
Changes during the financial year
Depreciations 6,012 0 6,012
Disposals (****) 0 -40,459 -40,459
Conversion differences 0 0 0
BALANCE AS PER 31 DECEMBER 2017 9,041 0 0 0 9,041
NET BOOK VALUENET BOOK VALUE AS PER 31 DECEMBER 2016 115,471 0 0 172,062 287,533
NET BOOK VALUE AS PER 31 DECEMBER 2017 109,459 453,562 0 0 563,021
(*) The advance payments in respect of vessels under construction have been presented under vessels in the consolidated statement of financial position. The advance payments made do not give EXMAR ownership rights on the vessels before their final delivery.
(**) IAS 23 requires that borrowing costs which are attributable to the construction of vessels are to be capitalized as part of the asset. As a consequence of the non-application of IAS 23 in prior periods, the opening balances of vessels under construction, the interest cost of the prior period as well as the equity have been restated. The table below summarizes the impact on the Group’s consolidated financial statements.
NOTES 95
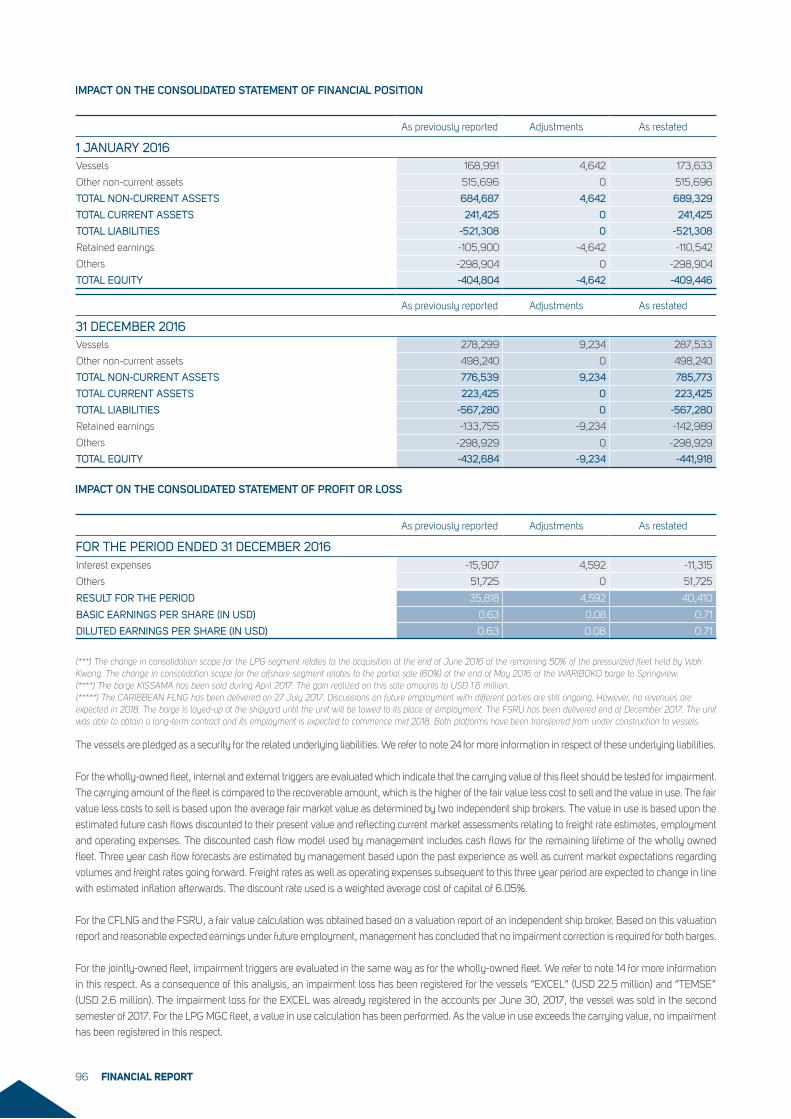
IMPACT ON THE CONSOLIDATED STATEMENT OF FINANCIAL POSITION
As previously reported Adjustments As restated
1 JANUARY 2016Vessels 168,991 4,642 173,633
Other non-current assets 515,696 0 515,696
TOTAL NON-CURRENT ASSETS 684,687 4,642 689,329
TOTAL CURRENT ASSETS 241,425 0 241,425
TOTAL LIABILITIES -521,308 0 -521,308
Retained earnings -105,900 -4,642 -110,542
Others -298,904 0 -298,904
TOTAL EQUITY -404,804 -4,642 -409,446
As previously reported Adjustments As restated
31 DECEMBER 2016Vessels 278,299 9,234 287,533
Other non-current assets 498,240 0 498,240
TOTAL NON-CURRENT ASSETS 776,539 9,234 785,773
TOTAL CURRENT ASSETS 223,425 0 223,425
TOTAL LIABILITIES -567,280 0 -567,280
Retained earnings -133,755 -9,234 -142,989
Others -298,929 0 -298,929
TOTAL EQUITY -432,684 -9,234 -441,918
IMPACT ON THE CONSOLIDATED STATEMENT OF PROFIT OR LOSS
As previously reported Adjustments As restated
FOR THE PERIOD ENDED 31 DECEMBER 2016Interest expenses -15,907 4,592 -11,315
Others 51,725 0 51,725
RESULT FOR THE PERIOD 35,818 4,592 40,410
BASIC EARNINGS PER SHARE (IN USD) 0.63 0.08 0.71
DILUTED EARNINGS PER SHARE (IN USD) 0.63 0.08 0.71
(***) The change in consolidation scope for the LPG segment relates to the acquisition at the end of June 2016 of the remaining 50% of the pressurized fleet held by Wah Kwong. The change in consolidation scope for the offshore segment relates to the partial sale (60%) at the end of May 2016 of the WARIBOKO barge to Springview. (****) The barge KISSAMA has been sold during April 2017. The gain realized on this sale amounts to USD 1.6 million. (*****) The CARIBBEAN FLNG has been delivered on 27 July 2017. Discussions on future employment with different parties are still ongoing. However, no revenues are expected in 2018. The barge is layed-up at the shipyard until the unit will be towed to its place of employment. The FSRU has been delivered end of December 2017. The unit was able to obtain a long-term contract and its employment is expected to commence mid 2018. Both platforms have been transferred from under construction to vessels.
The vessels are pledged as a security for the related underlying liabilities. We refer to note 24 for more information in respect of these underlying liabilities.
For the wholly-owned fleet, internal and external triggers are evaluated which indicate that the carrying value of this fleet should be tested for impairment.
The carrying amount of the fleet is compared to the recoverable amount, which is the higher of the fair value less cost to sell and the value in use. The fair
value less costs to sell is based upon the average fair market value as determined by two independent ship brokers. The value in use is based upon the
estimated future cash flows discounted to their present value and reflecting current market assessments relating to freight rate estimates, employment
and operating expenses. The discounted cash flow model used by management includes cash flows for the remaining lifetime of the wholly owned
fleet. Three year cash flow forecasts are estimated by management based upon the past experience as well as current market expectations regarding
volumes and freight rates going forward. Freight rates as well as operating expenses subsequent to this three year period are expected to change in line
with estimated inflation afterwards. The discount rate used is a weighted average cost of capital of 6.05%.
For the CFLNG and the FSRU, a fair value calculation was obtained based on a valuation report of an independent ship broker. Based on this valuation
report and reasonable expected earnings under future employment, management has concluded that no impairment correction is required for both barges.
For the jointly-owned fleet, impairment triggers are evaluated in the same way as for the wholly-owned fleet. We refer to note 14 for more information
in this respect. As a consequence of this analysis, an impairment loss has been registered for the vessels “EXCEL” (USD 22.5 million) and “TEMSE”
(USD 2.6 million). The impairment loss for the EXCEL was already registered in the accounts per June 30, 2017, the vessel was sold in the second
semester of 2017. For the LPG MGC fleet, a value in use calculation has been performed. As the value in use exceeds the carrying value, no impairment
has been registered in this respect.
FINANCIAL REPORT96
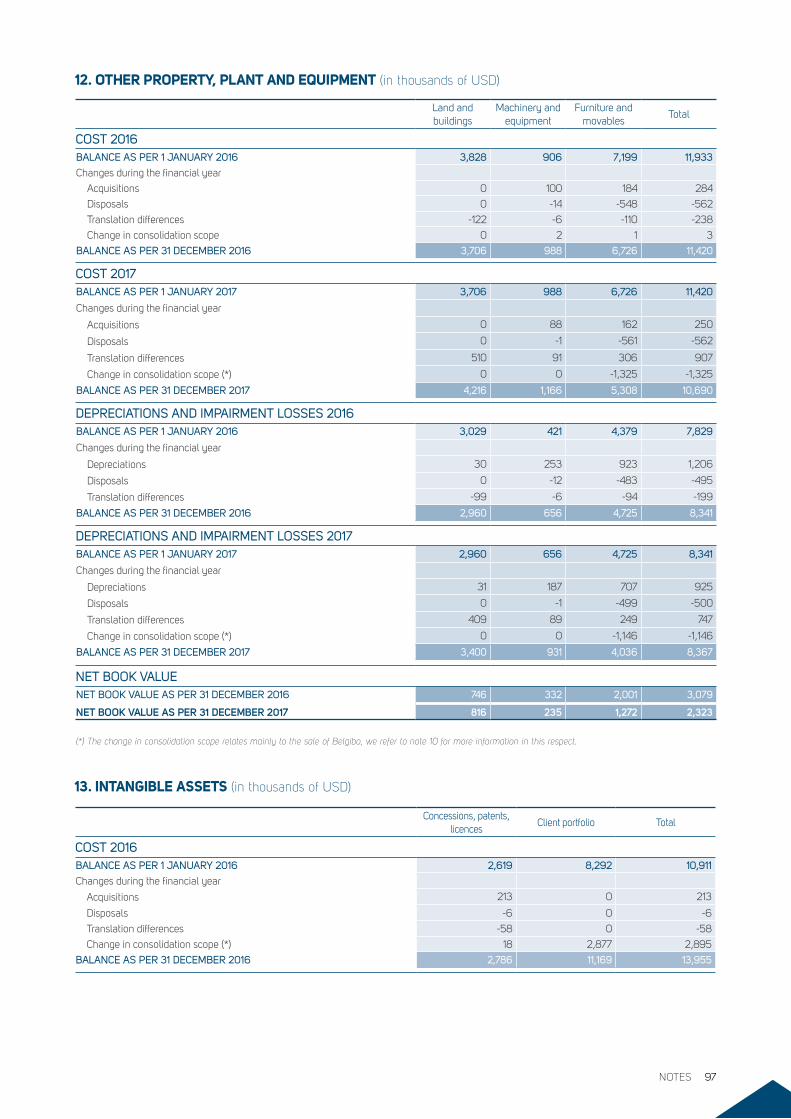
13. INTANGIBLE ASSETS (in thousands of USD)
Concessions, patents, licences
Client portfolio Total
COST 2016BALANCE AS PER 1 JANUARY 2016 2,619 8,292 10,911
Changes during the financial year
Acquisitions 213 0 213
Disposals -6 0 -6
Translation differences -58 0 -58
Change in consolidation scope (*) 18 2,877 2,895
BALANCE AS PER 31 DECEMBER 2016 2,786 11,169 13,955
12. OTHER PROPERTY, PLANT AND EQUIPMENT (in thousands of USD)
Land and buildings
Machinery and equipment
Furniture and movables
Total
COST 2016BALANCE AS PER 1 JANUARY 2016 3,828 906 7,199 11,933
Changes during the financial year
Acquisitions 0 100 184 284
Disposals 0 -14 -548 -562
Translation differences -122 -6 -110 -238
Change in consolidation scope 0 2 1 3
BALANCE AS PER 31 DECEMBER 2016 3,706 988 6,726 11,420
COST 2017BALANCE AS PER 1 JANUARY 2017 3,706 988 6,726 11,420
Changes during the financial year
Acquisitions 0 88 162 250
Disposals 0 -1 -561 -562
Translation differences 510 91 306 907
Change in consolidation scope (*) 0 0 -1,325 -1,325
BALANCE AS PER 31 DECEMBER 2017 4,216 1,166 5,308 10,690
DEPRECIATIONS AND IMPAIRMENT LOSSES 2016BALANCE AS PER 1 JANUARY 2016 3,029 421 4,379 7,829
Changes during the financial year
Depreciations 30 253 923 1,206
Disposals 0 -12 -483 -495
Translation differences -99 -6 -94 -199
BALANCE AS PER 31 DECEMBER 2016 2,960 656 4,725 8,341
DEPRECIATIONS AND IMPAIRMENT LOSSES 2017BALANCE AS PER 1 JANUARY 2017 2,960 656 4,725 8,341
Changes during the financial year
Depreciations 31 187 707 925
Disposals 0 -1 -499 -500
Translation differences 409 89 249 747
Change in consolidation scope (*) 0 0 -1,146 -1,146
BALANCE AS PER 31 DECEMBER 2017 3,400 931 4,036 8,367
NET BOOK VALUE NET BOOK VALUE AS PER 31 DECEMBER 2016 746 332 2,001 3,079
NET BOOK VALUE AS PER 31 DECEMBER 2017 816 235 1,272 2,323
(*) The change in consolidation scope relates mainly to the sale of Belgibo, we refer to note 10 for more information in this respect.
NOTES 97
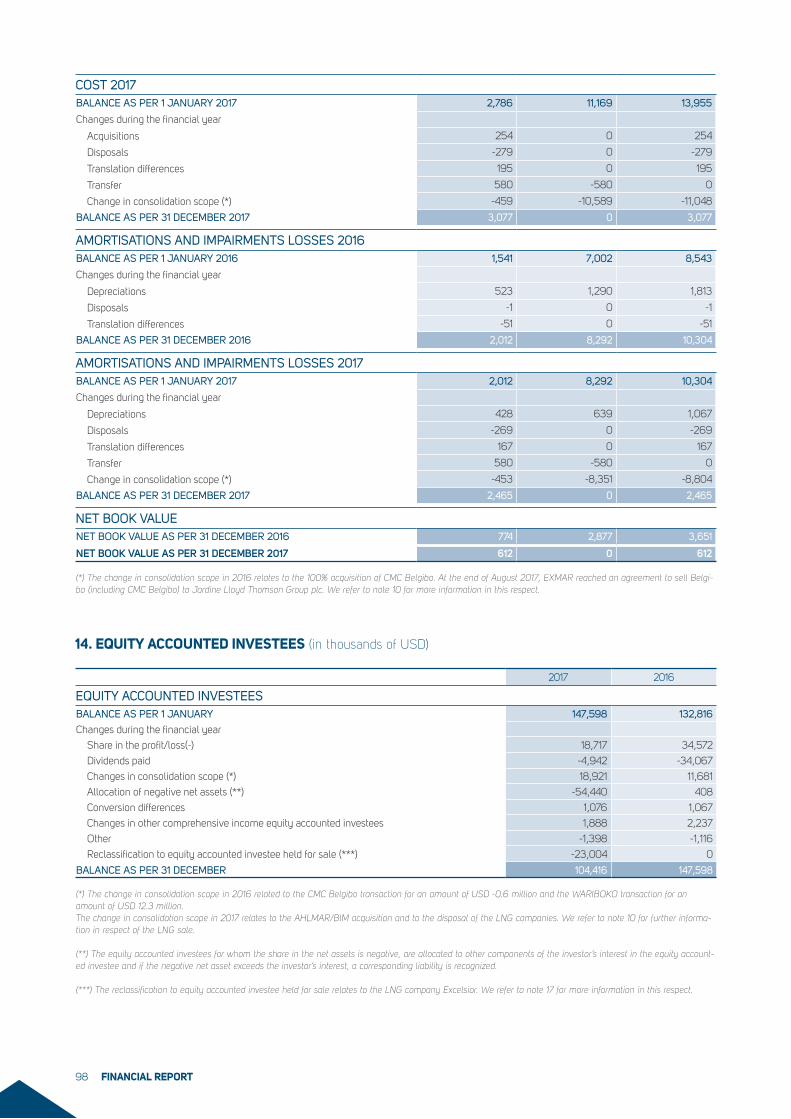
14. EQUITY ACCOUNTED INVESTEES (in thousands of USD)
2017 2016
EQUITY ACCOUNTED INVESTEESBALANCE AS PER 1 JANUARY 147,598 132,816
Changes during the financial year
Share in the profit/loss(-) 18,717 34,572
Dividends paid -4,942 -34,067
Changes in consolidation scope (*) 18,921 11,681
Allocation of negative net assets (**) -54,440 408
Conversion differences 1,076 1,067
Changes in other comprehensive income equity accounted investees 1,888 2,237
Other -1,398 -1,116
Reclassification to equity accounted investee held for sale (***) -23,004 0
BALANCE AS PER 31 DECEMBER 104,416 147,598
(*) The change in consolidation scope in 2016 related to the CMC Belgibo transaction for an amount of USD -0.6 million and the WARIBOKO transaction for an amount of USD 12.3 million. The change in consolidation scope in 2017 relates to the AHLMAR/BIM acquisition and to the disposal of the LNG companies. We refer to note 10 for further informa-tion in respect of the LNG sale.
(**) The equity accounted investees for whom the share in the net assets is negative, are allocated to other components of the investor’s interest in the equity account-ed investee and if the negative net asset exceeds the investor’s interest, a corresponding liability is recognized.
(***) The reclassification to equity accounted investee held for sale relates to the LNG company Excelsior. We refer to note 17 for more information in this respect.
COST 2017BALANCE AS PER 1 JANUARY 2017 2,786 11,169 13,955
Changes during the financial year
Acquisitions 254 0 254
Disposals -279 0 -279
Translation differences 195 0 195
Transfer 580 -580 0
Change in consolidation scope (*) -459 -10,589 -11,048
BALANCE AS PER 31 DECEMBER 2017 3,077 0 3,077
AMORTISATIONS AND IMPAIRMENTS LOSSES 2016BALANCE AS PER 1 JANUARY 2016 1,541 7,002 8,543
Changes during the financial year
Depreciations 523 1,290 1,813
Disposals -1 0 -1
Translation differences -51 0 -51
BALANCE AS PER 31 DECEMBER 2016 2,012 8,292 10,304
AMORTISATIONS AND IMPAIRMENTS LOSSES 2017BALANCE AS PER 1 JANUARY 2017 2,012 8,292 10,304
Changes during the financial year
Depreciations 428 639 1,067
Disposals -269 0 -269
Translation differences 167 0 167
Transfer 580 -580 0
Change in consolidation scope (*) -453 -8,351 -8,804
BALANCE AS PER 31 DECEMBER 2017 2,465 0 2,465
NET BOOK VALUE NET BOOK VALUE AS PER 31 DECEMBER 2016 774 2,877 3,651
NET BOOK VALUE AS PER 31 DECEMBER 2017 612 0 612
(*) The change in consolidation scope in 2016 relates to the 100% acquisition of CMC Belgibo. At the end of August 2017, EXMAR reached an agreement to sell Belgi-bo (including CMC Belgibo) to Jardine Lloyd Thomson Group plc. We refer to note 10 for more information in this respect.
FINANCIAL REPORT98
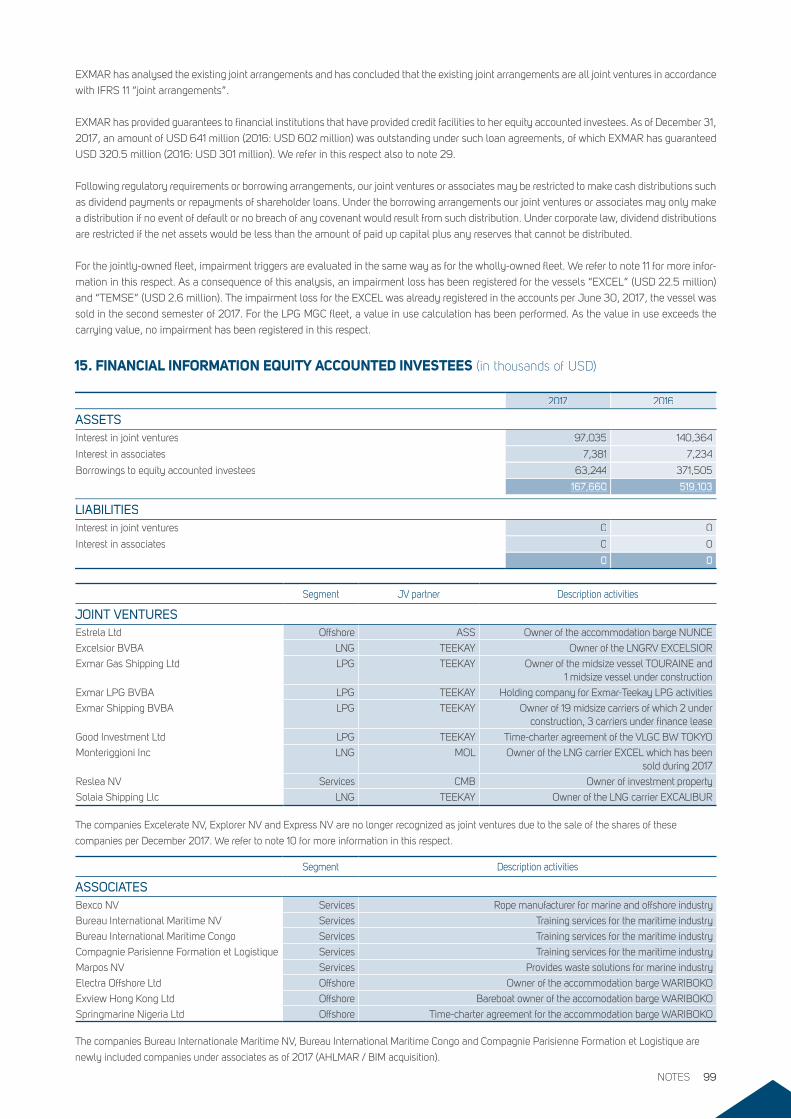
15. FINANCIAL INFORMATION EQUITY ACCOUNTED INVESTEES (in thousands of USD)
2017 2016
ASSETSASSETSInterest in joint ventures 97,035 140,364
Interest in associates 7,381 7,234
Borrowings to equity accounted investees 63,244 371,505
167,660 519,103
LIABILITIESInterest in joint ventures 0 0
Interest in associates 0 0
0 0
Segment JV partner Description activities
JOINT VENTURESEstrela Ltd Offshore ASS Owner of the accommodation barge NUNCE
Excelsior BVBA LNG TEEKAY Owner of the LNGRV EXCELSIOR
Exmar Gas Shipping Ltd LPG TEEKAY Owner of the midsize vessel TOURAINE and 1 midsize vessel under construction
Exmar LPG BVBA LPG TEEKAY Holding company for Exmar-Teekay LPG activities
Exmar Shipping BVBA LPG TEEKAY Owner of 19 midsize carriers of which 2 under construction, 3 carriers under finance lease
Good Investment Ltd LPG TEEKAY Time-charter agreement of the VLGC BW TOKYO
Monteriggioni Inc LNG MOL Owner of the LNG carrier EXCEL which has been sold during 2017
Reslea NV Services CMB Owner of investment property
Solaia Shipping Llc LNG TEEKAY Owner of the LNG carrier EXCALIBUR
The companies Excelerate NV, Explorer NV and Express NV are no longer recognized as joint ventures due to the sale of the shares of these
companies per December 2017. We refer to note 10 for more information in this respect.
Segment Description activities
ASSOCIATESBexco NV Services Rope manufacturer for marine and offshore industry
Bureau International Maritime NV Services Training services for the maritime industry
Bureau International Maritime Congo Services Training services for the maritime industry
Compagnie Parisienne Formation et Logistique Services Training services for the maritime industry
Marpos NV Services Provides waste solutions for marine industry
Electra Offshore Ltd Offshore Owner of the accommodation barge WARIBOKO
Exview Hong Kong Ltd Offshore Bareboat owner of the accomodation barge WARIBOKO
Springmarine Nigeria Ltd Offshore Time-charter agreement for the accommodation barge WARIBOKO
The companies Bureau Internationale Maritime NV, Bureau International Maritime Congo and Compagnie Parisienne Formation et Logistique are
newly included companies under associates as of 2017 (AHLMAR / BIM acquisition).
EXMAR has analysed the existing joint arrangements and has concluded that the existing joint arrangements are all joint ventures in accordance
with IFRS 11 “joint arrangements”.
EXMAR has provided guarantees to financial institutions that have provided credit facilities to her equity accounted investees. As of December 31,
2017, an amount of USD 641 million (2016: USD 602 million) was outstanding under such loan agreements, of which EXMAR has guaranteed
USD 320.5 million (2016: USD 301 million). We refer in this respect also to note 29.
Following regulatory requirements or borrowing arrangements, our joint ventures or associates may be restricted to make cash distributions such
as dividend payments or repayments of shareholder loans. Under the borrowing arrangements our joint ventures or associates may only make
a distribution if no event of default or no breach of any covenant would result from such distribution. Under corporate law, dividend distributions
are restricted if the net assets would be less than the amount of paid up capital plus any reserves that cannot be distributed.
For the jointly-owned fleet, impairment triggers are evaluated in the same way as for the wholly-owned fleet. We refer to note 11 for more infor-
mation in this respect. As a consequence of this analysis, an impairment loss has been registered for the vessels “EXCEL” (USD 22.5 million)
and “TEMSE” (USD 2.6 million). The impairment loss for the EXCEL was already registered in the accounts per June 30, 2017, the vessel was
sold in the second semester of 2017. For the LPG MGC fleet, a value in use calculation has been performed. As the value in use exceeds the
carrying value, no impairment has been registered in this respect.
NOTES 99
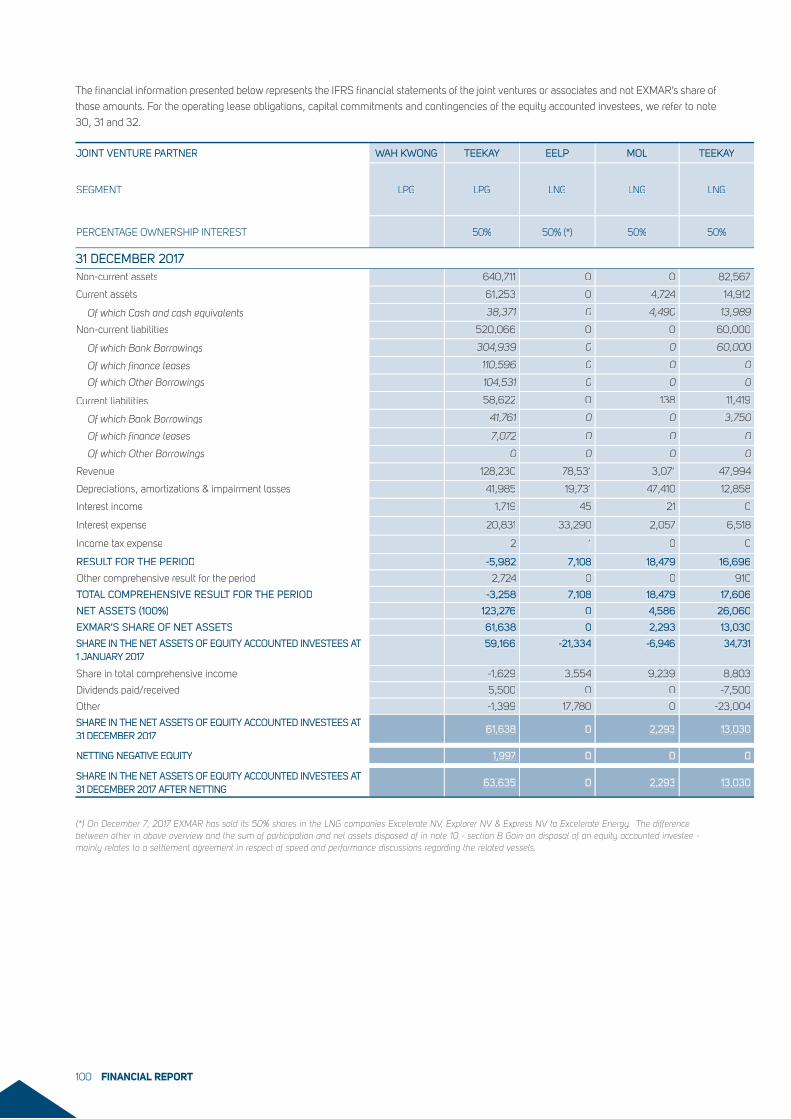
The financial information presented below represents the IFRS financial statements of the joint ventures or associates and not EXMAR’s share of
those amounts. For the operating lease obligations, capital commitments and contingencies of the equity accounted investees, we refer to note
30, 31 and 32.
JOINT VENTURE PARTNERJOINT VENTURE PARTNER WAH KWONG TEEKAY EELP MOL TEEKAY
SEGMENT LPG LPG LNG LNG LNG
PERCENTAGE OWNERSHIP INTEREST 50% 50% (*) 50% 50%
31 DECEMBER 2017Non-current assets 640,711 0 0 82,567
Current assets 61,253 0 4,724 14,912
Of which Cash and cash equivalents 38,371 0 4,490 13,989
Non-current liabilities 520,066 0 0 60,000
Of which Bank Borrowings 304,939 0 0 60,000
Of which finance leases 110,596 0 0 0
Of which Other Borrowings 104,531 0 0 0
Current liabilities 58,622 0 138 11,419
Of which Bank Borrowings 41,761 0 0 3,750
Of which finance leases 7,072 0 0 0
Of which Other Borrowings 0 0 0 0
Revenue 128,230 78,531 3,071 47,994
Depreciations, amortizations & impairment losses 41,985 19,731 47,410 12,858
Interest income 1,719 45 21 0
Interest expense 20,831 33,290 2,057 6,518
Income tax expense 2 1 0 0
RESULT FOR THE PERIOD -5,982 7,108 18,479 16,696
Other comprehensive result for the period 2,724 0 0 910
TOTAL COMPREHENSIVE RESULT FOR THE PERIOD -3,258 7,108 18,479 17,606
NET ASSETS (100%) 123,276 0 4,586 26,060
EXMAR’S SHARE OF NET ASSETS 61,638 0 2,293 13,030
SHARE IN THE NET ASSETS OF EQUITY ACCOUNTED INVESTEES AT 1 JANUARY 2017
59,166 -21,334 -6,946 34,731
Share in total comprehensive income -1,629 3,554 9,239 8,803
Dividends paid/received 5,500 0 0 -7,500
Other -1,399 17,780 0 -23,004
SHARE IN THE NET ASSETS OF EQUITY ACCOUNTED INVESTEES AT 31 DECEMBER 2017
61,638 0 2,293 13,030
NETTING NEGATIVE EQUITY 1,997 0 0 0
SHARE IN THE NET ASSETS OF EQUITY ACCOUNTED INVESTEES AT 31 DECEMBER 2017 AFTER NETTING
63,635 0 2,293 13,030
(*) On December 7, 2017 EXMAR has sold its 50% shares in the LNG companies Excelerate NV, Explorer NV & Express NV to Excelerate Energy. The difference between other in above overview and the sum of participation and net assets disposed of in note 10 - section B Gain on disposal of an equity accounted investee - mainly relates to a settlement agreement in respect of speed and performance discussions regarding the related vessels.
FINANCIAL REPORT100
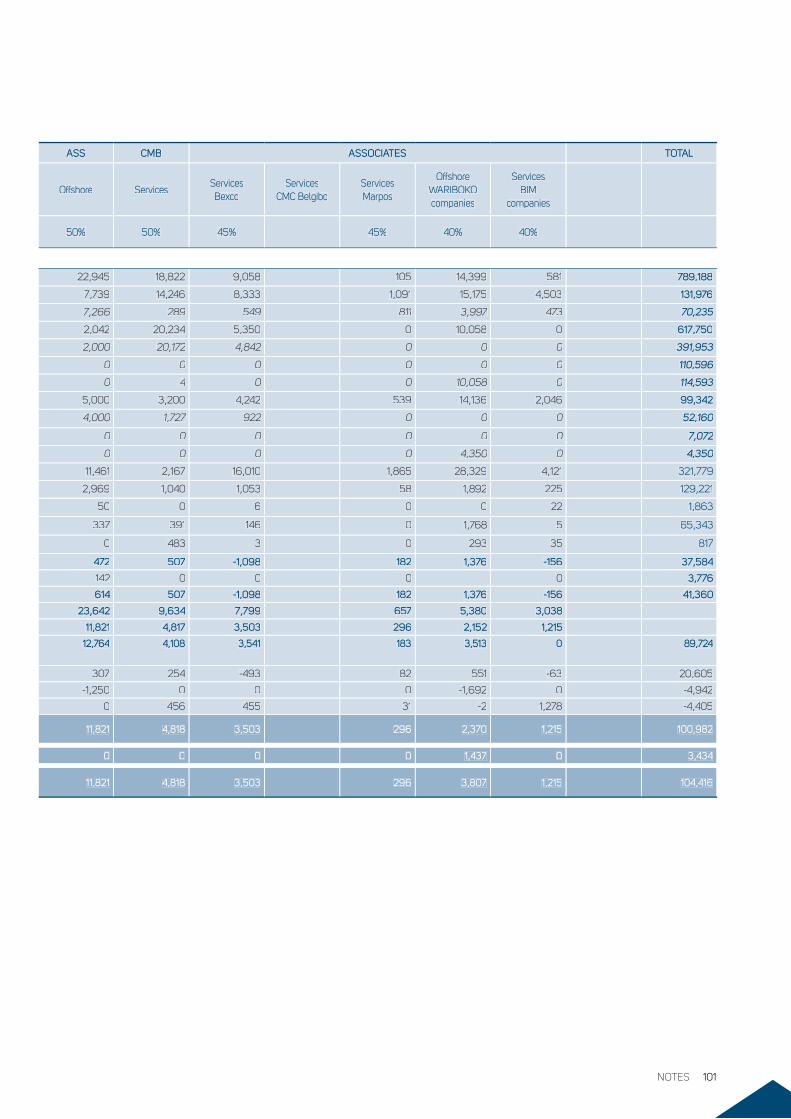
ASS CMB ASSOCIATES TOTAL
Offshore ServicesServicesBexco
ServicesCMC Belgibo
ServicesMarpos
Offshore WARIBOKO companies
ServicesBIM
companies
50% 50% 45% 45% 40% 40%
22,945 18,822 9,058 105 14,399 581 789,188
7,739 14,246 8,333 1,091 15,175 4,503 131,976
7,266 289 549 811 3,997 473 70,235
2,042 20,234 5,350 0 10,058 0 617,750
2,000 20,172 4,842 0 0 0 391,953
0 0 0 0 0 0 110,596
0 4 0 0 10,058 0 114,593
5,000 3,200 4,242 539 14,136 2,046 99,342
4,000 1,727 922 0 0 0 52,160
0 0 0 0 0 0 7,072
0 0 0 0 4,350 0 4,350
11,461 2,167 16,010 1,865 28,329 4,121 321,779
2,969 1,040 1,053 58 1,892 225 129,221
50 0 6 0 0 22 1,863
337 391 146 0 1,768 5 65,343
0 483 3 0 293 35 817
472 507 -1,098 182 1,376 -156 37,584
142 0 0 0 0 3,776
614 507 -1,098 182 1,376 -156 41,360
23,642 9,634 7,799 657 5,380 3,038
11,821 4,817 3,503 296 2,152 1,215
12,764 4,108 3,541 183 3,513 0 89,724
307 254 -493 82 551 -63 20,605
-1,250 0 0 0 -1,692 0 -4,942
0 456 455 31 -2 1,278 -4,405
11,821 4,818 3,503 296 2,370 1,215 100,982
0 0 0 0 1,437 0 3,434
11,821 4,818 3,503 296 3,807 1,215 104,416
NOTES 101
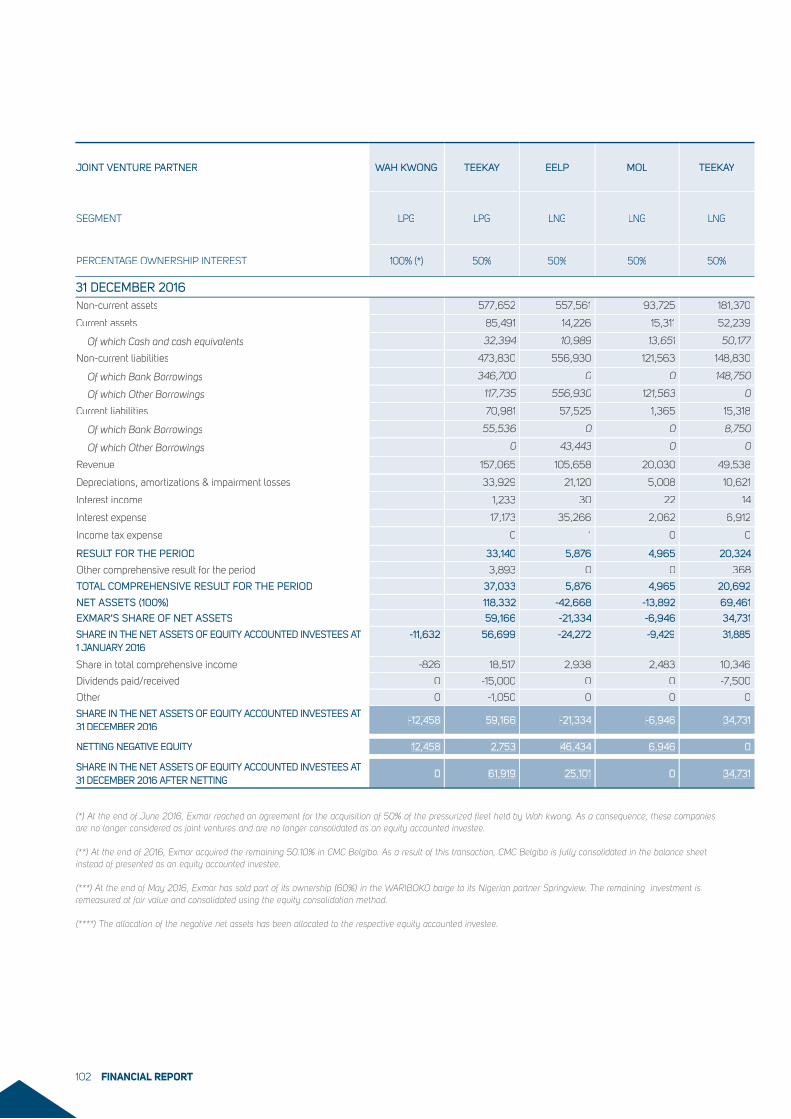
JOINT VENTURE PARTNERJOINT VENTURE PARTNER WAH KWONG TEEKAY EELP MOL TEEKAY
SEGMENT LPG LPG LNG LNG LNG
PERCENTAGE OWNERSHIP INTEREST 100% (*) 50% 50% 50% 50%
31 DECEMBER 2016Non-current assets 577,652 557,561 93,725 181,370
Current assets 85,491 14,226 15,311 52,239
Of which Cash and cash equivalents 32,394 10,989 13,651 50,177
Non-current liabilities 473,830 556,930 121,563 148,830
Of which Bank Borrowings 346,700 0 0 148,750
Of which Other Borrowings 117,735 556,930 121,563 0
Current liabilities 70,981 57,525 1,365 15,318
Of which Bank Borrowings 55,536 0 0 8,750
Of which Other Borrowings 0 43,443 0 0
Revenue 157,065 105,658 20,030 49,538
Depreciations, amortizations & impairment losses 33,929 21,120 5,008 10,621
Interest income 1,233 30 22 14
Interest expense 17,173 35,266 2,062 6,912
Income tax expense 0 1 0 0
RESULT FOR THE PERIOD 33,140 5,876 4,965 20,324
Other comprehensive result for the period 3,893 0 0 368
TOTAL COMPREHENSIVE RESULT FOR THE PERIOD 37,033 5,876 4,965 20,692
NET ASSETS (100%) 118,332 -42,668 -13,892 69,461
EXMAR’S SHARE OF NET ASSETS 59,166 -21,334 -6,946 34,731
SHARE IN THE NET ASSETS OF EQUITY ACCOUNTED INVESTEES AT 1 JANUARY 2016
-11,632 56,699 -24,272 -9,429 31,885
Share in total comprehensive income -826 18,517 2,938 2,483 10,346
Dividends paid/received 0 -15,000 0 0 -7,500
Other 0 -1,050 0 0 0
SHARE IN THE NET ASSETS OF EQUITY ACCOUNTED INVESTEES AT 31 DECEMBER 2016
-12,458 59,166 -21,334 -6,946 34,731
NETTING NEGATIVE EQUITY 12,458 2,753 46,434 6,946 0
SHARE IN THE NET ASSETS OF EQUITY ACCOUNTED INVESTEES AT 31 DECEMBER 2016 AFTER NETTING
0 61,919 25,101 0 34,731
(*) At the end of June 2016, Exmar reached an agreement for the acquisition of 50% of the pressurized fleet held by Wah kwong. As a consequence, these companies are no longer considered as joint ventures and are no longer consolidated as an equity accounted investee. (**) At the end of 2016, Exmar acquired the remaining 50.10% in CMC Belgibo. As a result of this transaction, CMC Belgibo is fully consolidated in the balance sheet instead of presented as an equity accounted investee. (***) At the end of May 2016, Exmar has sold part of its ownership (60%) in the WARIBOKO barge to its Nigerian partner Springview. The remaining investment is remeasured at fair value and consolidated using the equity consolidation method.
(****) The allocation of the negative net assets has been allocated to the respective equity accounted investee.
FINANCIAL REPORT102
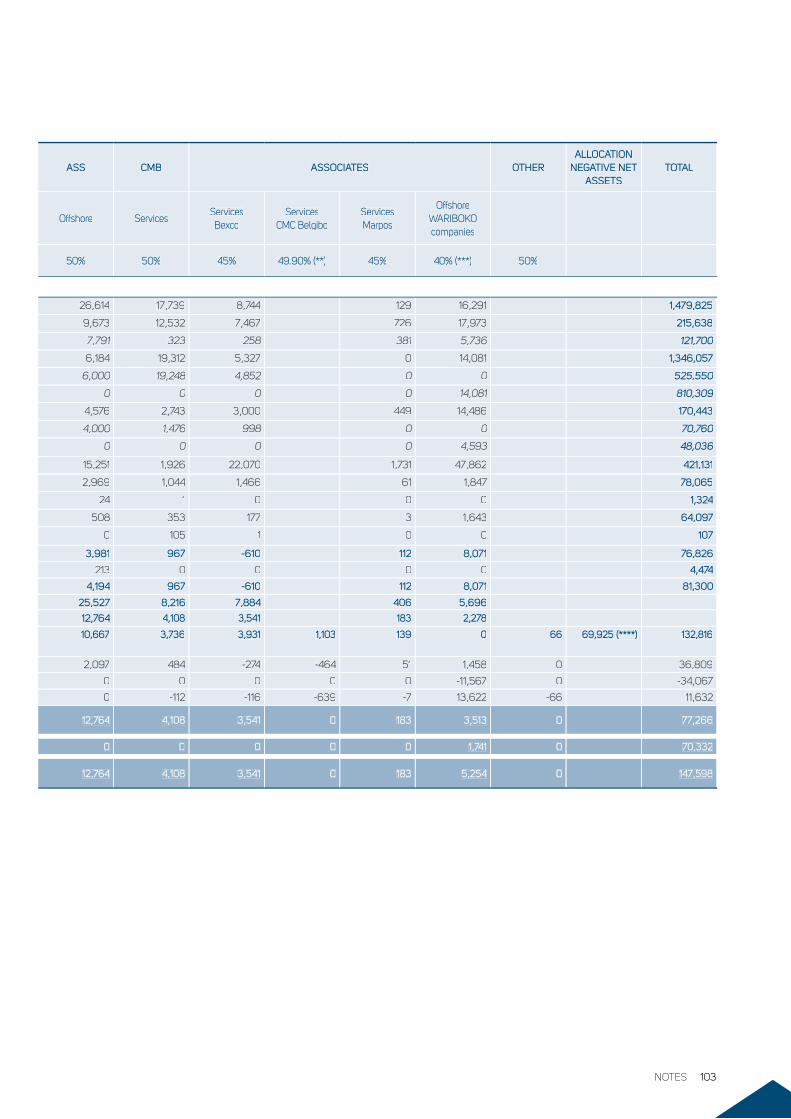
ASS CMB ASSOCIATES OTHERALLOCATION
NEGATIVE NET ASSETS
TOTAL
Offshore ServicesServicesBexco
ServicesCMC Belgibo
ServicesMarpos
OffshoreWARIBOKO companies
50% 50% 45% 49.90% (**) 45% 40% (***) 50%
26,614 17,739 8,744 129 16,291 1,479,825
9,673 12,532 7,467 726 17,973 215,638
7,791 323 258 381 5,736 121,700
6,184 19,312 5,327 0 14,081 1,346,057
6,000 19,248 4,852 0 0 525,550
0 0 0 0 14,081 810,309
4,576 2,743 3,000 449 14,486 170,443
4,000 1,476 998 0 0 70,760
0 0 0 0 4,593 48,036
15,251 1,926 22,070 1,731 47,862 421,131
2,969 1,044 1,466 61 1,847 78,065
24 1 0 0 0 1,324
508 353 177 3 1,643 64,097
0 105 1 0 0 107
3,981 967 -610 112 8,071 76,826
213 0 0 0 0 4,474
4,194 967 -610 112 8,071 81,300
25,527 8,216 7,884 406 5,696
12,764 4,108 3,541 183 2,278
10,667 3,736 3,931 1,103 139 0 66 69,925 (****) 132,816
2,097 484 -274 -464 51 1,458 0 36,809
0 0 0 0 0 -11,567 0 -34,067
0 -112 -116 -639 -7 13,622 -66 11,632
12,764 4,108 3,541 0 183 3,513 0 77,266
0 0 0 0 0 1,741 0 70,332
12,764 4,108 3,541 0 183 5,254 0 147,598
NOTES 103
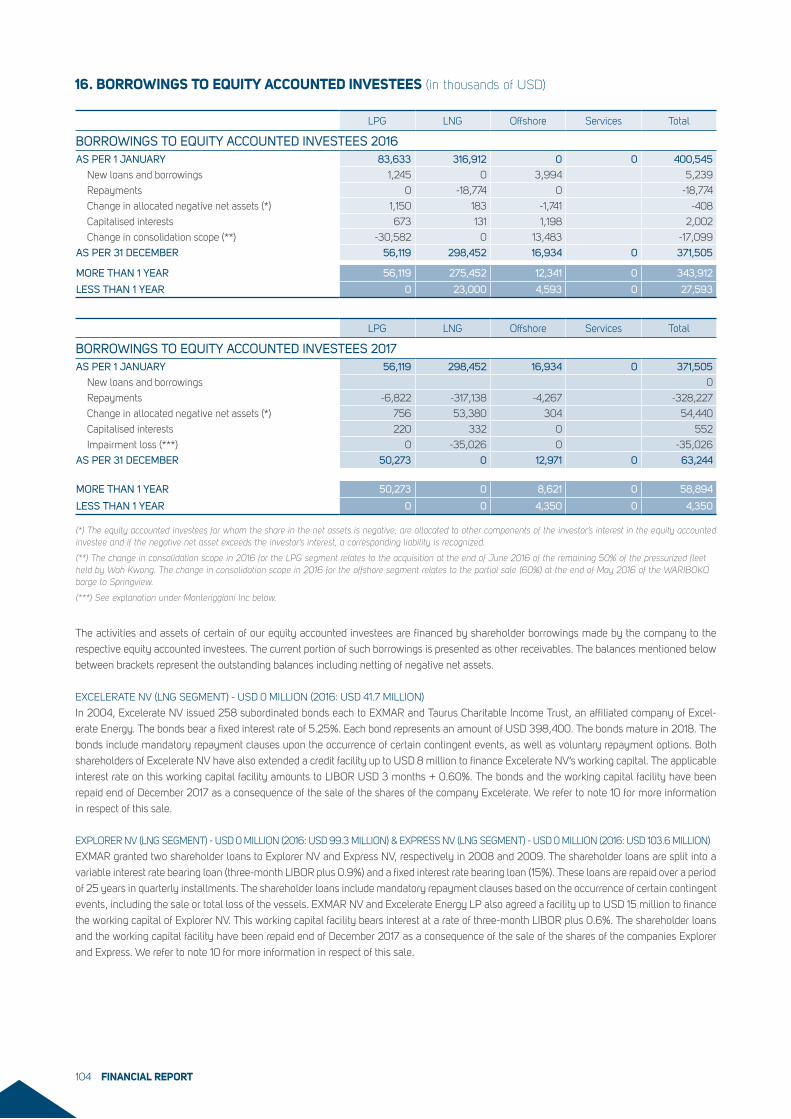
16. BORROWINGS TO EQUITY ACCOUNTED INVESTEES (in thousands of USD)
LPG LNG Offshore Services Total
BORROWINGS TO EQUITY ACCOUNTED INVESTEES 2016AS PER 1 JANUARY 83,633 316,912 0 0 400,545
New loans and borrowings 1,245 0 3,994 5,239
Repayments 0 -18,774 0 -18,774
Change in allocated negative net assets (*) 1,150 183 -1,741 -408
Capitalised interests 673 131 1,198 2,002
Change in consolidation scope (**) -30,582 0 13,483 -17,099
AS PER 31 DECEMBER 56,119 298,452 16,934 0 371,505
MORE THAN 1 YEAR 56,119 275,452 12,341 0 343,912
LESS THAN 1 YEAR 0 23,000 4,593 0 27,593
LPG LNG Offshore Services Total
BORROWINGS TO EQUITY ACCOUNTED INVESTEES 2017AS PER 1 JANUARY 56,119 298,452 16,934 0 371,505
New loans and borrowings 0
Repayments -6,822 -317,138 -4,267 -328,227
Change in allocated negative net assets (*) 756 53,380 304 54,440
Capitalised interests 220 332 0 552
Impairment loss (***) 0 -35,026 0 -35,026
AS PER 31 DECEMBER 50,273 0 12,971 0 63,244
MORE THAN 1 YEAR 50,273 0 8,621 0 58,894
LESS THAN 1 YEAR 0 0 4,350 0 4,350
(*) The equity accounted investees for whom the share in the net assets is negative, are allocated to other components of the investor’s interest in the equity accounted investee and if the negative net asset exceeds the investor’s interest, a corresponding liability is recognized.
(**) The change in consolidation scope in 2016 for the LPG segment relates to the acquisition at the end of June 2016 of the remaining 50% of the pressurized fleet held by Wah Kwong. The change in consolidation scope in 2016 for the offshore segment relates to the partial sale (60%) at the end of May 2016 of the WARIBOKO barge to Springview.
(***) See explanation under Monteriggioni Inc below.
The activities and assets of certain of our equity accounted investees are financed by shareholder borrowings made by the company to the
respective equity accounted investees. The current portion of such borrowings is presented as other receivables. The balances mentioned below
between brackets represent the outstanding balances including netting of negative net assets.
EXCELERATE NV (LNG SEGMENT) - USD 0 MILLION (2016: USD 41.7 MILLION)
In 2004, Excelerate NV issued 258 subordinated bonds each to EXMAR and Taurus Charitable Income Trust, an affiliated company of Excel-
erate Energy. The bonds bear a fixed interest rate of 5.25%. Each bond represents an amount of USD 398,400. The bonds mature in 2018. The
bonds include mandatory repayment clauses upon the occurrence of certain contingent events, as well as voluntary repayment options. Both
shareholders of Excelerate NV have also extended a credit facility up to USD 8 million to finance Excelerate NV’s working capital. The applicable
interest rate on this working capital facility amounts to LIBOR USD 3 months + 0.60%. The bonds and the working capital facility have been
repaid end of December 2017 as a consequence of the sale of the shares of the company Excelerate. We refer to note 10 for more information
in respect of this sale.
EXPLORER NV (LNG SEGMENT) - USD 0 MILLION (2016: USD 99.3 MILLION) & EXPRESS NV (LNG SEGMENT) - USD 0 MILLION (2016: USD 103.6 MILLION)
EXMAR granted two shareholder loans to Explorer NV and Express NV, respectively in 2008 and 2009. The shareholder loans are split into a
variable interest rate bearing loan (three-month LIBOR plus 0.9%) and a fixed interest rate bearing loan (15%). These loans are repaid over a period
of 25 years in quarterly installments. The shareholder loans include mandatory repayment clauses based on the occurrence of certain contingent
events, including the sale or total loss of the vessels. EXMAR NV and Excelerate Energy LP also agreed a facility up to USD 15 million to finance
the working capital of Explorer NV. This working capital facility bears interest at a rate of three-month LIBOR plus 0.6%. The shareholder loans
and the working capital facility have been repaid end of December 2017 as a consequence of the sale of the shares of the companies Explorer
and Express. We refer to note 10 for more information in respect of this sale.
FINANCIAL REPORT104
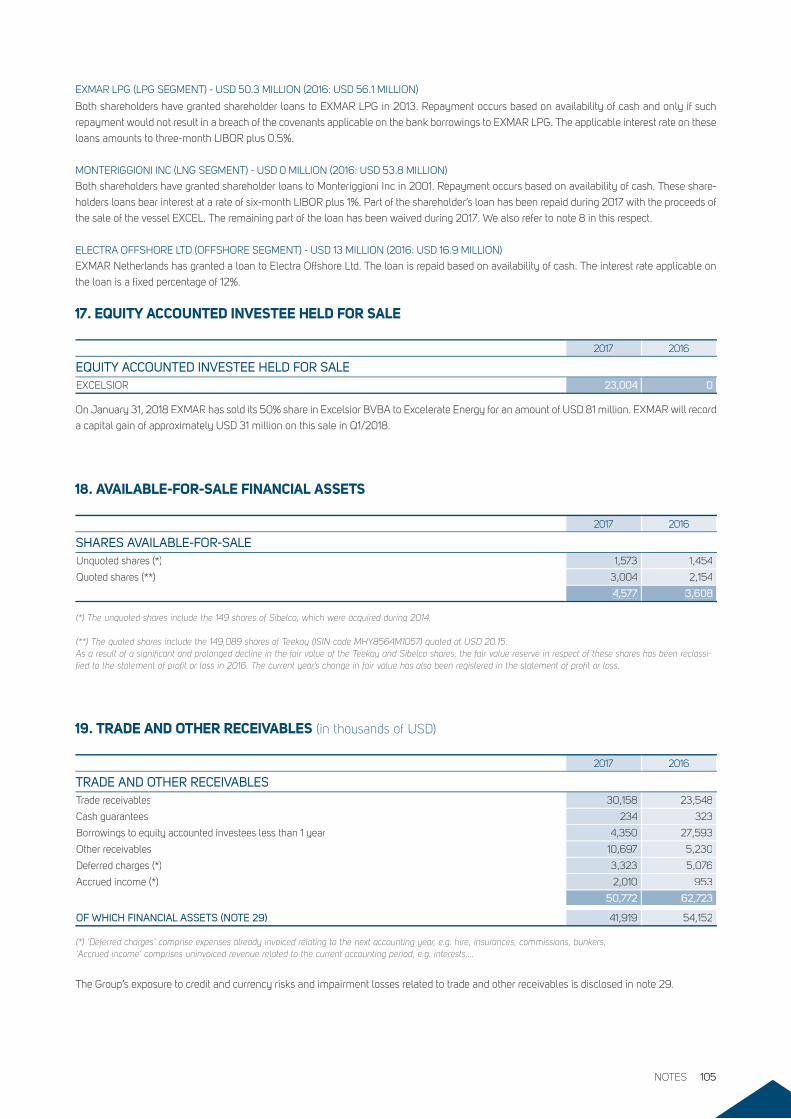
17. EQUITY ACCOUNTED INVESTEE HELD FOR SALE
18. AVAILABLE-FOR-SALE FINANCIAL ASSETS
19. TRADE AND OTHER RECEIVABLES (in thousands of USD)
2017 2016
EQUITY ACCOUNTED INVESTEE HELD FOR SALEEXCELSIOR 23,004 0
On January 31, 2018 EXMAR has sold its 50% share in Excelsior BVBA to Excelerate Energy for an amount of USD 81 million. EXMAR will record
a capital gain of approximately USD 31 million on this sale in Q1/2018.
2017 2016
SHARES AVAILABLE-FOR-SALEUnquoted shares (*) 1,573 1,454
Quoted shares (**) 3,004 2,154
4,577 3,608
(*) The unquoted shares include the 149 shares of Sibelco, which were acquired during 2014.
(**) The quoted shares include the 149,089 shares of Teekay (ISIN code MHY8564M1057) quoted at USD 20.15. As a result of a significant and prolonged decline in the fair value of the Teekay and Sibelco shares, the fair value reserve in respect of these shares has been reclassi-fied to the statement of profit or loss in 2016. The current year’s change in fair value has also been registered in the statement of profit or loss.
2017 2016
TRADE AND OTHER RECEIVABLESTrade receivables 30,158 23,548
Cash guarantees 234 323
Borrowings to equity accounted investees less than 1 year 4,350 27,593
Other receivables 10,697 5,230
Deferred charges (*) 3,323 5,076
Accrued income (*) 2,010 953
50,772 62,723
OF WHICH FINANCIAL ASSETS (NOTE 29) 41,919 54,152
(*) ‘Deferred charges’ comprise expenses already invoiced relating to the next accounting year, e.g. hire, insurances, commissions, bunkers,‘Accrued income’ comprises uninvoiced revenue related to the current accounting period, e.g. interests,...
The Group’s exposure to credit and currency risks and impairment losses related to trade and other receivables is disclosed in note 29.
EXMAR LPG (LPG SEGMENT) - USD 50.3 MILLION (2016: USD 56.1 MILLION)
Both shareholders have granted shareholder loans to EXMAR LPG in 2013. Repayment occurs based on availability of cash and only if such
repayment would not result in a breach of the covenants applicable on the bank borrowings to EXMAR LPG. The applicable interest rate on these
loans amounts to three-month LIBOR plus 0.5%.
MONTERIGGIONI INC (LNG SEGMENT) - USD 0 MILLION (2016: USD 53.8 MILLION)
Both shareholders have granted shareholder loans to Monteriggioni Inc in 2001. Repayment occurs based on availability of cash. These share-
holders loans bear interest at a rate of six-month LIBOR plus 1%. Part of the shareholder’s loan has been repaid during 2017 with the proceeds of
the sale of the vessel EXCEL. The remaining part of the loan has been waived during 2017. We also refer to note 8 in this respect.
ELECTRA OFFSHORE LTD (OFFSHORE SEGMENT) - USD 13 MILLION (2016: USD 16.9 MILLION)
EXMAR Netherlands has granted a loan to Electra Offshore Ltd. The loan is repaid based on availability of cash. The interest rate applicable on
the loan is a fixed percentage of 12%.
NOTES 105
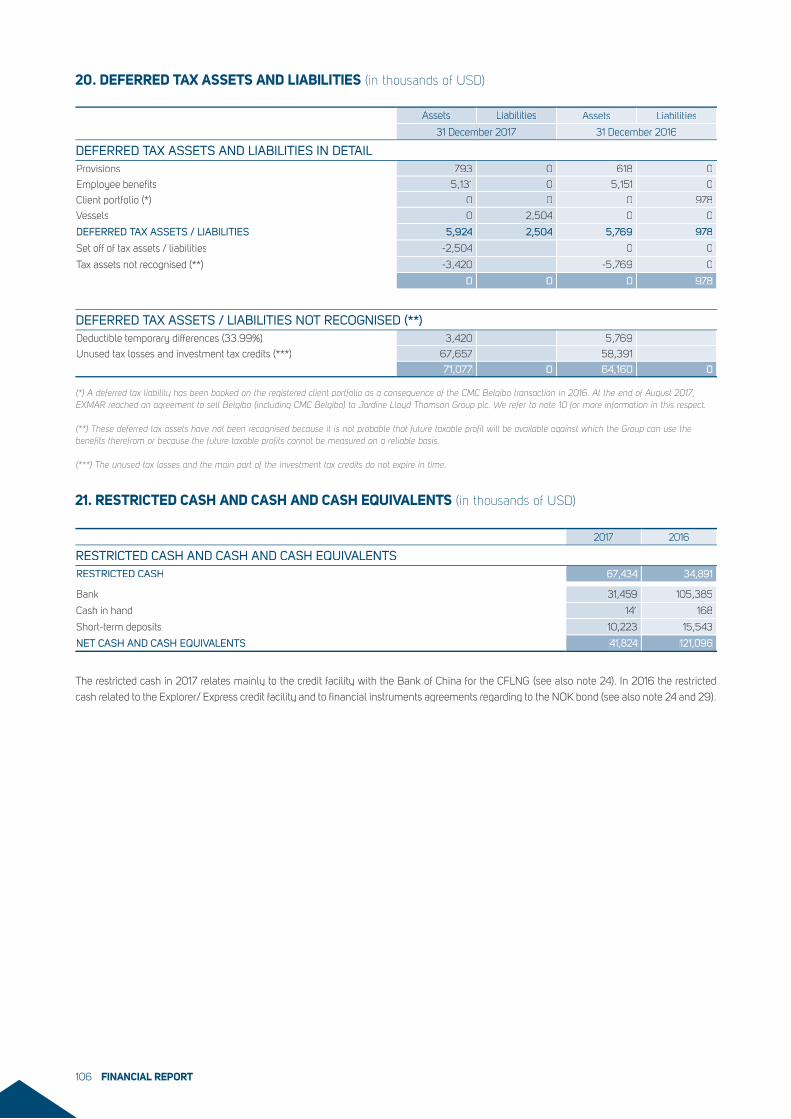
21. RESTRICTED CASH AND CASH AND CASH EQUIVALENTS (in thousands of USD)
2017 2016
RESTRICTED CASH AND CASH AND CASH EQUIVALENTS RESTRICTED CASH 67,434 34,891
Bank 31,459 105,385
Cash in hand 141 168
Short-term deposits 10,223 15,543
NET CASH AND CASH EQUIVALENTS 41,824 121,096
The restricted cash in 2017 relates mainly to the credit facility with the Bank of China for the CFLNG (see also note 24). In 2016 the restricted
cash related to the Explorer/ Express credit facility and to financial instruments agreements regarding to the NOK bond (see also note 24 and 29).
20. DEFERRED TAX ASSETS AND LIABILITIES (in thousands of USD)
Assets Liabilities Assets Liabilities
31 December 2017 31 December 2016
DEFERRED TAX ASSETS AND LIABILITIES IN DETAILProvisions 793 0 618 0
Employee benefits 5,131 0 5,151 0
Client portfolio (*) 0 0 0 978
Vessels 0 2,504 0 0
DEFERRED TAX ASSETS / LIABILITIES 5,924 2,504 5,769 978
Set off of tax assets / liabilities -2,504 0 0
Tax assets not recognised (**) -3,420 -5,769 0
0 0 0 978
DEFERRED TAX ASSETS / LIABILITIES NOT RECOGNISED (**)Deductible temporary differences (33.99%) 3,420 5,769
Unused tax losses and investment tax credits (***) 67,657 58,391
71,077 0 64,160 0
(*) A deferred tax liability has been booked on the registered client portfolio as a consequence of the CMC Belgibo transaction in 2016. At the end of August 2017, EXMAR reached an agreement to sell Belgibo (including CMC Belgibo) to Jardine Lloyd Thomson Group plc. We refer to note 10 for more information in this respect.
(**) These deferred tax assets have not been recognised because it is not probable that future taxable profit will be available against which the Group can use the benefits therefrom or because the future taxable profits cannot be measured on a reliable basis.
(***) The unused tax losses and the main part of the investment tax credits do not expire in time.
FINANCIAL REPORT106
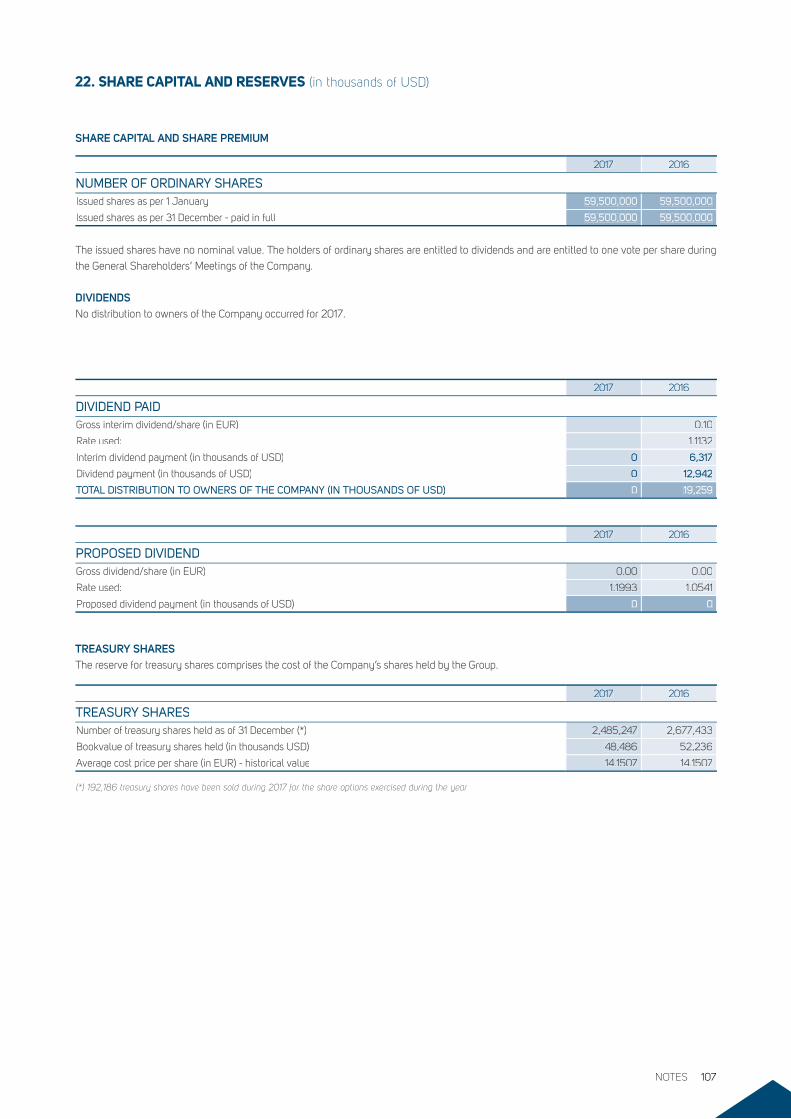
22. SHARE CAPITAL AND RESERVES (in thousands of USD)
2017 2016
NUMBER OF ORDINARY SHARESIssued shares as per 1 January 59,500,000 59,500,000
Issued shares as per 31 December - paid in full 59,500,000 59,500,000
2017 2016
DIVIDEND PAIDGross interim dividend/share (in EUR) 0.10
Rate used: 1.1132
Interim dividend payment (in thousands of USD) 0 6,317
Dividend payment (in thousands of USD) 0 12,942
TOTAL DISTRIBUTION TO OWNERS OF THE COMPANY (IN THOUSANDS OF USD) 0 19,259
2017 2016
PROPOSED DIVIDENDGross dividend/share (in EUR) 0.00 0.00
Rate used: 1.1993 1.0541
Proposed dividend payment (in thousands of USD) 0 0
SHARE CAPITAL AND SHARE PREMIUM
The issued shares have no nominal value. The holders of ordinary shares are entitled to dividends and are entitled to one vote per share during
the General Shareholders’ Meetings of the Company.
DIVIDENDSNo distribution to owners of the Company occurred for 2017.
2017 2016
TREASURY SHARESNumber of treasury shares held as of 31 December (*) 2,485,247 2,677,433
Bookvalue of treasury shares held (in thousands USD) 48,486 52,236
Average cost price per share (in EUR) - historical value 14.1507 14.1507
(*) 192,186 treasury shares have been sold during 2017 for the share options exercised during the year.
TREASURY SHARESThe reserve for treasury shares comprises the cost of the Company’s shares held by the Group.
NOTES 107
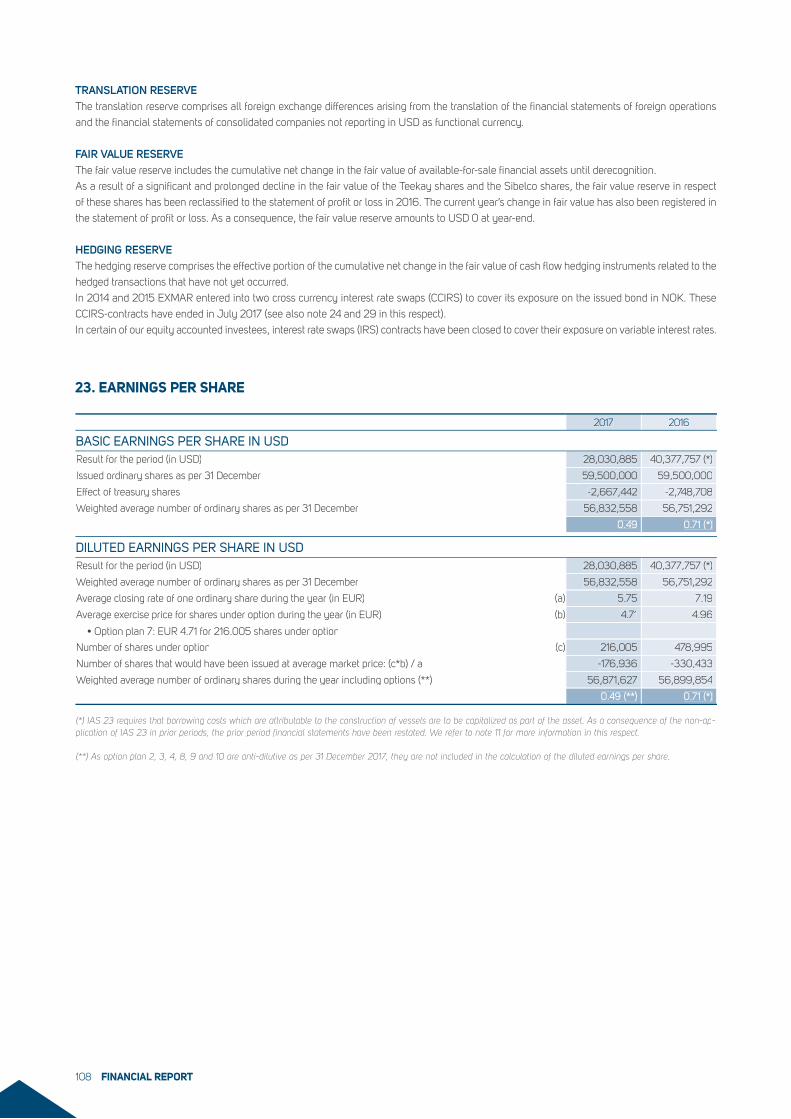
23. EARNINGS PER SHARE
2017 2016
BASIC EARNINGS PER SHARE IN USDResult for the period (in USD) 28,030,885 40,377,757 (*)
Issued ordinary shares as per 31 December 59,500,000 59,500,000
Effect of treasury shares -2,667,442 -2,748,708
Weighted average number of ordinary shares as per 31 December 56,832,558 56,751,292
0.49 0.71 (*)
DILUTED EARNINGS PER SHARE IN USDResult for the period (in USD) 28,030,885 40,377,757 (*)
Weighted average number of ordinary shares as per 31 December 56,832,558 56,751,292
Average closing rate of one ordinary share during the year (in EUR) (a) 5.75 7.19
Average exercise price for shares under option during the year (in EUR) (b) 4.71 4.96
• Option plan 7: EUR 4.71 for 216.005 shares under option
Number of shares under option (c) 216,005 478,995
Number of shares that would have been issued at average market price: (c*b) / a -176,936 -330,433
Weighted average number of ordinary shares during the year including options (**) 56,871,627 56,899,854
0.49 (**) 0.71 (*)
(*) IAS 23 requires that borrowing costs which are attributable to the construction of vessels are to be capitalized as part of the asset. As a consequence of the non-ap-plication of IAS 23 in prior periods, the prior period financial statements have been restated. We refer to note 11 for more information in this respect.
(**) As option plan 2, 3, 4, 8, 9 and 10 are anti-dilutive as per 31 December 2017, they are not included in the calculation of the diluted earnings per share.
TRANSLATION RESERVEThe translation reserve comprises all foreign exchange differences arising from the translation of the financial statements of foreign operations
and the financial statements of consolidated companies not reporting in USD as functional currency.
FAIR VALUE RESERVEThe fair value reserve includes the cumulative net change in the fair value of available-for-sale financial assets until derecognition.
As a result of a significant and prolonged decline in the fair value of the Teekay shares and the Sibelco shares, the fair value reserve in respect
of these shares has been reclassified to the statement of profit or loss in 2016. The current year’s change in fair value has also been registered in
the statement of profit or loss. As a consequence, the fair value reserve amounts to USD 0 at year-end.
HEDGING RESERVEThe hedging reserve comprises the effective portion of the cumulative net change in the fair value of cash flow hedging instruments related to the
hedged transactions that have not yet occurred.
In 2014 and 2015 EXMAR entered into two cross currency interest rate swaps (CCIRS) to cover its exposure on the issued bond in NOK. These
CCIRS-contracts have ended in July 2017 (see also note 24 and 29 in this respect).
In certain of our equity accounted investees, interest rate swaps (IRS) contracts have been closed to cover their exposure on variable interest rates.
FINANCIAL REPORT108
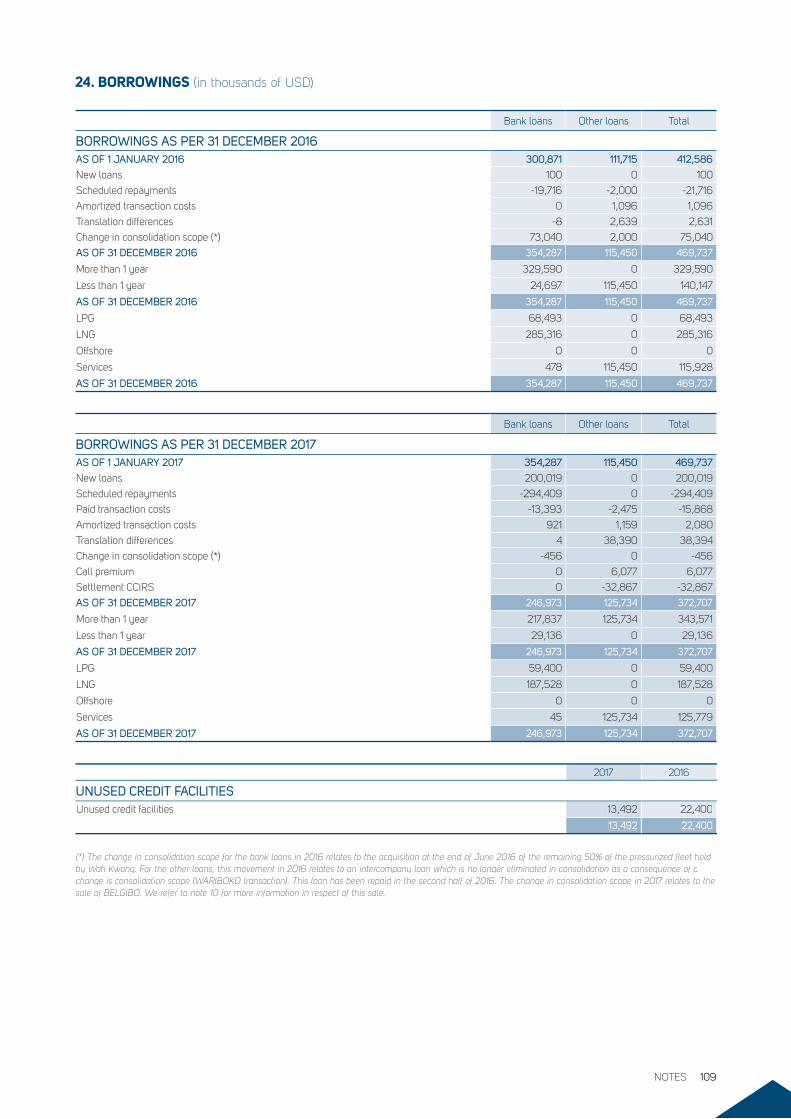
24. BORROWINGS (in thousands of USD)
Bank loans Other loans Total
BORROWINGS AS PER 31 DECEMBER 2016AS OF 1 JANUARY 2016 300,871 111,715 412,586
New loans 100 0 100
Scheduled repayments -19,716 -2,000 -21,716
Amortized transaction costs 0 1,096 1,096
Translation differences -8 2,639 2,631
Change in consolidation scope (*) 73,040 2,000 75,040
AS OF 31 DECEMBER 2016 354,287 115,450 469,737
More than 1 year 329,590 0 329,590
Less than 1 year 24,697 115,450 140,147
AS OF 31 DECEMBER 2016 354,287 115,450 469,737
LPG 68,493 0 68,493
LNG 285,316 0 285,316
Offshore 0 0 0
Services 478 115,450 115,928
AS OF 31 DECEMBER 2016 354,287 115,450 469,737
Bank loans Other loans Total
BORROWINGS AS PER 31 DECEMBER 2017AS OF 1 JANUARY 2017 354,287 115,450 469,737
New loans 200,019 0 200,019
Scheduled repayments -294,409 0 -294,409
Paid transaction costs -13,393 -2,475 -15,868
Amortized transaction costs 921 1,159 2,080
Translation differences 4 38,390 38,394
Change in consolidation scope (*) -456 0 -456
Call premium 0 6,077 6,077
Settlement CCIRS 0 -32,867 -32,867
AS OF 31 DECEMBER 2017 246,973 125,734 372,707
More than 1 year 217,837 125,734 343,571
Less than 1 year 29,136 0 29,136
AS OF 31 DECEMBER 2017 246,973 125,734 372,707
LPG 59,400 0 59,400
LNG 187,528 0 187,528
Offshore 0 0 0
Services 45 125,734 125,779
AS OF 31 DECEMBER 2017 246,973 125,734 372,707
2017 2016
UNUSED CREDIT FACILITIESUnused credit facilities 13,492 22,400
13,492 22,400
(*) The change in consolidation scope for the bank loans in 2016 relates to the acquisition at the end of June 2016 of the remaining 50% of the pressurized fleet held by Wah Kwong. For the other loans, this movement in 2016 relates to an intercompany loan which is no longer eliminated in consolidation as a consequence of a change is consolidation scope (WARIBOKO transaction). This loan has been repaid in the second half of 2016. The change in consolidation scope in 2017 relates to the sale of BELGIBO. We refer to note 10 for more information in respect of this sale.
NOTES 109
BANK LOANSThe bank loans mainly relate to the Excelerate facility, the Explorer/ Express facility, the LPG pressurized facilities and the Caribbean FLNG facility.
EXCELERATE FACILITY - USD 0 MILLION (2016: USD 55.2 MILLION)
In 2005, EXMAR entered into a secured loan facility (the “Excelerate Facility”) for the acquisition of certain bonds issued or to be issued by Exce-
lerate NV to assist in financing the construction and acquisition of the vessel EXCELERATE. The Excelerate Facility consists of three tranches. A
first tranche of up to USD 85 million that bears interest at an annual fixed rate of 5.515%. The principal amount is repayable in 24 consecutive
equal semi-annual installments of approximately USD 3.5 million, ending on October 20, 2018. The other two tranches of respectively USD 22
million and USD 19 million which are referred to collectively as the “commercial loans”, bear interest at an annual rate of three-month LIBOR
plus 1% at all times when the EXCELERATE is under an acceptable charter and an annual rate of three-month LIBOR plus 1.1% at all other times.
The principal amount of the commercial loans is repayable in full at maturity on October 20, 2018. EXMAR may prepay principal amounts owed
pursuant to the Excelerate Facility at any time, with 30 days’ written notice, without any penalty or premium. The Excelerate Facility includes
mandatory repayment clauses based on the occurrence of certain contingent events, including the sale or total loss of the EXCELERATE. The
loan has been repaid in December 2017 as a consequence of the sale of the shares of the company Excelerate. We refer to note 10 for more
information in respect of this sale.
EXPLORER & EXPRESS FACILITY - USD 0 MILLION (2016: USD 230.1 MILLION)
In May 2006, EXMAR entered into a secured loan facility totaling USD 280 million, consisting of two tranches of USD 140 million each, for the
financing of the EXPLORER and the EXPRESS (the “Explorer & Express Facility”). The facility bears interest at an annual floating rate of three-month
LIBOR plus 0.9%. The principal amount of the Explorer & Express Facility is repayable in 48 quarterly installments ranging from approximately
USD 0.62 million to USD 1.2 million for each tranche with a balloon payment of USD 98.7 for each tranche at the maturity date of the loan. The
maturity dates of the facility are April 2020 and April 2021 for EXPLORER and EXPRESS respectively. EXMAR may prepay principal amounts
owed pursuant to the Explorer & Express Facility at any time, with 14 days’ written notice, without any penalty or premium. The Explorer and
Express Facility include mandatory repayment clauses based on the occurrence of certain contingent events, including the sale or total loss of
the vessels. The loans have been repaid in December 2017 as a consequence of the sale of the shares of the companies Explorer and Express.
We refer to note 10 for more information in respect of this sale.
LPG PRESSURIZED FACILITIES - USD 59.4 MILLION (2016: USD 68.5 MILLION)
In October 2008, EXMAR closed a senior secured loan facility of USD 29.6 million for the financing of 2 pressurized LPG vessels. The loan in
repayable in quartely tranches and the applicable interest percentage amounts to three-month LIBOR plus 1%. The last repayment is foreseen
end of March 2019.
In December 2008, EXMAR closed 2 other senior secured loan facilities of respectively USD 67.2 million and USD 42.8 million for the financing
of 8 pressurized LPG vessels. The loans are repayable in quartely tranches and the applicable interest percentage amounts to three-month LIBOR
plus 3%. The last repayment is foreseen at the latest in December 2020.
All obligations of the borrower are guaranteed by EXMAR NV (“guarantor”).
CARIBBEAN FLNG FACILITY - USD 200 MILLION (2016: USD 0)
End of June 2017, EXPORT Lng Limited (a 100% subsidiary of EXMAR NV) has signed a financing agreement of USD 200 million with the Bank
of China (Boc), Deutsche Bank and Sinosure for the financing of the CARIBBEAN FLNG. This loan has been drawn on 27 July 2017 at the time
of the delivery of the CARIBBEAN FLNG. The agreement with BoC provides a repayment period of 12 years and the loan bears interest at a rate
of six-month LIBOR plus 3%. The yearly estimated debt service amounts to USD 26.5 million. There is a requirement for EXPORT to deposit an
amount equal to 30 months principal plus interest, i.e. an amount of USD 67.4 million, on an escrow account. This requirement will be reduced
to 6 months principal plus interest when acceptable long-term employment is secured. All obligations of the borrower are guaranteed by EXMAR
NV (“guarantor”).
OTHER LOANSThe other loans relate to a NOK 700 million senior unsecured bond issue. This bond was closed in July 2014 by EXMAR Netherlands BV (“issuer”),
a 100% subsidiary of EXMAR NV. During 2015, an additional amount of NOK 300 million has been issued (second tranche on the original NOK
700 million bond). The total nominal amount outstanding amounts to NOK 1 billion with initial maturity date in July 2017. In June 2017, the
term of the bond has been extended until July 2019. As a consequence, the bond has been classified as a long term liability in the consolidated
statement of financial position.
As a consequence of the extension of the term of the bond, each bond holder had the possibility to exchange NOK bonds to USD bonds. The
interest percentage applicable on the remaining NOK bonds amounts to three-month NIBOR plus a margin of 8%. The exchanged USD bonds
bear an interest percentage of three-month LIBOR plus a margin of 8.5%. EXMAR has received instructions for exchanges which represents an
amount of USD 15,622,732.
EXMAR has a call option on the bond at anytime. The call option price and redemption price at maturity amounts to 105%. The call premium of
5% amounts to USD 6.1 million and has been registered in profit or loss during 2017.
FINANCIAL REPORT110
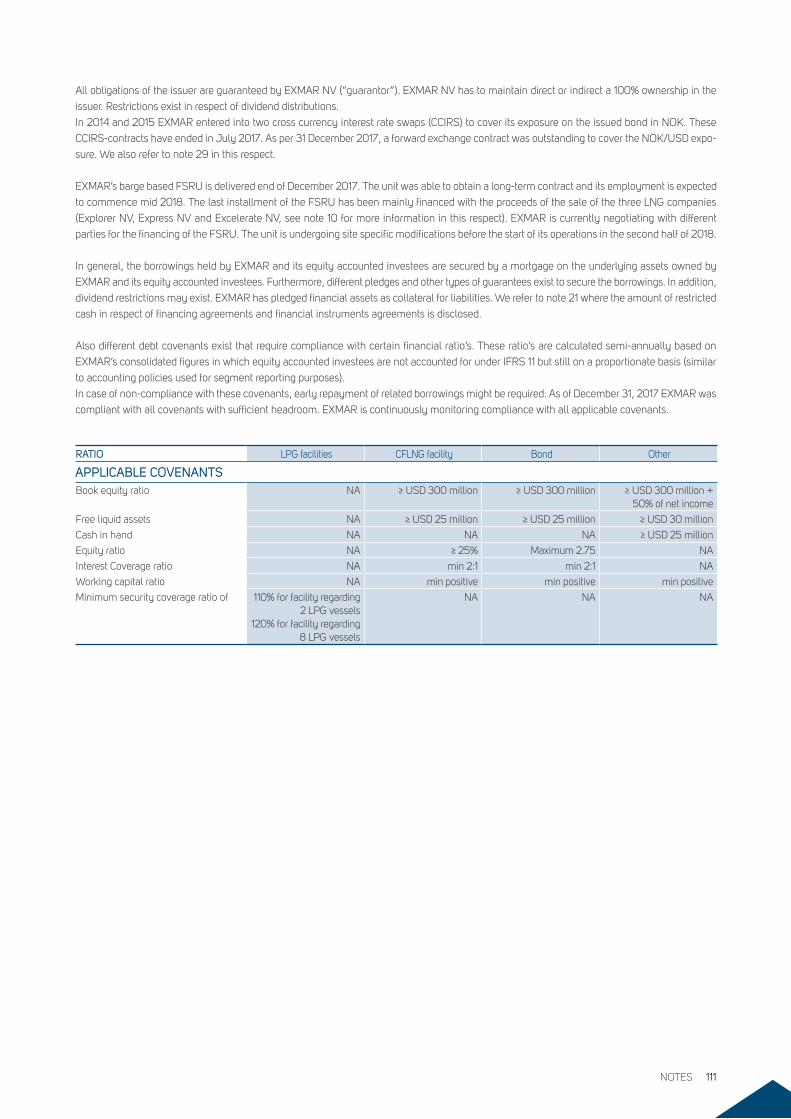
All obligations of the issuer are guaranteed by EXMAR NV (“guarantor”). EXMAR NV has to maintain direct or indirect a 100% ownership in the
issuer. Restrictions exist in respect of dividend distributions.
In 2014 and 2015 EXMAR entered into two cross currency interest rate swaps (CCIRS) to cover its exposure on the issued bond in NOK. These
CCIRS-contracts have ended in July 2017. As per 31 December 2017, a forward exchange contract was outstanding to cover the NOK/USD expo-
sure. We also refer to note 29 in this respect.
EXMAR’s barge based FSRU is delivered end of December 2017. The unit was able to obtain a long-term contract and its employment is expected
to commence mid 2018. The last installment of the FSRU has been mainly financed with the proceeds of the sale of the three LNG companies
(Explorer NV, Express NV and Excelerate NV, see note 10 for more information in this respect). EXMAR is currently negotiating with different
parties for the financing of the FSRU. The unit is undergoing site specific modifications before the start of its operations in the second half of 2018.
In general, the borrowings held by EXMAR and its equity accounted investees are secured by a mortgage on the underlying assets owned by
EXMAR and its equity accounted investees. Furthermore, different pledges and other types of guarantees exist to secure the borrowings. In addition,
dividend restrictions may exist. EXMAR has pledged financial assets as collateral for liabilities. We refer to note 21 where the amount of restricted
cash in respect of financing agreements and financial instruments agreements is disclosed.
Also different debt covenants exist that require compliance with certain financial ratio’s. These ratio’s are calculated semi-annually based on
EXMAR’s consolidated figures in which equity accounted investees are not accounted for under IFRS 11 but still on a proportionate basis (similar
to accounting policies used for segment reporting purposes).
In case of non-compliance with these covenants, early repayment of related borrowings might be required. As of December 31, 2017 EXMAR was
compliant with all covenants with sufficient headroom. EXMAR is continuously monitoring compliance with all applicable covenants.
RATIO LPG facilities CFLNG facility Bond Other
APPLICABLE COVENANTSBook equity ratio NA ≥ USD 300 million ≥ USD 300 million ≥ USD 300 million +
50% of net income
Free liquid assets NA ≥ USD 25 million ≥ USD 25 million ≥ USD 30 million
Cash in hand NA NA NA ≥ USD 25 million
Equity ratio NA ≥ 25% Maximum 2.75 NA
Interest Coverage ratio NA min 2:1 min 2:1 NA
Working capital ratio NA min positive min positive min positive
Minimum security coverage ratio of 110% for facility regarding 2 LPG vessels
120% for facility regarding 8 LPG vessels
NA NA NA
NOTES 111
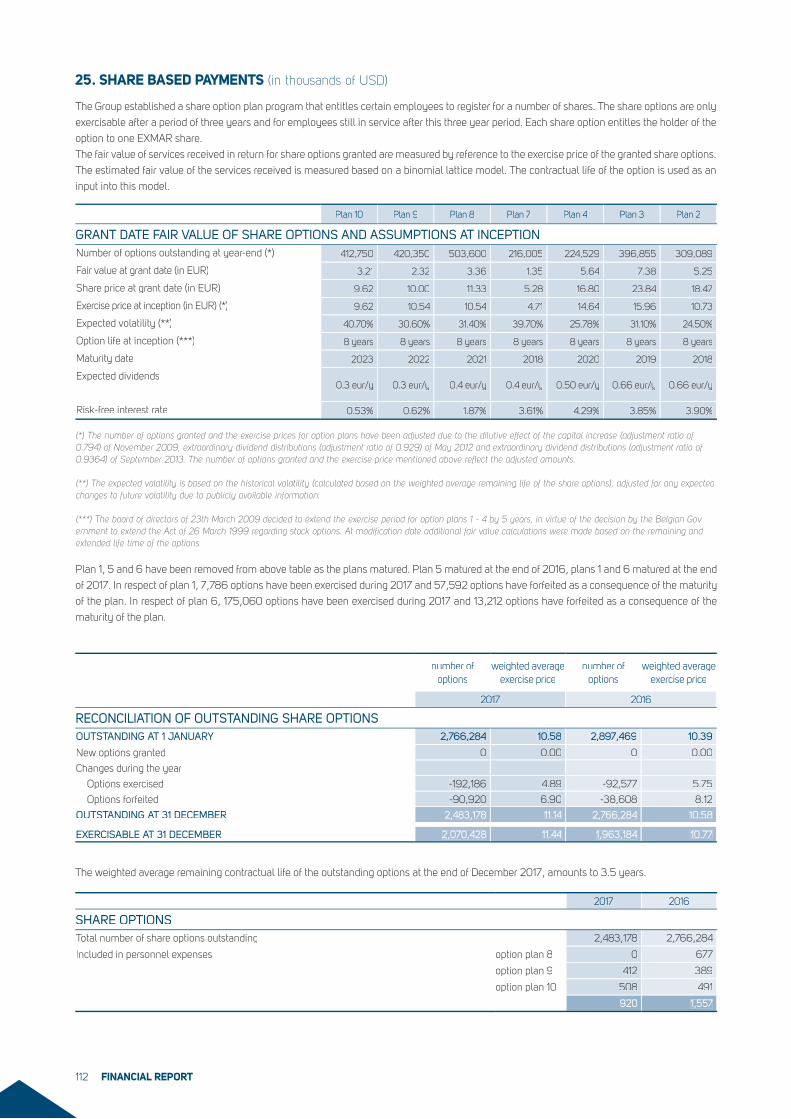
25. SHARE BASED PAYMENTS (in thousands of USD)
The Group established a share option plan program that entitles certain employees to register for a number of shares. The share options are only
exercisable after a period of three years and for employees still in service after this three year period. Each share option entitles the holder of the
option to one EXMAR share.
The fair value of services received in return for share options granted are measured by reference to the exercise price of the granted share options.
The estimated fair value of the services received is measured based on a binomial lattice model. The contractual life of the option is used as an
input into this model.
Plan 10 Plan 9 Plan 8 Plan 7 Plan 4 Plan 3 Plan 2
GRANT DATE FAIR VALUE OF SHARE OPTIONS AND ASSUMPTIONS AT INCEPTIONNumber of options outstanding at year-end (*) 412,750 420,350 503,600 216,005 224,529 396,855 309,089
Fair value at grant date (in EUR) 3.21 2.32 3.36 1.35 5.64 7.38 5.25
Share price at grant date (in EUR) 9.62 10.00 11.33 5.28 16.80 23.84 18.47
Exercise price at inception (in EUR) (*) 9.62 10.54 10.54 4.71 14.64 15.96 10.73
Expected volatility (**) 40.70% 30.60% 31.40% 39.70% 25.78% 31.10% 24.50%
Option life at inception (***) 8 years 8 years 8 years 8 years 8 years 8 years 8 years
Maturity date 2023 2022 2021 2018 2020 2019 2018
Expected dividends0.3 eur/y 0.3 eur/y 0.4 eur/y 0.4 eur/y 0.50 eur/y 0.66 eur/y 0.66 eur/y
Risk-free interest rate 0.53% 0.62% 1.87% 3.61% 4.29% 3.85% 3.90%
(*) The number of options granted and the exercise prices for option plans have been adjusted due to the dilutive effect of the capital increase (adjustment ratio of 0.794) of November 2009, extraordinary dividend distributions (adjustment ratio of 0.929) of May 2012 and extraordinary dividend distributions (adjustment ratio of 0.9364) of September 2013. The number of options granted and the exercise price mentioned above reflect the adjusted amounts.
(**) The expected volatility is based on the historical volatility (calculated based on the weighted average remaining life of the share options), adjusted for any expected changes to future volatility due to publicly available information.
(***) The board of directors of 23th March 2009 decided to extend the exercise period for option plans 1 - 4 by 5 years, in virtue of the decision by the Belgian Gov-ernment to extend the Act of 26 March 1999 regarding stock options. At modification date additional fair value calculations were made based on the remaining and extended life time of the options.
Plan 1, 5 and 6 have been removed from above table as the plans matured. Plan 5 matured at the end of 2016, plans 1 and 6 matured at the end
of 2017. In respect of plan 1, 7,786 options have been exercised during 2017 and 57,592 options have forfeited as a consequence of the maturity
of the plan. In respect of plan 6, 175,060 options have been exercised during 2017 and 13,212 options have forfeited as a consequence of the
maturity of the plan.
number of options
weighted average exercise price
number of options
weighted average exercise price
2017 2016
RECONCILIATION OF OUTSTANDING SHARE OPTIONSOUTSTANDING AT 1 JANUARY 2,766,284 10.58 2,897,469 10.39
New options granted 0 0.00 0 0.00
Changes during the year
Options exercised -192,186 4.89 -92,577 5.75
Options forfeited -90,920 6.90 -38,608 8.12
OUTSTANDING AT 31 DECEMBER 2,483,178 11.14 2,766,284 10.58
EXERCISABLE AT 31 DECEMBER 2,070,428 11.44 1,963,184 10.77
2017 2016
SHARE OPTIONSTotal number of share options outstanding 2,483,178 2,766,284
Included in personnel expenses option plan 8 0 677
option plan 9 412 389
option plan 10 508 491
920 1,557
The weighted average remaining contractual life of the outstanding options at the end of December 2017, amounts to 3.5 years.
FINANCIAL REPORT112
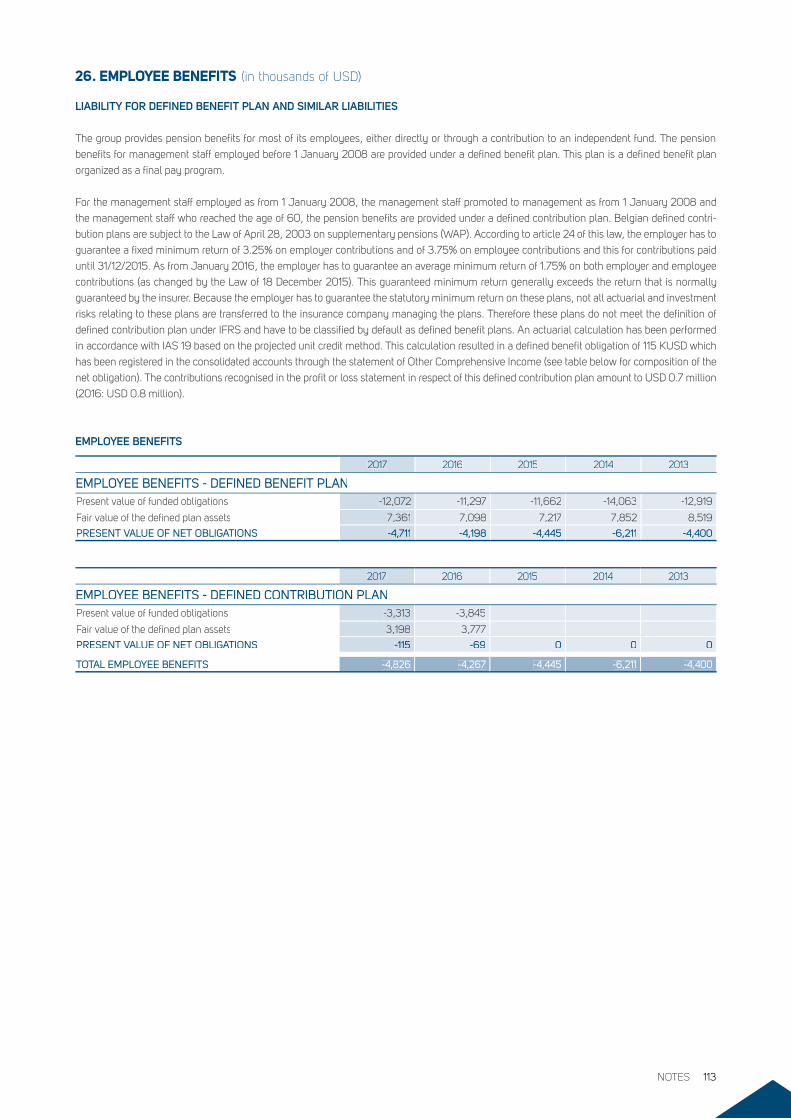
26. EMPLOYEE BENEFITS (in thousands of USD)
LIABILITY FOR DEFINED BENEFIT PLAN AND SIMILAR LIABILITIES
The group provides pension benefits for most of its employees, either directly or through a contribution to an independent fund. The pension
benefits for management staff employed before 1 January 2008 are provided under a defined benefit plan. This plan is a defined benefit plan
organized as a final pay program.
For the management staff employed as from 1 January 2008, the management staff promoted to management as from 1 January 2008 and
the management staff who reached the age of 60, the pension benefits are provided under a defined contribution plan. Belgian defined contri-
bution plans are subject to the Law of April 28, 2003 on supplementary pensions (WAP). According to article 24 of this law, the employer has to
guarantee a fixed minimum return of 3.25% on employer contributions and of 3.75% on employee contributions and this for contributions paid
until 31/12/2015. As from January 2016, the employer has to guarantee an average minimum return of 1.75% on both employer and employee
contributions (as changed by the Law of 18 December 2015). This guaranteed minimum return generally exceeds the return that is normally
guaranteed by the insurer. Because the employer has to guarantee the statutory minimum return on these plans, not all actuarial and investment
risks relating to these plans are transferred to the insurance company managing the plans. Therefore these plans do not meet the definition of
defined contribution plan under IFRS and have to be classified by default as defined benefit plans. An actuarial calculation has been performed
in accordance with IAS 19 based on the projected unit credit method. This calculation resulted in a defined benefit obligation of 115 KUSD which
has been registered in the consolidated accounts through the statement of Other Comprehensive Income (see table below for composition of the
net obligation). The contributions recognised in the profit or loss statement in respect of this defined contribution plan amount to USD 0.7 million
(2016: USD 0.8 million).
2017 2016 2015 2014 2013
EMPLOYEE BENEFITS - DEFINED BENEFIT PLANPresent value of funded obligations -12,072 -11,297 -11,662 -14,063 -12,919
Fair value of the defined plan assets 7,361 7,098 7,217 7,852 8,519
PRESENT VALUE OF NET OBLIGATIONS -4,711 -4,198 -4,445 -6,211 -4,400
2017 2016 2015 2014 2013
EMPLOYEE BENEFITS - DEFINED CONTRIBUTION PLANPresent value of funded obligations -3,313 -3,845
Fair value of the defined plan assets 3,198 3,777
PRESENT VALUE OF NET OBLIGATIONS -115 -69 0 0 0
TOTAL EMPLOYEE BENEFITS -4,826 -4,267 -4,445 -6,211 -4,400
EMPLOYEE BENEFITS
NOTES 113
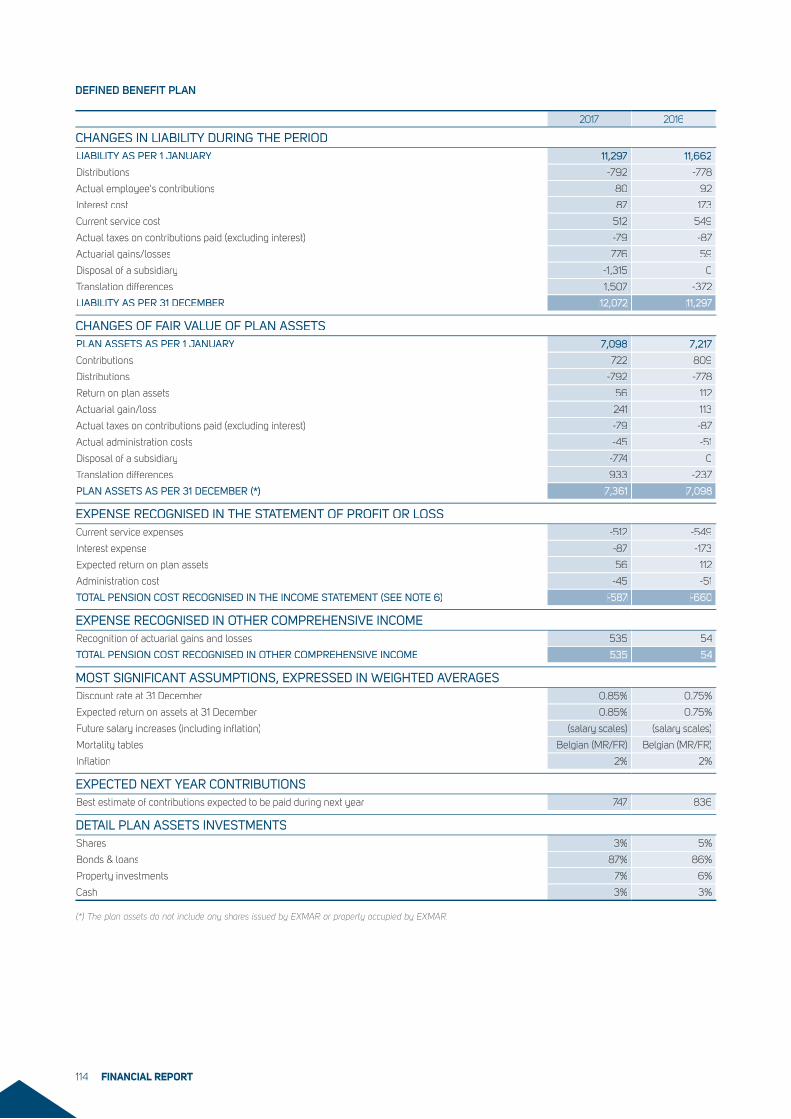
DEFINED BENEFIT PLAN
2017 2016
CHANGES IN LIABILITY DURING THE PERIODLIABILITY AS PER 1 JANUARY 11,297 11,662
Distributions -792 -778
Actual employee's contributions 80 92
Interest cost 87 173
Current service cost 512 549
Actual taxes on contributions paid (excluding interest) -79 -87
Actuarial gains/losses 776 59
Disposal of a subsidiary -1,315 0
Translation differences 1,507 -372
LIABILITY AS PER 31 DECEMBER 12,072 11,297
CHANGES OF FAIR VALUE OF PLAN ASSETS PLAN ASSETS AS PER 1 JANUARY 7,098 7,217
Contributions 722 809
Distributions -792 -778
Return on plan assets 56 112
Actuarial gain/loss 241 113
Actual taxes on contributions paid (excluding interest) -79 -87
Actual administration costs -45 -51
Disposal of a subsidiary -774 0
Translation differences 933 -237
PLAN ASSETS AS PER 31 DECEMBER (*) 7,361 7,098
EXPENSE RECOGNISED IN THE STATEMENT OF PROFIT OR LOSS Current service expenses -512 -549
Interest expense -87 -173
Expected return on plan assets 56 112
Administration cost -45 -51
TOTAL PENSION COST RECOGNISED IN THE INCOME STATEMENT (SEE NOTE 6) -587 -660
EXPENSE RECOGNISED IN OTHER COMPREHENSIVE INCOME Recognition of actuarial gains and losses 535 54
TOTAL PENSION COST RECOGNISED IN OTHER COMPREHENSIVE INCOME 535 54
MOST SIGNIFICANT ASSUMPTIONS, EXPRESSED IN WEIGHTED AVERAGESDiscount rate at 31 December 0.85% 0.75%
Expected return on assets at 31 December 0.85% 0.75%
Future salary increases (including inflation) (salary scales) (salary scales)
Mortality tables Belgian (MR/FR) Belgian (MR/FR)
Inflation 2% 2%
EXPECTED NEXT YEAR CONTRIBUTIONSBest estimate of contributions expected to be paid during next year 747 836
DETAIL PLAN ASSETS INVESTMENTSShares 3% 5%
Bonds & loans 87% 86%
Property investments 7% 6%
Cash 3% 3%
(*) The plan assets do not include any shares issued by EXMAR or property occupied by EXMAR.
FINANCIAL REPORT114
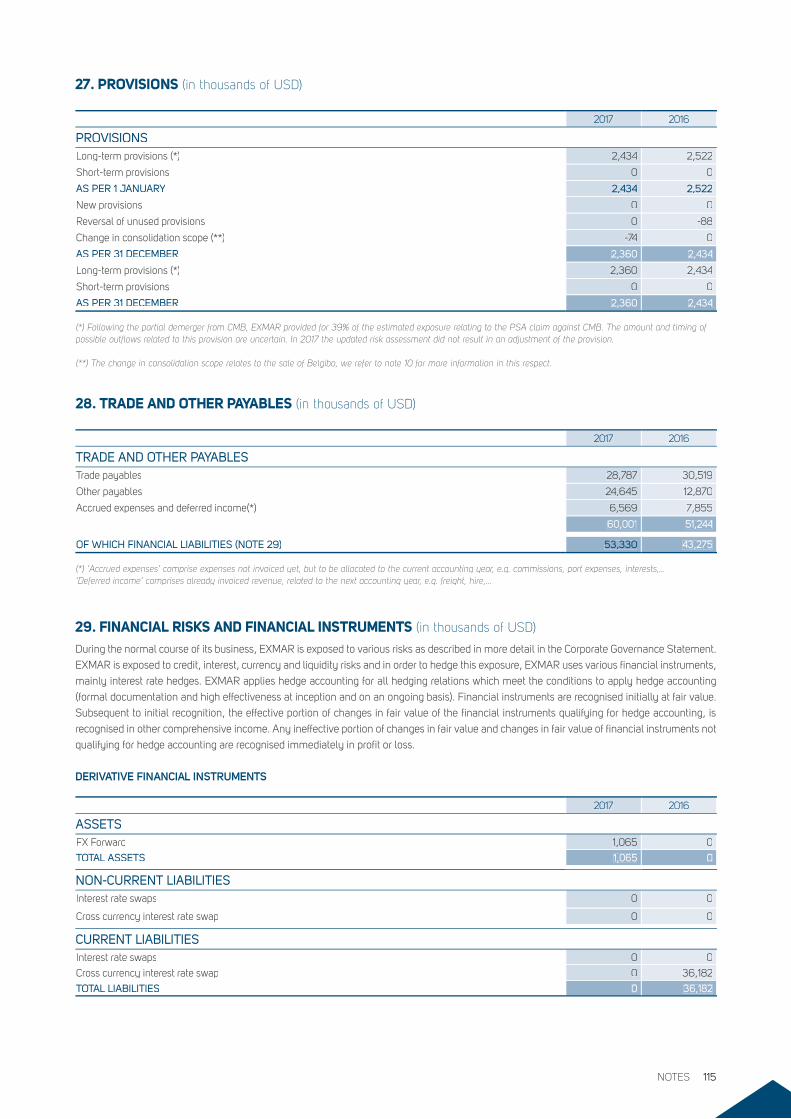
27. PROVISIONS (in thousands of USD)
2017 2016
PROVISIONSLong-term provisions (*) 2,434 2,522
Short-term provisions 0 0
AS PER 1 JANUARY AS PER 1 JANUARY 2,434 2,522
New provisions 0 0
Reversal of unused provisions 0 -88
Change in consolidation scope (**) -74 0
AS PER 31 DECEMBERAS PER 31 DECEMBER 2,360 2,434
Long-term provisions (*) 2,360 2,434
Short-term provisions 0 0
AS PER 31 DECEMBERAS PER 31 DECEMBER 2,360 2,434
(*) Following the partial demerger from CMB, EXMAR provided for 39% of the estimated exposure relating to the PSA claim against CMB. The amount and timing of possible outflows related to this provision are uncertain. In 2017 the updated risk assessment did not result in an adjustment of the provision.
(**) The change in consolidation scope relates to the sale of Belgibo, we refer to note 10 for more information in this respect.
28. TRADE AND OTHER PAYABLES (in thousands of USD)
2017 2016
TRADE AND OTHER PAYABLESTrade payables 28,787 30,519
Other payables 24,645 12,870
Accrued expenses and deferred income(*) 6,569 7,855
60,001 51,244
OF WHICH FINANCIAL LIABILITIES (NOTE 29) 53,330 43,275
(*) ‘Accrued expenses’ comprise expenses not invoiced yet, but to be allocated to the current accounting year, e.g. commissions, port expenses, interests,...‘Deferred income’ comprises already invoiced revenue, related to the next accounting year, e.g. freight, hire,...
29. FINANCIAL RISKS AND FINANCIAL INSTRUMENTS (in thousands of USD)
During the normal course of its business, EXMAR is exposed to various risks as described in more detail in the Corporate Governance Statement.
EXMAR is exposed to credit, interest, currency and liquidity risks and in order to hedge this exposure, EXMAR uses various financial instruments,
mainly interest rate hedges. EXMAR applies hedge accounting for all hedging relations which meet the conditions to apply hedge accounting
(formal documentation and high effectiveness at inception and on an ongoing basis). Financial instruments are recognised initially at fair value.
Subsequent to initial recognition, the effective portion of changes in fair value of the financial instruments qualifying for hedge accounting, is
recognised in other comprehensive income. Any ineffective portion of changes in fair value and changes in fair value of financial instruments not
qualifying for hedge accounting are recognised immediately in profit or loss.
DERIVATIVE FINANCIAL INSTRUMENTS
2017 2016
ASSETS ASSETS FX Forward 1,065 0
TOTAL ASSETS 1,065 0
NON-CURRENT LIABILITIES Interest rate swaps 0 0
Cross currency interest rate swap 0 0
CURRENT LIABILITIES Interest rate swaps 0 0
Cross currency interest rate swap 0 36,182
TOTAL LIABILITIES 0 36,182
NOTES 115
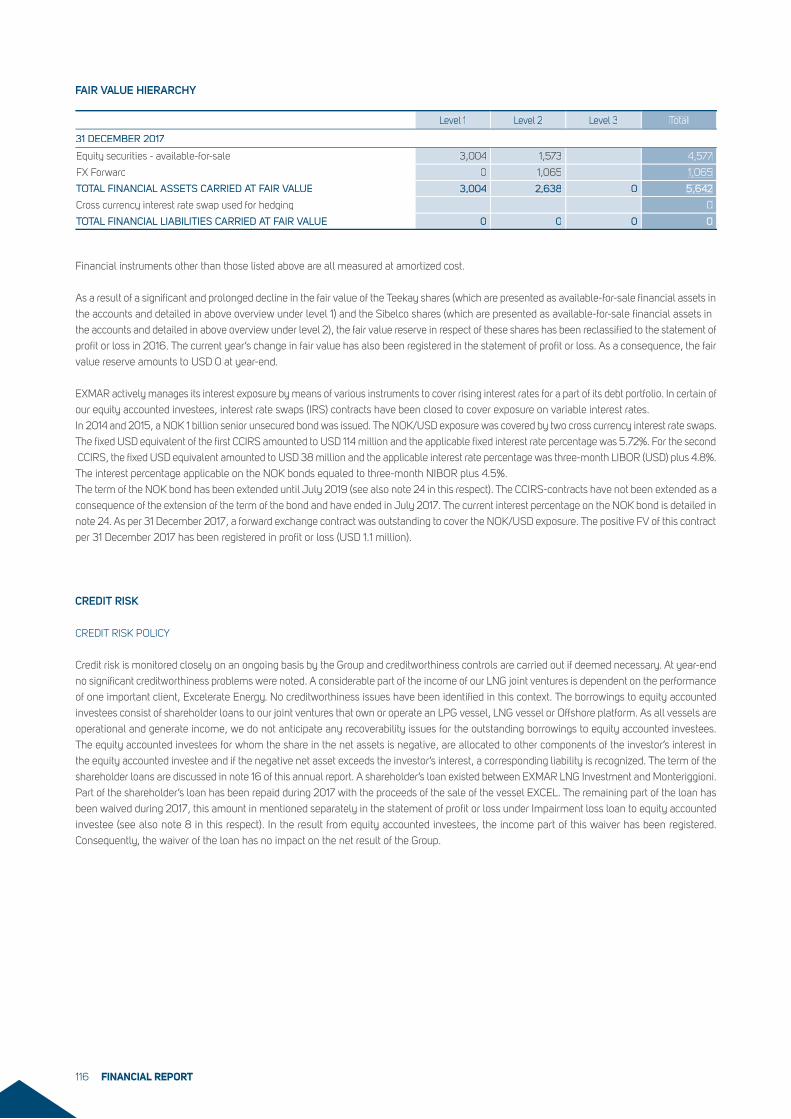
Financial instruments other than those listed above are all measured at amortized cost.
As a result of a significant and prolonged decline in the fair value of the Teekay shares (which are presented as available-for-sale financial assets in
the accounts and detailed in above overview under level 1) and the Sibelco shares (which are presented as available-for-sale financial assets in
the accounts and detailed in above overview under level 2), the fair value reserve in respect of these shares has been reclassified to the statement of
profit or loss in 2016. The current year’s change in fair value has also been registered in the statement of profit or loss. As a consequence, the fair
value reserve amounts to USD 0 at year-end.
EXMAR actively manages its interest exposure by means of various instruments to cover rising interest rates for a part of its debt portfolio. In certain of
our equity accounted investees, interest rate swaps (IRS) contracts have been closed to cover exposure on variable interest rates.
In 2014 and 2015, a NOK 1 billion senior unsecured bond was issued. The NOK/USD exposure was covered by two cross currency interest rate swaps.
The fixed USD equivalent of the first CCIRS amounted to USD 114 million and the applicable fixed interest rate percentage was 5.72%. For the second
CCIRS, the fixed USD equivalent amounted to USD 38 million and the applicable interest rate percentage was three-month LIBOR (USD) plus 4.8%.
The interest percentage applicable on the NOK bonds equaled to three-month NIBOR plus 4.5%.
The term of the NOK bond has been extended until July 2019 (see also note 24 in this respect). The CCIRS-contracts have not been extended as a
consequence of the extension of the term of the bond and have ended in July 2017. The current interest percentage on the NOK bond is detailed in
note 24. As per 31 December 2017, a forward exchange contract was outstanding to cover the NOK/USD exposure. The positive FV of this contract
per 31 December 2017 has been registered in profit or loss (USD 1.1 million).
FAIR VALUE HIERARCHY
Level 1 Level 2 Level 3 Total
31 DECEMBER 2017
Equity securities - available-for-sale 3,004 1,573 4,577
FX Forward 0 1,065 1,065
TOTAL FINANCIAL ASSETS CARRIED AT FAIR VALUE 3,004 2,638 0 5,642
Cross currency interest rate swap used for hedging 0
TOTAL FINANCIAL LIABILITIES CARRIED AT FAIR VALUE 0 0 0 0
CREDIT RISK
CREDIT RISK POLICY
Credit risk is monitored closely on an ongoing basis by the Group and creditworthiness controls are carried out if deemed necessary. At year-end
no significant creditworthiness problems were noted. A considerable part of the income of our LNG joint ventures is dependent on the performance
of one important client, Excelerate Energy. No creditworthiness issues have been identified in this context. The borrowings to equity accounted
investees consist of shareholder loans to our joint ventures that own or operate an LPG vessel, LNG vessel or Offshore platform. As all vessels are
operational and generate income, we do not anticipate any recoverability issues for the outstanding borrowings to equity accounted investees.
The equity accounted investees for whom the share in the net assets is negative, are allocated to other components of the investor’s interest in
the equity accounted investee and if the negative net asset exceeds the investor’s interest, a corresponding liability is recognized. The term of the
shareholder loans are discussed in note 16 of this annual report. A shareholder’s loan existed between EXMAR LNG Investment and Monteriggioni.
Part of the shareholder’s loan has been repaid during 2017 with the proceeds of the sale of the vessel EXCEL. The remaining part of the loan has
been waived during 2017, this amount in mentioned separately in the statement of profit or loss under Impairment loss loan to equity accounted
investee (see also note 8 in this respect). In the result from equity accounted investees, the income part of this waiver has been registered.
Consequently, the waiver of the loan has no impact on the net result of the Group.
FINANCIAL REPORT116
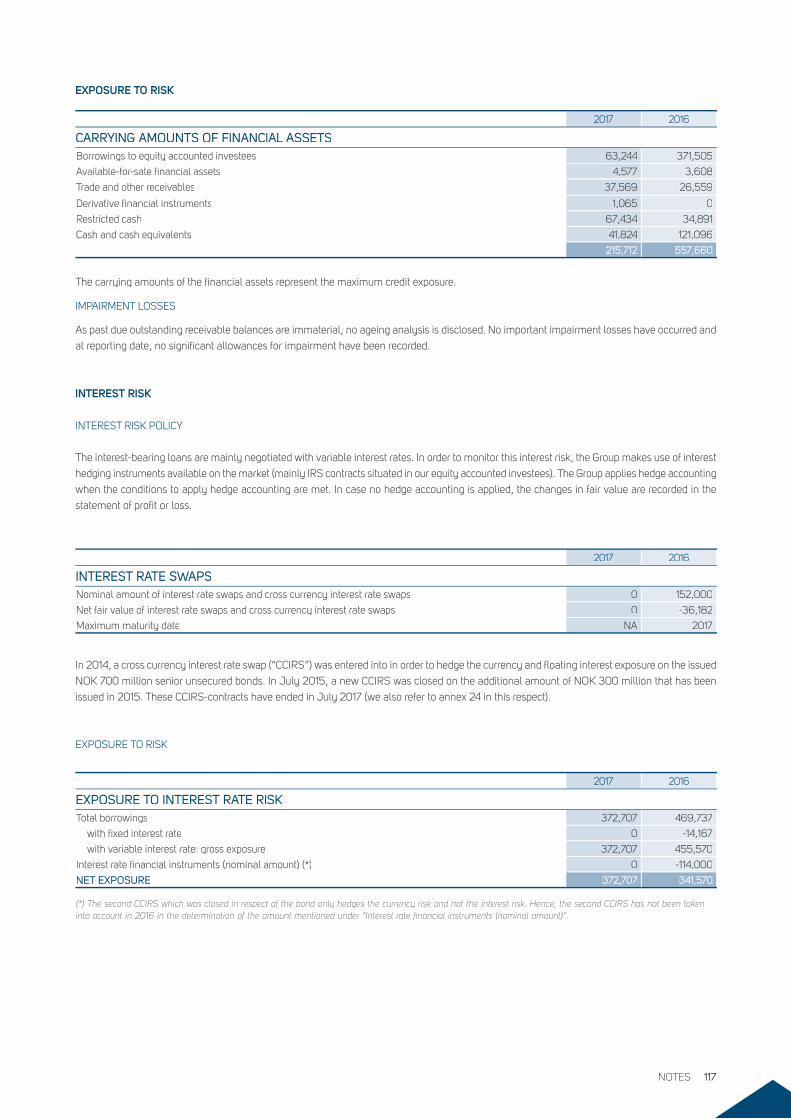
EXPOSURE TO RISK
2017 2016
CARRYING AMOUNTS OF FINANCIAL ASSETSBorrowings to equity accounted investees 63,244 371,505
Available-for-sale financial assets 4,577 3,608
Trade and other receivables 37,569 26,559
Derivative financial instruments 1,065 0
Restricted cash 67,434 34,891
Cash and cash equivalents 41,824 121,096
215,712 557,660
The carrying amounts of the financial assets represent the maximum credit exposure.
IMPAIRMENT LOSSES
As past due outstanding receivable balances are immaterial, no ageing analysis is disclosed. No important impairment losses have occurred and
at reporting date, no significant allowances for impairment have been recorded.
INTEREST RISK
INTEREST RISK POLICY
The interest-bearing loans are mainly negotiated with variable interest rates. In order to monitor this interest risk, the Group makes use of interest
hedging instruments available on the market (mainly IRS contracts situated in our equity accounted investees). The Group applies hedge accounting
when the conditions to apply hedge accounting are met. In case no hedge accounting is applied, the changes in fair value are recorded in the
statement of profit or loss.
In 2014, a cross currency interest rate swap (“CCIRS”) was entered into in order to hedge the currency and floating interest exposure on the issued
NOK 700 million senior unsecured bonds. In July 2015, a new CCIRS was closed on the additional amount of NOK 300 million that has been
issued in 2015. These CCIRS-contracts have ended in July 2017 (we also refer to annex 24 in this respect).
2017 2016
INTEREST RATE SWAPSNominal amount of interest rate swaps and cross currency interest rate swaps 0 152,000
Net fair value of interest rate swaps and cross currency interest rate swaps 0 -36,182
Maximum maturity date NA 2017
EXPOSURE TO RISK
2017 2016
EXPOSURE TO INTEREST RATE RISKTotal borrowings 372,707 469,737
with fixed interest rate 0 -14,167
with variable interest rate: gross exposure 372,707 455,570
Interest rate financial instruments (nominal amount) (*) 0 -114,000
NET EXPOSURE 372,707 341,570
(*) The second CCIRS which was closed in respect of the bond only hedges the currency risk and not the interest risk. Hence, the second CCIRS has not been taken into account in 2016 in the determination of the amount mentioned under “Interest rate financial instruments (nominal amount)”.
NOTES 117
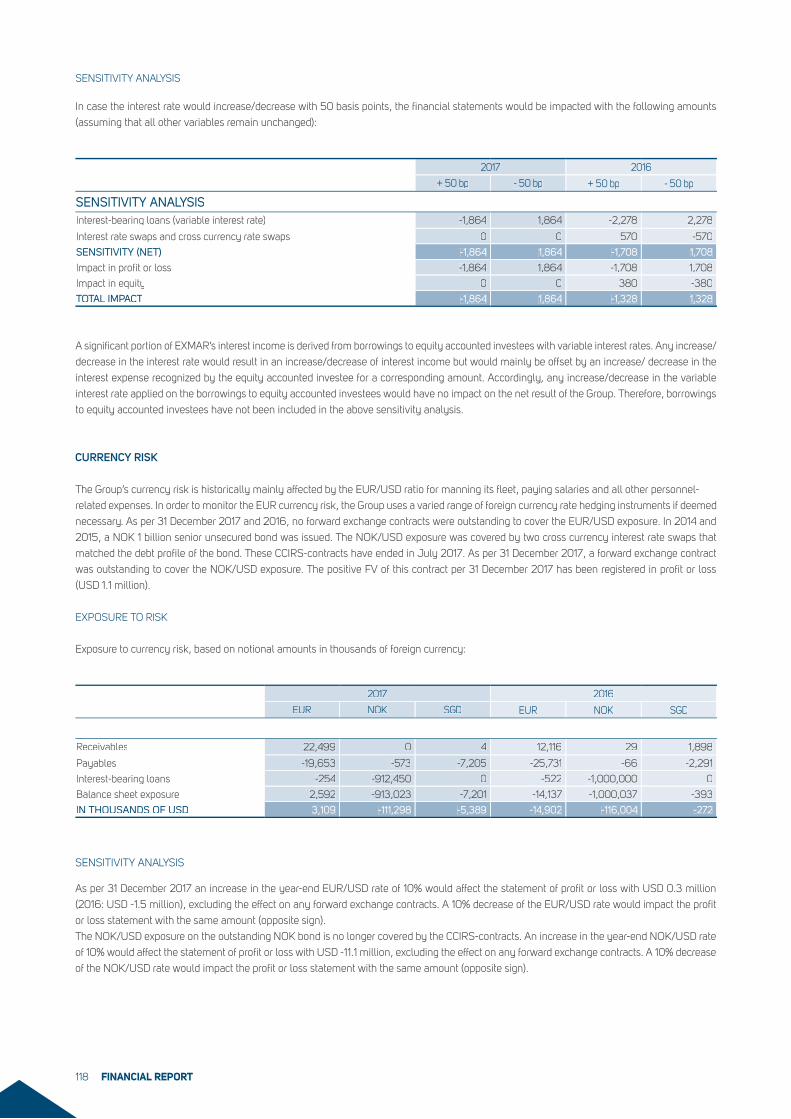
2017 2016
+ 50 bp - 50 bp + 50 bp - 50 bp
SENSITIVITY ANALYSISInterest-bearing loans (variable interest rate) -1,864 1,864 -2,278 2,278
Interest rate swaps and cross currency rate swaps 0 0 570 -570
SENSITIVITY (NET) -1,864 1,864 -1,708 1,708
Impact in profit or loss -1,864 1,864 -1,708 1,708
Impact in equity 0 0 380 -380
TOTAL IMPACT -1,864 1,864 -1,328 1,328
2017 2016
EUR NOK SGD EUR NOK SGD
Receivables 22,499 0 4 12,116 29 1,898
Payables -19,653 -573 -7,205 -25,731 -66 -2,291
Interest-bearing loans -254 -912,450 0 -522 -1,000,000 0
Balance sheet exposure 2,592 -913,023 -7,201 -14,137 -1,000,037 -393
IN THOUSANDS OF USD 3,109 -111,298 -5,389 -14,902 -116,004 -272
SENSITIVITY ANALYSIS
In case the interest rate would increase/decrease with 50 basis points, the financial statements would be impacted with the following amounts
(assuming that all other variables remain unchanged):
A significant portion of EXMAR’s interest income is derived from borrowings to equity accounted investees with variable interest rates. Any increase/
decrease in the interest rate would result in an increase/decrease of interest income but would mainly be offset by an increase/ decrease in the
interest expense recognized by the equity accounted investee for a corresponding amount. Accordingly, any increase/decrease in the variable
interest rate applied on the borrowings to equity accounted investees would have no impact on the net result of the Group. Therefore, borrowings
to equity accounted investees have not been included in the above sensitivity analysis.
CURRENCY RISK
The Group’s currency risk is historically mainly affected by the EUR/USD ratio for manning its fleet, paying salaries and all other personnel-
related expenses. In order to monitor the EUR currency risk, the Group uses a varied range of foreign currency rate hedging instruments if deemed
necessary. As per 31 December 2017 and 2016, no forward exchange contracts were outstanding to cover the EUR/USD exposure. In 2014 and
2015, a NOK 1 billion senior unsecured bond was issued. The NOK/USD exposure was covered by two cross currency interest rate swaps that
matched the debt profile of the bond. These CCIRS-contracts have ended in July 2017. As per 31 December 2017, a forward exchange contract
was outstanding to cover the NOK/USD exposure. The positive FV of this contract per 31 December 2017 has been registered in profit or loss
(USD 1.1 million).
EXPOSURE TO RISK
Exposure to currency risk, based on notional amounts in thousands of foreign currency:
SENSITIVITY ANALYSIS
As per 31 December 2017 an increase in the year-end EUR/USD rate of 10% would affect the statement of profit or loss with USD 0.3 million
(2016: USD -1.5 million), excluding the effect on any forward exchange contracts. A 10% decrease of the EUR/USD rate would impact the profit
or loss statement with the same amount (opposite sign).
The NOK/USD exposure on the outstanding NOK bond is no longer covered by the CCIRS-contracts. An increase in the year-end NOK/USD rate
of 10% would affect the statement of profit or loss with USD -11.1 million, excluding the effect on any forward exchange contracts. A 10% decrease
of the NOK/USD rate would impact the profit or loss statement with the same amount (opposite sign).
FINANCIAL REPORT118
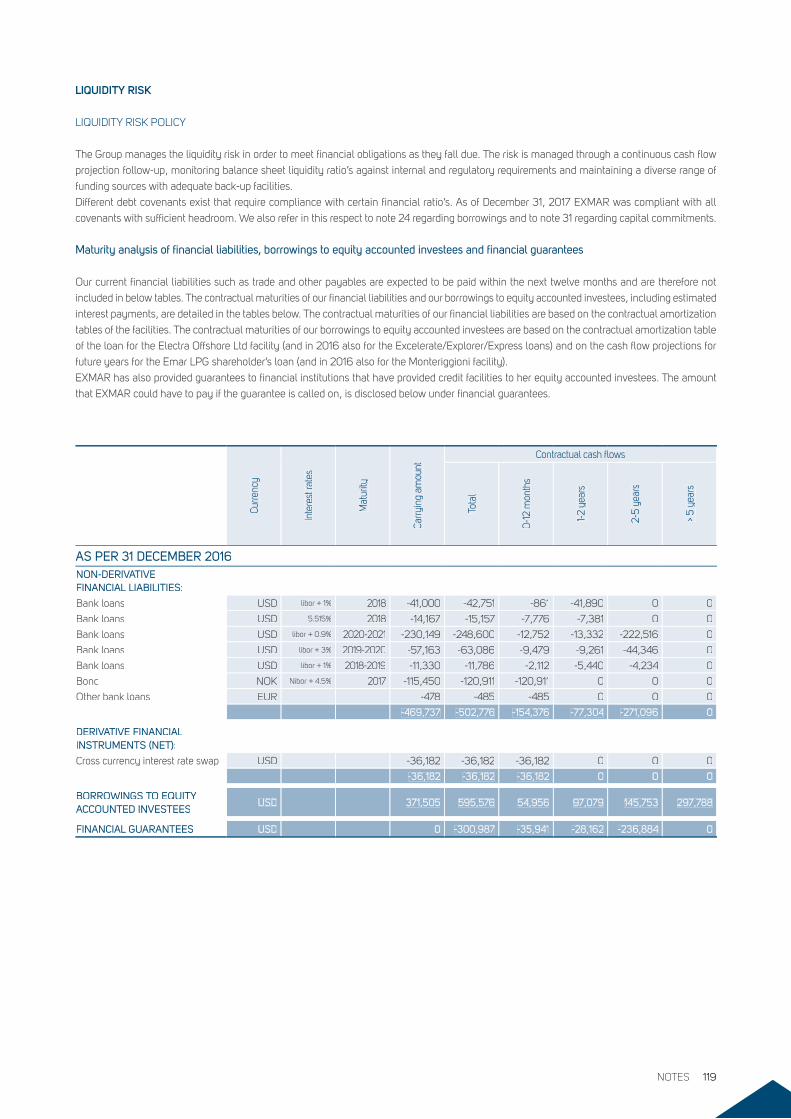
LIQUIDITY RISK
LIQUIDITY RISK POLICY
The Group manages the liquidity risk in order to meet financial obligations as they fall due. The risk is managed through a continuous cash flow
projection follow-up, monitoring balance sheet liquidity ratio’s against internal and regulatory requirements and maintaining a diverse range of
funding sources with adequate back-up facilities.
Different debt covenants exist that require compliance with certain financial ratio’s. As of December 31, 2017 EXMAR was compliant with all
covenants with sufficient headroom. We also refer in this respect to note 24 regarding borrowings and to note 31 regarding capital commitments.
Maturity analysis of financial liabilities, borrowings to equity accounted investees and financial guarantees
Our current financial liabilities such as trade and other payables are expected to be paid within the next twelve months and are therefore not
included in below tables. The contractual maturities of our financial liabilities and our borrowings to equity accounted investees, including estimated
interest payments, are detailed in the tables below. The contractual maturities of our financial liabilities are based on the contractual amortization
tables of the facilities. The contractual maturities of our borrowings to equity accounted investees are based on the contractual amortization table
of the loan for the Electra Offshore Ltd facility (and in 2016 also for the Excelerate/Explorer/Express loans) and on the cash flow projections for
future years for the Emar LPG shareholder’s loan (and in 2016 also for the Monteriggioni facility).
EXMAR has also provided guarantees to financial institutions that have provided credit facilities to her equity accounted investees. The amount
that EXMAR could have to pay if the guarantee is called on, is disclosed below under financial guarantees.
Curre
ncy
Inte
rest
rate
s
Mat
urity
Carry
ing
amou
nt
Contractual cash flows
Tota
l
0-12
mon
ths
1-2
year
s
2-5
year
s
> 5
year
s
AS PER 31 DECEMBER 2016AS PER 31 DECEMBER 2016NON-DERIVATIVE FINANCIAL LIABILITIES:
Bank loans USD libor + 1% 2018 -41,000 -42,751 -861 -41,890 0 0
Bank loans USD 5.515% 2018 -14,167 -15,157 -7,776 -7,381 0 0
Bank loans USD libor + 0.9% 2020-2021 -230,149 -248,600 -12,752 -13,332 -222,516 0
Bank loans USD libor + 3% 2019-2020 -57,163 -63,086 -9,479 -9,261 -44,346 0
Bank loans USD libor + 1% 2018-2019 -11,330 -11,786 -2,112 -5,440 -4,234 0
Bond NOK Nibor + 4.5% 2017 -115,450 -120,911 -120,911 0 0 0
Other bank loans EUR -478 -485 -485 0 0 0
-469,737 -502,776 -154,376 -77,304 -271,096 0
DERIVATIVE FINANCIAL INSTRUMENTS (NET):
Cross currency interest rate swap USD -36,182 -36,182 -36,182 0 0 0
-36,182 -36,182 -36,182 0 0 0
BORROWINGS TO EQUITY ACCOUNTED INVESTEESACCOUNTED INVESTEES
USD 371,505 595,576 54,956 97,079 145,753 297,788
FINANCIAL GUARANTEES USD 0 -300,987 -35,941 -28,162 -236,884 0
NOTES 119
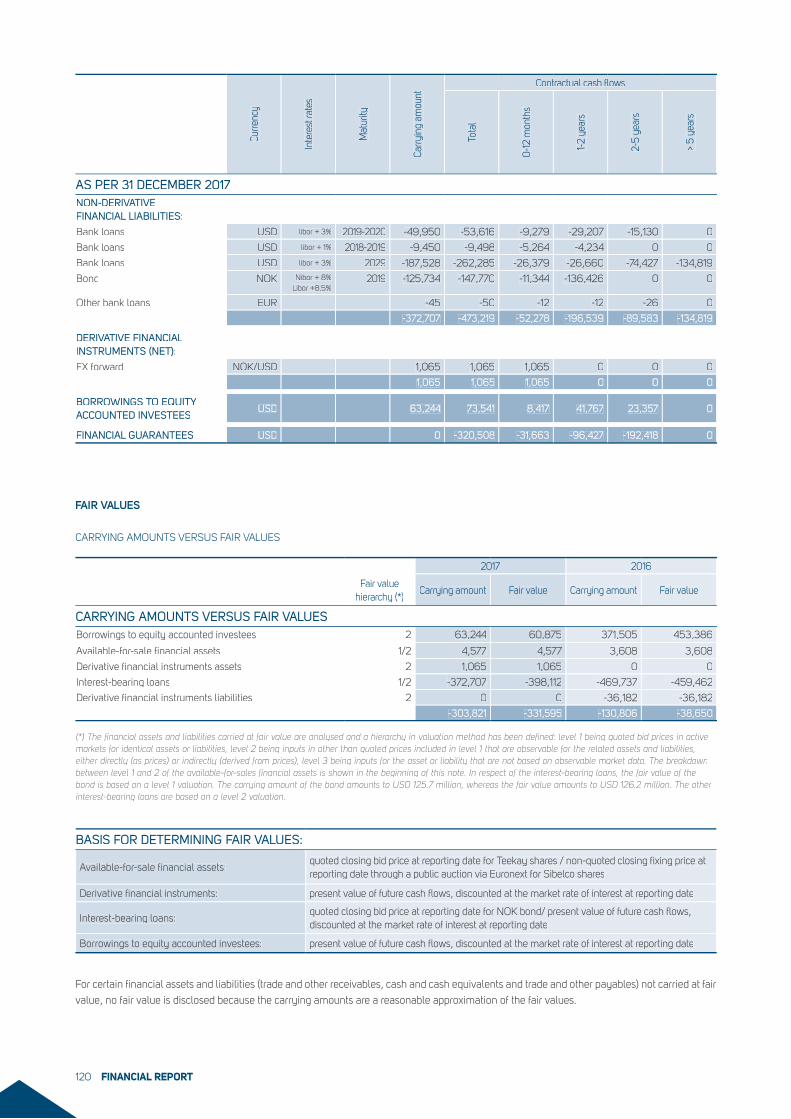
FAIR VALUES
CARRYING AMOUNTS VERSUS FAIR VALUES
2017 2016
Fair value hierarchy (*)
Carrying amount Fair value Carrying amount Fair value
CARRYING AMOUNTS VERSUS FAIR VALUESBorrowings to equity accounted investees 2 63,244 60,875 371,505 453,386
Available-for-sale financial assets 1/2 4,577 4,577 3,608 3,608
Derivative financial instruments assets 2 1,065 1,065 0 0
Interest-bearing loans 1/2 -372,707 -398,112 -469,737 -459,462
Derivative financial instruments liabilities 2 0 0 -36,182 -36,182
-303,821 -331,595 -130,806 -38,650
(*) The financial assets and liabilities carried at fair value are analysed and a hierarchy in valuation method has been defined: level 1 being quoted bid prices in active markets for identical assets or liabilities, level 2 being inputs in other than quoted prices included in level 1 that are observable for the related assets and liabilities, either directly (as prices) or indirectly (derived from prices), level 3 being inputs for the asset or liability that are not based on observable market data. The breakdown between level 1 and 2 of the available-for-sales financial assets is shown in the beginning of this note. In respect of the interest-bearing loans, the fair value of the bond is based on a level 1 valuation. The carrying amount of the bond amounts to USD 125.7 million, whereas the fair value amounts to USD 126.2 million. The other interest-bearing loans are based on a level 2 valuation.
BASIS FOR DETERMINING FAIR VALUES:
Available-for-sale financial assets:quoted closing bid price at reporting date for Teekay shares / non-quoted closing fixing price at reporting date through a public auction via Euronext for Sibelco shares
Derivative financial instruments: present value of future cash flows, discounted at the market rate of interest at reporting date
Interest-bearing loans:quoted closing bid price at reporting date for NOK bond/ present value of future cash flows, discounted at the market rate of interest at reporting date
Borrowings to equity accounted investees: present value of future cash flows, discounted at the market rate of interest at reporting date
For certain financial assets and liabilities (trade and other receivables, cash and cash equivalents and trade and other payables) not carried at fair
value, no fair value is disclosed because the carrying amounts are a reasonable approximation of the fair values.
Curre
ncy
Inte
rest
rate
s
Mat
urity
Carry
ing
amou
nt
Contractual cash flows
Tota
l
0-12
mon
ths
1-2
year
s
2-5
year
s
> 5
year
s
AS PER 31 DECEMBER 2017AS PER 31 DECEMBER 2017NON-DERIVATIVE FINANCIAL LIABILITIES:
Bank loans USD libor + 3% 2019-2020 -49,950 -53,616 -9,279 -29,207 -15,130 0
Bank loans USD libor + 1% 2018-2019 -9,450 -9,498 -5,264 -4,234 0 0
Bank loans USD libor + 3% 2029 -187,528 -262,285 -26,379 -26,660 -74,427 -134,819
Bond NOK Nibor + 8%Libor +8.5%
2019 -125,734 -147,770 -11,344 -136,426 0 0
Other bank loans EUR -45 -50 -12 -12 -26 0
-372,707 -473,219 -52,278 -196,539 -89,583 -134,819
DERIVATIVE FINANCIAL INSTRUMENTS (NET):
FX forward NOK/USD 1,065 1,065 1,065 0 0 0
1,065 1,065 1,065 0 0 0
BORROWINGS TO EQUITY ACCOUNTED INVESTEESACCOUNTED INVESTEES
USD 63,244 73,541 8,417 41,767 23,357 0
FINANCIAL GUARANTEES USD 0 -320,508 -31,663 -96,427 -192,418 0
FINANCIAL REPORT120
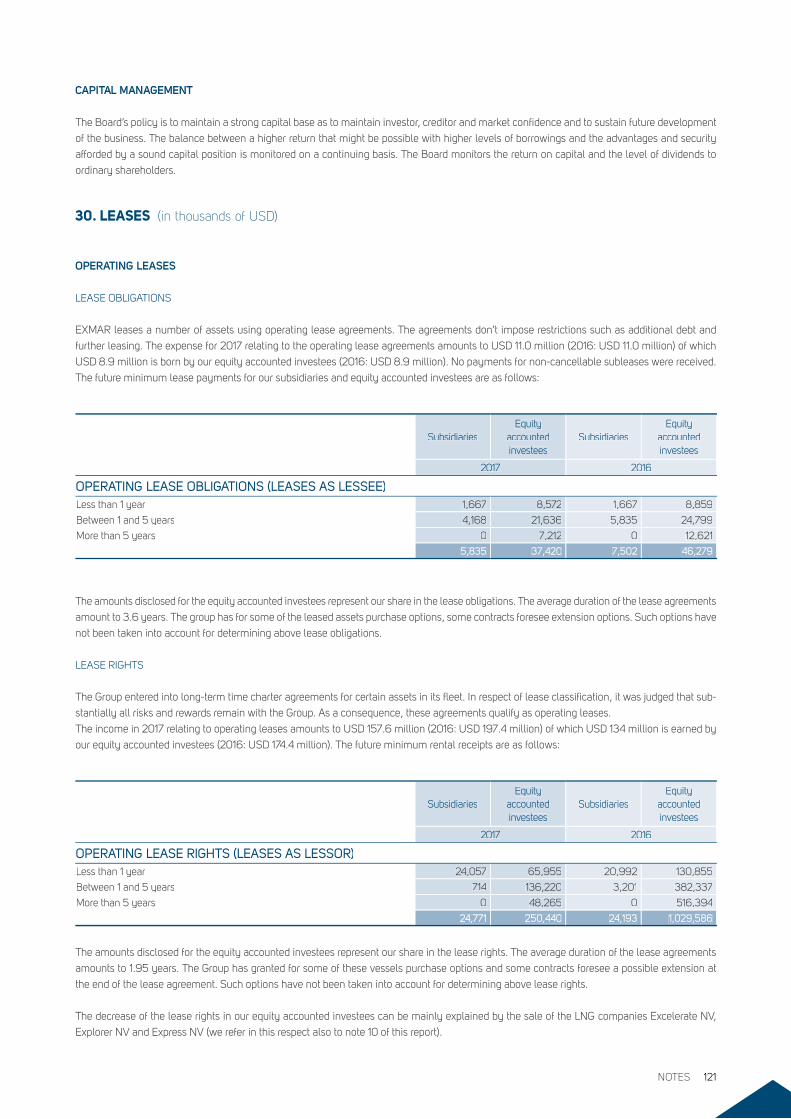
SubsidiariesEquity
accounted investees
SubsidiariesEquity
accounted investees
2017 2016
OPERATING LEASE OBLIGATIONS (LEASES AS LESSEE)Less than 1 year 1,667 8,572 1,667 8,859
Between 1 and 5 years 4,168 21,636 5,835 24,799
More than 5 years 0 7,212 0 12,621
5,835 37,420 7,502 46,279
SubsidiariesEquity
accounted investees
SubsidiariesEquity
accounted investees
2017 2016
OPERATING LEASE RIGHTS (LEASES AS LESSOR)Less than 1 year 24,057 65,955 20,992 130,855
Between 1 and 5 years 714 136,220 3,201 382,337
More than 5 years 0 48,265 0 516,394
24,771 250,440 24,193 1,029,586
30. LEASES (in thousands of USD)
OPERATING LEASES
LEASE OBLIGATIONS
EXMAR leases a number of assets using operating lease agreements. The agreements don’t impose restrictions such as additional debt and
further leasing. The expense for 2017 relating to the operating lease agreements amounts to USD 11.0 million (2016: USD 11.0 million) of which
USD 8.9 million is born by our equity accounted investees (2016: USD 8.9 million). No payments for non-cancellable subleases were received.
The future minimum lease payments for our subsidiaries and equity accounted investees are as follows:
The amounts disclosed for the equity accounted investees represent our share in the lease obligations. The average duration of the lease agreements
amount to 3.6 years. The group has for some of the leased assets purchase options, some contracts foresee extension options. Such options have
not been taken into account for determining above lease obligations.
LEASE RIGHTS
The Group entered into long-term time charter agreements for certain assets in its fleet. In respect of lease classification, it was judged that sub-
stantially all risks and rewards remain with the Group. As a consequence, these agreements qualify as operating leases.
The income in 2017 relating to operating leases amounts to USD 157.6 million (2016: USD 197.4 million) of which USD 134 million is earned by
our equity accounted investees (2016: USD 174.4 million). The future minimum rental receipts are as follows:
The amounts disclosed for the equity accounted investees represent our share in the lease rights. The average duration of the lease agreements
amounts to 1.95 years. The Group has granted for some of these vessels purchase options and some contracts foresee a possible extension at
the end of the lease agreement. Such options have not been taken into account for determining above lease rights.
The decrease of the lease rights in our equity accounted investees can be mainly explained by the sale of the LNG companies Excelerate NV,
Explorer NV and Express NV (we refer in this respect also to note 10 of this report).
CAPITAL MANAGEMENT
The Board’s policy is to maintain a strong capital base as to maintain investor, creditor and market confidence and to sustain future development
of the business. The balance between a higher return that might be possible with higher levels of borrowings and the advantages and security
afforded by a sound capital position is monitored on a continuing basis. The Board monitors the return on capital and the level of dividends to
ordinary shareholders.
NOTES 121
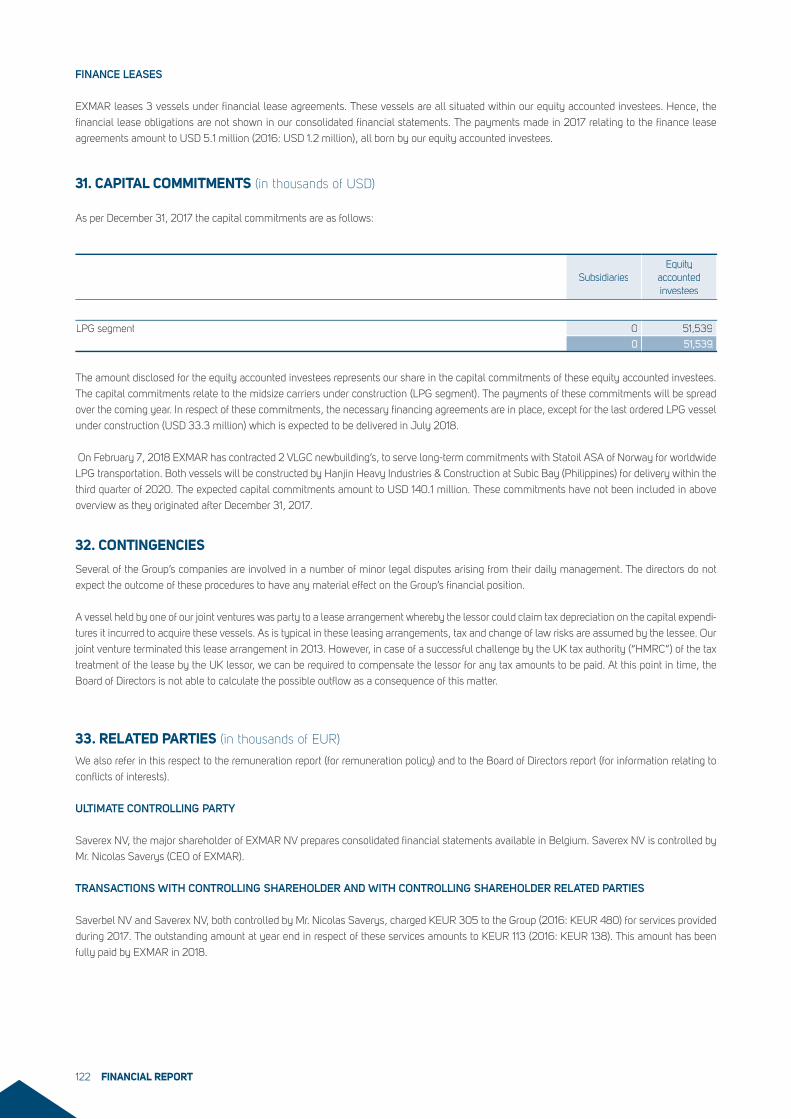
SubsidiariesEquity
accounted investees
LPG segment 0 51,539
0 51,539
The amount disclosed for the equity accounted investees represents our share in the capital commitments of these equity accounted investees.
The capital commitments relate to the midsize carriers under construction (LPG segment). The payments of these commitments will be spread
over the coming year. In respect of these commitments, the necessary financing agreements are in place, except for the last ordered LPG vessel
under construction (USD 33.3 million) which is expected to be delivered in July 2018.
On February 7, 2018 EXMAR has contracted 2 VLGC newbuilding’s, to serve long-term commitments with Statoil ASA of Norway for worldwide
LPG transportation. Both vessels will be constructed by Hanjin Heavy Industries & Construction at Subic Bay (Philippines) for delivery within the
third quarter of 2020. The expected capital commitments amount to USD 140.1 million. These commitments have not been included in above
overview as they originated after December 31, 2017.
31. CAPITAL COMMITMENTS (in thousands of USD)
As per December 31, 2017 the capital commitments are as follows:
32. CONTINGENCIES
Several of the Group’s companies are involved in a number of minor legal disputes arising from their daily management. The directors do not
expect the outcome of these procedures to have any material effect on the Group’s financial position.
A vessel held by one of our joint ventures was party to a lease arrangement whereby the lessor could claim tax depreciation on the capital expendi-
tures it incurred to acquire these vessels. As is typical in these leasing arrangements, tax and change of law risks are assumed by the lessee. Our
joint venture terminated this lease arrangement in 2013. However, in case of a successful challenge by the UK tax authority (“HMRC”) of the tax
treatment of the lease by the UK lessor, we can be required to compensate the lessor for any tax amounts to be paid. At this point in time, the
Board of Directors is not able to calculate the possible outflow as a consequence of this matter.
33. RELATED PARTIES (in thousands of EUR)
We also refer in this respect to the remuneration report (for remuneration policy) and to the Board of Directors report (for information relating to
conflicts of interests).
ULTIMATE CONTROLLING PARTY
Saverex NV, the major shareholder of EXMAR NV prepares consolidated financial statements available in Belgium. Saverex NV is controlled by
Mr. Nicolas Saverys (CEO of EXMAR).
TRANSACTIONS WITH CONTROLLING SHAREHOLDER AND WITH CONTROLLING SHAREHOLDER RELATED PARTIES
Saverbel NV and Saverex NV, both controlled by Mr. Nicolas Saverys, charged KEUR 305 to the Group (2016: KEUR 480) for services provided
during 2017. The outstanding amount at year end in respect of these services amounts to KEUR 113 (2016: KEUR 138). This amount has been
fully paid by EXMAR in 2018.
FINANCE LEASES
EXMAR leases 3 vessels under financial lease agreements. These vessels are all situated within our equity accounted investees. Hence, the
financial lease obligations are not shown in our consolidated financial statements. The payments made in 2017 relating to the finance lease
agreements amount to USD 5.1 million (2016: USD 1.2 million), all born by our equity accounted investees.
FINANCIAL REPORT122
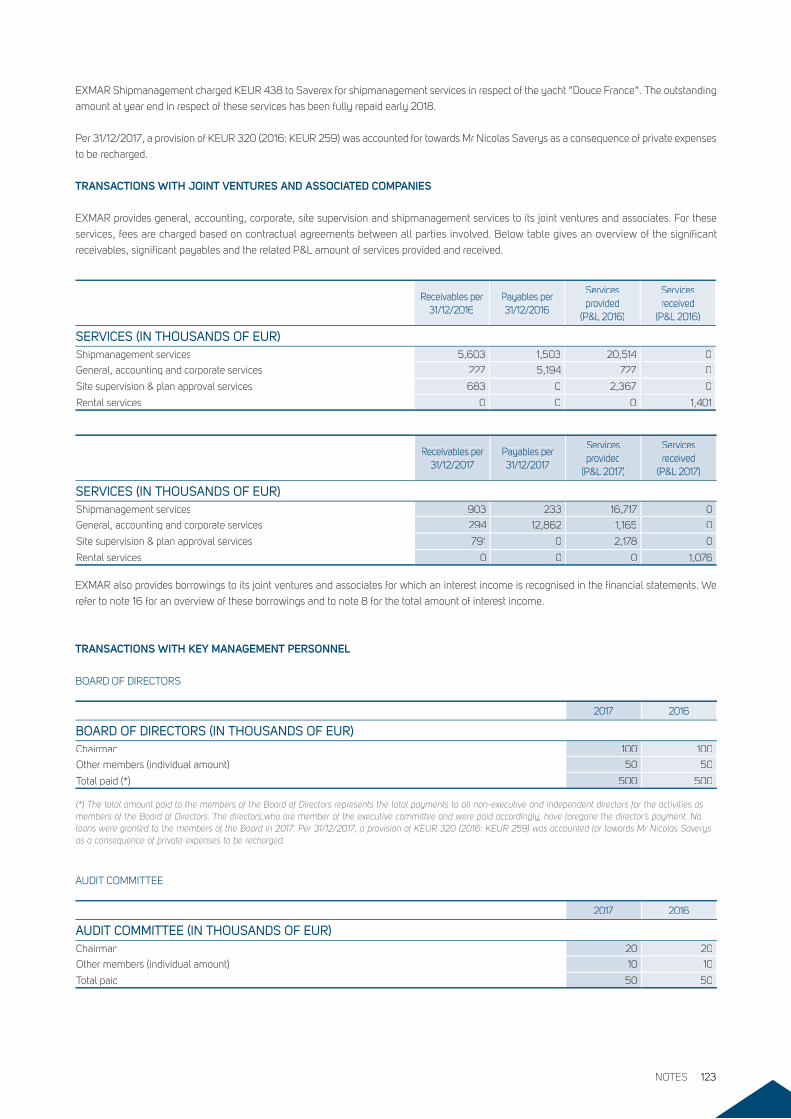
Receivables per 31/12/2016
Payables per 31/12/2016
Services provided
(P&L 2016)
Services received
(P&L 2016)
SERVICES (IN THOUSANDS OF EUR)Shipmanagement services 5,603 1,503 20,514 0
General, accounting and corporate services 227 5,194 727 0
Site supervision & plan approval services 683 0 2,367 0
Rental services 0 0 0 1,401
Receivables per 31/12/2017
Payables per 31/12/2017
Services provided
(P&L 2017)
Services received
(P&L 2017)
SERVICES (IN THOUSANDS OF EUR)Shipmanagement services 903 233 16,717 0
General, accounting and corporate services 294 12,862 1,165 0
Site supervision & plan approval services 791 0 2,178 0
Rental services 0 0 0 1,076
EXMAR also provides borrowings to its joint ventures and associates for which an interest income is recognised in the financial statements. We
refer to note 16 for an overview of these borrowings and to note 8 for the total amount of interest income.
2017 2016
BOARD OF DIRECTORS (IN THOUSANDS OF EUR)Chairman 100 100
Other members (individual amount) 50 50
Total paid (*) 500 500
(*) The total amount paid to the members of the Board of Directors represents the total payments to all non-executive and independent directors for the activities as members of the Board of Directors. The directors,who are member of the executive committee and were paid accordingly, have foregone the director’s payment. No loans were granted to the members of the Board in 2017. Per 31/12/2017, a provision of KEUR 320 (2016: KEUR 259) was accounted for towards Mr Nicolas Saverys as a consequence of private expenses to be recharged.
2017 2016
AUDIT COMMITTEE (IN THOUSANDS OF EUR)AUDIT COMMITTEE (IN THOUSANDS OF EUR)Chairman 20 20
Other members (individual amount) 10 10
Total paid 50 50
TRANSACTIONS WITH KEY MANAGEMENT PERSONNEL
BOARD OF DIRECTORS
AUDIT COMMITTEE
EXMAR Shipmanagement charged KEUR 438 to Saverex for shipmanagement services in respect of the yacht “Douce France”. The outstanding
amount at year end in respect of these services has been fully repaid early 2018.
Per 31/12/2017, a provision of KEUR 320 (2016: KEUR 259) was accounted for towards Mr Nicolas Saverys as a consequence of private expenses
to be recharged.
TRANSACTIONS WITH JOINT VENTURES AND ASSOCIATED COMPANIES
EXMAR provides general, accounting, corporate, site supervision and shipmanagement services to its joint ventures and associates. For these
services, fees are charged based on contractual agreements between all parties involved. Below table gives an overview of the significant
receivables, significant payables and the related P&L amount of services provided and received.
NOTES 123
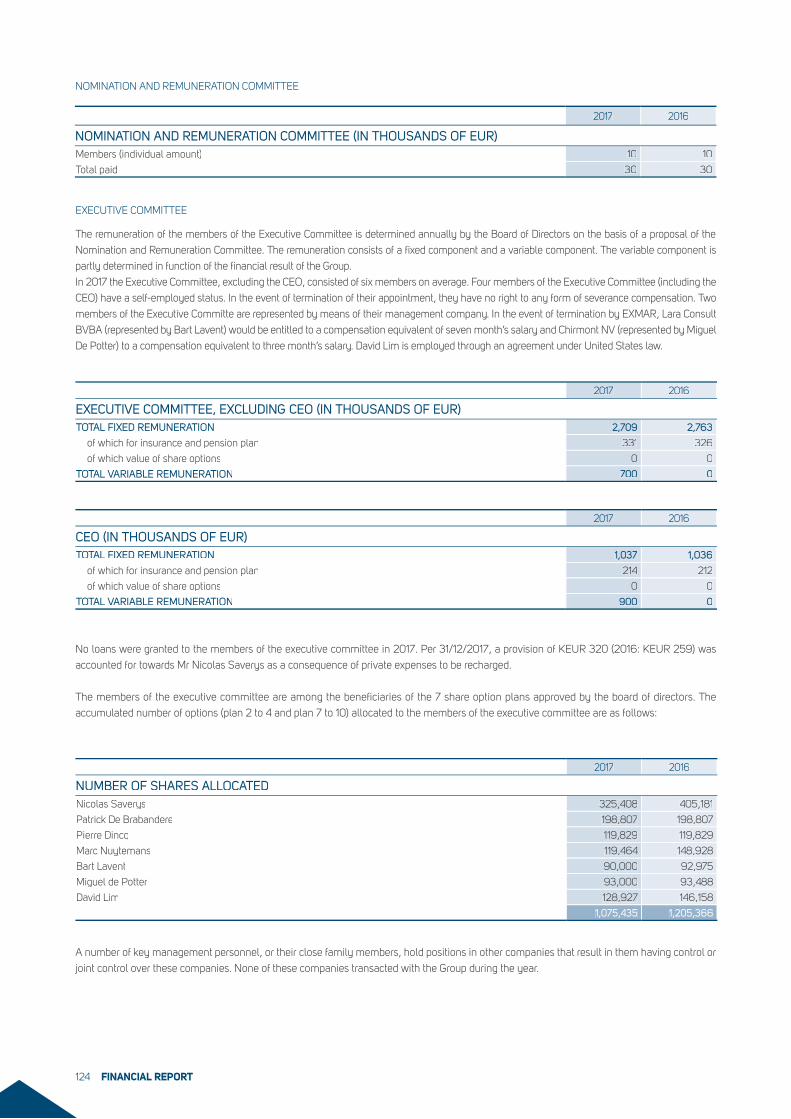
2017 2016
EXECUTIVE COMMITTEE, EXCLUDING CEO (IN THOUSANDS OF EUR) TOTAL FIXED REMUNERATION 2,709 2,763
of which for insurance and pension plan 331 326
of which value of share options 0 0
TOTAL VARIABLE REMUNERATION 700 0
2017 2016
CEO (IN THOUSANDS OF EUR)TOTAL FIXED REMUNERATION 1,037 1,036
of which for insurance and pension plan 214 212
of which value of share options 0 0
TOTAL VARIABLE REMUNERATION 900 0
2017 2016
NUMBER OF SHARES ALLOCATEDNicolas Saverys 325,408 405,181
Patrick De Brabandere 198,807 198,807
Pierre Dincq 119,829 119,829
Marc Nuytemans 119,464 148,928
Bart Lavent 90,000 92,975
Miguel de Potter 93,000 93,488
David Lim 128,927 146,158
1,075,435 1,205,366
EXECUTIVE COMMITTEE
The remuneration of the members of the Executive Committee is determined annually by the Board of Directors on the basis of a proposal of the
Nomination and Remuneration Committee. The remuneration consists of a fixed component and a variable component. The variable component is
partly determined in function of the financial result of the Group.
In 2017 the Executive Committee, excluding the CEO, consisted of six members on average. Four members of the Executive Committee (including the
CEO) have a self-employed status. In the event of termination of their appointment, they have no right to any form of severance compensation. Two
members of the Executive Committe are represented by means of their management company. In the event of termination by EXMAR, Lara Consult
BVBA (represented by Bart Lavent) would be entitled to a compensation equivalent of seven month’s salary and Chirmont NV (represented by Miguel
De Potter) to a compensation equivalent to three month’s salary. David Lim is employed through an agreement under United States law.
No loans were granted to the members of the executive committee in 2017. Per 31/12/2017, a provision of KEUR 320 (2016: KEUR 259) was
accounted for towards Mr Nicolas Saverys as a consequence of private expenses to be recharged.
The members of the executive committee are among the beneficiaries of the 7 share option plans approved by the board of directors. The
accumulated number of options (plan 2 to 4 and plan 7 to 10) allocated to the members of the executive committee are as follows:
A number of key management personnel, or their close family members, hold positions in other companies that result in them having control or
joint control over these companies. None of these companies transacted with the Group during the year.
2017 2016
NOMINATION AND REMUNERATION COMMITTEE (IN THOUSANDS OF EUR)Members (individual amount) 10 10
Total paid 30 30
NOMINATION AND REMUNERATION COMMITTEE
FINANCIAL REPORT124
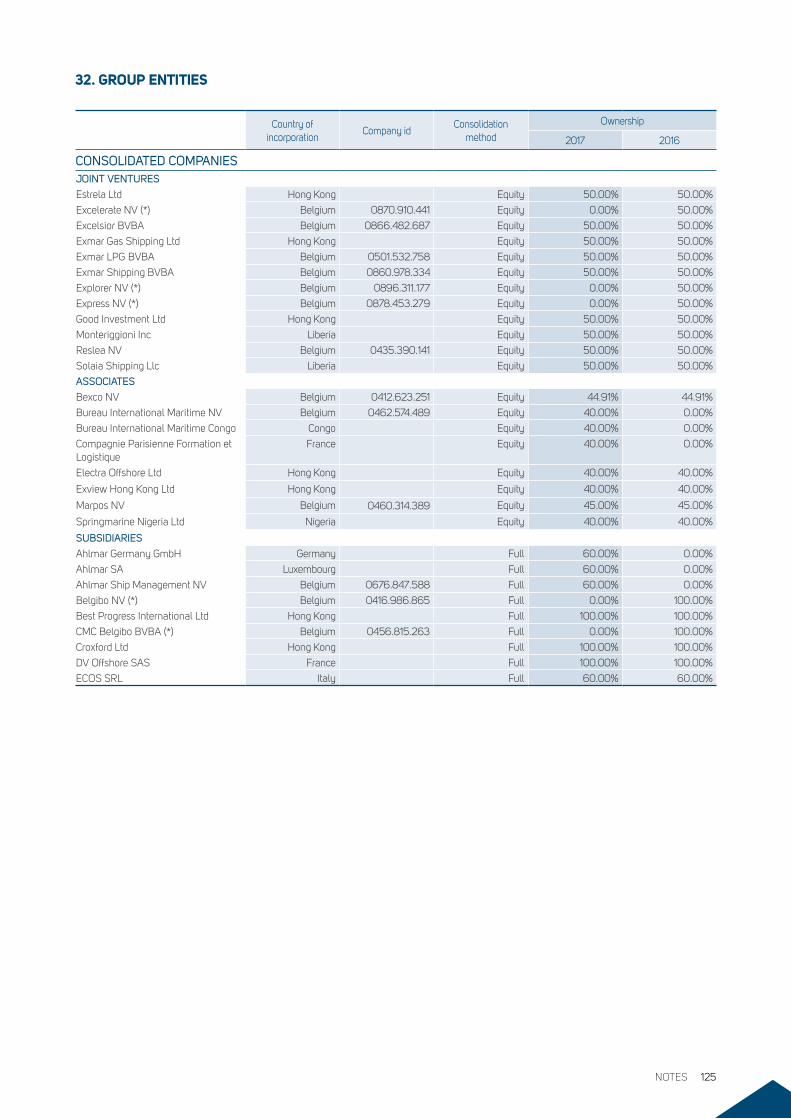
32. GROUP ENTITIES
Country of incorporation
Company idConsolidation
method
Ownership
2017 2016
CONSOLIDATED COMPANIESJOINT VENTURES
Estrela Ltd Hong Kong Equity 50.00% 50.00%
Excelerate NV (*) Belgium 0870.910.441 Equity 0.00% 50.00%
Excelsior BVBA Belgium 0866.482.687 Equity 50.00% 50.00%
Exmar Gas Shipping Ltd Hong Kong Equity 50.00% 50.00%
Exmar LPG BVBA Belgium 0501.532.758 Equity 50.00% 50.00%
Exmar Shipping BVBA Belgium 0860.978.334 Equity 50.00% 50.00%
Explorer NV (*) Belgium 0896.311.177 Equity 0.00% 50.00%
Express NV (*) Belgium 0878.453.279 Equity 0.00% 50.00%
Good Investment Ltd Hong Kong Equity 50.00% 50.00%
Monteriggioni Inc Liberia Equity 50.00% 50.00%
Reslea NV Belgium 0435.390.141 Equity 50.00% 50.00%
Solaia Shipping Llc Liberia Equity 50.00% 50.00%
ASSOCIATES
Bexco NV Belgium 0412.623.251 Equity 44.91% 44.91%
Bureau International Maritime NV Belgium 0462.574.489 Equity 40.00% 0.00%
Bureau International Maritime Congo Congo Equity 40.00% 0.00%
Compagnie Parisienne Formation et Logistique
France Equity 40.00% 0.00%
Electra Offshore Ltd Hong Kong Equity 40.00% 40.00%
Exview Hong Kong Ltd Hong Kong Equity 40.00% 40.00%
Marpos NV Belgium 0460.314.389 Equity 45.00% 45.00%
Springmarine Nigeria Ltd Nigeria Equity 40.00% 40.00%
SUBSIDIARIES
Ahlmar Germany GmbH Germany Full 60.00% 0.00%
Ahlmar SA Luxembourg Full 60.00% 0.00%
Ahlmar Ship Management NV Belgium 0676.847.588 Full 60.00% 0.00%
Belgibo NV (*) Belgium 0416.986.865 Full 0.00% 100.00%
Best Progress International Ltd Hong Kong Full 100.00% 100.00%
CMC Belgibo BVBA (*) Belgium 0456.815.263 Full 0.00% 100.00%
Croxford Ltd Hong Kong Full 100.00% 100.00%
DV Offshore SAS France Full 100.00% 100.00%
ECOS SRL Italy Full 60.00% 60.00%
NOTES 125
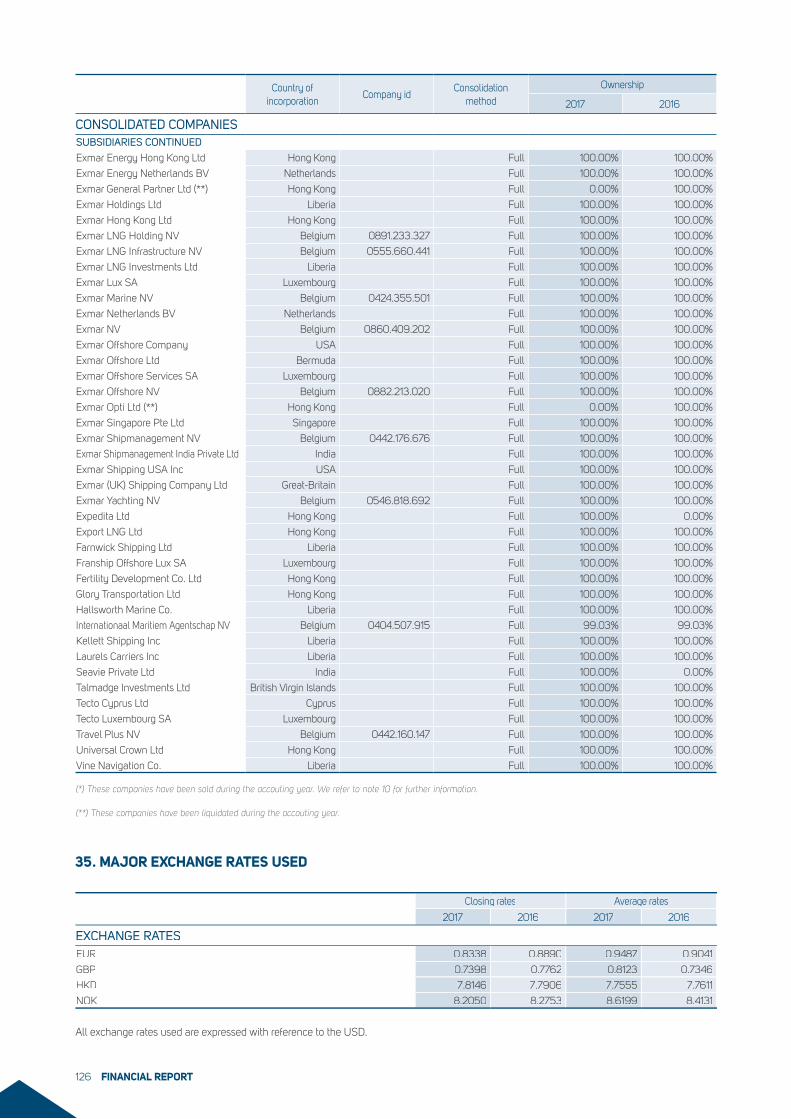
Country of incorporation
Company idConsolidation
method
Ownership
2017 2016
CONSOLIDATED COMPANIESSUBSIDIARIES CONTINUED
Exmar Energy Hong Kong Ltd Hong Kong Full 100.00% 100.00%
Exmar Energy Netherlands BV Netherlands Full 100.00% 100.00%
Exmar General Partner Ltd (**) Hong Kong Full 0.00% 100.00%
Exmar Holdings Ltd Liberia Full 100.00% 100.00%
Exmar Hong Kong Ltd Hong Kong Full 100.00% 100.00%
Exmar LNG Holding NV Belgium 0891.233.327 Full 100.00% 100.00%
Exmar LNG Infrastructure NV Belgium 0555.660.441 Full 100.00% 100.00%
Exmar LNG Investments Ltd Liberia Full 100.00% 100.00%
Exmar Lux SA Luxembourg Full 100.00% 100.00%
Exmar Marine NV Belgium 0424.355.501 Full 100.00% 100.00%
Exmar Netherlands BV Netherlands Full 100.00% 100.00%
Exmar NV Belgium 0860.409.202 Full 100.00% 100.00%
Exmar Offshore Company USA Full 100.00% 100.00%
Exmar Offshore Ltd Bermuda Full 100.00% 100.00%
Exmar Offshore Services SA Luxembourg Full 100.00% 100.00%
Exmar Offshore NV Belgium 0882.213.020 Full 100.00% 100.00%
Exmar Opti Ltd (**) Hong Kong Full 0.00% 100.00%
Exmar Singapore Pte Ltd Singapore Full 100.00% 100.00%
Exmar Shipmanagement NV Belgium 0442.176.676 Full 100.00% 100.00%
Exmar Shipmanagement India Private Ltd India Full 100.00% 100.00%
Exmar Shipping USA Inc USA Full 100.00% 100.00%
Exmar (UK) Shipping Company Ltd Great-Britain Full 100.00% 100.00%
Exmar Yachting NV Belgium 0546.818.692 Full 100.00% 100.00%
Expedita Ltd Hong Kong Full 100.00% 0.00%
Export LNG Ltd Hong Kong Full 100.00% 100.00%
Farnwick Shipping Ltd Liberia Full 100.00% 100.00%
Franship Offshore Lux SA Luxembourg Full 100.00% 100.00%
Fertility Development Co. Ltd Hong Kong Full 100.00% 100.00%
Glory Transportation Ltd Hong Kong Full 100.00% 100.00%
Hallsworth Marine Co. Liberia Full 100.00% 100.00%
Internationaal Maritiem Agentschap NV Belgium 0404.507.915 Full 99.03% 99.03%
Kellett Shipping Inc Liberia Full 100.00% 100.00%
Laurels Carriers Inc Liberia Full 100.00% 100.00%
Seavie Private Ltd India Full 100.00% 0.00%
Talmadge Investments Ltd British Virgin Islands Full 100.00% 100.00%
Tecto Cyprus Ltd Cyprus Full 100.00% 100.00%
Tecto Luxembourg SA Luxembourg Full 100.00% 100.00%
Travel Plus NV Belgium 0442.160.147 Full 100.00% 100.00%
Universal Crown Ltd Hong Kong Full 100.00% 100.00%
Vine Navigation Co. Liberia Full 100.00% 100.00%
(*) These companies have been sold during the accouting year. We refer to note 10 for further information.
(**) These companies have been liquidated during the accouting year.
Closing rates Average rates
2017 2016 2017 2016
EXCHANGE RATESEUR 0.8338 0.8890 0.9487 0.9041
GBP 0.7398 0.7762 0.8123 0.7346
HKD 7.8146 7.7906 7.7555 7.7611
NOK 8.2050 8.2753 8.6199 8.4131
35. MAJOR EXCHANGE RATES USED
All exchange rates used are expressed with reference to the USD.
FINANCIAL REPORT126
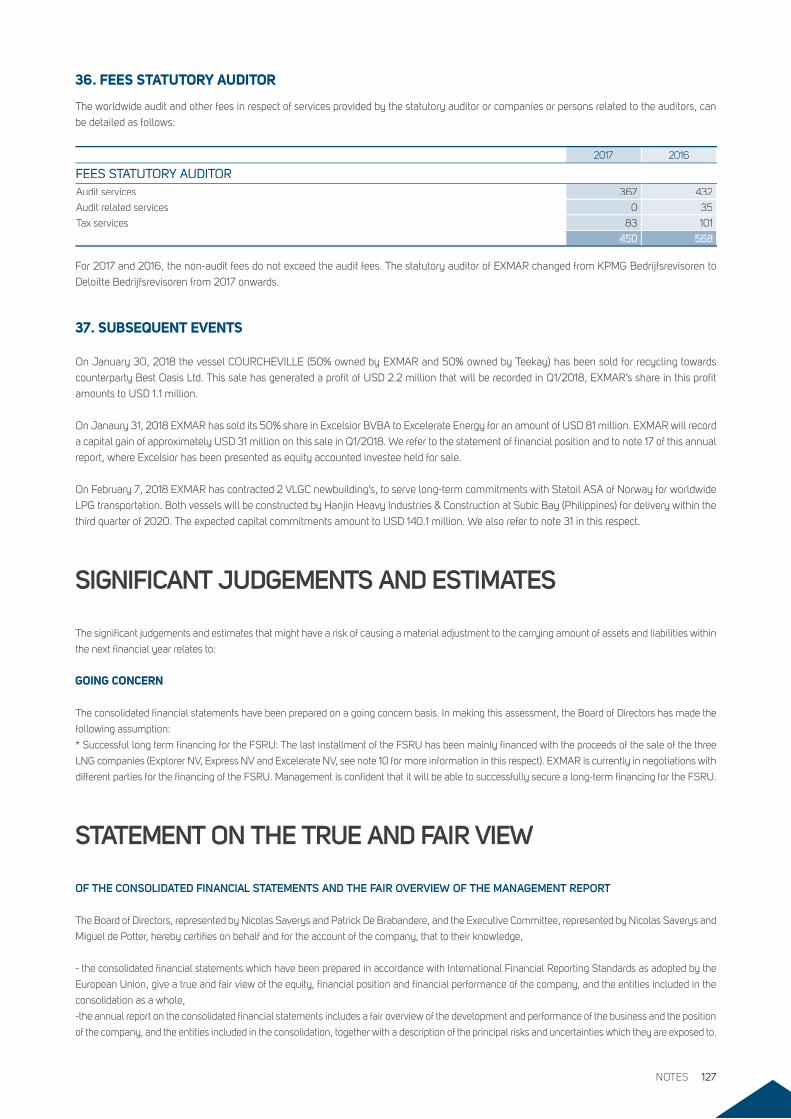
36. FEES STATUTORY AUDITOR
The worldwide audit and other fees in respect of services provided by the statutory auditor or companies or persons related to the auditors, can
be detailed as follows:
37. SUBSEQUENT EVENTS
On January 30, 2018 the vessel COURCHEVILLE (50% owned by EXMAR and 50% owned by Teekay) has been sold for recycling towards
counterparty Best Oasis Ltd. This sale has generated a profit of USD 2.2 million that will be recorded in Q1/2018, EXMAR’s share in this profit
amounts to USD 1.1 million.
On Janaury 31, 2018 EXMAR has sold its 50% share in Excelsior BVBA to Excelerate Energy for an amount of USD 81 million. EXMAR will record
a capital gain of approximately USD 31 million on this sale in Q1/2018. We refer to the statement of financial position and to note 17 of this annual
report, where Excelsior has been presented as equity accounted investee held for sale.
On February 7, 2018 EXMAR has contracted 2 VLGC newbuilding’s, to serve long-term commitments with Statoil ASA of Norway for worldwide
LPG transportation. Both vessels will be constructed by Hanjin Heavy Industries & Construction at Subic Bay (Philippines) for delivery within the
third quarter of 2020. The expected capital commitments amount to USD 140.1 million. We also refer to note 31 in this respect.
For 2017 and 2016, the non-audit fees do not exceed the audit fees. The statutory auditor of EXMAR changed from KPMG Bedrijfsrevisoren to
Deloitte Bedrijfsrevisoren from 2017 onwards.
2017 2016
FEES STATUTORY AUDITORAudit services 367 432
Audit related services 0 35
Tax services 83 101
450 568
STATEMENT ON THE TRUE AND FAIR VIEW
OF THE CONSOLIDATED FINANCIAL STATEMENTS AND THE FAIR OVERVIEW OF THE MANAGEMENT REPORT
The Board of Directors, represented by Nicolas Saverys and Patrick De Brabandere, and the Executive Committee, represented by Nicolas Saverys and
Miguel de Potter, hereby certifies on behalf and for the account of the company, that to their knowledge,
- the consolidated financial statements which have been prepared in accordance with International Financial Reporting Standards as adopted by the
European Union, give a true and fair view of the equity, financial position and financial performance of the company, and the entities included in the
consolidation as a whole,
-the annual report on the consolidated financial statements includes a fair overview of the development and performance of the business and the position
of the company, and the entities included in the consolidation, together with a description of the principal risks and uncertainties which they are exposed to.
SIGNIFICANT JUDGEMENTS AND ESTIMATES
The significant judgements and estimates that might have a risk of causing a material adjustment to the carrying amount of assets and liabilities within
the next financial year relates to:
GOING CONCERN
The consolidated financial statements have been prepared on a going concern basis. In making this assessment, the Board of Directors has made the
following assumption:
* Successful long term financing for the FSRU: The last installment of the FSRU has been mainly financed with the proceeds of the sale of the three
LNG companies (Explorer NV, Express NV and Excelerate NV, see note 10 for more information in this respect). EXMAR is currently in negotiations with
different parties for the financing of the FSRU. Management is confident that it will be able to successfully secure a long-term financing for the FSRU.
NOTES 127
REPORT OF THE STATUTORY AUDITOR
STATUTORY AUDITOR’S REPORT TO THE SHAREHOLDERS’ MEETING FOR THE YEAR ENDED 31 DECEMBER 2017In the context of the statutory audit of the consolidated financial statements of EXMAR NV/SA (“the company”) and its subsidiaries (jointly “the
group”), we hereby submit our statutory audit report to you. This report includes our report on the consolidated financial statements together with
our report on other legal, regulatory and professional requirements. These reports are one and indivisible. We were appointed in our capacity as
statutory auditor by the shareholders’ meeting of 16 May 2017, in accordance with the proposal of the board of directors issued upon recommen-
dation of the audit committee. Our mandate will expire on the date of the shareholders’ meeting deliberating on the financial statements for the
year ending 31 December 2019. We have audited the consolidated financial statements of EXMAR NV/SA for the first time during the financial
year referred to in this report.
REPORT ON THE AUDIT OF THE CONSOLIDATED FINANCIAL STATEMENTS
Unqualified opinionWe have audited the consolidated financial statements of the group, which comprise the consolidated statement of financial position as at 31
December 2017, the consolidated statement of profit or loss and consolidated statement of other comprehensive income, the consolidated statement
of changes in equity and the consolidated statement of cash flow for the year then ended, as well as the summary of significant accounting policies
and other explanatory notes. The consolidated statement of financial position shows total assets of 918 595 (000) USD and the consolidated
statement of profit or loss shows a consolidated net profit for the year then ended of 27 952 (000) USD. In our opinion, the consolidated financial
statements of EXMAR NV/SA give a true and fair view of the group’s net equity and financial position as of 31 December 2017 and of its consol-
idated results and its consolidated cash flow for the year then ended, in accordance with International Financial Reporting Standards (IFRS) as
adopted by the European Union and with the legal and regulatory requirements applicable in Belgium.
Basis for the unqualified opinionWe conducted our audit in accordance with International Standards on Auditing (ISA). Our responsibilities under those standards are further described
in the “Responsibilities of the statutory auditor for the audit of the consolidated financial statements” section of our report. We have complied with
all ethical requirements relevant to the statutory audit of consolidated financial statements in Belgium, including those regarding independence.
We have obtained from the board of directors and the company’s officials the explanations and information necessary for performing our audit.
We believe that the audit evidence obtained is sufficient and appropriate to provide a basis for our opinion.
Key audit mattersKey audit matters are those matters that, in our professional judgment, were of most significance in our audit of the consolidated financial state-
ments of the current period. These matters were addressed in the context of our audit of the consolidated financial statements as a whole and in
forming our opinion thereon, and we do not provide a separate opinion on these matters.
KEY AUDIT MATTERS HOW OUR AUDIT ADDRESSED THE KEY AUDIT MATTERS
IMPAIRMENT OF PROPERTY, PLANT AND EQUIPMENT – VESSELS
• Property, plant and equipment – Vessels with a carrying amount
of 563 021 (000) USD represent 61% of the consolidated balance
sheet total as at 31 December 2017. Management’s assessment of
the valuation of property, plant and equipment was significant to
our audit because this process is complex and requires significant
management judgement. Furthermore, there is an increased risk of
impairment due to the current low spot and charter rates.
• We refer to the consolidated financial statements, including notes to
the consolidated financial statements: Note 11 Vessels
• We considered the process and the internal control implemented by
management and we carried out testing relating to the design and
implementation of management’s controls to assess impairment
indicators.
• We obtained external broker reports via management to evaluate
the fair value less cost to sell, where applicable, of the vessels.
We obtained a written confirmation from the appraisers on their
independence, expertise and valuation basis.
• We tested management’s assumptions used in the value in
use calculations and we assessed the historical accuracy of
management’s estimates, where applicable. In challenging these
assumptions, we took into account actual results, negotiated
contract terms, external data, independent market reports and
market conditions.
• We involved our valuation experts to assist us in the evaluation of
the discount rates used by the Group, performed sensitivity analysis
where considered necessary and assessed the consistency of
valuation methodologies applied and assumptions used throughout
the Group.
• Furthermore, we evaluated the adequacy of the Group’s disclosures
regarding the impairments of property, plant and equipment.
FINANCIAL REPORT128
KEY AUDIT MATTERS HOW OUR AUDIT ADDRESSED THE KEY AUDIT MATTERS
GOING CONCERN
• The directors of the Group are required to make a rigorous assessment
of whether the Group will remain a going concern for a period of
at least twelve months from the date of approval of the financial
statements and assess whether there are any material uncertainties
in relation to the going concern basis of preparation.
• The Group’s liquidity and headroom on its financial covenants are
closely linked to changes in spot and charter rates, occupation of the
vessels and ongoing investment and divestment programs.
• Significant management judgement and estimate is required to
forecast future cash flows and conclude on whether the Group will
have sufficient liquidity and will be able to comply with its financial
covenants for the period of at least 12 months from the date of
authorizing the financial statements.
• We refer to the consolidated financial statements, including notes
to the consolidated financial statements: Significant judgements
and estimates.
• We have assessed the design and implementation of controls
related to the assessment of going concern.
• We challenged the appropriateness and consistency of the
assumptions used in the going concern model, in particular the
spot and charter rates, the occupation ratio of vessels which are
not employed under a time charter, the cash flows from investing
and divesting transactions. In challenging these assumptions we
took into account actual results, negotiated contract terms, external
data, independent market reports and market conditions.
• We have tested the arithmetic integrity of the calculations including
those related to management’s sensitivities. We also performed our
own sensitivity calculations to test the adequacy of the available
headroom and we considered the mitigating actions available to
management under these scenarios.
• We have tested the quality of management forecasting by
comparing EBITDA forecasts for prior periods to actual outcomes.
• We have discussed and reviewed the financial covenants and
recomputed the available headroom.
• We evaluated the adequacy of the Group’s disclosures regarding
the going concern assumption.
Other mattersThe consolidated financial statements for the previous financial year were audited by another statutory auditor who has issued an unqualified
opinion with an emphasis of matters paragraph.
Responsibilities of the board of directors for the consolidated financial statementsThe board of directors is responsible for the preparation and fair presentation of the consolidated financial statements in accordance with International
Financial Reporting Standards (IFRS) as adopted by the European Union and with the legal and regulatory requirements applicable in Belgium
and for such internal control as the board of directors determines is necessary to enable the preparation of consolidated financial statements that
are free from material misstatement, whether due to fraud or error. In preparing the consolidated financial statements the board of directors is
responsible for assessing the group’s ability to continue as a going concern, disclosing, as applicable, matters to be considered for going concern
and using the going concern basis of accounting unless the board of directors either intends to liquidate the group or to cease operations, or has
no other realistic alternative but to do so.
Responsibilities of the statutory auditor for the audit of the consolidated financial statementsOur objectives are to obtain reasonable assurance about whether the financial statements as a whole are free from material misstatement, whether due
to fraud or error, and to issue an auditor’s report that includes our opinion. Reasonable assurance is a high level of assurance, but is not a guarantee that
an audit conducted in accordance with ISA will always detect a material misstatement when it exists. Misstatements can arise from fraud or error and
are considered material if, individually or in the aggregate, they could reasonably be expected to influence the economic decisions of users taken on the
basis of these financial statements. As part of an audit in accordance with ISA, we exercise professional judgment and maintain professional skepticism
throughout the audit. We also:
• identify and assess the risks of material misstatement of the consolidated financial statements, whether due to fraud or error, design and perform
audit procedures responsive to those risks, and obtain audit evidence that is sufficient and appropriate to provide a basis for our opinion. The risk of not
detecting a material misstatement resulting from fraud is higher than for one resulting from an error, as fraud may involve collusion, forgery, intentional
omissions, misrepresentations, or the override of internal control;
• obtain an understanding of internal control relevant to the audit in order to design audit procedures that are appropriate in the circumstances, but not
for the purpose of expressing an opinion on the effectiveness of the group’s internal control;
• evaluate the appropriateness of accounting policies used and the reasonableness of accounting estimates and related disclosures made by the board
of directors;
• conclude on the appropriateness of management’s use of the going concern basis of accounting and, based on the audit evidence obtained, whether
a material uncertainty exists related to events or conditions that may cast significant doubt on the group’s ability to continue as a going concern. If
we conclude that a material uncertainty exists, we are required to draw attention in our auditor’s report to the related disclosures in the consolidated
financial statements or, if such disclosures are inadequate, to modify our opinion. Our conclusions are based on the audit evidence obtained up to the
date of our auditor’s report. However, future events or conditions may cause the group to cease to continue as a going concern;
• evaluate the overall presentation, structure and content of the consolidated financial statements, and whether the consolidated financial statements
represent the underlying transactions and events in a manner that achieves fair presentation.
NOTES 129
• obtain sufficient appropriate audit evidence regarding the financial information of the entities and business activities within the group to express an
opinion on the consolidated financial statements. We are responsible for the direction, supervision and performance of the group audit. We remain
solely responsible for our audit opinion.
We communicate with the audit committee regarding, amongst other matters, the planned scope and timing of the audit and significant audit findings,
including any significant deficiencies in internal control that we identify during our audit. We also provide the audit committee with a statement that we
have complied with relevant ethical requirements regarding independence, and we communicate with them about all relationships and other matters
that may reasonably be thought to bear our independence, and where applicable, related safeguards. From the matters communicated to the audit
committee, we determine those matters that were of most significance in the audit of the consolidated financial statements of the current period and are
therefore the key audit matters. We describe these matters in our auditor’s report unless law or regulation precludes any public disclosure about the matter.
REPORT ON OTHER LEGAL, REGULATORY AND PROFESSIONAL REQUIREMENTS
Responsibilities of the board of directorsThe board of directors is responsible for the preparation and the content of the directors’ report on the consolidated financial statements.
Responsibilities of the statutory auditorAs part of our mandate and in accordance with the Belgian standard complementary (Revised in 2018) to the International Standards on Auditing (ISA),
our responsibility is to verify, in all material respects, the director’s report on the consolidated financial statements, as well as to report on these matters.
Aspects regarding the directors’ report on the consolidated financial statementsIn our opinion, after performing the specific procedures on the directors’ report on the consolidated financial statements, this report is consistent with the
consolidated financial statements for the period ended 31 December 2017 and it has been established in accordance with the requirements of article 119 of
the Companies Code. In the context of our statutory audit of the consolidated financial statements we are also responsible to consider, in particular based on
information that we became aware of during the audit, if the directors’ report on the consolidated financial statements is free of material misstatement, either
by information that is incorrectly stated or otherwise misleading. In the context of the procedures performed, we are not aware of such material misstatement.
We do not express any kind of assurance on the directors’ report on the consolidated financial statements. The non-financial information as required by article
119, § 2 of the Companies Code, has been disclosed in the directors’ report on the consolidated financial statements. This non-financial information has been
established by the company in accordance with the internationally recognized framework. We do however not express any opinion on the question whether
this non-financial information has been established, in all material respects, in accordance with this internationally recognized framework. Furthermore, we
do not express any form of assurance conclusion on individual elements that have been disclosed in this non-financial information.
Statements regarding independence• Our audit firm and our network have not performed any prohibited services and our audit firm has remained independent from the company during
the performance of our mandate.
• The fees for the additional non-audit services compatible with the statutory audit of the consolidated financial statements, as defined in article 134 of
the Companies Code, have been properly disclosed and disaggregated in the notes to the consolidated financial statements.
Other statements• This report is consistent with our additional report to the audit committee referred to in article 11 ofRegulation (EU) No 537/2014.
Zaventem, April, 2018
The statutory auditor
DELOITTE Bedrijfsrevisoren / Réviseurs d’Entreprises
BV o.v.v.e. CVBA / SC s.f.d. SCRL
Represented by Gert Vanhees
FINANCIAL REPORT130
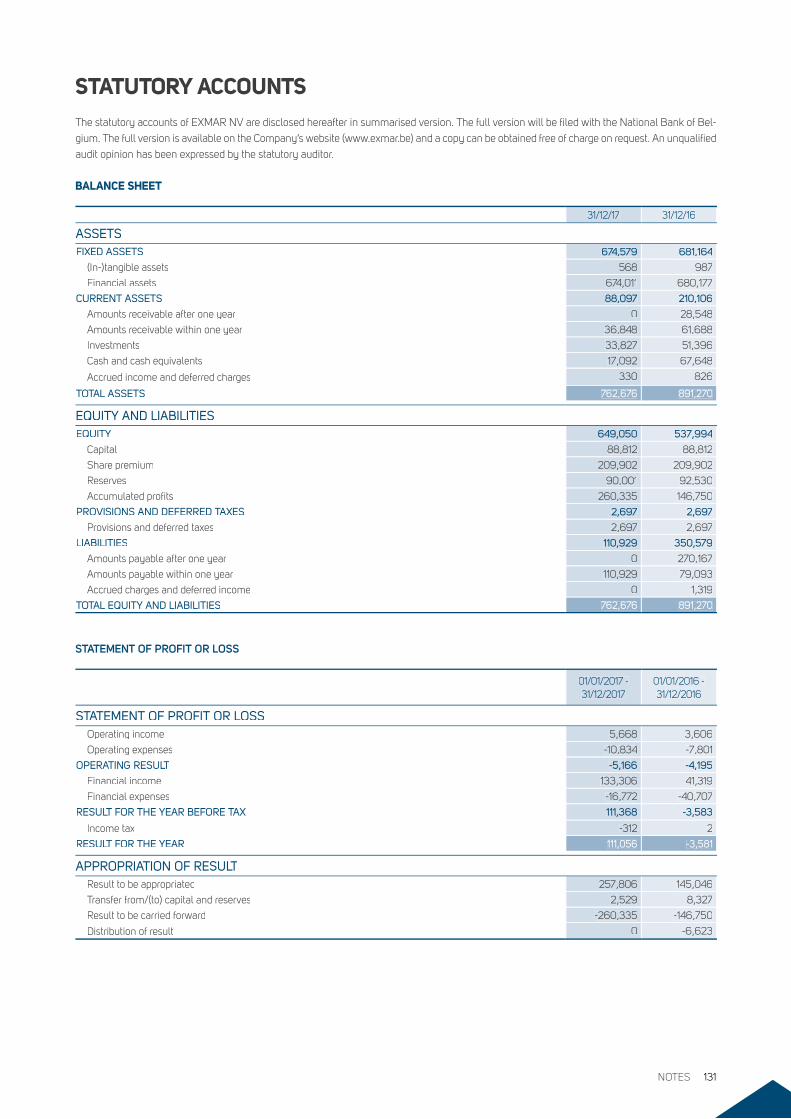
STATUTORY ACCOUNTSThe statutory accounts of EXMAR NV are disclosed hereafter in summarised version. The full version will be filed with the National Bank of Bel-
gium. The full version is available on the Company’s website (www.exmar.be) and a copy can be obtained free of charge on request. An unqualified
audit opinion has been expressed by the statutory auditor.
BALANCE SHEET
31/12/17 31/12/16
ASSETSASSETSFIXED ASSETS 674,579 681,164
(In-)tangible assets 568 987
Financial assets 674,011 680,177
CURRENT ASSETS 88,097 210,106
Amounts receivable after one year 0 28,548
Amounts receivable within one year 36,848 61,688
Investments 33,827 51,396
Cash and cash equivalents 17,092 67,648
Accrued income and deferred charges 330 826
TOTAL ASSETS 762,676 891,270
EQUITY AND LIABILITIESEQUITY 649,050 537,994
Capital 88,812 88,812
Share premium 209,902 209,902
Reserves 90,001 92,530
Accumulated profits 260,335 146,750
PROVISIONS AND DEFERRED TAXES 2,697 2,697
Provisions and deferred taxes 2,697 2,697
LIABILITIES 110,929 350,579
Amounts payable after one year 0 270,167
Amounts payable within one year 110,929 79,093
Accrued charges and deferred income 0 1,319
TOTAL EQUITY AND LIABILITIES 762,676 891,270
STATEMENT OF PROFIT OR LOSS
01/01/2017 - 31/12/2017
01/01/2016 - 31/12/2016
STATEMENT OF PROFIT OR LOSSOperating income 5,668 3,606
Operating expenses -10,834 -7,801
OPERATING RESULT -5,166 -4,195
Financial income 133,306 41,319
Financial expenses -16,772 -40,707
RESULT FOR THE YEAR BEFORE TAX 111,368 -3,583
Income tax -312 2
RESULT FOR THE YEAR 111,056 -3,581
APPROPRIATION OF RESULTAPPROPRIATION OF RESULTResult to be appropriated 257,806 145,046
Transfer from/(to) capital and reserves 2,529 8,327
Result to be carried forward -260,335 -146,750
Distribution of result 0 -6,623
NOTES 131
COLOPHON
BOARD OF DIRECTORSBaron Philippe Bodson – Chairman
Nicolas Saverys – CEO
Jalcos NV – represented by Ludwig Criel
Patrick De Brabandere – COO
Michel Delbaere
Howard Gutman
Jens Ismar
Ariane Saverys
Barbara Saverys
Pauline Saverys
Baron Philippe Vlerick
EXECUTIVE COMMITTEENicolas Saverys – Chief Executive Officer, Chairman
Patrick De Brabandere – Chief Operating Officer
Miguel de Potter – Chief Financial Officer
Pierre Dincq – Managing Director Shipping
Bart Lavent – Managing Director LNG Infrastructure
David Lim – Managing Director Offshore
Marc Nuytemans – CEO Exmar Shipmanagement
AUDITORDeloitte Auditors
Represented by
Mr. Gert Vanhees
EXMAR NV De Gerlachekaai 20
2000 Antwerp
Tel: +32(0)3 247 56 11
Fax: +32(0)3 247 56 01
Business registration number: 0860.409.202
RPR Antwerp
Website: www.exmar.com
E-mail: [email protected]
The Dutch version of this report must be
considered to be the official version.
COLOPHON 133
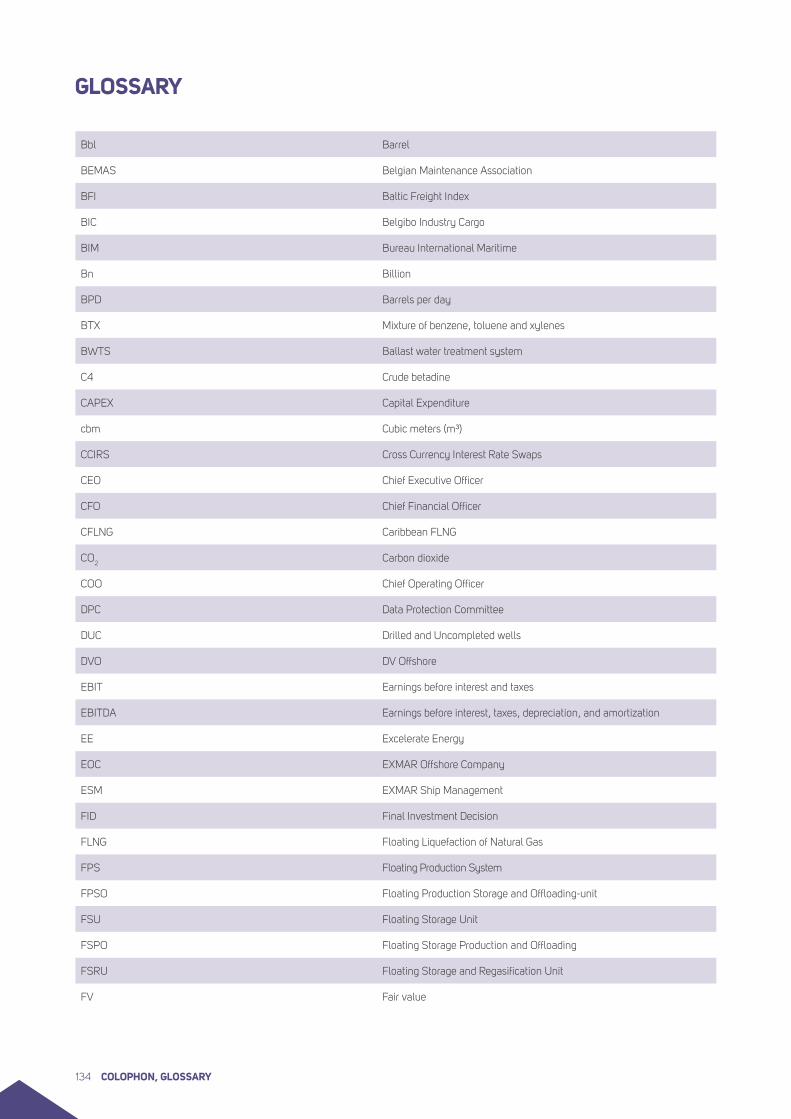
GLOSSARY
Bbl Barrel
BEMAS Belgian Maintenance Association
BFI Baltic Freight Index
BIC Belgibo Industry Cargo
BIM Bureau International Maritime
Bn Billion
BPD Barrels per day
BTX Mixture of benzene, toluene and xylenes
BWTS Ballast water treatment system
C4 Crude betadine
CAPEX Capital Expenditure
cbm Cubic meters (m³)
CCIRS Cross Currency Interest Rate Swaps
CEO Chief Executive Officer
CFO Chief Financial Officer
CFLNG Caribbean FLNG
CO2 Carbon dioxide
COO Chief Operating Officer
DPC Data Protection Committee
DUC Drilled and Uncompleted wells
DVO DV Offshore
EBIT Earnings before interest and taxes
EBITDA Earnings before interest, taxes, depreciation, and amortization
EE Excelerate Energy
EOC EXMAR Offshore Company
ESM EXMAR Ship Management
FID Final Investment Decision
FLNG Floating Liquefaction of Natural Gas
FPS Floating Production System
FPSO Floating Production Storage and Offloading-unit
FSU Floating Storage Unit
FSPO Floating Storage Production and Offloading
FSRU Floating Storage and Regasification Unit
FV Fair value
COLOPHON, GLOSSARY134
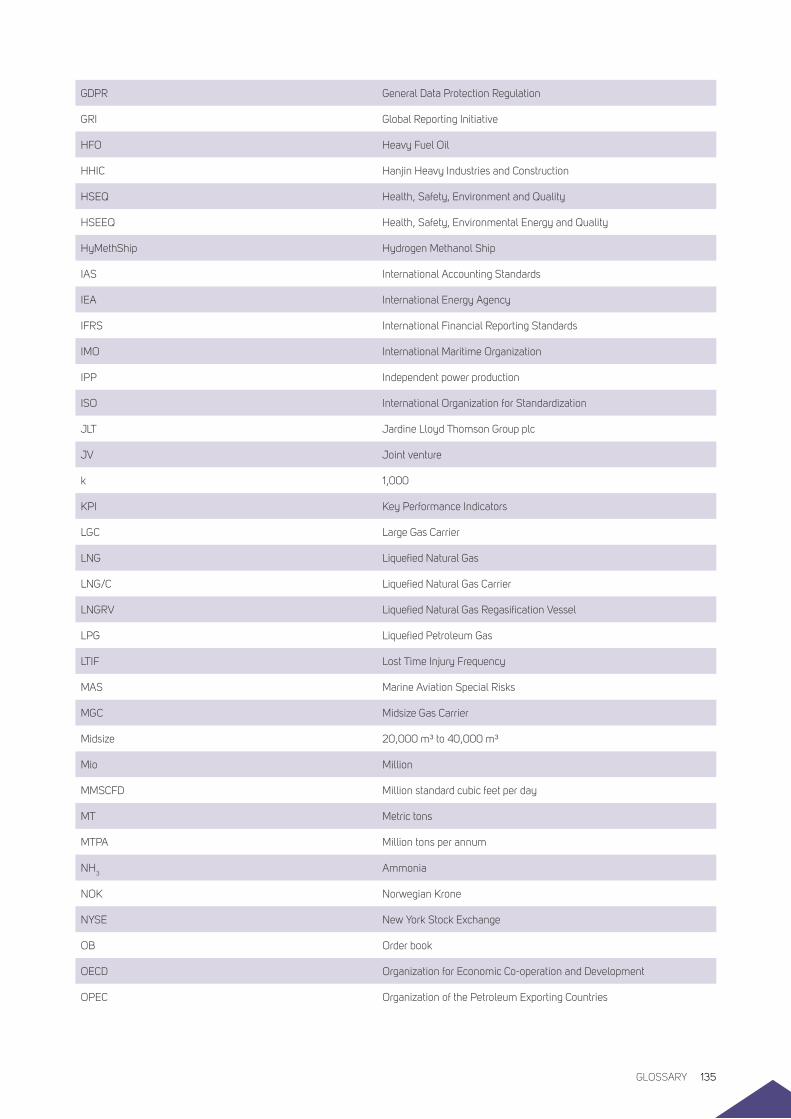
GDPR General Data Protection Regulation
GRI Global Reporting Initiative
HFO Heavy Fuel Oil
HHIC Hanjin Heavy Industries and Construction
HSEQ Health, Safety, Environment and Quality
HSEEQ Health, Safety, Environmental Energy and Quality
HyMethShip Hydrogen Methanol Ship
IAS International Accounting Standards
IEA International Energy Agency
IFRS International Financial Reporting Standards
IMO International Maritime Organization
IPP Independent power production
ISO International Organization for Standardization
JLT Jardine Lloyd Thomson Group plc
JV Joint venture
k 1,000
KPI Key Performance Indicators
LGC Large Gas Carrier
LNG Liquefied Natural Gas
LNG/C Liquefied Natural Gas Carrier
LNGRV Liquefied Natural Gas Regasification Vessel
LPG Liquefied Petroleum Gas
LTIF Lost Time Injury Frequency
MAS Marine Aviation Special Risks
MGC Midsize Gas Carrier
Midsize 20,000 m³ to 40,000 m³
Mio Million
MMSCFD Million standard cubic feet per day
MT Metric tons
MTPA Million tons per annum
NH3 Ammonia
NOK Norwegian Krone
NYSE New York Stock Exchange
OB Order book
OECD Organization for Economic Co-operation and Development
OPEC Organization of the Petroleum Exporting Countries
GLOSSARY 135
OPEX Operating Expenditures
Pcm Per calendar month
Petchems Petrochemicals
PEP Pacific Exploration & Production
POB Persons on board
PSU Power supply unit
PVC Polyvinylchloride
R&D Research & Development
REBITDA Recurring earnings before interests, taxes, depreciations and amortizations
Semi-ref. Semi-refrigerated LPG carrier
STS Ship-to-ship
TC Time charter
TCE Time charter equivalent
TTSL Taking The SAFETY LEAD
U/C Under Construction
UN United Nations
UNCTAD United Nations Conference on Trade & Development
US United States
USA United States of America
USD United States Dollar
VCM Vinyl Chloride Monomer
VLGC Very Large Gas Carrier
WAF West African
COLOPHON, GLOSSARY136

GLOSSARY 137