Embed Size (px)
Citation preview
The 5th International Symposium – Supercritical CO2 Power CyclesMarch 28-31, 2016, San Antonio, Texas
Exergy Analysis of the Allam Cycle
Mathias PenkuhnResearch Assistant
Technische Universität BerlinBerlin, Germany
George TsatsaronisProfessor
Technische Universität BerlinBerlin, Germany
Mathias Penkuhn is a research assistant at the Department of Energy En-gineering (group of Prof. Tsatsaronis) at Technische Universität Berlin, Ger-many. He received a diploma in process engineering from Technische Univer-sität Dresden, Germany. His areas of interest include the design, analysis andoptimization of energy conversion systems and the application and further de-velopment of exergy and exergoeconomic methods.
George Tsatsaronis is since 1994 the Bewag Professor of Energy Engineeringand Environmental Protection at the Technische Universität Berlin, Germany.His areas of interest include the design, development, analysis and optimiza-tion of energy conversion systems. He contributed significantly to the funda-mentals and terminology of exergy-based methods. He co-authored the book“Thermal Design and Optimisation” (Wiley, 1996), has published more than300 papers, received several international awards and recognitions, and hasserved as Chairman or Co-chairman of 18 international conferences.
Abstract
In the generation of electricity from fossil fuels a large part of the CO2 emissions can be omittedby employing carbon capture and sequestration. This, however, significantly reduces the overallplant efficiency. The recently developed Allam cycle presents a new approach to combine low-costpower generation with complete CO2 separation at a high-efficiency. The cycle employs oxy-fuelcombustion of hydrocarbons in a supercritical CO2 environment with subsequent expansion in ahybrid gas-steam turbine. The resulting high CO2 concentration in the turbine exhaust simplifiesthe step of CO2 separation. As a result, the cycle is supposed to achieve efficiencies of up to59 % (LHV) for natural gas operation. Based on the published cycle data, an exergy analysis isused to investigate the cycle performance regarding its parameters and configurations for naturalgas combustion. A sensitivity analysis is used to study the effects of the most important ther-modynamic parameters. The exergy concept thereby helps to identify the sources of the cycle’sthermodynamic inefficiencies at the component level. This information is further used to comparethe Allam cycle design with other designs incorporating CO2 separation, in order to identify themain differences. However, based on the identified inefficiencies in the proposed cycle design,important aspects for further research and development are identified.
1 Introduction
Future outlooks by the IEA [1] and the U.S. Department of Energy [2] regarding the worldwideprimary energy usage show an increasing demand and change in resources for the forthcomingyears. While the relative share of oil – as the main source of energy – is probably going to decline
1
between the years 1990 and 2040, the relative share of coal and natural gas is increasing [1,2] dueto extensive secured resources and global availability. The projections further indicate that coaland natural gas will remain two of the world’s main sources of energy regarding power generation.
Due to the increasing industrial competition and more stringent governmental policies world-wide, the demand for new, efficient and economically competitive processes is high, especiallyregarding the emission of pollutants [3,4]. As a result, an enormous effort is made in the researchand development concerning the clean utilization of coal and natural gas by improving traditionaland developing new technologies [3–13].
For the research and development of future power generation technologies, the feature ofcarbon dioxide (CO2) capture is essential. In general, three different approaches can be usedfor CO2 capture from fossil fuel based power generation: post-combustion, pre-combustion, andoxy-combustion [14, 15]. All three approaches differ greatly in technological implementation. Inpost-combustion capture, the CO2 is captured from the flue gas which is dilute in CO2 and atambient pressure. In contrast, pre-combustion technology removes the CO2 from a synthesis gasderived by gasification of coal or reforming of natural gas. Thus, the synthesis gas is concentratedin CO2 and at high pressure. The synthesis gas is then burned in a gas turbine for power genera-tion. Another possibility is the application of oxy-combustion technology, where the fuel is burnedin a pure oxygen environment stream containing almost no nitrogen. As a result, the flue gashas a very high CO2 concentration thus greatly facilitating its removal. Even though the differenttechnological approaches have their decisive advantages, the inherent efficiency penalties dueto thermodynamic limitations and the high additional costs of carbon capture equipment make itincreasingly challenging to implement any of the three different technologies [4,15–19] when usedwith traditional power generation systems.
In this context it has to be mentioned that a carbon capture, utilization and storage (CCUS)[9, 20] pathway is a means to utilize CO2 in the production of valuable outputs thus generating arevenue that is beneficial for offsetting the costs associated with carbon capture. From this pointof view it is clear that new and innovative power cycles are required.
While commercial post- and pre-combustion CO2 capture technologies are readily available,oxy-combustion technology is still under rapid development but not commercially available yet.Nevertheless, the main technologies for oxy-combustion, air separation for oxygen productionand pure oxygen combustion itself, can be considered as state-of-the-art today [4].
Although oxy-combustion technology can be used with all kinds of fuels [4,8,21], the applica-tion in natural-gas-fired power plants using oxy-combustion turbines is highly attractive substitut-ing air as the working fluid with carbon dioxide (CO2) or water (H2O), respectively. By eliminatingthe nitrogen, the combustion of natural gas with pure oxygen generates a flue gas that consistsmainly of CO2 and H2O. This mixture can be easily separated by condensation thus simplifyingthe CO2 capture step. However, an additional oxygen production unit and a large recycle streamto moderate the combustion temperature are required thus resulting in semi-closed cycle designs.Such gas turbine configurations differ greatly from conventional designs as the physical proper-ties of CO2 and H2O are different from air. This is particularly important in the development of therequired turbomachinery.
In the literature, different semi-closed cycles using CO2 or H2O as the main working fluidhave been proposed. The conditions (temperature and pressure) of the working fluids differ greatlybetween the cycles. The designs include semi-closed oxy-combustion combined cycles (SCOC-CC) that closely resembles a conventional combined cycle but with CO2 as the main workingfluid [21–26]. Another proposed cycle by Clean Energy Systems (CES cycle) uses H2O as themain working fluid in a subcritical cycle [24, 25, 27, 28]. Another subcritical cycle that has beenproposed with either CO2 or H2O as the combustion temperature moderator is the Graz cycle [29–
2
32]. Furthermore, the CO2-based MATIANT cycle has been proposed using different supercriticaland subcritical configurations [23, 33–36]. All the different cycles are employing a conventionalcryogenic air separation unit (ASU) for oxygen production.
In contrast, another option for oxygen production by employing high temperature oxygentransport membranes (OTM) has been proposed in the the AZEP [37,38]) and ZEITMOP [39,40]designs. Other options for oxy-combustion include Chemical Looping Combustion (CLC) [41] andhybridized solid oxide fuel cell and gas turbine systems (SOFC-GT) [42,43].
However, despite the innovative nature of the oxy-combustion systems, all cycles show alarge efficiency penalty compared to a conventional natural-gas-fired combined cycle (NGCC)power plant as large auxiliary power requirements for oxygen production are present. With effi-ciencies in the range of 45-52.5 % [21,24,25,44–46], the processes will remain economically notfeasible in the near future thus prohibiting their commercialization. Furthermore, technologies likeoxygen transport membranes, chemical looping combustion and solid oxide fuel cells are currentlynot at a level of development that would allow them to become commercially available in the nearfuture [8].
In the case of the semi-closed cycles, the auxiliary power demand for the cryogenic air sep-aration unit (ASU) reduces the cycle performance. However, the recently proposed Allam cy-cle [47, 48] recovers heat from the ASU into the main power cycle to boost the overall cycle’sefficiency. Combined with features such as an efficient compression/pumping configuration forCO2 compression, and a high temperature heat recovery, a very high cycle efficiency of 59 %(LHV) is reported for natural gas operation. This figure is even higher than the baseline efficiencyused by the U.S. Department of Energy National Energy Technology Laboratory’s baseline effi-ciency [10] for conventional NGCCs.
As not much information is available for the Allam cycle [47, 48], the already published datais used in the following analyses to evaluate the configuration of the natural gas oxy-combustionAllam cycle. Furthermore, exergy analyses [49,50] are used to identify the location, the magnitude,and the sources of the thermodynamic inefficiencies that occur within the process. In particular,the combination of exergy and sensitivity analyses provide a systematic framework to thoroughlyunderstand [51–53] the process for further research and development.
2 System Description
For a rigorous analysis, the Allam cycle is first characterized considering its main features. Sub-sequently, the simulation model is described and the assumptions are specified.
2.1 Allam Cycle Features
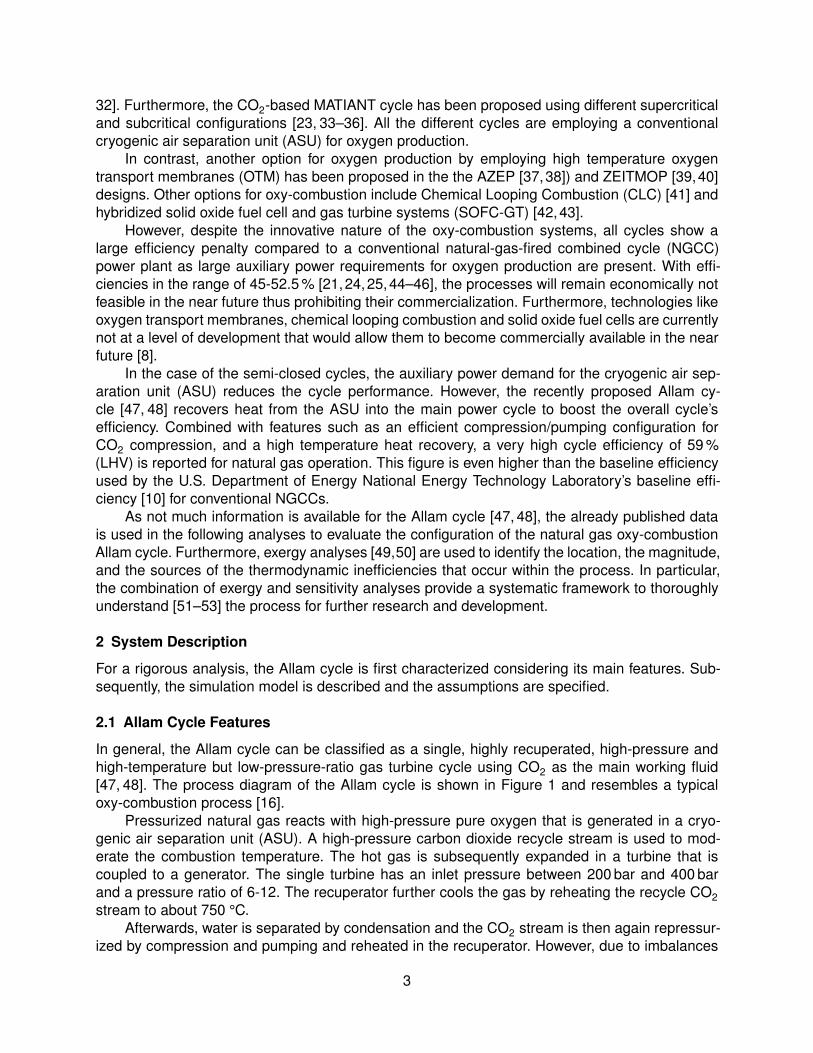
In general, the Allam cycle can be classified as a single, highly recuperated, high-pressure andhigh-temperature but low-pressure-ratio gas turbine cycle using CO2 as the main working fluid[47, 48]. The process diagram of the Allam cycle is shown in Figure 1 and resembles a typicaloxy-combustion process [16].
Pressurized natural gas reacts with high-pressure pure oxygen that is generated in a cryo-genic air separation unit (ASU). A high-pressure carbon dioxide recycle stream is used to mod-erate the combustion temperature. The hot gas is subsequently expanded in a turbine that iscoupled to a generator. The single turbine has an inlet pressure between 200 bar and 400 barand a pressure ratio of 6-12. The recuperator further cools the gas by reheating the recycle CO2stream to about 750 °C.
Afterwards, water is separated by condensation and the CO2 stream is then again repressur-ized by compression and pumping and reheated in the recuperator. However, due to imbalances
3
Figure 1: Process diagram of the Allam cycle
Table 1: Environment conditions used for the simulation based on [58]
Site Conditions Air Composition
Model Midwest ISO Nitrogen (N2) 0.7732 mol/molAmbient Pressure 1.01325 bar Oxygen (O2) 0.2074 mol/molAmbient Dry Bulb Temperature 15.0 °C Argon (Ar) 0.0091 mol/molAmbient Wet Bulb Temperature 10.8 °C Carbon Dioxide (CO2) 0.0003 mol/molRelative Humidity 60 % Water (H2O) 0.0100 mol/molCooling Water Temperature 15.6 °C Molar Mass 28.854 kg/kmol
in the thermodynamic properties between the hot gases leaving the turbine and the recycled CO2,a low-temperature heat input is required where waste heat from the ASU can be effectively uti-lized. Instead of being rejected to the environment, it thus contributes to a higher efficiency of theoverall cycle.
As the combustion of hydrocarbons introduces CO2 into the power cycle, a small amountof it has to be constantly removed from the process. As the CO2 content of the purge stream isvery high (≈ 97 %), it can be either directly fed to a pipeline or further purified, depending on theprospective application [20,54].
2.2 Description of the Simulation Model
As the Allam cycle is currently being commercialized by a consortium of NET Power, CB&I,Toshiba and Exelon, only limited information is publicly available [46–48, 55, 56]. In order to beable to benchmark the Allam cycle and to obtain comparable simulation results [24, 57], bestpractice guidelines are used in addition to the available process data.
The synthesized process flowsheet based on the data that is publicly available [46–48,55] isshown in Figure 2.
The environmental conditions as well as the air composition is specified according to [58] andis shown in Table 1. Furthermore, the composition of the natural gas supplied to the power cycleis set using the average data that is given by [10,59]. The molar composition as well as the supplytemperature and pressure are shown in Table 2.
As the scope of this study is to analyze the Allam cycle in detail, the auxiliary air separationunit (ASU), the CO2 purification and compression as well as the cooling tower are modeled byblack boxes. A specific power demand is specified for each unit in order to calculate the powerthat has to be supplied by the main cycle.
4
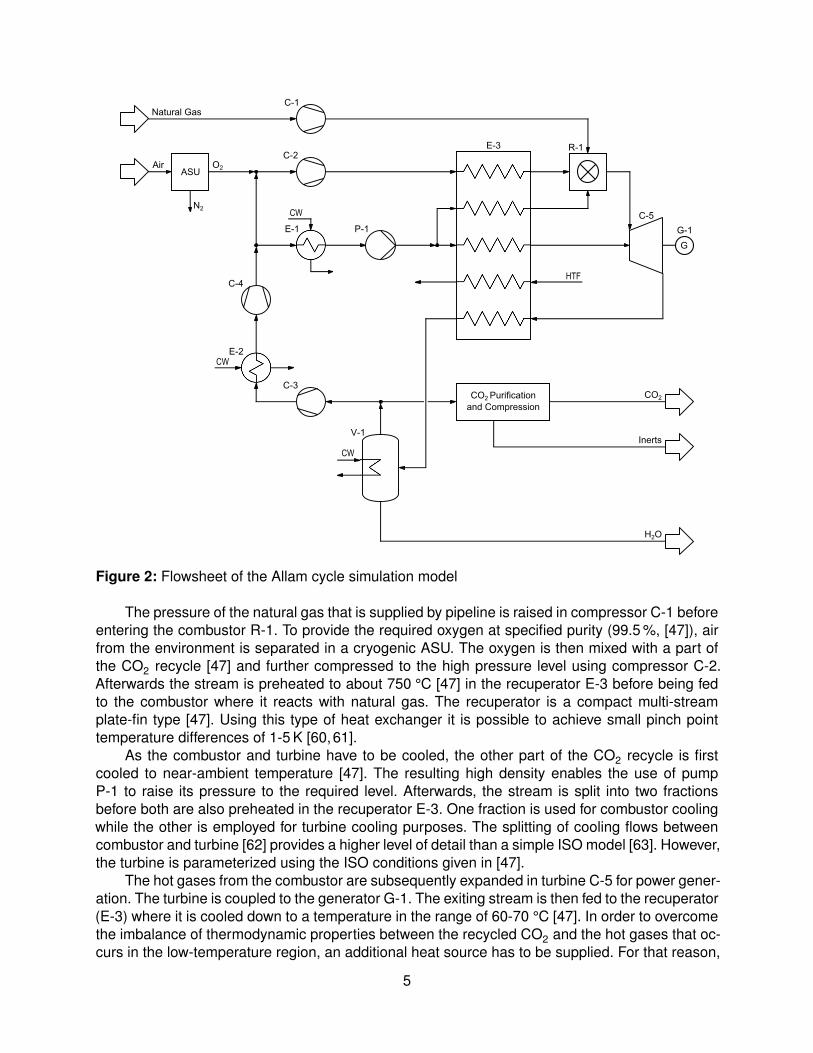
Figure 2: Flowsheet of the Allam cycle simulation model
The pressure of the natural gas that is supplied by pipeline is raised in compressor C-1 beforeentering the combustor R-1. To provide the required oxygen at specified purity (99.5 %, [47]), airfrom the environment is separated in a cryogenic ASU. The oxygen is then mixed with a part ofthe CO2 recycle [47] and further compressed to the high pressure level using compressor C-2.Afterwards the stream is preheated to about 750 °C [47] in the recuperator E-3 before being fedto the combustor where it reacts with natural gas. The recuperator is a compact multi-streamplate-fin type [47]. Using this type of heat exchanger it is possible to achieve small pinch pointtemperature differences of 1-5 K [60,61].
As the combustor and turbine have to be cooled, the other part of the CO2 recycle is firstcooled to near-ambient temperature [47]. The resulting high density enables the use of pumpP-1 to raise its pressure to the required level. Afterwards, the stream is split into two fractionsbefore both are also preheated in the recuperator E-3. One fraction is used for combustor coolingwhile the other is employed for turbine cooling purposes. The splitting of cooling flows betweencombustor and turbine [62] provides a higher level of detail than a simple ISO model [63]. However,the turbine is parameterized using the ISO conditions given in [47].
The hot gases from the combustor are subsequently expanded in turbine C-5 for power gener-ation. The turbine is coupled to the generator G-1. The exiting stream is then fed to the recuperator(E-3) where it is cooled down to a temperature in the range of 60-70 °C [47]. In order to overcomethe imbalance of thermodynamic properties between the recycled CO2 and the hot gases that oc-curs in the low-temperature region, an additional heat source has to be supplied. For that reason,
5
Table 2: Natural gas supply specification according to [10,59]
Methane (CH4) 0.931 mol/mol Lower Heating Value (LHV) 47457 kJ/kgEthane (C2H6) 0.032 mol/mol Higher Heating Value (HHV) 52581 kJ/kgPropane (C3H8) 0.007 mol/mol Temperature 38.0 °Cn-Butane (C4H10) 0.004 mol/mol Pressure 30 barCarbon Dioxide (CO2) 0.010 mol/molNitrogen (N2) 0.016 mol/mol
a heat transfer fluid (HTF) is used that transfers a portion of the heat of compression from theASU at the required temperature level.
After leaving the recuperator, the flue gases are further cooled down to condense a largeportion of the water. The separator V-1 is used to remove the liquid water. The remaining vapor,that contains about 97 % CO2, is then compressed using a two-stage inter-cooled compressor(C-3, C-4, E-2) [47] thus closing the power cycle. Nevertheless, a small portion of the vapor ispurged from the cycle. This purge stream is subsequently treated in the CO2 purification andcompression unit. The scope of this unit is to provide the CO2 concentration and pressure to meetthe specifications for further usage in possible storage, enhanced oil recovery (EOR) or chemicalfeedstock applications [54,64].
In order to obtain relevant results from the simulation model, it has to be parameterizeddefining the technology level and the operating conditions of the plant [57].
The simulations were conducted using the Aspen Plus modeling software. The thermody-namic properties are calculated using the Peng-Robinson equation of state for general propertycalculations whereas the Lee-Kesler-Plöcker equation is used for the CO2 recompression mod-eling as recommended in [58]. Due to the fact that a detailed analysis of the Allam cycle is notavailable, and in order to consider the influence of the assumed technological level, three differ-ent cases are investigated. By defining a base, low and high efficiency case, the influence of themain assumptions is revealed. The component parameters that are employed in the simulationsare given in Table 3. By taking uncertainty for some parameters into account, it is possible toestimate their impact on the cycle’s performance using general benchmark parameters. Based onthe results of the case studies, subsequent sensitivity analyses are conducted by variation of theperformance of main components.
3 Methodology
In order to analyze the Allam cycle, a conventional thermodynamic analysis as well as an exergyanalysis are used. The first methodology provides only general information about the thermody-namic efficiency, whereas the latter provides detailed data about the main sources of the cycle’sinefficiencies.
3.1 Thermodynamic Analysis
By employing the Aspen Plus modeling software, the energy and mass balances for the simulationmodel are solved. Based on the methodology of general thermodynamic studies [57, 58], theefficiency of the overall power cycle is evaluated by
” =Wnet
mfuel · LHV(1)
However, in order to provide a comparable benchmark, the selected modeling framework has tobe taken into account [57,58].
6
Table 3: Simulation parameters for the analysis of the Allam cycle
Parameter Base Case Variation Reference
Turbine Inlet Temperature (ISO) °C 1150 ± 0 [47]Turbine Inlet Pressure bar 300 ± 0 [47]Turbine Pressure Ratio – 0.1 ± 0 [47]Combustor R-1, Outlet Temperature °C 1300 ± 100 [46]Combustor R-1, Pressure Drop % 1.6 ± 0 [47]Combustor R-1, Heat Loss % 1.0 ± 0 [58]Oxygen Purity % 99.5 ± 0 [47]Excess Oxygen % 2.0 ± 0 [24]O2 Fraction (Molar) after Dilution % 22.5 ± 7.5 [47]Pump P-1, Efficiency % 75 ± 5 [58]Pump P-1, Mechanical Efficiency % 98 ± 0 [58]Compressor C-1-C-4, Polytropic Efficiency % 80 ± 5 [58]Compressor C-1-C-4, Mechanical Efficiency % 98 ± 0 [58]Motor Efficency % 97 ± 0 [58]Generator G-1, Efficiency % 99 ± 0 [58]Heat Exchanger E-1, E-2, Pinch Temperature Difference K 7.5 ± 2.5 [58]Heat Exchanger E-1, E-2, Pressure Drop (gas) % 2 ± 0 [58]Heat Exchanger E-1, E-2, Pressure Drop (liquid) % 4 ± 0 [58]Heat Exchanger E-3, Pinch Temperature Difference K 3 ± 2 [60,61]Heat Exchanger E-3, Pressure Drop % 2 ± 0 [58]Separator V-1, Pressure Drop % 2 ± 0 [58]Cooling Water Range K 11 ± 0 [58]Cooling Tower Fan Power Demand W=m3
Air 197,5 ± 0 [65]ASU, Specific Power Demand kWh/kgO2
250 ± 50 [66,67]CO2 Purification, Specific Power Demand kWh/kgCO2
50 ± 25 [67]
Table 4: Reference environment used for the exergetic analysis
Ambient Temperature 15 °CAmbient Pressure 1.01325 barChemical exergy model Szargut [68]
3.2 Exergy Analysis
For the analysis of systems and their constituent components, the exergy analysis provides a use-ful framework to uncover the real thermodynamic inefficiencies. Exergy is defined as the maximumtheoretical useful work obtainable from a thermal system as it is brought into thermodynamic equi-librium with the environment while interacting with the environment only. As exergy is destroyed inany real process, it provides information which is simply not available through conventional ther-modynamic analyses. The main causes of exergy destruction are generally related to chemicalreactions, heat transfer, fluid friction, and mixing of streams at different temperature, pressureand composition. The methodology and capabilities of a conventional exergy analysis are welldocumented [49,50,68,69].
Parameters obtained from exergy analysis are used to characterize the thermodynamic per-formance of a system and its different components from an unbiased point of view. This is done byintroducing a reference environment, that is shown in Table 4 and corresponds with the modelingframework used for benchmarking purposes.
To provide more details, the exergy is further split into its chemical and physical parts [50] foranalyzing the power cycle.
E = ECH + EPH (2)
7
Considering that the process operates at steady-state conditions, the exergy balance for com-ponent k is used to calculate its exergy destruction ED;k . The balance contains different terms forexergy transport by heat transfer Eq and power W as well as with transport of matter at the inletEi and exit Ee of component k.X
j
Eq;j;k + Wk +Xi
Ei ;k −Xe
Ee;k − ED;k = 0 (3)
The exergy destruction ED;k can further be used to determine the real thermodynamic perfor-mance of a system’s component k as well as for the overall system. The exergetic efficiencies ofthe k-th component "k is calculated using the following equation:
"k =EP;k
EF;k= 1− ED;k
EF;k(4)
Besides the exergy destruction that occurs within the system components, the analysis of theoverall system also has to consider possible exergy losses to the environment.
"tot =EP;tot
EF;tot= 1−
PkED;k + EL;tot
EF;tot(5)
The exergy rates EP;k and EF;k determine the respective exergy rates of product and fuel of theexamined component k. Furthermore, EP;tot and EF;tot are the exergy rates of product and fuel ofthe overall system. By calculating the sum of the components exergy destruction ED;k as well asthe exergy losses from the overall system EL;tot, the system’s real thermodynamic inefficienciesare determined.
In order to assign the appropriate exergy rates of product and fuel to the different componentsand the overall plant, the SPECO framework [70] is used. It provides a consistent methodologyfor defining the real thermodynamic efficiencies of a component and the overall system.
However, with the exergy destruction ratio yD;k another useful parameter can be defined. Itquantifies the contribution of the exergy destruction within component k to the reduction of theoverall exergetic efficiency "tot of the system.
yD;k =ED;k
EF;tot(6)
In general, the different exergy-related parameters can be used to analyze and subsequentlyimprove any thermal system. The exergy analysis further provides a convenient framework forbenchmarking and comparing different processes from an unbiased point of view.
4 Results
This section presents the findings of the main cycle analysis to show the consequences of theassumptions that were used for the parameterization of the simulation. Furthermore, the resultsof the thermodynamic and exergetic analyses are the starting point for discussing the importanceof the main cycle components by conducting sensitivity analyses.
8
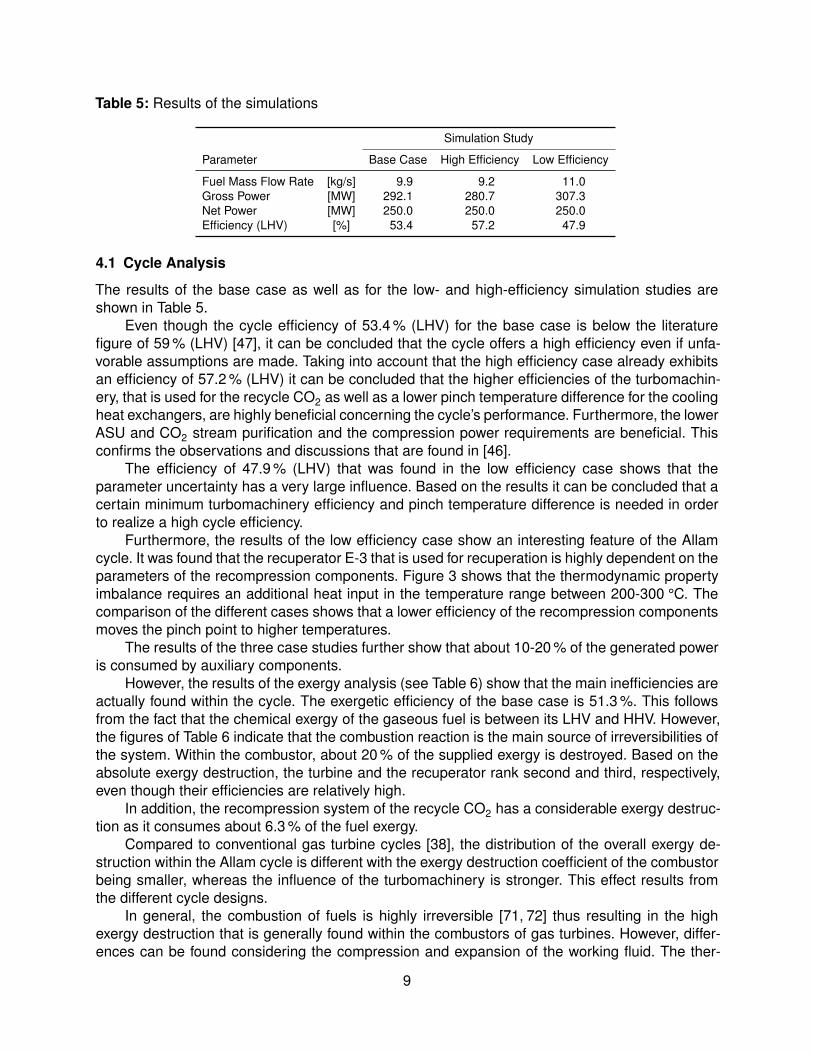
Table 5: Results of the simulations
Simulation Study
Parameter Base Case High Efficiency Low Efficiency
Fuel Mass Flow Rate [kg/s] 9.9 9.2 11.0Gross Power [MW] 292.1 280.7 307.3Net Power [MW] 250.0 250.0 250.0Efficiency (LHV) [%] 53.4 57.2 47.9
4.1 Cycle Analysis
The results of the base case as well as for the low- and high-efficiency simulation studies areshown in Table 5.
Even though the cycle efficiency of 53.4 % (LHV) for the base case is below the literaturefigure of 59 % (LHV) [47], it can be concluded that the cycle offers a high efficiency even if unfa-vorable assumptions are made. Taking into account that the high efficiency case already exhibitsan efficiency of 57.2 % (LHV) it can be concluded that the higher efficiencies of the turbomachin-ery, that is used for the recycle CO2 as well as a lower pinch temperature difference for the coolingheat exchangers, are highly beneficial concerning the cycle’s performance. Furthermore, the lowerASU and CO2 stream purification and the compression power requirements are beneficial. Thisconfirms the observations and discussions that are found in [46].
The efficiency of 47.9 % (LHV) that was found in the low efficiency case shows that theparameter uncertainty has a very large influence. Based on the results it can be concluded that acertain minimum turbomachinery efficiency and pinch temperature difference is needed in orderto realize a high cycle efficiency.
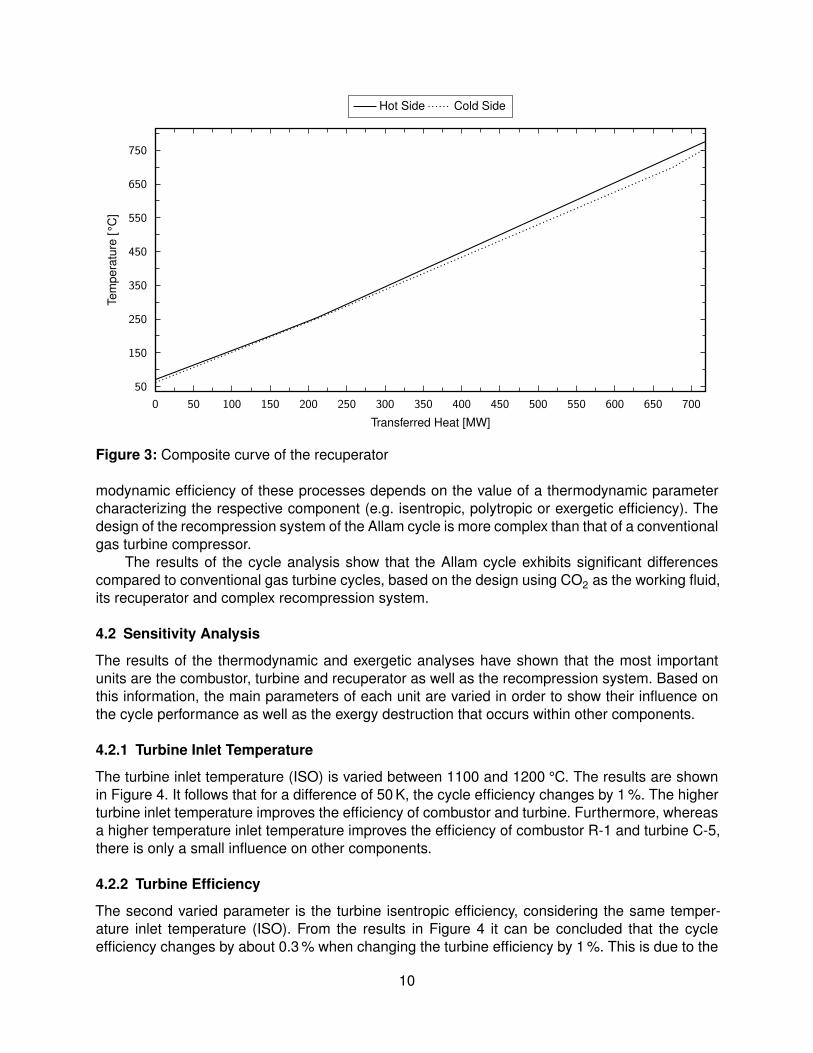
Furthermore, the results of the low efficiency case show an interesting feature of the Allamcycle. It was found that the recuperator E-3 that is used for recuperation is highly dependent on theparameters of the recompression components. Figure 3 shows that the thermodynamic propertyimbalance requires an additional heat input in the temperature range between 200-300 °C. Thecomparison of the different cases shows that a lower efficiency of the recompression componentsmoves the pinch point to higher temperatures.
The results of the three case studies further show that about 10-20 % of the generated poweris consumed by auxiliary components.
However, the results of the exergy analysis (see Table 6) show that the main inefficiencies areactually found within the cycle. The exergetic efficiency of the base case is 51.3 %. This followsfrom the fact that the chemical exergy of the gaseous fuel is between its LHV and HHV. However,the figures of Table 6 indicate that the combustion reaction is the main source of irreversibilities ofthe system. Within the combustor, about 20 % of the supplied exergy is destroyed. Based on theabsolute exergy destruction, the turbine and the recuperator rank second and third, respectively,even though their efficiencies are relatively high.
In addition, the recompression system of the recycle CO2 has a considerable exergy destruc-tion as it consumes about 6.3 % of the fuel exergy.
Compared to conventional gas turbine cycles [38], the distribution of the overall exergy de-struction within the Allam cycle is different with the exergy destruction coefficient of the combustorbeing smaller, whereas the influence of the turbomachinery is stronger. This effect results fromthe different cycle designs.
In general, the combustion of fuels is highly irreversible [71, 72] thus resulting in the highexergy destruction that is generally found within the combustors of gas turbines. However, differ-ences can be found considering the compression and expansion of the working fluid. The ther-
9
0 50 100 150 200 250 300 350 400 450 500 550 600 650 700
50
150
250
350
450
550
650
750
Transferred Heat [MW]
Tem
pera
ture
[°C
]Hot Side Cold Side
Figure 3: Composite curve of the recuperator
modynamic efficiency of these processes depends on the value of a thermodynamic parametercharacterizing the respective component (e.g. isentropic, polytropic or exergetic efficiency). Thedesign of the recompression system of the Allam cycle is more complex than that of a conventionalgas turbine compressor.
The results of the cycle analysis show that the Allam cycle exhibits significant differencescompared to conventional gas turbine cycles, based on the design using CO2 as the working fluid,its recuperator and complex recompression system.
4.2 Sensitivity Analysis
The results of the thermodynamic and exergetic analyses have shown that the most importantunits are the combustor, turbine and recuperator as well as the recompression system. Based onthis information, the main parameters of each unit are varied in order to show their influence onthe cycle performance as well as the exergy destruction that occurs within other components.
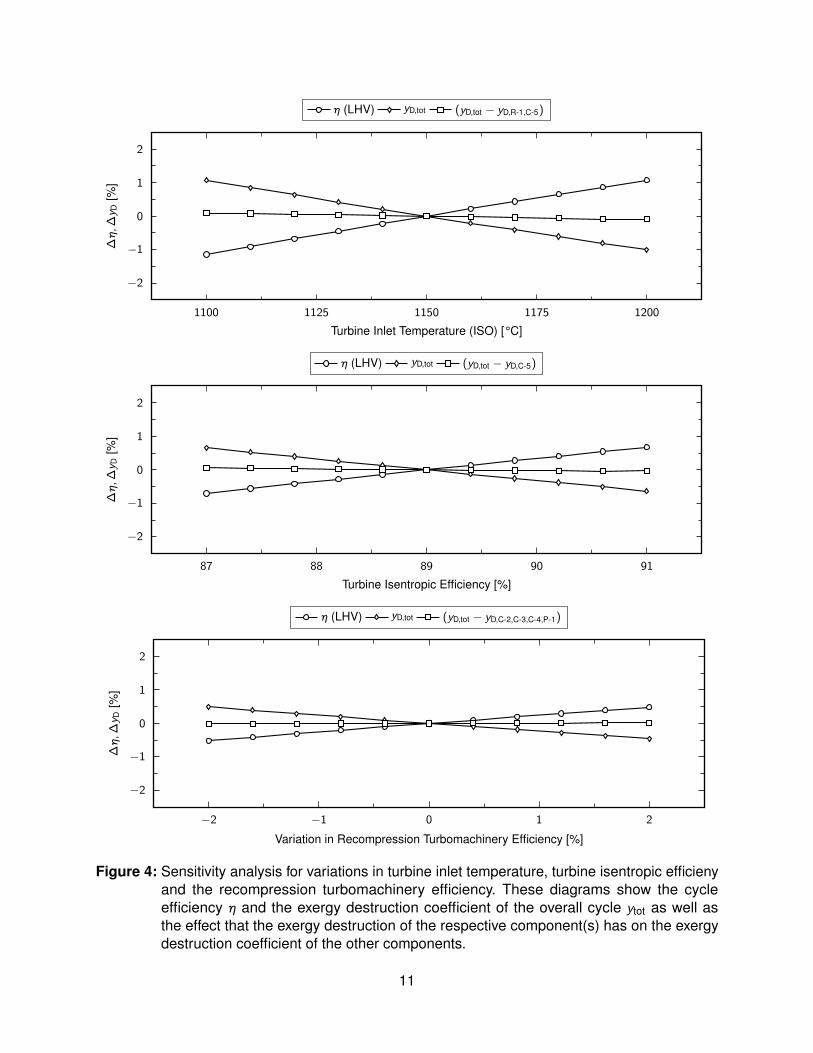
4.2.1 Turbine Inlet Temperature
The turbine inlet temperature (ISO) is varied between 1100 and 1200 °C. The results are shownin Figure 4. It follows that for a difference of 50 K, the cycle efficiency changes by 1 %. The higherturbine inlet temperature improves the efficiency of combustor and turbine. Furthermore, whereasa higher temperature inlet temperature improves the efficiency of combustor R-1 and turbine C-5,there is only a small influence on other components.
4.2.2 Turbine Efficiency
The second varied parameter is the turbine isentropic efficiency, considering the same temper-ature inlet temperature (ISO). From the results in Figure 4 it can be concluded that the cycleefficiency changes by about 0.3 % when changing the turbine efficiency by 1 %. This is due to the
10
1100 1125 1150 1175 1200
−2
−1
0
1
2
Turbine Inlet Temperature (ISO) [°C]
∆”;∆y D
[%]
” (LHV) yD,tot (yD,tot − yD,R-1,C-5)
87 88 89 90 91
−2
−1
0
1
2
Turbine Isentropic Efficiency [%]
∆”;∆y D
[%]
” (LHV) yD,tot (yD,tot − yD,C-5)
−2 −1 0 1 2
−2
−1
0
1
2
Variation in Recompression Turbomachinery Efficiency [%]
∆”;∆y D
[%]
” (LHV) yD,tot (yD,tot − yD,C-2,C-3,C-4,P-1)
Figure 4: Sensitivity analysis for variations in turbine inlet temperature, turbine isentropic efficienyand the recompression turbomachinery efficiency. These diagrams show the cycleefficiency ” and the exergy destruction coefficient of the overall cycle ytot as well asthe effect that the exergy destruction of the respective component(s) has on the exergydestruction coefficient of the other components.
11
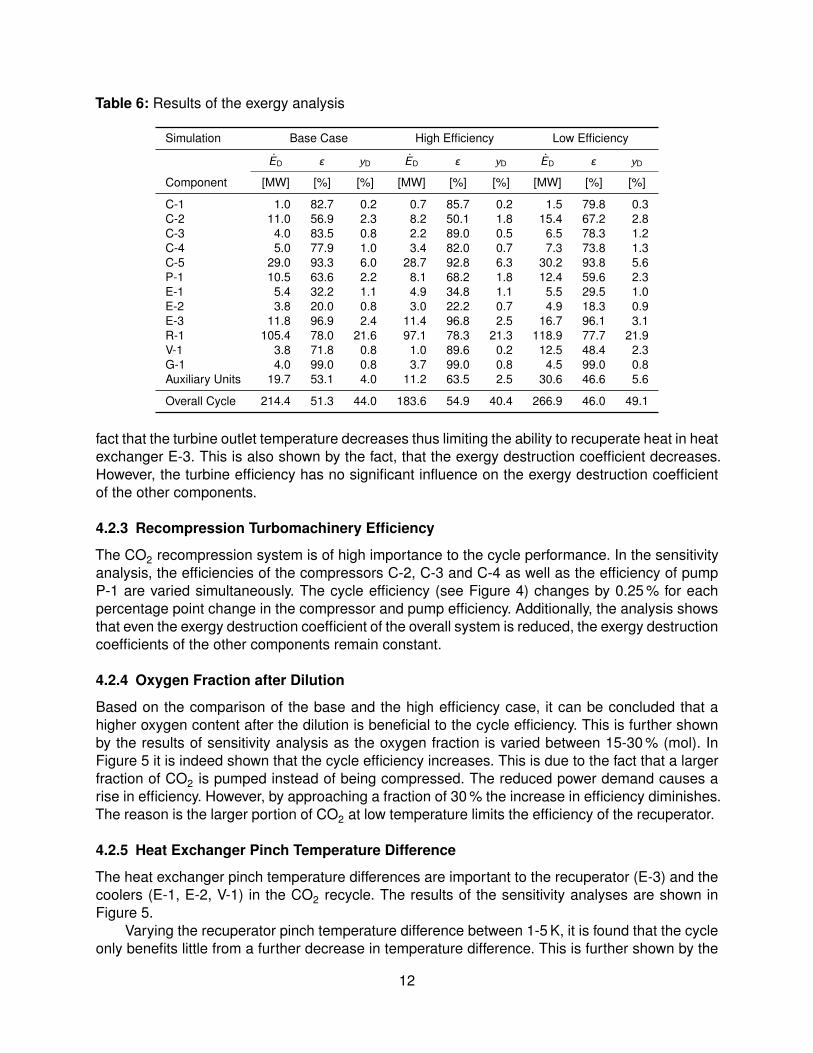
Table 6: Results of the exergy analysis
Simulation Base Case High Efficiency Low Efficiency
ED " yD ED " yD ED " yD
Component [MW] [%] [%] [MW] [%] [%] [MW] [%] [%]
C-1 1.0 82.7 0.2 0.7 85.7 0.2 1.5 79.8 0.3C-2 11.0 56.9 2.3 8.2 50.1 1.8 15.4 67.2 2.8C-3 4.0 83.5 0.8 2.2 89.0 0.5 6.5 78.3 1.2C-4 5.0 77.9 1.0 3.4 82.0 0.7 7.3 73.8 1.3C-5 29.0 93.3 6.0 28.7 92.8 6.3 30.2 93.8 5.6P-1 10.5 63.6 2.2 8.1 68.2 1.8 12.4 59.6 2.3E-1 5.4 32.2 1.1 4.9 34.8 1.1 5.5 29.5 1.0E-2 3.8 20.0 0.8 3.0 22.2 0.7 4.9 18.3 0.9E-3 11.8 96.9 2.4 11.4 96.8 2.5 16.7 96.1 3.1R-1 105.4 78.0 21.6 97.1 78.3 21.3 118.9 77.7 21.9V-1 3.8 71.8 0.8 1.0 89.6 0.2 12.5 48.4 2.3G-1 4.0 99.0 0.8 3.7 99.0 0.8 4.5 99.0 0.8Auxiliary Units 19.7 53.1 4.0 11.2 63.5 2.5 30.6 46.6 5.6
Overall Cycle 214.4 51.3 44.0 183.6 54.9 40.4 266.9 46.0 49.1
fact that the turbine outlet temperature decreases thus limiting the ability to recuperate heat in heatexchanger E-3. This is also shown by the fact, that the exergy destruction coefficient decreases.However, the turbine efficiency has no significant influence on the exergy destruction coefficientof the other components.
4.2.3 Recompression Turbomachinery Efficiency
The CO2 recompression system is of high importance to the cycle performance. In the sensitivityanalysis, the efficiencies of the compressors C-2, C-3 and C-4 as well as the efficiency of pumpP-1 are varied simultaneously. The cycle efficiency (see Figure 4) changes by 0.25 % for eachpercentage point change in the compressor and pump efficiency. Additionally, the analysis showsthat even the exergy destruction coefficient of the overall system is reduced, the exergy destructioncoefficients of the other components remain constant.
4.2.4 Oxygen Fraction after Dilution
Based on the comparison of the base and the high efficiency case, it can be concluded that ahigher oxygen content after the dilution is beneficial to the cycle efficiency. This is further shownby the results of sensitivity analysis as the oxygen fraction is varied between 15-30 % (mol). InFigure 5 it is indeed shown that the cycle efficiency increases. This is due to the fact that a largerfraction of CO2 is pumped instead of being compressed. The reduced power demand causes arise in efficiency. However, by approaching a fraction of 30 % the increase in efficiency diminishes.The reason is the larger portion of CO2 at low temperature limits the efficiency of the recuperator.
4.2.5 Heat Exchanger Pinch Temperature Difference
The heat exchanger pinch temperature differences are important to the recuperator (E-3) and thecoolers (E-1, E-2, V-1) in the CO2 recycle. The results of the sensitivity analyses are shown inFigure 5.
Varying the recuperator pinch temperature difference between 1-5 K, it is found that the cycleonly benefits little from a further decrease in temperature difference. This is further shown by the
12

15 17:5 20 22:5 25 27:5 30
−2
−1
0
1
2
Oxygen Fraction after Dilution [% (mol)]
∆”;∆y D
[%]
” (LHV) yD,tot (yD,tot − yD,C-2)
1 2 3 4 5
−2
−1
0
1
2
Recuperator Pinch Temperature Difference [K]
∆”;∆y D
[%]
” (LHV) yD,tot (yD,tot − yD,E-3)
5 6 7 8 9 10
−2
−1
0
1
2
Cooling Heat Exchanger Pinch Temperature Difference [K]
∆”;∆y D
[%]
” (LHV) yD,tot (yD,tot − yD,E-1,E-2,V-1)
Figure 5: Sensitivity analysis for variations in oxygen fraction after dilution and pinch temperaturedifference in the recuperator and the coolers. These diagrams show the cycle efficiency” and the exergy destruction coefficient of the overall cycle ytot as well as the effect thatthe exergy destruction of the respective component(s) has on the exergy destructioncoefficient of the other components.
13
small decrease in the exergy destruction coefficient of the overall cycle. However, as the exergydestruction within the recuperator becomes smaller, the exergy destruction coefficients of theother components remain almost constant.
In contrast to the recuperator (E-3) that can realize very small temperature differences, thepinch temperature difference of the conventional heat exchangers (E-1, E-2, V-1) is larger. Byvarying the pinch temperature difference between the hot side and the cooling water between5-10 K, it is found that a decrease of the temperature difference by 1 K leads to an increase inthe cycle efficiency by about 0.25 %. Furthermore, it is shown that a smaller temperature differ-ence increases the efficiency in other cycle components. The effect is mainly found in the CO2recompression system as the required pumping and compression power is reduced.
4.3 Discussion
The analyses of the Allam cycle has shown that the cycle is a highly innovative configuration as itfeatures a high efficiency even at reasonable component parameterizations. By further improvingthe main cycle parameters its efficiency can further be increased.
The configuration of the Allam cycle is insofar special as the exergy analyses suggest thatthe recuperator effectively decouples the high and low pressure levels. The consequences of thiseffect have to be studied in more detail in the future.
Comparing the Allam cycle with similar oxy-combustion cycles [38] it is found that the efficien-cies of the main system components like combustor, turbine and CO2 recompression are similar.The same is found for the exergy destruction coefficients, respectively. Nevertheless, as the Allamcycle has less components, the simplicity results in a higher overall efficiency than for comparablecycles. Furthermore, it can be concluded that the Allam cycle is considerably different comparedto conventional gas turbine cycles from a thermodynamic perspective.
Regarding the improvement of the Allam cycle, it is shown that the combustor, turbine, re-cuperator and CO2 recycle recompression show a certain potential. To be able to quantify thispotentials, the simulation black boxes of the auxiliary units for air separation and CO2 purificationand compression have to be replaced by detailed models.
5 Conclusion
In the present paper a model of the Allam cycle was synthesized and subsequently analyzed at thecomponent level. The different analyses have shown that the process has a considerable higherefficiency compared to other suggested oxy-combustion cycles and exhibits a further improvementpotential. The Allam cycle has several distinct features that are advantageous considering oxy-combustion cycles.
The information that was obtained from this study provides a good starting point for furtherstudies of the Allam cycle and its features. To be able to understand the cycle even better, sub-sequent analyses preferably using exergy-based methods should be conducted. In particular, theexergoeconomic and advanced exergy analysis [38,69] frameworks have the potential to provideadditional useful information.
References
[1] International Energy Agency (IEA), “World energy outlook,” tech. rep., OECD/IEA, 2012.[2] U.S. Energy Information Administration (EIA), “International energy outlook 2013 – with pro-
jections to 2040,” Tech. Rep. DOE/EIA-0483 (2013), U.S. Department of Energy, 2013.[3] J. M. Beér, “High efficiency electric power generation: The environmental role,” Progress in
Energy and Combustion Science, vol. 33, no. 2, pp. 107–134, 2007.
14
[4] E. S. Rubin, H. Mantripragada, A. Marks, P. Versteeg, and J. Kitchin, “The outlook for im-proved carbon capture technology,” Progress in Energy and Combustion Science, vol. 38,no. 5, pp. 630–671, 2012.
[5] W. Owens, T. L. Buchanan, M. DeLallo, R. Schoff, J. White, and R. H. Wolk, “Evaluation ofinnovative fossil fuel power plants with CO2 removal,” Tech. Rep. EPRI 1000316, ElectricPower Research Institute (EPRI), 2000.
[6] N. J. Kuehn, K. Mukherjee, P. Phiambolis, L. L. Pinkerton, E. Varghese, and M. C. Woods,“Current and future technologies for natural gas combined cycle (NGCC) power plants,” Tech.Rep. DOE/NETL-341/061013, U.S. Department of Energy, 2013.
[7] A. M. Carpenter, “R&D programmes for clean coal technologies,” Tech. Rep. CCC/244, Inter-national Energy Agency (IEA), 2014.
[8] M. Haines, J. Kemper, J. Davison, J. Gale, P. Singh, and S. Santos, “Assessment of emergingCO2 capture technologies and their potential to reduce costs,” Tech. Rep. 2014/TR4, Interna-tional Energy Agency (IEA), 2014.
[9] T. A. Adams, “Future opportunities and challenges in the design of new energy conversionsystems,” Computers & Chemical Engineering, vol. 81, pp. 94–103, 2015.
[10] T. Fout, A. Zoelle, D. L. Keairns, M. J. Turner, M. C. Woods, N. J. Kuehn, V. Shah, V. H. Chou,and L. L. Pinkerton, “Cost and performance baseline for fossil energy plants – volume 1a:Bituminous coal (PC) and natural gas to electricity,” Tech. Rep. DOE/NETL-2015/1723, U.S.Department of Energy, 2015.
[11] T. Fout, A. Zoelle, D. L. Keairns, M. J. Turner, M. C. Woods, N. J. Kuehn, V. Shah, V. H. Chou,and L. L. Pinkerton, “Cost and performance baseline for fossil energy plants – volume 1b:Bituminous coal (IGCC) to electricity,” Tech. Rep. DOE/NETL-2015/1727, U.S. Departmentof Energy, 2015.
[12] M. A. González-Salazar, “Recent developments in carbon dioxide capture technologies forgas turbine power generation,” International Journal of Greenhouse Gas Control, vol. 34,pp. 106–116, 2015.
[13] Q. Zhu, “High-efficiency power generation – review of alternative systems,” Tech. Rep.CCC/247, International Energy Agency (IEA), 2015.
[14] T. F. Wall, “Combustion processes for carbon capture,” Proceedings of the Combustion Insti-tute, vol. 31, no. 1, pp. 31–47, 2007.
[15] J. D. Figueroa, T. Fout, S. Plasynski, H. McIlvried, and R. D. Srivastava, “Advances in CO2capture technology – the U.S. Department of Energy’s carbon sequestration program,” Inter-national Journal of Greenhouse Gas Control, vol. 2, no. 1, pp. 9–20, 2008.
[16] K. Damen, M. van Troost, A. Faaij, and W. Turkenburg, “A comparison of electricity and hy-drogen production systems with CO2 capture and storage. Part A: Review and selection ofpromising conversion and capture technologies,” Progress in Energy and Combustion Sci-ence, vol. 32, no. 2, pp. 215–246, 2006.
[17] E. S. Rubin, M. Antes, S. Yeh, and M. Berkenpas, “Estimating the future trends in the cost ofCO2 capture technologies,” Tech. Rep. 2006/6, International Energy Agency (IEA), 2006.
[18] E. S. Rubin, C. Chen, and A. B. Rao, “Cost and performance of fossil fuel power plants withCO2 capture and storage,” Energy Policy, vol. 35, no. 9, pp. 4444–4454, 2007.
[19] Anon, “The global status of CCS: 2014,” tech. rep., Global Carbon Capture and StorageInstitute, 2014.
[20] T. Davis, T. Bucher, J. F. Goellner, and R. Murray, “Novel CO2 utilization concepts: Workingpaper,” Tech. Rep. DOE/NETL-2012/1588, U.S. Department of Energy, 2013.
[21] D. J. Dillon, V. White, R. J. Allam, R. A. Wall, and J. Gibbins, “Oxy combustion processes forCO2 capture from power plant,” Tech. Rep. 2005/9, International Energy Agency (IEA), 2005.
15
[22] I. Ulizar and P. Pilidis, “A semiclosed cycle gas turbine with carbon dioxide-argon as workingfluid,” in Proceedings of the ASME 1996 International Gas Turbine and Aeroengine Congressand Exhibition, Paper No. 96-GT-345, 1996.
[23] O. Bolland and P. Mathieu, “Comparison of two CO2 removal options in combined cycle powerplants,” Energy Conversion and Management, vol. 39, no. 16-18, pp. 1653–1663, 1998.
[24] H. M. Kvamsdal, K. Jordal, and O. Bolland, “A quantitative comparison of gas turbine cycleswith CO2 capture,” Energy, vol. 32, no. 1, pp. 10–24, 2007.
[25] N. Kuehn, A. Kyle, M. Woods, and W.-C. Yang, “Carbon capture and sequestration ap-proaches for natural gas combined cycle systems,” Tech. Rep. DOE/NETL-2011/1470, U.S.Department of Energy, 2010.
[26] S. G. Sundkvist, A. Dahlquist, J. Janczewski, M. Sjödin, M. Bysveen, M. Ditaranto, Ø. Langør-gen, M. Seljeskog, and M. Siljan, “Concept for a combustion system in oxyfuel gas turbinecombined cycles,” Journal of Engineering for Gas Turbines and Power, vol. 136, no. 10,p. 101513, 2014.
[27] R. E. Anderson, S. MacAdam, F. Viteri, D. O. Davies, J. P. Downs, and A. Paliszewski, “Adapt-ing gas turbines to zero emission oxy-fuel power plants,” in Proceedings of the ASME TurboExpo 2008: Power for Land, Sea, and Air, Paper No. GT2008-51377, 2008.
[28] R. Anderson, F. Viteri, R. Hollis, A. Keating, J. Shipper, G. Merrill, C. Schillig, S. Shinde,J. Downs, D. Davies, and M. Harris, “Oxy-fuel gas turbine, gas generator and reheat combus-tor technology development and demonstration,” in Proceedings of the ASME Turbo Expo2010: Power for Land, Sea, and Air, Paper No. GT2010-23001, 2010.
[29] H. Jericha, E. Göttlich, W. Sanz, and F. Heitmeir, “Design optimisation of the graz cycleprototype plant,” in Proceedings of the ASME Turbo Expo 2003, collocated with the 2003International Joint Power Generation Conference, Paper No. GT2003-38120, 2003.
[30] W. Sanz, H. Jericha, M. Moser, and F. Heitmeir, “Thermodynamic and economic investigationof an improved graz cycle power plant for CO2 capture,” Journal of Engineering for GasTurbines and Power, vol. 127, no. 4, pp. 765–772, 2005.
[31] H. Jericha, W. Sanz, E. Göttlich, and F. Neumayer, “Design details of a 600 MW graz cyclethermal power plant for CO,” in Proceedings of the ASME Turbo Expo 2008: Power for Land,Sea, and Air, Paper No. GT2008-50515, 2008.
[32] W. Sanz, H. Jericha, B. Bauer, and E. Göttlich, “Qualitative and quantitative comparisonof two promising oxy-fuel power cycles for CO2 capture,” Journal of Engineering for GasTurbines and Power, vol. 130, no. 3, p. 031702, 2008.
[33] P. Mathieu and R. Nihart, “Sensitivity analysis of the MATIANT cycle,” Energy Conversionand Management, vol. 40, no. 15-16, pp. 1687–1700, 1999.
[34] P. Mathieu and R. Nihart, “Zero-emission MATIANT cycle,” Journal of Engineering for GasTurbines and Power, vol. 121, no. 1, pp. 116–120, 1999.
[35] P. Mathieu, R. Dubuisson, S. Houyou, and R. Nihart, “New concept of CO2 removal technolo-gies in power generation, combined with fossil fuel recovery and long term CO2 sequestra-tion,” in Proceedings of the ASME Turbo Expo 2000: Power for Land, Sea, and Air, Paper No.2000-GT-0160, 2000.
[36] D. Fiaschi, G. Manfrida, P. Mathieu, and D. Tempesti, “Performance of an oxy-fuel combustionCO2 power cycle including blade cooling,” Energy, vol. 34, no. 12, pp. 2240–2247, 2009.
[37] T. Griffin, S. G. Sundkvist, K. Årsen, and T. Bruun, “Advanced zero emissions gas turbinepower plant,” Journal of Engineering for Gas Turbines and Power, vol. 127, no. 1, pp. 81–85,2005.
[38] F. Petrakopoulou, Comparative Evaluation of Power Plants with CO2 Capture: Thermody-namic, Economic and Environmental Performance. PhD thesis, Technische Universität Berlin,
16
2011.[39] E. Yantovski, J. Gorski, B. Smyth, and J. t. Elshof, “Zero-emission fuel-fired power plants with
ion transport membrane,” Energy, vol. 29, no. 12-15, pp. 2077–2088, 2004.[40] K. Foy and J. McGovern, “Analysis of the effects of combining air separation with combustion
in a zero emissions (ZEITMOP) cycle,” Energy Conversion and Management, vol. 48, no. 11,pp. 3046–3052, 2007.
[41] O. Brandvoll and O. Bolland, “Inherent CO2 capture using chemical looping combustion in anatural gas fired power cycle,” Journal of Engineering for Gas Turbines and Power, vol. 126,no. 2, pp. 316–321, 2004.
[42] B. Fredriksson Möller, J. Arriagada, M. Assadi, and I. Potts, “Optimisation of an SOFC/GTsystem with CO2-capture,” Journal of Power Sources, vol. 131, no. 1-2, pp. 320–326, 2004.
[43] F. Petrakopoulou, Y. D. Lee, and G. Tsatsaronis, “Simulation and exergetic evaluation ofCO2 capture in a solid-oxide fuel-cell combined-cycle power plant,” Applied Energy, vol. 114,pp. 417–425, 2014.
[44] O. Bolland, H. Kvamsdal, and J. Boden, “A comparison of the efficiencies of the oxy-fuelpower cycles water-cycle, Graz-cycle and MATIANT-cycle,” in Carbon Dioxide Capture forStorage in Deep Geologic Formations – Results from the CO2 Capture Project, Capture andSeparation of Carbon Dioxide from Combustion Sources, vol. 1, pp. 499–511, Elsevier, 2005.
[45] F. Petrakopoulou, G. Tsatsaronis, and T. Morosuk, “Exergoeconomic analysis of an advancedzero emission plant,” Journal of Engineering for Gas Turbines and Power, vol. 133, no. 11,p. 113001, 2011.
[46] L. Mancuso, N. Ferrari, P. Chiesa, E. Martelli, and M. Romano, “Oxy-combustion turbinepower plants,” tech. rep., International Energy Agency (IEA), 2015.
[47] R. J. Allam, M. R. Palmer, G. W. Brown, J. E. Fetvedt, D. Freed, H. Nomoto, M. Itoh,N. Okita, and C. Jones, “High efficiency and low cost of electricity generation from fossilfuels while eliminating atmospheric emissions, including carbon dioxide,” Energy Procedia,vol. 37, pp. 1135–1149, 2013.
[48] R. J. Allam, J. E. Fetvedt, B. A. Forrest, and D. A. Freed, “The oxy-fuel, supercritical CO2–Allam cycle: New cycle developments to produce even lower-cost electricity from fossil fuelswithout atmospheric emissions,” in Proceedings of the ASME Turbo Expo 2014: Power forLand, Sea and Air, Paper No. GT2014-26952, 2014.
[49] A. Bejan, M. J. Moran, and G. Tsatsaronis, Thermal Design and Optimization. Wiley, 1996.[50] G. Tsatsaronis, “Definitions and nomenclature in exergy analysis and exergoeconomics,” En-
ergy, vol. 32, no. 4, pp. 249–253, 2007.[51] D. A. Sama, “The use of the second law of thermodynamics in process design,” Journal of
Energy Resources Technology, vol. 117, no. 3, pp. 179–185, 1995.[52] G. Tsatsaronis, “Strengths and limitations of exergy analysis,” in Thermodynamic Optimiza-
tion of Complex Energy Systems, pp. 93–100, Springer, 1999.[53] N. Lior, “Thoughts about future power generation systems and the role of exergy analysis in
their development,” Energy Conversion and Management, vol. 43, no. 9-12, pp. 1187–1198,2002.
[54] E. d. Visser, C. Hendriks, M. Barrio, M. J. Mølnvik, G. d. Koeijer, S. Liljemark, and Y. L. Gallo,“Dynamis CO2 quality recommendations,” International Journal of Greenhouse Gas Control,vol. 2, no. 4, pp. 478–484, 2008.
[55] R. J. Allam, G. W. Brown, and M. R. Palmer, “System and method for high efficiency powergeneration using a carbon dioxide circulating working fluid.” U.S. Patent: US 8,959,887 B2,2015.
17
[56] NET Power, “NET Power – Allam Cycle.” California Energy Commission CO2 Capture Tech-nology Workshop, 2015.
[57] K. Jordal, “Benchmarking of power cycles with CO2 capture – the impact of the selectedframework,” International Journal of Greenhouse Gas Control, vol. 2, no. 4, pp. 468–477,2008.
[58] V. H. Chou, D. Kearney, M. J. Turner, M. C. Woods, A. Zoelle, and J. B. Black, “Qualityguidelines for energy system studies: Process modeling design parameters,” Tech. Rep.DOE/NETL-341/051314, U.S. Department of Energy, 2014.
[59] M. C. Woods, M. Matuszewski, and W. M. Summers, “Quality guidelines for energy systemstudies: Specification for selected feedstocks,” Tech. Rep. NETL/DOE-341/011812, U.S. De-partment of Energy, 2012.
[60] R. M. Smith, Chemical process: design and integration. Wiley, 2005.[61] R. K. Shah, A. C. Mueller, and D. P. Sekulic, “Heat exchangers, 1. fundamentals and general
design methodology,” in Ullmann’s Encyclopedia of Industrial Chemistry, Wiley, 2000.[62] M. Jonsson, O. Bolland, D. Bücker, and M. Rost, “Gas turbine cooling model for evaluation of
novel cycles,” in Proceedings of ECOS 2005, pp. 641–650, 2005.[63] International Organization for Standardization (ISO), “Gas turbines – acceptance tests.” ISO
2314:2009, 2009.[64] M. C. Woods, M. Matuszewski, and W. M. Summers, “Quality guidelines for energy system
studies: CO2 impurity design parameters,” Tech. Rep. DOE/NETL-341/011212, U.S. Depart-ment of Energy, 2012.
[65] F. L. Evans, Equipment Design Handbook for Refineries and Chemical Plants, vol. 2. GulfPublishing, 2 ed., 1980.
[66] P. Higginbotham, V. White, K. Fogash, and G. Guvelioglu, “Oxygen supply for oxyfuel CO2capture,” International Journal of Greenhouse Gas Control, vol. 5, pp. S194–S203, 2011.
[67] A. Darde, R. Prabhakar, J.-P. Tranier, and N. Perrin, “Air separation and flue gas compres-sion and purification units for oxy-coal combustion systems,” Energy Procedia, vol. 1, no. 1,pp. 527–534, 2009.
[68] J. Szargut, D. R. Morris, and F. R. Steward, Exergy analysis of thermal, chemical, and metal-lurgical processes. Hemisphere Publishing, 1988.
[69] G. Tsatsaronis and F. Cziesla, “Thermoeconomics,” in Encyclopedia of Physical Science andTechnology, pp. 659 – 680, Academic Press, 3rd edition ed., 2002.
[70] A. Lazzaretto and G. Tsatsaronis, “SPECO: A systematic and general methodology for cal-culating efficiencies and costs in thermal systems,” Energy, vol. 31, no. 8-9, pp. 1257–1289,2006.
[71] W. R. Dunbar and N. Lior, “Sources of combustion irreversibility,” Combustion Science andTechnology, vol. 103, no. 1-6, pp. 41–61, 1994.
[72] G. Tsatsaronis, T. Morosuk, D. Koch, and M. Sorgenfrei, “Understanding the thermodynamicinefficiencies in combustion processes,” Energy, vol. 62, pp. 3 – 11, 2013.
18


![Exergy Analysis of Vapor Compression Cycle...compression cycle, with flash intercooling with R22 using the exergy method and gave some useful conclusions. Dincer [17] asserts that](https://img.pdfslide.us/doc/110x75/5f36330828f5ef049b4d3cef/exergy-analysis-of-vapor-compression-cycle-compression-cycle-with-flash-intercooling.jpg)


![Exergy analysis of the Szewalski cycle with a waste …...eters of the Szewalski binary vapour cycle was performed by Kowalczyk et al.[3], who presented the energy and exergy analysis](https://img.pdfslide.us/doc/110x75/5f36873b62461f4a731f3996/exergy-analysis-of-the-szewalski-cycle-with-a-waste-eters-of-the-szewalski-binary.jpg)