Embed Size (px)
Citation preview
MSc Program Environmental Technology & International Affairs
A Master’s Thesis submitted for the degree of “Master of Science”
supervised by
Exergy Analysis of Plastic Waste Management
Univ.Prof. Dipl.-Ing. Dr.techn. Helmut Rechberger
Aditi Ramola
1227917
Vienna, 3 June 2014
Affidavit
I, ADITI RAMOLA, hereby declare
1. that I am the sole author of the present Master’s Thesis, "EXERGYANALYSIS OF PLASTIC WASTE MANAGEMENT", 63 pages,bound, and that I have not used any source or tool other than thosereferenced or any other illicit aid or tool, and
2. that I have not prior to this date submitted this Master’s Thesis as anexamination paper in any form in Austria or abroad.
Vienna, 03.06.2014Signature
Abstract
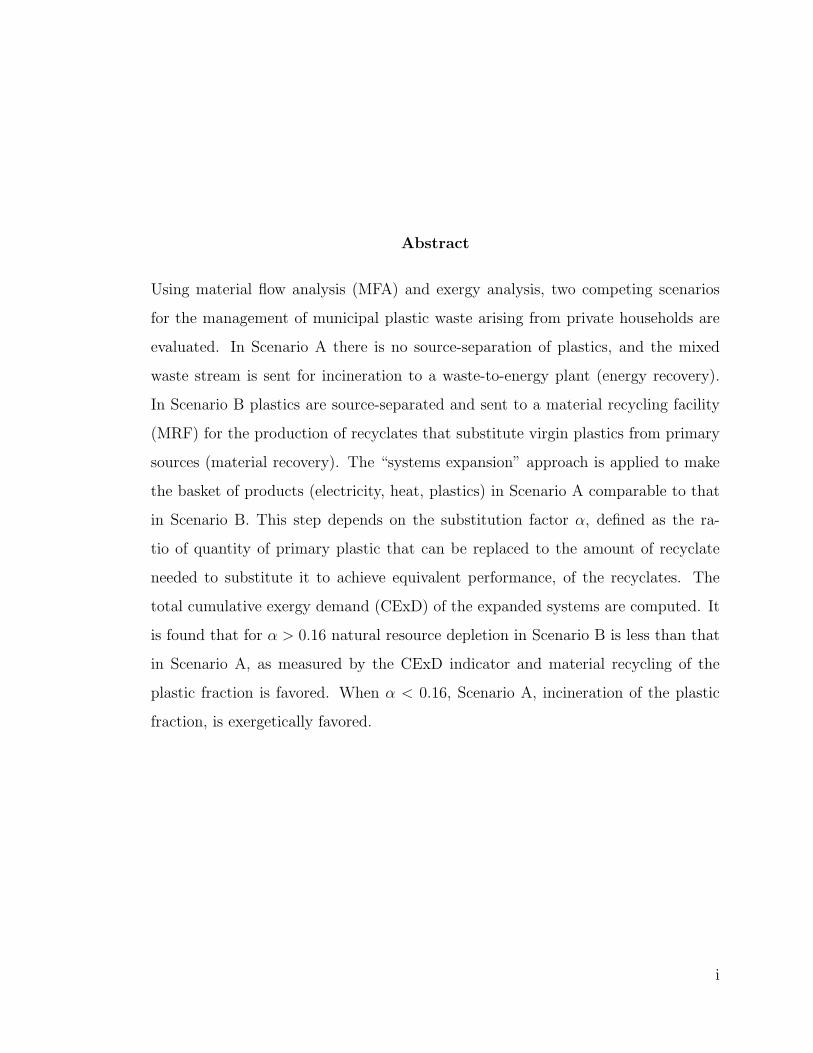
Using material flow analysis (MFA) and exergy analysis, two competing scenarios
for the management of municipal plastic waste arising from private households are
evaluated. In Scenario A there is no source-separation of plastics, and the mixed
waste stream is sent for incineration to a waste-to-energy plant (energy recovery).
In Scenario B plastics are source-separated and sent to a material recycling facility
(MRF) for the production of recyclates that substitute virgin plastics from primary
sources (material recovery). The “systems expansion” approach is applied to make
the basket of products (electricity, heat, plastics) in Scenario A comparable to that
in Scenario B. This step depends on the substitution factor α, defined as the ra-
tio of quantity of primary plastic that can be replaced to the amount of recyclate
needed to substitute it to achieve equivalent performance, of the recyclates. The
total cumulative exergy demand (CExD) of the expanded systems are computed. It
is found that for α > 0.16 natural resource depletion in Scenario B is less than that
in Scenario A, as measured by the CExD indicator and material recycling of the
plastic fraction is favored. When α < 0.16, Scenario A, incineration of the plastic
fraction, is exergetically favored.
i
Contents
1 Introduction 1
1.1 Goals . . . . . . . . . . . . . . . . . . . . . . . . . . . . . . . . . . . . 3
1.2 Outline of the thesis . . . . . . . . . . . . . . . . . . . . . . . . . . . 4
2 Plastics 6
2.1 Types . . . . . . . . . . . . . . . . . . . . . . . . . . . . . . . . . . . 7
2.2 Production . . . . . . . . . . . . . . . . . . . . . . . . . . . . . . . . 9
2.3 As a resource . . . . . . . . . . . . . . . . . . . . . . . . . . . . . . . 10
3 Exergy 14
3.1 The laws of thermodynamics . . . . . . . . . . . . . . . . . . . . . . . 14
3.2 The concept of exergy . . . . . . . . . . . . . . . . . . . . . . . . . . 17
3.3 Exergy in resource and waste management . . . . . . . . . . . . . . . 19
4 Material and Methods 22
4.1 Material Flow Analysis (MFA) . . . . . . . . . . . . . . . . . . . . . . 23
4.2 Exergy Analysis - Cumulative Exergy Demand . . . . . . . . . . . . . 25
4.3 Description and Data . . . . . . . . . . . . . . . . . . . . . . . . . . . 27
4.3.1 Scenario A - Energy recovery . . . . . . . . . . . . . . . . . . 29
4.3.2 Scenario B - Material recovery . . . . . . . . . . . . . . . . . . 34
5 Results 43
5.1 Material & Energy Flows . . . . . . . . . . . . . . . . . . . . . . . . . 43
ii
5.1.1 Scenario A . . . . . . . . . . . . . . . . . . . . . . . . . . . . . 43
5.1.2 Scenario B . . . . . . . . . . . . . . . . . . . . . . . . . . . . . 44
5.2 CExD Calculations . . . . . . . . . . . . . . . . . . . . . . . . . . . . 46
5.2.1 Scenario A . . . . . . . . . . . . . . . . . . . . . . . . . . . . . 50
5.2.2 Scenario B . . . . . . . . . . . . . . . . . . . . . . . . . . . . . 51
5.3 Discussion . . . . . . . . . . . . . . . . . . . . . . . . . . . . . . . . . 52
6 Conclusion and further considerations 54
References 57
iii
Acknowledgements
I would like to thank my advisor Prof. Dr. Helmut Rechberger for suggesting this
interesting topic, for being a source of inspiration, and for his constant support
throughout the process of writing this thesis.
This thesis would not have been possible without the help and guidance of my ‘sec-
ond advisor’ Dr. David Laner. I would like to express my gratitude and thank him
for the many discussions and for patiently answering every question I had.
Writing this thesis has been part of two very enriching and rewarding years in the
masters program. I would like to take this opportunity to thank Prof. Puxbaum,
Prof. Loibl and all others that were involved in setting up the ETIA program. It has
been the perfect avenue for me to pursue my interests.
Additionally, I would also like to thank Mag. Starlinger, Ms. Rasl, Dr. Hofer, Ms.
Chiarandon, and Ms. Winkler for making these two years go by smoothly.
Special thanks also to my friends, near and far, that have been part of this journey.
And finally, my deepest gratitude and thanks to Pranav, my parents and brother for
their unconditional love and support throughout the years.
iv
Chapter 1
Introduction
The industrial revolution marked the beginning of an era in human civilization dur-
ing which the consumption and degradation of natural resources grew at an un-
precedented exponential rate. During the 20th century there was a fourfold increase
in the world population, a twenty-two-fold increase in the economic output, and a
fourteen-fold increase in the worlds fossil fuel consumption (UNEP, 2011). The con-
comitant leaps in science, technology and medicine, coupled with economic growth
brought greater welfare to many. However, by the middle of the century, the impact
of human activity on the biosphere was apparent. By the 1970s scientists had begun
to warn of the dangers of unabated pollution of the environment, and overuse of
natural resources (Meadows, Meadows, Randers, & Behrens, 1974). It was in this
milieu that the importance of a sustainable industrial metabolism came to promi-
nence, and the term sustainable development, defined to be development that “meets
the needs of the present without sacrificing the ability of the future to meet its needs”
(Holdgate, 1987) was coined and became such an indispensable part of contemporary
vocabulary.
Plastics are the quintessential product of industrial society: they are derived
from a non-renewable and limited resource, namely crude oil and natural gas, and
typically require inputs of energy on an industrial scale for their production, and if
not properly disposed the end product is potentially toxic to the ecosphere. Despite
1
a short history of the plastics industry, since the 1940s plastics have found their
way into a myriad of aspects of modern life and have found use in a wide range of
applications (Hopewell, Dvorak, & Kosior, 2009). With increased use of plastics in
consumer applications the fraction of plastics in the municipal solid waste streams
keeps growing, with the growth being primarily attributable to packaging waste.
The ubiquity of plastic underscores the urgency of finding ways to optimize
the industrial metabolism of plastic. There are several levels at which industrial
metabolism can be optimized, ranging from the optimization of the efficiency of
individual plants (e.g. a waste-to-energy plant), to the optimization of the overall
industrial metabolism of plastic. It is the latter question that is the subject of this
thesis. It is becoming increasingly important to figure out a way to extract these
resources from an extremely complex waste stream. The management and utilization
of plastic wastes is often debated due to diverse and competing options available for
resource recovery. The use of end-of-life plastics can contribute to resource conser-
vation by substituting fuel, reductive agents and/or primary raw materials.
The goal of this study is to optimize plastic waste management for a defined sys-
tem from a thermodynamic perspective. Furthermore, this study aims to resolve the
debate on which plastic waste management path is exergetically more beneficial in the
context of sustainable use of resources. To this end, two different plastic waste man-
agement scenarios/options are described using material flow analysis (MFA) which
is a method to describe, investigate, and evaluate the flow of materials through a
system defined within a temporal and spatial boundary. Subsequently, plastic waste
utilization is evaluated by means of exergy analysis. The study considers both, the
benefits from energy recovery (incineration) and recycling of plastics to substitute
virgin materials.
The functional unit of the analysis is 1000 kg of mixed waste generated at the
private household. In the baseline case, all the residual waste including the plastic
fraction is collected together and directed to a waste to energy (W-t-E) plant. In
2
the alternative case mixed plastic wastes are collected separately and directed to
a materials recovery facility (MRF). Two different downstream utilization options
are investigated: a) thermal recovery of the energy content, b) material recycling
of selected fractions combined with thermal recovery for low-quality fractions. The
evaluation takes place within the framework of life-cycle assessment, where exergy
consumption data is available for a large number of resources.
Tasks that were completed in the course of this study were:
1. Literature review about exergy analysis, evaluation of waste and resource sys-
tems (especially plastics).
2. Material flow analysis of the plastic waste management scenarios.
3. Using the equal basket of benefits approach, cumulative exergy demand (CExD)
calculations of a basket of equal goods for both scenarios.
4. Interpretation and discussion of the results in view of optimizing plastic waste
utilization based on the second law of thermodynamics (exergy) analysis.
1.1 Goals
If plastic is the quintessential industrial product, then perhaps thermodynamics, and
especially the second law, is the quintessential science spawned by the industrial rev-
olution. While energy is conserved in any process, the second law implies that the
amount of energy available for useful work - exergy - is consumed in any natural
process. The second law has come to be a cornerstone of industrial ecology which
has it’s roots in the sustainable development movement of the 1970s. Since then
there has been a long tradition of analysis of industrial metabolism using exergy and
the second law (R. Ayres & Ayres, 2002; J. Dewulf et al., 2008a). However, there do
not appear to be many studies applying these concepts, and in particular the notion
of cumulative exergy demand, to the metabolism of plastics at a systems level. Such
studies have been initiated in (J. P. Dewulf & Van Langenhove, 2004, 2002). This
3
thesis aims to explore and take the ideas a step further and to begin to fill this gap
in the existing literature.
This thesis focuses on plastic waste flows through municipal waste generated by
private households. The following research questions were identified to help accom-
plish the goals of this study:
• What are the main processes and what does the system of interest look like?
• What are the flows of plastics and other materials through the defined system
in the two scenarios?
• What are the energy consumption requirements for the different processes?
• What are the electricity and heat outputs of the waste-to-energy plant in each
scenario?
• How much virgin material does the plastic recyclate substitute?
• What are the exergy flows through the system in both cases - does one scenario
perform better than the other exergetically?
• How well is the exergy concept suited to providing guidance on the preferable
option to manage plastic wastes?
1.2 Outline of the thesis
This document is structured as follows: Chapter 2 gives a brief overview of what
plastics are, their various types and applications, their production and recycling
processes, the value of plastics as a resource, and their importance in waste manage-
ment. Chapter 3 is a quick introduction to the exergy concept, its origins, and its
relation to the second law of Thermodynamics. This chapter concludes with a brief
discussion of the role of exergy in the context of resource and waste management.
4
Chapters 4 and 5 constitute the heart of this thesis. Chapter 4 opens with a
discussion of the two main methodologies – material flow analysis and cumulative
exergy demand analysis – that have been used to conduct this study. Section 4.3
of this chapter is devoted to a detailed description of scenarios A and B within the
paradigm of material flow analysis. Material and energy flows in both scenarios are
carefully documented. The data values that will be used in the comparison of the
scenarios are documented together with their sources. The assumptions made about
both scenarios are clearly stated.
In Chapter 5 the data for material flows described in Chapter 4 is fed into the
STAN MFA software, allowing a comparison of mass and energy flows. System
expansion is carried out, and the cumulative exergy demand for both scenarios is
computed. Chapter 6 concludes the paper with a summary of the main results, and
a short discussion of the implications of this study.
5
Chapter 2
Plastics
Plastics is a general term for a wide range of synthetic or semi-synthetic materials
used in a vast, and growing, range of applications. Owing to their properties such as
durability, inexpensiveness, high strength-to-weight ratio, bio-inertness, high ther-
mal/electrical insulation, and the fact that they can be molded into a vast variety of
products, the production and use of plastics has markedly increased over the last 60
years. Worldwide production of plastics reached 288 million tonnes in 2012 and with
increasing use in applications is predicted to grow every year (PlasticsEurope, 2014).
The history of modern plastics goes back a couple of centuries, with the most
revolutionary developments happening at the beginning of the 20th century. Plastics
are increasingly used and find application in packaging, building and construction,
transportation, medical and health products, electrical and electronic equipment,
agriculture, and sports and leisure equipment. The demand for plastics has grown
steadily - plastics are now accepted by engineers and designers as basic materials
along with the more traditional materials. The aviation industry, for instance, relies
on plastics to reduce weight of airplanes and thus increase energy efficiency.
As reported by PlasticsEurope (2014), plastics are derived from organic prod-
ucts, i.e. from feedstock containing carbon and hydrogen. Currently, fossil fuels
6
(non-renewable resources) are the preferred raw material, but plastics are also made
from renewable resources such as sugar and corn. Around 4% of global oil and gas
production is used as the raw material for plastics production and a further 3-4% is
used as energy in the manufacturing process. However, plastics by their very nature
store carbon, and this energy is retained by reusing and recycling plastics (Andrady
& Neal, 2009; Hopewell et al., 2009).
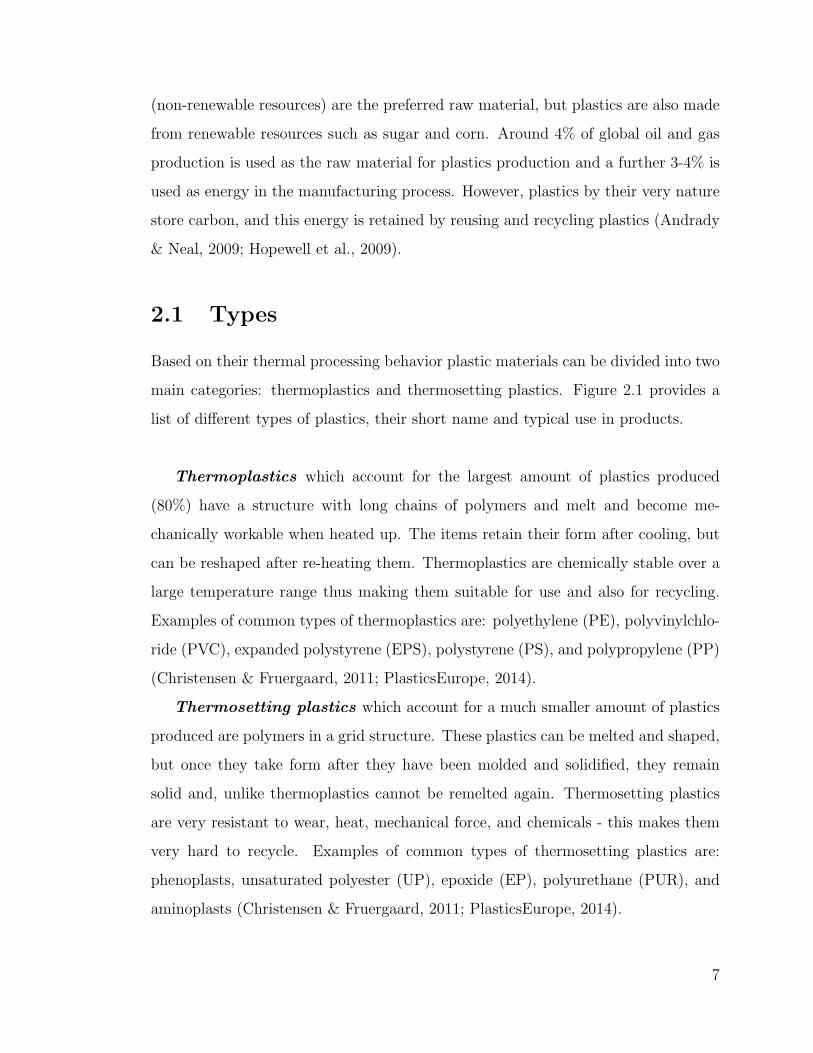
2.1 Types
Based on their thermal processing behavior plastic materials can be divided into two
main categories: thermoplastics and thermosetting plastics. Figure 2.1 provides a
list of different types of plastics, their short name and typical use in products.
Thermoplastics which account for the largest amount of plastics produced
(80%) have a structure with long chains of polymers and melt and become me-
chanically workable when heated up. The items retain their form after cooling, but
can be reshaped after re-heating them. Thermoplastics are chemically stable over a
large temperature range thus making them suitable for use and also for recycling.
Examples of common types of thermoplastics are: polyethylene (PE), polyvinylchlo-
ride (PVC), expanded polystyrene (EPS), polystyrene (PS), and polypropylene (PP)
(Christensen & Fruergaard, 2011; PlasticsEurope, 2014).
Thermosetting plastics which account for a much smaller amount of plastics
produced are polymers in a grid structure. These plastics can be melted and shaped,
but once they take form after they have been molded and solidified, they remain
solid and, unlike thermoplastics cannot be remelted again. Thermosetting plastics
are very resistant to wear, heat, mechanical force, and chemicals - this makes them
very hard to recycle. Examples of common types of thermosetting plastics are:
phenoplasts, unsaturated polyester (UP), epoxide (EP), polyurethane (PUR), and
aminoplasts (Christensen & Fruergaard, 2011; PlasticsEurope, 2014).
7
Plastic type Abbreviation Use
Thermoplastics
High density polyethylene HDPE Containers, toys, house wares, industrial wrappings, gas pipes
Low density polyethylene LDPE Pallets, agricultural films, bags, toys, coatings, containers, pipes, wrappings, films
Polypropylene PP Film, electrical components, battery cases, containers, crates
Polyethylene terephthalate PET Bottles for carbonated soft drinks, textile fibers, film food packaging
Polystyrene PS Thermal insulation, tape cassettes, cups, electrical appliances, plates, toys
Expanded polystyrene EPS Foam insulation, building material, cycle helmets, packaging of food stuff, medical supplies, electrical consumer goods
Polyamide PA Films for packaging of food waste, textile fibers
Polyvinyl-chloride PVC Window frames, pipes, flooring, wallpaper, bottles, guttering, cable insulation, toys, credit cards, medical appliances
Polymethyl-methacrylate PMMA Transparent all-weather sheet, electrical insulators, bathroom units
Thermosetting plastics
Epoxide EP Protective coatings, composite matrices, adhesives
Unsaturated polyester UP Construction and marine applications, e.g. filler for glass fibers in sailing boats
Polyurethane PUR Mattresses, vehicle seats, cushions, finishes, coatings
Phenoplasts Plywood manufacture, insulation, lacquers, varnishes, molding, laminates
Figure 2.1: Types and Uses of Plastics. (Source: Author, adapted from Christensen& Fruergaard, 2011)
8
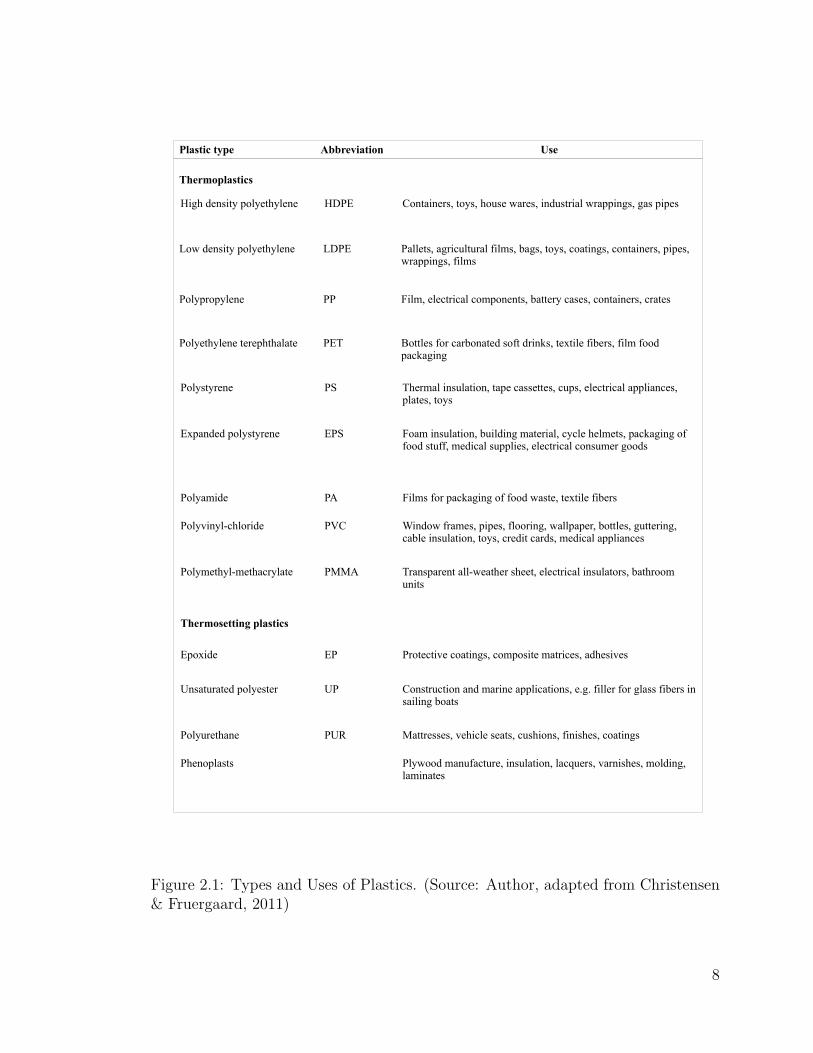
2.2 Production
The production of plastics begins by distilling heavy crude oil into lighter groups
called fractions. Each of the fractions is a mixture of hydrocarbon chains (chemical
compounds made up of carbon and hydrogen), which differ from each other in terms
of the structure and size of their molecules. One such fraction, naphtha, is the cru-
cial/necessary element for the production of plastics (PlasticsEurope, 2014). Figure
2.2 illustrates the production of plastics starting from crude oil in a refinery.
Crude oilCrude oil
Volatile oilVolatile oil
Kerosene Kerosene
Gas oilGas oil
NaphthaNaphtha
Fuel oilFuel oil
Ethylene
Propylene
Butane/butylene
Aromatic series
Others
Ethylene
Propylene
Butane/butylene
Aromatic series
Others
PolyethylenePolypropylene
PVC resinPolyethylene terephthalate
PolyamidePolystyrene
Other thermoplastic resinsThermosetting resins
PolyethylenePolypropylene
PVC resinPolyethylene terephthalate
PolyamidePolystyrene
Other thermoplastic resinsThermosetting resins
Crude Oil Petroleum products Basic petrochemicalproducts
Plastics
Figure 2.2: Production of plastics from crude oil. (Source: Author, adapted fromPlastic Waste Management Institute (PWMI), 2014)
Naphtha is first heated and cracked into monomers to extract substances with
a simpler structure (i.e. compounds with a low molecular weight) such as ethylene,
propylene, and butylene. The two major processes used to produce plastics are called
polymerization and polycondensation. In a polymerization reaction, monomers like
9

ethylene and propylene are linked together to form macro-molecules (i.e. compounds
with high molecular weight) with long polymers chains. Each of the polymers pro-
duced has its own properties, structure and size depending on the different types of
basic monomers used. The molecules obtained are then chemically coupled (poly-
merized) to form substances with new properties, such as polyethylene (PE) and
polypropylene (PP), which are called synthetic resins and polymers. Additives are
added to the newly formed polyethylene and other such substances to alter and im-
prove basic mechanical, physical and chemical properties. They are then made into
granules and it is from this stage on that they are normally referred to as plastics.
Plastic granules (granulates) are the basic product from which plastic products are
made. New plastics are usually supplied to processors and molding plants in the
form of granules to be turned into plastic products by heating, extruding, and mold-
ing. (PlasticsEurope, 2014; Plastic Waste Management Institute (PWMI), 2014;
Christensen & Fruergaard, 2011)
2.3 As a resource
Much of what we use and consume in modern society constitutes of plastic in some
form, including but not limited to - clothing, footwear, food packaging, and electrical
appliances. Millions of tonnes of plastics are converted into textile fiber (mainly ny-
lon, polyester and acrylics) worldwide for use in apparel manufacture. High strength-
to-weight ratio gives plastics the advantage of using minimal material in packaging
design, and a large portion of plastic produced each year is used to make dispos-
able packaging items or other short-lived products that are discarded and enter
the waste stream within a year of manufacture (Andrady & Neal, 2009). High-
performance clothing is almost exclusively plastics – polyesters, fluoropolymers and
nylons; fleece clothing is 100 per cent plastic (PET) and can be made from recycled
PET (Andrady & Neal, 2009). Mattresses, vehicle seats, coating, and cushions are
made from polyurethane; protective coatings, adhesives, and composite matrices are
10

all made of plastic materials mostly epoxide (EP) (Christensen & Fruergaard, 2011).
It is hence evident that plastics constitute an important component and a large vol-
ume of the range of materials used in modern society.
The properties of plastics that deliver unparalleled design versatility also make
plastic waste remain in the environment for a very long time unless treated and re-
covered. At the end of their first use, recovery of plastics can be handled in one of
two broad ways: energy recovery and material recovery.
Energy recovery : All plastics being variations of hydrocarbons, have high in-
trinsic heating (calorific) values and the incineration of plastic waste can recapture
the energy resource in plastics and substitute for primary fuels in industrial pro-
cesses, or electricity and heat generation.
Material recovery : On the other hand, material recovery involves recycling
plastic waste into new products by means of mechanical recycling and chemical/feedstock
recycling.
• Mechanical recycling involves processes where the chemical structure of plastic
remains unchanged such as shredding, melting or granulation of plastic waste.
• Feedstock recycling refers to techniques that break plastic down into monomers
(chemical structure of plastic is not maintained) for use in chemical production
and refineries (Christensen & Fruergaard, 2011).
Feedstock or chemical recycling goes one step back in the production/recycling
process, and is not of interest for this study and hence is not discussed in this paper.
Many types of plastics are recycled today but recycling into high-quality plastic
products requires that material is free of contaminants and foreign items. Addition-
ally, recycling of post-consumer plastics is faced with the problem of keeping different
11
resin or plastic types in separate streams so as to maintain the most significant fea-
ture of plastic: great strength and flexibility at very small weights and dimensions.
If the recycled plastic waste is source-separated, clean and consists of only one type
of resin/plastic, then the recycled waste substitutes use of virgin plastics. If the dif-
ferent types are not carefully separated, then the recycled plastic waste substitutes
materials such as wood or concrete, and can only be used to produce low-strength
items of secondary importance such as garden furniture, pots, fences, and so on.
(Astrup, Fruergaard, & Christensen, 2009; Christensen & Fruergaard, 2011)
Mechanical recycling of plastic waste takes place at a material recovery facility
(MRF). This study focuses on a MRF that delivers granulates for the production
of new products (material recycling) as opposed to pellets for industry as a fuel,
from source-separated plastic waste. Such a MRF receives high-quality plastic waste
limited to bottles and containers for liquids. Source-separation of plastics limits
the amount of contaminants such as organic waste and dirty plastic films, etc. in
the input. In such a case the waste is likely to be dominated by PET, since most
bottles are made from plastic resin of this type. Usually the recovered material is
received in the receiving area and transported by a conveyor to a manual sorting
area, which is commonly done as negative sorting of a plastic waste stream domi-
nated by one type of resin, where large foreign objects are removed. Then mechanical
treatment involves automatic sorting primarily using infrared spectroscopic identifi-
cation, screens, magnetic and eddy-current separation, granulation (i.e. size reduc-
tion), washing and drying, finally extrusion and then cutting of extruded plastics
into granulates that are typically cooled in water. The granulates are then bagged
and stored until sold to a reprocessing plant. The cleaner and purer the fraction of
plastic waste received, the lesser the mechanical treatment needed. (Christensen &
Fruergaard, 2011; Astrup et al., 2009) The residues from the sorting and recycling
processes are sent back to the waste-to-energy plant for incineration.
12
Recyclates are recycled plastics that come from post-consumer waste, i.e. plastics
that have already passed through one complete ‘life cycle’ (been disposed of with
household waste at least once after being used), whereas regranulates come from
waste recycled during the production process of plastics. It is important not to
confuse the two. Recyclates, or secondary raw materials, can be used to make
high-quality new products and convert plastic waste into products they once were.
(Ecoplast, 2014)
13
Chapter 3
Exergy
The thermodynamic concept of exergy constitutes the conceptual and theoretical
foundation of the analysis of plastic waste management carried out in this thesis.
This concept has as its basis the first and second laws of thermodynamics - these laws
are recalled in Section 3.1, following (Feynman, Leighton, Sands, & Gottlieb, 1963;
Waser, Trueblood, & Knobler, 1976; Castellan, 1983). Section 3.2 introduces the
notion of exergy following the discussion in (R. U. Ayres, Ayres, & Martinas, 1996;
Szargut, 2005). Finally, the role of exergy in the management of natural resources
and waste is discussed in Section 3.3.
3.1 The laws of thermodynamics
The modern science of thermodynamics originated in the seminal work of the French
engineer Sadi Carnot (Carnot, 1824) titled “Reflections on the Motive Power of Fire”.
Carnot was concerned with the efficiency of heat engines - devices that extract work
from heat that is flowing from a hotter body to a cooler body. In particular, he
posed the following question: what is the maximum amount of mechanical work W
that can be extracted from a certain quantity of heat Q flowing from a source at
temperature T1 to a sink at temperature T2 < T1? Starting from a single assumption,
Carnot deduced the remarkable fact that W is independent of the specific substances
14
participating in the process and that, regardless of how cleverly the machine or pro-
cess is designed, there is an upper bound for W that depends only on the temperatures
T1 and T2. Thermodynamics is the subject that is concerned with those aspects of
macroscopic processes and phenomena that are independent of the detailed micro-
scopic structure of the materials participating in them. Thermodynamic reasoning
is thus a powerful tool in the analysis of complex systems.
The quantity W is given by:
W = Q
(1− T2
T1
)
In modern language, this can be formulated as the assertion that the exergy content
(see (Szargut, 2005; R. U. Ayres et al., 1996)) of the given amount of thermal energy
Q at temperature T1, with respect to an environment at temperature T2 is given by
Q(1− T2/T1).
The point of departure of Carnot’s analysis was the simple premise that it is
impossible to design a reproducible cyclic process whose net result is to extract heat
from a reservoir at a single temperature T and convert it to work. In other words,
to extract work from heat, Carnot assumed that we must use bodies at two distinct
temperatures, allowing the heat to “fall” from the hotter to the cooler body. This
assumption, and its numerous consequences, has withstood every experimental test;
it is now enshrined as the second law of thermodynamics.
Formally, a thermodynamic system is specified by a set of states that the system
can occupy, and a collection of state variables - functions that assign a number to each
state. Examples of state variables are temperature and pressure. For non-isolated
systems, one must specify in addition differentials such a δQ (heat transferred) and
δW (work done), which describe the ways in which a system interacts with its envi-
ronment.
A process is a path from an initial state to a final state. Among the set of all
possible processes, there is a subclass consisting of those processes that are realizable
in nature. The laws of thermodynamics are constraints that processes realizable in
15
nature are required to satisfy. These laws have been abstracted from countless em-
pirical observations.
The first law: There exists a state variable U , called internal energy, with the
property that U remains constant along any realizable process γ of an isolated system.
Thus, the first law of thermodynamics is the law of conservation of energy. It
states that there is an abstract quantity called energy, not necessarily directly mea-
surable or perceivable to the senses, which remains unchanged in an isolated system.
What if the system is not isolated? In this case, the first law becomes the asser-
tion that any change in U during a process should be attributable to a measurable
quantity that can interpreted as “the transfer of a form of energy” to/from the sys-
tem. For many systems of practical interest, these quantities turn out to be of three
types: (i) the transfer of an amount δQ of heat (“thermal energy”) from the envi-
ronment to the system, (ii) δW , the work done by the environment on the system
and (iii) the transfer of Ni moles of a substance with chemical potential µi to the
system. For such non-isolated systems, the first law becomes:
The first law (non-isolated systems): There is a state variable U , such that
dU = δQ+ δW +∑
i µiNi along any infinitesimal process occuring in nature.
The second law of thermodynamics has a form very similar to the first law: the
only difference is that the term “constant” is replaced by “non-decreasing”.
The second law: There exists a state variable S, called entropy, with the property
that S is nondecreasing along any process γ realizable in an isolated system. For
a materially isolated but thermally non-isolated system, the infinitesimal change in
entropy along an infinitesimal reversible path is given by dS = δQ/T , where T is the
temperature.
16
While the statement of this law, due in this form to Clausius and Caratheodory,
may seem obscure at first, its physical content is in fact more intuitively easy to grasp
than the first law, and it chronologically preceded the first law. In fact, (see, e.g.,
(Feynman et al., 1963) for an excellent discussion), the second law is equivalent to
the following intuitive statement: It is impossible to construct a reproducible process
where heat flows spontaneously from a cooler body to a warmer body.
With the advent of statistical mechanics, thermodynamic variables acquired an
interpretation in terms of the microscopic constituents of matter (molecules). In
particular, Boltzmann (see (Feynman et al., 1963)) showed that entropy could be
interpreted as the “disorder of a system” in a certain precise sense. To the extent
that disorder is palpable to the human consciousness, entropy is perceivable to the
senses. However, it is usually not possible to directly measure entropy.
There are two other important fundamental laws of thermodynamics - the zeroth
and third laws. These will not be discussed in this thesis.
3.2 The concept of exergy
The exergy Ex of a system S, with respect to a given environment Senv, is defined
to be the maximum amount of useful work that can be extracted from the system in
a process that brings the system into equilibrium with its environment (R. U. Ayres
et al., 1996; Szargut, 2005). Here we assume that the environment is an infinite
reservoir, whose temperature, pressure, etc. do not change appreciably during the
equilibration process. The availability of energy for conversion to useful work is
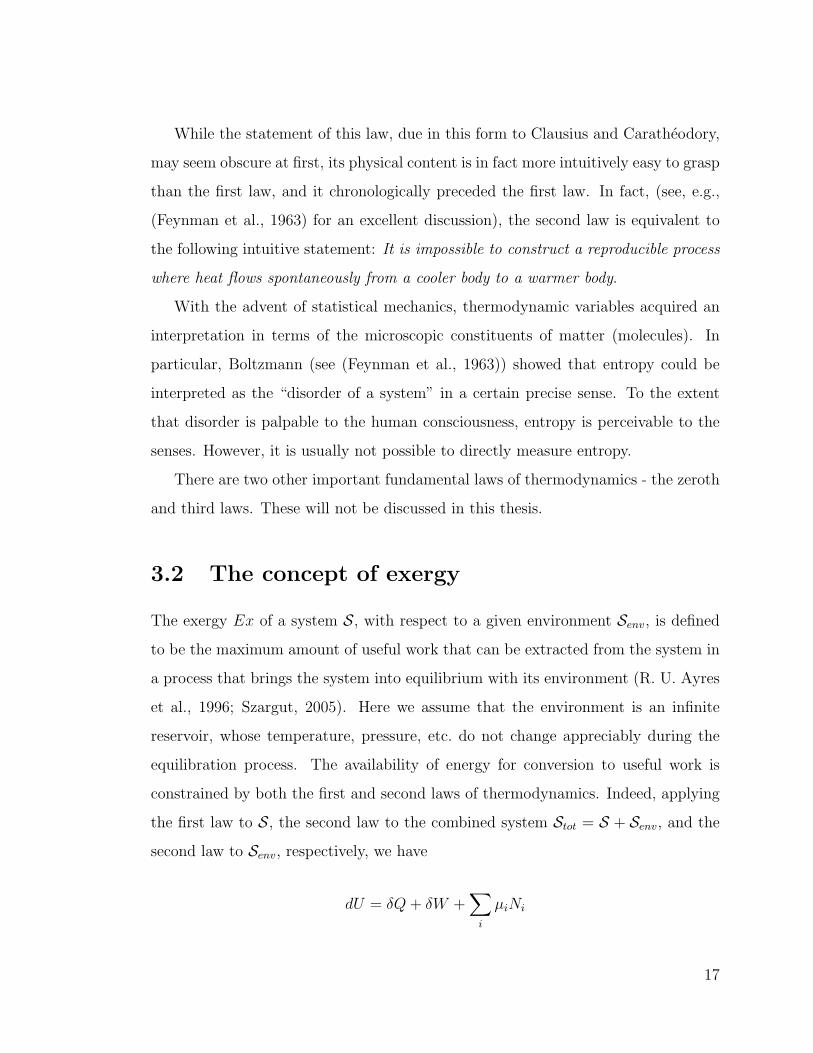
constrained by both the first and second laws of thermodynamics. Indeed, applying
the first law to S, the second law to the combined system Stot = S + Senv, and the
second law to Senv, respectively, we have
dU = δQ+ δW +∑i
µiNi
17
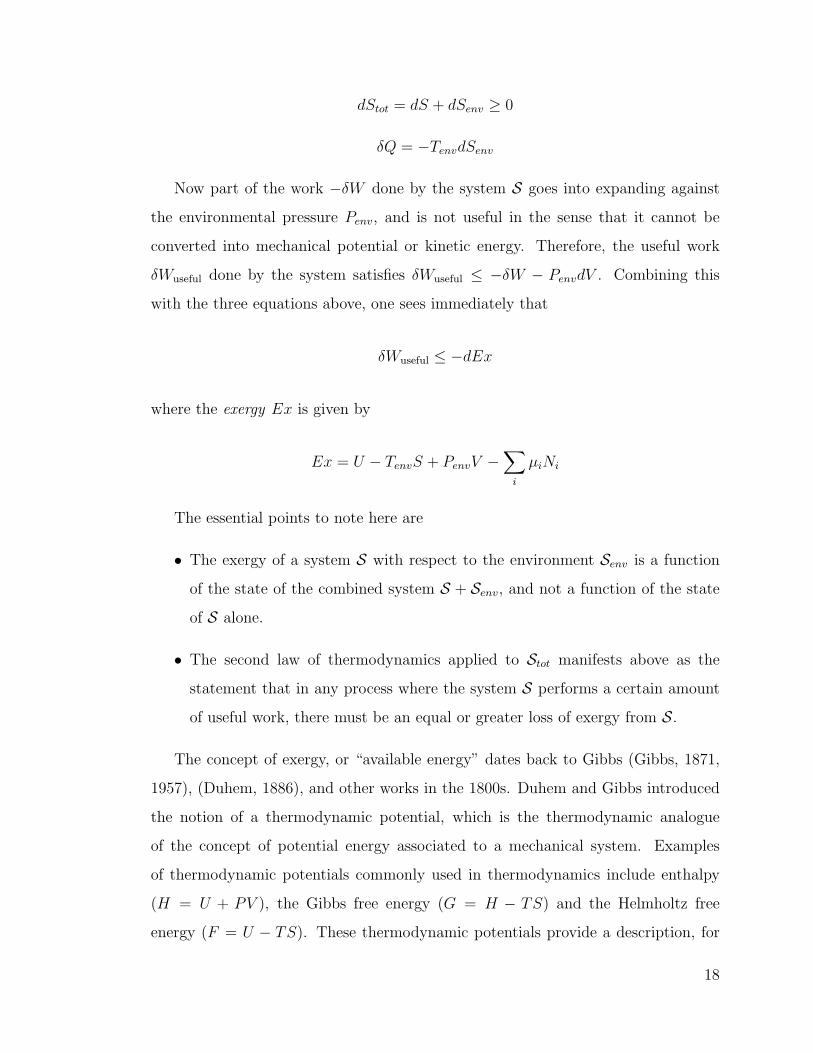
dStot = dS + dSenv ≥ 0
δQ = −TenvdSenv
Now part of the work −δW done by the system S goes into expanding against
the environmental pressure Penv, and is not useful in the sense that it cannot be
converted into mechanical potential or kinetic energy. Therefore, the useful work
δWuseful done by the system satisfies δWuseful ≤ −δW − PenvdV . Combining this
with the three equations above, one sees immediately that
δWuseful ≤ −dEx
where the exergy Ex is given by
Ex = U − TenvS + PenvV −∑i
µiNi
The essential points to note here are
• The exergy of a system S with respect to the environment Senv is a function
of the state of the combined system S + Senv, and not a function of the state
of S alone.
• The second law of thermodynamics applied to Stot manifests above as the
statement that in any process where the system S performs a certain amount
of useful work, there must be an equal or greater loss of exergy from S.
The concept of exergy, or “available energy” dates back to Gibbs (Gibbs, 1871,
1957), (Duhem, 1886), and other works in the 1800s. Duhem and Gibbs introduced
the notion of a thermodynamic potential, which is the thermodynamic analogue
of the concept of potential energy associated to a mechanical system. Examples
of thermodynamic potentials commonly used in thermodynamics include enthalpy
(H = U + PV ), the Gibbs free energy (G = H − TS) and the Helmholtz free
energy (F = U − TS). These thermodynamic potentials provide a description, for
18
materially closed systems in internal equilibrium subject to various constraints, of
the evolution toward equilibrium with the environment. See (Castellan, 1983) for a
detailed discussion, and (R. U. Ayres et al., 1996) for an excellent overview. The
concept of exergy can be regarded as a generalization of the notion of thermodynamic
potential to open systems that are not subject to any constraints. The term exergy
was coined in (Rant, 1956), but the precursors of the concept goes back to (Gibbs,
1871), as noted above.
3.3 Exergy in resource and waste management
In common parlance, as well as in much of the scientific literature on environmental
science and sustainability, the term “energy consumption” is ubiquitous. However,
according to the first law of thermodynamics, energy is conserved - it can neither
be created nor destroyed. As explained above, the quantity that is consumed, when
useful work is done, is the exergy of the system.
Since thermodynamic analyses are, by their very nature, independent of the de-
tailed microscopic structure of the systems being considered, they are well adapted
to the methods of systems analysis (Meadows et al., 1974). Although the precursors
of the exergy concept were discovered in the 1800s, it was only in the 1970s that
exergy started to be applied systematically to the analysis of complex industrial,
economic, biological and economic systems (R. U. Ayres et al., 1996). During this
decade, publication of “Limits to Growth” (Meadows et al., 1974) drew greater at-
tention to the issue of resource depletion. The landmark studies (United States.
Congress. Joint Committee on Atomic Energy, 1973; Carnahan, W. and American
Physical Society and National Science Foundation (U.S.) and United States. Federal
Energy Administration and Electric Power Research Institute, 1975), commissioned
by the Joint Committee on Atomic Energy of the U.S. Congress and the American
Physical Society respectively, marked the beginning of what is now a long tradition
of the application of exergy and the second law of thermodynamics in the study of
19
resource use and conservation, a practice which is a cornerstone of the thriving field
of industrial ecology (R. Ayres & Ayres, 2002).
Complex systems - whether single organisms, entire ecosystems, economies, or
industrial systems - sustain themselves by performing useful work. The idea that
the second law should play a central role in the description of how “living systems”
sustain themselves was proposed in (Schrodinger, 1955), where it was argued that
such systems sustain themselves by feeding on “negative entropy”, and “excreting”
entropy into their environment. In the language of this thesis, one might formulate
this by saying that these systems sustain themselves by consuming exergy. These
ideas have been developed further by several authors (Murphy & O’Neill, 1997;
Schneider & Kay, 1994) using the exergy concept, and it has been argued that (i)
the exergy content an ecosystem and (ii) its ability to effectively dissipate exergy
are strong indicators of the integrity and health of the ecosystem (Bendoricchio &
Jørgensen, 1997; Fath, Patten, & Choi, 2001). Considerable evidence in favor of this
hypothesis has been found: see (J. Dewulf et al., 2008b) and the references therein.
In as much as the “value” of a resource to a given system (biological, ecolog-
ical, industrial, etc) is determined by its utility in maintaining or “improving the
integrity/stability of” the system, it is clear then that the exergy content of the
resource is a good indicator of its value. It provides a universal currency, measured
in units of energy, with which to measure and compare materials and processes of
disparate origins and types. This observation lies at the foundation of the subject
of thermo-economics, an approach to economics based on entropy and exergy, in-
troduced in (Georgescu-Roegen, 1971). The subject is now very well-developed; see
(R. Ayres & Warr, 2010) for an overview of the literature, and a discussion of how
various traditional economic indicators, such as GDP, are strongly correlated with
exergy flows.
Exergy can also be used to assess the impact of a given product on the envi-
ronment. To evaluate the resource depletion brought about by a given product, it
is necessary to take into account the exergies of all the resources participating in
20
the process that leads from raw materials occuring in the environment to the given
product (the supply chain in a manufacturing process from cradle to grave). The
cumulative exergy consumption (CExC) (Szargut, Morris, & Steward, 1987; Szargut,
2005) of a product, also known as the cumulative exergy demand (CExD) (Bosch,
Hellweg, Huijbregts, & Frischknecht, 2007), is a measure of the total amount of
exergy depleted from the environment in the production of the product. It is not
an attribute of the product itself, but of the process that the leads to the product
from its naturally occuring components. This notion will be discussed in detail in
Section 4.2; it forms the basis for the analysis in this paper of the environmental
impacts of different plastic waste management scenarios.
21
Chapter 4
Material and Methods
A number of steps/tasks were completed in carrying out this study. First, a literature
review about exergy analysis and evaluation of waste and resource systems (especially
plastics) was conducted.
The second step involved defining the system of interest and it’s processes and
flows, within temporal and geographical boundaries. Two scenarios were elaborated
for the material flow analysis: Scenario A, the baseline case, assumed no source-
separation for plastic waste generated at private households and where mixed solid
waste (residual waste) with the plastic fraction was sent for incineration to a waste-
to-energy plant with energy (heat and electricity) recovery capability. Scenario B,
differed from Scenario A in that the plastic fraction was source-separated at house-
holds and was sent instead to a material recycling facility for production of recyclates
to substitute plastic production from virgin sources. Next an inventory of the mate-
rial and energy flows for the two plastic waste management scenarios was conducted.
The third step included conducting an impact assessment of the two scenarios
using cumulative exergy demand (CExD) indicators.
Finally, the fourth step involved interpretation and discussion of the results in
view of optimizing plastic waste utilization based on the second law of thermody-
namic analysis.
The two methodologies applied to reach the goals of this thesis – material flow
22
analysis (MFA) and exergy analysis – are briefly described below, followed by the
description of the two scenarios and the sources from which material and energy flow
data was gathered.
4.1 Material Flow Analysis (MFA)
As defined by Brunner and Rechberger (2004), material flow analysis (MFA) “is a
systematic assessment of the flows and stocks of materials within a system defined in
space and time. It connects the sources, the pathways, and the intermediate and final
sinks of a material.” Based on the principle of conservation of matter, MFA is a
simple yet powerful tool that can analyze a process by comparing and balancing it’s
input, stock, and output material flows. It is this property of MFA that makes it a
useful decision-making tool in resource and waste management. An MFA of a system
or process provides an accurate picture of all the flows and stocks of a particular
substance/material within it, and it becomes easier to identify the loadings and
sources of the substance/material. This can lead to early identification of depletion or
accumulation of particular materials and allow for the implementation of appropriate
policy measures - either to allow accumulation for future use or to counteract the
depletion. Also, changes that would otherwise take a long time to measure become
evident by conducting a MFA of a system or process. (Brunner & Rechberger, 2004)
It should be noted that anthropogenic systems are intricately linked to space,
information, energy, society - and though an MFA can be performed with a simple
mass-balance analysis, these aspects have to be taken into consideration while inter-
preting the results of an MFA. Applying MFA to a system involves conducting an
inventory analysis for the material flows and stocks of the system.
Listed are key terms and procedures used in MFA methodology as developed by
Baccini and Brunner in the 1980s:
• Material : The term material encompasses both, substances and goods. Sub-
stances are defined as a particular form of matter consisting of uniform prop-
23
erties or units. Goods are substances or a mixture of substances that have an
assigned economic value which can be either positive or negative.
• Process: A process can be defined as a transport, transformation, or storage
of materials. A process on the whole can be examined as a closed system or
black box, meaning that only the inputs and outputs are of interest and not
the details within the box. When the processes within the black box are of
relevance or interest then they can be subdivided into two or more processes.
Processes are linked together by flows and fluxes.
• Flows and Fluxes : Flow is defined as the rate of flow mass through a con-
ductor, and a flux is defined as the flow per cross section.
• Transfer Coefficients (TC): These describe the partitioning of a substance
within a process and are defined for each output good of a process. Transfer
coefficients are a substance specific value and when multiplied by 100, give the
percentage of the total throughput of a substance that is transferred to a spe-
cific output good (also called partitioning). Furthermore, transfer coefficients
depend on the characteristics of a process and need not always be constant.
• System and System Boundary : The system is the object that is investi-
gated by an MFA. It consists of a set of material flows, stocks, and processes
within a defined spatial and temporal boundary (system boundary). The tem-
poral boundary is the time span over which the system of interest needs to be
studied and balanced. It is defined by the system and the problem to be inves-
tigated, for instance it could range from seconds for a combustion process to
a 1000 years for a landfill. The spatial boundary is generally the geographical
region in which the processes are located but can also be an abstract area. For
example, a city, region, country, the whole planet, or even a virtual limit such
as a waste-management system of a town. A system can be represented by a
single process or a collection of processes.
24
Material flow analysis for this study was performed using the free software STAN
(short for subSTance flow ANalysis) that can graphically model arbitrarily complex
systems using predefined components (flows, processes, subsystems, system bound-
aries, and text fields) and allows known data (mass flows, volume flows, stocks,
and transfer coefficients) with corresponding physical units to be either entered or
imported for different time periods and hierarchical layers (goods/substances and
energy).
4.2 Exergy Analysis - Cumulative Exergy Demand
Having introduced the concept of exergy and it’s origins in the second law of thermo-
dynamics in Chapter 3 above, this section describes the notion of cumulative exergy
demand (CExD) and why it will be used in this study.
The CExD indicator is introduced by Bosch et. al. (2007) to mean the sum of
exergies of all the resources required to provide a particular product. This depicts
the total exergy removed from nature to provide that product. “CExD assesses the
quality of energy demand and includes the exergy of energy carriers as well as of
non-energetic materials” (Bosch et al., 2007). From the laws of thermodynamics
we know that energy and mass are conserved in an (materially and energetically)
isolated system – for all practical purposes the Earth can be considered to be a
materially isolated system. What is consumed and eventually depleted is ‘usable
matter and usable energy’, and exergy is a measure of such useful and available
energy (Bosch et al., 2007). Hence, the cumulative exergy demand (CExD) is a suit-
able useful energy based indicator for the quality of resources that are removed from
nature to provide a particular good or product. CExD is equivalent to the concept
of cumulative consumption of exergy(CExC) introduced by Szargut (1987, 2005) and
Morris (1987) (Bosch et al., 2007; Szargut & Morris, 1987; Szargut et al., 1987).
CExD is an impact assessment indicator, that is, it measures the total resource
25
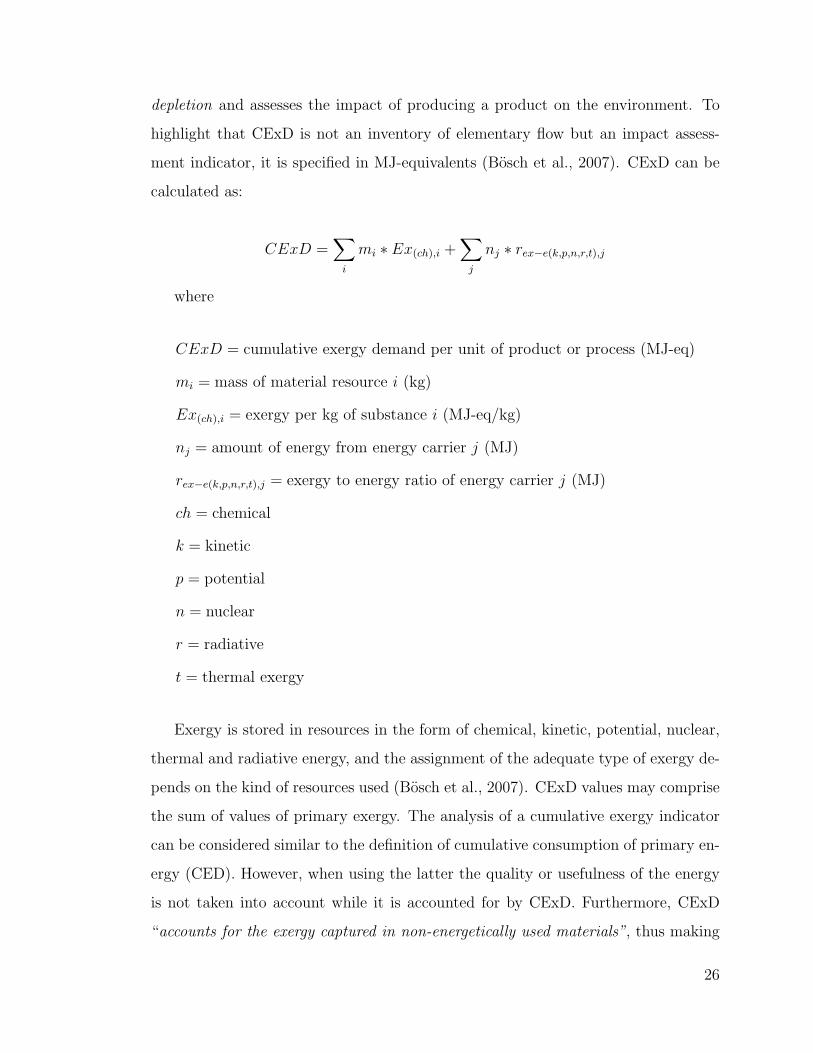
depletion and assesses the impact of producing a product on the environment. To
highlight that CExD is not an inventory of elementary flow but an impact assess-
ment indicator, it is specified in MJ-equivalents (Bosch et al., 2007). CExD can be
calculated as:
CExD =∑i
mi ∗ Ex(ch),i +∑j
nj ∗ rex−e(k,p,n,r,t),j
where
CExD = cumulative exergy demand per unit of product or process (MJ-eq)
mi = mass of material resource i (kg)
Ex(ch),i = exergy per kg of substance i (MJ-eq/kg)
nj = amount of energy from energy carrier j (MJ)
rex−e(k,p,n,r,t),j = exergy to energy ratio of energy carrier j (MJ)
ch = chemical
k = kinetic
p = potential
n = nuclear
r = radiative
t = thermal exergy
Exergy is stored in resources in the form of chemical, kinetic, potential, nuclear,
thermal and radiative energy, and the assignment of the adequate type of exergy de-
pends on the kind of resources used (Bosch et al., 2007). CExD values may comprise
the sum of values of primary exergy. The analysis of a cumulative exergy indicator
can be considered similar to the definition of cumulative consumption of primary en-
ergy (CED). However, when using the latter the quality or usefulness of the energy
is not taken into account while it is accounted for by CExD. Furthermore, CExD
“accounts for the exergy captured in non-energetically used materials”, thus making
26
CExD indicator a more comprehensive energy-based resource demand indicator than
CED (Bosch et al., 2007). The ecoinvent database contains CExD values that were
calculated for a large number of ecoinvent product and process systems and provides
life cycle resource demands of various products. CExD values for electricity and
plastics used in this study are taken from the ecoinvent database.
4.3 Description and Data
The goal of this study is to evaluate competing waste management options for plastic
wastes generated at private households by identifying whether one option is exer-
getically significantly more beneficial than the other. Two scenarios, A and B, are
developed and analyzed to enable comparison to be made between competing dis-
posal options for plastic waste.
Functional unit : The basis for the two scenarios described is the recycling, repro-
cessing, or incineration of 1 tonne – 1000 kg – of residual waste (mixed solid waste)
generated by private households.
System/Study boundaries: This study only analyzes energy or material recovery
options for mixed plastics and does not evaluate the management of the plastics
within the mixed or residual waste stream.
• Temporal boundary : The temporal boundary is taken to be one year.
• Geographical boundary : For the sake of representative data from waste streams,
waste-to-energy plants, and material recycling facilities, the geographical bound-
ary is set to be a town/city in a developed nation with an established waste
management system. Though a majority of data used in this study is from the
city of Vienna in Austria, it is not a study of the Viennese waste management
system, but could equally well be applied to other regions with equivalent pro-
cesses in place for the management of resources and waste. It is expected that
27
the direct performance of the processes (energy consumption, recycling effi-
ciency, energy recovery efficiency, etc.) would not be affected by location and
are representative of a town/city with a similar municipal waste management
system as analyzed/described in this study.
Data uncertainties : Data uncertainties are ignored for the purpose of this study.
Assumptions: The large number of different waste streams and the potential for
cross-contamination of a recycled stream makes the scenarios complex to model. As
such, a number of assumptions have been made to simplify the assessment. Where
and when made every assumption has been clearly stated.
Data for the evaluation and inventory of municipal waste collection and compo-
sition is obtained primarily from MA48 for Vienna in the year 2011. Other data for
heating values, plastic production processes, efficiencies etc. are taken from a variety
of published literature, including scientific publications and governmental statistics
and reports. CExD values for various fuels, electricity sources, and plastic fractions
are taken from the Ecoinvent database. In the case where data for a particular pro-
cess was not available generic figures for other cities in Europe from peer-reviewed
literature was used.
Once the boundary of the system was defined and the individual processes were
elaborated, data was gathered for conducting material balances on each individual
process, this included input data for mass flows and transfer coefficients. A materials’
balance helped in determining the appropriate weight factor used for calculating the
energy requirements and outputs of each process.
After completing the data inventory, the STAN software was used to build a
graphical model for each of the two scenarios. Material flow analysis was conducted
on the goods level and additionally energy inputs and outputs were calculated for
the processes. Subsequently, cumulative exergy demand (CExD) calculations were
28
conducted for processes in both scenarios.
The accuracy of this study is directly related to the quality of the input data and
the assumptions made. Data necessary for this study were process-related data and
fuel-related data.
4.3.1 Scenario A - Energy recovery
In this baseline scenario, it is assumed that there is no source-separation of the
plastic fraction and that all mixed solid waste (residual waste) from private house-
holds is sent to an incineration plant with energy and heat recovery capability. For
the purpose of this study the incineration (waste-to-energy) plant is modelled very
simply, meaning that no pre-processing or sorting of mixed solid wastes prior to in-
cineration is required. The system boundary was set starting at the collection and
transport of municipal waste from private households to when it was incinerated at
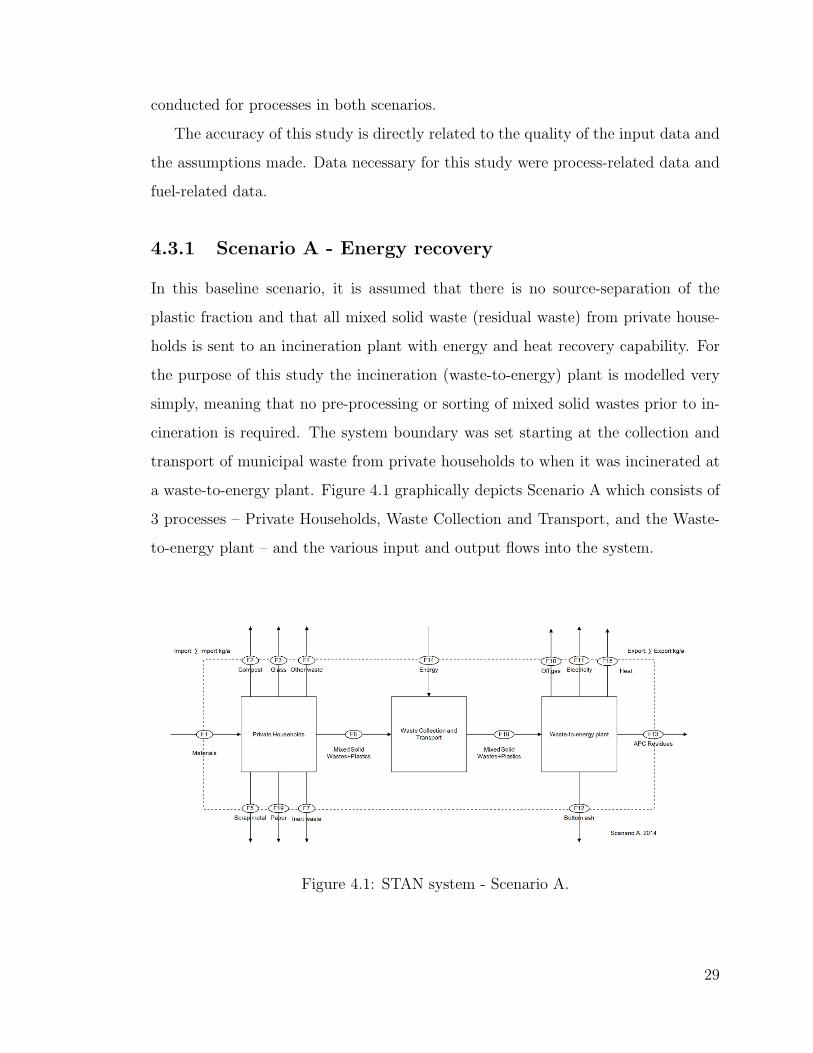
a waste-to-energy plant. Figure 4.1 graphically depicts Scenario A which consists of
3 processes – Private Households, Waste Collection and Transport, and the Waste-
to-energy plant – and the various input and output flows into the system.
Figure 4.1: STAN system - Scenario A.
29
Processes
Private Households:
Material imports (1) - the municipal waste generated by private households.
Material exports (7) - Compost, Glass, Other waste, Scrap metal, Paper, Inert waste,
and Mixed Solid Wastes + Plastics.
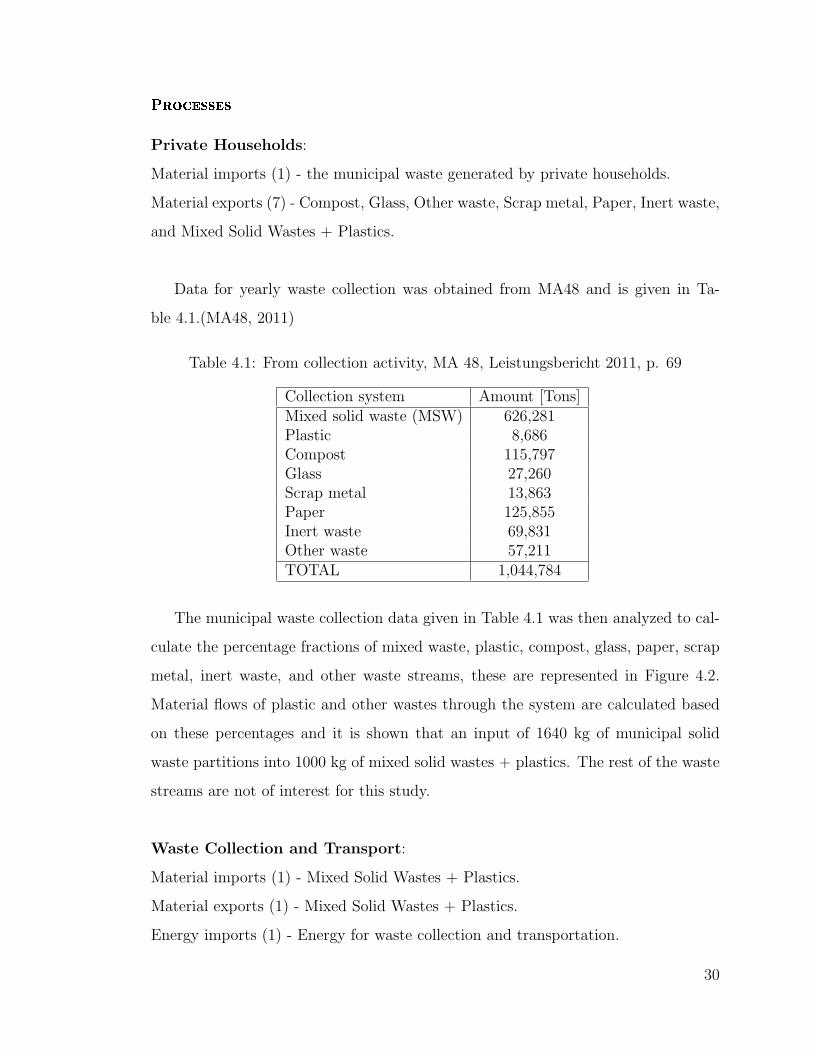
Data for yearly waste collection was obtained from MA48 and is given in Ta-
ble 4.1.(MA48, 2011)
Table 4.1: From collection activity, MA 48, Leistungsbericht 2011, p. 69
Collection system Amount [Tons]Mixed solid waste (MSW) 626,281Plastic 8,686Compost 115,797Glass 27,260Scrap metal 13,863Paper 125,855Inert waste 69,831Other waste 57,211TOTAL 1,044,784
The municipal waste collection data given in Table 4.1 was then analyzed to cal-
culate the percentage fractions of mixed waste, plastic, compost, glass, paper, scrap
metal, inert waste, and other waste streams, these are represented in Figure 4.2.
Material flows of plastic and other wastes through the system are calculated based
on these percentages and it is shown that an input of 1640 kg of municipal solid
waste partitions into 1000 kg of mixed solid wastes + plastics. The rest of the waste
streams are not of interest for this study.
Waste Collection and Transport:
Material imports (1) - Mixed Solid Wastes + Plastics.
Material exports (1) - Mixed Solid Wastes + Plastics.
Energy imports (1) - Energy for waste collection and transportation.
30

59.2%
1.0%
11.0%
3.0%1.3%
12.0%
7.0%5.5%
MSW
Plastic
Compost
Glass
Scrap metal
Paper
Inert waste
Other waste
Figure 4.2: Waste composition of private households. (Source: Author, adapted todata from MA48, 2011)
The 1000 kg of waste coming in is sent directly for incineration to a waste-to-
energy plant with electricity and heat generation capability.
Data on fuel requirements for the collection and transportation of waste materials
from households to the waste facility, was gathered from MA48 and is shown in
Table 4.2. Figures for densities and lower heating values (LHV) of fuels shown in
Table 4.2 were acquired from the Tank-to-Wheels report (Edwards, Larive, Mahieu,
& Rouveirolles, 2007).
The transportation of mixed wastes and plastics takes place with other fractions
of waste. A mass based allocation is used in order to account for solely the fractions
31
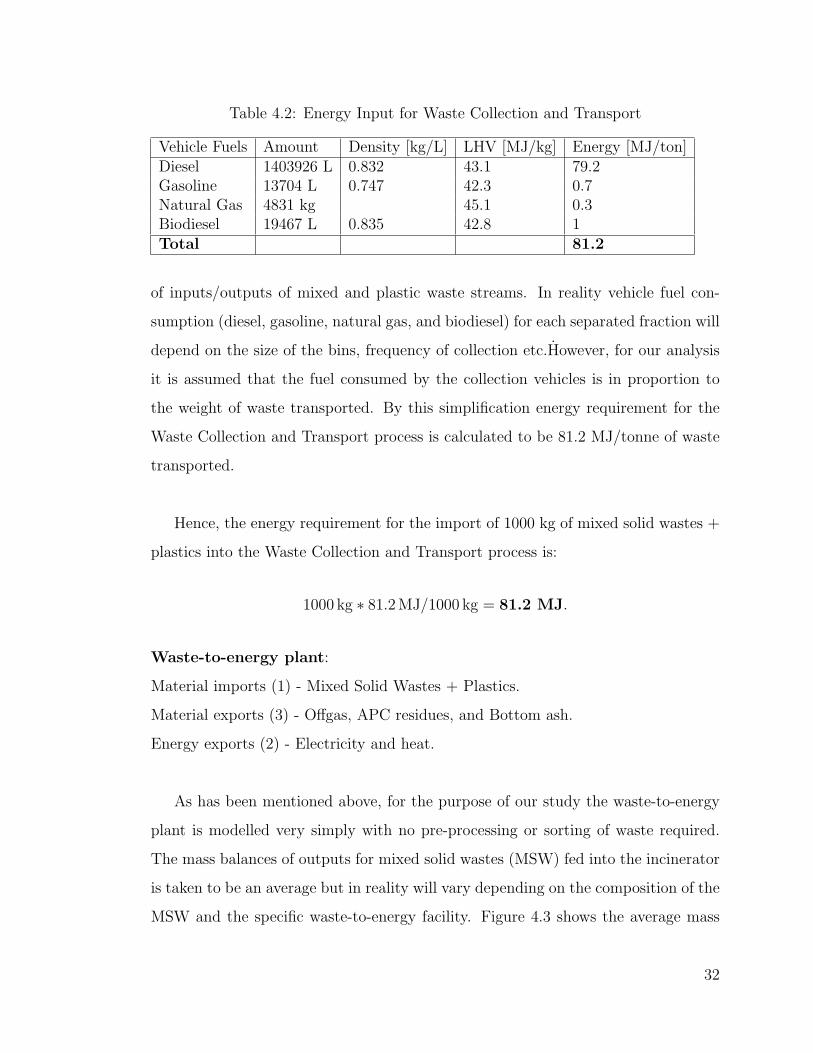
Table 4.2: Energy Input for Waste Collection and Transport
Vehicle Fuels Amount Density [kg/L] LHV [MJ/kg] Energy [MJ/ton]Diesel 1403926 L 0.832 43.1 79.2Gasoline 13704 L 0.747 42.3 0.7Natural Gas 4831 kg 45.1 0.3Biodiesel 19467 L 0.835 42.8 1Total 81.2
of inputs/outputs of mixed and plastic waste streams. In reality vehicle fuel con-
sumption (diesel, gasoline, natural gas, and biodiesel) for each separated fraction will
depend on the size of the bins, frequency of collection etc.However, for our analysis
it is assumed that the fuel consumed by the collection vehicles is in proportion to
the weight of waste transported. By this simplification energy requirement for the
Waste Collection and Transport process is calculated to be 81.2 MJ/tonne of waste
transported.
Hence, the energy requirement for the import of 1000 kg of mixed solid wastes +
plastics into the Waste Collection and Transport process is:
1000 kg ∗ 81.2MJ/1000 kg = 81.2 MJ.
Waste-to-energy plant:
Material imports (1) - Mixed Solid Wastes + Plastics.
Material exports (3) - Offgas, APC residues, and Bottom ash.
Energy exports (2) - Electricity and heat.
As has been mentioned above, for the purpose of our study the waste-to-energy
plant is modelled very simply with no pre-processing or sorting of waste required.
The mass balances of outputs for mixed solid wastes (MSW) fed into the incinerator
is taken to be an average but in reality will vary depending on the composition of the
MSW and the specific waste-to-energy facility. Figure 4.3 shows the average mass
32
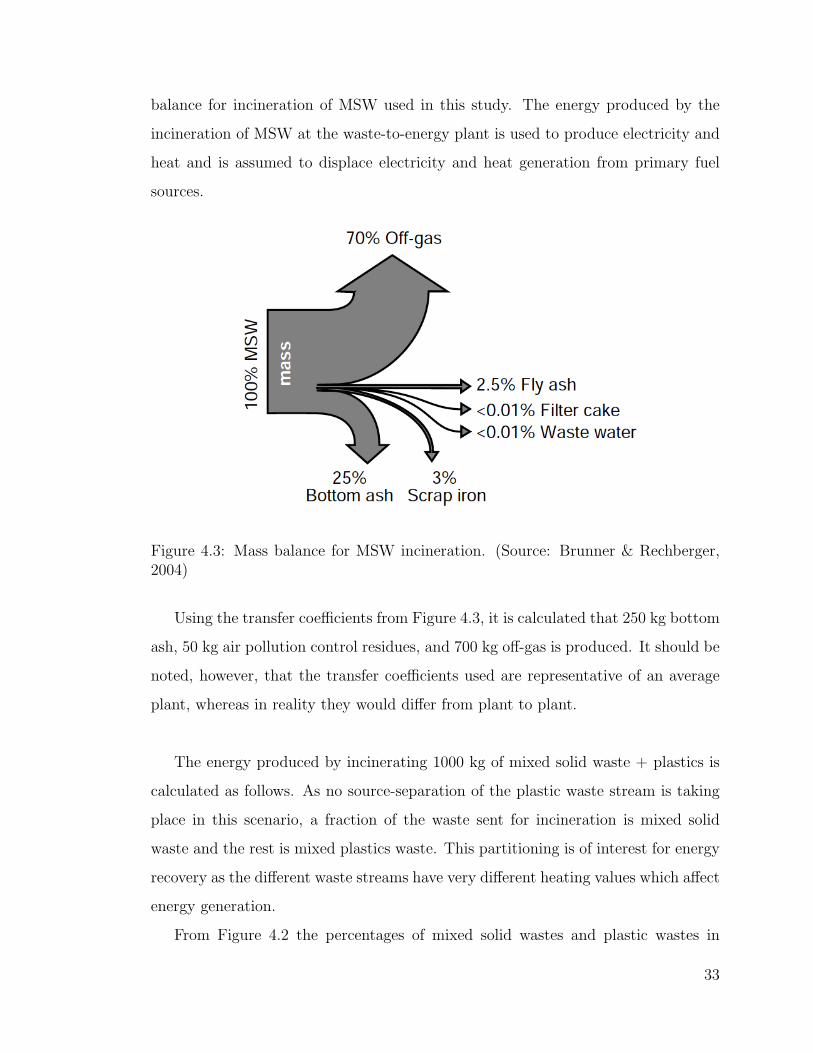
balance for incineration of MSW used in this study. The energy produced by the
incineration of MSW at the waste-to-energy plant is used to produce electricity and
heat and is assumed to displace electricity and heat generation from primary fuel
sources.
Figure 4.3: Mass balance for MSW incineration. (Source: Brunner & Rechberger,2004)
Using the transfer coefficients from Figure 4.3, it is calculated that 250 kg bottom
ash, 50 kg air pollution control residues, and 700 kg off-gas is produced. It should be
noted, however, that the transfer coefficients used are representative of an average
plant, whereas in reality they would differ from plant to plant.
The energy produced by incinerating 1000 kg of mixed solid waste + plastics is
calculated as follows. As no source-separation of the plastic waste stream is taking
place in this scenario, a fraction of the waste sent for incineration is mixed solid
waste and the rest is mixed plastics waste. This partitioning is of interest for energy
recovery as the different waste streams have very different heating values which affect
energy generation.
From Figure 4.2 the percentages of mixed solid wastes and plastic wastes in
33
municipal waste are known to be 60% and 1% respectively. Based on these values it
is calculated that in a waste stream of 1000 kg with no source-separation of plastics,
984 kg is mixed solid waste and 16 kg is plastic waste.
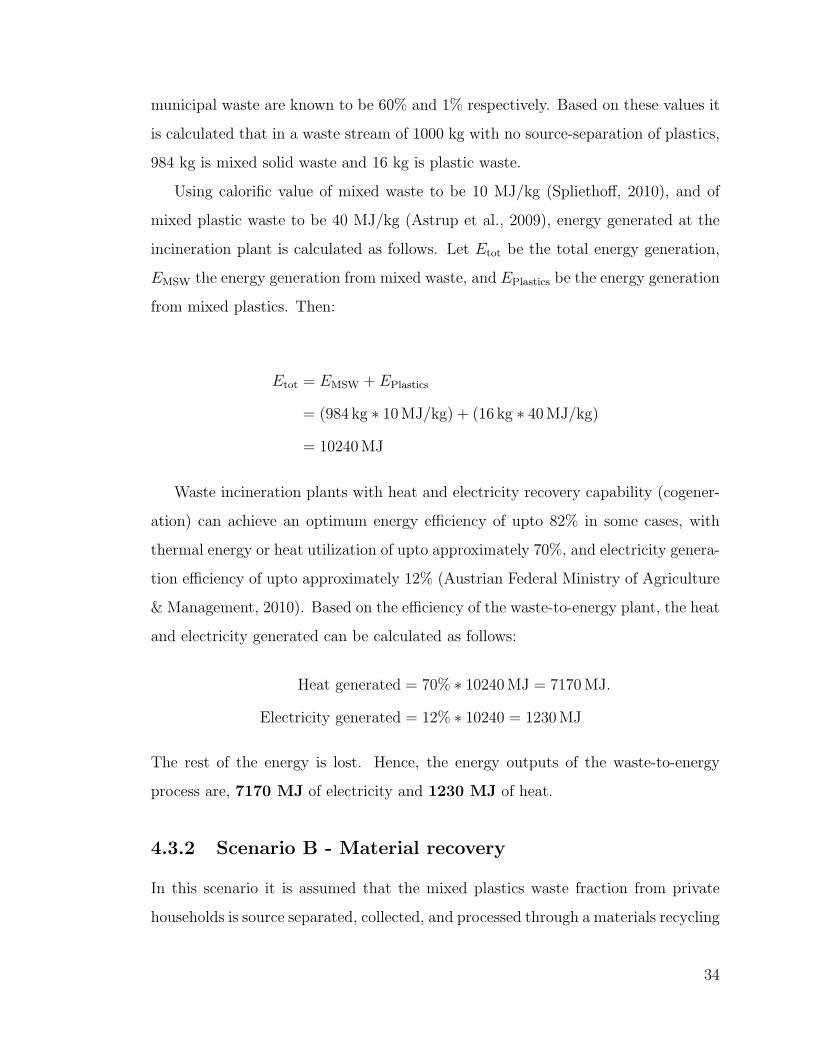
Using calorific value of mixed waste to be 10 MJ/kg (Spliethoff, 2010), and of
mixed plastic waste to be 40 MJ/kg (Astrup et al., 2009), energy generated at the
incineration plant is calculated as follows. Let Etot be the total energy generation,
EMSW the energy generation from mixed waste, and EPlastics be the energy generation
from mixed plastics. Then:
Etot = EMSW + EPlastics
= (984 kg ∗ 10MJ/kg) + (16 kg ∗ 40MJ/kg)
= 10240MJ
Waste incineration plants with heat and electricity recovery capability (cogener-
ation) can achieve an optimum energy efficiency of upto 82% in some cases, with
thermal energy or heat utilization of upto approximately 70%, and electricity genera-
tion efficiency of upto approximately 12% (Austrian Federal Ministry of Agriculture
& Management, 2010). Based on the efficiency of the waste-to-energy plant, the heat
and electricity generated can be calculated as follows:
Heat generated = 70% ∗ 10240MJ = 7170MJ.
Electricity generated = 12% ∗ 10240 = 1230MJ
The rest of the energy is lost. Hence, the energy outputs of the waste-to-energy
process are, 7170 MJ of electricity and 1230 MJ of heat.
4.3.2 Scenario B - Material recovery
In this scenario it is assumed that the mixed plastics waste fraction from private
households is source separated, collected, and processed through a materials recycling
34
facility (MRF) which models a situation where the major polymer types (PE, PP, PS,
PET, and PVC) in the waste stream are sorted/separated and mechanically recycled.
It should be noted that the MRF processing the plastic waste and producing the
granulates may in some cases be physically co-located with the reprocessing facility
using the plastic granulates making it difficult to distinguish between the processes
that are related to the MRF and those to the reprocessing facility. (Astrup et al.,
2009) For the purpose of clarity, both the facilities are chosen to be separate in this
study.
Plastic recyclates leave the MRF facility ready to be made into ‘new’ products.
Non-recycled fractions are sent back to the waste-to-energy plant for incineration
where they can substitute primary fuels. It should be noted that the calorific value
of the mixed plastic waste from the MRF is much higher than normal residual waste
feedstock accepted for incineration.
Though the sorting and shredding and subsequently granulation takes place at
the same material recycling facility (MRF), for the sake of clarity they have been
defined as separate processes in this MFA. Based on literature data (Astrup et al.,
2009), electricity requirement for handling and mechanical treatment, correspond-
ing to sorting and shredding, is around 25 kWh/tonne of plastic waste; electricity
requirement for final granulation to obtain a high-quality product is around 600
kWh/tonne of plastic waste. Important assumption: markets exist for the recycled
plastics that are produced - PP, PET, PE, PVC and mixed PP/PE blends.
In the case of recovered/recycled products the analysis also includes the avoided
production of virgin material and energy from primary sources. This follows a system
expansion methodology commonly applied in such studies, which, in this case, is used
to take into account the benefits of the recovery process.
Figure 4.4 graphically depicts Scenario B which consists of 5 processes – Private
Households, Waste Collection and Transport, Waste-to-Energy Plant, Material Re-
cycling Facility (MRF), and the Granulation Facility – and the various input and
output flows into the system.
35
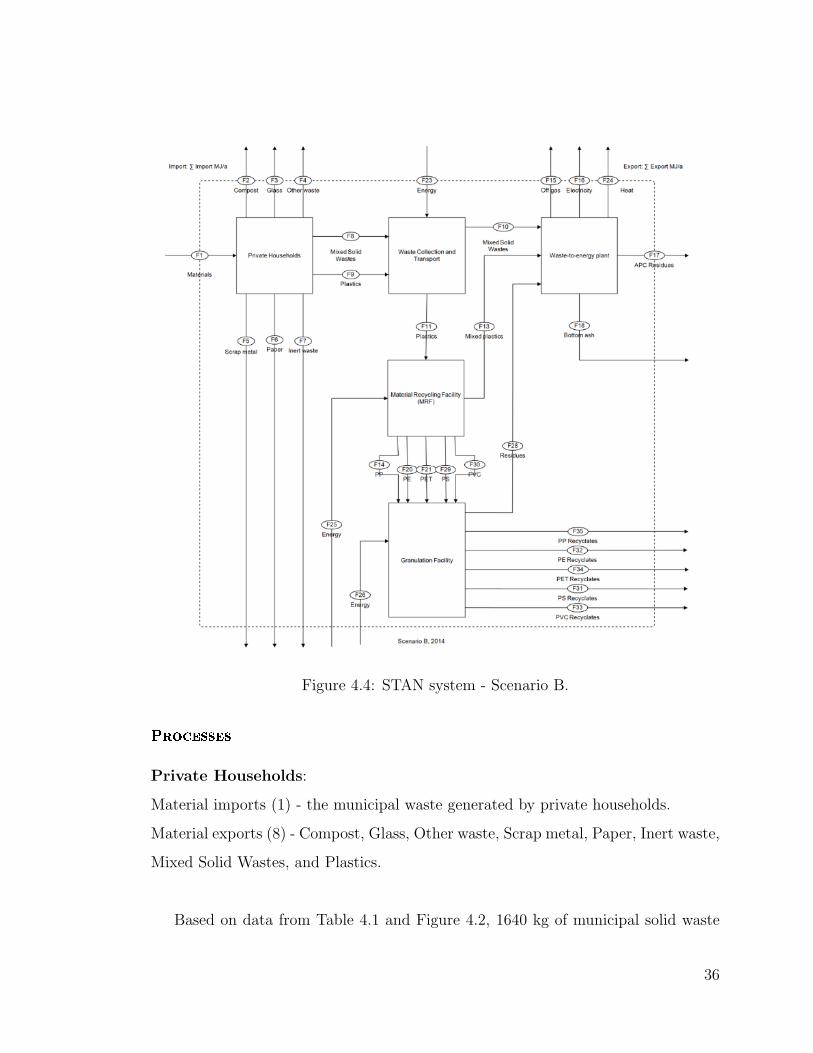
Figure 4.4: STAN system - Scenario B.
Processes
Private Households:
Material imports (1) - the municipal waste generated by private households.
Material exports (8) - Compost, Glass, Other waste, Scrap metal, Paper, Inert waste,
Mixed Solid Wastes, and Plastics.
Based on data from Table 4.1 and Figure 4.2, 1640 kg of municipal solid waste
36
partitions into 984 kg of mixed solid wastes and 16 kg of source-separated plastic
wastes. The rest of the waste streams are not of interest for this study.
Waste Collection and Transport:
Material imports (2) - Mixed Solid Wastes, and Plastics.
Material exports (2) - Mixed Solid Wastes, and Plastics.
Energy imports (1) - Energy for waste collection and transportation.
Same as in Scenario A, data on fuel requirements for the collection and trans-
portation of waste materials from households to the waste facility, was gathered
from MA48 and is shown in Table 4.2. Figures for densities and lower heating values
(LHV) of fuels shown in Table 4.2 were acquired from the Tank-to-Wheels report
(Edwards et al., 2007).
The transportation of mixed wastes and plastics takes place with other fractions
of waste. A mass based allocation is used in order to account for solely the fractions
of inputs/outputs of mixed and plastic waste streams. In reality vehicle fuel con-
sumption (diesel, gasoline, natural gas, and biodiesel) for each separated fraction will
depend on the size of the bins, frequency of collection etc., however, for our analysis
it is assumed that the fuel consumed by the collection vehicles is in proportion to
the weight of waste transported. By this simplification energy requirement for the
Waste Collection and Transport process is calculated to be 81.2 MJ/tonne of waste
transported.
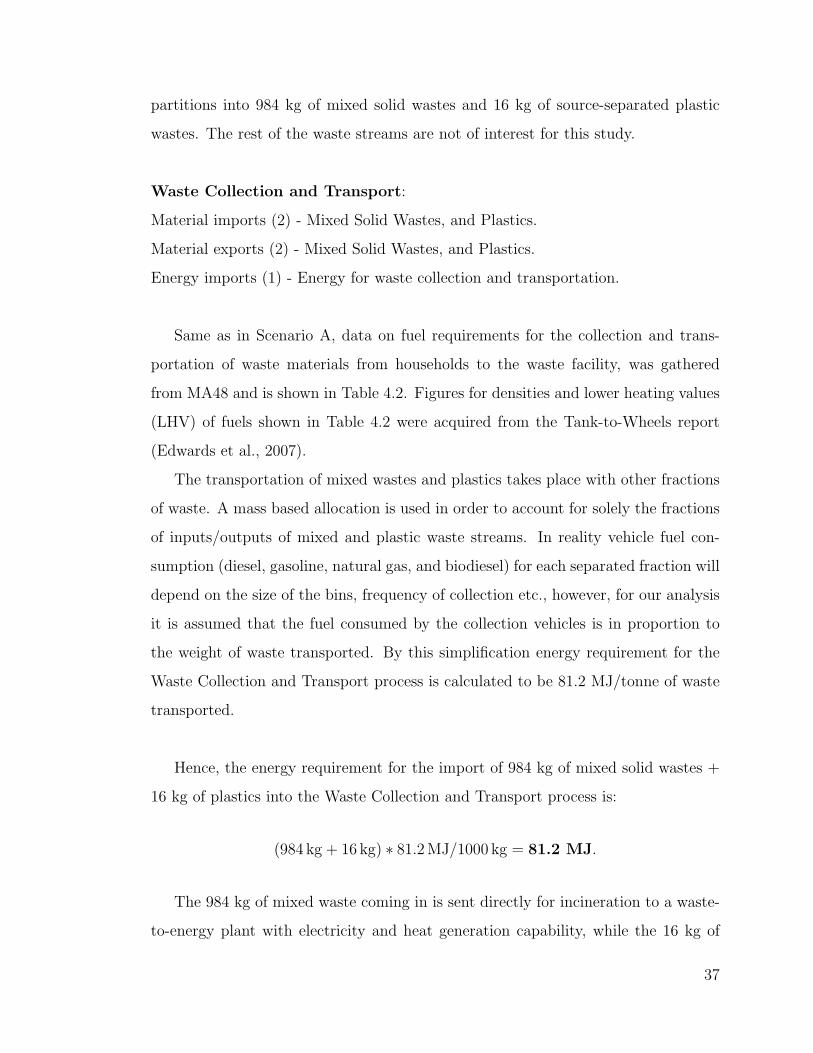
Hence, the energy requirement for the import of 984 kg of mixed solid wastes +
16 kg of plastics into the Waste Collection and Transport process is:
(984 kg + 16 kg) ∗ 81.2MJ/1000 kg = 81.2 MJ.
The 984 kg of mixed waste coming in is sent directly for incineration to a waste-
to-energy plant with electricity and heat generation capability, while the 16 kg of
37
source-separated plastic waste is sent to a material recycling facility (MRF).
Waste-to-Energy Plant:
Material imports (2) - Mixed Solid Wastes, and Mixed Plastics.
Material exports (3) - Offgas, APC residues, and Bottom ash.
Energy exports (2) - Electricity and heat.
As has been mentioned above, for the purpose of this study the waste-to-energy
plant is modelled very simply with no pre-processing or sorting of waste required.
Using the transfer coefficients from Figure 4.3, it is calculated that 250 kg bottom
ash, 50 kg air pollution control residues, and 690 kg off-gas is produced. It should be
noted, however, that the transfer coefficients used are representative of an average
plant, whereas in reality they would differ from plant to plant.
The energy produced by incineration (of 984 kg mixed solid waste + residues
from MRF + residues from Granulation facility) is calculated as follows. In this
scenario mixed plastic wastes are source separated and sent to a material recycling
facility for recovery and recycling while only the mixed waste fraction is sent for
incineration. As can be seen from the calorific values of the different fractions, it is
evident that removing the high calorific plastics fraction will decrease the amount
of energy produced. The change in composition compared to scenario A leads to a
lower heating value of the incoming waste to the waste-to-energy plant.
Using calorific value of mixed waste to be 10 MJ/kg (Spliethoff, 2010), and that of
mixed plastics to be 40 MJ/kg (Astrup et al., 2009) energy generated at the waste-
to-energy plant is calculated as follows. Let Etot be the total energy generation,
EMSW the energy generation from mixed waste, EMRF be the energy generation from
mixed plastics sent by the material recycling facility (MRF), and ERes be the energy
38
generation from residues sent by the granulation facility. Then:
Etot = EMSW + EMRF + ERes
= (984 kg ∗ 10MJ/kg) + (1.8 kg ∗ 40MJ/kg) + (5.84 kg ∗ 40MJ/kg)
= 10104MJ
Based on the efficiency of the waste-to-energy plant, the heat and electricity
generated can be calculated as follows:
Heat generated = 70% ∗ 10104MJ = 7070MJ.
Electricity generated = 12% ∗ 10104 = 1210MJ
The rest of the energy is lost. Hence, the energy outputs of the waste-to-energy
process are, 7070 MJ of electricity and 1210 MJ of heat.
Material Recycling Facility (MRF):
Material imports (1) - Plastics.
Material exports (6) - PP, PE, PET, PS, PVC, and Mixed Plastics.
Energy imports (1) - Energy for material sorting and shredding.
As stated previously, the MRF depicted in this study is the type that produces
granules (recyclates) for production of new products (material recovery) as opposed
to a MRF that produces fuel pellets for energy recovery. Using data acquired from
(WRAP, 2008) a typical mix of materials leaving the MRF is given in Table 4.3
where column 2 depicts a default distribution of plastics and column 3 depicts a
high polyolefin alternative.
Since this study uses a calorific value of 40 MJ/kg for mixed plastic waste the high
polyolefin distribution is chosen for the MRF. It is calculated from these percentages
that 16.8 kg of incoming source-separated plastic waste into the MRF is partitioned
39
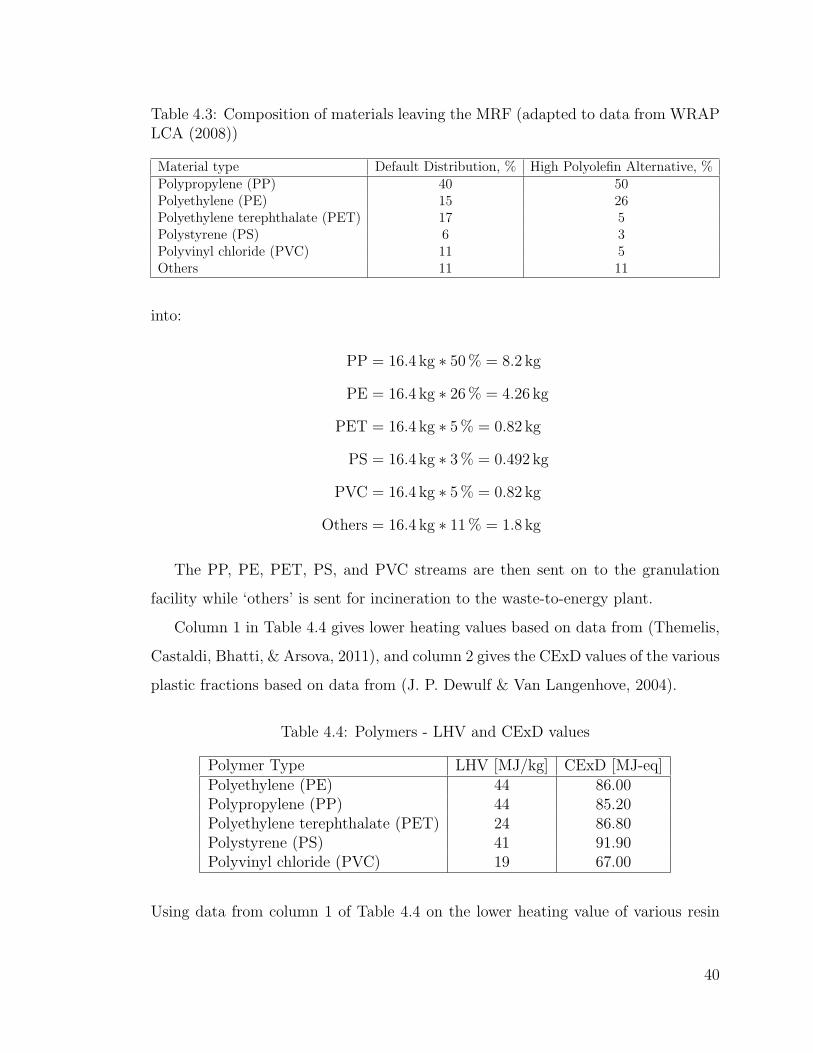
Table 4.3: Composition of materials leaving the MRF (adapted to data from WRAPLCA (2008))
Material type Default Distribution, % High Polyolefin Alternative, %Polypropylene (PP) 40 50Polyethylene (PE) 15 26Polyethylene terephthalate (PET) 17 5Polystyrene (PS) 6 3Polyvinyl chloride (PVC) 11 5Others 11 11
into:
PP = 16.4 kg ∗ 50% = 8.2 kg
PE = 16.4 kg ∗ 26% = 4.26 kg
PET = 16.4 kg ∗ 5% = 0.82 kg
PS = 16.4 kg ∗ 3% = 0.492 kg
PVC = 16.4 kg ∗ 5% = 0.82 kg
Others = 16.4 kg ∗ 11% = 1.8 kg
The PP, PE, PET, PS, and PVC streams are then sent on to the granulation
facility while ‘others’ is sent for incineration to the waste-to-energy plant.
Column 1 in Table 4.4 gives lower heating values based on data from (Themelis,
Castaldi, Bhatti, & Arsova, 2011), and column 2 gives the CExD values of the various
plastic fractions based on data from (J. P. Dewulf & Van Langenhove, 2004).
Table 4.4: Polymers - LHV and CExD values
Polymer Type LHV [MJ/kg] CExD [MJ-eq]Polyethylene (PE) 44 86.00Polypropylene (PP) 44 85.20Polyethylene terephthalate (PET) 24 86.80Polystyrene (PS) 41 91.90Polyvinyl chloride (PVC) 19 67.00
Using data from column 1 of Table 4.4 on the lower heating value of various resin
40

fractions, the calorific value (CV) of mixed plastic waste can be calculated by:
CV =∑i
PResin,i ∗ LHVResin,i
where
CV = calorific value of mixed plastics waste (MJ/kg)
PResin,i = percentage of resin fraction i (%)
LHVResin,i = lower heating value of fraction i (MJ-eq/kg)
Using this formula the calorific value of mixed plastics waste is calculated to be 33
MJ/kg. However, the composition of plastic materials entering the mixed plastics
waste stream are not consistent and can vary widely. In the literature the calorific
value of mixed plastic waste – with large shares of PP and PE, and moderate shares of
PET, PVC and PS – is taken to be 30-40 MJ/kg. (Astrup et al., 2009) Calculations in
this study are done based on lower heating value of 40 MJ/kg of mixed plastic waste.
Electricity consumption for simple sorting and shredding processes is in the range
of 16-32 kWh/tonne of plastic waste (Astrup et al., 2009; WRAP, 2008). An average
value of 24 kWh/tonne of plastic waste is used for the calculations in this analysis.
Using the conversion 1KWh = 3.6MJ this is converted to 0.086 MJ/kg.
For an amount 16.4 kg of source separated mixed plastic waste coming into the
MRF, the electricity requirement for the facility is calculated to be:
16.4 kg ∗ 0.086MJ/kg = 1.41MJ
Hence, the energy input for MRF is 1.41 MJ.
41
Granulation Facility:
Material imports (5) - PP, PE, PET, PS, and PVC
Material exports (5) - PP, PE, PET, PS, and PVC Recyclates.
Energy imports (1) - Electricity for granulation processes.
From the literature surveyed it is known that plastic material recycling can reach
efficiencies of 60% while the remaining 40% of the material is sent for incineration
(J. P. Dewulf & Van Langenhove, 2002, 2004; WRAP, 2008). Based on the amount
of material coming into the facility which is 14.6 kg of plastics (PP, PE, PET, PS,
and PVC), a total of 10.56 kg of recyclate material is produced while 5.84 kg is sent
back for incineration to the waste-to-energy plant. An important assumption is that
markets exist for the produced recycled plastics – PP, PET, PE, PVC and mixed
PP/PE blends – and the 10.56 kg of recycled plastic produced at the granulation
facility can substitute production of plastics from virgin sources.
Electricity consumption for the granulation processes is in the range of 240-300
kWh/tonne of plastic waste (Astrup et al., 2009; WRAP, 2008). An average value
of 270 kWh/tonne of plastic waste is used for the calculations in this analysis. Using
the conversion 1KWh = 3.6MJ this is converted to 0.97 MJ/kg.
For an amount of source separated mixed plastic waste coming into the MRF,
the electricity requirement is calculated to be:
14.6 kg ∗ 0.97MJ/kg = 14.2MJ
Hence, the energy input for the granulation facility is 14.2 MJ.
42
Chapter 5
Results
This chapter assesses and describes the results of the material flow analysis and
cumulative exergy demand calculations for scenarios A and B.
5.1 Material & Energy Flows
5.1.1 Scenario A
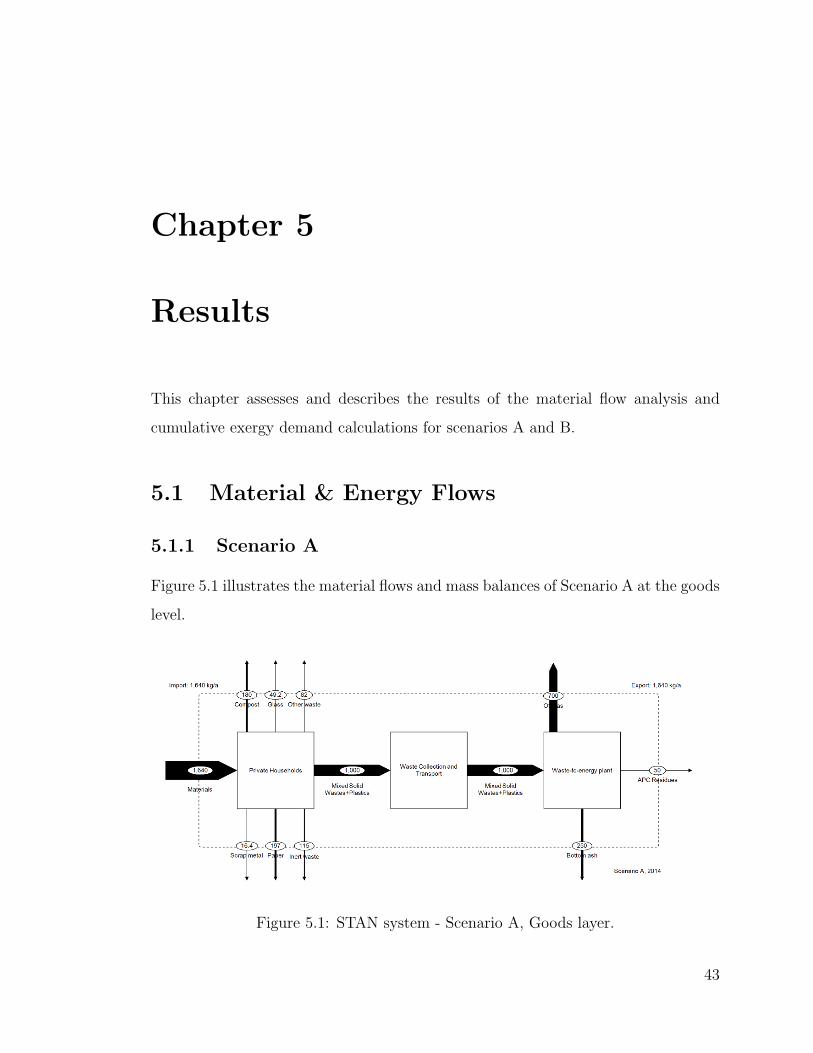
Figure 5.1 illustrates the material flows and mass balances of Scenario A at the goods
level.
Figure 5.1: STAN system - Scenario A, Goods layer.
43
1000 kg of mixed solid waste + plastic is collected and transported straight for
incineration to a waste-to-energy plant for energy recovery.
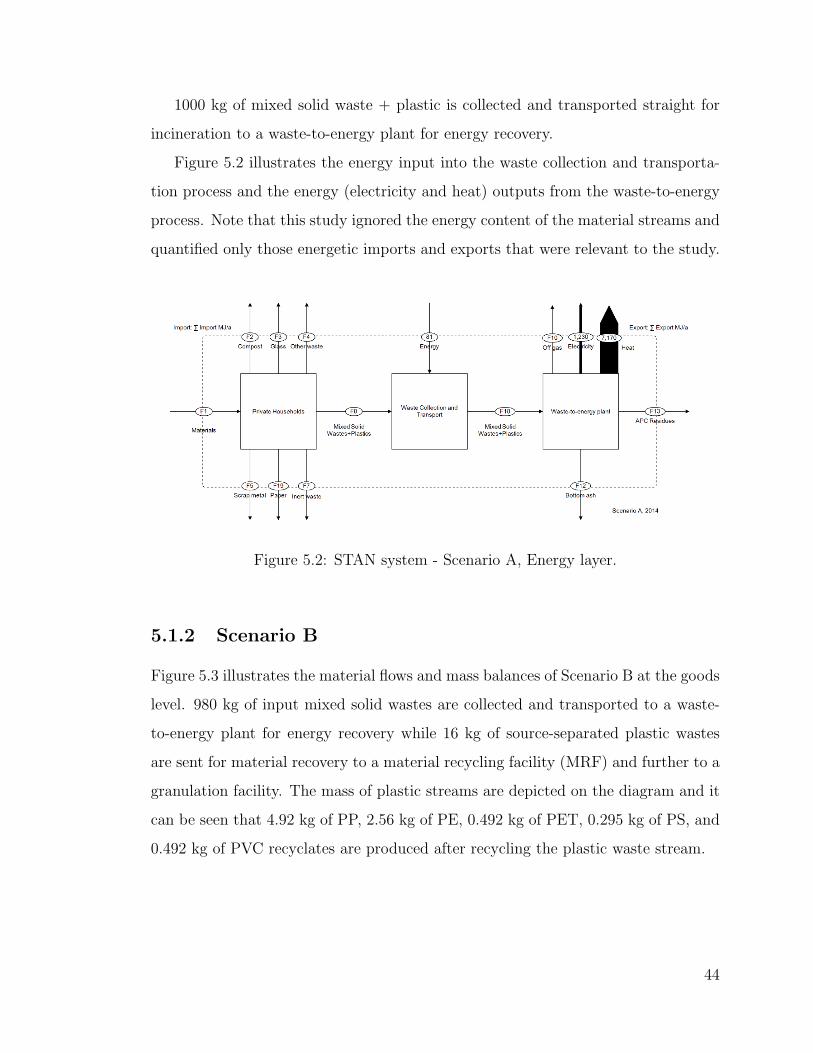
Figure 5.2 illustrates the energy input into the waste collection and transporta-
tion process and the energy (electricity and heat) outputs from the waste-to-energy
process. Note that this study ignored the energy content of the material streams and
quantified only those energetic imports and exports that were relevant to the study.
Figure 5.2: STAN system - Scenario A, Energy layer.
5.1.2 Scenario B
Figure 5.3 illustrates the material flows and mass balances of Scenario B at the goods
level. 980 kg of input mixed solid wastes are collected and transported to a waste-
to-energy plant for energy recovery while 16 kg of source-separated plastic wastes
are sent for material recovery to a material recycling facility (MRF) and further to a
granulation facility. The mass of plastic streams are depicted on the diagram and it
can be seen that 4.92 kg of PP, 2.56 kg of PE, 0.492 kg of PET, 0.295 kg of PS, and
0.492 kg of PVC recyclates are produced after recycling the plastic waste stream.
44
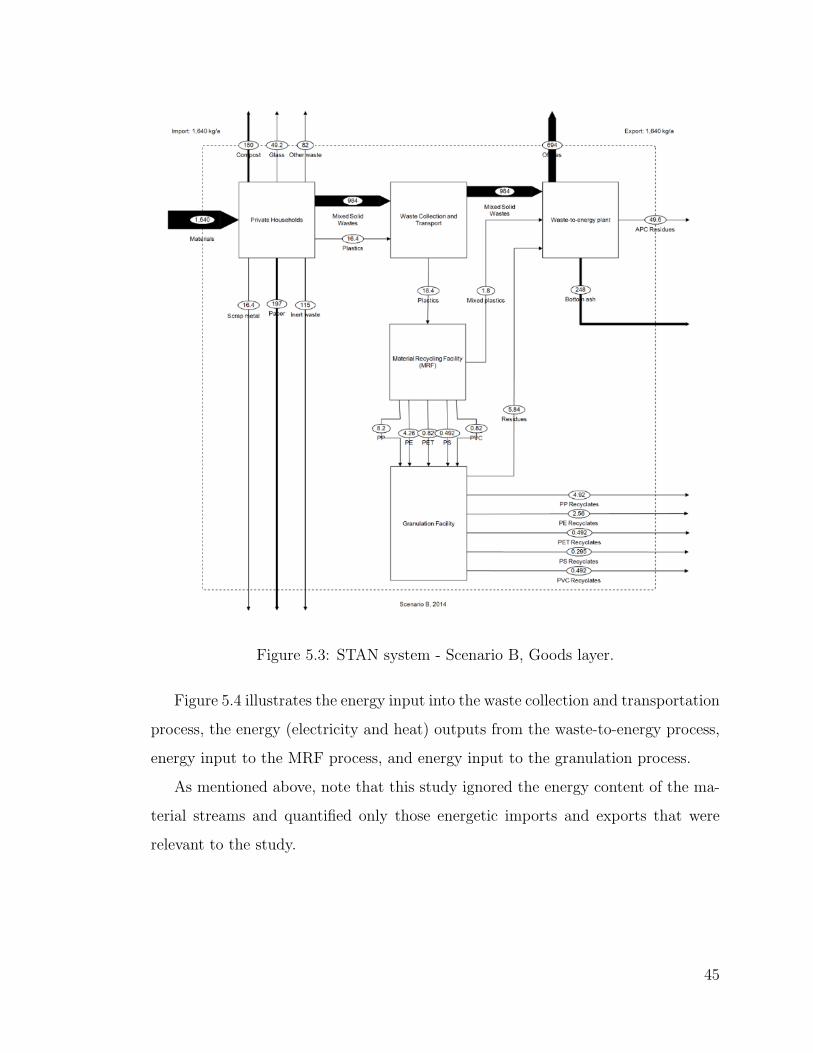
Figure 5.3: STAN system - Scenario B, Goods layer.
Figure 5.4 illustrates the energy input into the waste collection and transportation
process, the energy (electricity and heat) outputs from the waste-to-energy process,
energy input to the MRF process, and energy input to the granulation process.
As mentioned above, note that this study ignored the energy content of the ma-
terial streams and quantified only those energetic imports and exports that were
relevant to the study.
45
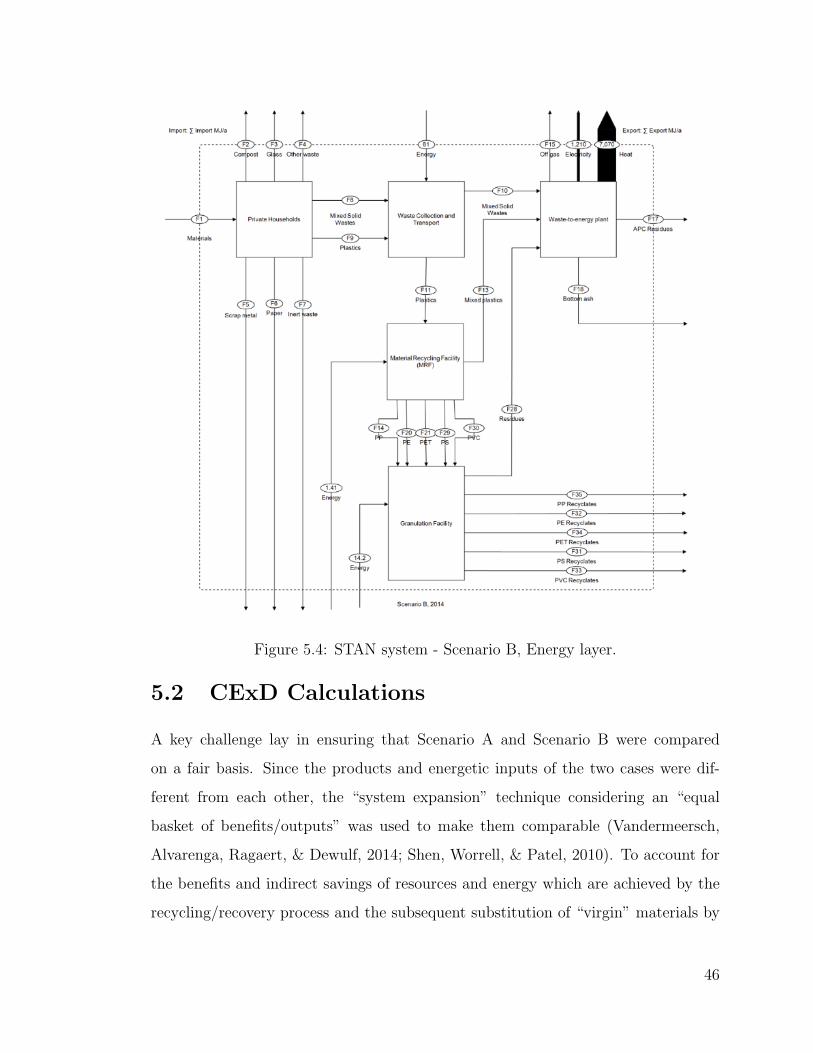
Figure 5.4: STAN system - Scenario B, Energy layer.
5.2 CExD Calculations
A key challenge lay in ensuring that Scenario A and Scenario B were compared
on a fair basis. Since the products and energetic inputs of the two cases were dif-
ferent from each other, the “system expansion” technique considering an “equal
basket of benefits/outputs” was used to make them comparable (Vandermeersch,
Alvarenga, Ragaert, & Dewulf, 2014; Shen, Worrell, & Patel, 2010). To account for
the benefits and indirect savings of resources and energy which are achieved by the
recycling/recovery process and the subsequent substitution of “virgin” materials by
46
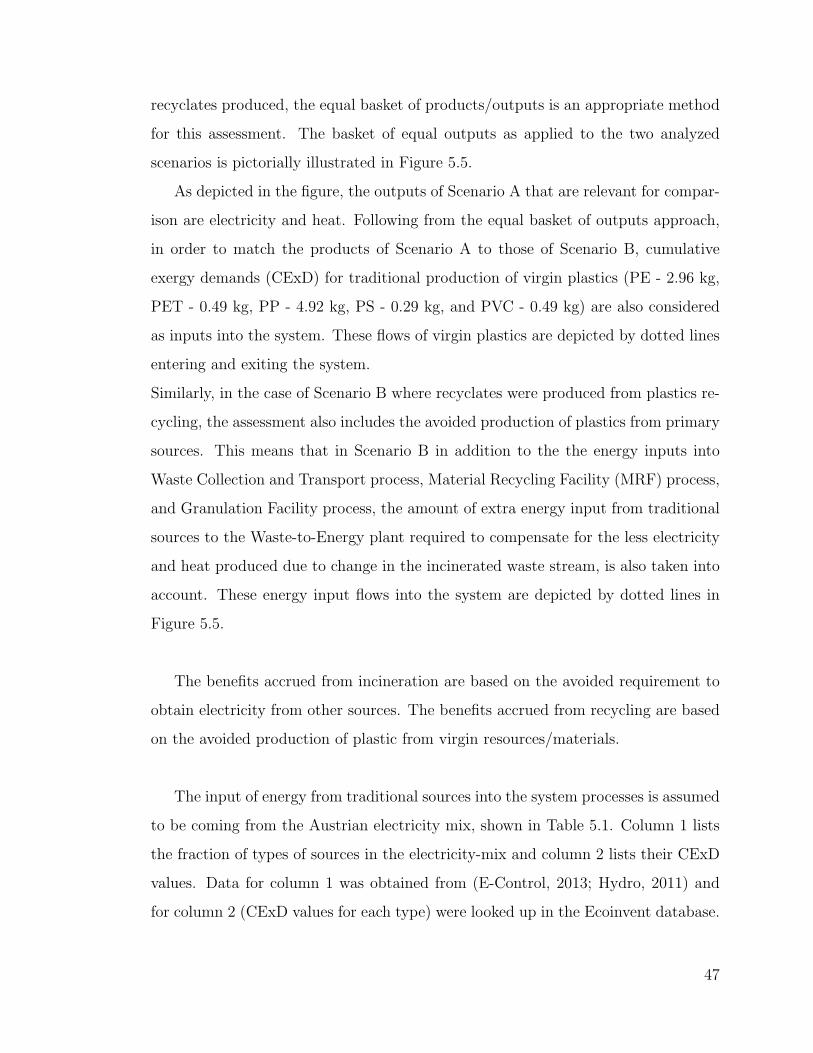
recyclates produced, the equal basket of products/outputs is an appropriate method
for this assessment. The basket of equal outputs as applied to the two analyzed
scenarios is pictorially illustrated in Figure 5.5.
As depicted in the figure, the outputs of Scenario A that are relevant for compar-
ison are electricity and heat. Following from the equal basket of outputs approach,
in order to match the products of Scenario A to those of Scenario B, cumulative
exergy demands (CExD) for traditional production of virgin plastics (PE - 2.96 kg,
PET - 0.49 kg, PP - 4.92 kg, PS - 0.29 kg, and PVC - 0.49 kg) are also considered
as inputs into the system. These flows of virgin plastics are depicted by dotted lines
entering and exiting the system.
Similarly, in the case of Scenario B where recyclates were produced from plastics re-
cycling, the assessment also includes the avoided production of plastics from primary
sources. This means that in Scenario B in addition to the the energy inputs into
Waste Collection and Transport process, Material Recycling Facility (MRF) process,
and Granulation Facility process, the amount of extra energy input from traditional
sources to the Waste-to-Energy plant required to compensate for the less electricity
and heat produced due to change in the incinerated waste stream, is also taken into
account. These energy input flows into the system are depicted by dotted lines in
Figure 5.5.
The benefits accrued from incineration are based on the avoided requirement to
obtain electricity from other sources. The benefits accrued from recycling are based
on the avoided production of plastic from virgin resources/materials.
The input of energy from traditional sources into the system processes is assumed
to be coming from the Austrian electricity mix, shown in Table 5.1. Column 1 lists
the fraction of types of sources in the electricity-mix and column 2 lists their CExD
values. Data for column 1 was obtained from (E-Control, 2013; Hydro, 2011) and
for column 2 (CExD values for each type) were looked up in the Ecoinvent database.
47
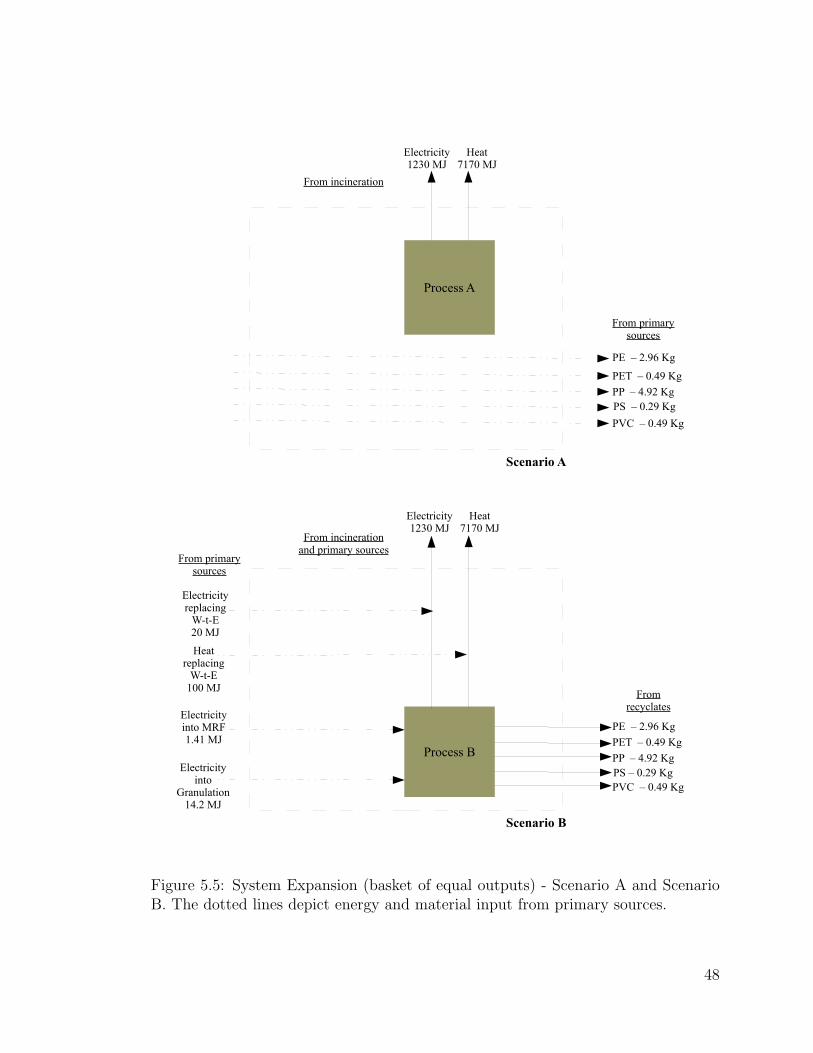
Process A
Process B
Electricity1230 MJ
Heat7170 MJ
Electricity1230 MJ
Heat7170 MJ
PE – 2.96 Kg
PET – 0.49 Kg
PP – 4.92 KgPS – 0.29 Kg
PVC – 0.49 Kg
PE – 2.96 Kg
PET – 0.49 Kg
PP – 4.92 KgPS – 0.29 KgPVC – 0.49 Kg
From recyclates
From primary sources
Scenario B
Scenario A
Electricity replacing
W-t-E20 MJ
Heat replacing
W-t-E 100 MJ
From primary sources
Electricity into MRF1.41 MJ
Electricity into
Granulation14.2 MJ
From incineration
From incineration and primary sources
Figure 5.5: System Expansion (basket of equal outputs) - Scenario A and ScenarioB. The dotted lines depict energy and material input from primary sources.
48
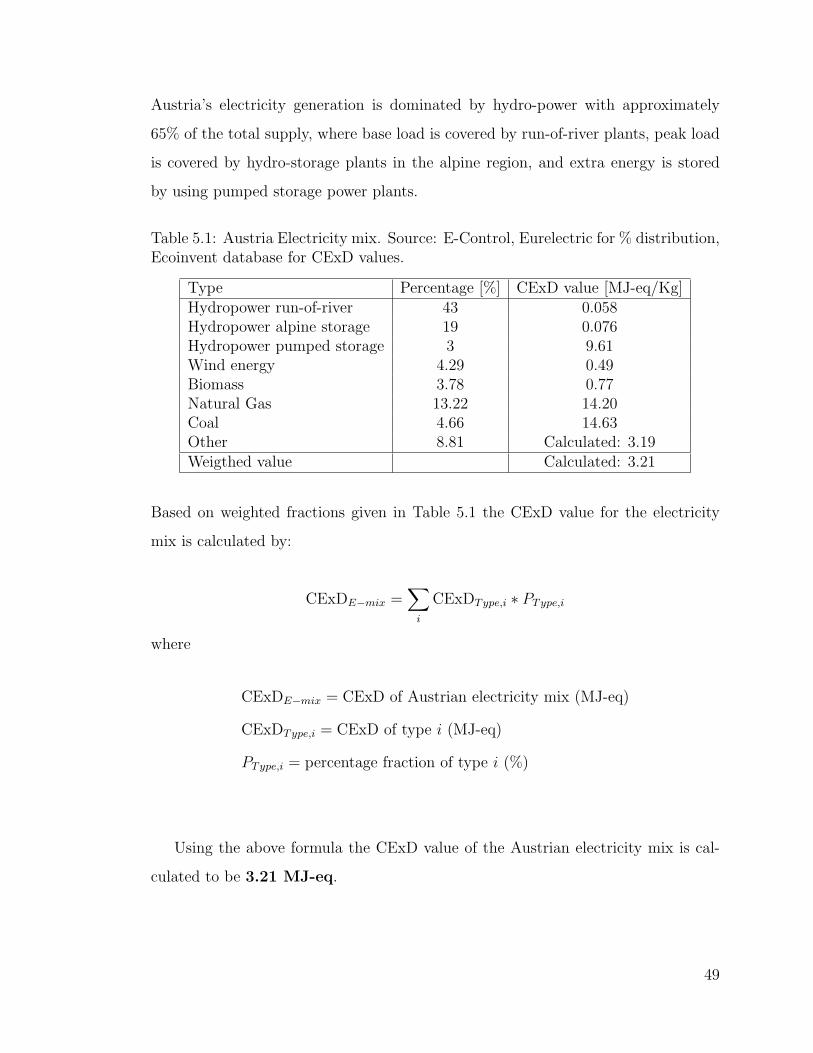
Austria’s electricity generation is dominated by hydro-power with approximately
65% of the total supply, where base load is covered by run-of-river plants, peak load
is covered by hydro-storage plants in the alpine region, and extra energy is stored
by using pumped storage power plants.
Table 5.1: Austria Electricity mix. Source: E-Control, Eurelectric for % distribution,Ecoinvent database for CExD values.
Type Percentage [%] CExD value [MJ-eq/Kg]Hydropower run-of-river 43 0.058Hydropower alpine storage 19 0.076Hydropower pumped storage 3 9.61Wind energy 4.29 0.49Biomass 3.78 0.77Natural Gas 13.22 14.20Coal 4.66 14.63Other 8.81 Calculated: 3.19Weigthed value Calculated: 3.21
Based on weighted fractions given in Table 5.1 the CExD value for the electricity
mix is calculated by:
CExDE−mix =∑i
CExDType,i ∗ PType,i
where
CExDE−mix = CExD of Austrian electricity mix (MJ-eq)
CExDType,i = CExD of type i (MJ-eq)
PType,i = percentage fraction of type i (%)
Using the above formula the CExD value of the Austrian electricity mix is cal-
culated to be 3.21 MJ-eq.
49
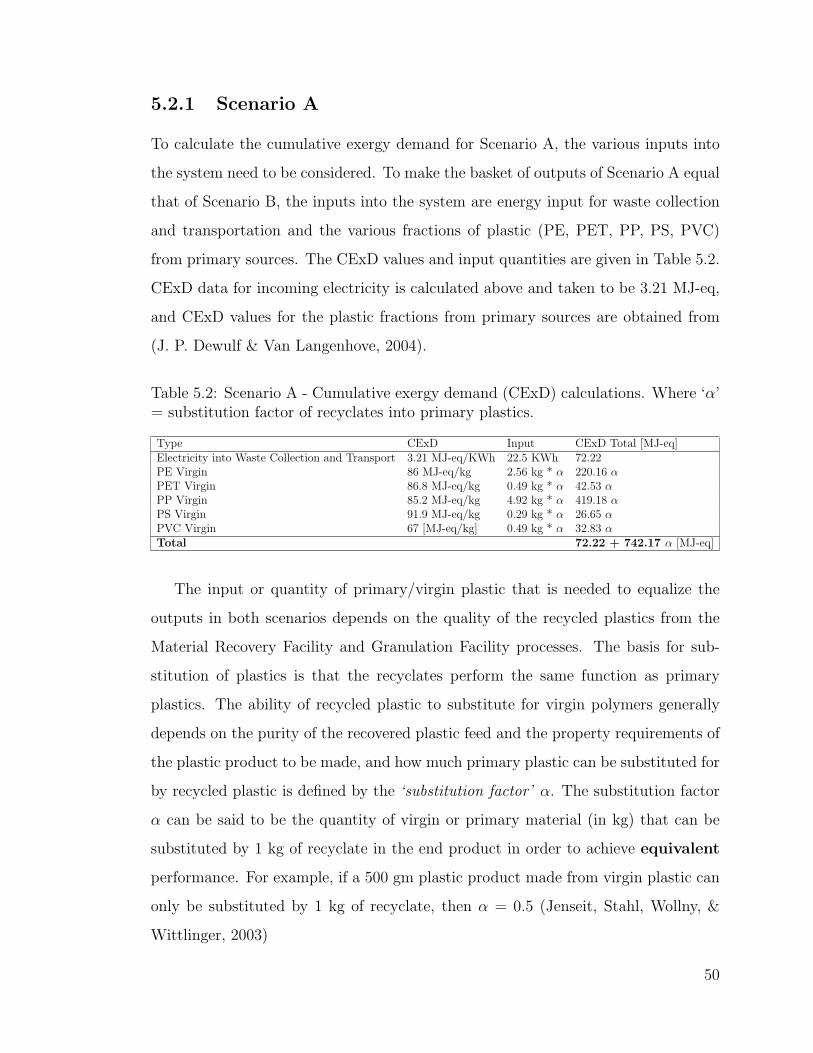
5.2.1 Scenario A
To calculate the cumulative exergy demand for Scenario A, the various inputs into
the system need to be considered. To make the basket of outputs of Scenario A equal
that of Scenario B, the inputs into the system are energy input for waste collection
and transportation and the various fractions of plastic (PE, PET, PP, PS, PVC)
from primary sources. The CExD values and input quantities are given in Table 5.2.
CExD data for incoming electricity is calculated above and taken to be 3.21 MJ-eq,
and CExD values for the plastic fractions from primary sources are obtained from
(J. P. Dewulf & Van Langenhove, 2004).
Table 5.2: Scenario A - Cumulative exergy demand (CExD) calculations. Where ‘α’= substitution factor of recyclates into primary plastics.
Type CExD Input CExD Total [MJ-eq]Electricity into Waste Collection and Transport 3.21 MJ-eq/KWh 22.5 KWh 72.22PE Virgin 86 MJ-eq/kg 2.56 kg * α 220.16 αPET Virgin 86.8 MJ-eq/kg 0.49 kg * α 42.53 αPP Virgin 85.2 MJ-eq/kg 4.92 kg * α 419.18 αPS Virgin 91.9 MJ-eq/kg 0.29 kg * α 26.65 αPVC Virgin 67 [MJ-eq/kg] 0.49 kg * α 32.83 αTotal 72.22 + 742.17 α [MJ-eq]
The input or quantity of primary/virgin plastic that is needed to equalize the
outputs in both scenarios depends on the quality of the recycled plastics from the
Material Recovery Facility and Granulation Facility processes. The basis for sub-
stitution of plastics is that the recyclates perform the same function as primary
plastics. The ability of recycled plastic to substitute for virgin polymers generally
depends on the purity of the recovered plastic feed and the property requirements of
the plastic product to be made, and how much primary plastic can be substituted for
by recycled plastic is defined by the ‘substitution factor’ α. The substitution factor
α can be said to be the quantity of virgin or primary material (in kg) that can be
substituted by 1 kg of recyclate in the end product in order to achieve equivalent
performance. For example, if a 500 gm plastic product made from virgin plastic can
only be substituted by 1 kg of recyclate, then α = 0.5 (Jenseit, Stahl, Wollny, &
Wittlinger, 2003)
50
Depending on the properties and quality of the recyclates and additionally on
the markets existing for the type of resin, each plastic fraction will have a different
substitution factor for instance, PP = α1, PE = α2, PET = α3, PS = α4, PVC =
α5.
For the sake of simplicity, in this study it is assumed that:
α1 = α2 = α3 = α4 = α5 = α
The value of α can lie anywhere between 0 and 1. An α of 0 means that recyclates
do not substitute for any virgin plastics and an α of 1 means that recycled plastic is
of very high quality and will directly substitute for virgin plastic on a 1:1 basis.
The substitution factor α which is dependent on the quality of the recyclates is
very important in this analysis as the benefits from either Scenario A or Scenario B
depend on the products or materials that can be substituted by recyclates.
Taking the substitution factor of the recyclates produced to be α, as shown in Ta-
ble 5.2 the cumulative exergy demand (CExD) for Scenario A is calculated to be:
72.22 + 742.17 αMJ-eq.
5.2.2 Scenario B
To calculate the cumulative exergy demand for Scenario B, the various inputs into
the system need to be considered. To make the basket of outputs for Scenario
B equal that of Scenario A, the inputs into the system are electricity for the Waste
Collection and Transport process, for the Material Recycling Facility (MRF) process,
and for the Granulation Facility process, as well as, input into the Waste-to-Energy
plant to compensate the less heat and electricity being generated in Scenario B. The
CExD values and input quantities are given in Table 5.3. CExD data for incoming
electricity is calculated above and taken to be 3.21 MJ-eq.
51
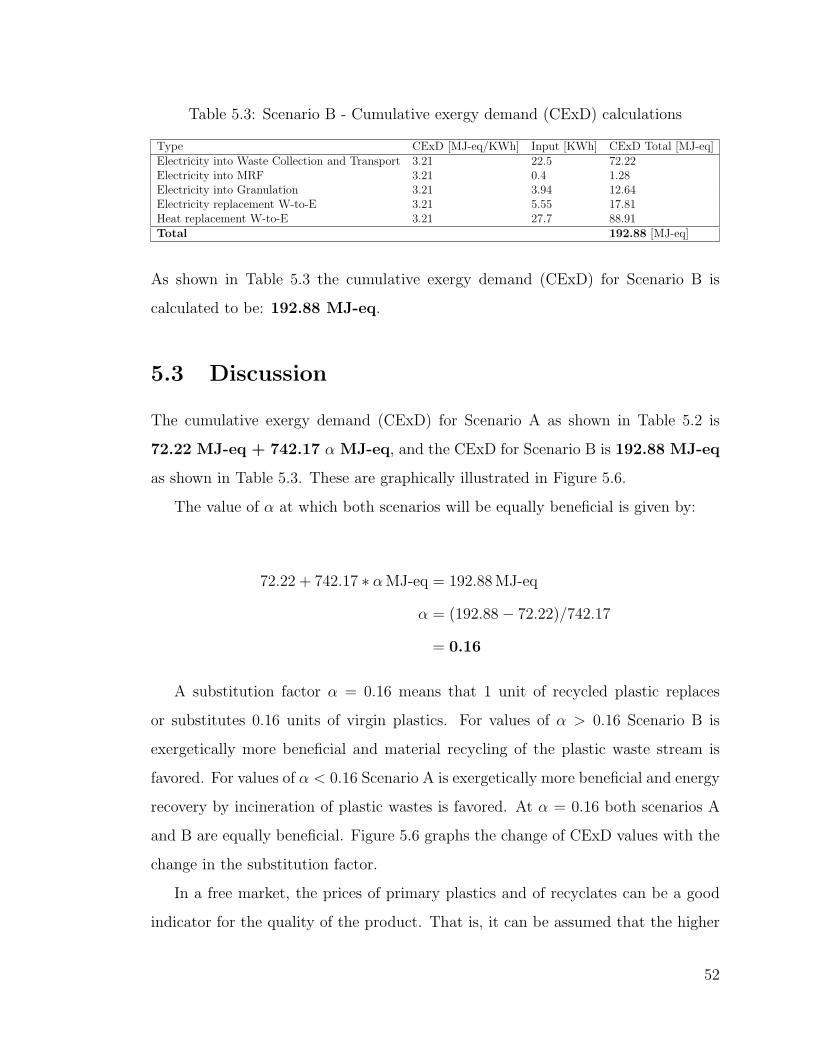
Table 5.3: Scenario B - Cumulative exergy demand (CExD) calculations
Type CExD [MJ-eq/KWh] Input [KWh] CExD Total [MJ-eq]Electricity into Waste Collection and Transport 3.21 22.5 72.22Electricity into MRF 3.21 0.4 1.28Electricity into Granulation 3.21 3.94 12.64Electricity replacement W-to-E 3.21 5.55 17.81Heat replacement W-to-E 3.21 27.7 88.91Total 192.88 [MJ-eq]
As shown in Table 5.3 the cumulative exergy demand (CExD) for Scenario B is
calculated to be: 192.88 MJ-eq.
5.3 Discussion
The cumulative exergy demand (CExD) for Scenario A as shown in Table 5.2 is
72.22 MJ-eq + 742.17 α MJ-eq, and the CExD for Scenario B is 192.88 MJ-eq
as shown in Table 5.3. These are graphically illustrated in Figure 5.6.
The value of α at which both scenarios will be equally beneficial is given by:
72.22 + 742.17 ∗ αMJ-eq = 192.88MJ-eq
α = (192.88− 72.22)/742.17
= 0.16
A substitution factor α = 0.16 means that 1 unit of recycled plastic replaces
or substitutes 0.16 units of virgin plastics. For values of α > 0.16 Scenario B is
exergetically more beneficial and material recycling of the plastic waste stream is
favored. For values of α < 0.16 Scenario A is exergetically more beneficial and energy
recovery by incineration of plastic wastes is favored. At α = 0.16 both scenarios A
and B are equally beneficial. Figure 5.6 graphs the change of CExD values with the
change in the substitution factor.
In a free market, the prices of primary plastics and of recyclates can be a good
indicator for the quality of the product. That is, it can be assumed that the higher
52
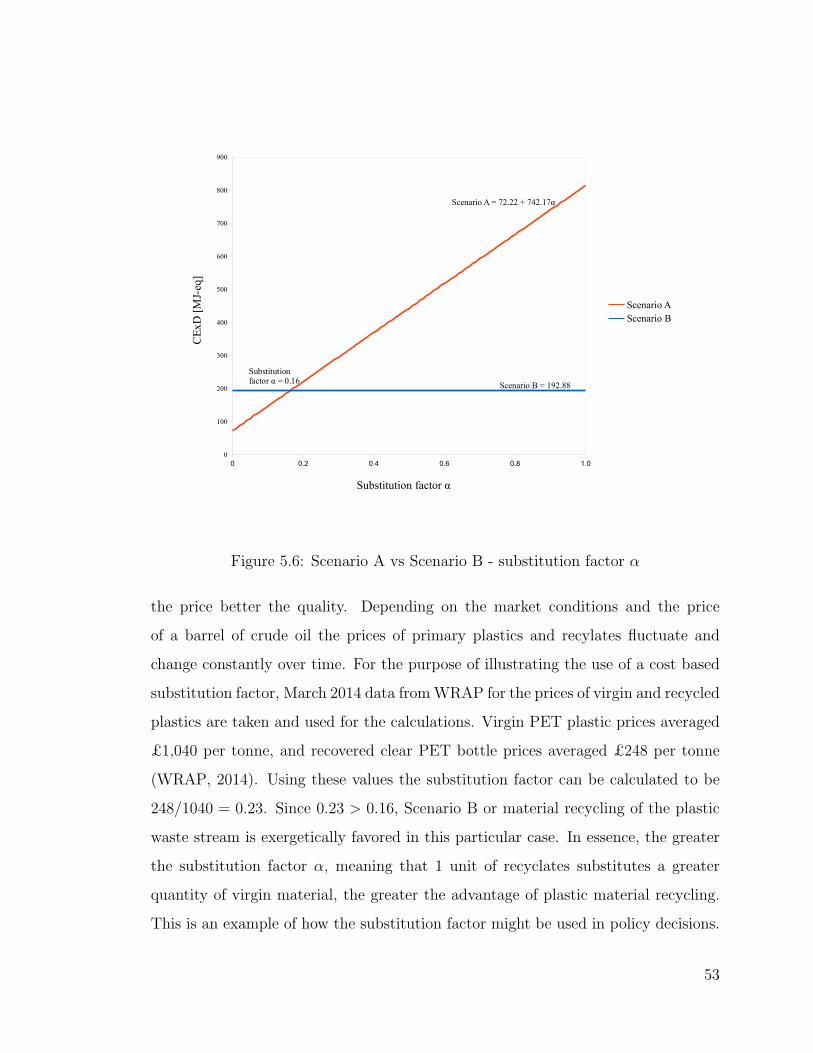
0 0.2 0.4 0.6 0.8 1.00
100
200
300
400
500
600
700
800
900
Scenario AScenario B
Substitution factor α
CE
xD [
MJ-
eq]
Substitution factor α = 0.16
Scenario A = 72.22 + 742.17α
Scenario B = 192.88
Figure 5.6: Scenario A vs Scenario B - substitution factor α
the price better the quality. Depending on the market conditions and the price
of a barrel of crude oil the prices of primary plastics and recylates fluctuate and
change constantly over time. For the purpose of illustrating the use of a cost based
substitution factor, March 2014 data fromWRAP for the prices of virgin and recycled
plastics are taken and used for the calculations. Virgin PET plastic prices averaged
£1,040 per tonne, and recovered clear PET bottle prices averaged £248 per tonne
(WRAP, 2014). Using these values the substitution factor can be calculated to be
248/1040 = 0.23. Since 0.23 > 0.16, Scenario B or material recycling of the plastic
waste stream is exergetically favored in this particular case. In essence, the greater
the substitution factor α, meaning that 1 unit of recyclates substitutes a greater
quantity of virgin material, the greater the advantage of plastic material recycling.
This is an example of how the substitution factor might be used in policy decisions.
53
Chapter 6
Conclusion and further
considerations
Beginning in the 1970s there has been a long tradition of analysis of industrial
metabolism using exergy and the second law of thermodynamics (R. Ayres & Ayres,
2002; J. Dewulf et al., 2008a). However, there do not appear to be many studies
applying these concepts, and in particular the notion of cumulative exergy demand,
to the metabolism of plastics at a systems level. Such studies have been initiated in
(J. P. Dewulf & Van Langenhove, 2004, 2002) and this thesis takes another step in
this direction.
Two competing options for the management of plastic wastes generated by pri-
vate households were analyzed. Scenario A represented the energy recovery option
in which plastics were part of the mixed waste stream and were sent for incineration
to a waste-to-energy plant. Scenario B, on the other hand represented the material
recovery option in which plastics were source separated and sent to a material re-
cycling facility (MRF) and further to a granulation facility to be recycled for use
as substitutes for plastics produced from primary sources. Material flow analysis
and cumulative exergy demand calculations were used to analyze the material and
energy requirements of the two scenarios. System expansion using the equal basket
54
of benefits approach was used to make the two cases comparable.
It is important when comparing the environmental impacts of the two scenarios
to note that neither of the options were better than the other in absolute terms. The
resource depletion brought about by the scenarios is dependent upon the quality
of the recyclates produced and how much plastic from primary production they
replaced as indicated by the substitution factor α. It should be noted that the α is
closely related to numerous factors including the price of crude oil, quality of plastic
recyclates, and the recycling technology.
For values of α < 0.16 Scenario A was the better option exergetically, while for
α > 0.16 scenario B was the favored option. At α = 0.16 both options were equally
favored. Scenario A seemingly requires more exergy mainly due to the high CExD
inputs of plastics from primary production.
This study relates only to waste management options of source separated mixed
plastics. An assessment of the potential effect of managing mixed plastics as part
of a mixed municipal waste stream was beyond the scope of the system. It would
be interesting to study the plastic waste stream within the mixed wastes which ac-
counts for roughly 14% of the total wastes and is much harder to sort and clean due
to contamination from organics and other streams in the mixed waste. Additionally,
data uncertainties were not taken into account and no consideration has been taken
of future changes in the electricity mix, technology improvements, or changes in the
waste fractions. A future refinement of this study, that includes these aspects, as
well as a sensitivity analysis, would be a valuable addition.
CExD is a robust and powerful indicator with which to study resource and waste
management as it takes into account all the useful energy that was consumed in the
creation of a product. Therefore the concept of CExD is a valuable one in assessing
degradation of natural resources and systems. It helps account for the consumption
55
of natural resources using a thermodynamic perspective that takes into account the
second law and entropy production.
In summary, the results indicated that any value of the substitution factor, α,
greater than 0.16 favored the recycling of the plastic waste. The results of the
analysis in this thesis can serve as a guide for planners and policy makers with which
to make an informed decision for the exergetically optimal management of the mixed
plastic waste stream in municipal waste.
56
References
Andrady, A. L., & Neal, M. A. (2009). Applications and societal benefits of plas-
tics. Philosophical Transactions of the Royal Society B: Biological Sciences ,
364 (1526), 1977-1984.
Astrup, T., Fruergaard, T., & Christensen, T. H. (2009). Recycling of plastic: ac-
counting of greenhouse gases and global warming contributions. Waste Man-
agement & Research, 27 (8), 763-772.
Austrian Federal Ministry of Agriculture, E., Forestry, & Management, W. (2010).
Waste-to-energy in austria white book. http://www.umweltnet.at/article/
articleview/29163/1/6956/. (Accessed: 2014-05-15)
Ayres, R., & Ayres, L. (2002). A handbook of industrial ecology. Edward Elgar
Publishing, Incorporated.
Ayres, R., & Warr, B. (2010). The economic growth engine: How energy and work
drive material prosperity. Edward Elgar.
Ayres, R. U., Ayres, L., & Martinas, K. (1996). Eco-thermodynamics: Exergy and
life cycle analysis. INSEAD.
Bendoricchio, G., & Jørgensen, S. E. (1997). Exergy as goal function of ecosystems
dynamic. Ecological Modelling , 102 (1), 5 - 15.
Bosch, M., Hellweg, S., Huijbregts, M. A., & Frischknecht, R. (2007). Applying
cumulative exergy demand (CExD) indicators to the ecoinvent database. The
International Journal of Life Cycle Assessment , 12 (3), 181-190.
Brunner, P. H., & Rechberger, H. (2004). Practical handbook of material flow
analysis. CRC Press LLC, Boca Raton, Florida.
57
Carnahan, W. and American Physical Society and National Science Foundation
(U.S.) and United States. Federal Energy Administration and Electric Power
Research Institute. (1975). Efficient use of energy, a physics perspective: A
report of the summer study on technical aspects of efficient energy utilization.
American Physical Society.
Carnot, S. (1824). Reflexions sur la puissance motrice du feu et sur les machines
propres a developper atte puissance. Bachelier Libraire.
Castellan, G. (1983). Physical chemistry. Addison-Wesley.
Christensen, T., & Fruergaard, T. (2011). Recycling of plastic. In Solid waste
technology and management (Vol. Volume 1. Chapter 5.3, p. 220-233). Wiley.
Dewulf, J., Van Langenhove, H., Muys, B., Bruers, S., Bakshi, B. R., Grubb, G. F.,
. . . Sciubba, E. (2008a). Exergy: Its potential and limitations in environmental
science and technology. Environmental Science & Technology , 42 (7), 2221-
2232.
Dewulf, J., Van Langenhove, H., Muys, B., Bruers, S., Bakshi, B. R., Grubb, G. F.,
. . . Sciubba, E. (2008b). Exergy: Its potential and limitations in environmental
science and technology. Environmental Science & Technology , 42 (7), 2221-
2232.
Dewulf, J. P., & Van Langenhove, H. R. (2002). Quantitative assessment of solid
waste treatment systems in the industrial ecology perspective by exergy anal-
ysis. Environmental Science & Technology , 36 (5), 1130-1135.
Dewulf, J. P., & Van Langenhove, H. R. (2004). Thermodynamic optimization of
the life cycle of plastics by exergy analysis. Int. J. Energy Res., 28 , 969-976.
Duhem, P. (1886). Le potentiel thermodynamique et ses applications a la mecanique
chimique et a l’etude des phenomenes electriques. A. Hermann.
E-Control. (2013). Stromkennzeichnungsbericht 2013. http://www.e-control.at/
portal/page/portal/medienbibliothek/oeko-energie/dokumente/pdfs/
Stromkennzeichnungsbericht2013.pdf. (Accessed: 2014-05-15)
Ecoplast. (2014). Ecoplast kunststoffrecycling gmbh. http://www.ecoplast.com/
58
index.php/recycling/ratgeber/?lang=en. (Accessed: 2014-05-15)
Edwards, R., Larive, J.-F., Mahieu, V., & Rouveirolles, P. (2007). Well-to-wheels
analysis of future automotive fuels and powertrains in the european context.
http://ies.jrc.ec.europa.eu/WTW. (Accessed: 2014-05-10)
Fath, B. D., Patten, B. C., & Choi, J. S. (2001). Complementarity of ecological goal
functions. Journal of Theoretical Biology , 208 (4), 493 - 506.
Feynman, R., Leighton, R., Sands, M., & Gottlieb, M. (1963). The Feynman
lectures on physics: Mainly mechanics, radiation, and heat: Supplement.
Pearson/Addison-Wesley.
Georgescu-Roegen, N. (1971). The entropy law and the economic process. Harvard
University Press.
Gibbs, J. (1871). A method of geometrical representation of the thermodynamic
properties of substances by means of surfaces. The Academy.
Gibbs, J. (1957). The collected works of J. Willard Gibbs (No. v. 1). Yale University
Press.
Holdgate, M. W. (1987, 8). Our common future: The report of the world commission
on environment and development. Environmental Conservation, 14 , 282–282.
Hopewell, J., Dvorak, R., & Kosior, E. (2009). Plastics recycling: challenges and
opportunities. Philosophical Transactions of the Royal Society B: Biological
Sciences , 364 (1526), 2115-2126.
Hydro, E. W. (2011). Hydro in europe: Powering renewables, an-
nexes. http://www.eurelectric.org/media/26700/hydro in europe -
annexes-2011-160-0012-01-e.pdf. (Accessed: 2014-05-20)
Jenseit, W., Stahl, H., Wollny, V., & Wittlinger, R. (2003). Recovery options from
plastic parts from end-of-life vehicles: An eco-efficiency assessment. http://
www.oeko.de/oekodoc/151/2003-039-en.pdf. Oko-Institute e.V. (Accessed:
2014-05-10)
MA48. (2011). Leistungsbericht 2011. http://www.wien.gv.at/umwelt/ma48/
service/publikationen/pdf/leistungsbericht-ma48-2011.pdf. (Ac-
59

cessed: 2014-05-10)
Meadows, D., Meadows, D., Randers, J., & Behrens, W. (1974). The limits to
growth: a report for the club of rome’s project on the predicament of mankind.
Universe Books.
Murphy, M., & O’Neill, L. (1997). What is life? the next fifty years: Speculations
on the future of biology. Cambridge University Press.
PlasticsEurope. (2014). The plastics portal. http://www.plasticseurope.org/.
(Accessed: 2014-05-01)
Plastic Waste Management Institute (PWMI). (2014). An introduction to plastic
recycling (2009). http://www.pwmi.or.jp/ei/index.htm. (Accessed: 2014-
05-01)
Rant, Z. (1956). Exergie, ein neues wort fur “technische arbeitsfahigkeit”. Forschung
im Ingenieurwesen, 22 , 36-37.
Schneider, E., & Kay, J. (1994). Life as a manifestation of the second law of
thermodynamics. Mathematical and Computer Modelling , 19 (68), 25 - 48.
Schrodinger, E. (1955). What is life?: the physical aspect of the living cell. The
University Press.
Shen, L., Worrell, E., & Patel, M. K. (2010). Open-loop recycling: A lca case study
of pet bottle-to-fibre recycling. Resources, Conservation and Recycling , 55 (1),
34-52.
Spliethoff, H. (2010). Power generation from solid fuels. Springer-Verlag, Berlin.
Szargut, J. (2005). Exergy method: technical and ecological applications. WIT.
Szargut, J., Morris, D., & Steward, F. (1987). Exergy analysis of thermal, chemical,
and metallurgical processes.
Szargut, J., & Morris, D. R. (1987). Cumulative exergy consumption and cumulative
degree of perfection of chemical processes. International Journal of Energy
Research, 11 (2), 245–261.
Themelis, N., Castaldi, M., Bhatti, J., & Arsova, L. (2011). Energy
and economic value of nonrecycled plastics (nrp) and municipal solid
60
wastes (msw) that are currently landfilled in the fifty states. http://
plastics.americanchemistry.com/Education-Resources/Publications/
Report-from-Columbia-Universitys-Earth-Engineering-Center.pdf.
(Accessed: 2014-05-15)
UNEP. (2011). Decoupling natural resource use and environmental impacts from eco-
nomic growth. http://www.unep.org/resourcepanel/decoupling/files/
pdf/decoupling report english.pdf. (Accessed: 2014-05-05)
United States. Congress. Joint Committee on Atomic Energy. (1973). Understanding
the “national energy dilemma.”. U.S. Govt. Print. Off.
Vandermeersch, T., Alvarenga, R., Ragaert, P., & Dewulf, J. (2014). Environmen-
tal sustainability assessment of food waste valorization options. Resources,
Conservation and Recycling , 87 (0), 57 - 64.
Waser, J., Trueblood, K., & Knobler, C. (1976). Chem one. McGraw-Hill Compa-
nies.
WRAP. (2008, June). Lca of management options for mixed waste plastics.
http://www.wrap.org.uk/sites/files/wrap/LCA\%20of\%20Management\
%20Options\%20for\%20Mixed\%20Waste\%20Plastics.pdf. (Accessed:
2014-05-05)
WRAP. (2014). Waste & resources action programme (wrap). http://www.wrap
.org.uk/. (Accessed: 2014-05-05)
61
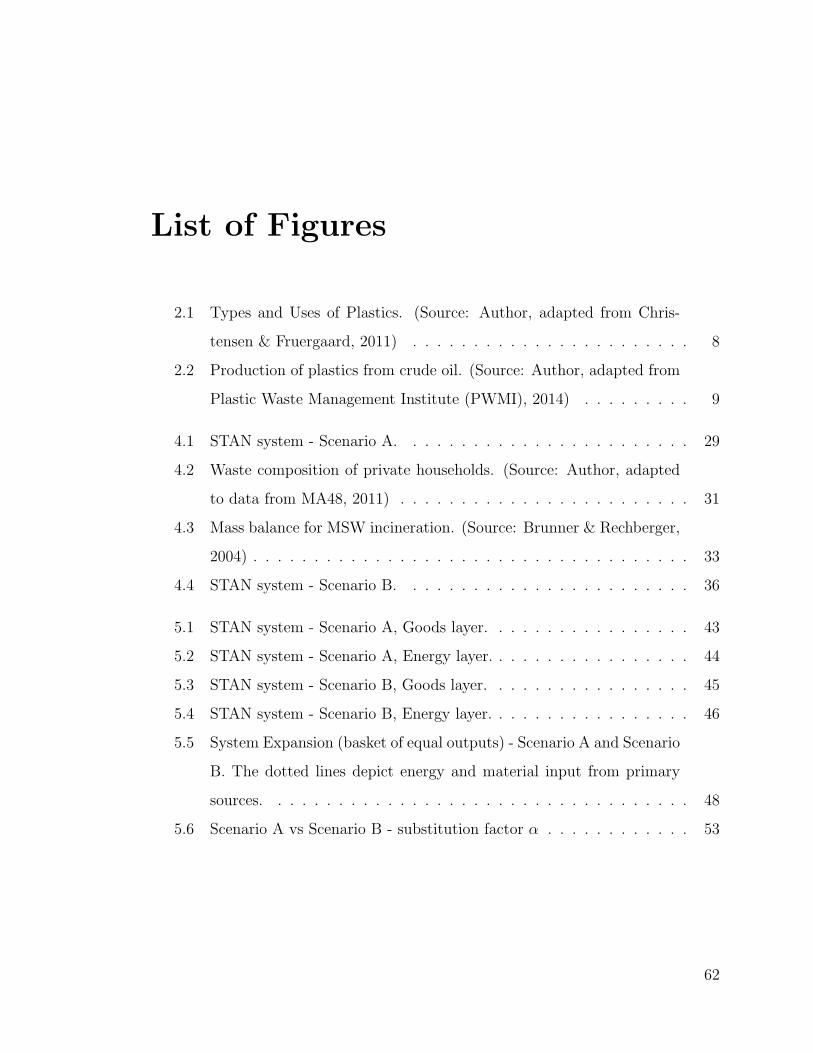
List of Figures
2.1 Types and Uses of Plastics. (Source: Author, adapted from Chris-
tensen & Fruergaard, 2011) . . . . . . . . . . . . . . . . . . . . . . . 8
2.2 Production of plastics from crude oil. (Source: Author, adapted from
Plastic Waste Management Institute (PWMI), 2014) . . . . . . . . . 9
4.1 STAN system - Scenario A. . . . . . . . . . . . . . . . . . . . . . . . 29
4.2 Waste composition of private households. (Source: Author, adapted
to data from MA48, 2011) . . . . . . . . . . . . . . . . . . . . . . . . 31
4.3 Mass balance for MSW incineration. (Source: Brunner & Rechberger,
2004) . . . . . . . . . . . . . . . . . . . . . . . . . . . . . . . . . . . . 33
4.4 STAN system - Scenario B. . . . . . . . . . . . . . . . . . . . . . . . 36
5.1 STAN system - Scenario A, Goods layer. . . . . . . . . . . . . . . . . 43
5.2 STAN system - Scenario A, Energy layer. . . . . . . . . . . . . . . . . 44
5.3 STAN system - Scenario B, Goods layer. . . . . . . . . . . . . . . . . 45
5.4 STAN system - Scenario B, Energy layer. . . . . . . . . . . . . . . . . 46
5.5 System Expansion (basket of equal outputs) - Scenario A and Scenario
B. The dotted lines depict energy and material input from primary
sources. . . . . . . . . . . . . . . . . . . . . . . . . . . . . . . . . . . 48
5.6 Scenario A vs Scenario B - substitution factor α . . . . . . . . . . . . 53
62
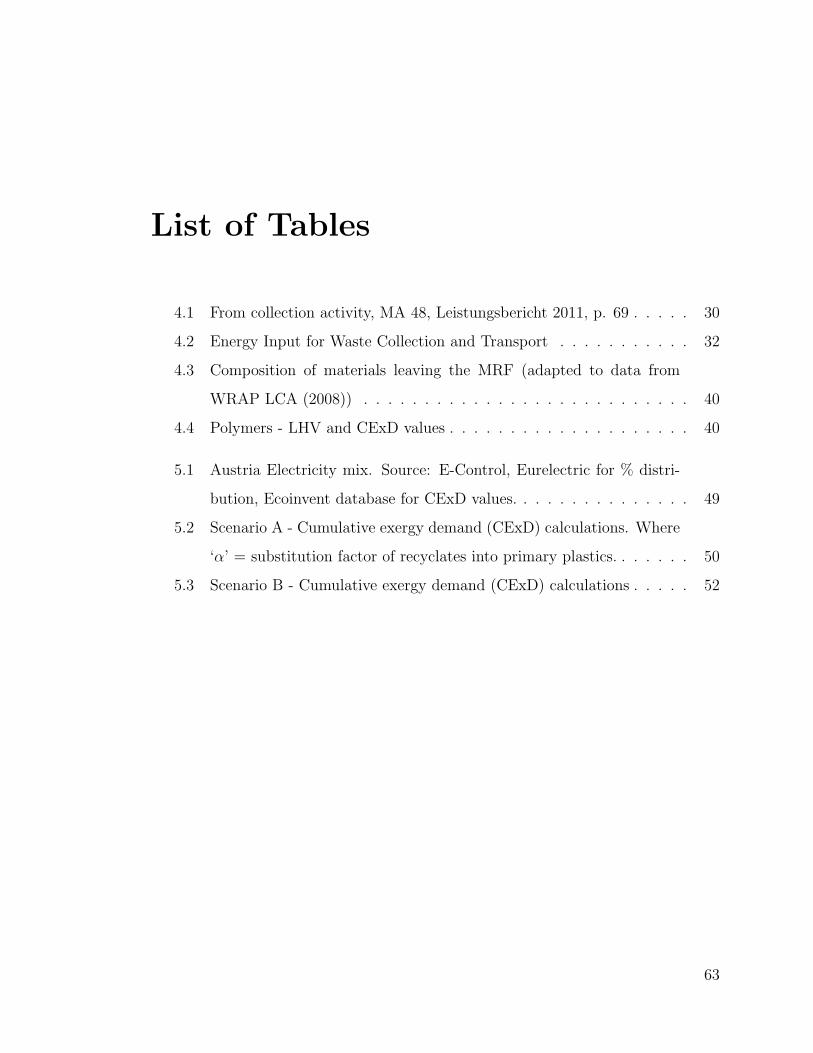
List of Tables
4.1 From collection activity, MA 48, Leistungsbericht 2011, p. 69 . . . . . 30
4.2 Energy Input for Waste Collection and Transport . . . . . . . . . . . 32
4.3 Composition of materials leaving the MRF (adapted to data from
WRAP LCA (2008)) . . . . . . . . . . . . . . . . . . . . . . . . . . . 40
4.4 Polymers - LHV and CExD values . . . . . . . . . . . . . . . . . . . . 40
5.1 Austria Electricity mix. Source: E-Control, Eurelectric for % distri-
bution, Ecoinvent database for CExD values. . . . . . . . . . . . . . . 49
5.2 Scenario A - Cumulative exergy demand (CExD) calculations. Where
‘α’ = substitution factor of recyclates into primary plastics. . . . . . . 50
5.3 Scenario B - Cumulative exergy demand (CExD) calculations . . . . . 52
63


![[IJCST-V3I3P35]: Ankit Kandpal, Vishal Ramola](https://img.pdfslide.us/doc/110x75/55cf8a8a55034654898b8969/ijcst-v3i3p35-ankit-kandpal-vishal-ramola.jpg)