Embed Size (px)
Citation preview

252y0821a 3/31/08
Output for the last Take-home problemAbout 60 Pages – You may want to print only your problem.
————— 4/4/2008 9:04:29 PM ———————————————————— Welcome to Minitab, press F1 for help.MTB > WOpen "C:\Documents and Settings\RBOVE\My Documents\Minitab\252x0821-02V1.MTW". Version 1 – Only data printouts are shown.Retrieving worksheet from file: 'C:\Documents and Settings\RBOVE\MyDocuments\Minitab\252x0821-02V1.MTW'Worksheet was saved on Wed Apr 02 2008
Results for: 252x0821-02V1.MTWMTB > Execute "C:\Documents and Settings\RBOVE\My Documents\Minitab\252x0822.mtb" 1.Executing from file: C:\Documents and Settings\RBOVE\My Documents\Minitab\252x0822.mtb Descriptive Statistics: Fat, Fit, diff Variable N N* Mean SE Mean StDev Minimum Q1 Median Q3Fat 13 0 4.613 0.197 0.711 3.120 4.140 4.740 5.200Fit 13 0 6.411 0.123 0.442 5.710 6.100 6.380 6.605diff 13 0 -1.798 0.211 0.761 -2.960 -2.505 -2.000 -1.195
Variable MaximumFat 5.530Fit 7.320diff -0.400 Covariances: Fat, Fit Diagonal Items are Variances. Fat FitFat 0.505090Fit 0.060514 0.195241 Data Display Row Fat fatsq Fit fitsq diff diffsq 1 4.24 17.9776 6.42 41.2164 -2.18 4.7524 2 4.74 22.4676 7.32 53.5824 -2.58 6.6564 3 4.93 24.3049 6.38 40.7044 -1.45 2.1025 4 4.16 17.3056 6.16 37.9456 -2.00 4.0000 5 5.53 30.5809 5.93 35.1649 -0.40 0.1600 6 4.12 16.9744 7.08 50.1264 -2.96 8.7616 7 5.10 26.0100 6.37 40.5769 -1.27 1.6129 8 4.47 19.9809 6.53 42.6409 -2.06 4.2436 9 5.30 28.0900 6.68 44.6224 -1.38 1.9044 10 3.12 9.7344 5.71 32.6041 -2.59 6.7081 11 3.77 14.2129 6.20 38.4400 -2.43 5.9049 12 5.09 25.9081 6.04 36.4816 -0.95 0.9025 13 5.40 29.1600 6.52 42.5104 -1.12 1.2544 Sum of Fat Sum of Fat = 59.97 Sum of Squares of Fat Sum of squares (uncorrected) of Fat = 282.707
Sum of fatsq Sum of fatsq = 282.707
Sum of Fit Sum of Fit = 83.34
1

252y0821a 3/31/08
Sum of Squares of Fit Version 1Sum of squares (uncorrected) of Fit = 536.616
Sum of fitsq Sum of fitsq = 536.616
Sum of diff Sum of diff = -23.37 Sum of Squares of diff Sum of squares (uncorrected) of diff = 48.9637 Sum of diffsq Sum of diffsq = 48.9637
Two-Sample T-Test and CI: Fat, Fit Two-sample T for Fat vs Fit N Mean StDev SE MeanFat 13 4.613 0.711 0.20Fit 13 6.411 0.442 0.12Difference = mu (Fat) - mu (Fit)Estimate for difference: -1.79895% upper bound for difference: -1.401T-Test of difference = 0 (vs <): T-Value = -7.75 P-Value = 0.000 DF = 24Both use Pooled StDev = 0.5917 Two-Sample T-Test and CI: Fat, Fit Two-sample T for Fat vs Fit N Mean StDev SE MeanFat 13 4.613 0.711 0.20Fit 13 6.411 0.442 0.12Difference = mu (Fat) - mu (Fit)Estimate for difference: -1.79895% upper bound for difference: -1.397T-Test of difference = 0 (vs <): T-Value = -7.75 P-Value = 0.000 DF = 20 Test for Equal Variances: Fat, Fit 95% Bonferroni confidence intervals for standard deviations N Lower StDev UpperFat 13 0.487243 0.710697 1.27091Fit 13 0.302933 0.441861 0.79016
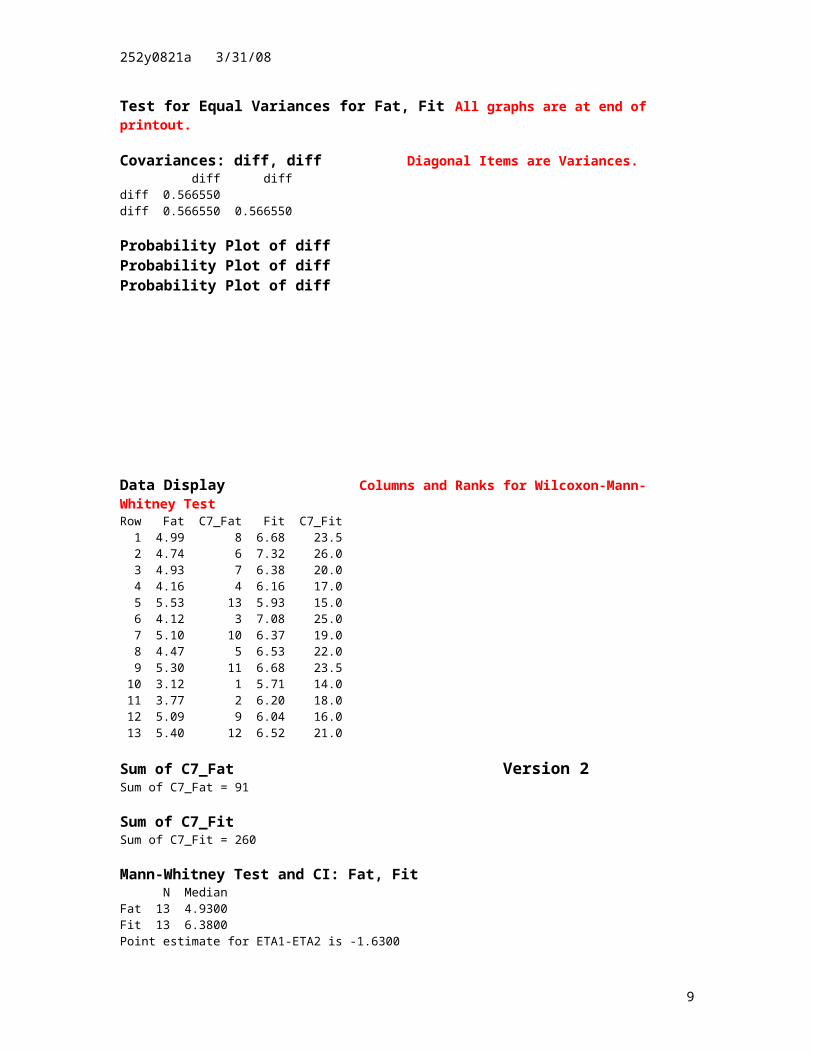
F-Test (Normal Distribution)Test statistic = 2.59, p-value = 0.113Levene's Test (Any Continuous Distribution)Test statistic = 3.40, p-value = 0.078Test for Equal Variances for Fat, Fit All graphs are at end of printout.. Covariances: diff, diff Diagonal Items are Variances. diff diffdiff 0.579303diff 0.579303 0.579303 Probability Plot of diff Probability Plot of diff Probability Plot of diff
2

252y0821a 3/31/08
Data Display Columns and Ranks for Wilcoxon-Mann-Whitney TestRow Fat C7_Fat Fit C7_Fit 1 4.24 5 6.42 21 2 4.74 7 7.32 26 3 4.93 8 6.38 20 4 4.16 4 6.16 17 5 5.53 13 5.93 15 6 4.12 3 7.08 25 7 5.10 10 6.37 19 8 4.47 6 6.53 23 9 5.30 11 6.68 24 10 3.12 1 5.71 14 11 3.77 2 6.20 18 12 5.09 9 6.04 16 13 5.40 12 6.52 22 Sum of C7_Fat Version 1Sum of C7_Fat = 91 Sum of C7_Fit Sum of C7_Fit = 260
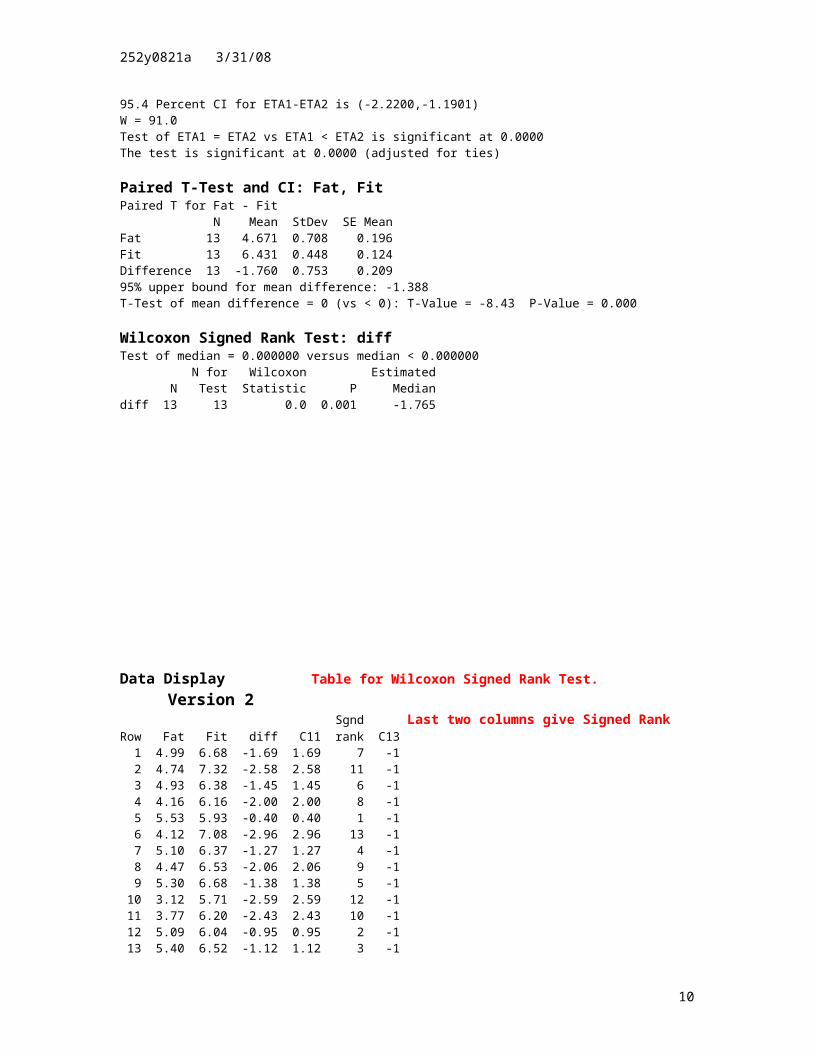
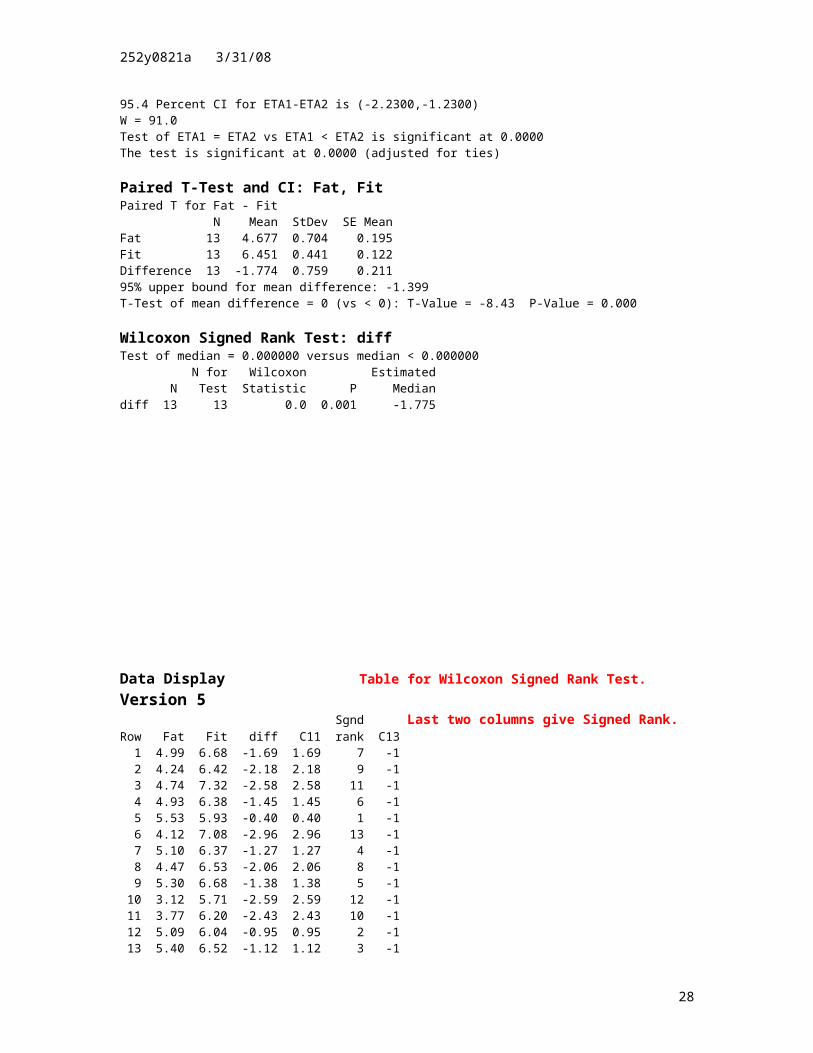
Mann-Whitney Test and CI: Fat, Fit N MedianFat 13 4.7400Fit 13 6.3800Point estimate for ETA1-ETA2 is -1.750095.4 Percent CI for ETA1-ETA2 is (-2.2598,-1.2297)W = 91.0Test of ETA1 = ETA2 vs ETA1 < ETA2 is significant at 0.0000 Paired T-Test and CI: Fat, Fit Paired T for Fat - Fit N Mean StDev SE MeanFat 13 4.613 0.711 0.197Fit 13 6.411 0.442 0.123Difference 13 -1.798 0.761 0.21195% upper bound for mean difference: -1.421T-Test of mean difference = 0 (vs < 0): T-Value = -8.52 P-Value = 0.000 Wilcoxon Signed Rank Test: diff Test of median = 0.000000 versus median < 0.000000 N for Wilcoxon Estimated N Test Statistic P Mediandiff 13 13 0.0 0.001 -1.780
3

252y0821a 3/31/08
Data Display Table for Wilcoxon Signed Rank Test. Version 1 Sgnd Last two columns give Signed Rank Row Fat Fit diff C11 rank C13 1 4.24 6.42 -2.18 2.18 9 -1 2 4.74 7.32 -2.58 2.58 11 -1 3 4.93 6.38 -1.45 1.45 6 -1 4 4.16 6.16 -2.00 2.00 7 -1 5 5.53 5.93 -0.40 0.40 1 -1 6 4.12 7.08 -2.96 2.96 13 -1 7 5.10 6.37 -1.27 1.27 4 -1 8 4.47 6.53 -2.06 2.06 8 -1 9 5.30 6.68 -1.38 1.38 5 -1 10 3.12 5.71 -2.59 2.59 12 -1 11 3.77 6.20 -2.43 2.43 10 -1 12 5.09 6.04 -0.95 0.95 2 -1 13 5.40 6.52 -1.12 1.12 3 -1
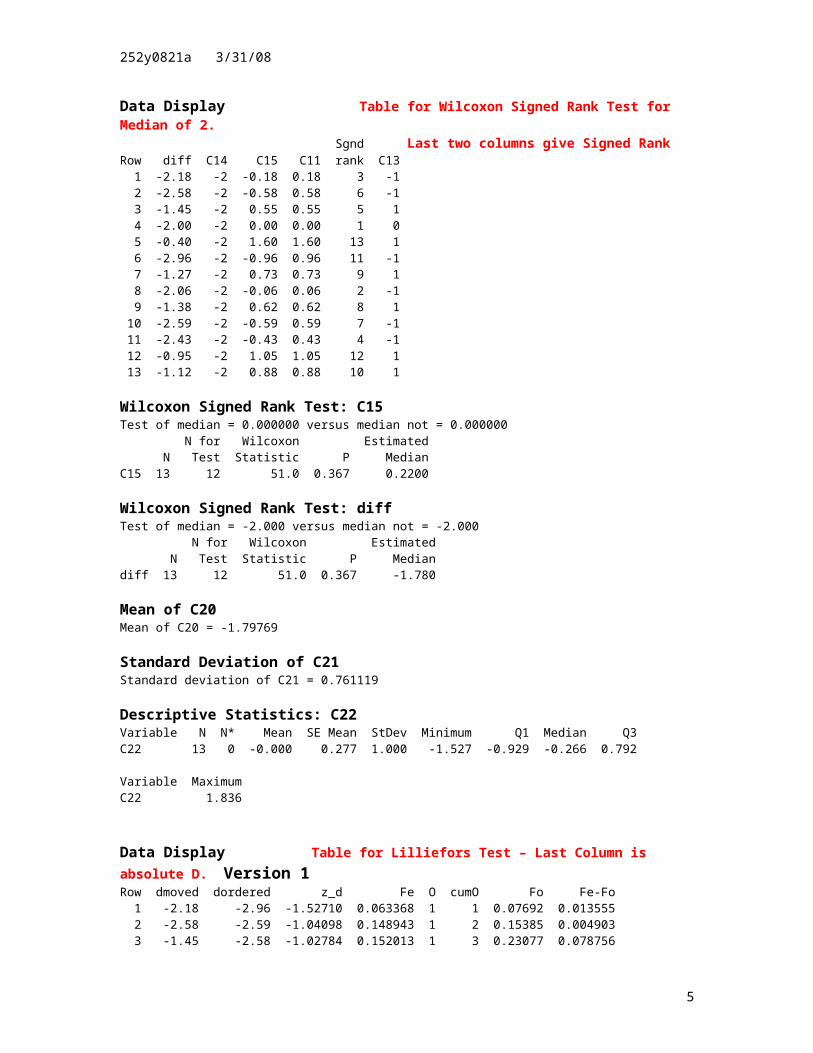
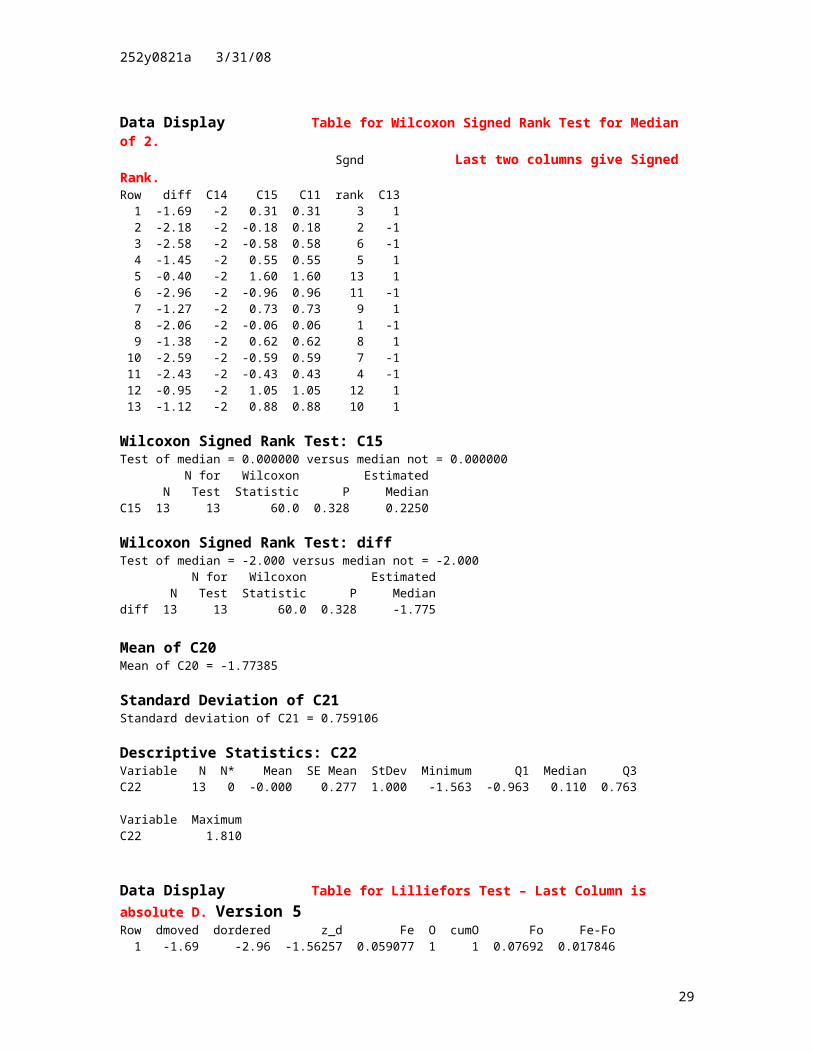
Data Display Table for Wilcoxon Signed Rank Test for Median of 2. Sgnd Last two columns give Signed RankRow diff C14 C15 C11 rank C13 1 -2.18 -2 -0.18 0.18 3 -1 2 -2.58 -2 -0.58 0.58 6 -1 3 -1.45 -2 0.55 0.55 5 1 4 -2.00 -2 0.00 0.00 1 0 5 -0.40 -2 1.60 1.60 13 1 6 -2.96 -2 -0.96 0.96 11 -1 7 -1.27 -2 0.73 0.73 9 1 8 -2.06 -2 -0.06 0.06 2 -1 9 -1.38 -2 0.62 0.62 8 1 10 -2.59 -2 -0.59 0.59 7 -1 11 -2.43 -2 -0.43 0.43 4 -1 12 -0.95 -2 1.05 1.05 12 1 13 -1.12 -2 0.88 0.88 10 1 Wilcoxon Signed Rank Test: C15 Test of median = 0.000000 versus median not = 0.000000 N for Wilcoxon Estimated N Test Statistic P MedianC15 13 12 51.0 0.367 0.2200 Wilcoxon Signed Rank Test: diff Test of median = -2.000 versus median not = -2.000 N for Wilcoxon Estimated N Test Statistic P Mediandiff 13 12 51.0 0.367 -1.780
Mean of C20 Mean of C20 = -1.79769 Standard Deviation of C21 Standard deviation of C21 = 0.761119
Descriptive Statistics: C22 Variable N N* Mean SE Mean StDev Minimum Q1 Median Q3C22 13 0 -0.000 0.277 1.000 -1.527 -0.929 -0.266 0.792
Variable MaximumC22 1.836
4
252y0821a 3/31/08
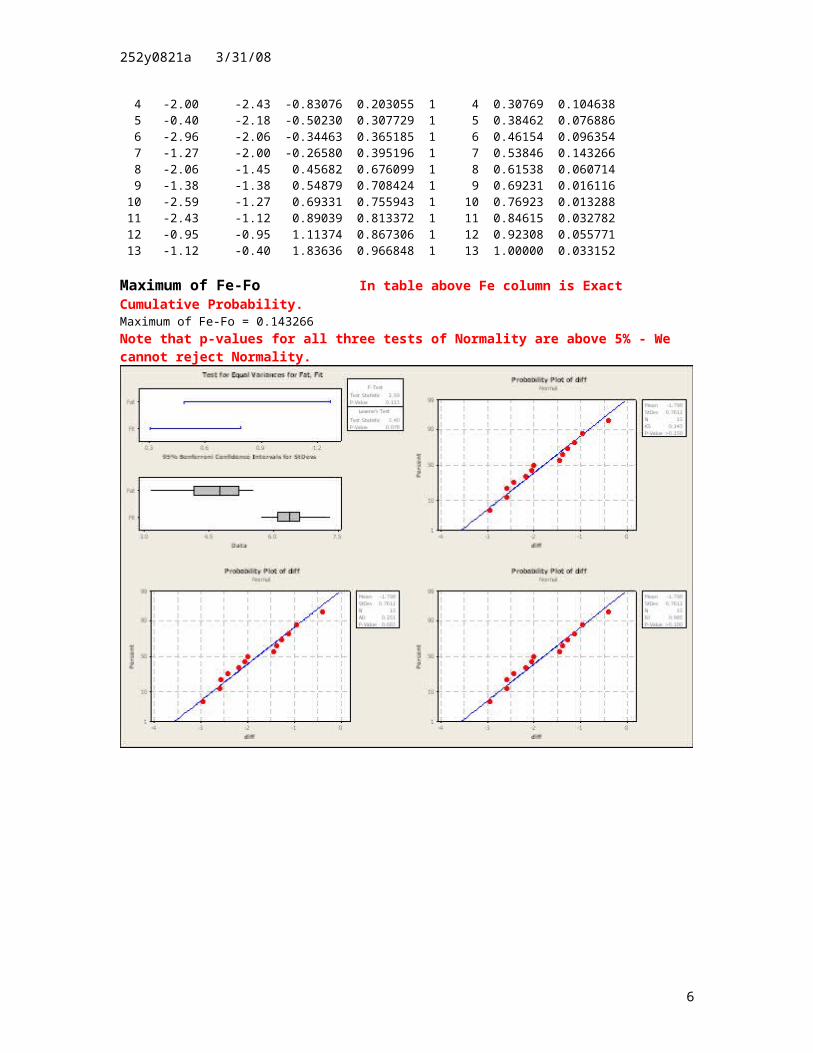
Data Display Table for Lilliefors Test – Last Column is absolute D. Version 1Row dmoved dordered z_d Fe O cumO Fo Fe-Fo 1 -2.18 -2.96 -1.52710 0.063368 1 1 0.07692 0.013555 2 -2.58 -2.59 -1.04098 0.148943 1 2 0.15385 0.004903 3 -1.45 -2.58 -1.02784 0.152013 1 3 0.23077 0.078756 4 -2.00 -2.43 -0.83076 0.203055 1 4 0.30769 0.104638 5 -0.40 -2.18 -0.50230 0.307729 1 5 0.38462 0.076886 6 -2.96 -2.06 -0.34463 0.365185 1 6 0.46154 0.096354 7 -1.27 -2.00 -0.26580 0.395196 1 7 0.53846 0.143266 8 -2.06 -1.45 0.45682 0.676099 1 8 0.61538 0.060714 9 -1.38 -1.38 0.54879 0.708424 1 9 0.69231 0.016116 10 -2.59 -1.27 0.69331 0.755943 1 10 0.76923 0.013288 11 -2.43 -1.12 0.89039 0.813372 1 11 0.84615 0.032782 12 -0.95 -0.95 1.11374 0.867306 1 12 0.92308 0.055771 13 -1.12 -0.40 1.83636 0.966848 1 13 1.00000 0.033152 Maximum of Fe-Fo In table above Fe column is Exact Cumulative Probability. Maximum of Fe-Fo = 0.143266Note that p-values for all three tests of Normality are above 5% - We cannot reject Normality.
5
252y0821a 3/31/08
MTB > WOpen "C:\Documents and Settings\RBOVE\My Documents\Minitab\252x0821-02V2.MTW". Version 2 – Only data printouts are shown.Retrieving worksheet from file: 'C:\Documents and Settings\RBOVE\MyDocuments\Minitab\252x0821-02V2.MTW'Worksheet was saved on Wed Apr 02 2008Results for: 252x0821-02V2.MTWMTB > exec "252x0822.mtb"Executing from file: 252x0822.mtb Descriptive Statistics: Fat, Fit, diff Variable N N* Mean SE Mean StDev Minimum Q1 Median Q3Fat 13 0 4.671 0.196 0.708 3.120 4.140 4.930 5.200Fit 13 0 6.431 0.124 0.448 5.710 6.100 6.380 6.680diff 13 0 -1.760 0.209 0.753 -2.960 -2.505 -1.690 -1.195
Variable MaximumFat 5.530Fit 7.320diff -0.400 Covariances: Fat, Fit Diagonal Items are Variances. Fat FitFat 0.501724Fit 0.068008 0.200841
Data Display Row Fat fatsq Fit fitsq diff diffsq 1 4.99 24.9001 6.68 44.6224 -1.69 2.8561 2 4.74 22.4676 7.32 53.5824 -2.58 6.6564 3 4.93 24.3049 6.38 40.7044 -1.45 2.1025 4 4.16 17.3056 6.16 37.9456 -2.00 4.0000 5 5.53 30.5809 5.93 35.1649 -0.40 0.1600 6 4.12 16.9744 7.08 50.1264 -2.96 8.7616 7 5.10 26.0100 6.37 40.5769 -1.27 1.6129 8 4.47 19.9809 6.53 42.6409 -2.06 4.2436 9 5.30 28.0900 6.68 44.6224 -1.38 1.9044 10 3.12 9.7344 5.71 32.6041 -2.59 6.7081 11 3.77 14.2129 6.20 38.4400 -2.43 5.9049 12 5.09 25.9081 6.04 36.4816 -0.95 0.9025 13 5.40 29.1600 6.52 42.5104 -1.12 1.2544 Sum of Fat Sum of Fat = 60.72 Sum of Squares of Fat Sum of squares (uncorrected) of Fat = 289.630 Sum of fatsq Sum of fatsq = 289.630 Sum of Fit Sum of Fit = 83.6
Sum of Squares of Fit Sum of squares (uncorrected) of Fit = 540.022
Sum of fitsq Sum of fitsq = 540.022
6

252y0821a 3/31/08
Sum of diff Version 2Sum of diff = -22.88 Sum of Squares of diff Sum of squares (uncorrected) of diff = 47.0674 Sum of diffsq Sum of diffsq = 47.0674 Two-Sample T-Test and CI: Fat, Fit Two-sample T for Fat vs Fit N Mean StDev SE MeanFat 13 4.671 0.708 0.20Fit 13 6.431 0.448 0.12Difference = mu (Fat) - mu (Fit)Estimate for difference: -1.76095% upper bound for difference: -1.362T-Test of difference = 0 (vs <): T-Value = -7.57 P-Value = 0.000 DF = 24Both use Pooled StDev = 0.5927 Two-Sample T-Test and CI: Fat, Fit Two-sample T for Fat vs Fit N Mean StDev SE MeanFat 13 4.671 0.708 0.20Fit 13 6.431 0.448 0.12Difference = mu (Fat) - mu (Fit)Estimate for difference: -1.76095% upper bound for difference: -1.359T-Test of difference = 0 (vs <): T-Value = -7.57 P-Value = 0.000 DF = 20 Test for Equal Variances: Fat, Fit 95% Bonferroni confidence intervals for standard deviations N Lower StDev UpperFat 13 0.485617 0.708325 1.26667Fit 13 0.307247 0.448153 0.80142F-Test (Normal Distribution)Test statistic = 2.50, p-value = 0.127Levene's Test (Any Continuous Distribution)Test statistic = 1.58, p-value = 0.221Test for Equal Variances for Fat, Fit All graphs are at end of printout.
Covariances: diff, diff Diagonal Items are Variances. diff diffdiff 0.566550diff 0.566550 0.566550 Probability Plot of diff Probability Plot of diff Probability Plot of diff
7

252y0821a 3/31/08
Data Display Columns and Ranks for Wilcoxon-Mann-Whitney TestRow Fat C7_Fat Fit C7_Fit 1 4.99 8 6.68 23.5 2 4.74 6 7.32 26.0 3 4.93 7 6.38 20.0 4 4.16 4 6.16 17.0 5 5.53 13 5.93 15.0 6 4.12 3 7.08 25.0 7 5.10 10 6.37 19.0 8 4.47 5 6.53 22.0 9 5.30 11 6.68 23.5 10 3.12 1 5.71 14.0 11 3.77 2 6.20 18.0 12 5.09 9 6.04 16.0 13 5.40 12 6.52 21.0 Sum of C7_Fat Version 2Sum of C7_Fat = 91 Sum of C7_Fit Sum of C7_Fit = 260 Mann-Whitney Test and CI: Fat, Fit N MedianFat 13 4.9300Fit 13 6.3800Point estimate for ETA1-ETA2 is -1.630095.4 Percent CI for ETA1-ETA2 is (-2.2200,-1.1901)W = 91.0Test of ETA1 = ETA2 vs ETA1 < ETA2 is significant at 0.0000The test is significant at 0.0000 (adjusted for ties) Paired T-Test and CI: Fat, Fit Paired T for Fat - Fit N Mean StDev SE MeanFat 13 4.671 0.708 0.196Fit 13 6.431 0.448 0.124Difference 13 -1.760 0.753 0.20995% upper bound for mean difference: -1.388T-Test of mean difference = 0 (vs < 0): T-Value = -8.43 P-Value = 0.000 Wilcoxon Signed Rank Test: diff Test of median = 0.000000 versus median < 0.000000 N for Wilcoxon Estimated N Test Statistic P Mediandiff 13 13 0.0 0.001 -1.765
8
252y0821a 3/31/08
Data Display Table for Wilcoxon Signed Rank Test. Version 2 Sgnd Last two columns give Signed RankRow Fat Fit diff C11 rank C13 1 4.99 6.68 -1.69 1.69 7 -1 2 4.74 7.32 -2.58 2.58 11 -1 3 4.93 6.38 -1.45 1.45 6 -1 4 4.16 6.16 -2.00 2.00 8 -1 5 5.53 5.93 -0.40 0.40 1 -1 6 4.12 7.08 -2.96 2.96 13 -1 7 5.10 6.37 -1.27 1.27 4 -1 8 4.47 6.53 -2.06 2.06 9 -1 9 5.30 6.68 -1.38 1.38 5 -1 10 3.12 5.71 -2.59 2.59 12 -1 11 3.77 6.20 -2.43 2.43 10 -1 12 5.09 6.04 -0.95 0.95 2 -1 13 5.40 6.52 -1.12 1.12 3 -1 Data Display Table for Wilcoxon Signed Rank Test for Median of 2. Sgnd Last two columns give Signed RankRow diff C14 C15 C11 rank C13 1 -1.69 -2 0.31 0.31 3 1 2 -2.58 -2 -0.58 0.58 6 -1 3 -1.45 -2 0.55 0.55 5 1 4 -2.00 -2 0.00 0.00 1 0 5 -0.40 -2 1.60 1.60 13 1 6 -2.96 -2 -0.96 0.96 11 -1 7 -1.27 -2 0.73 0.73 9 1 8 -2.06 -2 -0.06 0.06 2 -1 9 -1.38 -2 0.62 0.62 8 1 10 -2.59 -2 -0.59 0.59 7 -1 11 -2.43 -2 -0.43 0.43 4 -1 12 -0.95 -2 1.05 1.05 12 1 13 -1.12 -2 0.88 0.88 10 1 Wilcoxon Signed Rank Test: C15 Test of median = 0.000000 versus median not = 0.000000 N for Wilcoxon Estimated N Test Statistic P MedianC15 13 12 53.0 0.290 0.2350 Wilcoxon Signed Rank Test: diff Test of median = -2.000 versus median not = -2.000 N for Wilcoxon Estimated N Test Statistic P Mediandiff 13 12 53.0 0.290 -1.765
Mean of C20 Mean of C20 = -1.76 Standard Deviation of C21 Standard deviation of C21 = 0.752695
Descriptive Statistics: C22 Variable N N* Mean SE Mean StDev Minimum Q1 Median Q3C22 13 0 -0.000 0.277 1.000 -1.594 -0.990 0.093 0.751
Variable MaximumC22 1.807
9
252y0821a 3/31/08
Data Display Table for Lilliefors Test – Last Column is absolute D. Version 2Row dmoved dordered z_d Fe O cumO Fo Fe-Fo 1 -1.69 -2.96 -1.59427 0.055438 1 1 0.07692 0.021485 2 -2.58 -2.59 -1.10270 0.135078 1 2 0.15385 0.018768 3 -1.45 -2.58 -1.08942 0.137985 1 3 0.23077 0.092785 4 -2.00 -2.43 -0.89013 0.186697 1 4 0.30769 0.120995 5 -0.40 -2.06 -0.39857 0.345106 1 5 0.38462 0.039510 6 -2.96 -2.00 -0.31885 0.374919 1 6 0.46154 0.086620 7 -1.27 -1.69 0.09300 0.537048 1 7 0.53846 0.001414 8 -2.06 -1.45 0.41185 0.659777 1 8 0.61538 0.044392 9 -1.38 -1.38 0.50485 0.693169 1 9 0.69231 0.000861 10 -2.59 -1.27 0.65099 0.742475 1 10 0.76923 0.026756 11 -2.43 -1.12 0.85028 0.802415 1 11 0.84615 0.043739 12 -0.95 -0.95 1.07613 0.859066 1 12 0.92308 0.064011 13 -1.12 -0.40 1.80684 0.964606 1 13 1.00000 0.035394 Maximum of Fe-Fo In table above Fe column is Exact Cumulative Probability.Maximum of Fe-Fo = 0.120995Note that p-values for all three tests of Normality are above 5% - We cannot reject Normality.
10

252y0821a 3/31/08
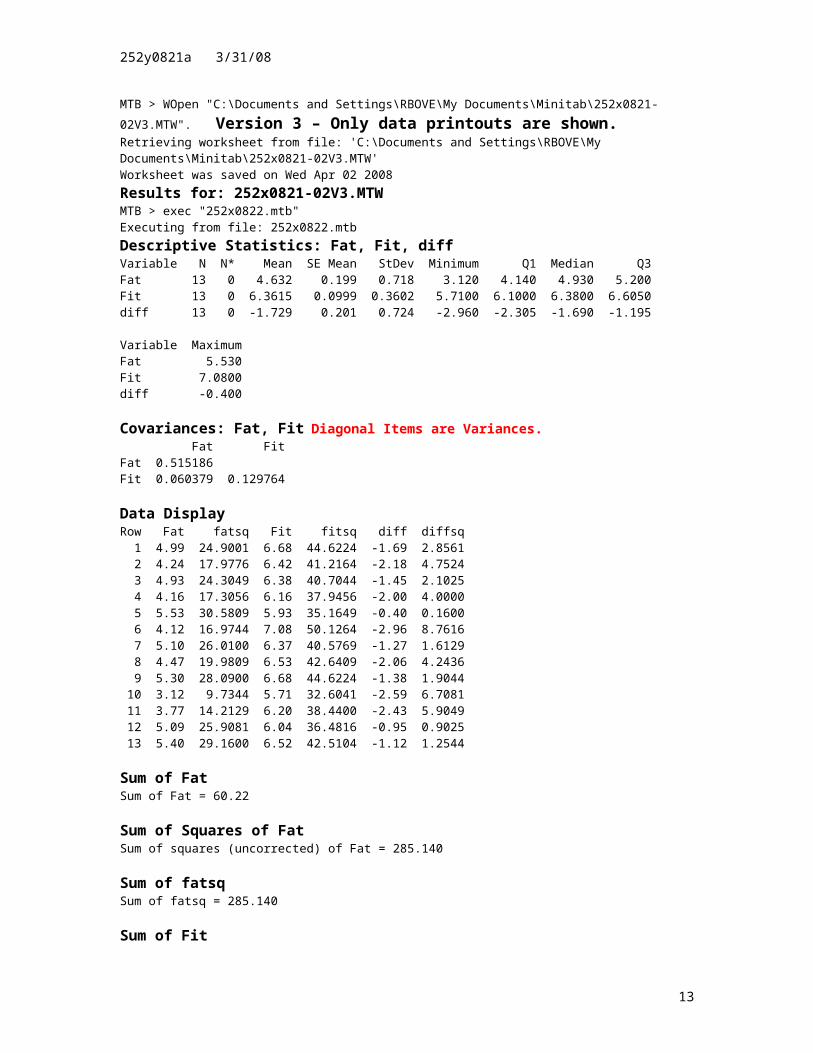
MTB > WOpen "C:\Documents and Settings\RBOVE\My Documents\Minitab\252x0821-02V3.MTW". Version 3 – Only data printouts are shown.Retrieving worksheet from file: 'C:\Documents and Settings\RBOVE\MyDocuments\Minitab\252x0821-02V3.MTW'Worksheet was saved on Wed Apr 02 2008Results for: 252x0821-02V3.MTWMTB > exec "252x0822.mtb"Executing from file: 252x0822.mtbDescriptive Statistics: Fat, Fit, diff Variable N N* Mean SE Mean StDev Minimum Q1 Median Q3Fat 13 0 4.632 0.199 0.718 3.120 4.140 4.930 5.200Fit 13 0 6.3615 0.0999 0.3602 5.7100 6.1000 6.3800 6.6050diff 13 0 -1.729 0.201 0.724 -2.960 -2.305 -1.690 -1.195
Variable MaximumFat 5.530Fit 7.0800diff -0.400
Covariances: Fat, Fit Diagonal Items are Variances. Fat FitFat 0.515186Fit 0.060379 0.129764 Data Display Row Fat fatsq Fit fitsq diff diffsq 1 4.99 24.9001 6.68 44.6224 -1.69 2.8561 2 4.24 17.9776 6.42 41.2164 -2.18 4.7524 3 4.93 24.3049 6.38 40.7044 -1.45 2.1025 4 4.16 17.3056 6.16 37.9456 -2.00 4.0000 5 5.53 30.5809 5.93 35.1649 -0.40 0.1600 6 4.12 16.9744 7.08 50.1264 -2.96 8.7616 7 5.10 26.0100 6.37 40.5769 -1.27 1.6129 8 4.47 19.9809 6.53 42.6409 -2.06 4.2436 9 5.30 28.0900 6.68 44.6224 -1.38 1.9044 10 3.12 9.7344 5.71 32.6041 -2.59 6.7081 11 3.77 14.2129 6.20 38.4400 -2.43 5.9049 12 5.09 25.9081 6.04 36.4816 -0.95 0.9025 13 5.40 29.1600 6.52 42.5104 -1.12 1.2544 Sum of Fat Sum of Fat = 60.22 Sum of Squares of Fat Sum of squares (uncorrected) of Fat = 285.140 Sum of fatsq Sum of fatsq = 285.140 Sum of Fit Sum of Fit = 82.7 Sum of Squares of Fit Sum of squares (uncorrected) of Fit = 527.656 Sum of fitsq Sum of fitsq = 527.656 Sum of diff Sum of diff = -22.48
11

252y0821a 3/31/08
Sum of Squares of diff Version 3 Sum of squares (uncorrected) of diff = 45.1634 Sum of diffsq Sum of diffsq = 45.1634 Two-Sample T-Test and CI: Fat, Fit Two-sample T for Fat vs Fit N Mean StDev SE MeanFat 13 4.632 0.718 0.20Fit 13 6.362 0.360 0.10Difference = mu (Fat) - mu (Fit)Estimate for difference: -1.72995% upper bound for difference: -1.348T-Test of difference = 0 (vs <): T-Value = -7.76 P-Value = 0.000 DF = 24Both use Pooled StDev = 0.5679 Two-Sample T-Test and CI: Fat, Fit Two-sample T for Fat vs Fit N Mean StDev SE MeanFat 13 4.632 0.718 0.20Fit 13 6.362 0.360 0.10Difference = mu (Fat) - mu (Fit)Estimate for difference: -1.72995% upper bound for difference: -1.342T-Test of difference = 0 (vs <): T-Value = -7.76 P-Value = 0.000 DF = 17 Test for Equal Variances: Fat, Fit 95% Bonferroni confidence intervals for standard deviations N Lower StDev UpperFat 13 0.492089 0.717765 1.28355Fit 13 0.246967 0.360228 0.64418F-Test (Normal Distribution)Test statistic = 3.97, p-value = 0.024Levene's Test (Any Continuous Distribution)Test statistic = 4.17, p-value = 0.052Test for Equal Variances for Fat, Fit All graphs are at end of printout.
Covariances: diff, diff Diagonal Items are Variances. diff diffdiff 0.524191diff 0.524191 0.524191 Probability Plot of diff Probability Plot of diff Probability Plot of diff
12
252y0821a 3/31/08
Data Display Columns and Ranks for Wilcoxon-Mann-Whitney Test Version 3Row Fat C7_Fat Fit C7_Fit 1 4.99 8 6.68 24.5 2 4.24 5 6.42 21.0 3 4.93 7 6.38 20.0 4 4.16 4 6.16 17.0 5 5.53 13 5.93 15.0 6 4.12 3 7.08 26.0 7 5.10 10 6.37 19.0 8 4.47 6 6.53 23.0 9 5.30 11 6.68 24.5 10 3.12 1 5.71 14.0 11 3.77 2 6.20 18.0 12 5.09 9 6.04 16.0 13 5.40 12 6.52 22.0 Sum of C7_Fat Sum of C7_Fat = 91 Sum of C7_Fit Sum of C7_Fit = 260
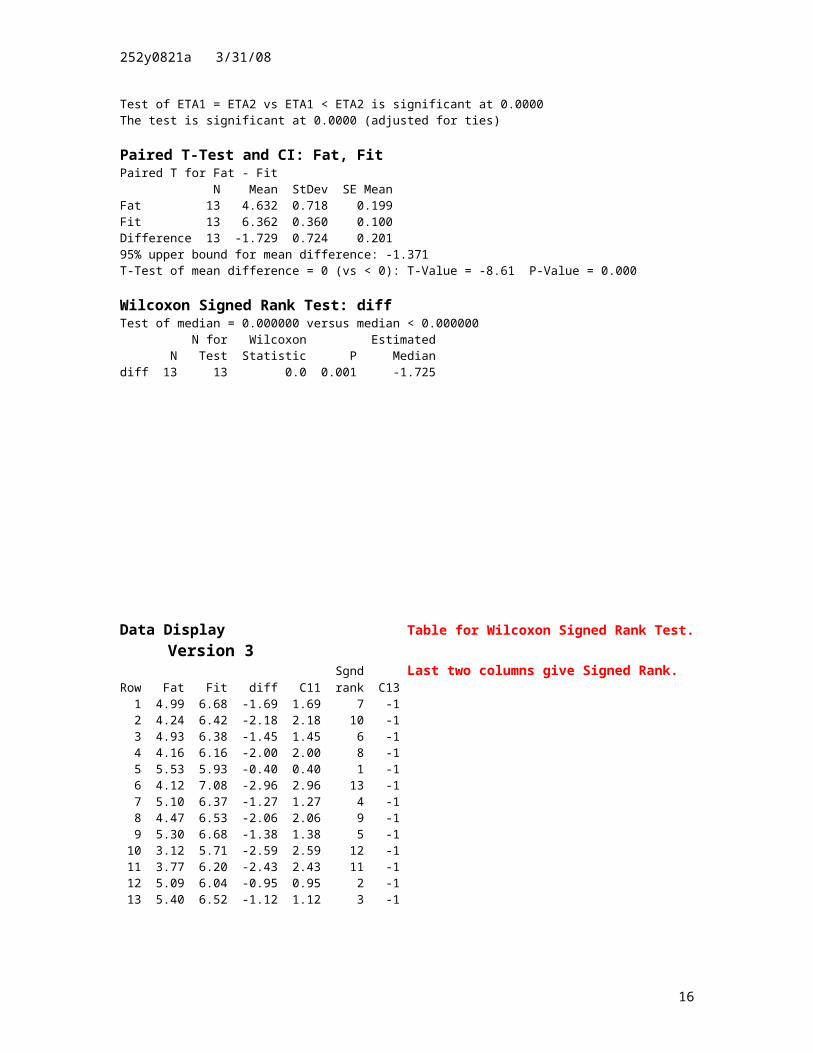
Mann-Whitney Test and CI: Fat, Fit N MedianFat 13 4.9300Fit 13 6.3800Point estimate for ETA1-ETA2 is -1.590095.4 Percent CI for ETA1-ETA2 is (-2.2100,-1.1498)W = 91.0Test of ETA1 = ETA2 vs ETA1 < ETA2 is significant at 0.0000The test is significant at 0.0000 (adjusted for ties) Paired T-Test and CI: Fat, Fit Paired T for Fat - Fit N Mean StDev SE MeanFat 13 4.632 0.718 0.199Fit 13 6.362 0.360 0.100Difference 13 -1.729 0.724 0.20195% upper bound for mean difference: -1.371T-Test of mean difference = 0 (vs < 0): T-Value = -8.61 P-Value = 0.000 Wilcoxon Signed Rank Test: diff Test of median = 0.000000 versus median < 0.000000 N for Wilcoxon Estimated N Test Statistic P Mediandiff 13 13 0.0 0.001 -1.725
13

252y0821a 3/31/08
Data Display Table for Wilcoxon Signed Rank Test. Version 3 Sgnd Last two columns give Signed Rank.Row Fat Fit diff C11 rank C13 1 4.99 6.68 -1.69 1.69 7 -1 2 4.24 6.42 -2.18 2.18 10 -1 3 4.93 6.38 -1.45 1.45 6 -1 4 4.16 6.16 -2.00 2.00 8 -1 5 5.53 5.93 -0.40 0.40 1 -1 6 4.12 7.08 -2.96 2.96 13 -1 7 5.10 6.37 -1.27 1.27 4 -1 8 4.47 6.53 -2.06 2.06 9 -1 9 5.30 6.68 -1.38 1.38 5 -1 10 3.12 5.71 -2.59 2.59 12 -1 11 3.77 6.20 -2.43 2.43 11 -1 12 5.09 6.04 -0.95 0.95 2 -1 13 5.40 6.52 -1.12 1.12 3 -1 Data Display Table for Wilcoxon Signed Rank Test for Median of 2. Sgnd Last two columns give Signed RankRow diff C14 C15 C11 rank C13 1 -1.69 -2 0.31 0.31 4 1 2 -2.18 -2 -0.18 0.18 3 -1 3 -1.45 -2 0.55 0.55 6 1 4 -2.00 -2 0.00 0.00 1 0 5 -0.40 -2 1.60 1.60 13 1 6 -2.96 -2 -0.96 0.96 11 -1 7 -1.27 -2 0.73 0.73 9 1 8 -2.06 -2 -0.06 0.06 2 -1 9 -1.38 -2 0.62 0.62 8 1 10 -2.59 -2 -0.59 0.59 7 -1 11 -2.43 -2 -0.43 0.43 5 -1 12 -0.95 -2 1.05 1.05 12 1 13 -1.12 -2 0.88 0.88 10 1 Wilcoxon Signed Rank Test: C15 Test of median = 0.000000 versus median not = 0.000000 N for Wilcoxon Estimated N Test Statistic P MedianC15 13 12 55.0 0.224 0.2750 Wilcoxon Signed Rank Test: diff Test of median = -2.000 versus median not = -2.000 N for Wilcoxon Estimated N Test Statistic P Mediandiff 13 12 55.0 0.224 -1.725 Mean of C20 Mean of C20 = -1.72923 Standard Deviation of C21 Standard deviation of C21 = 0.724010 Descriptive Statistics: C22 Variable N N* Mean SE Mean StDev Minimum Q1 Median Q3C22 13 0 -0.000 0.277 1.000 -1.700 -0.795 0.054 0.738
Variable MaximumC22 1.836
14

252y0821a 3/31/08
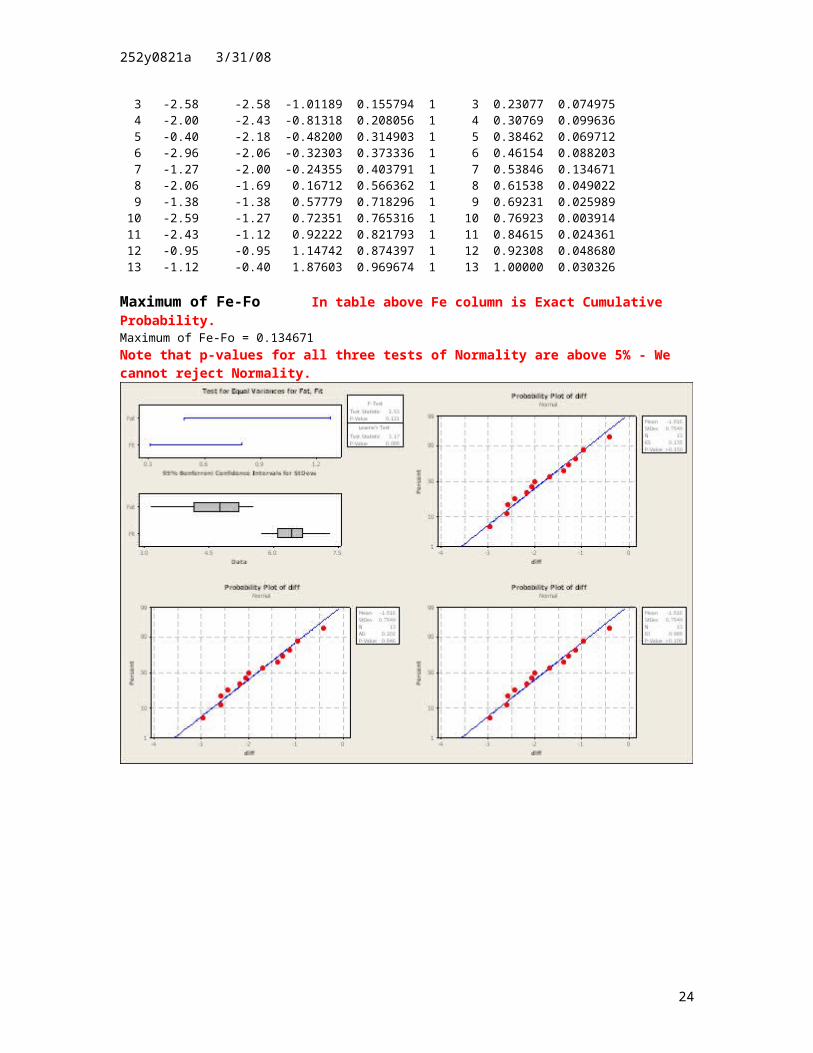
Data Display Table for Lilliefors Test – Last Column is absolute D. Version 3Row dmoved dordered z_d Fe O cumO Fo Fe-Fo 1 -1.69 -2.96 -1.69993 0.044572 1 1 0.07692 0.032351 2 -2.18 -2.59 -1.18889 0.117241 1 2 0.15385 0.036605 3 -1.45 -2.43 -0.96790 0.166547 1 3 0.23077 0.064222 4 -2.00 -2.18 -0.62260 0.266774 1 4 0.30769 0.040919 5 -0.40 -2.06 -0.45686 0.323887 1 5 0.38462 0.060728 6 -2.96 -2.00 -0.37399 0.354208 1 6 0.46154 0.107331 7 -1.27 -1.69 0.05419 0.521606 1 7 0.53846 0.016855 8 -2.06 -1.45 0.38567 0.650130 1 8 0.61538 0.034746 9 -1.38 -1.38 0.48236 0.685223 1 9 0.69231 0.007084 10 -2.59 -1.27 0.63429 0.737053 1 10 0.76923 0.032177 11 -2.43 -1.12 0.84147 0.799957 1 11 0.84615 0.046197 12 -0.95 -0.95 1.07627 0.859097 1 12 0.92308 0.063980 13 -1.12 -0.40 1.83593 0.966816 1 13 1.00000 0.033184 Maximum of Fe-Fo Maximum of Fe-Fo = 0.107331Note that p-values for all three tests of Normality are above 5% - We cannot reject Normality.
15
252y0821a 3/31/08
MTB > WOpen "C:\Documents and Settings\RBOVE\My Documents\Minitab\252x0821-02V4.MTW". Version 4 – Only data printouts are shown.Retrieving worksheet from file: 'C:\Documents and Settings\RBOVE\MyDocuments\Minitab\252x0821-02V4.MTW'Worksheet was saved on Wed Apr 02 2008Results for: 252x0821-02V4.MTWMTB > exec "252x0822.mtb"Executing from file: 252x0822.mtb
Descriptive Statistics: Fat, Fit, diff Variable N N* Mean SE Mean StDev Minimum Q1 Median Q3Fat 13 0 4.618 0.198 0.713 3.120 4.140 4.740 5.200Fit 13 0 6.434 0.124 0.448 5.710 6.100 6.420 6.680diff 13 0 -1.816 0.209 0.755 -2.960 -2.505 -2.000 -1.195
Variable MaximumFat 5.530Fit 7.320diff -0.400 Covariances: Fat, Fit Diagonal Items are Variances. Fat FitFat 0.508536Fit 0.069668 0.200626 Data Display Row Fat fatsq Fit fitsq diff diffsq 1 4.99 24.9001 6.68 44.6224 -1.69 2.8561 2 4.24 17.9776 6.42 41.2164 -2.18 4.7524 3 4.74 22.4676 7.32 53.5824 -2.58 6.6564 4 4.16 17.3056 6.16 37.9456 -2.00 4.0000 5 5.53 30.5809 5.93 35.1649 -0.40 0.1600 6 4.12 16.9744 7.08 50.1264 -2.96 8.7616 7 5.10 26.0100 6.37 40.5769 -1.27 1.6129 8 4.47 19.9809 6.53 42.6409 -2.06 4.2436 9 5.30 28.0900 6.68 44.6224 -1.38 1.9044 10 3.12 9.7344 5.71 32.6041 -2.59 6.7081 11 3.77 14.2129 6.20 38.4400 -2.43 5.9049 12 5.09 25.9081 6.04 36.4816 -0.95 0.9025 13 5.40 29.1600 6.52 42.5104 -1.12 1.2544 Sum of Fat Sum of Fat = 60.03 Sum of Squares of Fat Sum of squares (uncorrected) of Fat = 283.302 Sum of fatsq Sum of fatsq = 283.302 Sum of Fit Sum of Fit = 83.64 Sum of Squares of Fit Sum of squares (uncorrected) of Fit = 540.534 Sum of fitsq Sum of fitsq = 540.534
16

252y0821a 3/31/08
Sum of diff Version 4Sum of diff = -23.61 Sum of Squares of diff Sum of squares (uncorrected) of diff = 49.7173 Sum of diffsq Sum of diffsq = 49.7173 Two-Sample T-Test and CI: Fat, Fit Two-sample T for Fat vs Fit N Mean StDev SE MeanFat 13 4.618 0.713 0.20Fit 13 6.434 0.448 0.12Difference = mu (Fat) - mu (Fit)Estimate for difference: -1.81695% upper bound for difference: -1.417T-Test of difference = 0 (vs <): T-Value = -7.78 P-Value = 0.000 DF = 24Both use Pooled StDev = 0.5955 Two-Sample T-Test and CI: Fat, Fit Two-sample T for Fat vs Fit N Mean StDev SE MeanFat 13 4.618 0.713 0.20Fit 13 6.434 0.448 0.12Difference = mu (Fat) - mu (Fit)Estimate for difference: -1.81695% upper bound for difference: -1.413T-Test of difference = 0 (vs <): T-Value = -7.78 P-Value = 0.000 DF = 20 Test for Equal Variances: Fat, Fit 95% Bonferroni confidence intervals for standard deviations N Lower StDev UpperFat 13 0.488903 0.713117 1.27524Fit 13 0.307082 0.447913 0.80099F-Test (Normal Distribution)Test statistic = 2.53, p-value = 0.121Levene's Test (Any Continuous Distribution)Test statistic = 3.17, p-value = 0.088Test for Equal Variances for Fat, Fit All graphs are at end of printout.
Covariances: diff, diff Diagonal Items are Variances. diff diffdiff 0.569826diff 0.569826 0.569826 Probability Plot of diff Probability Plot of diff Probability Plot of diff
17

252y0821a 3/31/08
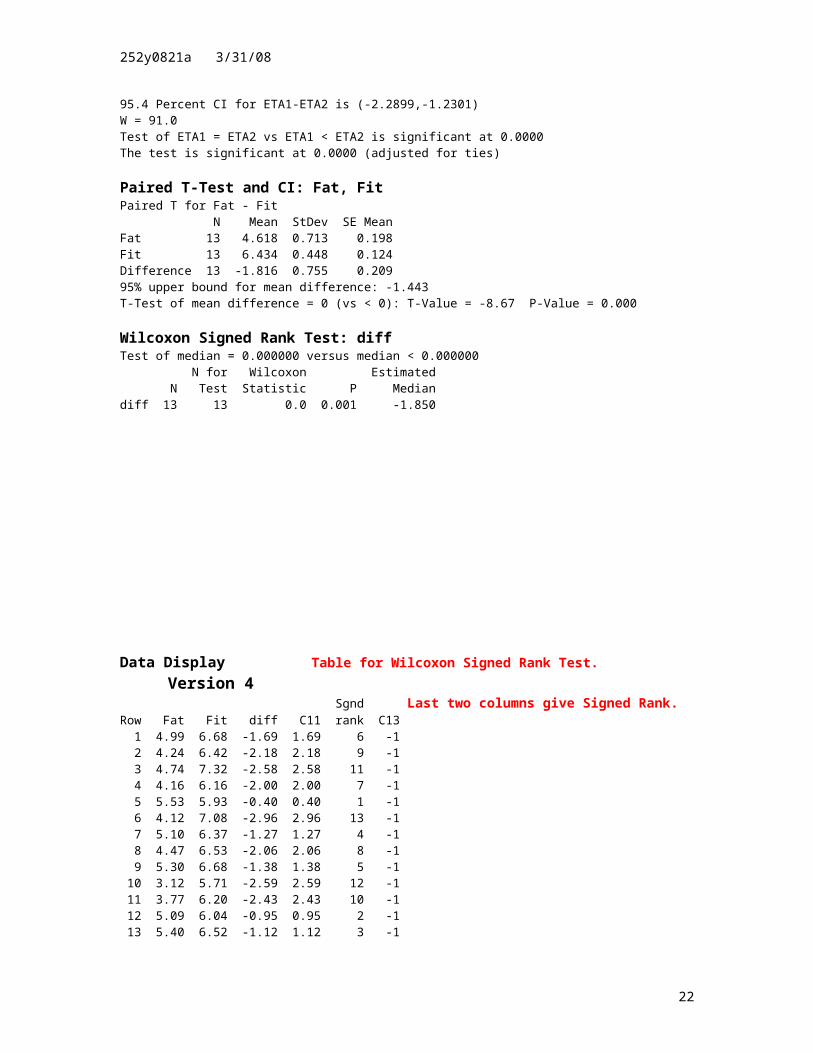
Data Display Columns and Ranks for Wilcoxon-Mann-Whitney Test. Version 4Row Fat C7_Fat Fit C7_Fit 1 4.99 8 6.68 23.5 2 4.24 5 6.42 20.0 3 4.74 7 7.32 26.0 4 4.16 4 6.16 17.0 5 5.53 13 5.93 15.0 6 4.12 3 7.08 25.0 7 5.10 10 6.37 19.0 8 4.47 6 6.53 22.0 9 5.30 11 6.68 23.5 10 3.12 1 5.71 14.0 11 3.77 2 6.20 18.0 12 5.09 9 6.04 16.0 13 5.40 12 6.52 21.0 Sum of C7_Fat Sum of C7_Fat = 91 Sum of C7_Fit Sum of C7_Fit = 260 Mann-Whitney Test and CI: Fat, Fit N MedianFat 13 4.7400Fit 13 6.4200Point estimate for ETA1-ETA2 is -1.770095.4 Percent CI for ETA1-ETA2 is (-2.2899,-1.2301)W = 91.0Test of ETA1 = ETA2 vs ETA1 < ETA2 is significant at 0.0000The test is significant at 0.0000 (adjusted for ties) Paired T-Test and CI: Fat, Fit Paired T for Fat - Fit N Mean StDev SE MeanFat 13 4.618 0.713 0.198Fit 13 6.434 0.448 0.124Difference 13 -1.816 0.755 0.20995% upper bound for mean difference: -1.443T-Test of mean difference = 0 (vs < 0): T-Value = -8.67 P-Value = 0.000
Wilcoxon Signed Rank Test: diff Test of median = 0.000000 versus median < 0.000000 N for Wilcoxon Estimated N Test Statistic P Mediandiff 13 13 0.0 0.001 -1.850
18

252y0821a 3/31/08
Data Display Table for Wilcoxon Signed Rank Test. Version 4 Sgnd Last two columns give Signed Rank.Row Fat Fit diff C11 rank C13 1 4.99 6.68 -1.69 1.69 6 -1 2 4.24 6.42 -2.18 2.18 9 -1 3 4.74 7.32 -2.58 2.58 11 -1 4 4.16 6.16 -2.00 2.00 7 -1 5 5.53 5.93 -0.40 0.40 1 -1 6 4.12 7.08 -2.96 2.96 13 -1 7 5.10 6.37 -1.27 1.27 4 -1 8 4.47 6.53 -2.06 2.06 8 -1 9 5.30 6.68 -1.38 1.38 5 -1 10 3.12 5.71 -2.59 2.59 12 -1 11 3.77 6.20 -2.43 2.43 10 -1 12 5.09 6.04 -0.95 0.95 2 -1 13 5.40 6.52 -1.12 1.12 3 -1 Data Display Table for Wilcoxon Signed Rank Test for Median of 2. Sgnd Last two columns give Signed Rank.Row diff C14 C15 C11 rank C13 1 -1.69 -2 0.31 0.31 4 1 2 -2.18 -2 -0.18 0.18 3 -1 3 -2.58 -2 -0.58 0.58 6 -1 4 -2.00 -2 0.00 0.00 1 0 5 -0.40 -2 1.60 1.60 13 1 6 -2.96 -2 -0.96 0.96 11 -1 7 -1.27 -2 0.73 0.73 9 1 8 -2.06 -2 -0.06 0.06 2 -1 9 -1.38 -2 0.62 0.62 8 1 10 -2.59 -2 -0.59 0.59 7 -1 11 -2.43 -2 -0.43 0.43 5 -1 12 -0.95 -2 1.05 1.05 12 1 13 -1.12 -2 0.88 0.88 10 1 Wilcoxon Signed Rank Test: C15 Test of median = 0.000000 versus median not = 0.000000 N for Wilcoxon Estimated N Test Statistic P MedianC15 13 12 50.0 0.410 0.1500 Wilcoxon Signed Rank Test: diff Test of median = -2.000 versus median not = -2.000 N for Wilcoxon Estimated N Test Statistic P Mediandiff 13 12 50.0 0.410 -1.850 Mean of C20 Mean of C20 = -1.81615 Standard Deviation of C21 Standard deviation of C21 = 0.754868 Descriptive Statistics: C22 Variable N N* Mean SE Mean StDev Minimum Q1 Median Q3C22 13 0 -0.000 0.277 1.000 -1.515 -0.913 -0.244 0.823
Variable MaximumC22 1.876
19

252y0821a 3/31/08
Data Display Table for Lilliefors Test – Last Column is absolute D. Version 4Row dmoved dordered z_d Fe O cumO Fo Fe-Fo 1 -1.69 -2.96 -1.51529 0.064849 1 1 0.07692 0.012074 2 -2.18 -2.59 -1.02514 0.152648 1 2 0.15385 0.001198 3 -2.58 -2.58 -1.01189 0.155794 1 3 0.23077 0.074975 4 -2.00 -2.43 -0.81318 0.208056 1 4 0.30769 0.099636 5 -0.40 -2.18 -0.48200 0.314903 1 5 0.38462 0.069712 6 -2.96 -2.06 -0.32303 0.373336 1 6 0.46154 0.088203 7 -1.27 -2.00 -0.24355 0.403791 1 7 0.53846 0.134671 8 -2.06 -1.69 0.16712 0.566362 1 8 0.61538 0.049022 9 -1.38 -1.38 0.57779 0.718296 1 9 0.69231 0.025989 10 -2.59 -1.27 0.72351 0.765316 1 10 0.76923 0.003914 11 -2.43 -1.12 0.92222 0.821793 1 11 0.84615 0.024361 12 -0.95 -0.95 1.14742 0.874397 1 12 0.92308 0.048680 13 -1.12 -0.40 1.87603 0.969674 1 13 1.00000 0.030326
Maximum of Fe-Fo In table above Fe column is Exact Cumulative Probability.Maximum of Fe-Fo = 0.134671Note that p-values for all three tests of Normality are above 5% - We cannot reject Normality.
20

252y0821a 3/31/08
MTB > WOpen "C:\Documents and Settings\RBOVE\My Documents\Minitab\252x0821-02V5.MTW". Version 5 – All commands and data printouts are shown.Retrieving worksheet from file: 'C:\Documents and Settings\RBOVE\MyDocuments\Minitab\252x0821-02V5.MTW'Worksheet was saved on Wed Apr 02 2008Results for: 252x0821-02V5.MTWMTB > exec "252x0822.mtb"Executing from file: 252x0822.mtb Descriptive Statistics: Fat, Fit, diff Variable N N* Mean SE Mean StDev Minimum Q1 Median Q3Fat 13 0 4.677 0.195 0.704 3.120 4.180 4.930 5.200Fit 13 0 6.451 0.122 0.441 5.710 6.120 6.420 6.680diff 13 0 -1.774 0.211 0.759 -2.960 -2.505 -1.690 -1.195
Variable MaximumFat 5.530Fit 7.320diff -0.400 Covariances: Fat, Fit Diagonal Items are Variances. Fat FitFat 0.495406Fit 0.056736 0.194308 Data Display Row Fat fatsq Fit fitsq diff diffsq 1 4.99 24.9001 6.68 44.6224 -1.69 2.8561 2 4.24 17.9776 6.42 41.2164 -2.18 4.7524 3 4.74 22.4676 7.32 53.5824 -2.58 6.6564 4 4.93 24.3049 6.38 40.7044 -1.45 2.1025 5 5.53 30.5809 5.93 35.1649 -0.40 0.1600 6 4.12 16.9744 7.08 50.1264 -2.96 8.7616 7 5.10 26.0100 6.37 40.5769 -1.27 1.6129 8 4.47 19.9809 6.53 42.6409 -2.06 4.2436 9 5.30 28.0900 6.68 44.6224 -1.38 1.9044 10 3.12 9.7344 5.71 32.6041 -2.59 6.7081 11 3.77 14.2129 6.20 38.4400 -2.43 5.9049 12 5.09 25.9081 6.04 36.4816 -0.95 0.9025 13 5.40 29.1600 6.52 42.5104 -1.12 1.2544 Sum of Fat Sum of Fat = 60.8 Sum of Squares of Fat Sum of squares (uncorrected) of Fat = 290.302 Sum of fatsq Sum of fatsq = 290.302 Sum of Fit Sum of Fit = 83.86 Sum of Squares of Fit Sum of squares (uncorrected) of Fit = 543.293
Sum of fitsq Sum of fitsq = 543.293
21
252y0821a 3/31/08
Sum of diff Version 5Sum of diff = -23.06 Sum of Squares of diff Sum of squares (uncorrected) of diff = 47.8198 Sum of diffsq Sum of diffsq = 47.8198 Two-Sample T-Test and CI: Fat, Fit Two-sample T for Fat vs Fit N Mean StDev SE MeanFat 13 4.677 0.704 0.20Fit 13 6.451 0.441 0.12Difference = mu (Fat) - mu (Fit)Estimate for difference: -1.77495% upper bound for difference: -1.380T-Test of difference = 0 (vs <): T-Value = -7.70 P-Value = 0.000 DF = 24Both use Pooled StDev = 0.5872 Two-Sample T-Test and CI: Fat, Fit Two-sample T for Fat vs Fit N Mean StDev SE MeanFat 13 4.677 0.704 0.20Fit 13 6.451 0.441 0.12Difference = mu (Fat) - mu (Fit)Estimate for difference: -1.77495% upper bound for difference: -1.377T-Test of difference = 0 (vs <): T-Value = -7.70 P-Value = 0.000 DF = 20
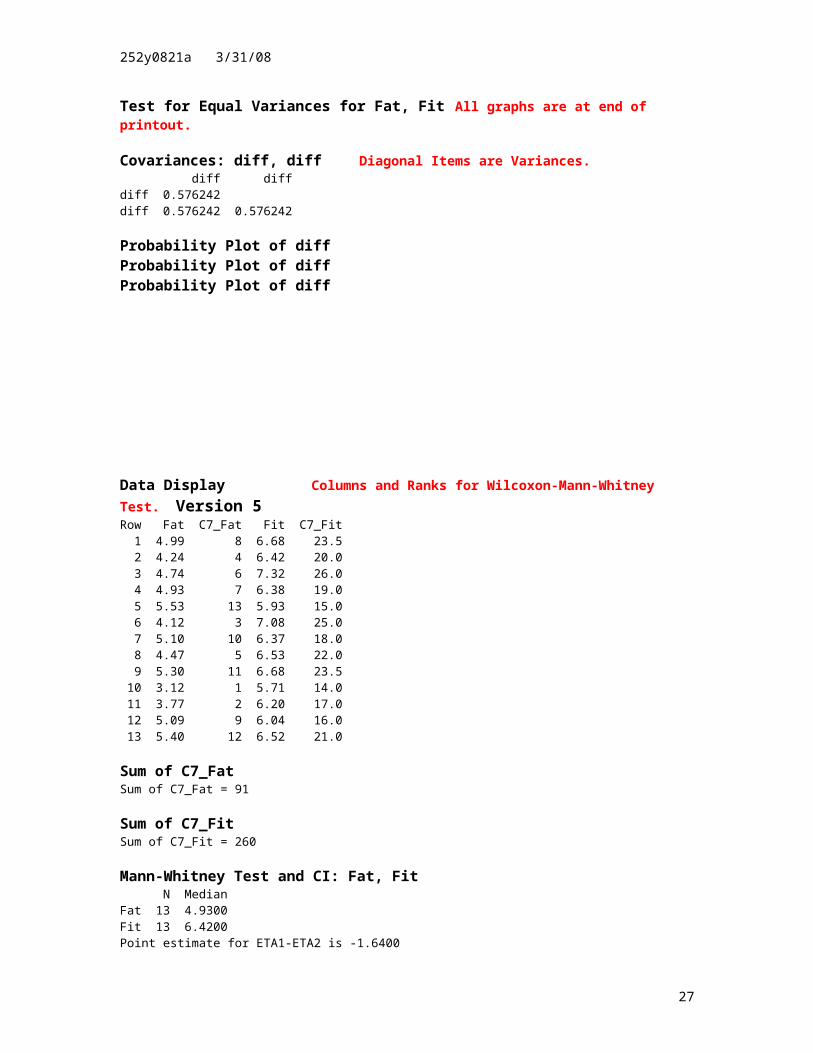
Test for Equal Variances: Fat, Fit 95% Bonferroni confidence intervals for standard deviations N Lower StDev UpperFat 13 0.482550 0.703851 1.25867Fit 13 0.302208 0.440803 0.78827F-Test (Normal Distribution)Test statistic = 2.55, p-value = 0.119Levene's Test (Any Continuous Distribution)Test statistic = 1.74, p-value = 0.199Test for Equal Variances for Fat, Fit All graphs are at end of printout. Covariances: diff, diff Diagonal Items are Variances. diff diffdiff 0.576242diff 0.576242 0.576242 Probability Plot of diff Probability Plot of diff Probability Plot of diff
22

252y0821a 3/31/08
Data Display Columns and Ranks for Wilcoxon-Mann-Whitney Test. Version 5Row Fat C7_Fat Fit C7_Fit 1 4.99 8 6.68 23.5 2 4.24 4 6.42 20.0 3 4.74 6 7.32 26.0 4 4.93 7 6.38 19.0 5 5.53 13 5.93 15.0 6 4.12 3 7.08 25.0 7 5.10 10 6.37 18.0 8 4.47 5 6.53 22.0 9 5.30 11 6.68 23.5 10 3.12 1 5.71 14.0 11 3.77 2 6.20 17.0 12 5.09 9 6.04 16.0 13 5.40 12 6.52 21.0
Sum of C7_Fat Sum of C7_Fat = 91 Sum of C7_Fit Sum of C7_Fit = 260 Mann-Whitney Test and CI: Fat, Fit N MedianFat 13 4.9300Fit 13 6.4200Point estimate for ETA1-ETA2 is -1.640095.4 Percent CI for ETA1-ETA2 is (-2.2300,-1.2300)W = 91.0Test of ETA1 = ETA2 vs ETA1 < ETA2 is significant at 0.0000The test is significant at 0.0000 (adjusted for ties) Paired T-Test and CI: Fat, Fit Paired T for Fat - Fit N Mean StDev SE MeanFat 13 4.677 0.704 0.195Fit 13 6.451 0.441 0.122Difference 13 -1.774 0.759 0.21195% upper bound for mean difference: -1.399T-Test of mean difference = 0 (vs < 0): T-Value = -8.43 P-Value = 0.000 Wilcoxon Signed Rank Test: diff Test of median = 0.000000 versus median < 0.000000 N for Wilcoxon Estimated N Test Statistic P Mediandiff 13 13 0.0 0.001 -1.775
23
252y0821a 3/31/08
Data Display Table for Wilcoxon Signed Rank Test. Version 5 Sgnd Last two columns give Signed Rank.Row Fat Fit diff C11 rank C13 1 4.99 6.68 -1.69 1.69 7 -1 2 4.24 6.42 -2.18 2.18 9 -1 3 4.74 7.32 -2.58 2.58 11 -1 4 4.93 6.38 -1.45 1.45 6 -1 5 5.53 5.93 -0.40 0.40 1 -1 6 4.12 7.08 -2.96 2.96 13 -1 7 5.10 6.37 -1.27 1.27 4 -1 8 4.47 6.53 -2.06 2.06 8 -1 9 5.30 6.68 -1.38 1.38 5 -1 10 3.12 5.71 -2.59 2.59 12 -1 11 3.77 6.20 -2.43 2.43 10 -1 12 5.09 6.04 -0.95 0.95 2 -1 13 5.40 6.52 -1.12 1.12 3 -1 Data Display Table for Wilcoxon Signed Rank Test for Median of 2. Sgnd Last two columns give Signed Rank.Row diff C14 C15 C11 rank C13 1 -1.69 -2 0.31 0.31 3 1 2 -2.18 -2 -0.18 0.18 2 -1 3 -2.58 -2 -0.58 0.58 6 -1 4 -1.45 -2 0.55 0.55 5 1 5 -0.40 -2 1.60 1.60 13 1 6 -2.96 -2 -0.96 0.96 11 -1 7 -1.27 -2 0.73 0.73 9 1 8 -2.06 -2 -0.06 0.06 1 -1 9 -1.38 -2 0.62 0.62 8 1 10 -2.59 -2 -0.59 0.59 7 -1 11 -2.43 -2 -0.43 0.43 4 -1 12 -0.95 -2 1.05 1.05 12 1 13 -1.12 -2 0.88 0.88 10 1 Wilcoxon Signed Rank Test: C15 Test of median = 0.000000 versus median not = 0.000000 N for Wilcoxon Estimated N Test Statistic P MedianC15 13 13 60.0 0.328 0.2250 Wilcoxon Signed Rank Test: diff Test of median = -2.000 versus median not = -2.000 N for Wilcoxon Estimated N Test Statistic P Mediandiff 13 13 60.0 0.328 -1.775
Mean of C20 Mean of C20 = -1.77385 Standard Deviation of C21 Standard deviation of C21 = 0.759106 Descriptive Statistics: C22 Variable N N* Mean SE Mean StDev Minimum Q1 Median Q3C22 13 0 -0.000 0.277 1.000 -1.563 -0.963 0.110 0.763
Variable MaximumC22 1.810
24

252y0821a 3/31/08
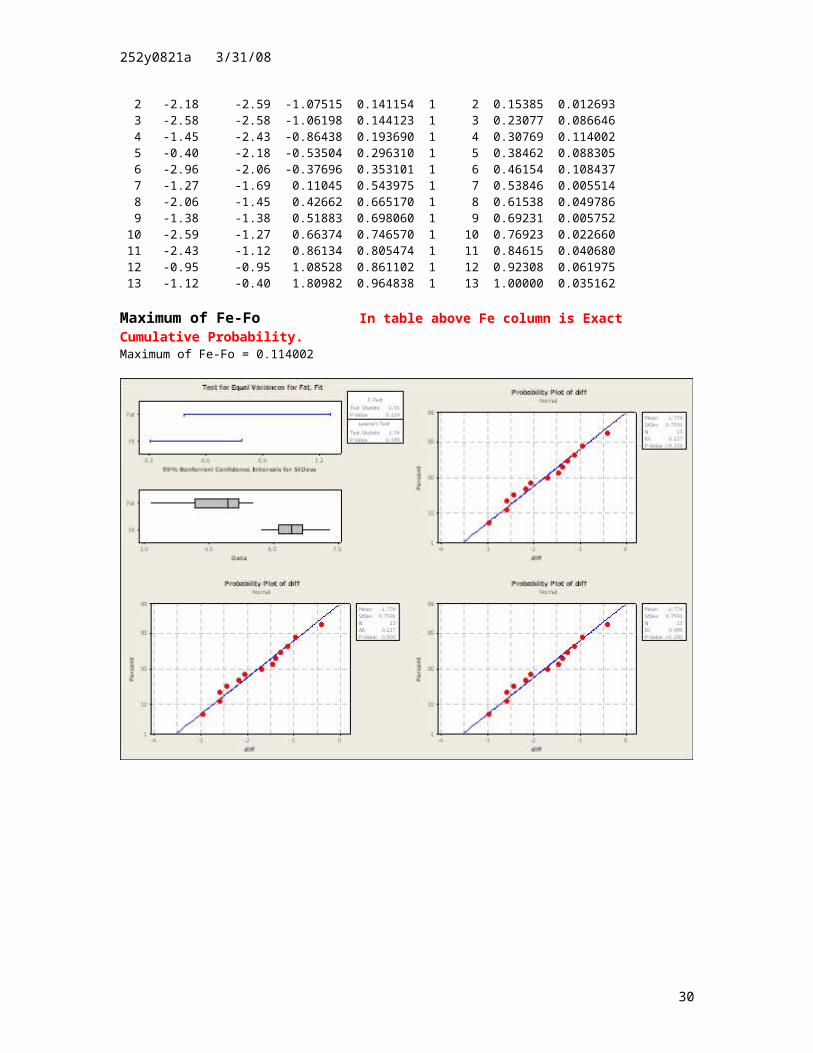
Data Display Table for Lilliefors Test – Last Column is absolute D. Version 5Row dmoved dordered z_d Fe O cumO Fo Fe-Fo 1 -1.69 -2.96 -1.56257 0.059077 1 1 0.07692 0.017846 2 -2.18 -2.59 -1.07515 0.141154 1 2 0.15385 0.012693 3 -2.58 -2.58 -1.06198 0.144123 1 3 0.23077 0.086646 4 -1.45 -2.43 -0.86438 0.193690 1 4 0.30769 0.114002 5 -0.40 -2.18 -0.53504 0.296310 1 5 0.38462 0.088305 6 -2.96 -2.06 -0.37696 0.353101 1 6 0.46154 0.108437 7 -1.27 -1.69 0.11045 0.543975 1 7 0.53846 0.005514 8 -2.06 -1.45 0.42662 0.665170 1 8 0.61538 0.049786 9 -1.38 -1.38 0.51883 0.698060 1 9 0.69231 0.005752 10 -2.59 -1.27 0.66374 0.746570 1 10 0.76923 0.022660 11 -2.43 -1.12 0.86134 0.805474 1 11 0.84615 0.040680 12 -0.95 -0.95 1.08528 0.861102 1 12 0.92308 0.061975 13 -1.12 -0.40 1.80982 0.964838 1 13 1.00000 0.035162 Maximum of Fe-Fo In table above Fe column is Exact Cumulative Probability.Maximum of Fe-Fo = 0.114002
25

252y0821a 3/31/08
MTB > WOpen "C:\Documents and Settings\RBOVE\My Documents\Minitab\252x0821-02V6.MTW". Version 6 – All commands and data printouts are shown.Retrieving worksheet from file: 'C:\Documents and Settings\RBOVE\MyDocuments\Minitab\252x0821-02V6.MTW'Worksheet was saved on Wed Apr 02 2008Results for: 252x0821-02V6.MTWMTB > echoMTB > exec "252x0822.mtb"Executing from file: 252x0822.mtbMTB > #252x0822 Runs Fit-Fat problemMTB > # Change to descriptionMTB > describe c2 c3 c4Descriptive Statistics: Fat, Fit, diff Variable N N* Mean SE Mean StDev Minimum Q1 Median Q3Fat 13 0 4.572 0.185 0.667 3.120 4.140 4.740 5.095Fit 13 0 6.468 0.117 0.422 5.710 6.180 6.420 6.680diff 13 0 -1.897 0.177 0.638 -2.960 -2.505 -2.000 -1.325
Variable MaximumFat 5.400Fit 7.320diff -0.950
MTB > covariance c2 c3Covariances: Fat, Fit Diagonal Items are Variances. Fat FitFat 0.444997Fit 0.108303 0.178414
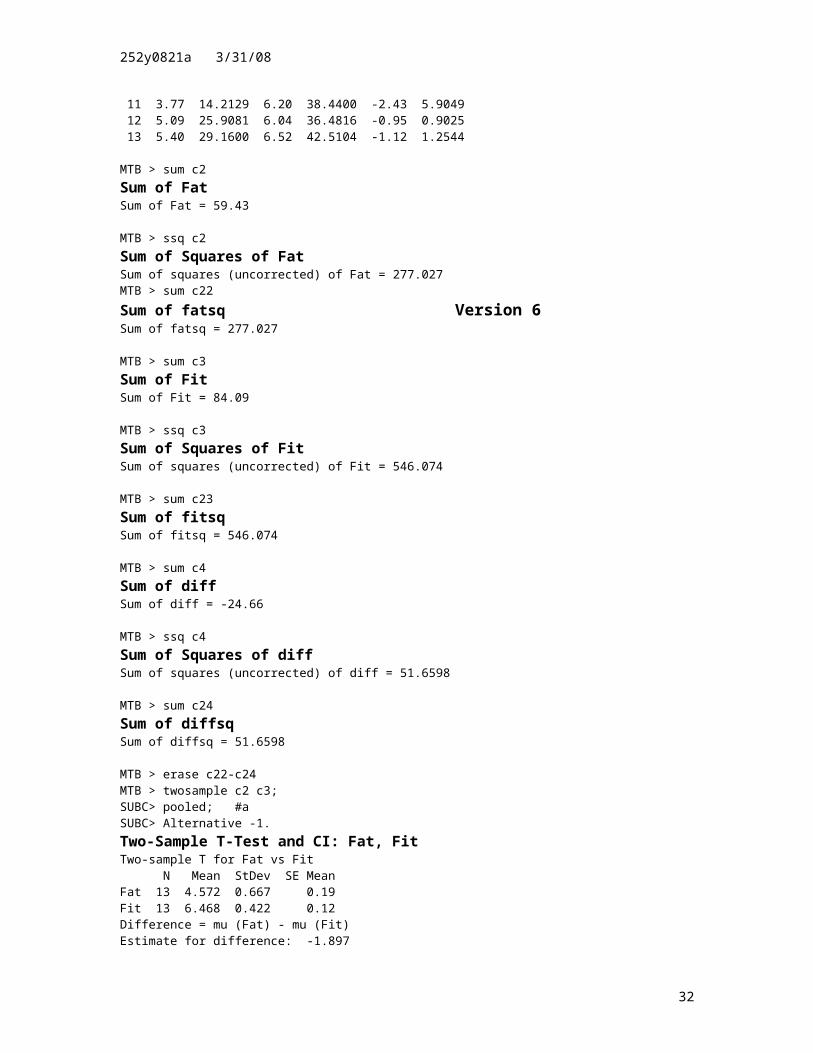
MTB > erase c5-c100MTB > let c22 = c2*c2MTB > let c23 = c3*c3MTB > let c24 = c4*c4MTB > name c22 'fatsq'MTB > name c23 'fitsq'MTB > name c24 'diffsq'MTB > print c2 c22 c3 c23 c4 c24 Data Display Row Fat fatsq Fit fitsq diff diffsq 1 4.99 24.9001 6.68 44.6224 -1.69 2.8561 2 4.24 17.9776 6.42 41.2164 -2.18 4.7524 3 4.74 22.4676 7.32 53.5824 -2.58 6.6564 4 4.93 24.3049 6.38 40.7044 -1.45 2.1025 5 4.16 17.3056 6.16 37.9456 -2.00 4.0000 6 4.12 16.9744 7.08 50.1264 -2.96 8.7616 7 5.10 26.0100 6.37 40.5769 -1.27 1.6129 8 4.47 19.9809 6.53 42.6409 -2.06 4.2436 9 5.30 28.0900 6.68 44.6224 -1.38 1.9044 10 3.12 9.7344 5.71 32.6041 -2.59 6.7081 11 3.77 14.2129 6.20 38.4400 -2.43 5.9049 12 5.09 25.9081 6.04 36.4816 -0.95 0.9025 13 5.40 29.1600 6.52 42.5104 -1.12 1.2544
MTB > sum c2Sum of Fat Sum of Fat = 59.43
MTB > ssq c2Sum of Squares of Fat Sum of squares (uncorrected) of Fat = 277.027
26
252y0821a 3/31/08
MTB > sum c22Sum of fatsq Version 6Sum of fatsq = 277.027
MTB > sum c3Sum of Fit Sum of Fit = 84.09
MTB > ssq c3Sum of Squares of Fit Sum of squares (uncorrected) of Fit = 546.074
MTB > sum c23Sum of fitsq Sum of fitsq = 546.074
MTB > sum c4Sum of diff Sum of diff = -24.66
MTB > ssq c4Sum of Squares of diff Sum of squares (uncorrected) of diff = 51.6598
MTB > sum c24Sum of diffsq Sum of diffsq = 51.6598
MTB > erase c22-c24MTB > twosample c2 c3;SUBC> pooled; #aSUBC> Alternative -1.Two-Sample T-Test and CI: Fat, Fit Two-sample T for Fat vs Fit N Mean StDev SE MeanFat 13 4.572 0.667 0.19Fit 13 6.468 0.422 0.12Difference = mu (Fat) - mu (Fit)Estimate for difference: -1.89795% upper bound for difference: -1.522T-Test of difference = 0 (vs <): T-Value = -8.66 P-Value = 0.000 DF = 24Both use Pooled StDev = 0.5583
MTB > twosample c2 c3; #bSUBC> Alternative -1.Two-Sample T-Test and CI: Fat, Fit Two-sample T for Fat vs Fit N Mean StDev SE MeanFat 13 4.572 0.667 0.19Fit 13 6.468 0.422 0.12Difference = mu (Fat) - mu (Fit)Estimate for difference: -1.89795% upper bound for difference: -1.519T-Test of difference = 0 (vs <): T-Value = -8.66 P-Value = 0.000 DF = 20
27
252y0821a 3/31/08
MTB > VarTest c2 c3; #c Version 6SUBC> Unstacked.Test for Equal Variances: Fat, Fit 95% Bonferroni confidence intervals for standard deviations N Lower StDev UpperFat 13 0.457341 0.667081 1.19292Fit 13 0.289585 0.422391 0.75535F-Test (Normal Distribution)Test statistic = 2.49, p-value = 0.127Levene's Test (Any Continuous Distribution)Test statistic = 2.75, p-value = 0.111Test for Equal Variances for Fat, Fit All graphs are at end of printout.
MTB > covariance c4 c4 #dCovariances: diff, diff Diagonal Items are Variances. diff diffdiff 0.406806diff 0.406806 0.406806
MTB > NormTest c4;SUBC> KSTest.Probability Plot of diff MTB > NormTest c4.
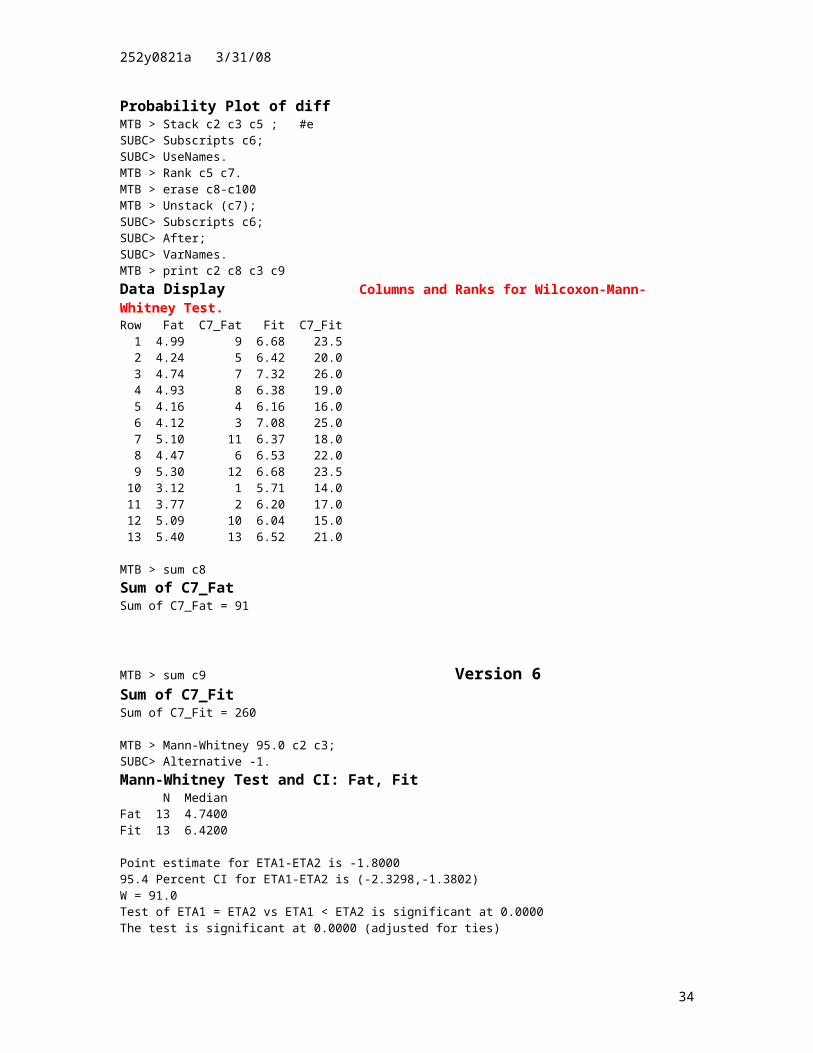
Probability Plot of diff MTB > NormTest c4;SUBC> RJTest. Probability Plot of diff MTB > Stack c2 c3 c5 ; #eSUBC> Subscripts c6;SUBC> UseNames.MTB > Rank c5 c7.MTB > erase c8-c100MTB > Unstack (c7);SUBC> Subscripts c6;SUBC> After;SUBC> VarNames.MTB > print c2 c8 c3 c9Data Display Columns and Ranks for Wilcoxon-Mann-Whitney Test.Row Fat C7_Fat Fit C7_Fit 1 4.99 9 6.68 23.5 2 4.24 5 6.42 20.0 3 4.74 7 7.32 26.0 4 4.93 8 6.38 19.0 5 4.16 4 6.16 16.0 6 4.12 3 7.08 25.0 7 5.10 11 6.37 18.0 8 4.47 6 6.53 22.0 9 5.30 12 6.68 23.5 10 3.12 1 5.71 14.0 11 3.77 2 6.20 17.0 12 5.09 10 6.04 15.0 13 5.40 13 6.52 21.0
MTB > sum c8Sum of C7_Fat Sum of C7_Fat = 91
28
252y0821a 3/31/08
MTB > sum c9 Version 6Sum of C7_Fit Sum of C7_Fit = 260
MTB > Mann-Whitney 95.0 c2 c3;SUBC> Alternative -1.Mann-Whitney Test and CI: Fat, Fit N MedianFat 13 4.7400Fit 13 6.4200
Point estimate for ETA1-ETA2 is -1.800095.4 Percent CI for ETA1-ETA2 is (-2.3298,-1.3802)W = 91.0Test of ETA1 = ETA2 vs ETA1 < ETA2 is significant at 0.0000The test is significant at 0.0000 (adjusted for ties)
MTB > Paired c2 c3; #fSUBC> Alternative -1.Paired T-Test and CI: Fat, Fit Paired T for Fat - Fit N Mean StDev SE MeanFat 13 4.572 0.667 0.185Fit 13 6.468 0.422 0.117Difference 13 -1.897 0.638 0.17795% upper bound for mean difference: -1.582T-Test of mean difference = 0 (vs < 0): T-Value = -10.72 P-Value = 0.000
MTB > WTest 0.0 c4; #gSUBC> Alternative -1.Wilcoxon Signed Rank Test: diff Test of median = 0.000000 versus median < 0.000000 N for Wilcoxon Estimated N Test Statistic P Mediandiff 13 13 0.0 0.001 -1.905
MTB > name c12 'sgnd rank'MTB > Rank c4 c10.MTB > let c11 = abs(c4)MTB > rank c11 c12MTB > let c13 = signs(c4)MTB > print c2 c3 c4 c11 c12 c13Data Display Sgnd Table for Wilcoxon Signed Rank Test.Row Fat Fit diff C11 rank C13 Last two columns give Signed Rank. 1 4.99 6.68 -1.69 1.69 6 -1 2 4.24 6.42 -2.18 2.18 9 -1 3 4.74 7.32 -2.58 2.58 11 -1 4 4.93 6.38 -1.45 1.45 5 -1 5 4.16 6.16 -2.00 2.00 7 -1 6 4.12 7.08 -2.96 2.96 13 -1 7 5.10 6.37 -1.27 1.27 3 -1 8 4.47 6.53 -2.06 2.06 8 -1 9 5.30 6.68 -1.38 1.38 4 -1 10 3.12 5.71 -2.59 2.59 12 -1 11 3.77 6.20 -2.43 2.43 10 -1 12 5.09 6.04 -0.95 0.95 1 -1 13 5.40 6.52 -1.12 1.12 2 -1
MTB > let c14 = 0 - 2*c2 #hMTB > let c14 = c14/c2
29
252y0821a 3/31/08
MTB > let c15 = c4 + 2 Version 6MTB > let c11 = abs(c15)MTB > rank c11 c12MTB > let c13 = signs(c15)MTB > print c4 c14 c15 c11 c12 c13Data Display Table for Wilcoxon Signed Rank Test for Median of 2. Sgnd Last two columns give Signed Rank.Row diff C14 C15 C11 rank C13 1 -1.69 -2 0.31 0.31 4 1 2 -2.18 -2 -0.18 0.18 3 -1 3 -2.58 -2 -0.58 0.58 7 -1 4 -1.45 -2 0.55 0.55 6 1 5 -2.00 -2 0.00 0.00 1 0 6 -2.96 -2 -0.96 0.96 12 -1 7 -1.27 -2 0.73 0.73 10 1 8 -2.06 -2 -0.06 0.06 2 -1 9 -1.38 -2 0.62 0.62 9 1 10 -2.59 -2 -0.59 0.59 8 -1 11 -2.43 -2 -0.43 0.43 5 -1 12 -0.95 -2 1.05 1.05 13 1 13 -1.12 -2 0.88 0.88 11 1
MTB > WTest 0.0 c15Wilcoxon Signed Rank Test: C15 Test of median = 0.000000 versus median not = 0.000000 N for Wilcoxon Estimated N Test Statistic P MedianC15 13 12 47.0 0.556 0.09500
MTB > WTest -2.0 c4Wilcoxon Signed Rank Test: diff Test of median = -2.000 versus median not = -2.000 N for Wilcoxon Estimated N Test Statistic P Mediandiff 13 12 47.0 0.556 -1.905
MTB > erase c20 - c27 #d againMTB > let c20 = c4MTB > Sort c20 c21;SUBC> By c20.MTB > mean (c20)Mean of C20 Mean of C20 = -1.89692
MTB > let c22 = c21 - mean(c21)MTB > stdev c21Standard Deviation of C21 Standard deviation of C21 = 0.637814
MTB > let c22 = c22/stdev(c21)MTB > describe c22Descriptive Statistics: C22 Variable N N* Mean SE Mean StDev Minimum Q1 Median Q3C22 13 0 -0.000 0.277 1.000 -1.667 -0.953 -0.162 0.897
Variable MaximumC22 1.485
MTB > CDF c22 c23;SUBC> Normal 0.0 1.0.MTB > name C20 'dmoved'
30

252y0821a 3/31/08
MTB > name c21 'dordered' Version 6MTB > name c22 'z_d'MTB > name c23 'Fe'MTB > Set c25DATA> 1( 1 : 13 / 1 )1DATA> End.MTB > name c25 'cumO'MTB > let c24 = c25/c25MTB > name c24 'O'MTB > name c25 'cumO'MTB > let c24 = c25/c25MTB > name C26 'Fo'MTB > let c26 = c25/count(c25)MTB > Name C27 'Fe-Fo'MTB > let c27 = c23 - c26MTB > let c27 = abs(c27)MTB > Print c20-c27Data Display Table for Lilliefors Test – Last Column is absolute D.Row dmoved dordered z_d Fe O cumO Fo Fe-Fo 1 -1.69 -2.96 -1.66675 0.047782 1 1 0.07692 0.029141 2 -2.18 -2.59 -1.08664 0.138597 1 2 0.15385 0.015249 3 -2.58 -2.58 -1.07097 0.142092 1 3 0.23077 0.088677 4 -1.45 -2.43 -0.83579 0.201637 1 4 0.30769 0.106055 5 -2.00 -2.18 -0.44382 0.328585 1 5 0.38462 0.056030 6 -2.96 -2.06 -0.25568 0.399099 1 6 0.46154 0.062440 7 -1.27 -2.00 -0.16161 0.435807 1 7 0.53846 0.102655 8 -2.06 -1.69 0.32443 0.627192 1 8 0.61538 0.011807 9 -1.38 -1.45 0.70071 0.758258 1 9 0.69231 0.065951 10 -2.59 -1.38 0.81046 0.791162 1 10 0.76923 0.021932 11 -2.43 -1.27 0.98292 0.837178 1 11 0.84615 0.008976 12 -0.95 -1.12 1.21810 0.888408 1 12 0.92308 0.034669 13 -1.12 -0.95 1.48464 0.931180 1 13 1.00000 0.068820
MTB > max (c27) In table above Fe column is Exact Cumulative Probability.Maximum of Fe-Fo Maximum of Fe-Fo = 0.106055
MTB > erase c20-c27MTB > end
31
252y0821a 3/31/08
Note that p-values for all three tests of Normality are above 5% - We cannot reject Normality.
32

252y0821a 3/31/08
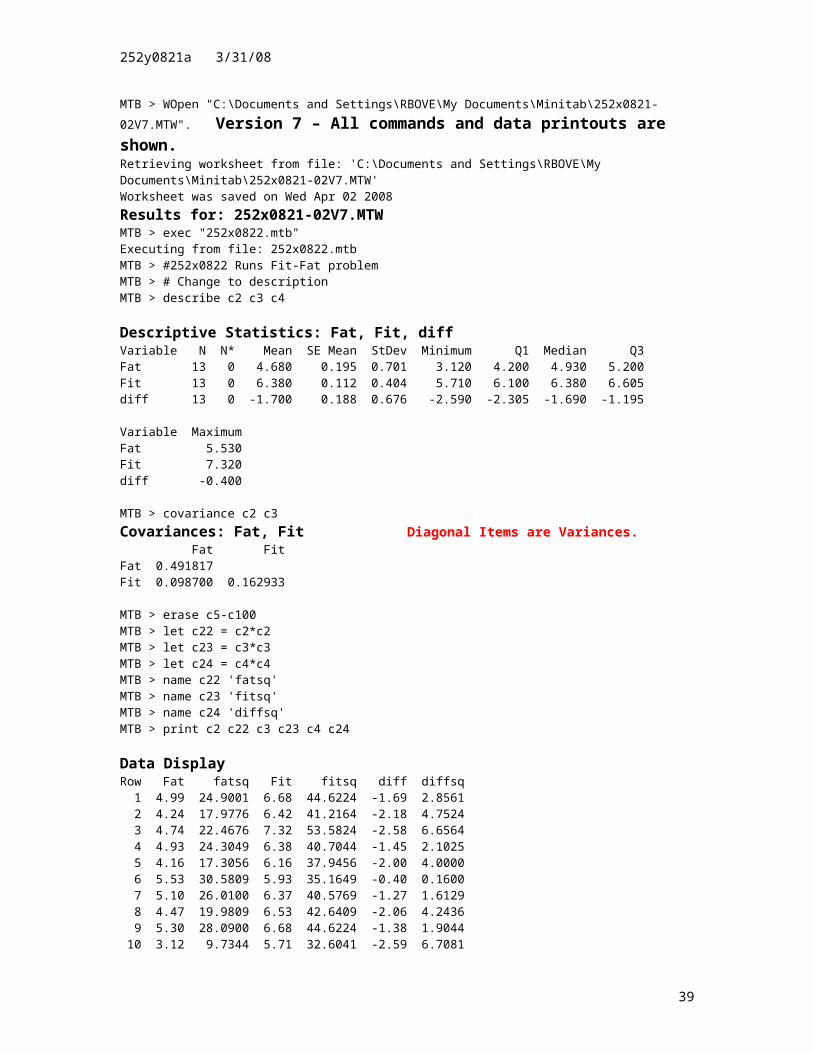
MTB > WOpen "C:\Documents and Settings\RBOVE\My Documents\Minitab\252x0821-02V7.MTW". Version 7 – All commands and data printouts are shown.Retrieving worksheet from file: 'C:\Documents and Settings\RBOVE\MyDocuments\Minitab\252x0821-02V7.MTW'Worksheet was saved on Wed Apr 02 2008Results for: 252x0821-02V7.MTWMTB > exec "252x0822.mtb"Executing from file: 252x0822.mtbMTB > #252x0822 Runs Fit-Fat problemMTB > # Change to descriptionMTB > describe c2 c3 c4 Descriptive Statistics: Fat, Fit, diff Variable N N* Mean SE Mean StDev Minimum Q1 Median Q3Fat 13 0 4.680 0.195 0.701 3.120 4.200 4.930 5.200Fit 13 0 6.380 0.112 0.404 5.710 6.100 6.380 6.605diff 13 0 -1.700 0.188 0.676 -2.590 -2.305 -1.690 -1.195
Variable MaximumFat 5.530Fit 7.320diff -0.400
MTB > covariance c2 c3Covariances: Fat, Fit Diagonal Items are Variances. Fat FitFat 0.491817Fit 0.098700 0.162933
MTB > erase c5-c100MTB > let c22 = c2*c2MTB > let c23 = c3*c3MTB > let c24 = c4*c4MTB > name c22 'fatsq'MTB > name c23 'fitsq'MTB > name c24 'diffsq'MTB > print c2 c22 c3 c23 c4 c24 Data Display Row Fat fatsq Fit fitsq diff diffsq 1 4.99 24.9001 6.68 44.6224 -1.69 2.8561 2 4.24 17.9776 6.42 41.2164 -2.18 4.7524 3 4.74 22.4676 7.32 53.5824 -2.58 6.6564 4 4.93 24.3049 6.38 40.7044 -1.45 2.1025 5 4.16 17.3056 6.16 37.9456 -2.00 4.0000 6 5.53 30.5809 5.93 35.1649 -0.40 0.1600 7 5.10 26.0100 6.37 40.5769 -1.27 1.6129 8 4.47 19.9809 6.53 42.6409 -2.06 4.2436 9 5.30 28.0900 6.68 44.6224 -1.38 1.9044 10 3.12 9.7344 5.71 32.6041 -2.59 6.7081 11 3.77 14.2129 6.20 38.4400 -2.43 5.9049 12 5.09 25.9081 6.04 36.4816 -0.95 0.9025 13 5.40 29.1600 6.52 42.5104 -1.12 1.2544
MTB > sum c2Sum of Fat Sum of Fat = 60.84
MTB > ssq c2Sum of Squares of Fat Sum of squares (uncorrected) of Fat = 290.633
33
252y0821a 3/31/08
MTB > sum c22 Version 7Sum of fatsq Sum of fatsq = 290.633
MTB > sum c3Sum of Fit Sum of Fit = 82.94
MTB > ssq c3Sum of Squares of Fit Sum of squares (uncorrected) of Fit = 531.112
MTB > sum c23Sum of fitsq Sum of fitsq = 531.112
MTB > sum c4Sum of diff Sum of diff = -22.1
MTB > ssq c4Sum of Squares of diff Sum of squares (uncorrected) of diff = 43.0582
MTB > sum c24Sum of diffsq Sum of diffsq = 43.0582
MTB > erase c22-c24MTB > twosample c2 c3;SUBC> pooled; #aSUBC> Alternative -1.Two-Sample T-Test and CI: Fat, Fit Two-sample T for Fat vs Fit N Mean StDev SE MeanFat 13 4.680 0.701 0.19Fit 13 6.380 0.404 0.11Difference = mu (Fat) - mu (Fit)Estimate for difference: -1.70095% upper bound for difference: -1.316T-Test of difference = 0 (vs <): T-Value = -7.58 P-Value = 0.000 DF = 24Both use Pooled StDev = 0.5722
MTB > twosample c2 c3; #bSUBC> Alternative -1.Two-Sample T-Test and CI: Fat, Fit Two-sample T for Fat vs Fit N Mean StDev SE MeanFat 13 4.680 0.701 0.19Fit 13 6.380 0.404 0.11Difference = mu (Fat) - mu (Fit)Estimate for difference: -1.70095% upper bound for difference: -1.312T-Test of difference = 0 (vs <): T-Value = -7.58 P-Value = 0.000 DF = 19
34

252y0821a 3/31/08
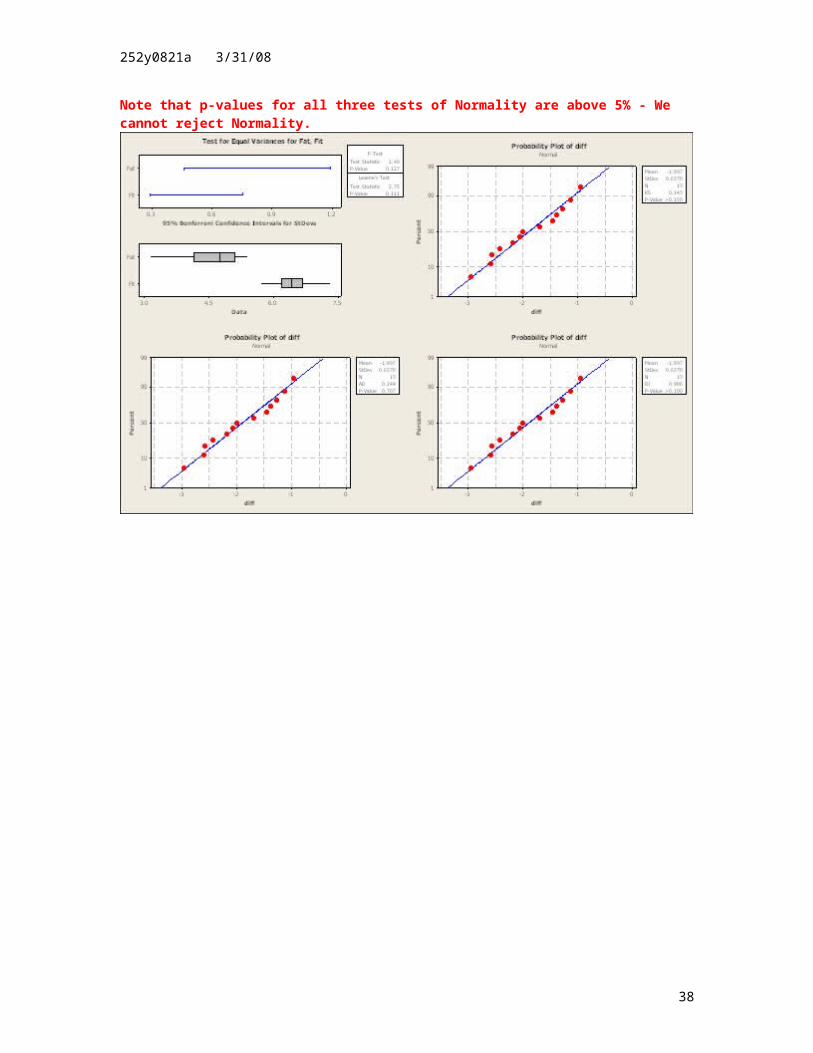
MTB > VarTest c2 c3; #c Version 7UBC> Unstacked.Test for Equal Variances: Fat, Fit 95% Bonferroni confidence intervals for standard deviations N Lower StDev UpperFat 13 0.480799 0.701296 1.25410Fit 13 0.276737 0.403650 0.72183F-Test (Normal Distribution)Test statistic = 3.02, p-value = 0.067Levene's Test (Any Continuous Distribution)Test statistic = 2.37, p-value = 0.137Test for Equal Variances for Fat, Fit All graphs are at end of printout.
MTB > covariance c4 c4 #dCovariances: diff, diff Diagonal Items are Variances. diff diffdiff 0.457350diff 0.457350 0.457350
MTB > NormTest c4;SUBC> KSTest.Probability Plot of diff
MTB > NormTest c4.Probability Plot of diff
MTB > NormTest c4;SUBC> RJTest.Probability Plot of diff
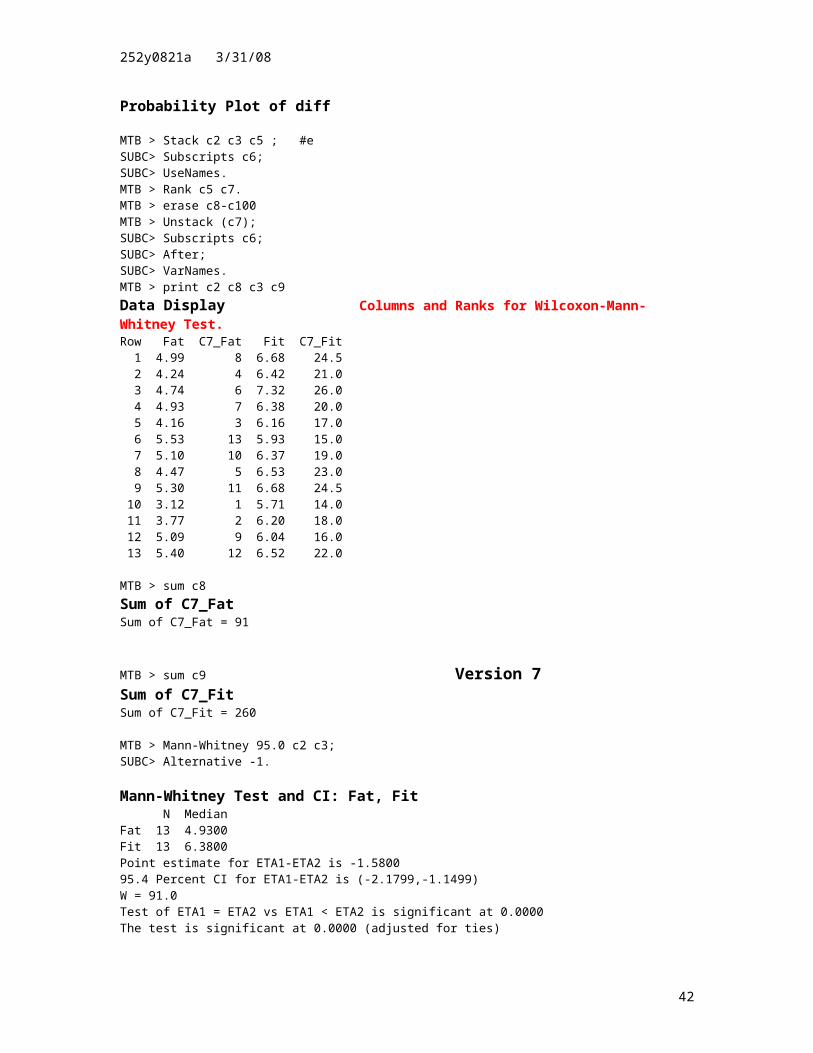
MTB > Stack c2 c3 c5 ; #eSUBC> Subscripts c6;SUBC> UseNames.MTB > Rank c5 c7.MTB > erase c8-c100MTB > Unstack (c7);SUBC> Subscripts c6;SUBC> After;SUBC> VarNames.MTB > print c2 c8 c3 c9Data Display Columns and Ranks for Wilcoxon-Mann-Whitney Test.Row Fat C7_Fat Fit C7_Fit 1 4.99 8 6.68 24.5 2 4.24 4 6.42 21.0 3 4.74 6 7.32 26.0 4 4.93 7 6.38 20.0 5 4.16 3 6.16 17.0 6 5.53 13 5.93 15.0 7 5.10 10 6.37 19.0 8 4.47 5 6.53 23.0 9 5.30 11 6.68 24.5 10 3.12 1 5.71 14.0 11 3.77 2 6.20 18.0 12 5.09 9 6.04 16.0 13 5.40 12 6.52 22.0
MTB > sum c8Sum of C7_Fat Sum of C7_Fat = 91
35

252y0821a 3/31/08
MTB > sum c9 Version 7Sum of C7_Fit Sum of C7_Fit = 260
MTB > Mann-Whitney 95.0 c2 c3;SUBC> Alternative -1. Mann-Whitney Test and CI: Fat, Fit N MedianFat 13 4.9300Fit 13 6.3800Point estimate for ETA1-ETA2 is -1.580095.4 Percent CI for ETA1-ETA2 is (-2.1799,-1.1499)W = 91.0Test of ETA1 = ETA2 vs ETA1 < ETA2 is significant at 0.0000The test is significant at 0.0000 (adjusted for ties)
MTB > Paired c2 c3; #fSUBC> Alternative -1.Paired T-Test and CI: Fat, Fit Paired T for Fat - Fit N Mean StDev SE MeanFat 13 4.680 0.701 0.195Fit 13 6.380 0.404 0.112Difference 13 -1.700 0.676 0.18895% upper bound for mean difference: -1.366T-Test of mean difference = 0 (vs < 0): T-Value = -9.06 P-Value = 0.000
MTB > WTest 0.0 c4; #gSUBC> Alternative -1.Wilcoxon Signed Rank Test: diff Test of median = 0.000000 versus median < 0.000000 N for Wilcoxon Estimated N Test Statistic P Mediandiff 13 13 0.0 0.001 -1.725
MTB > name c12 'sgnd rank'MTB > Rank c4 c10.MTB > let c11 = abs(c4)MTB > rank c11 c12MTB > let c13 = signs(c4)MTB > print c2 c3 c4 c11 c12 c13Data Display Table for Wilcoxon Signed Rank Test. Sgnd Last two columns give Signed Rank.Row Fat Fit diff C11 rank C13 1 4.99 6.68 -1.69 1.69 7 -1 2 4.24 6.42 -2.18 2.18 10 -1 3 4.74 7.32 -2.58 2.58 12 -1 4 4.93 6.38 -1.45 1.45 6 -1 5 4.16 6.16 -2.00 2.00 8 -1 6 5.53 5.93 -0.40 0.40 1 -1 7 5.10 6.37 -1.27 1.27 4 -1 8 4.47 6.53 -2.06 2.06 9 -1 9 5.30 6.68 -1.38 1.38 5 -1 10 3.12 5.71 -2.59 2.59 13 -1 11 3.77 6.20 -2.43 2.43 11 -1 12 5.09 6.04 -0.95 0.95 2 -1 13 5.40 6.52 -1.12 1.12 3 -1
MTB > let c14 = 0 - 2*c2 #hMTB > let c14 = c14/c2
36

252y0821a 3/31/08
MTB > let c15 = c4 + 2 Version 7MTB > let c11 = abs(c15)MTB > rank c11 c12MTB > let c13 = signs(c15)MTB > print c4 c14 c15 c11 c12 c13 Data Display Table for Wilcoxon Signed Rank Test for Median of 2. Sgnd Last two columns give Signed Rank.Row diff C14 C15 C11 rank C13 1 -1.69 -2 0.31 0.31 4 1 2 -2.18 -2 -0.18 0.18 3 -1 3 -2.58 -2 -0.58 0.58 7 -1 4 -1.45 -2 0.55 0.55 6 1 5 -2.00 -2 0.00 0.00 1 0 6 -0.40 -2 1.60 1.60 13 1 7 -1.27 -2 0.73 0.73 10 1 8 -2.06 -2 -0.06 0.06 2 -1 9 -1.38 -2 0.62 0.62 9 1 10 -2.59 -2 -0.59 0.59 8 -1 11 -2.43 -2 -0.43 0.43 5 -1 12 -0.95 -2 1.05 1.05 12 1 13 -1.12 -2 0.88 0.88 11 1
MTB > WTest 0.0 c15Wilcoxon Signed Rank Test: C15 Test of median = 0.000000 versus median not = 0.000000 N for Wilcoxon Estimated N Test Statistic P MedianC15 13 12 58.0 0.147 0.2750
MTB > WTest -2.0 c4Wilcoxon Signed Rank Test: diff Test of median = -2.000 versus median not = -2.000 N for Wilcoxon Estimated N Test Statistic P Mediandiff 13 12 58.0 0.147 -1.725
MTB > erase c20 - c27 #d againMTB > let c20 = c4MTB > Sort c20 c21;SUBC> By c20.MTB > mean (c20)Mean of C20 Mean of C20 = -1.7
MTB > let c22 = c21 - mean(c21)MTB > stdev c21Standard Deviation of C21 Standard deviation of C21 = 0.676277
MTB > let c22 = c22/stdev(c21)MTB > describe c22Descriptive Statistics: C22 Variable N N* Mean SE Mean StDev Minimum Q1 Median Q3C22 13 0 -0.000 0.277 1.000 -1.316 -0.895 0.015 0.747
Variable MaximumC22 1.922
MTB > CDF c22 c23;SUBC> Normal 0.0 1.0.
37
252y0821a 3/31/08
MTB > name C20 'dmoved' Version 7MTB > name c21 'dordered'MTB > name c22 'z_d'MTB > name c23 'Fe'MTB > Set c25DATA> 1( 1 : 13 / 1 )1DATA> End.MTB > name c25 'cumO'MTB > let c24 = c25/c25MTB > name c24 'O'MTB > name c25 'cumO'MTB > let c24 = c25/c25MTB > name C26 'Fo'MTB > let c26 = c25/count(c25)MTB > Name C27 'Fe-Fo'MTB > let c27 = c23 - c26MTB > let c27 = abs(c27)MTB > Print c20-c27Data Display Table for Lilliefors Test – Last Column is absolute D.Row dmoved dordered z_d Fe O cumO Fo Fe-Fo 1 -1.69 -2.59 -1.31603 0.094082 1 1 0.07692 0.017159 2 -2.18 -2.58 -1.30124 0.096588 1 2 0.15385 0.057258 3 -2.58 -2.43 -1.07944 0.140196 1 3 0.23077 0.090573 4 -1.45 -2.18 -0.70977 0.238924 1 4 0.30769 0.068769 5 -2.00 -2.06 -0.53233 0.297250 1 5 0.38462 0.087365 6 -0.40 -2.00 -0.44361 0.328664 1 6 0.46154 0.132875 7 -1.27 -1.69 0.01479 0.505899 1 7 0.53846 0.032563 8 -2.06 -1.45 0.36967 0.644186 1 8 0.61538 0.028802 9 -1.38 -1.38 0.47318 0.681957 1 9 0.69231 0.010350 10 -2.59 -1.27 0.63583 0.737558 1 10 0.76923 0.031673 11 -2.43 -1.12 0.85764 0.804454 1 11 0.84615 0.041700 12 -0.95 -0.95 1.10901 0.866288 1 12 0.92308 0.056789 13 -1.12 -0.40 1.92229 0.972715 1 13 1.00000 0.027285
MTB > max (c27) In table above Fe column is Exact Cumulative Probability.Maximum of Fe-Fo Maximum of Fe-Fo = 0.132875
MTB > erase c20-c27MTB > end
38
252y0821a 3/31/08
Note that p-values for all three tests of Normality are above 5% - We cannot reject Normality.
39

252y0821a 3/31/08
MTB > WOpen "C:\Documents and Settings\RBOVE\My Documents\Minitab\252x0821-02V8.MTW". Version 8 – All commands and data printouts are shown.Retrieving worksheet from file: 'C:\Documents and Settings\RBOVE\MyDocuments\Minitab\252x0821-02V8.MTW'Worksheet was saved on Wed Apr 02 2008Results for: 252x0821-02V8.MTWMTB > exec "252x0822.mtb"Executing from file: 252x0822.mtbMTB > #252x0822 Runs Fit-Fat problemMTB > # Change to descriptionMTB > describe c2 c3 c4Descriptive Statistics: Fat, Fit, diff Variable N N* Mean SE Mean StDev Minimum Q1 Median Q3Fat 13 0 4.605 0.196 0.705 3.120 4.140 4.740 5.195Fit 13 0 6.435 0.124 0.448 5.710 6.100 6.420 6.680diff 13 0 -1.830 0.207 0.746 -2.960 -2.505 -2.000 -1.250
Variable MaximumFat 5.530Fit 7.320diff -0.400
MTB > covariance c2 c3Covariances: Fat, Fit Diagonal Items are Variances. Fat FitFat 0.497094Fit 0.070844 0.200527
MTB > erase c5-c100MTB > let c22 = c2*c2MTB > let c23 = c3*c3MTB > let c24 = c4*c4MTB > name c22 'fatsq'MTB > name c23 'fitsq'MTB > name c24 'diffsq'MTB > print c2 c22 c3 c23 c4 c24Data Display Row Fat fatsq Fit fitsq diff diffsq 1 4.99 24.9001 6.68 44.6224 -1.69 2.8561 2 4.24 17.9776 6.42 41.2164 -2.18 4.7524 3 4.74 22.4676 7.32 53.5824 -2.58 6.6564 4 4.93 24.3049 6.38 40.7044 -1.45 2.1025 5 4.16 17.3056 6.16 37.9456 -2.00 4.0000 6 5.53 30.5809 5.93 35.1649 -0.40 0.1600 7 4.12 16.9744 7.08 50.1264 -2.96 8.7616 8 4.47 19.9809 6.53 42.6409 -2.06 4.2436 9 5.30 28.0900 6.68 44.6224 -1.38 1.9044 10 3.12 9.7344 5.71 32.6041 -2.59 6.7081 11 3.77 14.2129 6.20 38.4400 -2.43 5.9049 12 5.09 25.9081 6.04 36.4816 -0.95 0.9025 13 5.40 29.1600 6.52 42.5104 -1.12 1.2544
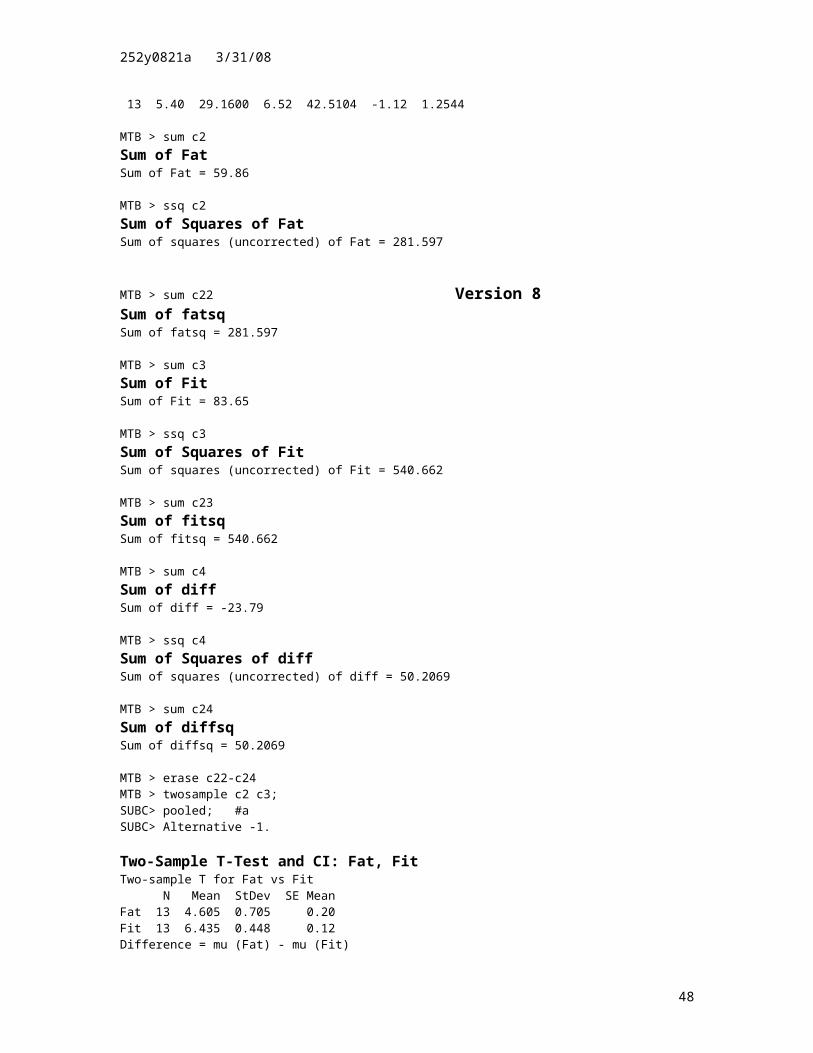
MTB > sum c2Sum of Fat Sum of Fat = 59.86
MTB > ssq c2Sum of Squares of Fat Sum of squares (uncorrected) of Fat = 281.597
40

252y0821a 3/31/08
MTB > sum c22 Version 8Sum of fatsq Sum of fatsq = 281.597
MTB > sum c3Sum of Fit Sum of Fit = 83.65
MTB > ssq c3Sum of Squares of Fit Sum of squares (uncorrected) of Fit = 540.662
MTB > sum c23Sum of fitsq Sum of fitsq = 540.662
MTB > sum c4Sum of diff Sum of diff = -23.79
MTB > ssq c4Sum of Squares of diff Sum of squares (uncorrected) of diff = 50.2069
MTB > sum c24Sum of diffsq Sum of diffsq = 50.2069
MTB > erase c22-c24MTB > twosample c2 c3;SUBC> pooled; #aSUBC> Alternative -1. Two-Sample T-Test and CI: Fat, Fit Two-sample T for Fat vs Fit N Mean StDev SE MeanFat 13 4.605 0.705 0.20Fit 13 6.435 0.448 0.12Difference = mu (Fat) - mu (Fit)Estimate for difference: -1.83095% upper bound for difference: -1.434T-Test of difference = 0 (vs <): T-Value = -7.90 P-Value = 0.000 DF = 24Both use Pooled StDev = 0.5906
MTB > twosample c2 c3; #bSUBC> Alternative -1.Two-Sample T-Test and CI: Fat, Fit Two-sample T for Fat vs Fit N Mean StDev SE MeanFat 13 4.605 0.705 0.20Fit 13 6.435 0.448 0.12Difference = mu (Fat) - mu (Fit)Estimate for difference: -1.83095% upper bound for difference: -1.430T-Test of difference = 0 (vs <): T-Value = -7.90 P-Value = 0.000 DF = 20
41
252y0821a 3/31/08
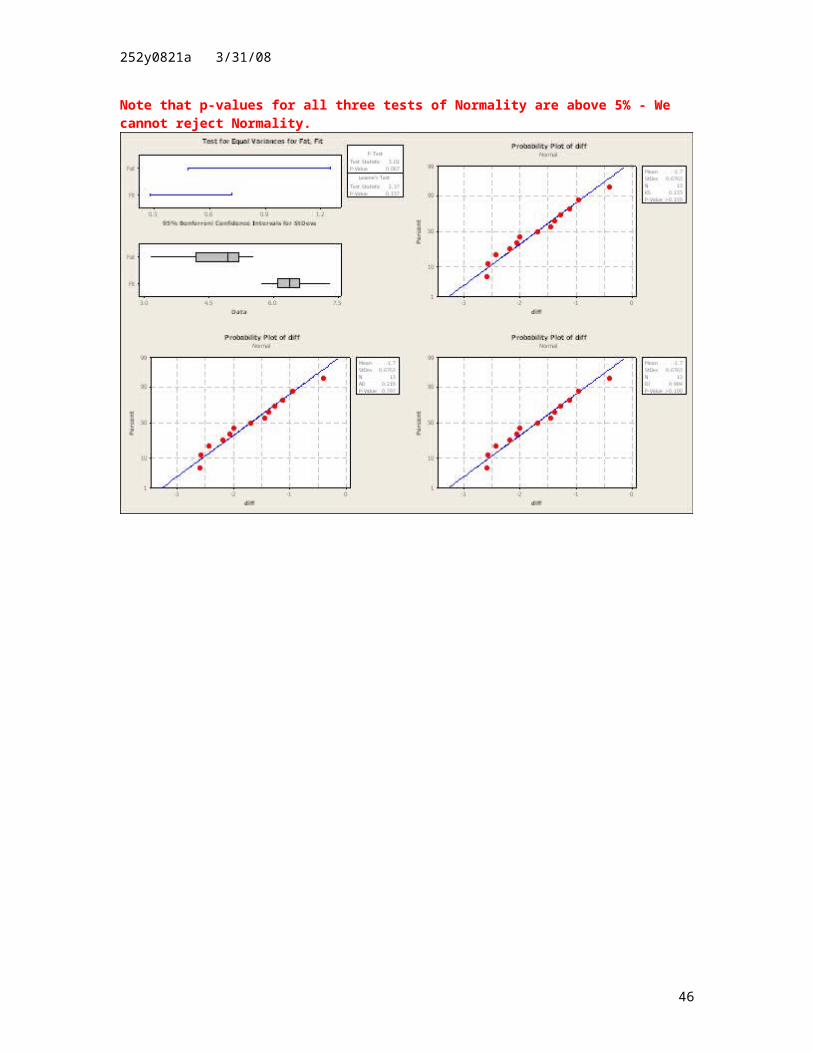
MTB > VarTest c2 c3; #c Version 8SUBC> Unstacked.Test for Equal Variances: Fat, Fit 95% Bonferroni confidence intervals for standard deviations N Lower StDev UpperFat 13 0.483371 0.705049 1.26081Fit 13 0.307007 0.447802 0.80079F-Test (Normal Distribution)Test statistic = 2.48, p-value = 0.130Levene's Test (Any Continuous Distribution)Test statistic = 2.75, p-value = 0.110Test for Equal Variances for Fat, Fit All graphs are at end of printout.
MTB > covariance c4 c4 #dCovariances: diff, diff Diagonal Items are Variances. diff diffdiff 0.555933diff 0.555933 0.555933
MTB > NormTest c4;SUBC> KSTest.Probability Plot of diff
MTB > NormTest c4.Probability Plot of diff
MTB > NormTest c4;SUBC> RJTest.Probability Plot of diff
MTB > Stack c2 c3 c5 ; #eSUBC> Subscripts c6;SUBC> UseNames.MTB > Rank c5 c7.MTB > erase c8-c100MTB > Unstack (c7);SUBC> Subscripts c6;SUBC> After;SUBC> VarNames.MTB > print c2 c8 c3 c9Data Display Columns and Ranks for Wilcoxon-Mann-Whitney Test.Row Fat C7_Fat Fit C7_Fit 1 4.99 9 6.68 23.5 2 4.24 5 6.42 20.0 3 4.74 7 7.32 26.0 4 4.93 8 6.38 19.0 5 4.16 4 6.16 17.0 6 5.53 13 5.93 15.0 7 4.12 3 7.08 25.0 8 4.47 6 6.53 22.0 9 5.30 11 6.68 23.5 10 3.12 1 5.71 14.0 11 3.77 2 6.20 18.0 12 5.09 10 6.04 16.0 13 5.40 12 6.52 21.0
MTB > sum c8Sum of C7_Fat Sum of C7_Fat = 91
42

252y0821a 3/31/08
MTB > sum c9 Version 8Sum of C7_Fit Sum of C7_Fit = 260
MTB > Mann-Whitney 95.0 c2 c3;SUBC> Alternative -1.Mann-Whitney Test and CI: Fat, Fit N MedianFat 13 4.7400Fit 13 6.4200Point estimate for ETA1-ETA2 is -1.770095.4 Percent CI for ETA1-ETA2 is (-2.3000,-1.2399)W = 91.0Test of ETA1 = ETA2 vs ETA1 < ETA2 is significant at 0.0000The test is significant at 0.0000 (adjusted for ties)
MTB > Paired c2 c3; #fSUBC> Alternative -1.Paired T-Test and CI: Fat, Fit Paired T for Fat - Fit N Mean StDev SE MeanFat 13 4.605 0.705 0.196Fit 13 6.435 0.448 0.124Difference 13 -1.830 0.746 0.20795% upper bound for mean difference: -1.461T-Test of mean difference = 0 (vs < 0): T-Value = -8.85 P-Value = 0.000MTB > WTest 0.0 c4; #gSUBC> Alternative -1. Wilcoxon Signed Rank Test: diff Test of median = 0.000000 versus median < 0.000000 N for Wilcoxon Estimated N Test Statistic P Mediandiff 13 13 0.0 0.001 -1.850
MTB > name c12 'sgnd rank'MTB > Rank c4 c10.MTB > let c11 = abs(c4)MTB > rank c11 c12MTB > let c13 = signs(c4)MTB > print c2 c3 c4 c11 c12 c13Data Display Table for Wilcoxon Signed Rank Test. Sgnd Last two columns give Signed RankRow Fat Fit diff C11 rank C13 1 4.99 6.68 -1.69 1.69 6 -1 2 4.24 6.42 -2.18 2.18 9 -1 3 4.74 7.32 -2.58 2.58 11 -1 4 4.93 6.38 -1.45 1.45 5 -1 5 4.16 6.16 -2.00 2.00 7 -1 6 5.53 5.93 -0.40 0.40 1 -1 7 4.12 7.08 -2.96 2.96 13 -1 8 4.47 6.53 -2.06 2.06 8 -1 9 5.30 6.68 -1.38 1.38 4 -1 10 3.12 5.71 -2.59 2.59 12 -1 11 3.77 6.20 -2.43 2.43 10 -1 12 5.09 6.04 -0.95 0.95 2 -1 13 5.40 6.52 -1.12 1.12 3 -1
MTB > let c14 = 0 - 2*c2 #hMTB > let c14 = c14/c2MTB > let c15 = c4 + 2
43

252y0821a 3/31/08
MTB > let c11 = abs(c15) Version 8MTB > rank c11 c12MTB > let c13 = signs(c15)MTB > print c4 c14 c15 c11 c12 c13Data Display Table for Wilcoxon Signed Rank Test for Median of 2. Sgnd Last two columns give Signed Rank.Row diff C14 C15 C11 rank C13 1 -1.69 -2 0.31 0.31 4 1 2 -2.18 -2 -0.18 0.18 3 -1 3 -2.58 -2 -0.58 0.58 7 -1 4 -1.45 -2 0.55 0.55 6 1 5 -2.00 -2 0.00 0.00 1 0 6 -0.40 -2 1.60 1.60 13 1 7 -2.96 -2 -0.96 0.96 11 -1 8 -2.06 -2 -0.06 0.06 2 -1 9 -1.38 -2 0.62 0.62 9 1 10 -2.59 -2 -0.59 0.59 8 -1 11 -2.43 -2 -0.43 0.43 5 -1 12 -0.95 -2 1.05 1.05 12 1 13 -1.12 -2 0.88 0.88 10 1
MTB > WTest 0.0 c15Wilcoxon Signed Rank Test: C15 Test of median = 0.000000 versus median not = 0.000000 N for Wilcoxon Estimated N Test Statistic P MedianC15 13 12 48.0 0.505 0.1500
MTB > WTest -2.0 c4Wilcoxon Signed Rank Test: diff Test of median = -2.000 versus median not = -2.000 N for Wilcoxon Estimated N Test Statistic P Mediandiff 13 12 48.0 0.505 -1.850
MTB > erase c20 - c27 #d againMTB > let c20 = c4MTB > Sort c20 c21;SUBC> By c20.MTB > mean (c20)Mean of C20 Mean of C20 = -1.83
MTB > let c22 = c21 - mean(c21)MTB > stdev c21Standard Deviation of C21 Standard deviation of C21 = 0.745609
MTB > let c22 = c22/stdev(c21)MTB > describe c22Descriptive Statistics: C22 Variable N N* Mean SE Mean StDev Minimum Q1 Median Q3C22 13 0 -0.000 0.277 1.000 -1.516 -0.905 -0.228 0.778
Variable MaximumC22 1.918
MTB > CDF c22 c23;SUBC> Normal 0.0 1.0.MTB > name C20 'dmoved'MTB > name c21 'dordered'
44

252y0821a 3/31/08
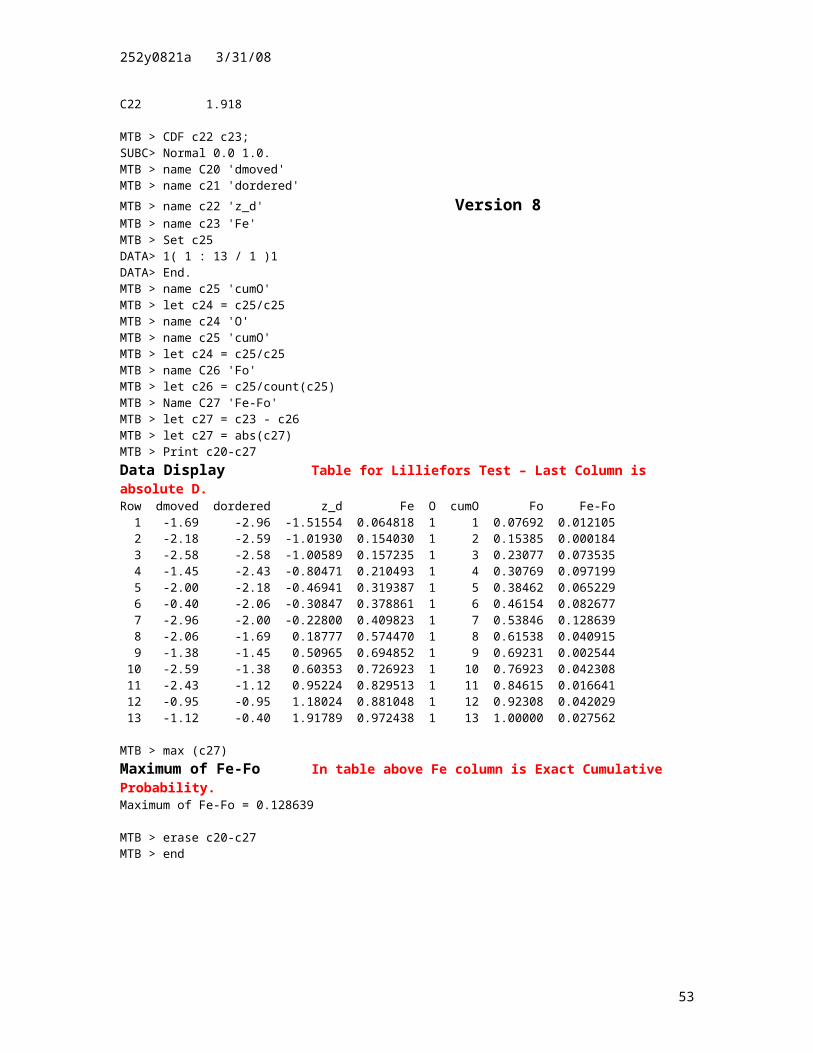
MTB > name c22 'z_d' Version 8MTB > name c23 'Fe'MTB > Set c25DATA> 1( 1 : 13 / 1 )1DATA> End.MTB > name c25 'cumO'MTB > let c24 = c25/c25MTB > name c24 'O'MTB > name c25 'cumO'MTB > let c24 = c25/c25MTB > name C26 'Fo'MTB > let c26 = c25/count(c25)MTB > Name C27 'Fe-Fo'MTB > let c27 = c23 - c26MTB > let c27 = abs(c27)MTB > Print c20-c27Data Display Table for Lilliefors Test – Last Column is absolute D.Row dmoved dordered z_d Fe O cumO Fo Fe-Fo 1 -1.69 -2.96 -1.51554 0.064818 1 1 0.07692 0.012105 2 -2.18 -2.59 -1.01930 0.154030 1 2 0.15385 0.000184 3 -2.58 -2.58 -1.00589 0.157235 1 3 0.23077 0.073535 4 -1.45 -2.43 -0.80471 0.210493 1 4 0.30769 0.097199 5 -2.00 -2.18 -0.46941 0.319387 1 5 0.38462 0.065229 6 -0.40 -2.06 -0.30847 0.378861 1 6 0.46154 0.082677 7 -2.96 -2.00 -0.22800 0.409823 1 7 0.53846 0.128639 8 -2.06 -1.69 0.18777 0.574470 1 8 0.61538 0.040915 9 -1.38 -1.45 0.50965 0.694852 1 9 0.69231 0.002544 10 -2.59 -1.38 0.60353 0.726923 1 10 0.76923 0.042308 11 -2.43 -1.12 0.95224 0.829513 1 11 0.84615 0.016641 12 -0.95 -0.95 1.18024 0.881048 1 12 0.92308 0.042029 13 -1.12 -0.40 1.91789 0.972438 1 13 1.00000 0.027562
MTB > max (c27)Maximum of Fe-Fo In table above Fe column is Exact Cumulative Probability.Maximum of Fe-Fo = 0.128639
MTB > erase c20-c27MTB > end
45
252y0821a 3/31/08
Note that p-values for all three tests of Normality are above 5% - We cannot reject Normality.
46

252y0821a 3/31/08
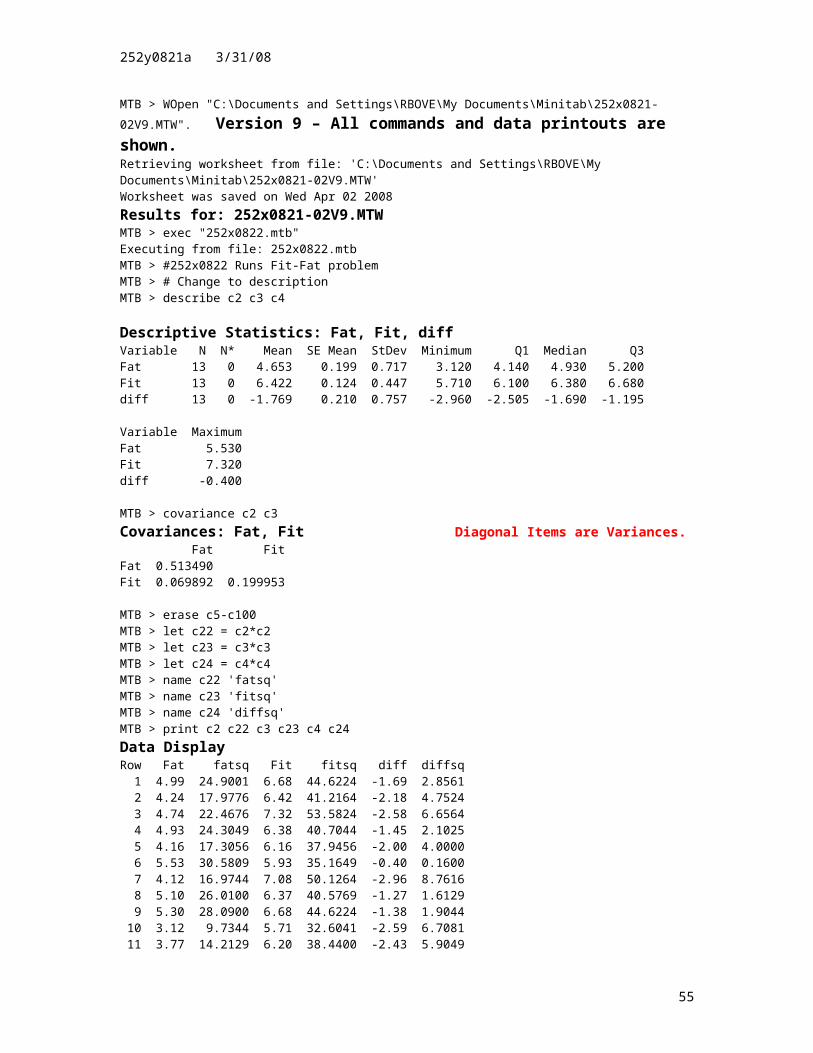
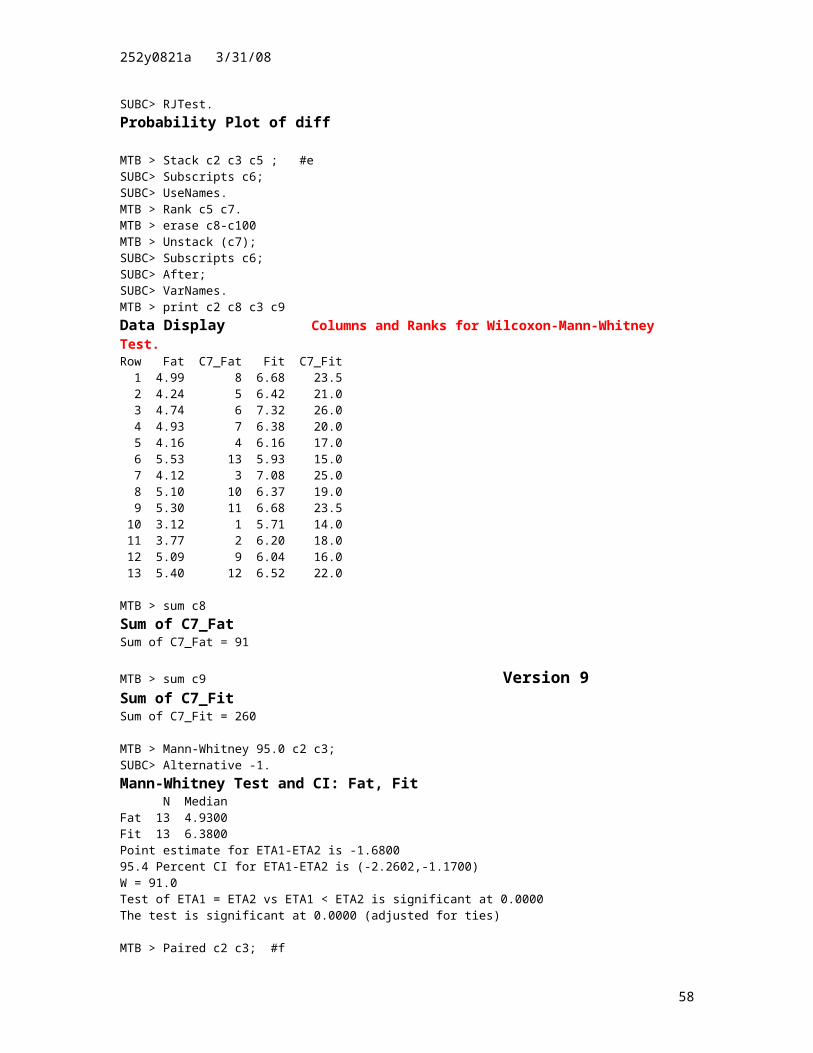
MTB > WOpen "C:\Documents and Settings\RBOVE\My Documents\Minitab\252x0821-02V9.MTW". Version 9 – All commands and data printouts are shown.Retrieving worksheet from file: 'C:\Documents and Settings\RBOVE\MyDocuments\Minitab\252x0821-02V9.MTW'Worksheet was saved on Wed Apr 02 2008Results for: 252x0821-02V9.MTWMTB > exec "252x0822.mtb"Executing from file: 252x0822.mtbMTB > #252x0822 Runs Fit-Fat problemMTB > # Change to descriptionMTB > describe c2 c3 c4 Descriptive Statistics: Fat, Fit, diff Variable N N* Mean SE Mean StDev Minimum Q1 Median Q3Fat 13 0 4.653 0.199 0.717 3.120 4.140 4.930 5.200Fit 13 0 6.422 0.124 0.447 5.710 6.100 6.380 6.680diff 13 0 -1.769 0.210 0.757 -2.960 -2.505 -1.690 -1.195
Variable MaximumFat 5.530Fit 7.320diff -0.400
MTB > covariance c2 c3Covariances: Fat, Fit Diagonal Items are Variances. Fat FitFat 0.513490Fit 0.069892 0.199953
MTB > erase c5-c100MTB > let c22 = c2*c2MTB > let c23 = c3*c3MTB > let c24 = c4*c4MTB > name c22 'fatsq'MTB > name c23 'fitsq'MTB > name c24 'diffsq'MTB > print c2 c22 c3 c23 c4 c24Data Display Row Fat fatsq Fit fitsq diff diffsq 1 4.99 24.9001 6.68 44.6224 -1.69 2.8561 2 4.24 17.9776 6.42 41.2164 -2.18 4.7524 3 4.74 22.4676 7.32 53.5824 -2.58 6.6564 4 4.93 24.3049 6.38 40.7044 -1.45 2.1025 5 4.16 17.3056 6.16 37.9456 -2.00 4.0000 6 5.53 30.5809 5.93 35.1649 -0.40 0.1600 7 4.12 16.9744 7.08 50.1264 -2.96 8.7616 8 5.10 26.0100 6.37 40.5769 -1.27 1.6129 9 5.30 28.0900 6.68 44.6224 -1.38 1.9044 10 3.12 9.7344 5.71 32.6041 -2.59 6.7081 11 3.77 14.2129 6.20 38.4400 -2.43 5.9049 12 5.09 25.9081 6.04 36.4816 -0.95 0.9025 13 5.40 29.1600 6.52 42.5104 -1.12 1.2544
MTB > sum c2Sum of Fat Sum of Fat = 60.49
MTB > ssq c2Sum of Squares of Fat Sum of squares (uncorrected) of Fat = 287.627
47
252y0821a 3/31/08
MTB > sum c22 Version 9Sum of fatsq Sum of fatsq = 287.627
MTB > sum c3Sum of Fit Sum of Fit = 83.49
MTB > ssq c3Sum of Squares of Fit Sum of squares (uncorrected) of Fit = 538.598
MTB > sum c23Sum of fitsq Sum of fitsq = 538.598
MTB > sum c4Sum of diff Sum of diff = -23
MTB > ssq c4Sum of Squares of diff Sum of squares (uncorrected) of diff = 47.5762
MTB > sum c24Sum of diffsq Sum of diffsq = 47.5762
MTB > erase c22-c24MTB > twosample c2 c3;SUBC> pooled; #aSUBC> Alternative -1.Two-Sample T-Test and CI: Fat, Fit Two-sample T for Fat vs Fit N Mean StDev SE MeanFat 13 4.653 0.717 0.20Fit 13 6.422 0.447 0.12Difference = mu (Fat) - mu (Fit)Estimate for difference: -1.76995% upper bound for difference: -1.368T-Test of difference = 0 (vs <): T-Value = -7.55 P-Value = 0.000 DF = 24Both use Pooled StDev = 0.5973
MTB > twosample c2 c3; #bSUBC> Alternative -1.Two-Sample T-Test and CI: Fat, Fit Two-sample T for Fat vs Fit N Mean StDev SE MeanFat 13 4.653 0.717 0.20Fit 13 6.422 0.447 0.12Difference = mu (Fat) - mu (Fit)Estimate for difference: -1.76995% upper bound for difference: -1.365T-Test of difference = 0 (vs <): T-Value = -7.55 P-Value = 0.000 DF = 20
48

252y0821a 3/31/08
MTB > VarTest c2 c3; #c Version 9SUBC> Unstacked.Test for Equal Variances: Fat, Fit 95% Bonferroni confidence intervals for standard deviations N Lower StDev UpperFat 13 0.491278 0.716582 1.28144Fit 13 0.306567 0.447161 0.79964F-Test (Normal Distribution)Test statistic = 2.57, p-value = 0.116Levene's Test (Any Continuous Distribution)Test statistic = 1.98, p-value = 0.172Test for Equal Variances for Fat, Fit All graphs are at end of printout.
MTB > covariance c4 c4 #dCovariances: diff, diff Diagonal Items are Variances. diff diffdiff 0.573658diff 0.573658 0.573658
MTB > NormTest c4;SUBC> KSTest.Probability Plot of diff
MTB > NormTest c4.Probability Plot of diff
MTB > NormTest c4;SUBC> RJTest.Probability Plot of diff
MTB > Stack c2 c3 c5 ; #eSUBC> Subscripts c6;SUBC> UseNames.MTB > Rank c5 c7.MTB > erase c8-c100MTB > Unstack (c7);SUBC> Subscripts c6;SUBC> After;SUBC> VarNames.MTB > print c2 c8 c3 c9Data Display Columns and Ranks for Wilcoxon-Mann-Whitney Test.Row Fat C7_Fat Fit C7_Fit 1 4.99 8 6.68 23.5 2 4.24 5 6.42 21.0 3 4.74 6 7.32 26.0 4 4.93 7 6.38 20.0 5 4.16 4 6.16 17.0 6 5.53 13 5.93 15.0 7 4.12 3 7.08 25.0 8 5.10 10 6.37 19.0 9 5.30 11 6.68 23.5 10 3.12 1 5.71 14.0 11 3.77 2 6.20 18.0 12 5.09 9 6.04 16.0 13 5.40 12 6.52 22.0
MTB > sum c8Sum of C7_Fat Sum of C7_Fat = 91
49

252y0821a 3/31/08
MTB > sum c9 Version 9Sum of C7_Fit Sum of C7_Fit = 260
MTB > Mann-Whitney 95.0 c2 c3;SUBC> Alternative -1.Mann-Whitney Test and CI: Fat, Fit N MedianFat 13 4.9300Fit 13 6.3800Point estimate for ETA1-ETA2 is -1.680095.4 Percent CI for ETA1-ETA2 is (-2.2602,-1.1700)W = 91.0Test of ETA1 = ETA2 vs ETA1 < ETA2 is significant at 0.0000The test is significant at 0.0000 (adjusted for ties)
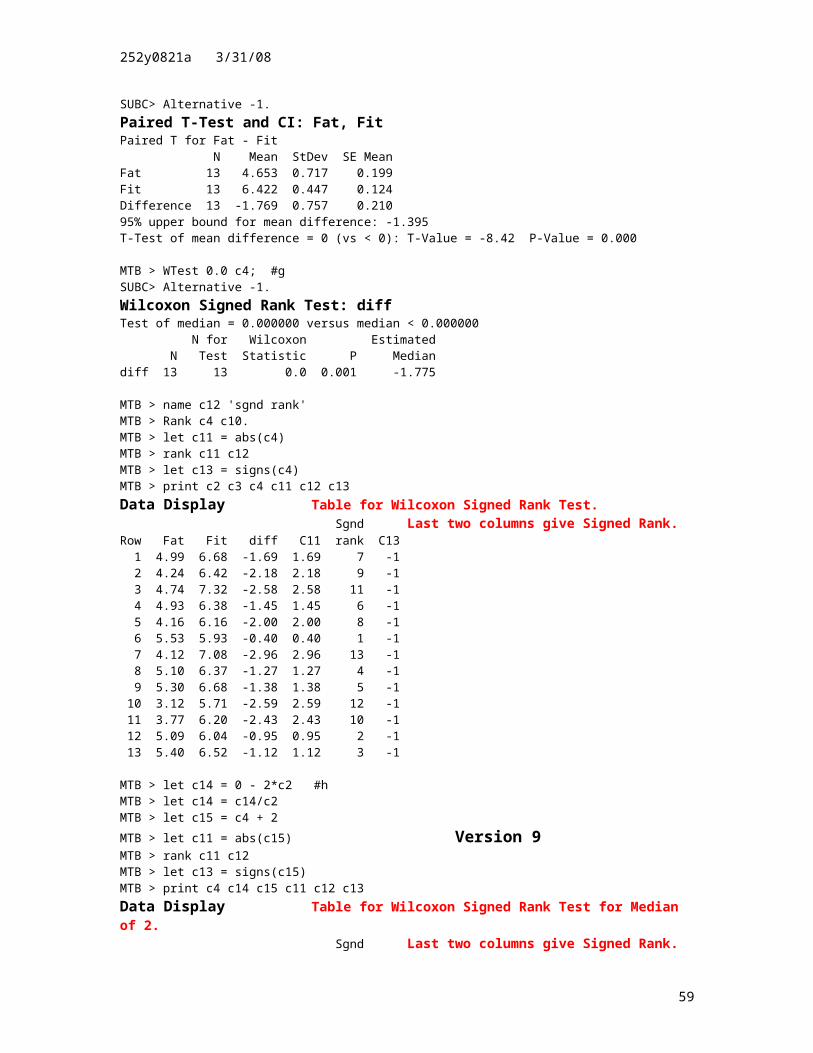
MTB > Paired c2 c3; #fSUBC> Alternative -1.Paired T-Test and CI: Fat, Fit Paired T for Fat - Fit N Mean StDev SE MeanFat 13 4.653 0.717 0.199Fit 13 6.422 0.447 0.124Difference 13 -1.769 0.757 0.21095% upper bound for mean difference: -1.395T-Test of mean difference = 0 (vs < 0): T-Value = -8.42 P-Value = 0.000
MTB > WTest 0.0 c4; #gSUBC> Alternative -1.Wilcoxon Signed Rank Test: diff Test of median = 0.000000 versus median < 0.000000 N for Wilcoxon Estimated N Test Statistic P Mediandiff 13 13 0.0 0.001 -1.775
MTB > name c12 'sgnd rank'MTB > Rank c4 c10.MTB > let c11 = abs(c4)MTB > rank c11 c12MTB > let c13 = signs(c4)MTB > print c2 c3 c4 c11 c12 c13Data Display Table for Wilcoxon Signed Rank Test. Sgnd Last two columns give Signed Rank.Row Fat Fit diff C11 rank C13 1 4.99 6.68 -1.69 1.69 7 -1 2 4.24 6.42 -2.18 2.18 9 -1 3 4.74 7.32 -2.58 2.58 11 -1 4 4.93 6.38 -1.45 1.45 6 -1 5 4.16 6.16 -2.00 2.00 8 -1 6 5.53 5.93 -0.40 0.40 1 -1 7 4.12 7.08 -2.96 2.96 13 -1 8 5.10 6.37 -1.27 1.27 4 -1 9 5.30 6.68 -1.38 1.38 5 -1 10 3.12 5.71 -2.59 2.59 12 -1 11 3.77 6.20 -2.43 2.43 10 -1 12 5.09 6.04 -0.95 0.95 2 -1 13 5.40 6.52 -1.12 1.12 3 -1
MTB > let c14 = 0 - 2*c2 #hMTB > let c14 = c14/c2MTB > let c15 = c4 + 2
50

252y0821a 3/31/08
MTB > let c11 = abs(c15) Version 9MTB > rank c11 c12MTB > let c13 = signs(c15)MTB > print c4 c14 c15 c11 c12 c13Data Display Table for Wilcoxon Signed Rank Test for Median of 2. Sgnd Last two columns give Signed Rank.Row diff C14 C15 C11 rank C13 1 -1.69 -2 0.31 0.31 3 1 2 -2.18 -2 -0.18 0.18 2 -1 3 -2.58 -2 -0.58 0.58 6 -1 4 -1.45 -2 0.55 0.55 5 1 5 -2.00 -2 0.00 0.00 1 0 6 -0.40 -2 1.60 1.60 13 1 7 -2.96 -2 -0.96 0.96 11 -1 8 -1.27 -2 0.73 0.73 9 1 9 -1.38 -2 0.62 0.62 8 1 10 -2.59 -2 -0.59 0.59 7 -1 11 -2.43 -2 -0.43 0.43 4 -1 12 -0.95 -2 1.05 1.05 12 1 13 -1.12 -2 0.88 0.88 10 1
MTB > WTest 0.0 c15Wilcoxon Signed Rank Test: C15 Test of median = 0.000000 versus median not = 0.000000 N for Wilcoxon Estimated N Test Statistic P MedianC15 13 12 53.0 0.290 0.2250
MTB > WTest -2.0 c4Wilcoxon Signed Rank Test: diff Test of median = -2.000 versus median not = -2.000 N for Wilcoxon Estimated N Test Statistic P Mediandiff 13 12 53.0 0.290 -1.775
MTB > erase c20 - c27 #d againMTB > let c20 = c4MTB > Sort c20 c21;SUBC> By c20.MTB > mean (c20)Mean of C20 Mean of C20 = -1.76923
MTB > let c22 = c21 - mean(c21)MTB > stdev c21Standard Deviation of C21 Standard deviation of C21 = 0.757402
MTB > let c22 = c22/stdev(c21)MTB > describe c22Descriptive Statistics: C22 Variable N N* Mean SE Mean StDev Minimum Q1 Median Q3C22 13 0 -0.000 0.277 1.000 -1.572 -0.971 0.105 0.758
Variable MaximumC22 1.808
MTB > CDF c22 c23;SUBC> Normal 0.0 1.0.MTB > name C20 'dmoved'MTB > name c21 'dordered'
51

252y0821a 3/31/08
MTB > name c22 'z_d' Version 9
MTB > name c23 'Fe'MTB > Set c25DATA> 1( 1 : 13 / 1 )1DATA> End.MTB > name c25 'cumO'MTB > let c24 = c25/c25MTB > name c24 'O'MTB > name c25 'cumO'MTB > let c24 = c25/c25MTB > name C26 'Fo'MTB > let c26 = c25/count(c25)MTB > Name C27 'Fe-Fo'MTB > let c27 = c23 - c26MTB > let c27 = abs(c27)MTB > Print c20-c27Data Display Table for Lilliefors Test – Last Column is absolute D.Row dmoved dordered z_d Fe O cumO Fo Fe-Fo 1 -1.69 -2.96 -1.57218 0.057955 1 1 0.07692 0.018968 2 -2.18 -2.59 -1.08366 0.139257 1 2 0.15385 0.014589 3 -2.58 -2.58 -1.07046 0.142206 1 3 0.23077 0.088563 4 -1.45 -2.43 -0.87242 0.191491 1 4 0.30769 0.116201 5 -2.00 -2.18 -0.54234 0.293792 1 5 0.38462 0.090823 6 -0.40 -2.00 -0.30469 0.380303 1 6 0.46154 0.081236 7 -2.96 -1.69 0.10461 0.541657 1 7 0.53846 0.003195 8 -1.27 -1.45 0.42148 0.663298 1 8 0.61538 0.047914 9 -1.38 -1.38 0.51390 0.696340 1 9 0.69231 0.004032 10 -2.59 -1.27 0.65914 0.745096 1 10 0.76923 0.024135 11 -2.43 -1.12 0.85718 0.804328 1 11 0.84615 0.041826 12 -0.95 -0.95 1.08163 0.860292 1 12 0.92308 0.062785 13 -1.12 -0.40 1.80780 0.964681 1 13 1.00000 0.035319
MTB > max (c27) In table above Fe column is Exact Cumulative Probability.Maximum of Fe-Fo Maximum of Fe-Fo = 0.116201
MTB > erase c20-c27MTB > end
52
252y0821a 3/31/08
Note that p-values for all three tests of Normality are above 5% - We cannot reject Normality.
53

252y0821a 3/31/08
MTB > WOpen "C:\Documents and Settings\RBOVE\My Documents\Minitab\252x0821-02v10.MTW". Version 10 – All commands and data printouts are shown.Retrieving worksheet from file: 'C:\Documents and Settings\RBOVE\MyDocuments\Minitab\252x0821-02v10.MTW'Worksheet was saved on Wed Apr 02 2008Results for: 252x0821-02v10.MTWMTB > exec "252x0822.mtb"Executing from file: 252x0822.mtbMTB > #252x0822 Runs Fit-Fat problemMTB > # Change to descriptionMTB > describe c2 c3 c4Descriptive Statistics: Fat, Fit, diff Variable N N* Mean SE Mean StDev Minimum Q1 Median Q3Fat 13 0 4.589 0.192 0.691 3.120 4.140 4.740 5.095Fit 13 0 6.411 0.123 0.442 5.710 6.100 6.380 6.605diff 13 0 -1.822 0.208 0.752 -2.960 -2.505 -2.000 -1.195
Variable MaximumFat 5.530Fit 7.320diff -0.400
MTB > covariance c2 c3Covariances: Fat, Fit Diagonal Items are Variances. Fat FitFat 0.476991Fit 0.053559 0.195241
MTB > erase c5-c100MTB > let c22 = c2*c2MTB > let c23 = c3*c3MTB > let c24 = c4*c4MTB > name c22 'fatsq'MTB > name c23 'fitsq'MTB > name c24 'diffsq'MTB > print c2 c22 c3 c23 c4 c24Data Display Row Fat fatsq Fit fitsq diff diffsq 1 4.99 24.9001 6.68 44.6224 -1.69 2.8561 2 4.24 17.9776 6.42 41.2164 -2.18 4.7524 3 4.74 22.4676 7.32 53.5824 -2.58 6.6564 4 4.93 24.3049 6.38 40.7044 -1.45 2.1025 5 4.16 17.3056 6.16 37.9456 -2.00 4.0000 6 5.53 30.5809 5.93 35.1649 -0.40 0.1600 7 4.12 16.9744 7.08 50.1264 -2.96 8.7616 8 5.10 26.0100 6.37 40.5769 -1.27 1.6129 9 4.47 19.9809 6.53 42.6409 -2.06 4.2436 10 3.12 9.7344 5.71 32.6041 -2.59 6.7081 11 3.77 14.2129 6.20 38.4400 -2.43 5.9049 12 5.09 25.9081 6.04 36.4816 -0.95 0.9025 13 5.40 29.1600 6.52 42.5104 -1.12 1.2544
MTB > sum c2Sum of Fat Sum of Fat = 59.66
MTB > ssq c2Sum of Squares of Fat Sum of squares (uncorrected) of Fat = 279.517
54
252y0821a 3/31/08
MTB > sum c22 Version 10Sum of fatsq Sum of fatsq = 279.517
MTB > sum c3Sum of Fit Sum of Fit = 83.34
MTB > ssq c3Sum of Squares of Fit Sum of squares (uncorrected) of Fit = 536.616
MTB > sum c23Sum of fitsq Sum of fitsq = 536.616
MTB > sum c4Sum of diff Sum of diff = -23.68
MTB > ssq c4Sum of Squares of diff Sum of squares (uncorrected) of diff = 49.9154
MTB > sum c24Sum of diffsq Sum of diffsq = 49.9154
MTB > erase c22-c24MTB > twosample c2 c3;SUBC> pooled; #aSUBC> Alternative -1.Two-Sample T-Test and CI: Fat, Fit Two-sample T for Fat vs Fit N Mean StDev SE MeanFat 13 4.589 0.691 0.19Fit 13 6.411 0.442 0.12Difference = mu (Fat) - mu (Fit)Estimate for difference: -1.82295% upper bound for difference: -1.432T-Test of difference = 0 (vs <): T-Value = -8.01 P-Value = 0.000 DF = 24Both use Pooled StDev = 0.5798
MTB > twosample c2 c3; #bSUBC> Alternative -1.Two-Sample T-Test and CI: Fat, Fit Two-sample T for Fat vs Fit N Mean StDev SE MeanFat 13 4.589 0.691 0.19Fit 13 6.411 0.442 0.12Difference = mu (Fat) - mu (Fit)Estimate for difference: -1.82295% upper bound for difference: -1.429T-Test of difference = 0 (vs <): T-Value = -8.01 P-Value = 0.000 DF = 20
55

252y0821a 3/31/08
MTB > VarTest c2 c3; #c Version 10SUBC> Unstacked.Test for Equal Variances: Fat, Fit 95% Bonferroni confidence intervals for standard deviations N Lower StDev UpperFat 13 0.473496 0.690645 1.23506Fit 13 0.302933 0.441861 0.79016F-Test (Normal Distribution)Test statistic = 2.44, p-value = 0.136Levene's Test (Any Continuous Distribution)Test statistic = 2.70, p-value = 0.113Test for Equal Variances for Fat, Fit All graphs are at end of printout.
MTB > covariance c4 c4 #dCovariances: diff, diff Diagonal Items are Variances. diff diffdiff 0.565114diff 0.565114 0.565114
MTB > NormTest c4;SUBC> KSTest.Probability Plot of diff
MTB > NormTest c4.Probability Plot of diff
MTB > NormTest c4;SUBC> RJTest.Probability Plot of diff
MTB > Stack c2 c3 c5 ; #eSUBC> Subscripts c6;SUBC> UseNames.MTB > Rank c5 c7.MTB > erase c8-c100MTB > Unstack (c7);SUBC> Subscripts c6;SUBC> After;SUBC> VarNames.MTB > print c2 c8 c3 c9Data Display Row Fat C7_Fat Fit C7_Fit Columns and Ranks for Wilcoxon-Mann-Whitney Test. 1 4.99 9 6.68 24 2 4.24 5 6.42 21 3 4.74 7 7.32 26 4 4.93 8 6.38 20 5 4.16 4 6.16 17 6 5.53 13 5.93 15 7 4.12 3 7.08 25 8 5.10 11 6.37 19 9 4.47 6 6.53 23 10 3.12 1 5.71 14 11 3.77 2 6.20 18 12 5.09 10 6.04 16 13 5.40 12 6.52 22
MTB > sum c8Sum of C7_Fat Sum of C7_Fat = 91
56

252y0821a 3/31/08
MTB > sum c9 Version 10Sum of C7_Fit Sum of C7_Fit = 260
MTB > Mann-Whitney 95.0 c2 c3;SUBC> Alternative -1.Mann-Whitney Test and CI: Fat, Fit N MedianFat 13 4.7400Fit 13 6.3800Point estimate for ETA1-ETA2 is -1.750095.4 Percent CI for ETA1-ETA2 is (-2.2699,-1.2796)W = 91.0Test of ETA1 = ETA2 vs ETA1 < ETA2 is significant at 0.0000
MTB > Paired c2 c3; #fSUBC> Alternative -1.Paired T-Test and CI: Fat, Fit Paired T for Fat - Fit N Mean StDev SE MeanFat 13 4.589 0.691 0.192Fit 13 6.411 0.442 0.123Difference 13 -1.822 0.752 0.20895% upper bound for mean difference: -1.450T-Test of mean difference = 0 (vs < 0): T-Value = -8.74 P-Value = 0.000
MTB > WTest 0.0 c4; #gSUBC> Alternative -1.Wilcoxon Signed Rank Test: diff Test of median = 0.000000 versus median < 0.000000 N for Wilcoxon Estimated N Test Statistic P Mediandiff 13 13 0.0 0.001 -1.850
MTB > name c12 'sgnd rank'MTB > Rank c4 c10.MTB > let c11 = abs(c4)MTB > rank c11 c12MTB > let c13 = signs(c4)MTB > print c2 c3 c4 c11 c12 c13Data Display Table for Wilcoxon Signed Rank Test. Sgnd Last two columns give Signed Rank.Row Fat Fit diff C11 rank C13 1 4.99 6.68 -1.69 1.69 6 -1 2 4.24 6.42 -2.18 2.18 9 -1 3 4.74 7.32 -2.58 2.58 11 -1 4 4.93 6.38 -1.45 1.45 5 -1 5 4.16 6.16 -2.00 2.00 7 -1 6 5.53 5.93 -0.40 0.40 1 -1 7 4.12 7.08 -2.96 2.96 13 -1 8 5.10 6.37 -1.27 1.27 4 -1 9 4.47 6.53 -2.06 2.06 8 -1 10 3.12 5.71 -2.59 2.59 12 -1 11 3.77 6.20 -2.43 2.43 10 -1 12 5.09 6.04 -0.95 0.95 2 -1 13 5.40 6.52 -1.12 1.12 3 -1
MTB > let c14 = 0 - 2*c2 #hMTB > let c14 = c14/c2MTB > let c15 = c4 + 2MTB > let c11 = abs(c15)
57
252y0821a 3/31/08
MTB > rank c11 c12MTB > let c13 = signs(c15) Version 10MTB > print c4 c14 c15 c11 c12 c13Data Display Table for Wilcoxon Signed Rank Test for Median of 2. Sgnd Last two columns give Signed Rank.Row diff C14 C15 C11 rank C13 1 -1.69 -2 0.31 0.31 4 1 2 -2.18 -2 -0.18 0.18 3 -1 3 -2.58 -2 -0.58 0.58 7 -1 4 -1.45 -2 0.55 0.55 6 1 5 -2.00 -2 0.00 0.00 1 0 6 -0.40 -2 1.60 1.60 13 1 7 -2.96 -2 -0.96 0.96 11 -1 8 -1.27 -2 0.73 0.73 9 1 9 -2.06 -2 -0.06 0.06 2 -1 10 -2.59 -2 -0.59 0.59 8 -1 11 -2.43 -2 -0.43 0.43 5 -1 12 -0.95 -2 1.05 1.05 12 1 13 -1.12 -2 0.88 0.88 10 1
MTB > WTest 0.0 c15Wilcoxon Signed Rank Test: C15 Test of median = 0.000000 versus median not = 0.000000 N for Wilcoxon Estimated N Test Statistic P MedianC15 13 12 48.0 0.505 0.1500
MTB > WTest -2.0 c4Wilcoxon Signed Rank Test: diff Test of median = -2.000 versus median not = -2.000 N for Wilcoxon Estimated N Test Statistic P Mediandiff 13 12 48.0 0.505 -1.850
MTB > erase c20 - c27 #d againMTB > let c20 = c4MTB > Sort c20 c21;SUBC> By c20.MTB > mean (c20)Mean of C20 Mean of C20 = -1.82154
MTB > let c22 = c21 - mean(c21)TB > stdev c21Standard Deviation of C21 Standard deviation of C21 = 0.751741
MTB > let c22 = c22/stdev(c21)MTB > describe c22Descriptive Statistics: C22 Variable N N* Mean SE Mean StDev Minimum Q1 Median Q3C22 13 0 -0.000 0.277 1.000 -1.514 -0.909 -0.237 0.833
Variable MaximumC22 1.891
MTB > CDF c22 c23;SUBC> Normal 0.0 1.0.MTB > name C20 'dmoved'MTB > name c21 'dordered'MTB > name c22 'z_d'
58
252y0821a 3/31/08
MTB > name c23 'Fe' Version 10MTB > Set c25DATA> 1( 1 : 13 / 1 )1DATA> End.MTB > name c25 'cumO'MTB > let c24 = c25/c25MTB > name c24 'O'MTB > name c25 'cumO'MTB > let c24 = c25/c25MTB > name C26 'Fo'MTB > let c26 = c25/count(c25)MTB > Name C27 'Fe-Fo'MTB > let c27 = c23 - c26MTB > let c27 = abs(c27)MTB > Print c20-c27Data Display Table for Lilliefors Test – Last Column is absolute D.Row dmoved dordered z_d Fe O cumO Fo Fe-Fo 1 -1.69 -2.96 -1.51443 0.064958 1 1 0.07692 0.011965 2 -2.18 -2.59 -1.02224 0.153333 1 2 0.15385 0.000513 3 -2.58 -2.58 -1.00894 0.156502 1 3 0.23077 0.074268 4 -1.45 -2.43 -0.80940 0.209142 1 4 0.30769 0.098551 5 -2.00 -2.18 -0.47684 0.316737 1 5 0.38462 0.067878 6 -0.40 -2.06 -0.31721 0.375541 1 6 0.46154 0.085997 7 -2.96 -2.00 -0.23740 0.406174 1 7 0.53846 0.132287 8 -1.27 -1.69 0.17498 0.569452 1 8 0.61538 0.045933 9 -2.06 -1.45 0.49424 0.689431 1 9 0.69231 0.002877 10 -2.59 -1.27 0.73368 0.768429 1 10 0.76923 0.000802 11 -2.43 -1.12 0.93322 0.824646 1 11 0.84615 0.021507 12 -0.95 -0.95 1.15936 0.876845 1 12 0.92308 0.046232 13 -1.12 -0.40 1.89100 0.970688 1 13 1.00000 0.029312
MTB > max (c27)Maximum of Fe-Fo In table above Fe column is Exact Cumulative Probability.Maximum of Fe-Fo = 0.132287
MTB > erase c20-c27MTB > end
59

252y0821a 3/31/08
Note that p-values for all three tests of Normality are above 5% - We cannot reject Normality.
60