Embed Size (px)
Citation preview
Exchange Traded Funds (ETFs) in the U.S. have never been more popular, and while the market has never before been so crowded, it is also ripe with potential for firms willing to innovate. This report, produced in conjunction with Strategic Insight, looks at the state of the ETF market and the reasons behind its boom in recent years – dynamics that are important to understand, regardless of whether or not an asset manager offers ETFs. It explains why ETFs are entering the mainstream, how they are redefining investment management and how asset managers can still tap the vigorous growth of this industry with products that are passive, active, or somewhere in between.
Executive Summary
• The U.S. ETF market, now just over $1 trillion, is still growing remarkably quickly for an industry its size. We predict that ETF assets (including Exchange Traded Notes) will hit $2 trillion before the end of 2015. Such tremendous growth creates more opportunities for a wider array of ETF managers and a greater variety of ETF products.
• More and more, ETFs are blurring the distinction between alpha and beta. In some cases, financial advisors are dynamically managing a set of passive ETF “building blocks” to generate excess returns that resemble traditional alpha. In other cases, investors are using individual ETFs that are either actively managed or track customized indexes that are dynamic enough to be considered quasi-active.
• Traditional asset allocation models have lost much of their allure in the wake of the global financial crisis. Investors are increasingly open to new ways of reducing volatility and managing risk, often via emerging markets, commodities and other nontraditional categories. As the narrowly defined style-box model of asset allocation fades, it is likely that investors will increasingly demand innovative ETFs that are active and quasi-active in nature. This redefines what’s considered “niche” and creates growth opportunities beyond the “plain-vanilla” index products that still make up the bulk of ETF assets.
• Asset managers who are looking to enter or expand within the ETF market must clarify the value proposition of their products for retail and institutional ETF investors. They must tackle the challenge of differentiating themselves from other ETF managers, as well as from managers of actively managed mutual funds. Therefore, a distribution and operational strategy must be crafted that effectively supports the products delivering that value.
June 2011
ETFs 2.0: The Next Wave of Growth andOpportunity in the U.S. ETF Market
Foreword
All of us at BNY Mellon Asset Servicing are pleased to sponsor the following timely analysis on the current state of the Exchange Traded Funds marketplace entitled “ETFs 2.0: The Next Wave of Growth and Opportunity in the U.S. ETF Market”. This thought-provoking new study, authored by Strategic Insight, a leading independent mutual fund research and consulting firm, validates our prediction for continued exponential growth (in terms of total assets under management, ETF sponsors and new products) and offers additional insights on best practices in the critical areas of product construction, distribution and ETF investor usage and education.
At BNY Mellon, Exchange Traded Funds Services is a core business that is among our fastest-growing. It is our strategy to continue to invest in the necessary resources to deliver superior technology and the highest quality products and services to our clients throughout the world. Because of our commitment to the asset servicing business, we will constantly strive to identify opportunities to deliver real value to our clients. We believe this comprehensive and illuminating research piece to be a tangible example of our unwavering commitment to the funds management industry.
We look forward to additional opportunities to help drive the awareness and education of this rapidly evolving segment of the asset management industry. We would like to thank you the reader, Strategic Insight and most importantly our clients for the confidence they have shown in our capabilities by trusting BNY Mellon with their business.
Joe Keenan
Managing Director Head of Global Exchange Traded Funds Services
bnymellon.com ETFs 2.0: The Next Wave of Growth and Opportunity in the U.S. ETF Market 1
The ETF Market Today
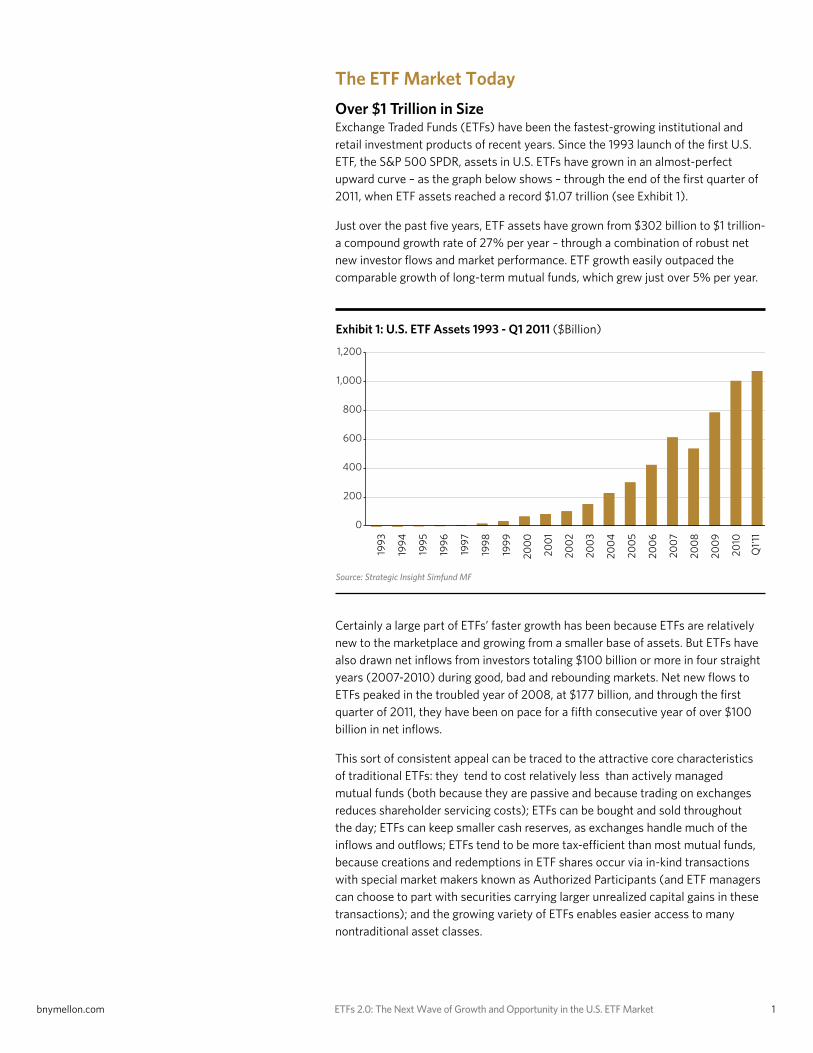
Over $1 Trillion in Size Exchange Traded Funds (ETFs) have been the fastest-growing institutional and retail investment products of recent years. Since the 1993 launch of the first U.S. ETF, the S&P 500 SPDR, assets in U.S. ETFs have grown in an almost-perfect upward curve – as the graph below shows – through the end of the first quarter of 2011, when ETF assets reached a record $1.07 trillion (see Exhibit 1).
Just over the past five years, ETF assets have grown from $302 billion to $1 trillion- a compound growth rate of 27% per year – through a combination of robust net new investor flows and market performance. ETF growth easily outpaced the comparable growth of long-term mutual funds, which grew just over 5% per year.
Certainly a large part of ETFs’ faster growth has been because ETFs are relatively new to the marketplace and growing from a smaller base of assets. But ETFs have also drawn net inflows from investors totaling $100 billion or more in four straight years (2007-2010) during good, bad and rebounding markets. Net new flows to ETFs peaked in the troubled year of 2008, at $177 billion, and through the first quarter of 2011, they have been on pace for a fifth consecutive year of over $100 billion in net inflows.
This sort of consistent appeal can be traced to the attractive core characteristics of traditional ETFs: they tend to cost relatively less than actively managed mutual funds (both because they are passive and because trading on exchanges reduces shareholder servicing costs); ETFs can be bought and sold throughout the day; ETFs can keep smaller cash reserves, as exchanges handle much of the inflows and outflows; ETFs tend to be more tax-efficient than most mutual funds, because creations and redemptions in ETF shares occur via in-kind transactions with special market makers known as Authorized Participants (and ETF managers can choose to part with securities carrying larger unrealized capital gains in these transactions); and the growing variety of ETFs enables easier access to many nontraditional asset classes.
Exhibit 1: U.S. ETF Assets 1993 - Q1 2011 ($Billion)
Source: Strategic Insight Simfund MF
0
200
400
600
800
1,000
1,200
1993
1994
1995
1996
1997
1998
1999
200
0
200
1
200
2
200
3
200
4
200
5
200
6
200
7
200
8
200
9
2010
Q1'
11
0%
2%
4%
6%
8%
10%
12/07 12/08 12/09 12/10 03/11
0
300
600
900
1200
March'06 March'11
0.00
0.20
0.40
0.60
0.80
1.00
1.20
U.S. Equity Int'l Equity Taxable Bond Muni Bond
0%
5%
10%
15%
20%
25%
30%
35%
40%
Q4'08 Q1'09 Q2'09 Q3'09 Q4'09 Q1'10 Q2'10 Q3'10 Q4'10 Q1'11
0
50
100
150
200
250
300
350
12/07 12/08 12/09 12/10 3/11 12/07 12/08 12/09 12/10 3/11
Europe/Offshore
Asia
0
500
1,000
1,500
2,000
2,500
2005 2006 2007 2008 2009 2010 2011E 2012E 2013E 2014E 2015E
Diversified U.S. Equity U.S. Equity - Sectors Int'l/Global Equity
Mutual Funds ETF’s
Currency Taxable Bond Muni Bond Commodity
bnymellon.com ETFs 2.0: The Next Wave of Growth and Opportunity in the U.S. ETF Market 2
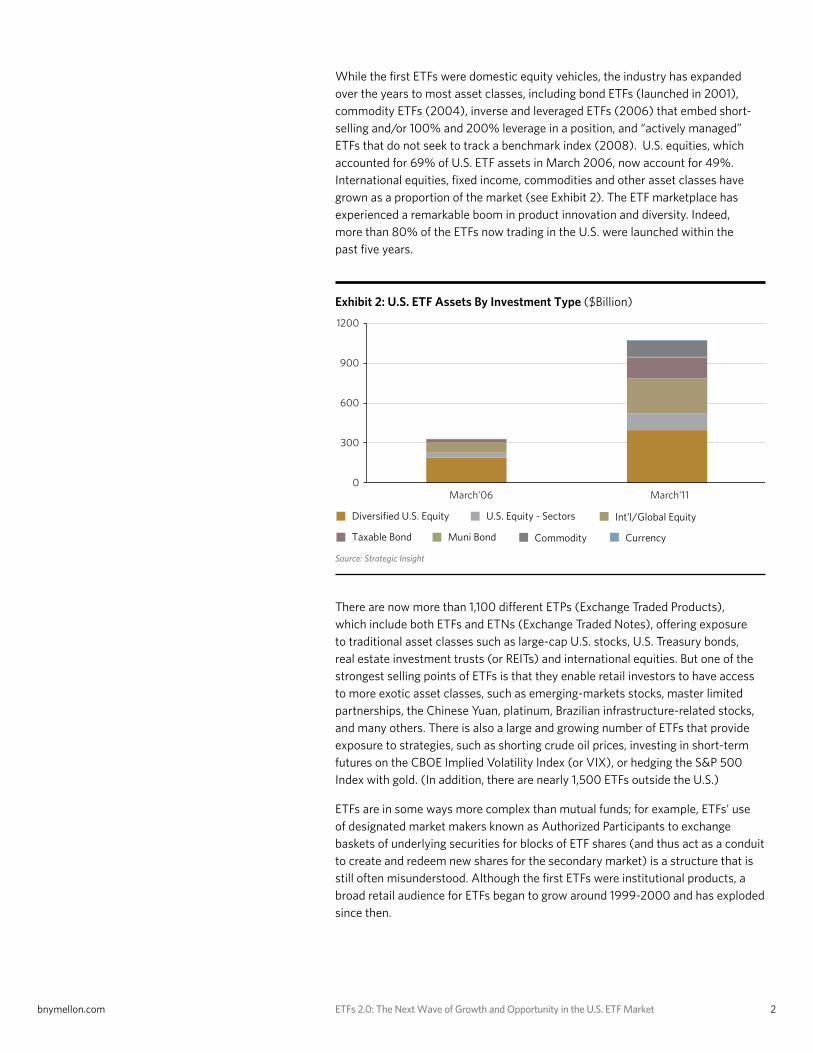
While the first ETFs were domestic equity vehicles, the industry has expanded over the years to most asset classes, including bond ETFs (launched in 2001), commodity ETFs (2004), inverse and leveraged ETFs (2006) that embed short-selling and/or 100% and 200% leverage in a position, and “actively managed” ETFs that do not seek to track a benchmark index (2008). U.S. equities, which accounted for 69% of U.S. ETF assets in March 2006, now account for 49%. International equities, fixed income, commodities and other asset classes have grown as a proportion of the market (see Exhibit 2). The ETF marketplace has experienced a remarkable boom in product innovation and diversity. Indeed, more than 80% of the ETFs now trading in the U.S. were launched within the past five years.
There are now more than 1,100 different ETPs (Exchange Traded Products), which include both ETFs and ETNs (Exchange Traded Notes), offering exposure to traditional asset classes such as large-cap U.S. stocks, U.S. Treasury bonds, real estate investment trusts (or REITs) and international equities. But one of the strongest selling points of ETFs is that they enable retail investors to have access to more exotic asset classes, such as emerging-markets stocks, master limited partnerships, the Chinese Yuan, platinum, Brazilian infrastructure-related stocks, and many others. There is also a large and growing number of ETFs that provide exposure to strategies, such as shorting crude oil prices, investing in short-term futures on the CBOE Implied Volatility Index (or VIX), or hedging the S&P 500 Index with gold. (In addition, there are nearly 1,500 ETFs outside the U.S.)
ETFs are in some ways more complex than mutual funds; for example, ETFs’ use of designated market makers known as Authorized Participants to exchange baskets of underlying securities for blocks of ETF shares (and thus act as a conduit to create and redeem new shares for the secondary market) is a structure that is still often misunderstood. Although the first ETFs were institutional products, a broad retail audience for ETFs began to grow around 1999-2000 and has exploded since then.
Exhibit 2: U.S. ETF Assets By Investment Type ($Billion)
Source: Strategic Insight
0
200
400
600
800
1,000
1,200
1993
1994
1995
1996
1997
1998
1999
200
0
200
1
200
2
200
3
200
4
200
5
200
6
200
7
200
8
200
9
2010
Q1'
11
0%
2%
4%
6%
8%
10%
12/07 12/08 12/09 12/10 03/11
0
300
600
900
1200
March'06 March'11
0.00
0.20
0.40
0.60
0.80
1.00
1.20
U.S. Equity Int'l Equity Taxable Bond Muni Bond
0%
5%
10%
15%
20%
25%
30%
35%
40%
Q4'08 Q1'09 Q2'09 Q3'09 Q4'09 Q1'10 Q2'10 Q3'10 Q4'10 Q1'11
0
50
100
150
200
250
300
350
12/07 12/08 12/09 12/10 3/11 12/07 12/08 12/09 12/10 3/11
Europe/Offshore
Asia
0
500
1,000
1,500
2,000
2,500
2005 2006 2007 2008 2009 2010 2011E 2012E 2013E 2014E 2015E
Diversified U.S. Equity U.S. Equity - Sectors Int'l/Global Equity
Mutual Funds ETF’s
Currency Taxable Bond Muni Bond Commodity
bnymellon.com ETFs 2.0: The Next Wave of Growth and Opportunity in the U.S. ETF Market 3
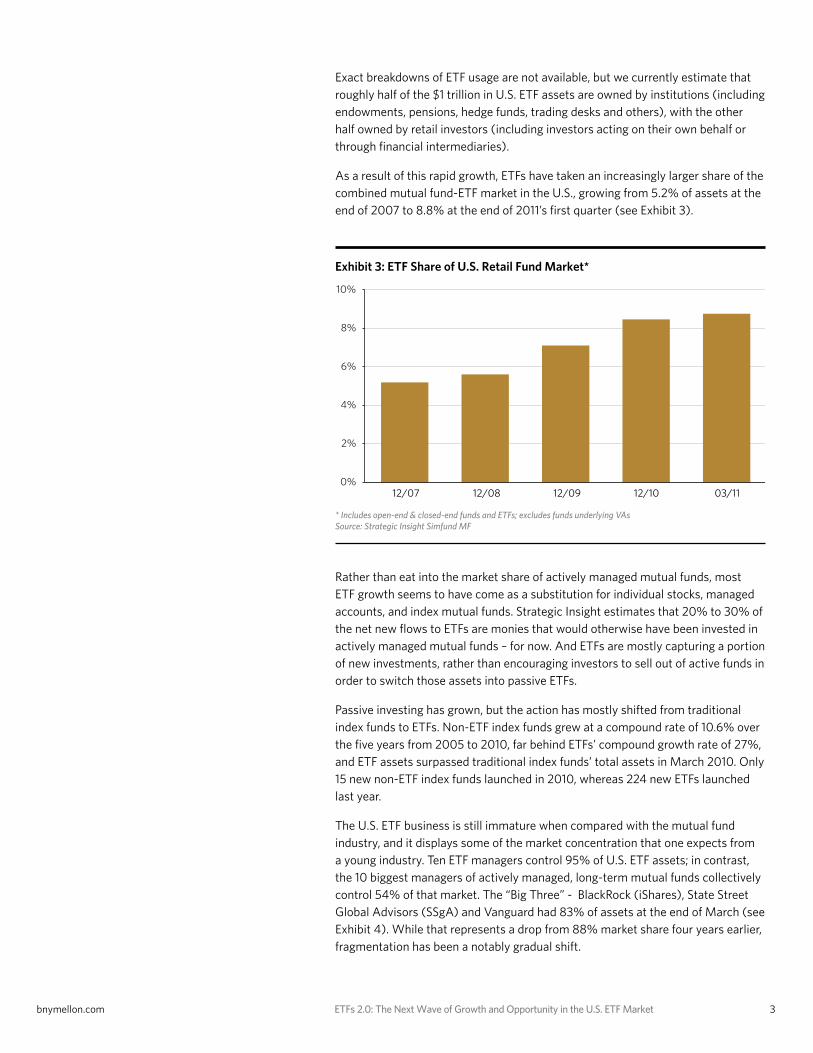
Exhibit 3: ETF Share of U.S. Retail Fund Market*
* Includes open-end & closed-end funds and ETFs; excludes funds underlying VAsSource: Strategic Insight Simfund MF
Exact breakdowns of ETF usage are not available, but we currently estimate that roughly half of the $1 trillion in U.S. ETF assets are owned by institutions (including endowments, pensions, hedge funds, trading desks and others), with the other half owned by retail investors (including investors acting on their own behalf or through financial intermediaries).
As a result of this rapid growth, ETFs have taken an increasingly larger share of the combined mutual fund-ETF market in the U.S., growing from 5.2% of assets at the end of 2007 to 8.8% at the end of 2011’s first quarter (see Exhibit 3).
Rather than eat into the market share of actively managed mutual funds, most ETF growth seems to have come as a substitution for individual stocks, managed accounts, and index mutual funds. Strategic Insight estimates that 20% to 30% of the net new flows to ETFs are monies that would otherwise have been invested in actively managed mutual funds – for now. And ETFs are mostly capturing a portion of new investments, rather than encouraging investors to sell out of active funds in order to switch those assets into passive ETFs.
Passive investing has grown, but the action has mostly shifted from traditional index funds to ETFs. Non-ETF index funds grew at a compound rate of 10.6% over the five years from 2005 to 2010, far behind ETFs’ compound growth rate of 27%, and ETF assets surpassed traditional index funds’ total assets in March 2010. Only 15 new non-ETF index funds launched in 2010, whereas 224 new ETFs launched last year.
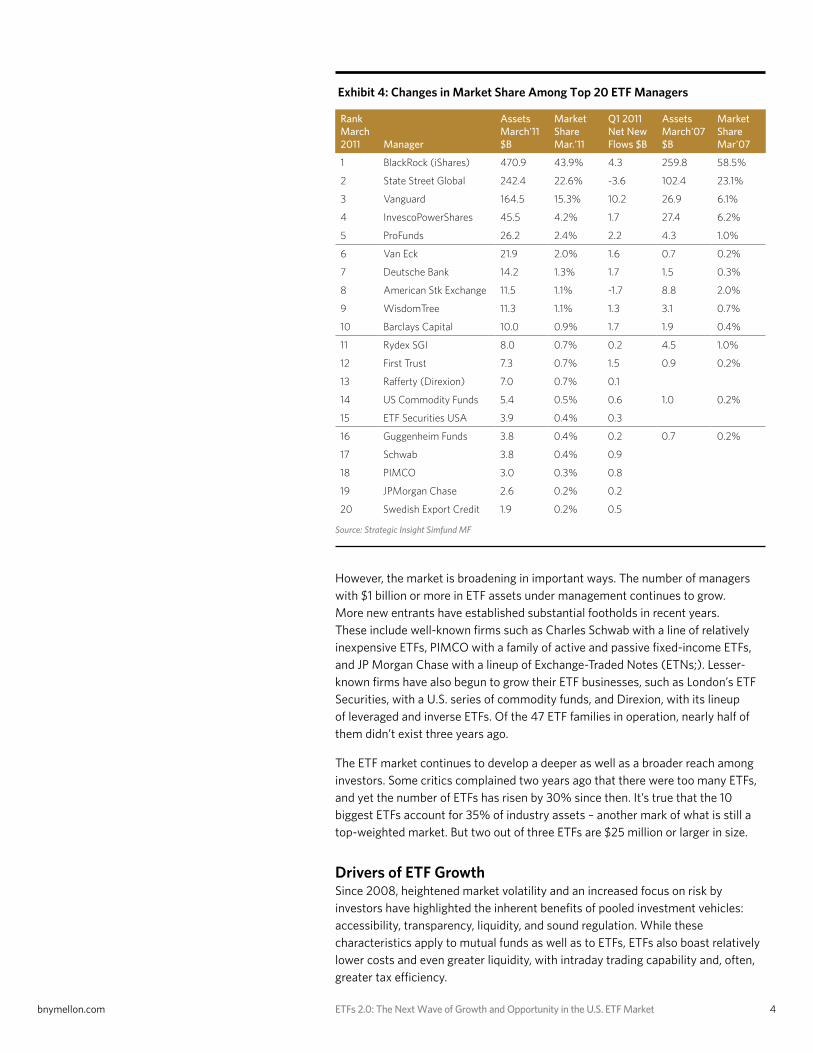
The U.S. ETF business is still immature when compared with the mutual fund industry, and it displays some of the market concentration that one expects from a young industry. Ten ETF managers control 95% of U.S. ETF assets; in contrast, the 10 biggest managers of actively managed, long-term mutual funds collectively control 54% of that market. The “Big Three” - BlackRock (iShares), State Street Global Advisors (SSgA) and Vanguard had 83% of assets at the end of March (see Exhibit 4). While that represents a drop from 88% market share four years earlier, fragmentation has been a notably gradual shift.
0
200
400
600
800
1,000
1,200
1993
1994
1995
1996
1997
1998
1999
200
0
200
1
200
2
200
3
200
4
200
5
200
6
200
7
200
8
200
9
2010
Q1'
11
0%
2%
4%
6%
8%
10%
12/07 12/08 12/09 12/10 03/11
0
300
600
900
1200
March'06 March'11
0.00
0.20
0.40
0.60
0.80
1.00
1.20
U.S. Equity Int'l Equity Taxable Bond Muni Bond
0%
5%
10%
15%
20%
25%
30%
35%
40%
Q4'08 Q1'09 Q2'09 Q3'09 Q4'09 Q1'10 Q2'10 Q3'10 Q4'10 Q1'11
0
50
100
150
200
250
300
350
12/07 12/08 12/09 12/10 3/11 12/07 12/08 12/09 12/10 3/11
Europe/Offshore
Asia
0
500
1,000
1,500
2,000
2,500
2005 2006 2007 2008 2009 2010 2011E 2012E 2013E 2014E 2015E
Diversified U.S. Equity U.S. Equity - Sectors Int'l/Global Equity
Mutual Funds ETF’s
Currency Taxable Bond Muni Bond Commodity
bnymellon.com ETFs 2.0: The Next Wave of Growth and Opportunity in the U.S. ETF Market 4
However, the market is broadening in important ways. The number of managers with $1 billion or more in ETF assets under management continues to grow. More new entrants have established substantial footholds in recent years. These include well-known firms such as Charles Schwab with a line of relatively inexpensive ETFs, PIMCO with a family of active and passive fixed-income ETFs, and JP Morgan Chase with a lineup of Exchange-Traded Notes (ETNs;). Lesser-known firms have also begun to grow their ETF businesses, such as London’s ETF Securities, with a U.S. series of commodity funds, and Direxion, with its lineup of leveraged and inverse ETFs. Of the 47 ETF families in operation, nearly half of them didn’t exist three years ago.
The ETF market continues to develop a deeper as well as a broader reach among investors. Some critics complained two years ago that there were too many ETFs, and yet the number of ETFs has risen by 30% since then. It’s true that the 10 biggest ETFs account for 35% of industry assets – another mark of what is still a top-weighted market. But two out of three ETFs are $25 million or larger in size.
Drivers of ETF Growth Since 2008, heightened market volatility and an increased focus on risk by investors have highlighted the inherent benefits of pooled investment vehicles: accessibility, transparency, liquidity, and sound regulation. While these characteristics apply to mutual funds as well as to ETFs, ETFs also boast relatively lower costs and even greater liquidity, with intraday trading capability and, often, greater tax efficiency.
Exhibit 4: Changes in Market Share Among Top 20 ETF Managers
Source: Strategic Insight Simfund MF
RankMarch2011 Manager
AssetsMarch'11$B
MarketShareMar.'11
Q1 2011Net NewFlows $B
AssetsMarch'07$B
MarketShareMar'07
1 BlackRock (iShares) 470.9 43.9% 4.3 259.8 58.5%
2 State Street Global 242.4 22.6% -3.6 102.4 23.1%
3 Vanguard 164.5 15.3% 10.2 26.9 6.1%
4 InvescoPowerShares 45.5 4.2% 1.7 27.4 6.2%
5 ProFunds 26.2 2.4% 2.2 4.3 1.0%
6 Van Eck 21.9 2.0% 1.6 0.7 0.2%
7 Deutsche Bank 14.2 1.3% 1.7 1.5 0.3%
8 American Stk Exchange 11.5 1.1% -1.7 8.8 2.0%
9 WisdomTree 11.3 1.1% 1.3 3.1 0.7%
10 Barclays Capital 10.0 0.9% 1.7 1.9 0.4%
11 Rydex SGI 8.0 0.7% 0.2 4.5 1.0%
12 First Trust 7.3 0.7% 1.5 0.9 0.2%
13 Rafferty (Direxion) 7.0 0.7% 0.1
14 US Commodity Funds 5.4 0.5% 0.6 1.0 0.2%
15 ETF Securities USA 3.9 0.4% 0.3
16 Guggenheim Funds 3.8 0.4% 0.2 0.7 0.2%
17 Schwab 3.8 0.4% 0.9
18 PIMCO 3.0 0.3% 0.8
19 JPMorgan Chase 2.6 0.2% 0.2
20 Swedish Export Credit 1.9 0.2% 0.5
bnymellon.com ETFs 2.0: The Next Wave of Growth and Opportunity in the U.S. ETF Market 5
“Asset allocation” has become the dominant theme for institutional and individual investors, as they work to create diversified portfolios with growth opportunities and balanced risks. This helps explains the rise in asset -allocation programs such as wrap accounts (in 2010, nearly 40% of all mutual fund sales through financial advisors were within “wrap” programs), and asset-allocation products, such as target date funds. In the wake of the financial crisis, investors, advisors and asset managers have begun to rethink the nature of diversified asset allocation, leading to increased demand for less-correlated, nontraditional asset classes such as commodities and absolute-return/market-neutral strategies.
This updated concept of asset allocation has resulted in investor portfolios moving towards a “barbell” approach, with some sleeves allocated to inexpensive beta and some sleeves allocated to higher-risk, potentially higher-alpha strategies, with little space for funds in between those two poles. For many years, ETFs have been useful as simple building blocks to construct diversified portfolios, and more recently they have played the other side of this equation, offering advanced and “alternative” strategies. For example, several exchange-traded products have replicated the characteristics of a diversified basket of hedge funds, carrying expense ratios of 75 basis points or less – far cheaper than actual funds of hedge funds.
ETFs’ lower cost structure is an advantage during a time when financial advisors’ compensation is shifting from transaction-based fees to fees for advice. Because advisory program structures such as wrap programs overlay a fee for the advice on top of other portfolio costs, those programs tend to seek low-cost underlying investments, which often turn out to be ETFs.
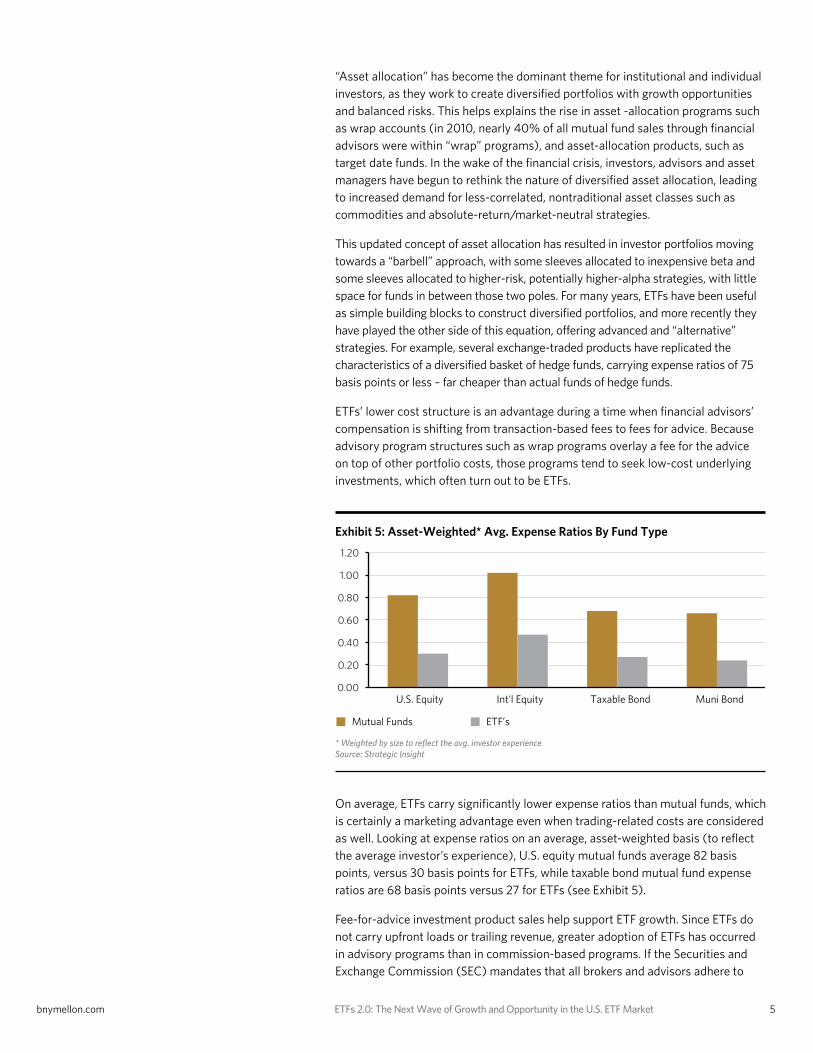
Exhibit 5: Asset-Weighted* Avg. Expense Ratios By Fund Type
* Weighted by size to reflect the avg. investor experienceSource: Strategic Insight
0
200
400
600
800
1,000
1,200
1993
1994
1995
1996
1997
1998
1999
200
0
200
1
200
2
200
3
200
4
200
5
200
6
200
7
200
8
200
9
2010
Q1'
11
0%
2%
4%
6%
8%
10%
12/07 12/08 12/09 12/10 03/11
0
300
600
900
1200
March'06 March'11
0.00
0.20
0.40
0.60
0.80
1.00
1.20
U.S. Equity Int'l Equity Taxable Bond Muni Bond
0%
5%
10%
15%
20%
25%
30%
35%
40%
Q4'08 Q1'09 Q2'09 Q3'09 Q4'09 Q1'10 Q2'10 Q3'10 Q4'10 Q1'11
0
50
100
150
200
250
300
350
12/07 12/08 12/09 12/10 3/11 12/07 12/08 12/09 12/10 3/11
Europe/Offshore
Asia
0
500
1,000
1,500
2,000
2,500
2005 2006 2007 2008 2009 2010 2011E 2012E 2013E 2014E 2015E
Diversified U.S. Equity U.S. Equity - Sectors Int'l/Global Equity
Mutual Funds ETF’s
Currency Taxable Bond Muni Bond Commodity
On average, ETFs carry significantly lower expense ratios than mutual funds, which is certainly a marketing advantage even when trading-related costs are considered as well. Looking at expense ratios on an average, asset-weighted basis (to reflect the average investor’s experience), U.S. equity mutual funds average 82 basis points, versus 30 basis points for ETFs, while taxable bond mutual fund expense ratios are 68 basis points versus 27 for ETFs (see Exhibit 5).
Fee-for-advice investment product sales help support ETF growth. Since ETFs do not carry upfront loads or trailing revenue, greater adoption of ETFs has occurred in advisory programs than in commission-based programs. If the Securities and Exchange Commission (SEC) mandates that all brokers and advisors adhere to
bnymellon.com ETFs 2.0: The Next Wave of Growth and Opportunity in the U.S. ETF Market 6
a “fiduciary” standard, rather than the “suitability” standard that brokers must currently meet, the change should help speed up the industry’s shift to fee-for-advice business models and therefore could help support further ETF growth among financial advisors.
ETFs in Portfolio Construction Varieties of ETF usage are mushrooming. Before 2008, ETFs were largely used in a few tactical or strategic ways. They could be used tactically, to express short-term views on segments of the market, or for tax-loss harvesting, transition management or cash equitization purposes. ETFs could also be used strategically as low-cost beta components of long-term portfolios.
In recent years, however, both institutional and retail investors have been eroding the distinction between tactical and strategic investing. Fewer investors are content to “set and forget” their long-term allocations, and more are incorporating a tactical, or dynamic, aspect to their investing – often relying on more-frequent adjustments to their holdings as well as using ETFs (either though short positions or other means) and other products for hedging.
In terms of products, investors have generally displayed an increasing acceptance of more broadly mandated and flexible funds, partly in the hopes that these funds may navigate market volatility more nimbly. Indeed, global tactical asset allocation products have consistently been among the most popular equity funds since the start of 2009, underscoring the fact that investors’ biggest disappointment with actively managed funds was that they weren’t more “active” in mitigating the effects of the financial crisis.
Retail portfolios are becoming more similar to institutional core/satellite constructions. As a result, investors of all stripes are deciding how to build their “core” portfolio positions (consisting of U.S. and international equity and fixed income) and how to invest in potentially higher-alpha “satellite” styles (typically commodities, emerging markets, real estate, high yield bond and other less-traditional strategies). A large number of investors have embraced the somewhat more-predictable risk/return profile of passive investing for some or all of their core asset classes. ETFs are also increasingly used in satellite styles. In some instances, they are able to provide liquid, targeted exposure to certain asset classes; for example, Harvard University’s endowment uses ETFs for a large portion of its emerging markets equity exposure. In addition, ETFs may be used as satellites for part of what some call “portable beta” strategies, attempting to generate excess returns through dynamic mixing of beta exposures using long-short, sector-rotation and other strategies rather than pursuing active-management alpha.
Because 99% of ETFs provide some sort of beta, they can be used as simple building blocks of core and satellite positions within diversified portfolios of nearly any degree of sophistication. The proliferation of ETFs challenges the traditional demarcation between alpha and beta: for instance, is an actively managed portfolio of ETFs aiming to generate alpha or beta? Most investors are ambivalent, focusing instead on wealth creation, risk management and liquidity in an investing world that seems ever more convoluted. Thus, demand for absolute-return, tactical asset allocation and other more-complex portfolio solutions continues to increase. As a result, ETFs will likely play larger and larger roles in all facets of this new wave of portfolio construction.
bnymellon.com ETFs 2.0: The Next Wave of Growth and Opportunity in the U.S. ETF Market 7
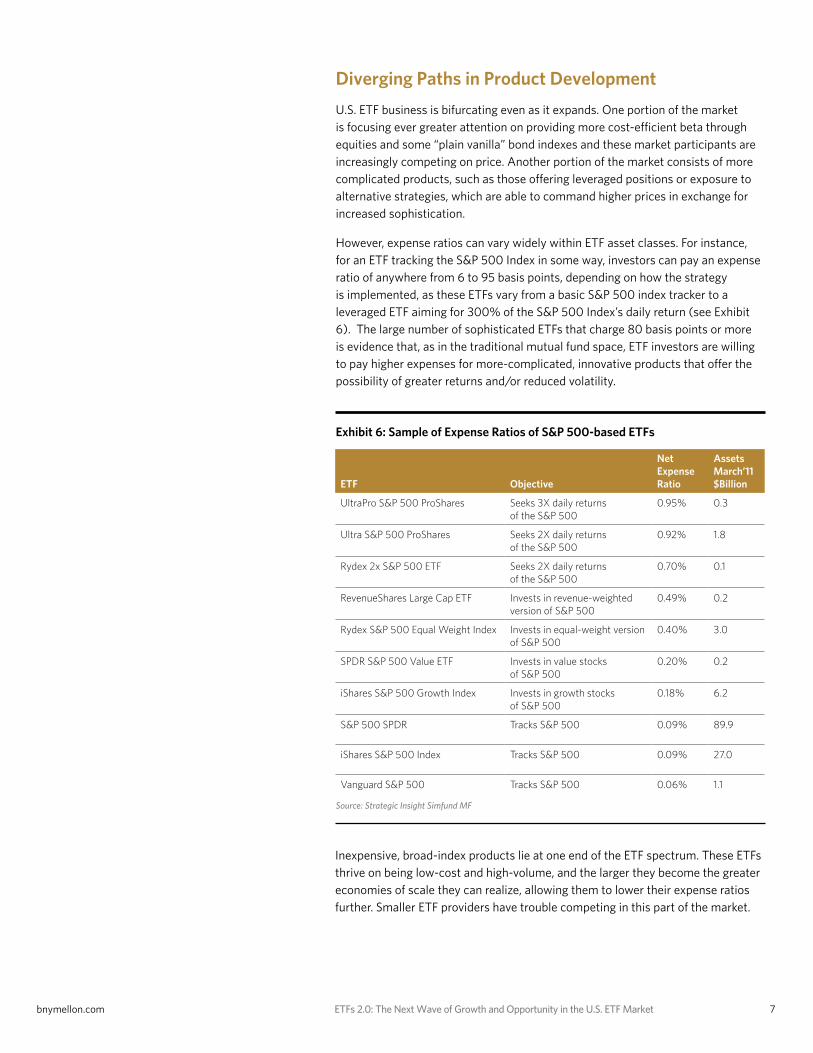
Exhibit 6: Sample of Expense Ratios of S&P 500-based ETFs
Source: Strategic Insight Simfund MF
Diverging Paths in Product Development
U.S. ETF business is bifurcating even as it expands. One portion of the market is focusing ever greater attention on providing more cost-efficient beta through equities and some “plain vanilla” bond indexes and these market participants are increasingly competing on price. Another portion of the market consists of more complicated products, such as those offering leveraged positions or exposure to alternative strategies, which are able to command higher prices in exchange for increased sophistication.
However, expense ratios can vary widely within ETF asset classes. For instance, for an ETF tracking the S&P 500 Index in some way, investors can pay an expense ratio of anywhere from 6 to 95 basis points, depending on how the strategy is implemented, as these ETFs vary from a basic S&P 500 index tracker to a leveraged ETF aiming for 300% of the S&P 500 Index’s daily return (see Exhibit 6). The large number of sophisticated ETFs that charge 80 basis points or more is evidence that, as in the traditional mutual fund space, ETF investors are willing to pay higher expenses for more-complicated, innovative products that offer the possibility of greater returns and/or reduced volatility.
ETF Objective
Net Expense Ratio
Assets March’11 $Billion
UltraPro S&P 500 ProShares Seeks 3X daily returns of the S&P 500
0.95% 0.3
Ultra S&P 500 ProShares Seeks 2X daily returns of the S&P 500
0.92% 1.8
Rydex 2x S&P 500 ETF Seeks 2X daily returns of the S&P 500
0.70% 0.1
RevenueShares Large Cap ETF Invests in revenue-weighted version of S&P 500
0.49% 0.2
Rydex S&P 500 Equal Weight Index Invests in equal-weight version of S&P 500
0.40% 3.0
SPDR S&P 500 Value ETF Invests in value stocks of S&P 500
0.20% 0.2
iShares S&P 500 Growth Index Invests in growth stocks of S&P 500
0.18% 6.2
S&P 500 SPDR Tracks S&P 500 0.09% 89.9
iShares S&P 500 Index Tracks S&P 500 0.09% 27.0
Vanguard S&P 500 Tracks S&P 500 0.06% 1.1
Inexpensive, broad-index products lie at one end of the ETF spectrum. These ETFs thrive on being low-cost and high-volume, and the larger they become the greater economies of scale they can realize, allowing them to lower their expense ratios further. Smaller ETF providers have trouble competing in this part of the market.
bnymellon.com ETFs 2.0: The Next Wave of Growth and Opportunity in the U.S. ETF Market 8
In recent years, even the large ETF sponsors have also had some trouble competing on price, as price competition has driven many expense ratios even lower. In 2009, broker Charles Schwab leveraged its brand and large ETF-using audience of individual investors and independent RIAs to launch a low-cost line of broad, “core” ETFs. This included a U.S. large-cap ETF costing 8 basis points and a U.S. broad stock market ETF at 6 basis points – below the 9 basis points of the S&P 500 SPDR. Vanguard launched its own S&P 500 ETF priced at 6 basis points. And in April 2011, broker Scottrade entered the ETF market with its own FocusShares range of U.S. equity ETFs, including a U.S. large-cap ETF and a broad U.S. stock market ETF, both costing 5 basis points. (No U.S. ETF has come close to Europe’s db x-trackers DJ Euro STOXX 50 ETF, managed by Deutsche Bank, which cut its expense ratio from 15 basis points to zero – making its money instead from securities lending, tax arbitrage and derivatives issuance.)
ETF sponsors have been willing to trim already slim profit margins because price competition has worked in the past. For example, the iShares Gold Trust gained significant new inflows after reducing its expense ratio by one-third to 25 basis points, below the 40 basis points charged by World Gold Council’s SPDR Gold Shares, the industry’s biggest gold ETF. The most famous example of a price war was waged between Vanguard’s MSCI Emerging Markets Stock ETF and the iShares MSCI Emerging Markets Stock ETF. In addition to having different approaches to tracking the same index, Vanguard’s ETF had an expense ratio of 27 basis points versus 69 basis points for the iShares product. Vanguard increasingly gained on its more-established rival and in January 2011 the Vanguard ETF surpassed the iShares ETF in assets. Then, in February 2011, Vanguard lowered the price of its emerging- markets ETF’s price to 22 basis points, below the 25 basis points of Schwab’s own emerging-markets stock ETF launched in early 2010. Both Vanguard and iShares have emerging- markets ETFs that continue to be sizeable, with $47 billion and $38 billion in assets, respectively.
The lower expense ratios of ETFs have put more pressure on traditional mutual funds. In today’s environment, even successful actively managed mutual funds have to distinguish themselves from ETFs. In recent years, flows to U.S. equity funds have gone predominantly to distinctive, high-tracking-error funds pursuing flexible or alternative strategies, while U.S. style-box equity funds have seen net outflows. Although mutual funds often have the advantage in trading costs, as evidenced by many investors in retirement plans buying funds commission-free every month, they cannot always compete with ETFs’ lower management fees.
Price competition has also come to commissions on ETF trading. When Schwab launched its proprietary ETFs, online trades for these investments were offered commission-free for Schwab customers. In early 2010, Fidelity announced a partnership with BlackRock whereby select iShares ETFs would trade commission-free on Fidelity’s retail platform. Three months later, Vanguard began offering commission-free trades of its ETFs for its brokerage clients. Then broker TD Ameritrade unveiled, late in 2010, that it would offer commission-free trades to brokerage clients on over 100 ETFs from eight different providers. Scottrade is also offering its own, recently launched FocusShares ETFs with commission-free trading on its brokerage platform.
bnymellon.com ETFs 2.0: The Next Wave of Growth and Opportunity in the U.S. ETF Market 9
Given the economics of these offers, some brokers clearly see ETFs as such valuable tools for attraction and retention that they are using them not as profit centers in themselves but as “anchor” products designed to lock in clients who can then be sold more profitable products and services. Commission-free trading is likely to spread to more ETFs as the products become even more mainstream, helping support further growth of the industry.
Growing Appetite for ‘ETFs 2.0’ At the other end of the spectrum, more firms are launching complicated, premium-priced ETFs that go well beyond tracking a well-known index. It began with alternatively weighted ETFs, such as those tracking earnings-weighted or fundamentals-weighted versions of the S&P 500 or the Russell 3000: these were still passive products, but with a twist on the traditional notion of passive. However, ETF sponsors are now offering “ETFs 2.0” that are either extremely selective or that track indexes following multiple rule sets such that the products begin to approach active management, if more quant-oriented active management. While much of the innovation stems from the fact that most well-known, traditional asset classes are already well-represented in exchange-traded products, it is also spurred by investor demand.
In many cases, ETF firms are offering finer slices of the market. For example, rather than exposure to emerging markets, they offer exposure to emerging-markets sectors – such as the Global X Silver Miners ETF, the Emerging Global Shares Dow Jones Emerging Markets Consumer Titans ETF, and many other global and emerging-markets sector products.
Another area of product innovation is in ETFs whose complex methods, often based on indexes that seek to echo or even replicate investing strategies, blur the lines between alpha and beta. A few examples follow:
• The Greenhaven Continuous Commodity Index Fund ($809 million in assets as of March 31, 2011) rebalances daily among 17 commodities to maintain equal weighting
• Guggenheim Insider Sentiment ETF ($165 million) tracks an index of 100 stocks (selected from 6,000) that reflect favorable corporate insider buying trends
• IndexIQ Hedge Multi-Strategy Tracker ETF ($124 million) aims to provide beta replication of the returns and characteristics of a diverse basket of hedge funds by investing in ETFs
The examples above illustrate the types of ETFs that are pushing the envelope of what is considered beta. While they still track indexes, the indexes are usually created particularly for that ETF, by an index provider, and do the work that active portfolio managers might have done. And beyond such quasi-active ETFs lies the emergent category of active ETFs, which are addressed later in this report.
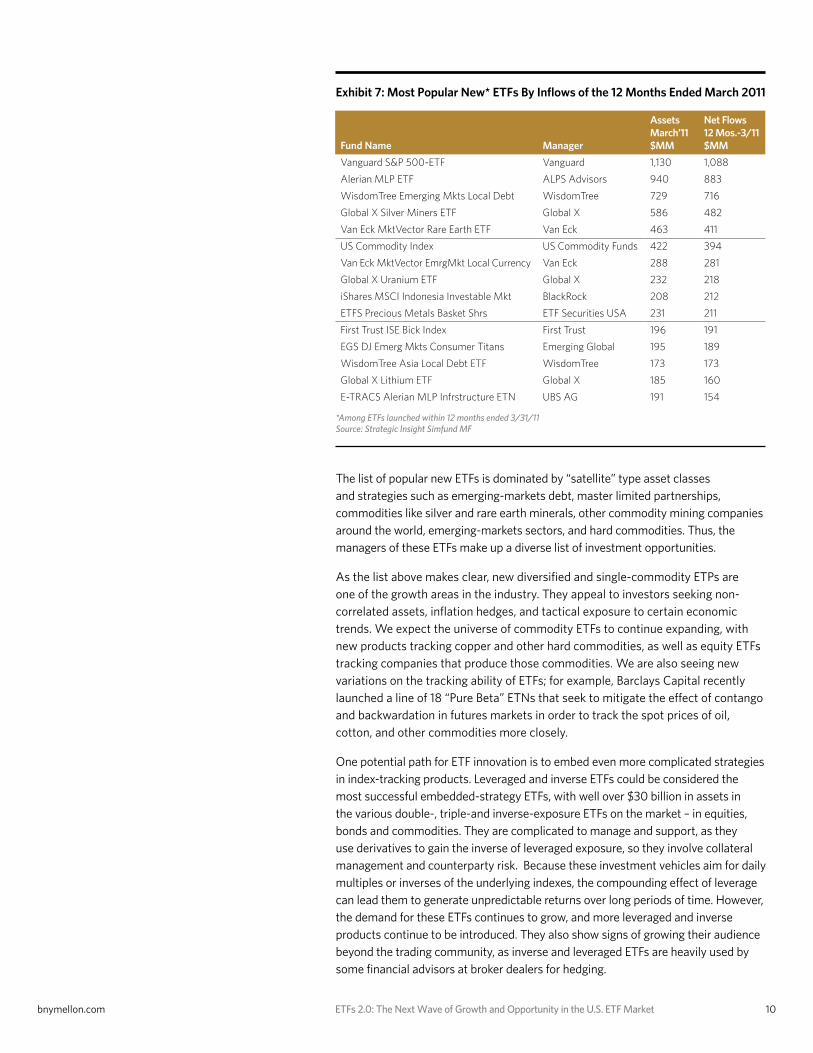
There is much more room for newer and smaller ETF players in the ETFs 2.0 market, and such beta-blurring products are a growing part of the overall ETF market. Of the most popular ETFs launched during the 12 months ended March 2011, only two of the top 15 products in net inflows were managed by the “Big Three” of BlackRock, State Street and Vanguard (see Exhibit 7). In addition, the innovative strategies offered by these ETFs enable nearly all of them to command premium pricing: among these 15 most popular new ETFs, the median expense ratio is 64 basis points.
bnymellon.com ETFs 2.0: The Next Wave of Growth and Opportunity in the U.S. ETF Market 10
Exhibit 7: Most Popular New* ETFs By Inflows of the 12 Months Ended March 2011
*Among ETFs launched within 12 months ended 3/31/11Source: Strategic Insight Simfund MF
Fund Name Manager
Assets March’11 $MM
Net Flows 12 Mos.-3/11 $MM
Vanguard S&P 500-ETF Vanguard 1,130 1,088
Alerian MLP ETF ALPS Advisors 940 883
WisdomTree Emerging Mkts Local Debt WisdomTree 729 716
Global X Silver Miners ETF Global X 586 482
Van Eck MktVector Rare Earth ETF Van Eck 463 411
US Commodity Index US Commodity Funds 422 394
Van Eck MktVector EmrgMkt Local Currency Van Eck 288 281
Global X Uranium ETF Global X 232 218
iShares MSCI Indonesia Investable Mkt BlackRock 208 212
ETFS Precious Metals Basket Shrs ETF Securities USA 231 211
First Trust ISE Bick Index First Trust 196 191
EGS DJ Emerg Mkts Consumer Titans Emerging Global 195 189
WisdomTree Asia Local Debt ETF WisdomTree 173 173
Global X Lithium ETF Global X 185 160
E-TRACS Alerian MLP Infrstructure ETN UBS AG 191 154
The list of popular new ETFs is dominated by “satellite” type asset classes and strategies such as emerging-markets debt, master limited partnerships, commodities like silver and rare earth minerals, other commodity mining companies around the world, emerging-markets sectors, and hard commodities. Thus, the managers of these ETFs make up a diverse list of investment opportunities.
As the list above makes clear, new diversified and single-commodity ETPs are one of the growth areas in the industry. They appeal to investors seeking non-correlated assets, inflation hedges, and tactical exposure to certain economic trends. We expect the universe of commodity ETFs to continue expanding, with new products tracking copper and other hard commodities, as well as equity ETFs tracking companies that produce those commodities. We are also seeing new variations on the tracking ability of ETFs; for example, Barclays Capital recently launched a line of 18 “Pure Beta” ETNs that seek to mitigate the effect of contango and backwardation in futures markets in order to track the spot prices of oil, cotton, and other commodities more closely.
One potential path for ETF innovation is to embed even more complicated strategies in index-tracking products. Leveraged and inverse ETFs could be considered the most successful embedded-strategy ETFs, with well over $30 billion in assets in the various double-, triple-and inverse-exposure ETFs on the market – in equities, bonds and commodities. They are complicated to manage and support, as they use derivatives to gain the inverse of leveraged exposure, so they involve collateral management and counterparty risk. Because these investment vehicles aim for daily multiples or inverses of the underlying indexes, the compounding effect of leverage can lead them to generate unpredictable returns over long periods of time. However, the demand for these ETFs continues to grow, and more leveraged and inverse products continue to be introduced. They also show signs of growing their audience beyond the trading community, as inverse and leveraged ETFs are heavily used by some financial advisors at broker dealers for hedging.
bnymellon.com ETFs 2.0: The Next Wave of Growth and Opportunity in the U.S. ETF Market 11
In February, FactorShares launched some of the more ambitious “strategy” ETFs yet: five products that offer 2X exposure to the “spread” between the S&P 500 and another index. For example, one ETF offers 200% daily exposure to a long position in light sweet crude oil futures and a short position in E-mini S&P 500 Futures, while another offers 200% daily exposure to long position in E-mini S&P 500 Futures and a short position in U.S. Treasury Bond Futures. A slightly less complicated example is a Credit Suisse ETN launched in March that provides 200% exposure to an index replicating the returns of a basket of merger-arbitrage hedge funds. These products naturally carry risks not present in more standard ETFs, including a higher risk of investor/advisor misunderstanding. It is too early to assess these specific products, but they point toward one feasible path for ETF product development.
A third category of “ETFs 2.0” consists of products tracking new and more sophisticated asset classes. Barclays Capital has had notable success with its series of exchange traded notes (ETNs) tracking the CBOE Implied Volatility Index, (or VIX), which tracks the anticipated volatility of the S&P 500 based on options activity. The iPath S&P 500 VIX Short-Term Futures and Medium-Term Futures ETNs, launched in January 2009, had amassed $2 billion in assets as of March 31, 2011. Barclays followed up by launching VIX ETNs in Canada, Germany and the U.K., and launching an inverse VIX futures ETN in the U.S. Meanwhile, Credit Suisse and UBS have since launched their own VIX-tracking ETNs, and ProFunds launched the first VIX Futures ETF in the U.S.
The “ETFs 2.0” trends are echoed outside the U.S. Besides the VIX ETNs already mentioned, “alternative” ETFs include two from Goldman Sachs and Source aimed at hedge fund replication, and Deutsche Bank offers two ETFs that invest in baskets of hedge funds (rather than use beta replication), as part of its db x-trackers family in Europe. Societe Generale’s Lyxor offers quantitative, strategy-based ETFs such as the ETF Wise Quantitative Strategy, a European equities product. ETF Securities, known for commodities and currencies, also offers ETFs with exposure to global gold-mining and coal-mining companies. In addition, Paris-based Ossiam and other firms are planning more strategy-based ETFs.
As for new asset classes to which ETFs may provide access, Invesco PowerShares launched the first volatility-weighted and beta-weighted equity index funds in May, followed closely by Russell Investments, which also launched momentum-weighted ETFs. The next ETF success on the scale of implied volatility might be beta, or momentum, or correlation risk, or even tail risk. Meanwhile, index providers are constructing new indexes regularly – such as the Factor Indexes that S&P created, later the basis for the FactorShares ETFs – to meet or anticipate demand from a growing ETF market.
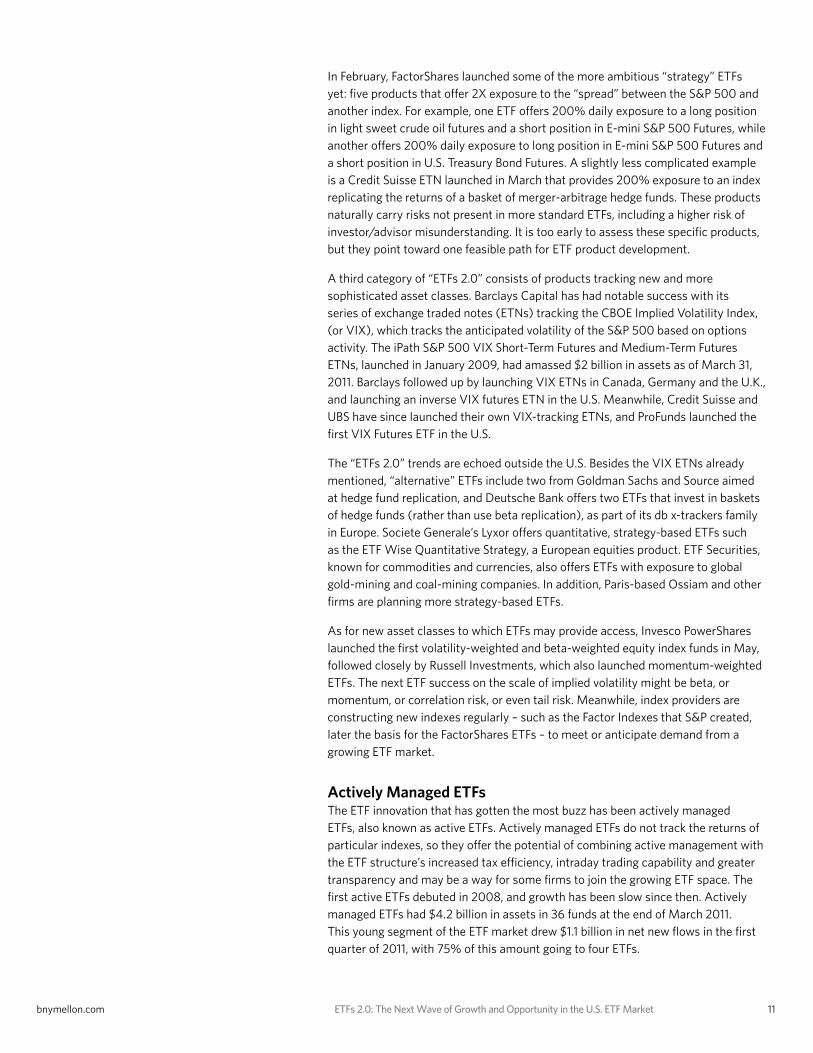
Actively Managed ETFs The ETF innovation that has gotten the most buzz has been actively managed ETFs, also known as active ETFs. Actively managed ETFs do not track the returns of particular indexes, so they offer the potential of combining active management with the ETF structure’s increased tax efficiency, intraday trading capability and greater transparency and may be a way for some firms to join the growing ETF space. The first active ETFs debuted in 2008, and growth has been slow since then. Actively managed ETFs had $4.2 billion in assets in 36 funds at the end of March 2011. This young segment of the ETF market drew $1.1 billion in net new flows in the first quarter of 2011, with 75% of this amount going to four ETFs.
bnymellon.com ETFs 2.0: The Next Wave of Growth and Opportunity in the U.S. ETF Market 12
The market for active ETFs remains very concentrated. There are a handful of large funds, and only eight ETFs have $100 million or more in assets (see Exhibit 8). The field offers a variety of approaches, the largest of which is a money market alternative fund. In addition, WisdomTree’s currency ETFs use derivatives to track currency movement, while AdvisorShares’ Cambria Fund was introduced as the first global tactical asset allocation ETF. WisdomTree and iShares both offer alternative strategy ETFs, and PIMCO has an ETF offering active management in the broad municipal bond market.
To date, a number of well-known mutual fund firms that are better known for active management (including Eaton Vance, T. Rowe Price, Legg Mason, AllianceBernstein, JP Morgan, Janus and others) have filed with the SEC for the exemptive relief needed to launch active ETFs. But few firms have launched such ETFs. One reason is a backlog of exemptive applications at the SEC, which has frozen approvals of active ETFs that rely heavily on derivatives, since March 2010, while the Commission continues an in-depth investigation on the use of derivatives by registered investment companies. Another hurdle is the concern surrounding the required daily portfolio disclosure, which is a standard requirement of all ETFs but may trigger front-running. Accusations of front-running have yet to surface, but it may partly be a function of the lack of arbitrage interest in such small funds.
Despite its small size, the active ETF market is drawing increased interest based on developments that hint at greater potential: Columbia Management and Russell Investments each acquired small active ETF managers with the expectation they will use those firms’ existing SEC exemptive relief to launch more active ETFs. In addition, PIMCO filed in April with the SEC to launch an active-ETF version of its industry-leading Total Return Bond Fund. A successful Total Return Bond ETF, although it would not be identical to the mutual fund, could ease fears of front-running and demonstrate the viability a brand-name active ETF. Lastly, Eaton Vance acquired Managed ETFs LLC to gain intellectual property related to ETF operations and trading. The entry of more established fund managers and funds over the next few years will redefine the active ETF market.
Exhibit 8: Biggest Actively Managed ETFs ($ Million)
Source: Strategic Insight Simfund MF
Fund Name Objective
Assets March’11 $MM
Net New Flows $MM Q1 2011
PIMCO Enhanced ShortMaturity Strtgy ETF Corp. Short Maturity 1,190 403
WisdomTree Emerging Mkt Local Debt ETF Int'l Emerg Mkt Bond 729 161
WisdomTree Dreyfus Chin Yuan ETF Currency Funds 639 -5
WisdomTree Dreyfus Emerg Currency ETF Currency Funds 450 151
WisdomTree Asia Local Debt ETF Global Bond General 173 173
WisdomTree Dreyfus Brazil Real ETF Currency Funds 171 36
Cambria Global Tactical ETF Global Asset Alloctn 145 74
iShares Diversified Alternative Trust Global Asset Alloctn 127 15
PIMCO Intrmed Muni Bond Strategy ETF Muni Nat'l Intermed 78 15
WisdomTree Managed Futures Strategy Global Asset Alloctn 73 72
bnymellon.com ETFs 2.0: The Next Wave of Growth and Opportunity in the U.S. ETF Market 13
Growth Dynamics in the ETF Market
Room to Grow ETFs still have far to go in terms of penetrating the U.S. investor market. In 2009, only 5% of households owning mutual funds also owned ETFs, according to the Investment Company Institute, and ownership tended to gravitate toward more affluent and sophisticated investors. One source of growth for the still-young ETF industry will simply be expanding that 5% base.
Independent, fee-based Registered Investment Advisors (RIAs) were early adopters of ETFs. As a group, they are the biggest fans of ETFs, often becoming the first to use new exchange-traded products. One indication of this group’s significance within the ETF market is that RIAs using Schwab platforms account for more than 5% of the U.S. ETF market, excluding direct use by retail investors.
Financial advisors at broker-dealers (BDs) have also begun to increase their usage of ETFs. Fee-for-advice “wrap” programs have been the main vehicle for selling ETFs at broker-dealers. Many wraps offer ETFs alongside mutual funds. The first ETF-only wrap program debuted in 2001, and there are now many all-ETF wraps, each managing multiple billions in assets. Some broker-dealers also offer their advisors all-ETF model portfolios constructed by third parties.
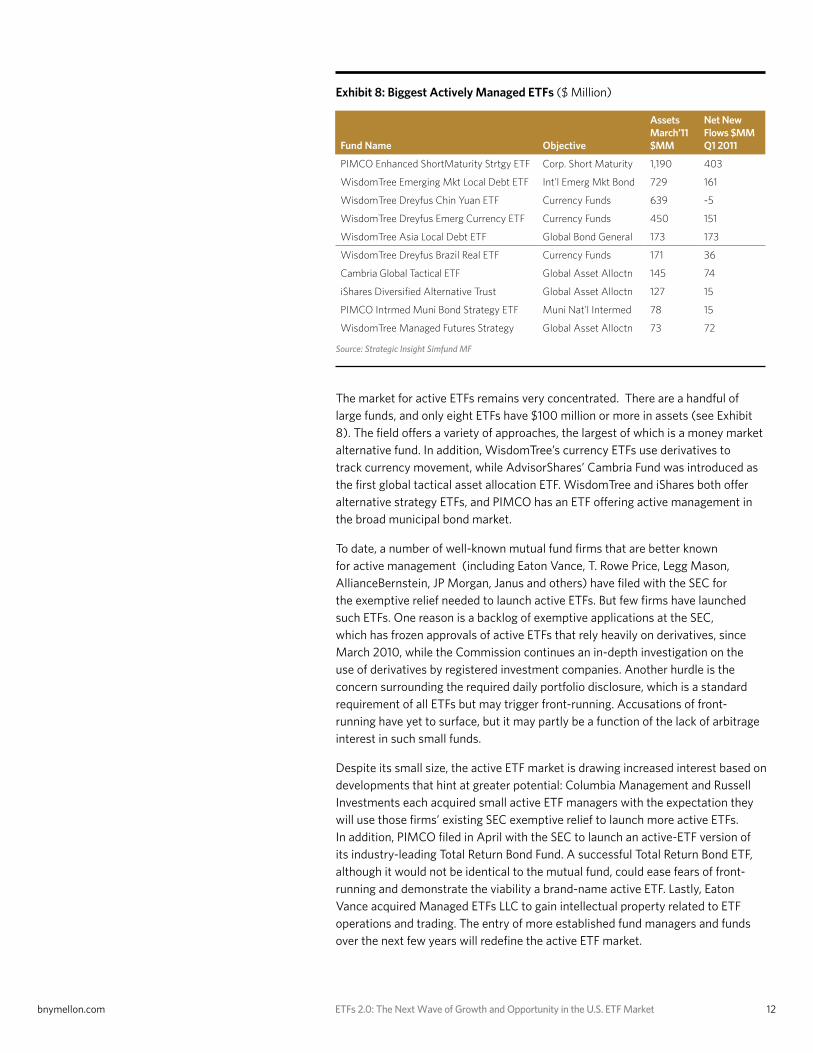
To see how quickly financial advisors have been warming to ETFs, we analyzed data from Coates Analytics’ Distribution Management System, a proprietary, web-based distribution and sales management database. Coates Analytics, an affiliate of Pershing, tracks fund and ETF sales and asset trends among more than 30,000 financial advisors at Morgan Stanley Smith Barney, UBS and Wells Fargo Advisors. By tracking a majority of National BD retail fund assets, the dataset provides a sense of how advisors at other broker-dealers use ETFs.
Exhibit 9: ETFs’ Share of National Broker Dealer Wrap Retail Fund Assets
Note: Wrap assets are those tracked by Coates AnalyticsSource: Coates Analytics Distribution Management System / Strategic Insight
0
200
400
600
800
1,000
1,200
1993
1994
1995
1996
1997
1998
1999
200
0
200
1
200
2
200
3
200
4
200
5
200
6
200
7
200
8
200
9
2010
Q1'
11
0%
2%
4%
6%
8%
10%
12/07 12/08 12/09 12/10 03/11
0
300
600
900
1200
March'06 March'11
0.00
0.20
0.40
0.60
0.80
1.00
1.20
U.S. Equity Int'l Equity Taxable Bond Muni Bond
0%
5%
10%
15%
20%
25%
30%
35%
40%
Q4'08 Q1'09 Q2'09 Q3'09 Q4'09 Q1'10 Q2'10 Q3'10 Q4'10 Q1'11
0
50
100
150
200
250
300
350
12/07 12/08 12/09 12/10 3/11 12/07 12/08 12/09 12/10 3/11
Europe/Offshore
Asia
0
500
1,000
1,500
2,000
2,500
2005 2006 2007 2008 2009 2010 2011E 2012E 2013E 2014E 2015E
Diversified U.S. Equity U.S. Equity - Sectors Int'l/Global Equity
Mutual Funds ETF’s
Currency Taxable Bond Muni Bond Commodity
We found that ETFs have been gaining ground in the Coates-tracked National BD wraps we studied. At the end of the first quarter of 2011, ETFs rose to 28% of retail fund (both mutual fund and ETF) assets in wrap programs – fee-based advisory programs – within National BDs, up from 22% at the end of 2008. This is evidence of significant growth, as National BDs have traditionally been the single biggest distribution channel for mutual funds.
bnymellon.com ETFs 2.0: The Next Wave of Growth and Opportunity in the U.S. ETF Market 14
ETFs Outside the U.S. Europe and Asia provide additional venues for possible growth. ETFs are a global phenomenon, and the forces driving adoption in the U.S. are at work in other parts of the world, as well. ETFs’ lower cost, liquidity, transparency, intraday tradability and their role providing access to diverse strategies, have resulted in rapid growth outside the U.S. One major difference is that non-U.S. markets for ETFs tend to be largely institutional – with the exception of the U.K. and a few other countries. However, this trend is slowly changing.
A number of ETFs are already cross-listed in multiple countries. For example, SPDR Gold Shares were introduced in the U.S., and then listed in Tokyo, Hong Kong and Singapore. Similarly, the iShares MSCI Emerging Markets Index ETF, which trades in the U.S., is also available in a version domiciled in Dublin and offered in 11 European countries as well as in Japan, Chile, Australia and the United Arab Emirates. European firms have an edge, as they create ETFs in the UCITS format, a regulatory structure that is much more widely accepted in Asia (where the U.S. 1940 Act structure is not widely accepted). European ETF heavyweights Lyxor, db x-trackers and ETF Securities each have at least a dozen ETFs listed in Singapore, Hong Kong or Japan.
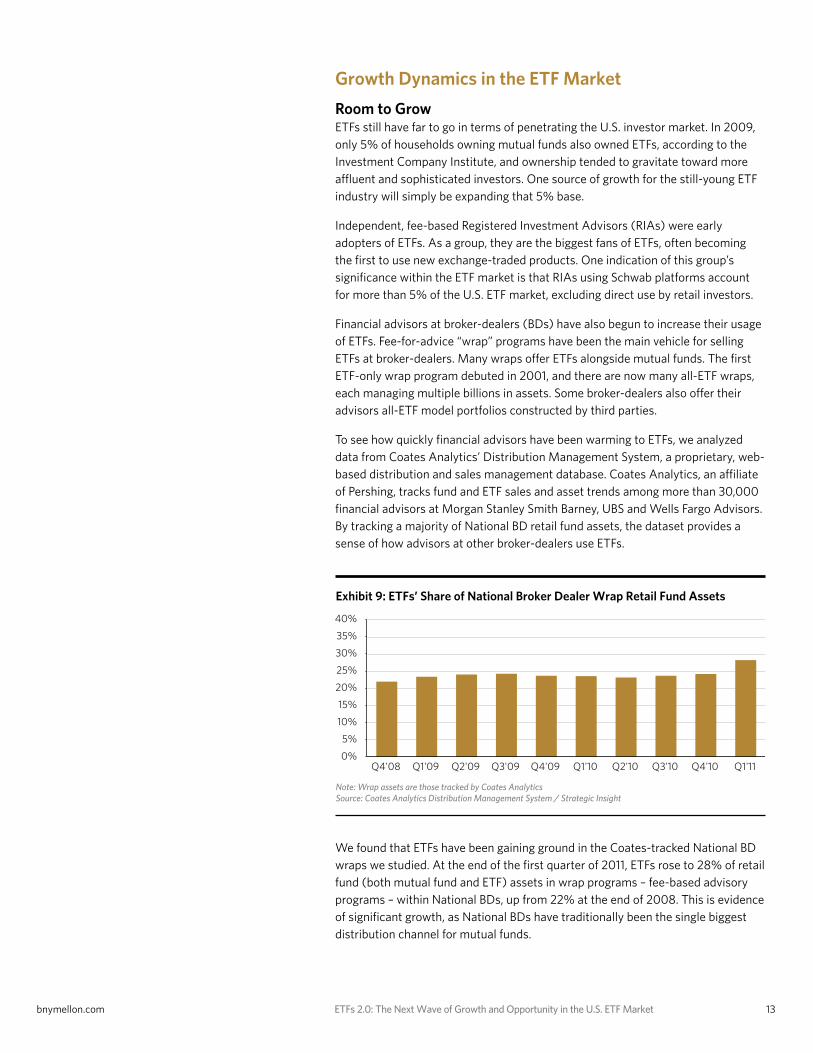
Exhibit 10: Growth of Europe/Offshore and Asia ETF Assets ($ Billion)
Note: Europe/Offshore includes International Domiciled ETFsSource: Strategic Insight Simfund
0
200
400
600
800
1,000
1,200
1993
1994
1995
1996
1997
1998
1999
200
0
200
1
200
2
200
3
200
4
200
5
200
6
200
7
200
8
200
9
2010
Q1'
11
0%
2%
4%
6%
8%
10%
12/07 12/08 12/09 12/10 03/11
0
300
600
900
1200
March'06 March'11
0.00
0.20
0.40
0.60
0.80
1.00
1.20
U.S. Equity Int'l Equity Taxable Bond Muni Bond
0%
5%
10%
15%
20%
25%
30%
35%
40%
Q4'08 Q1'09 Q2'09 Q3'09 Q4'09 Q1'10 Q2'10 Q3'10 Q4'10 Q1'11
0
50
100
150
200
250
300
350
12/07 12/08 12/09 12/10 3/11 12/07 12/08 12/09 12/10 3/11
Europe/Offshore
Asia
0
500
1,000
1,500
2,000
2,500
2005 2006 2007 2008 2009 2010 2011E 2012E 2013E 2014E 2015E
Diversified U.S. Equity U.S. Equity - Sectors Int'l/Global Equity
Mutual Funds ETF’s
Currency Taxable Bond Muni Bond Commodity
The European and offshore region, including ETFs domiciled in Dublin and Luxembourg but offered across borders, is the second-largest ETF “market” after the U.S. (acknowledging that Europe is really a collection of local markets). Europe/Offshore ETFs had $326 billion in assets as of March 31, 2011, which was up from $240 billion at the end of 2009. Asia is the third-largest “market” for ETFs; at March 31, it had $82 billion in ETF assets, up from $64 billion at the end of 2009.
There has been some limited cross-border activity by U.S. ETF managers. Notably, U.S.-based iShares is the #1 ETF manager in Europe and #3 in Asia, and U.S.-based State Street Global Advisors is ranked #2 in Asia. Invesco PowerShares is also active in Europe, PIMCO has launched a few ETFs in the U.K. and Germany, and Vanguard plans to launch European ETFs.
Europe and Asia offer possible opportunities for U.S.-based ETF sponsors. A number of factors make them appealing, including the fact that these markets
bnymellon.com ETFs 2.0: The Next Wave of Growth and Opportunity in the U.S. ETF Market 15
are more fragmented, ETF use is rising, and the appetite for investment expertise, especially in Asia, cannot always be filled by homegrown managers. Many large institutional investors outside the U.S. already invest in U.S.-domiciled ETFs, so are familiar with the sponsor brands. Besides creating UCITS-compliant versions of U.S. ETFs for foreign listings, joint ventures are another potential route. Partnerships are more common in Europe than in the U.S. ETF market, where, for example, PIMCO launched several ETFs in collaboration with Source, an ETF platform owned by several banks, including Goldman Sachs and Morgan Stanley.
Pending regulatory changes may make Europe even more attractive for ETF issuers. In the U.K., the Retail Distribution Review will result in new regulations banning commissions from product providers to advisors starting in 2013. This shift to a more fee-based environment should spark an acceleration in ETF growth, although such growth may be moderated if regulators continue to allow funds to rebate a portion of management fees to the distribution platform. More broadly, the new UCITS IV regulations contain fund “passport” features that could lower the costs for ETFs being marketed and distributed in a cross-border manner within the EU. In the longer term, the EU is reviewing its MiFID regulations, which could have an impact on revenue sharing with distributors across member states. Any change in market practices is likely to be slow, but the shift to fee-based “advisory” sales looks increasingly like a global, rather than U.S., phenomenon.
Challenges to ETF Growth Defined Contribution (DC) plans remain the most tantalizing challenge for ETFs. The $4.5 trillion DC market has been a small part of ETFs’ growth because of operational issues: DC platforms are overwhelmingly structured to deal with mutual funds in terms of settlement, trading and revenue-sharing, and ETFs’ tax efficiency and intraday trading are not advantageous within DC plans. As a result, few DC plans even offer ETFs as investment options.
A number of firms are making efforts to add ETFs to DC plans; for example, several record-keepers have built ETF-specific DC platforms. In addition, discount broker Charles Schwab plans to launch an all-ETF 401(k) recordkeeping platform. Furthermore, TD Ameritrade plans to open its 401(k) platform to ETFs alongside mutual funds and other investment products.
While these initiatives should accelerate ETFs’ slow expansion into the DC territory, the greater potential within the retirement space might be found within target-date funds. Proprietary, one-firm target date funds currently dominate this space, and a few ETF managers offer their own all-ETF versions. ETFs may find even more opportunity as sleeves within the small but growing number of multimanager target date funds (which typically use collective trust or institutional separate account structures).
For the most part, the biggest challenge to ETF growth is not the structure of certain markets but a lack of understanding of ETFs and how they work. Strategic Insight research has found that financial advisors are more apt to use ETFs in discretionary accounts, where they do not have to convince clients of the merits of ETFs. Because ETFs are relatively new, somewhat complex, and have grown so rapidly, they have bred suspicion among some critics who link them to market volatility and other risks. For example, rising commodity prices have been blamed on long-only commodity ETFs rather than on demand.
bnymellon.com ETFs 2.0: The Next Wave of Growth and Opportunity in the U.S. ETF Market 16
ETFs were blamed for helping cause the “Flash Crash” on May 6, 2010, when major U.S. equity indices in both the futures and securities markets suddenly plummeted in a matter of minutes before rebounding almost as quickly. Liquidity evaporated, resulting in over 20,000 trades being executed at prices more than 60% away from their values. ETFs accounted for 70% of the “broken trades” that had to be canceled. The SEC and Commodity Futures Trading Commission (CFTC) found that one mutual fund’s order to sell a large block of futures contracts triggered the flash crash. Indeed, the agencies concluded that the substantial activity of dark pools and high-frequency traders exacerbated the Flash Crash, and that ETFs were victims of these phenomena, not culprits. Still, the ETF-“Flash Crash” link in many observers’ minds was strong enough that a November 2010 report by the Kauffman Foundation, which was contested by a wide range of industry experts, surprisingly contradicted the SEC-CFTC findings and claimed that short-selling ETFs could possibly cause a similar market disruption.
Wariness of ETFs has also been evident in Europe. In April, the G20 Financial Stability Board, the International Monetary Fund (IMF) and the Bank for International Settlements (BIS) all issued reports expressing concerns about ETFs and systemic risk. Those worries mainly focused on either ETFs’ securities lending practices or counterparty risk related to swaps used in ETFs (swaps-based ETFs being much more prevalent in Europe). However, while the reports raise reasonable points about the need for proper collateralization with liquid and marketable securities (all of which UCITS regulations already require), the concerns are based on a Lehman Brothers-type collapse, which is possible but unlikely.
U.S. ETF Assets To Hit $2 Trillion By 2016 Even with the challenges that ETFs face, we believe the U.S. industry faces more tailwinds than headwinds. ETF assets in the U.S. grew by 28% in 2010, and while that was a decline from the 47% growth they enjoyed in 20009, it was still an impressive pace. Given that the ETF industry is more mature and much larger (and therefore more difficult to grow in percentage terms), it’s improbable that it will ever again grow by 47% in one year.
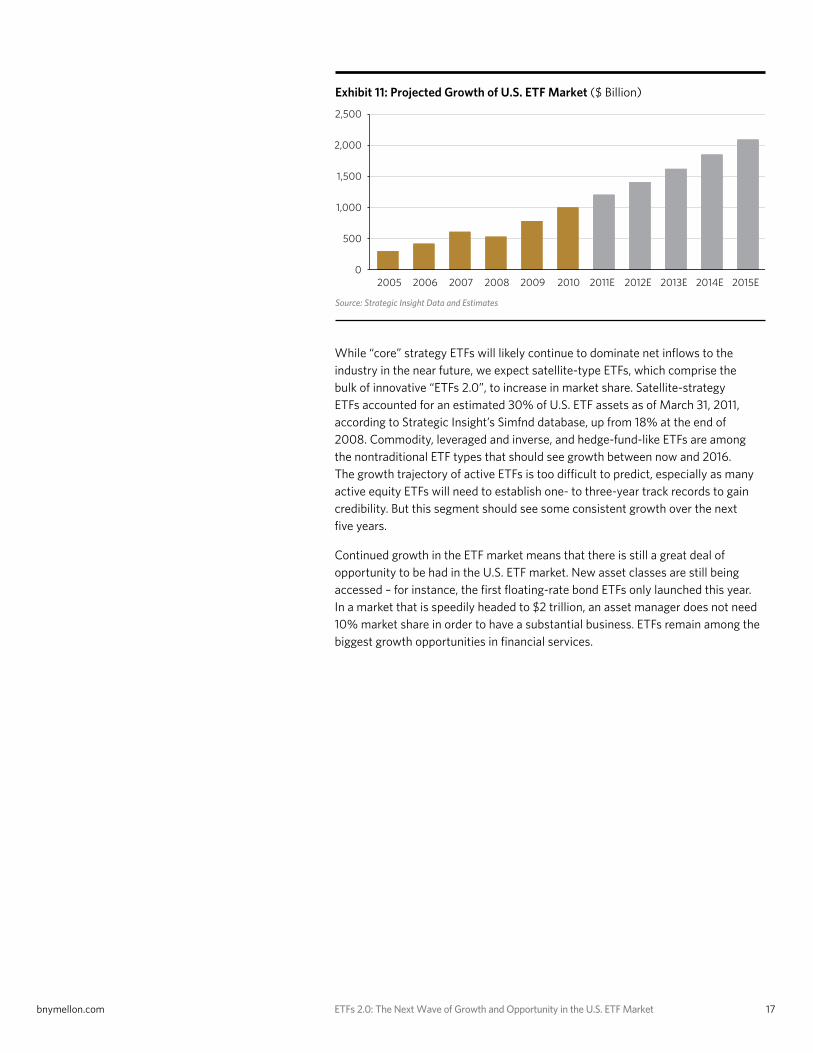
Barring a dramatic bear market, Strategic Insight projects that U.S. ETF assets will reach $2 trillion by the end of 2015. This assumes ETF asset growth slows gradually over the coming years, producing a compound annual growth rate of 15.8% through 2015. This pace would be a decline from the 27.2% compound annual growth rate that ETFs experienced from 2005 through 2010, because a larger industry naturally expands more slowly (and data suggest some ETF users are reaching a saturation point). Still, this means ETFs should rise from $1.005 trillion in U.S. assets at the end of 2010 to $2.091 trillion at the end of 2015 (see Exhibit 11).
bnymellon.com ETFs 2.0: The Next Wave of Growth and Opportunity in the U.S. ETF Market 17
Exhibit 11: Projected Growth of U.S. ETF Market ($ Billion)
Source: Strategic Insight Data and Estimates
0
200
400
600
800
1,000
1,200
1993
1994
1995
1996
1997
1998
1999
200
0
200
1
200
2
200
3
200
4
200
5
200
6
200
7
200
8
200
9
2010
Q1'
11
0%
2%
4%
6%
8%
10%
12/07 12/08 12/09 12/10 03/11
0
300
600
900
1200
March'06 March'11
0.00
0.20
0.40
0.60
0.80
1.00
1.20
U.S. Equity Int'l Equity Taxable Bond Muni Bond
0%
5%
10%
15%
20%
25%
30%
35%
40%
Q4'08 Q1'09 Q2'09 Q3'09 Q4'09 Q1'10 Q2'10 Q3'10 Q4'10 Q1'11
0
50
100
150
200
250
300
350
12/07 12/08 12/09 12/10 3/11 12/07 12/08 12/09 12/10 3/11
Europe/Offshore
Asia
0
500
1,000
1,500
2,000
2,500
2005 2006 2007 2008 2009 2010 2011E 2012E 2013E 2014E 2015E
Diversified U.S. Equity U.S. Equity - Sectors Int'l/Global Equity
Mutual Funds ETF’s
Currency Taxable Bond Muni Bond Commodity
While “core” strategy ETFs will likely continue to dominate net inflows to the industry in the near future, we expect satellite-type ETFs, which comprise the bulk of innovative “ETFs 2.0”, to increase in market share. Satellite-strategy ETFs accounted for an estimated 30% of U.S. ETF assets as of March 31, 2011, according to Strategic Insight’s Simfnd database, up from 18% at the end of 2008. Commodity, leveraged and inverse, and hedge-fund-like ETFs are among the nontraditional ETF types that should see growth between now and 2016. The growth trajectory of active ETFs is too difficult to predict, especially as many active equity ETFs will need to establish one- to three-year track records to gain credibility. But this segment should see some consistent growth over the next five years.
Continued growth in the ETF market means that there is still a great deal of opportunity to be had in the U.S. ETF market. New asset classes are still being accessed – for instance, the first floating-rate bond ETFs only launched this year. In a market that is speedily headed to $2 trillion, an asset manager does not need 10% market share in order to have a substantial business. ETFs remain among the biggest growth opportunities in financial services.
bnymellon.com ETFs 2.0: The Next Wave of Growth and Opportunity in the U.S. ETF Market 18
Considerations for Launching ETFs
The Asset Manager’s Capabilities When contemplating the launch of an ETF operation or the addition of new products to an existing line of ETFs the first priority is to identify if they are a logical fit with or a natural extension of the asset manager’s core competencies. Some U.S. fund management firms have looked at the ETF market and decided that launching some kind of passive ETF was not in their corporate DNA. Others have decided that ETFs complement their existing offerings with an additional structure and distribution outlet for new strategies. For example, PIMCO launched not only actively managed ETFs, but also passive ETFs representing the beta of asset classes in which the firm had actively managed products.
Asset managers who are looking to enter or expand within the ETF market must clarify the value proposition of their products for retail and institutional ETF investors. For instance, Van Eck Global, a longtime manager of nontraditional mutual funds, entered the ETF market in 2006 with a gold-mining stocks ETF, building on the firm’s gold-related expertise that it had gained from managing a gold stock mutual fund since 1968. Van Eck’s first ETF drew over $1.6 billion in net inflows in its first two years of existence. A new ETF must differentiate itself from other ETFs and from actively managed mutual funds.
For some asset managers, building their own ETFs is the preferred route, while others may choose to partner with another firm in the ETF space. An example of this method would be Dreyfus, an affiliate of The Bank of New York Mellon, which uses its expertise to sub-advise a number of WisdomTree ETFs, such as the WisdomTree Dreyfus China Yuan ETF. Another viable option is acquiring an ETF sponsor; the biggest such deal was BlackRock’s purchase of iShares in 2009. On a smaller scale, Goldman Sachs recently acquired India’s Benchmark Capital, giving the firm its first ETFs in Asia.
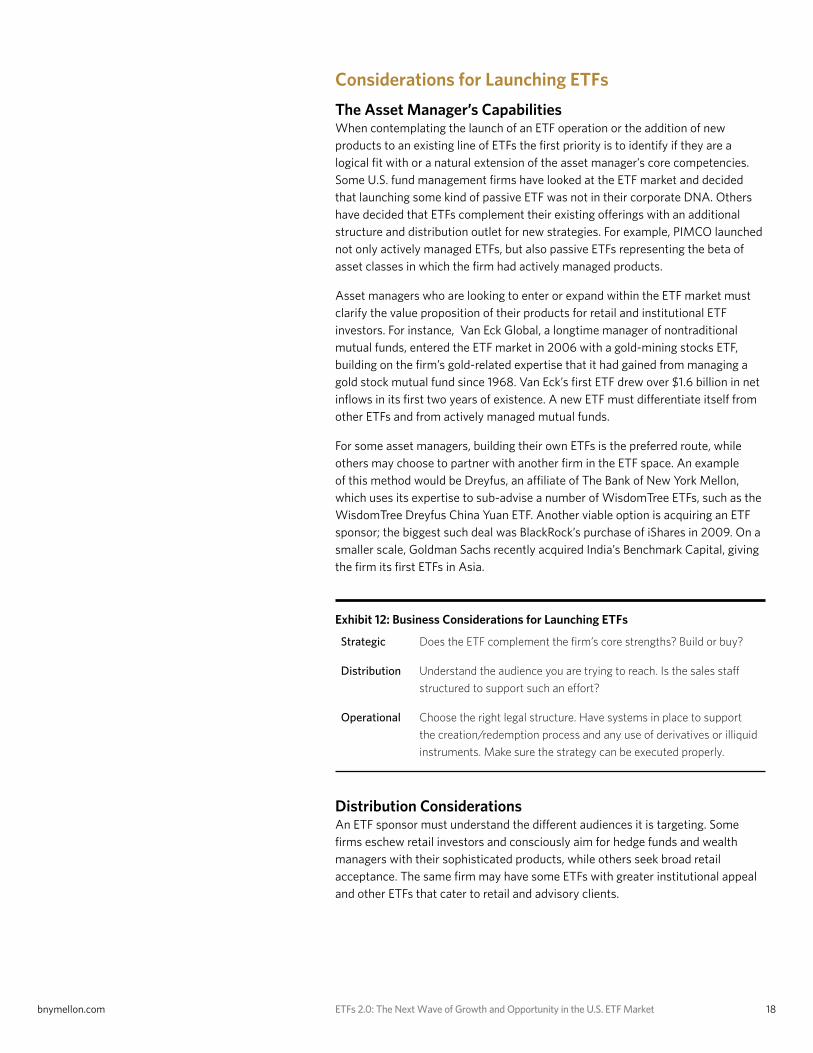
Exhibit 12: Business Considerations for Launching ETFs
Strategic Does the ETF complement the firm’s core strengths? Build or buy?
Distribution Understand the audience you are trying to reach. Is the sales staff
structured to support such an effort?
Operational Choose the right legal structure. Have systems in place to support
the creation/redemption process and any use of derivatives or illiquid
instruments. Make sure the strategy can be executed properly.
Distribution Considerations An ETF sponsor must understand the different audiences it is targeting. Some firms eschew retail investors and consciously aim for hedge funds and wealth managers with their sophisticated products, while others seek broad retail acceptance. The same firm may have some ETFs with greater institutional appeal and other ETFs that cater to retail and advisory clients.
bnymellon.com ETFs 2.0: The Next Wave of Growth and Opportunity in the U.S. ETF Market 19
Case Study: WisdomTree
Trading volume is crucial to the success of an ETF, as many investors gauge daily liquidity before making a trade. Thus a manager should seek to launch an ETF with many Authorized Participants. Those firms, and traders and other market makers, are integral parts of every ETF’s client base. Ideally, an ETF manager can use its relationships with the trading community to help in periods of volatility or to manage investors’ large block ETF trades.
An ETF manager must structure a sales staff to address the audiences it has identified. The personnel might come from a variety of backgrounds, including fund wholesaling, ETF sponsors, trading desks and wealth management. If a firm has a legacy mutual fund business, it must also decide whether its fund wholesalers will try to sell ETFs alongside its traditional funds, which may present cross-selling opportunities but may also dilute salespeople’s focus, or if it needs a separate staff focused solely on selling ETFs. Similarly, structuring compensation for ETF distribution personnel can require creativity because of the difficulty in determining wholesalers’ impact on product sales given the lack of granularity available at the individual investor level. There is no industry-wide solution for the lack of advisor- or rep- level details on ETF transactions and holdings, although firms such as Pershing and its Coates Analytics affiliate can help with such reporting for a portion of the ETF retail market.
The sales staff needs support from marketing. In addition to advertisements and sponsorships, education is vital, and can be delivered through whitepapers, webinars, web sites and more. Some investors and advisors will have to be introduced to ETFs and how specific ETFs might fit into portfolios. Financial advisors will need additional materials to share with retail investors. And ETF managers should also provide other, typical markets- and practice-related value-added content.
New York-based WisdomTree launched its first ETFs in 2006, and currently manages
$11.3 billion in 46 ETFs as of March 31, 2011. With no legacy mutual fund business, it
has focused on building a line of equity, fixed income, currency and alternative ETFs.
A diverse range of ETFs allows the firm to appeal to a broad range of customers.
Customers sometimes suggest product ideas, and client demand inspired the firm
to launch its Asia Local Debt Fund following the successful launch of its Emerging
Markets Local Debt Fund. WisdomTree’s staff of external and internal wholesalers is
segmented along three channels: institutions, National Broker Dealers and independent
RIAs. Every salesperson must be able to discuss all 46 ETFs, so new wholesalers go
through four to eight weeks of training before facing clients. WisdomTree creates a
launch plan for each new ETF, with the hope of quickly gathering the assets and trading
volume to help clients become comfortable investing in a new product.
bnymellon.com ETFs 2.0: The Next Wave of Growth and Opportunity in the U.S. ETF Market 20
Operational Considerations In considering a new ETF, the manager must decide what kind of structure is needed to deliver the investment strategy. Open-end, 1940 Act mutual fund structures are the most popular based on assets, but many nontraditional strategies require the fund to be structured as a grantor trust, a partnership, or an ETN, to provide the necessary flexibility to invest in futures and other instruments.
Because of the complexities of the ETF structure, trusted relationships with service providers are essential. Systems are needed to handle the creation/redemption process, including transfer agency services and accounting solutions that enable Authorized Participants to remain appropriately hedged. Robust valuation systems must be able to calculate an indicative net asset value (NAV) every 15 seconds, which can be challenging when an ETF holds illiquid securities or hard-to-value derivatives. Capabilities in collateral management and securities lending may be needed, and are sometimes new activities for the asset manager. If a strategy involves short-selling, access to prime brokerage services may be necessary.
Asset managers often develop a consultative relationship with service providers, who can frequently help with exchange listing, links to the market maker/specialist community, and other aspects of launching and running an ETF. Depending on the ETF, it may make sense to involve service providers early in the product development process to make sure the proposed strategy can be executed efficiently and effectively.
With the appropriate planning, all manner of complicated exchange-traded products can be brought to market. These capabilities ensure that asset managers can maintain the innovation that is fueling the growth of the ETF industry. As the U.S. ETF market roughly doubles in size over the next 3 1/2 years, that growth offers exciting potential for the ETF manager who is focused on meeting investors’ growing demand for sophisticated solutions.

bnymellon.comThis publication, which may be considered advertising, is provided with the understanding that it is for informational purposes only and does not constitute the rendering of legal, tax or accounting advice or other professional advice by The Bank of New York Mellon or its affiliates. Any discussion of tax matters contained in this publication is not intended or written to be used, and cannot be used, for the purpose of avoiding penalties under the Internal Revenue Code or promoting, marketing or recommending to another party any transaction or matter. This material may not be reproduced or disseminated in any form without the express written permission of The Bank of New York Mellon. The Bank of New York Mellon does not guarantee the accuracy of any information contained herein and cannot be held liable for any errors in or reliance upon this information. Prior results do not guarantee a similar outcome.
© 2011 The Bank of New York Mellon Corporation. All rights reserved. 06/11
About Strategic InsightBegun in 1986, Strategic Insight is a competitive-intelligence source for the investment management industry, providing clients with in-depth studies, consultation, and electronic database systems. The firm assists over 250 organizations worldwide, including the largest mutual fund management companies operating in the U.S. and the largest insurance companies serving the VA business. Strategic Insight also helps over 60 of the world’s largest asset managers expand in Europe and Asia. For more information, visit www.sionline.com.
About BNY Mellon BNY Mellon is a global financial services company focused on helping clients manage and service their financial assets, operating in 36 countries and serving more than 100 markets. BNY Mellon is a leading provider of financial services for institutions, corporations and high-net-worth individuals, offering superior investment management and investment services through a worldwide client-focused team. It has $25.5 trillion in assets under custody and administration and $1.2 trillion in assets under management, services $11.9 trillion in outstanding debt and processes global payments averaging $1.7 trillion per day. BNY Mellon is the corporate brand of The Bank of New York Mellon Corporation. Additional information is available at www.bnymellon.com.
About BNY Mellon Asset Servicing BNY Mellon Asset Servicing offers clients worldwide a broad spectrum of specialized asset servicing capabilities, including custody and fund services, securities lending, performance and analytics, and execution services. BNY Mellon Asset Servicing provides services through BNY Mellon and other related companies.