Embed Size (px)
Citation preview
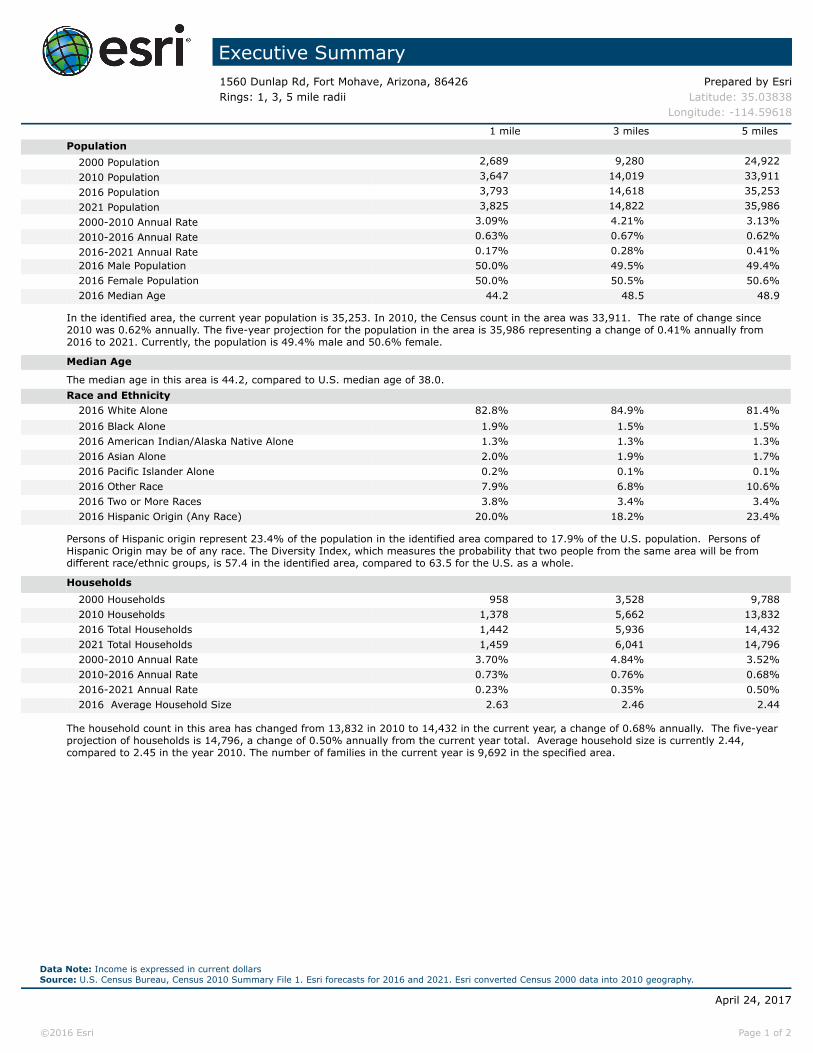
Executive Summary1560 Dunlap Rd, Fort Mohave, Arizona, 86426 Prepared by EsriRings: 1, 3, 5 mile radii Latitude: 35.03838
Longitude: -114.59618
1 mile 3 miles 5 milesPopulation
2000 Population 2,689 9,280 24,9222010 Population 3,647 14,019 33,9112016 Population 3,793 14,618 35,2532021 Population 3,825 14,822 35,9862000-2010 Annual Rate 3.09% 4.21% 3.13%2010-2016 Annual Rate 0.63% 0.67% 0.62%2016-2021 Annual Rate 0.17% 0.28% 0.41%2016 Male Population 50.0% 49.5% 49.4%2016 Female Population 50.0% 50.5% 50.6%2016 Median Age 44.2 48.5 48.9
In the identified area, the current year population is 35,253. In 2010, the Census count in the area was 33,911. The rate of change since 2010 was 0.62% annually. The five-year projection for the population in the area is 35,986 representing a change of 0.41% annually from 2016 to 2021. Currently, the population is 49.4% male and 50.6% female.
Median Age
The median age in this area is 44.2, compared to U.S. median age of 38.0.Race and Ethnicity
2016 White Alone 82.8% 84.9% 81.4%2016 Black Alone 1.9% 1.5% 1.5%2016 American Indian/Alaska Native Alone 1.3% 1.3% 1.3%2016 Asian Alone 2.0% 1.9% 1.7%2016 Pacific Islander Alone 0.2% 0.1% 0.1%2016 Other Race 7.9% 6.8% 10.6%2016 Two or More Races 3.8% 3.4% 3.4%2016 Hispanic Origin (Any Race) 20.0% 18.2% 23.4%
Persons of Hispanic origin represent 23.4% of the population in the identified area compared to 17.9% of the U.S. population. Persons of Hispanic Origin may be of any race. The Diversity Index, which measures the probability that two people from the same area will be from different race/ethnic groups, is 57.4 in the identified area, compared to 63.5 for the U.S. as a whole.
Households2000 Households 958 3,528 9,7882010 Households 1,378 5,662 13,8322016 Total Households 1,442 5,936 14,4322021 Total Households 1,459 6,041 14,7962000-2010 Annual Rate 3.70% 4.84% 3.52%2010-2016 Annual Rate 0.73% 0.76% 0.68%2016-2021 Annual Rate 0.23% 0.35% 0.50%2016 Average Household Size 2.63 2.46 2.44
The household count in this area has changed from 13,832 in 2010 to 14,432 in the current year, a change of 0.68% annually. The five-year projection of households is 14,796, a change of 0.50% annually from the current year total. Average household size is currently 2.44, compared to 2.45 in the year 2010. The number of families in the current year is 9,692 in the specified area.
Data Note: Income is expressed in current dollarsSource: U.S. Census Bureau, Census 2010 Summary File 1. Esri forecasts for 2016 and 2021. Esri converted Census 2000 data into 2010 geography.
April 24, 2017
©2016 Esri Page 1 of 2
Executive Summary1560 Dunlap Rd, Fort Mohave, Arizona, 86426 Prepared by EsriRings: 1, 3, 5 mile radii Latitude: 35.03838
Longitude: -114.59618
1 mile 3 miles 5 milesMedian Household Income
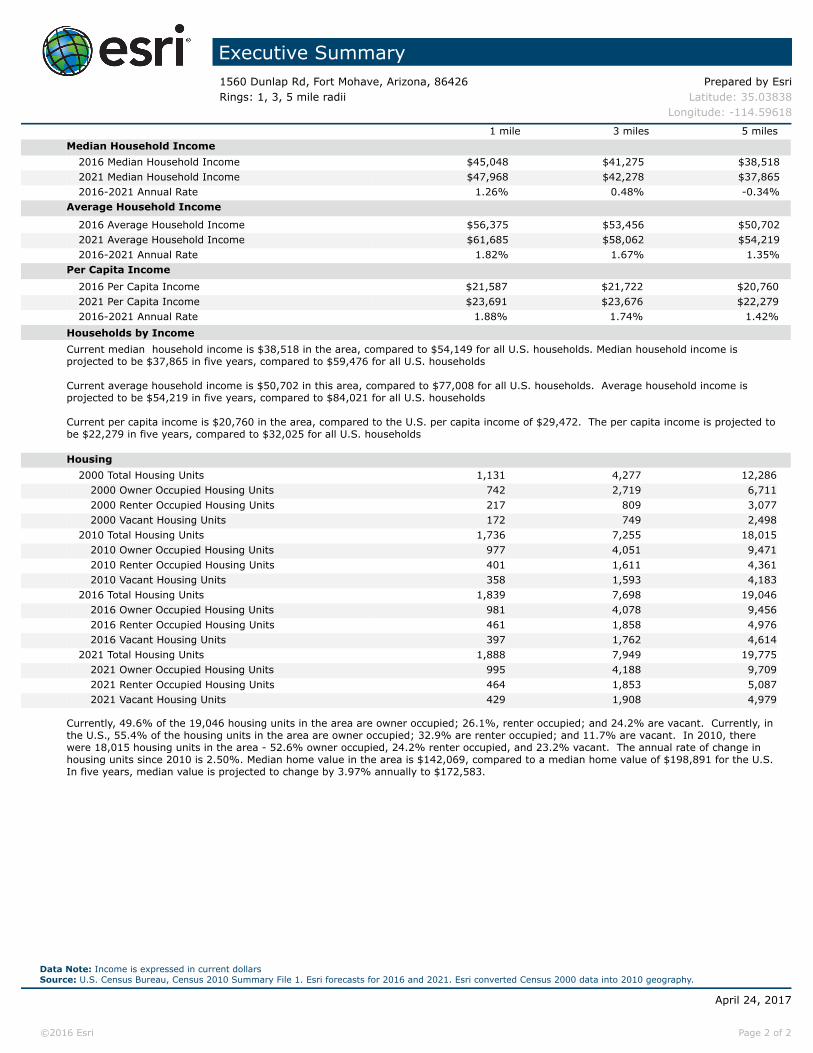
2016 Median Household Income $45,048 $41,275 $38,5182021 Median Household Income $47,968 $42,278 $37,8652016-2021 Annual Rate 1.26% 0.48% -0.34%
Average Household Income
2016 Average Household Income $56,375 $53,456 $50,7022021 Average Household Income $61,685 $58,062 $54,2192016-2021 Annual Rate 1.82% 1.67% 1.35%
Per Capita Income2016 Per Capita Income $21,587 $21,722 $20,7602021 Per Capita Income $23,691 $23,676 $22,2792016-2021 Annual Rate 1.88% 1.74% 1.42%
Households by IncomeCurrent median household income is $38,518 in the area, compared to $54,149 for all U.S. households. Median household income is projected to be $37,865 in five years, compared to $59,476 for all U.S. households
Current average household income is $50,702 in this area, compared to $77,008 for all U.S. households. Average household income is projected to be $54,219 in five years, compared to $84,021 for all U.S. households
Current per capita income is $20,760 in the area, compared to the U.S. per capita income of $29,472. The per capita income is projected to be $22,279 in five years, compared to $32,025 for all U.S. households Housing
2000 Total Housing Units 1,131 4,277 12,2862000 Owner Occupied Housing Units 742 2,719 6,7112000 Renter Occupied Housing Units 217 809 3,0772000 Vacant Housing Units 172 749 2,498
2010 Total Housing Units 1,736 7,255 18,0152010 Owner Occupied Housing Units 977 4,051 9,4712010 Renter Occupied Housing Units 401 1,611 4,3612010 Vacant Housing Units 358 1,593 4,183
2016 Total Housing Units 1,839 7,698 19,0462016 Owner Occupied Housing Units 981 4,078 9,4562016 Renter Occupied Housing Units 461 1,858 4,9762016 Vacant Housing Units 397 1,762 4,614
2021 Total Housing Units 1,888 7,949 19,7752021 Owner Occupied Housing Units 995 4,188 9,7092021 Renter Occupied Housing Units 464 1,853 5,0872021 Vacant Housing Units 429 1,908 4,979
Currently, 49.6% of the 19,046 housing units in the area are owner occupied; 26.1%, renter occupied; and 24.2% are vacant. Currently, in the U.S., 55.4% of the housing units in the area are owner occupied; 32.9% are renter occupied; and 11.7% are vacant. In 2010, there were 18,015 housing units in the area - 52.6% owner occupied, 24.2% renter occupied, and 23.2% vacant. The annual rate of change in housing units since 2010 is 2.50%. Median home value in the area is $142,069, compared to a median home value of $198,891 for the U.S. In five years, median value is projected to change by 3.97% annually to $172,583.
Data Note: Income is expressed in current dollarsSource: U.S. Census Bureau, Census 2010 Summary File 1. Esri forecasts for 2016 and 2021. Esri converted Census 2000 data into 2010 geography.
April 24, 2017
©2016 Esri Page 2 of 2
Retail MarketPlace Profile1560 Dunlap Rd, Fort Mohave, Arizona, 86426 Prepared by EsriRing: 1 mile radius Latitude: 35.03838
Longitude: -114.59618
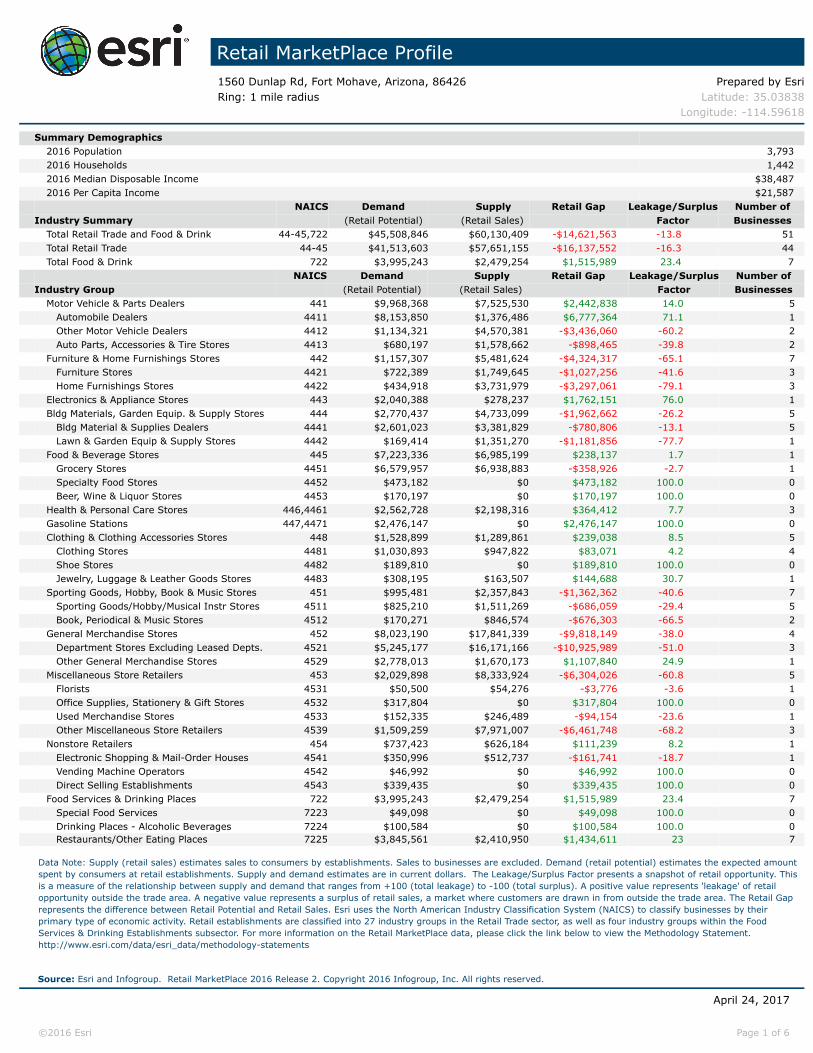
Summary Demographics2016 Population 3,7932016 Households 1,4422016 Median Disposable Income $38,4872016 Per Capita Income $21,587
NAICS Demand Supply Retail Gap Leakage/Surplus Number ofIndustry Summary (Retail Potential) (Retail Sales) Factor Businesses
Total Retail Trade and Food & Drink 44-45,722 $45,508,846 $60,130,409 -$14,621,563 -13.8 51Total Retail Trade 44-45 $41,513,603 $57,651,155 -$16,137,552 -16.3 44Total Food & Drink 722 $3,995,243 $2,479,254 $1,515,989 23.4 7
NAICS Demand Supply Retail Gap Leakage/Surplus Number ofIndustry Group (Retail Potential) (Retail Sales) Factor Businesses
Motor Vehicle & Parts Dealers 441 $9,968,368 $7,525,530 $2,442,838 14.0 5 Automobile Dealers 4411 $8,153,850 $1,376,486 $6,777,364 71.1 1 Other Motor Vehicle Dealers 4412 $1,134,321 $4,570,381 -$3,436,060 -60.2 2 Auto Parts, Accessories & Tire Stores 4413 $680,197 $1,578,662 -$898,465 -39.8 2Furniture & Home Furnishings Stores 442 $1,157,307 $5,481,624 -$4,324,317 -65.1 7 Furniture Stores 4421 $722,389 $1,749,645 -$1,027,256 -41.6 3 Home Furnishings Stores 4422 $434,918 $3,731,979 -$3,297,061 -79.1 3Electronics & Appliance Stores 443 $2,040,388 $278,237 $1,762,151 76.0 1Bldg Materials, Garden Equip. & Supply Stores 444 $2,770,437 $4,733,099 -$1,962,662 -26.2 5 Bldg Material & Supplies Dealers 4441 $2,601,023 $3,381,829 -$780,806 -13.1 5 Lawn & Garden Equip & Supply Stores 4442 $169,414 $1,351,270 -$1,181,856 -77.7 1Food & Beverage Stores 445 $7,223,336 $6,985,199 $238,137 1.7 1 Grocery Stores 4451 $6,579,957 $6,938,883 -$358,926 -2.7 1 Specialty Food Stores 4452 $473,182 $0 $473,182 100.0 0 Beer, Wine & Liquor Stores 4453 $170,197 $0 $170,197 100.0 0Health & Personal Care Stores 446,4461 $2,562,728 $2,198,316 $364,412 7.7 3Gasoline Stations 447,4471 $2,476,147 $0 $2,476,147 100.0 0Clothing & Clothing Accessories Stores 448 $1,528,899 $1,289,861 $239,038 8.5 5 Clothing Stores 4481 $1,030,893 $947,822 $83,071 4.2 4 Shoe Stores 4482 $189,810 $0 $189,810 100.0 0 Jewelry, Luggage & Leather Goods Stores 4483 $308,195 $163,507 $144,688 30.7 1Sporting Goods, Hobby, Book & Music Stores 451 $995,481 $2,357,843 -$1,362,362 -40.6 7 Sporting Goods/Hobby/Musical Instr Stores 4511 $825,210 $1,511,269 -$686,059 -29.4 5 Book, Periodical & Music Stores 4512 $170,271 $846,574 -$676,303 -66.5 2General Merchandise Stores 452 $8,023,190 $17,841,339 -$9,818,149 -38.0 4 Department Stores Excluding Leased Depts. 4521 $5,245,177 $16,171,166 -$10,925,989 -51.0 3 Other General Merchandise Stores 4529 $2,778,013 $1,670,173 $1,107,840 24.9 1Miscellaneous Store Retailers 453 $2,029,898 $8,333,924 -$6,304,026 -60.8 5 Florists 4531 $50,500 $54,276 -$3,776 -3.6 1 Office Supplies, Stationery & Gift Stores 4532 $317,804 $0 $317,804 100.0 0 Used Merchandise Stores 4533 $152,335 $246,489 -$94,154 -23.6 1 Other Miscellaneous Store Retailers 4539 $1,509,259 $7,971,007 -$6,461,748 -68.2 3Nonstore Retailers 454 $737,423 $626,184 $111,239 8.2 1 Electronic Shopping & Mail-Order Houses 4541 $350,996 $512,737 -$161,741 -18.7 1 Vending Machine Operators 4542 $46,992 $0 $46,992 100.0 0 Direct Selling Establishments 4543 $339,435 $0 $339,435 100.0 0Food Services & Drinking Places 722 $3,995,243 $2,479,254 $1,515,989 23.4 7 Special Food Services 7223 $49,098 $0 $49,098 100.0 0 Drinking Places - Alcoholic Beverages 7224 $100,584 $0 $100,584 100.0 0 Restaurants/Other Eating Places 7225 $3,845,561 $2,410,950 $1,434,611 23 7
Data Note: Supply (retail sales) estimates sales to consumers by establishments. Sales to businesses are excluded. Demand (retail potential) estimates the expected amount spent by consumers at retail establishments. Supply and demand estimates are in current dollars. The Leakage/Surplus Factor presents a snapshot of retail opportunity. This is a measure of the relationship between supply and demand that ranges from +100 (total leakage) to -100 (total surplus). A positive value represents 'leakage' of retail opportunity outside the trade area. A negative value represents a surplus of retail sales, a market where customers are drawn in from outside the trade area. The Retail Gap represents the difference between Retail Potential and Retail Sales. Esri uses the North American Industry Classification System (NAICS) to classify businesses by their primary type of economic activity. Retail establishments are classified into 27 industry groups in the Retail Trade sector, as well as four industry groups within the Food Services & Drinking Establishments subsector. For more information on the Retail MarketPlace data, please click the link below to view the Methodology Statement.http://www.esri.com/data/esri_data/methodology-statements
Source: Esri and Infogroup. Retail MarketPlace 2016 Release 2. Copyright 2016 Infogroup, Inc. All rights reserved.
April 24, 2017
©2016 Esri Page 1 of 6
Retail MarketPlace Profile1560 Dunlap Rd, Fort Mohave, Arizona, 86426 Prepared by EsriRing: 1 mile radius Latitude: 35.03838
Longitude: -114.59618
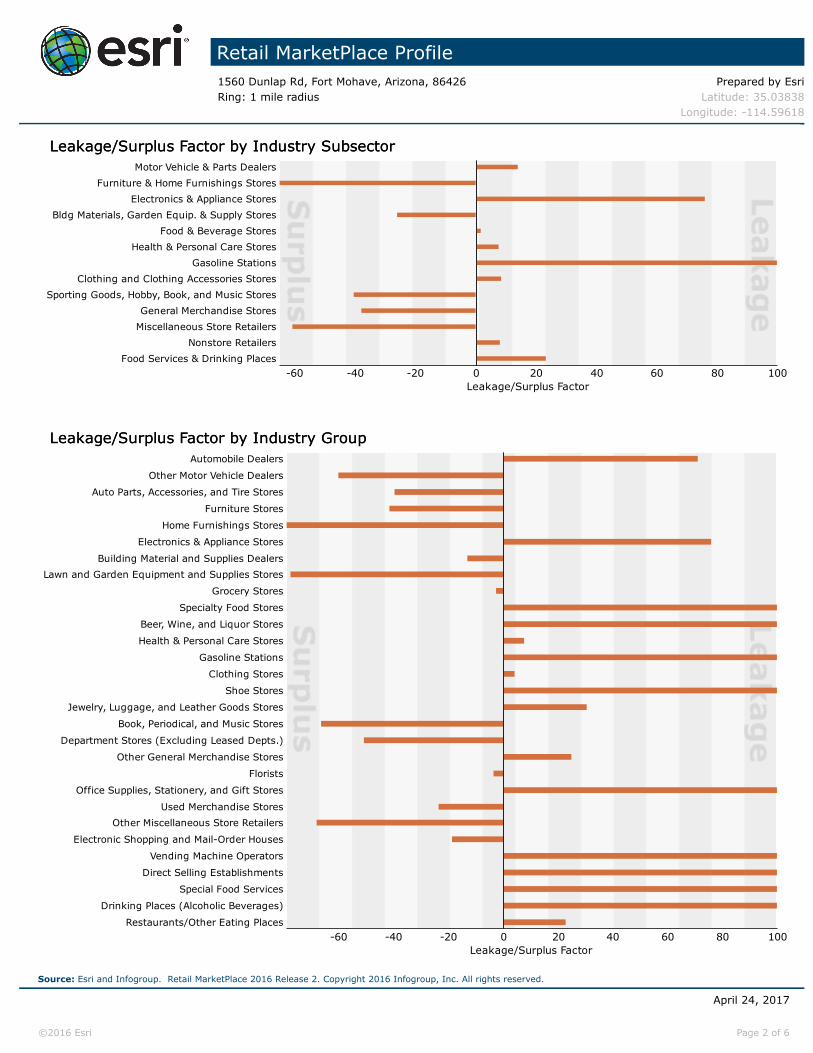
Leakage/Surplus Factor by Industry SubsectorLeakage/Surplus Factor by Industry Subsector
Food Services & Drinking Places Nonstore Retailers
Miscellaneous Store Retailers General Merchandise Stores
Sporting Goods, Hobby, Book, and Music Stores Clothing and Clothing Accessories Stores
Gasoline Stations Health & Personal Care Stores
Food & Beverage Stores Bldg Materials, Garden Equip. & Supply Stores
Electronics & Appliance Stores Furniture & Home Furnishings Stores
Motor Vehicle & Parts Dealers
Leakage/Surplus Factor100806040200-20-40-60
Leakage/Surplus Factor by Industry GroupLeakage/Surplus Factor by Industry Group
Restaurants/Other Eating Places
Drinking Places (Alcoholic Beverages)
Special Food Services
Direct Selling Establishments
Vending Machine Operators
Electronic Shopping and Mail-Order Houses
Other Miscellaneous Store Retailers Used Merchandise Stores
Office Supplies, Stationery, and Gift Stores
Florists
Other General Merchandise Stores
Department Stores (Excluding Leased Depts.)
Book, Periodical, and Music Stores
Jewelry, Luggage, and Leather Goods Stores
Shoe Stores
Clothing Stores
Gasoline Stations
Health & Personal Care Stores
Beer, Wine, and Liquor Stores
Specialty Food Stores
Grocery Stores
Lawn and Garden Equipment and Supplies Stores Building Material and Supplies Dealers
Electronics & Appliance Stores
Home Furnishings Stores
Furniture Stores
Auto Parts, Accessories, and Tire Stores
Other Motor Vehicle Dealers
Automobile Dealers
Leakage/Surplus Factor100806040200-20-40-60
Source: Esri and Infogroup. Retail MarketPlace 2016 Release 2. Copyright 2016 Infogroup, Inc. All rights reserved.
April 24, 2017
©2016 Esri Page 2 of 6
Retail MarketPlace Profile1560 Dunlap Rd, Fort Mohave, Arizona, 86426 Prepared by EsriRing: 3 mile radius Latitude: 35.03838
Longitude: -114.59618
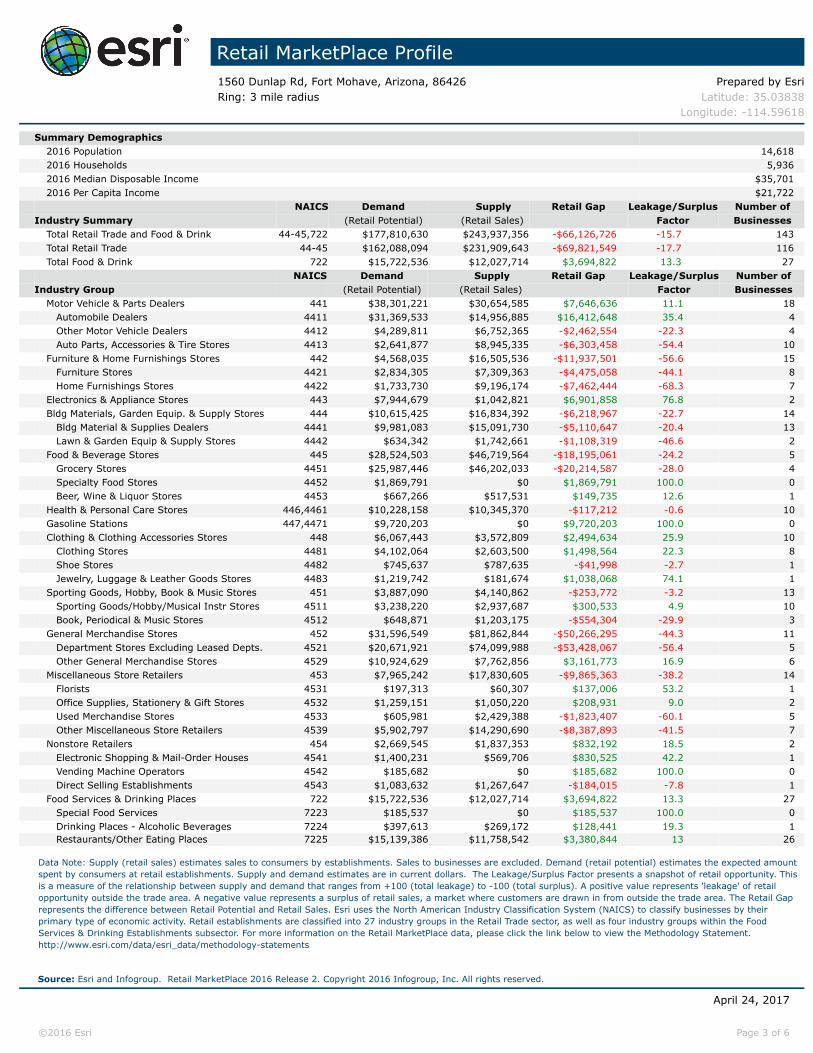
Summary Demographics2016 Population 14,6182016 Households 5,9362016 Median Disposable Income $35,7012016 Per Capita Income $21,722
NAICS Demand Supply Retail Gap Leakage/Surplus Number ofIndustry Summary (Retail Potential) (Retail Sales) Factor Businesses
Total Retail Trade and Food & Drink 44-45,722 $177,810,630 $243,937,356 -$66,126,726 -15.7 143Total Retail Trade 44-45 $162,088,094 $231,909,643 -$69,821,549 -17.7 116Total Food & Drink 722 $15,722,536 $12,027,714 $3,694,822 13.3 27
NAICS Demand Supply Retail Gap Leakage/Surplus Number ofIndustry Group (Retail Potential) (Retail Sales) Factor Businesses
Motor Vehicle & Parts Dealers 441 $38,301,221 $30,654,585 $7,646,636 11.1 18 Automobile Dealers 4411 $31,369,533 $14,956,885 $16,412,648 35.4 4 Other Motor Vehicle Dealers 4412 $4,289,811 $6,752,365 -$2,462,554 -22.3 4 Auto Parts, Accessories & Tire Stores 4413 $2,641,877 $8,945,335 -$6,303,458 -54.4 10Furniture & Home Furnishings Stores 442 $4,568,035 $16,505,536 -$11,937,501 -56.6 15 Furniture Stores 4421 $2,834,305 $7,309,363 -$4,475,058 -44.1 8 Home Furnishings Stores 4422 $1,733,730 $9,196,174 -$7,462,444 -68.3 7Electronics & Appliance Stores 443 $7,944,679 $1,042,821 $6,901,858 76.8 2Bldg Materials, Garden Equip. & Supply Stores 444 $10,615,425 $16,834,392 -$6,218,967 -22.7 14 Bldg Material & Supplies Dealers 4441 $9,981,083 $15,091,730 -$5,110,647 -20.4 13 Lawn & Garden Equip & Supply Stores 4442 $634,342 $1,742,661 -$1,108,319 -46.6 2Food & Beverage Stores 445 $28,524,503 $46,719,564 -$18,195,061 -24.2 5 Grocery Stores 4451 $25,987,446 $46,202,033 -$20,214,587 -28.0 4 Specialty Food Stores 4452 $1,869,791 $0 $1,869,791 100.0 0 Beer, Wine & Liquor Stores 4453 $667,266 $517,531 $149,735 12.6 1Health & Personal Care Stores 446,4461 $10,228,158 $10,345,370 -$117,212 -0.6 10Gasoline Stations 447,4471 $9,720,203 $0 $9,720,203 100.0 0Clothing & Clothing Accessories Stores 448 $6,067,443 $3,572,809 $2,494,634 25.9 10 Clothing Stores 4481 $4,102,064 $2,603,500 $1,498,564 22.3 8 Shoe Stores 4482 $745,637 $787,635 -$41,998 -2.7 1 Jewelry, Luggage & Leather Goods Stores 4483 $1,219,742 $181,674 $1,038,068 74.1 1Sporting Goods, Hobby, Book & Music Stores 451 $3,887,090 $4,140,862 -$253,772 -3.2 13 Sporting Goods/Hobby/Musical Instr Stores 4511 $3,238,220 $2,937,687 $300,533 4.9 10 Book, Periodical & Music Stores 4512 $648,871 $1,203,175 -$554,304 -29.9 3General Merchandise Stores 452 $31,596,549 $81,862,844 -$50,266,295 -44.3 11 Department Stores Excluding Leased Depts. 4521 $20,671,921 $74,099,988 -$53,428,067 -56.4 5 Other General Merchandise Stores 4529 $10,924,629 $7,762,856 $3,161,773 16.9 6Miscellaneous Store Retailers 453 $7,965,242 $17,830,605 -$9,865,363 -38.2 14 Florists 4531 $197,313 $60,307 $137,006 53.2 1 Office Supplies, Stationery & Gift Stores 4532 $1,259,151 $1,050,220 $208,931 9.0 2 Used Merchandise Stores 4533 $605,981 $2,429,388 -$1,823,407 -60.1 5 Other Miscellaneous Store Retailers 4539 $5,902,797 $14,290,690 -$8,387,893 -41.5 7Nonstore Retailers 454 $2,669,545 $1,837,353 $832,192 18.5 2 Electronic Shopping & Mail-Order Houses 4541 $1,400,231 $569,706 $830,525 42.2 1 Vending Machine Operators 4542 $185,682 $0 $185,682 100.0 0 Direct Selling Establishments 4543 $1,083,632 $1,267,647 -$184,015 -7.8 1Food Services & Drinking Places 722 $15,722,536 $12,027,714 $3,694,822 13.3 27 Special Food Services 7223 $185,537 $0 $185,537 100.0 0 Drinking Places - Alcoholic Beverages 7224 $397,613 $269,172 $128,441 19.3 1 Restaurants/Other Eating Places 7225 $15,139,386 $11,758,542 $3,380,844 13 26
Data Note: Supply (retail sales) estimates sales to consumers by establishments. Sales to businesses are excluded. Demand (retail potential) estimates the expected amount spent by consumers at retail establishments. Supply and demand estimates are in current dollars. The Leakage/Surplus Factor presents a snapshot of retail opportunity. This is a measure of the relationship between supply and demand that ranges from +100 (total leakage) to -100 (total surplus). A positive value represents 'leakage' of retail opportunity outside the trade area. A negative value represents a surplus of retail sales, a market where customers are drawn in from outside the trade area. The Retail Gap represents the difference between Retail Potential and Retail Sales. Esri uses the North American Industry Classification System (NAICS) to classify businesses by their primary type of economic activity. Retail establishments are classified into 27 industry groups in the Retail Trade sector, as well as four industry groups within the Food Services & Drinking Establishments subsector. For more information on the Retail MarketPlace data, please click the link below to view the Methodology Statement.http://www.esri.com/data/esri_data/methodology-statements
Source: Esri and Infogroup. Retail MarketPlace 2016 Release 2. Copyright 2016 Infogroup, Inc. All rights reserved.
April 24, 2017
©2016 Esri Page 3 of 6
Retail MarketPlace Profile1560 Dunlap Rd, Fort Mohave, Arizona, 86426 Prepared by EsriRing: 3 mile radius Latitude: 35.03838
Longitude: -114.59618
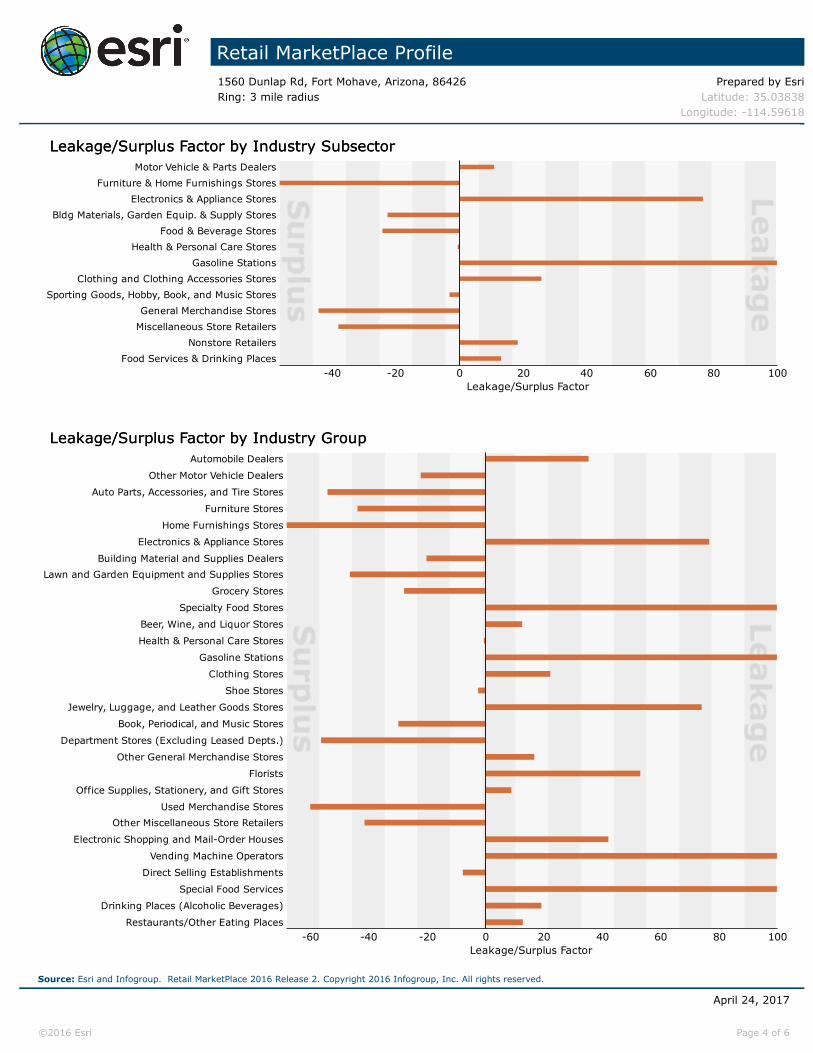
Leakage/Surplus Factor by Industry SubsectorLeakage/Surplus Factor by Industry Subsector
Food Services & Drinking Places Nonstore Retailers
Miscellaneous Store Retailers General Merchandise Stores
Sporting Goods, Hobby, Book, and Music Stores Clothing and Clothing Accessories Stores
Gasoline Stations Health & Personal Care Stores
Food & Beverage Stores Bldg Materials, Garden Equip. & Supply Stores
Electronics & Appliance Stores Furniture & Home Furnishings Stores
Motor Vehicle & Parts Dealers
Leakage/Surplus Factor100806040200-20-40
Leakage/Surplus Factor by Industry GroupLeakage/Surplus Factor by Industry Group
Restaurants/Other Eating Places
Drinking Places (Alcoholic Beverages)
Special Food Services
Direct Selling Establishments
Vending Machine Operators
Electronic Shopping and Mail-Order Houses
Other Miscellaneous Store Retailers Used Merchandise Stores
Office Supplies, Stationery, and Gift Stores
Florists
Other General Merchandise Stores
Department Stores (Excluding Leased Depts.)
Book, Periodical, and Music Stores
Jewelry, Luggage, and Leather Goods Stores
Shoe Stores
Clothing Stores
Gasoline Stations
Health & Personal Care Stores
Beer, Wine, and Liquor Stores
Specialty Food Stores
Grocery Stores
Lawn and Garden Equipment and Supplies Stores Building Material and Supplies Dealers
Electronics & Appliance Stores
Home Furnishings Stores
Furniture Stores
Auto Parts, Accessories, and Tire Stores
Other Motor Vehicle Dealers
Automobile Dealers
Leakage/Surplus Factor100806040200-20-40-60
Source: Esri and Infogroup. Retail MarketPlace 2016 Release 2. Copyright 2016 Infogroup, Inc. All rights reserved.
April 24, 2017
©2016 Esri Page 4 of 6
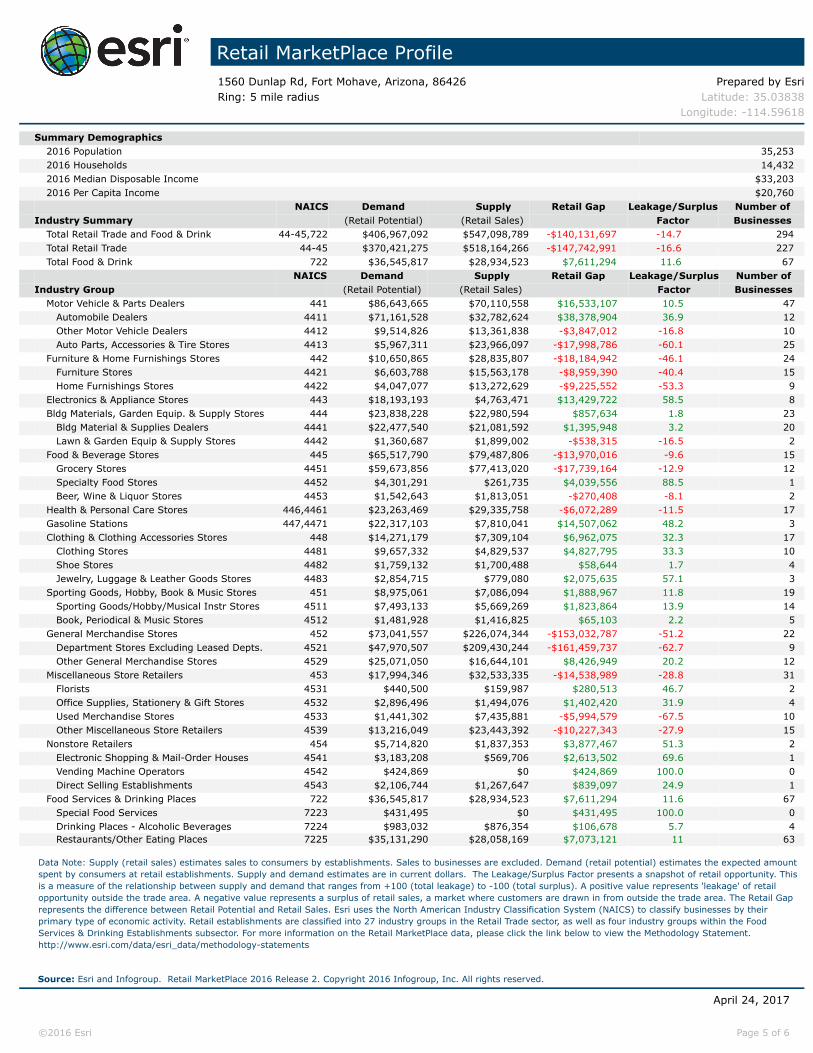
Retail MarketPlace Profile1560 Dunlap Rd, Fort Mohave, Arizona, 86426 Prepared by EsriRing: 5 mile radius Latitude: 35.03838
Longitude: -114.59618
Summary Demographics2016 Population 35,2532016 Households 14,4322016 Median Disposable Income $33,2032016 Per Capita Income $20,760
NAICS Demand Supply Retail Gap Leakage/Surplus Number ofIndustry Summary (Retail Potential) (Retail Sales) Factor Businesses
Total Retail Trade and Food & Drink 44-45,722 $406,967,092 $547,098,789 -$140,131,697 -14.7 294Total Retail Trade 44-45 $370,421,275 $518,164,266 -$147,742,991 -16.6 227Total Food & Drink 722 $36,545,817 $28,934,523 $7,611,294 11.6 67
NAICS Demand Supply Retail Gap Leakage/Surplus Number ofIndustry Group (Retail Potential) (Retail Sales) Factor Businesses
Motor Vehicle & Parts Dealers 441 $86,643,665 $70,110,558 $16,533,107 10.5 47 Automobile Dealers 4411 $71,161,528 $32,782,624 $38,378,904 36.9 12 Other Motor Vehicle Dealers 4412 $9,514,826 $13,361,838 -$3,847,012 -16.8 10 Auto Parts, Accessories & Tire Stores 4413 $5,967,311 $23,966,097 -$17,998,786 -60.1 25Furniture & Home Furnishings Stores 442 $10,650,865 $28,835,807 -$18,184,942 -46.1 24 Furniture Stores 4421 $6,603,788 $15,563,178 -$8,959,390 -40.4 15 Home Furnishings Stores 4422 $4,047,077 $13,272,629 -$9,225,552 -53.3 9Electronics & Appliance Stores 443 $18,193,193 $4,763,471 $13,429,722 58.5 8Bldg Materials, Garden Equip. & Supply Stores 444 $23,838,228 $22,980,594 $857,634 1.8 23 Bldg Material & Supplies Dealers 4441 $22,477,540 $21,081,592 $1,395,948 3.2 20 Lawn & Garden Equip & Supply Stores 4442 $1,360,687 $1,899,002 -$538,315 -16.5 2Food & Beverage Stores 445 $65,517,790 $79,487,806 -$13,970,016 -9.6 15 Grocery Stores 4451 $59,673,856 $77,413,020 -$17,739,164 -12.9 12 Specialty Food Stores 4452 $4,301,291 $261,735 $4,039,556 88.5 1 Beer, Wine & Liquor Stores 4453 $1,542,643 $1,813,051 -$270,408 -8.1 2Health & Personal Care Stores 446,4461 $23,263,469 $29,335,758 -$6,072,289 -11.5 17Gasoline Stations 447,4471 $22,317,103 $7,810,041 $14,507,062 48.2 3Clothing & Clothing Accessories Stores 448 $14,271,179 $7,309,104 $6,962,075 32.3 17 Clothing Stores 4481 $9,657,332 $4,829,537 $4,827,795 33.3 10 Shoe Stores 4482 $1,759,132 $1,700,488 $58,644 1.7 4 Jewelry, Luggage & Leather Goods Stores 4483 $2,854,715 $779,080 $2,075,635 57.1 3Sporting Goods, Hobby, Book & Music Stores 451 $8,975,061 $7,086,094 $1,888,967 11.8 19 Sporting Goods/Hobby/Musical Instr Stores 4511 $7,493,133 $5,669,269 $1,823,864 13.9 14 Book, Periodical & Music Stores 4512 $1,481,928 $1,416,825 $65,103 2.2 5General Merchandise Stores 452 $73,041,557 $226,074,344 -$153,032,787 -51.2 22 Department Stores Excluding Leased Depts. 4521 $47,970,507 $209,430,244 -$161,459,737 -62.7 9 Other General Merchandise Stores 4529 $25,071,050 $16,644,101 $8,426,949 20.2 12Miscellaneous Store Retailers 453 $17,994,346 $32,533,335 -$14,538,989 -28.8 31 Florists 4531 $440,500 $159,987 $280,513 46.7 2 Office Supplies, Stationery & Gift Stores 4532 $2,896,496 $1,494,076 $1,402,420 31.9 4 Used Merchandise Stores 4533 $1,441,302 $7,435,881 -$5,994,579 -67.5 10 Other Miscellaneous Store Retailers 4539 $13,216,049 $23,443,392 -$10,227,343 -27.9 15Nonstore Retailers 454 $5,714,820 $1,837,353 $3,877,467 51.3 2 Electronic Shopping & Mail-Order Houses 4541 $3,183,208 $569,706 $2,613,502 69.6 1 Vending Machine Operators 4542 $424,869 $0 $424,869 100.0 0 Direct Selling Establishments 4543 $2,106,744 $1,267,647 $839,097 24.9 1Food Services & Drinking Places 722 $36,545,817 $28,934,523 $7,611,294 11.6 67 Special Food Services 7223 $431,495 $0 $431,495 100.0 0 Drinking Places - Alcoholic Beverages 7224 $983,032 $876,354 $106,678 5.7 4 Restaurants/Other Eating Places 7225 $35,131,290 $28,058,169 $7,073,121 11 63
Data Note: Supply (retail sales) estimates sales to consumers by establishments. Sales to businesses are excluded. Demand (retail potential) estimates the expected amount spent by consumers at retail establishments. Supply and demand estimates are in current dollars. The Leakage/Surplus Factor presents a snapshot of retail opportunity. This is a measure of the relationship between supply and demand that ranges from +100 (total leakage) to -100 (total surplus). A positive value represents 'leakage' of retail opportunity outside the trade area. A negative value represents a surplus of retail sales, a market where customers are drawn in from outside the trade area. The Retail Gap represents the difference between Retail Potential and Retail Sales. Esri uses the North American Industry Classification System (NAICS) to classify businesses by their primary type of economic activity. Retail establishments are classified into 27 industry groups in the Retail Trade sector, as well as four industry groups within the Food Services & Drinking Establishments subsector. For more information on the Retail MarketPlace data, please click the link below to view the Methodology Statement.http://www.esri.com/data/esri_data/methodology-statements
Source: Esri and Infogroup. Retail MarketPlace 2016 Release 2. Copyright 2016 Infogroup, Inc. All rights reserved.
April 24, 2017
©2016 Esri Page 5 of 6
Retail MarketPlace Profile1560 Dunlap Rd, Fort Mohave, Arizona, 86426 Prepared by EsriRing: 5 mile radius Latitude: 35.03838
Longitude: -114.59618
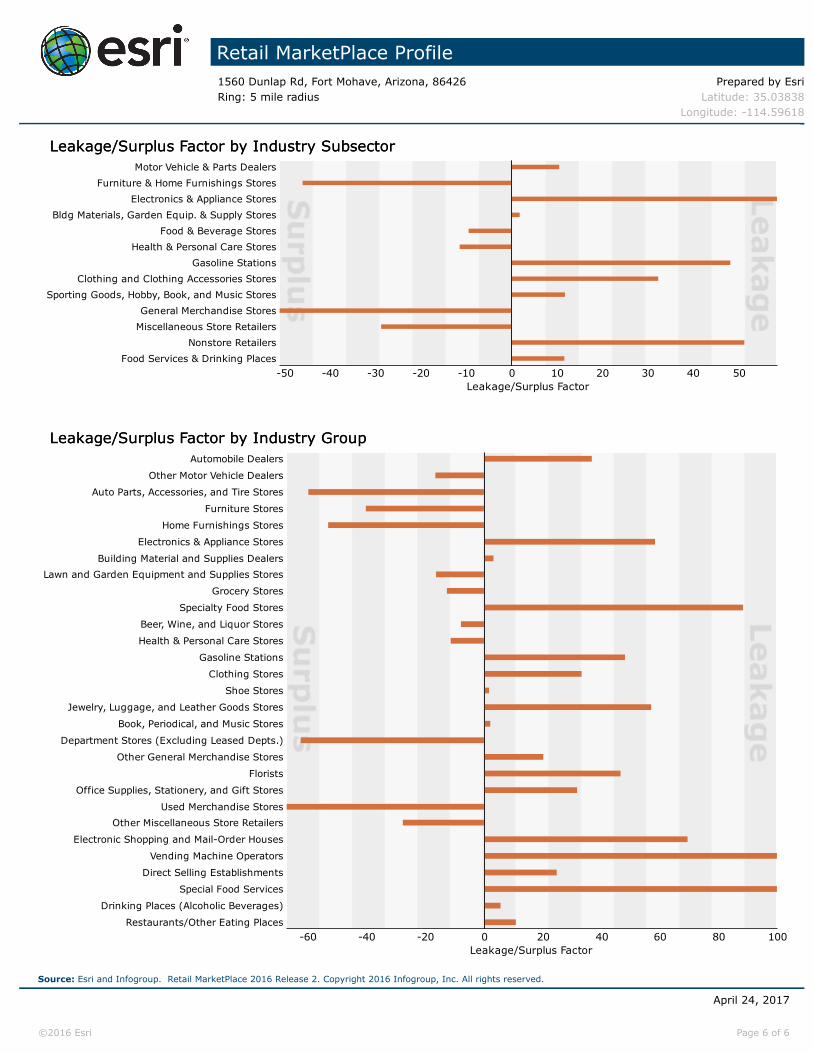
Leakage/Surplus Factor by Industry SubsectorLeakage/Surplus Factor by Industry Subsector
Food Services & Drinking Places Nonstore Retailers
Miscellaneous Store Retailers General Merchandise Stores
Sporting Goods, Hobby, Book, and Music Stores Clothing and Clothing Accessories Stores
Gasoline Stations Health & Personal Care Stores
Food & Beverage Stores Bldg Materials, Garden Equip. & Supply Stores
Electronics & Appliance Stores Furniture & Home Furnishings Stores
Motor Vehicle & Parts Dealers
Leakage/Surplus Factor50403020100-10-20-30-40-50
Leakage/Surplus Factor by Industry GroupLeakage/Surplus Factor by Industry Group
Restaurants/Other Eating Places
Drinking Places (Alcoholic Beverages)
Special Food Services
Direct Selling Establishments
Vending Machine Operators
Electronic Shopping and Mail-Order Houses
Other Miscellaneous Store Retailers Used Merchandise Stores
Office Supplies, Stationery, and Gift Stores
Florists
Other General Merchandise Stores
Department Stores (Excluding Leased Depts.)
Book, Periodical, and Music Stores
Jewelry, Luggage, and Leather Goods Stores
Shoe Stores
Clothing Stores
Gasoline Stations
Health & Personal Care Stores
Beer, Wine, and Liquor Stores
Specialty Food Stores
Grocery Stores
Lawn and Garden Equipment and Supplies Stores Building Material and Supplies Dealers
Electronics & Appliance Stores
Home Furnishings Stores
Furniture Stores
Auto Parts, Accessories, and Tire Stores
Other Motor Vehicle Dealers
Automobile Dealers
Leakage/Surplus Factor100806040200-20-40-60
Source: Esri and Infogroup. Retail MarketPlace 2016 Release 2. Copyright 2016 Infogroup, Inc. All rights reserved.
April 24, 2017
©2016 Esri Page 6 of 6
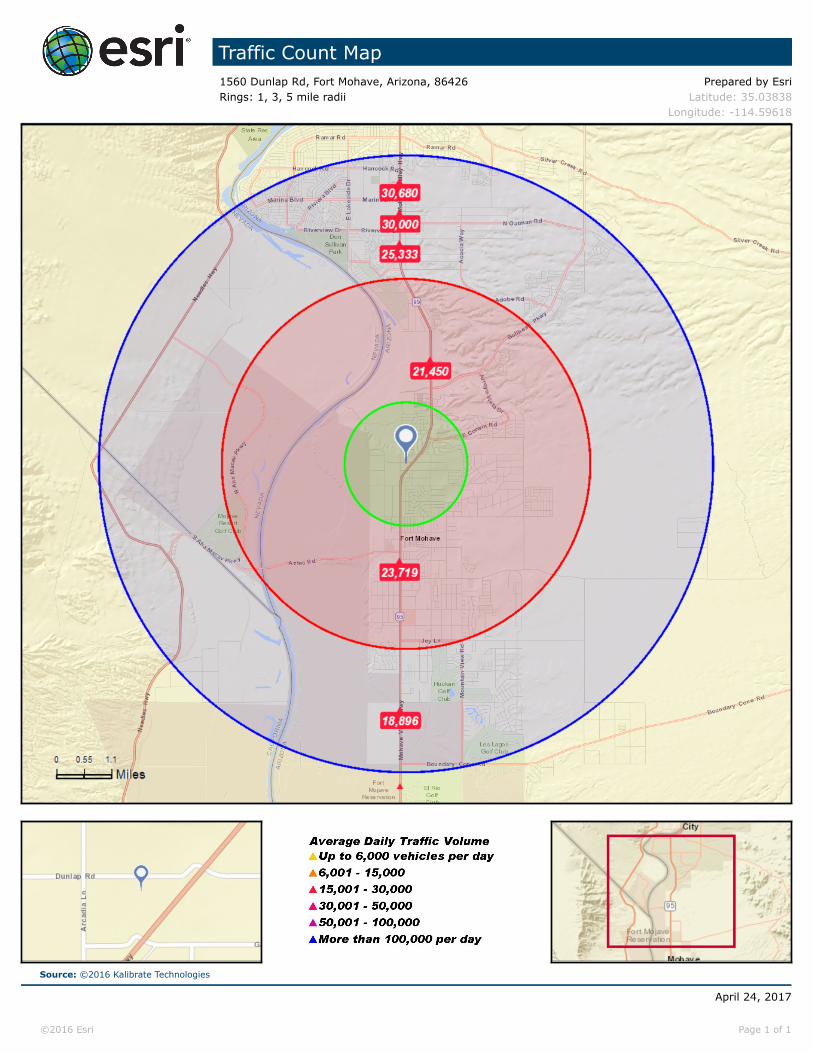
Traffic Count Map1560 Dunlap Rd, Fort Mohave, Arizona, 86426 Prepared by EsriRings: 1, 3, 5 mile radii Latitude: 35.03838
Longitude: -114.59618
Source: ©2016 Kalibrate Technologies
April 24, 2017
©2016 Esri Page 1 of 1