Embed Size (px)
Citation preview

CDE Improvement Planning Template for Schools (Version 7.0 – Template Last Updated: June 9, 2015)
Colorado’s Unified Improvement Plan for Schools for 2015-16
Organization Code: 0880 District Name: DENVER COUNTY 1 School Code: 8242 School Name: STEELE ELEMENTARY SCHOOL Official 2014 SPF: 3 Year
Section I: Summary Information about the School
Directions: This section provides an overview of the school’s improvement plan. To complete this section, copy and paste the school’s Priority Performance Challenges, Root Causes and Major Improvement Strategies from Section III and IV of the 2015-16 UIP once it has been completed. In the UIP online system, this section will populate automatically as the UIP is written.
Executive Summary
How are students performing? Where will school staff be focusing attention?
Priority Performance Challenges: Specific statements about the school’s performance challenges (not budgeting, staffing, curriculum, instruction, etc.), with at least one priority identified for each performance indicator (achievement, growth, growth gaps, PWR) where the school did not meet federal, state and/or local expectations.
31.4% of all students are not meeting/exceeding expectations on CMAS ELA.
The difference in performance between students identified as FRL and students identified as Paid Lunch was 33% on CMAS ELA.
27% of students who were identified as SBGL moved to Below Grade Level or Above. This is below the district average of 35%.
Why is the school continuing to have these problems?
Root Causes: Statements describing the deepest underlying cause, or causes, of the performance challenges, that, if dissolved, would result in elimination, or substantial reduction of the performance challenges.
Teachers are continuing to develop capacity to implement the CCSS ELA standards and assessments.
We have not provided our students with consistent school-wide instruction in regards to foundational reading skills.
What action is the school taking to eliminate these challenges?
Major Improvement Strategies: An overall approach that describes a series of related actions intended to result in improvements in performance.
We will provide students with structured reading instruction that develops foundational reading skills, while focusing on providing students with strategies to increase their comprehension and ability to read increasingly difficult texts.
Access School Performance Frameworks here: http://www.cde.state.co.us/schoolview/performance
School Code: 8242 School Name: STEELE ELEMENTARY SCHOOL
CDE Improvement Planning Template for Schools (Version 7.0 – Template Last Updated: June 9, 2015) 2
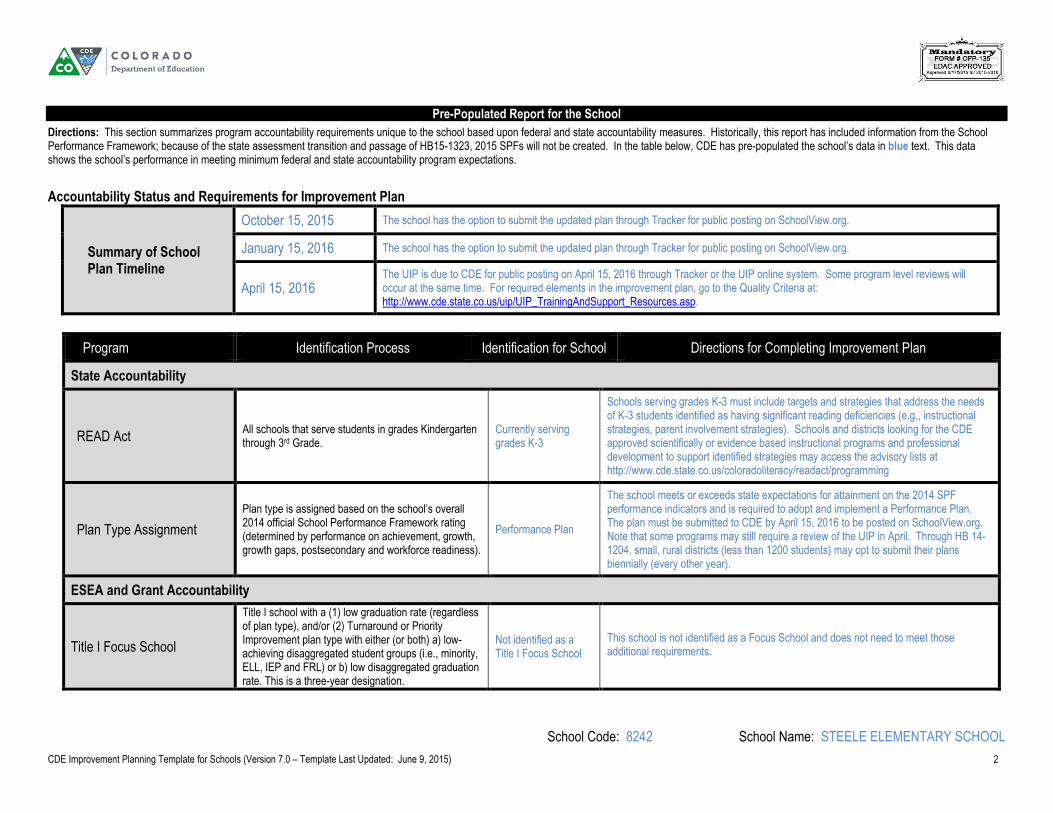
Pre-Populated Report for the School
Directions: This section summarizes program accountability requirements unique to the school based upon federal and state accountability measures. Historically, this report has included information from the School Performance Framework; because of the state assessment transition and passage of HB15-1323, 2015 SPFs will not be created. In the table below, CDE has pre-populated the school’s data in blue text. This data shows the school’s performance in meeting minimum federal and state accountability program expectations.
Accountability Status and Requirements for Improvement Plan
Summary of School Plan Timeline
October 15, 2015 The school has the option to submit the updated plan through Tracker for public posting on SchoolView.org.
January 15, 2016 The school has the option to submit the updated plan through Tracker for public posting on SchoolView.org.
April 15, 2016
The UIP is due to CDE for public posting on April 15, 2016 through Tracker or the UIP online system. Some program level reviews will occur at the same time. For required elements in the improvement plan, go to the Quality Criteria at: http://www.cde.state.co.us/uip/UIP_TrainingAndSupport_Resources.asp.
Program Identification Process Identification for School Directions for Completing Improvement Plan
State Accountability
READ Act All schools that serve students in grades Kindergarten through 3rd Grade.
Currently serving grades K-3
Schools serving grades K-3 must include targets and strategies that address the needs of K-3 students identified as having significant reading deficiencies (e.g., instructional strategies, parent involvement strategies). Schools and districts looking for the CDE approved scientifically or evidence based instructional programs and professional development to support identified strategies may access the advisory lists at http://www.cde.state.co.us/coloradoliteracy/readact/programming
Plan Type Assignment
Plan type is assigned based on the school’s overall 2014 official School Performance Framework rating (determined by performance on achievement, growth, growth gaps, postsecondary and workforce readiness).
Performance Plan
The school meets or exceeds state expectations for attainment on the 2014 SPF performance indicators and is required to adopt and implement a Performance Plan. The plan must be submitted to CDE by April 15, 2016 to be posted on SchoolView.org. Note that some programs may still require a review of the UIP in April. Through HB 14-1204, small, rural districts (less than 1200 students) may opt to submit their plans biennially (every other year).
ESEA and Grant Accountability
Title I Focus School
Title I school with a (1) low graduation rate (regardless of plan type), and/or (2) Turnaround or Priority Improvement plan type with either (or both) a) low-achieving disaggregated student groups (i.e., minority, ELL, IEP and FRL) or b) low disaggregated graduation rate. This is a three-year designation.
Not identified as a Title I Focus School
This school is not identified as a Focus School and does not need to meet those additional requirements.

School Code: 8242 School Name: STEELE ELEMENTARY SCHOOL
CDE Improvement Planning Template for Schools (Version 7.0 – Template Last Updated: June 9, 2015) 3
Tiered Intervention Grant (TIG)
Competitive grant (1003g) for schools identified as 5% of lowest performing Title I or Title I eligible schools, eligible to implement one of four reform models as defined by the USDE.
Not awarded a TIG Grant
This school does not receive a current TIG award and does not need to meet those additional requirements.
Diagnostic Review and Planning Grant
Title I competitive grant that includes a diagnostic review and/or improvement planning support.
Not awarded a current Diagnostic Review and Planning Grant
This school has not received a current Diagnostic Review and Planning grant and does not need to meet those additional requirements.
School Improvement Support (SIS) Grant
Title I competitive grant that supports implementation of major improvement strategies and action steps identified in the school’s action plan.
Not a current SIS Grantee
This school has not received a current SIS grant and does not need to meet those additional requirements.
Colorado Graduation Pathways Program (CGP)
The program supports the development of sustainable, replicable models for dropout prevention and recovery that improve interim indicators (attendance, behavior and course completion), reduce the dropout rate and increase the graduation rate for all students participating in the program.
Not a CGP Funded School
This school does not receive funding from the CGP Program and does not need to meet these additional program requirements.

School Code: 8242 School Name: STEELE ELEMENTARY SCHOOL
CDE Improvement Planning Template for Schools (Version 7.0 – Template Last Updated: June 9, 2015) 4
Section II: Improvement Plan Information
Additional Information about the School
Comprehensive Review and Selected Grant History
Related Grant Awards Has the school received a grant that supports the school’s improvement efforts? When was the grant awarded?
External Evaluator
Has the school partnered with an external evaluator to provide comprehensive evaluation? Indicate the year and the name of the provider/tool used.
Improvement Plan Information
The school is submitting this improvement plan to satisfy requirements for (check all that apply):
State Accreditation Title I Focus School Tiered Intervention Grant (TIG) Diagnostic Review and Planning Grant
School Improvement Support Grant READ Act Requirements Other:
___________________________________________________
School Contact Information (Additional contacts may be added, if needed)
1 Name and Title Kevin Greeley Principal
Email [email protected]
Phone 720-424-3723
Mailing Address 320 S.Marion PKWY Denver Colorado 80209
2 Name and Title
Phone
Mailing Address
School Code: 8242 School Name: STEELE ELEMENTARY SCHOOL
CDE Improvement Planning Template for Schools (Version 7.0 – Template Last Updated: June 9, 2015) 5
Section III: Narrative on Data Analysis and Root Cause Identification
This section corresponds with the “Evaluate” portion of the continuous improvement cycle. The main outcome is to construct a narrative that describes the process and results of the analysis of the data for your school. The analysis should justify the performance targets and actions proposed in Section IV. Two worksheets have been provided to help organize your data analysis for your narrative. This analysis section includes: identifying where the school did not at least meet minimum state and federal accountability expectations; describing progress toward targets for the prior school year; describing what performance data were used in the analysis of trends; identifying trends and priority performance challenges (negative trends); describing how performance challenges were prioritized; identifying the root causes of performance challenges; describing how the root causes were identified and verified and what data were used; and describing stakeholder involvement in the analysis. Additional guidance on how to engage in the data analysis process is provided in Unified Improvement Planning Handbook.
Implications of Colorado Measures of Academic Success (CMAS) on Data Analysis: During the 2014-15 school year, Colorado transitioned from reading, writing and math TCAP assessments to CMAS PARCC English language arts and math assessments. These assessments measure related, but different content standards and are expected to have different proficiency levels. As a result, updating the data analysis this year (particularly the trend statements) may be more challenging. While the school’s data analysis is still expected to be updated, some modifications in typical practice may be needed. Refer to the UIP state assessment transition guidance document on the UIP website for options and considerations.
Data Narrative for School Directions: In the narrative, describe the process and results of the data analysis for the school, including (1) a description of the school and the process for data analysis, (2) a review of current performance, (3) trend analysis, (4) priority performance challenges and (5) root cause analysis. A description of the expected narrative sections are included below. The narrative should not take more than five pages. Two worksheets (#1 Progress Monitoring of Prior Year’s Performance Targets and #2 Data Analysis) have been provided to organize the data referenced in the narrative.
Description of School Setting and Process for Data Analysis: Provide a very brief description of the school to set the context for readers (e.g., demographics). Include the general process for developing the UIP and participants (e.g., School Accountability Committee).
Review Current Performance: Review recent state and local data. Document any areas where the school did not at least meet state/federal expectations. Consider the previous year’s progress toward the school’s targets. Identify the overall magnitude of the school’s performance challenges.
Trend Analysis: Provide a description of the trend analysis that includes at least three years of data (state and local data), if available. Trend statements should be provided in the four performance indicator areas and by disaggregated groups. Trend statements should include the direction of the trend and a comparison (e.g., state expectations, state average) to indicate why the trend is notable.
Priority Performance Challenges: Identify notable trends (or a combination of trends) that are the highest priority to address (priority performance challenges). No more than 3-5 are recommended. Provide a rationale for why these challenges have been selected and address the magnitude of the school’s overall performance challenges.
Root Cause Analysis: Identify at least one root cause for every priority performance challenge. Root causes should address adult actions, be under the control of the school, and address the priority performance challenge(s). Provide evidence that the root cause was verified through the use of additional data. A description of the selection process for the corresponding major improvement strategy(s) is encouraged.
Steele Elementary is located in the Washington Park Neighborhood. Steele Elementary is unique in its partnership with Stanley British Primary School’s teacher education program. Thirteen classrooms have an intern who is working to receive their teaching license through course work and their intern work. To ensure equity, all other classrooms have a paraprofessional to support the education programming. Steele has a highly involved parent community that supports Steele Elementary both financially and through volunteering. The Collaborative School Committee (CSC) and PTA work together to help improve and support our instructional program. The CSC and School Leadership Team were the main participants in the UIP process.
School Code: 8242 School Name: STEELE ELEMENTARY SCHOOL
CDE Improvement Planning Template for Schools (Version 7.0 – Template Last Updated: June 9, 2015) 6
Steele’s enrollment for the 2014-15 school year is 477 students, kindergarten through fifth grade. 4% of our students are English Language Learners, 14% receive free and reduced lunch, 7% receive Special Education support and 13% belong to a minority group.
Current Performance/Trend Analysis:
Literacy:
The percentage of students who Met or Exceeded Expectations on CMAS ELA was 69.6% in 3rd grade, 63.9% in 4th grade, and 73.4% in 5th grade. Overall, 68.6% of students in grades 3 through 5 Met or Exceeded Expectations. All grade levels were above the district averages. 40.0% of students identified as receiving Free/Reduced Lunch Met or Exceeded Expectations on CMAS ELA which was above the district average of 21.8%. 73.0% of students who identified as Paid Lunch Met or Exceeded Expectations on CMAS ELA.
72.3% of White students Met or Exceeded Expectations on CMAS ELA. 37.5% of Students of Color Met or Exceeded Expectations on CMAS ELA. Both groups were above the district averages.
96.2% of students identified as Gifted/Talented Met or Exceeded Expectations on CMAS ELA. 60.3% of students who are not identified as Gifted/Talented Met or Exceeded Expectations on CMAS ELA. Both groups were above the district averages
Math:
The percentage of students who Met or Exceeded Expectations on CMAS Math was 75.9% in 3rd grade, 60.2% in 4th grade, and 64.1% in 5th grade. Overall, 66.8% of students in grades 3 through 5 Met or Exceeded Expectations. All grade levels were above the district averages. 30.0% of students identified as receiving Free/Reduced Lunch Met or Exceeded Expectations on CMAS Math which was slightly above the district average of 14.8%. 72.4% of students who identified as Paid Lunch Met or Exceeded Expectations on CMAS Math.
70.3% of White students Met or Exceeded Expectations on CMAS Math. 37.5% of Students of Color Met or Exceeded Expectations on CMAS ELA. Both groups were above the district averages.
96.2% of students identified as Gifted/Talented Met or Exceeded Expectations on CMAS Math. 58.0% of students who are not identified as Gifted/Talented Met or Exceeded Expectations on CMAS Math. Both groups were above the district averages.
READ Act:
The percentage of students in grades Kindergarten through 3rd grade reading At or Above Grade Level increased from 74% in 2014 to 84% in 2015. Both years were significantly above the district averages of 62% in 2014 and 64% in 2015.
9% of students identified as being Significantly Below Grade Level based on Fall 2014 data moved to At/Above Grade Level in Spring 2015. This was slightly below the district average of 10%.
27% of students identified as being Significantly Below Grade Level based on Fall 2014 data moved to Below Grade Level or Above in Spring 2015. This was below the district average of 35%.

School Code: 8242 School Name: STEELE ELEMENTARY SCHOOL
CDE Improvement Planning Template for Schools (Version 7.0 – Template Last Updated: June 9, 2015) 7
Science:
The percentage of students performing at Strong and Distinguished on CMAS Science increased from 44% in 2014 to 57% in 2015. Both years were significantly above the district averages of 19% in 2014 and 22% in 2015.
ACCESS:
The MGP for ACCESS increased from 74 in 2013 to 84 in 2014 followed by a decrease to 65.5 in 2015.
Priority Performance Challenges:
31.4% of all students are not meeting/exceeding expectations on CMAS ELA.
The difference in performance between students identified as FRL and students identified as Paid Lunch was 33% on CMAS ELA.
27% of students who were identified as SBGL moved to Below Grade Level or Above. This is below the district average of 35%.
Root Cause Analysis:
Teachers are continuing to develop capacity to implement the CCSS ELA standards and assessments.
We have not provided our students with consistent school-wide instruction in regards to foundational reading skills.

School Code: 8242 School Name: STEELE ELEMENTARY SCHOOL
CDE Improvement Planning Template for Schools (Version 7.0 – Template Last Updated: June 9, 2015) 8
Worksheet #1: Progress Monitoring of Prior Year’s Performance Targets Directions: This chart supports analysis of progress made towards performance targets set for the 2014-15 school year (last year’s plan). While this worksheet should be included in your UIP, the main intent is to record your school’s reflections to help build your data narrative.
Performance Indicators Targets for 2014-15 school year
(Targets set in last year’s plan)
Performance in 2014-15? Was the target met? How close was the school to meeting
the target?
Brief reflection on why previous targets were met or not met.
Academic Achievement (Status)
We achieved one of our goals and missed the other by 1 percentage point. Our focus on Guided Reading helped support students with the specific skills that they needed in order to grow.
Academic Growth
Academic Growth Gaps
The percentage of Minority students scoring proficient/advanced on the DPS interim will be 75% or greater
The target was exceeded; 79% of our minority students scored proficient on the spring literacy assessment
The percentage of FRL students scoring proficient/advanced on DPS Literacy Exam will be 75% or greater
The target was not met; 74% of our FRL students scored proficient on the spring literacy assessment. We missed our goal by one percentage point
Postsecondary & Workforce Readiness

School Code: 8242 School Name: STEELE ELEMENTARY SCHOOL
CDE Improvement Planning Template for Schools (Version 7.0 – Template Last Updated: June 9, 2015) 9
Worksheet #2: Data Analysis Directions: This chart supports planning teams in recording and organizing observations about school-level data in preparation for writing the required data narrative. Planning teams should describe positive and negative trends for all of the four performance indicators using at least three years of data, when available, and then prioritize the performance challenges (based on notable trends) that the school will focus its efforts on improving. The root cause analysis and improvement planning efforts in the remainder of the plan should be aimed at addressing the identified priority performance challenge(s). A limited number of priority performance challenges is recommended (no more than 3-5); a performance challenge may apply to multiple performance indicators. At a minimum, priority performance challenges must be identified in any of the four performance indicator areas where minimum state and federal expectations were not met for accountability purposes. In most cases, this should just be an update to the plan from 2014 since the SPF has not changed for 2015. Finally, provide a brief description of the root cause analysis for any priority performance challenges. Root causes may apply to multiple priority performance challenges. You may add rows, as needed.
Performance Indicators Description of Notable Trends
(3 years of past state and local data) Priority Performance
Challenges Root Causes
Academic Achievement (Status)
The percentage of students who Met or Exceeded Expectations on CMAS ELA was 69.6% in 3rd grade, 63.9% in 4th grade, and 73.4% in 5th grade. Overall, 68.6% of students in grades 3 through 5 Met or Exceeded Expectations. All
31.4% of all students are not meeting/exceeding expectations on CMAS ELA.
Teachers are continuing to develop capacity to implement the CCSS ELA standards and assessments.
School Code: 8242 School Name: STEELE ELEMENTARY SCHOOL
CDE Improvement Planning Template for Schools (Version 7.0 – Template Last Updated: June 9, 2015) 10
Performance Indicators Description of Notable Trends
(3 years of past state and local data) Priority Performance
Challenges Root Causes
grade levels were above the district averages.
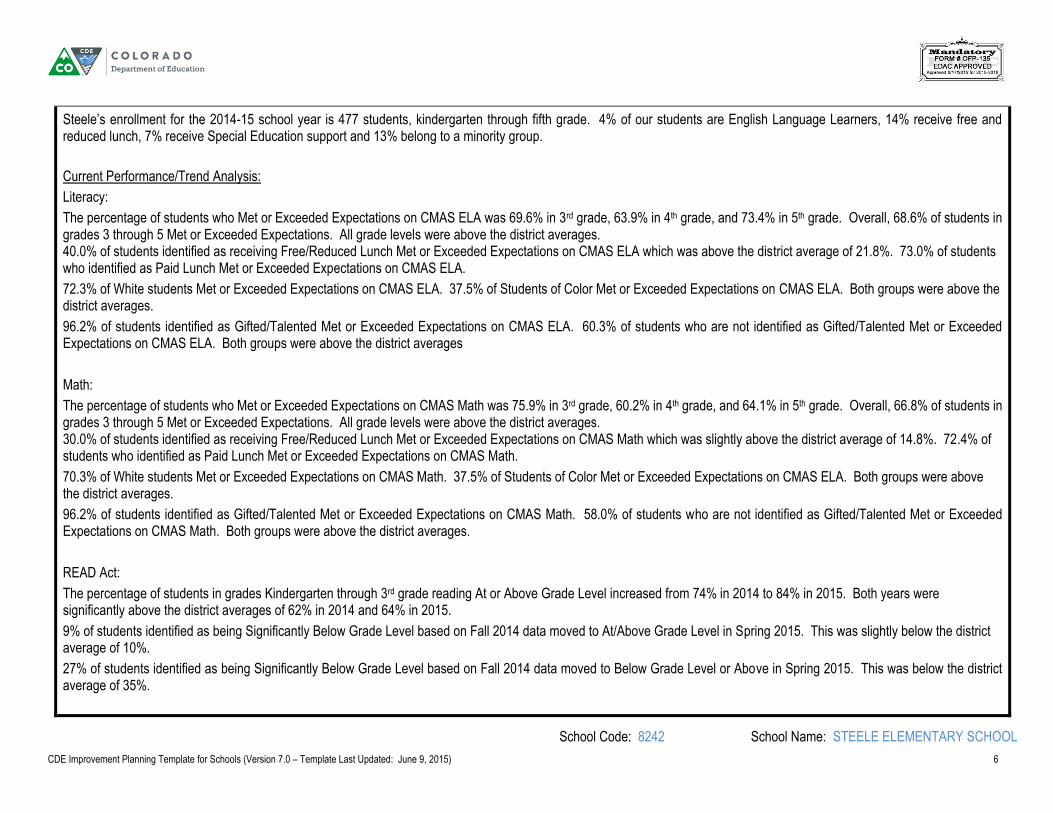
40.0% of students identified as receiving Free/Reduced Lunch Met or Exceeded Expectations on CMAS ELA which was above the district average of 21.8%. 73.0% of students who identified as Paid Lunch Met or Exceeded Expectations on CMAS ELA.
The difference in performance between students identified as FRL and students identified as Paid Lunch was 33% on CMAS ELA.
Teachers are continuing to develop capacity to implement the CCSS ELA standards and assessments.
72.3% of White students Met or Exceeded Expectations on CMAS ELA. 37.5% of Students of Color Met or Exceeded Expectations on CMAS ELA. Both groups were above the district averages.
School Code: 8242 School Name: STEELE ELEMENTARY SCHOOL
CDE Improvement Planning Template for Schools (Version 7.0 – Template Last Updated: June 9, 2015) 11
Performance Indicators Description of Notable Trends
(3 years of past state and local data) Priority Performance
Challenges Root Causes
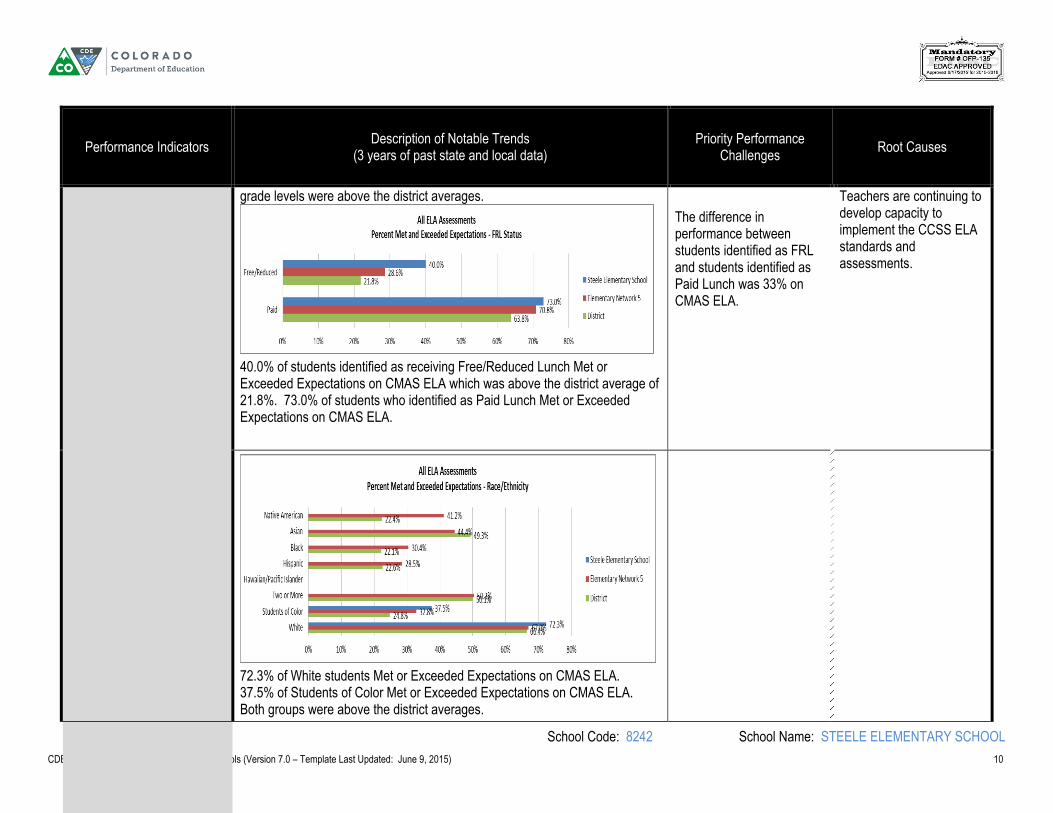
96.2% of students identified as Gifted/Talented Met or Exceeded Expectations on CMAS ELA. 60.3% of students who are not identified as Gifted/Talented Met or Exceeded Expectations on CMAS ELA. Both groups were above the district averages
The percentage of students who Met or Exceeded Expectations on CMAS Math was 75.9% in 3rd grade, 60.2% in 4th grade, and 64.1% in 5th grade. Overall, 66.8% of students in grades 3 through 5 Met or Exceeded Expectations. All grade levels were above the district averages.

School Code: 8242 School Name: STEELE ELEMENTARY SCHOOL
CDE Improvement Planning Template for Schools (Version 7.0 – Template Last Updated: June 9, 2015) 12
Performance Indicators Description of Notable Trends
(3 years of past state and local data) Priority Performance
Challenges Root Causes
30.0% of students identified as receiving Free/Reduced Lunch Met or Exceeded Expectations on CMAS Math which was slightly above the district average of 14.8%. 72.4% of students who identified as Paid Lunch Met or Exceeded Expectations on CMAS Math.
70.3% of White students Met or Exceeded Expectations on CMAS Math. 37.5% of Students of Color Met or Exceeded Expectations on CMAS ELA. Both groups were above the district averages.

School Code: 8242 School Name: STEELE ELEMENTARY SCHOOL
CDE Improvement Planning Template for Schools (Version 7.0 – Template Last Updated: June 9, 2015) 13
Performance Indicators Description of Notable Trends
(3 years of past state and local data) Priority Performance
Challenges Root Causes
96.2% of students identified as Gifted/Talented Met or Exceeded Expectations on CMAS Math. 58.0% of students who are not identified as Gifted/Talented Met or Exceeded Expectations on CMAS Math. Both groups were above the district averages.
The percentage of students in grades Kindergarten through 3rd grade reading At or Above Grade Level increased from 74% in 2014 to 84% in 2015. Both years were significantly above the district averages of 62% in 2014 and 64% in 2015.

School Code: 8242 School Name: STEELE ELEMENTARY SCHOOL
CDE Improvement Planning Template for Schools (Version 7.0 – Template Last Updated: June 9, 2015) 14
Performance Indicators Description of Notable Trends
(3 years of past state and local data) Priority Performance
Challenges Root Causes
9% of students identified as being Significantly Below Grade Level based on Fall 2014 data moved to At/Above Grade Level in Spring 2015. This was slightly below the district average of 10%.
27% of students identified as being Significantly Below Grade Level based on Fall 2014 data moved to Below Grade Level or Above in Spring 2015. This was below the district average of 35%.
27% of students who were identified as SBGL moved to Below Grade Level or Above. This is below the district average of 35%.
We have not provided our students with consistent school-wide instruction in regards to foundational reading skills.

School Code: 8242 School Name: STEELE ELEMENTARY SCHOOL
CDE Improvement Planning Template for Schools (Version 7.0 – Template Last Updated: June 9, 2015) 15
Performance Indicators Description of Notable Trends
(3 years of past state and local data) Priority Performance
Challenges Root Causes
The percentage of students performing at Strong and Distinguished on CMAS Science increased from 44% in 2014 to 57% in 2015. Both years were significantly above the district averages of 19% in 2014 and 22% in 2015.

School Code: 8242 School Name: STEELE ELEMENTARY SCHOOL
CDE Improvement Planning Template for Schools (Version 7.0 – Template Last Updated: June 9, 2015) 16
Performance Indicators Description of Notable Trends
(3 years of past state and local data) Priority Performance
Challenges Root Causes
Academic Growth
The MGP for ACCESS increased from 74 in 2013 to 84 in 2014 followed by a decrease to 65.5 in 2015.
Academic Growth Gaps
Postsecondary & Workforce Readiness
School Code: 8242 School Name: STEELE ELEMENTARY SCHOOL
CDE Improvement Planning Template for Schools (Version 7.0 – Template Last Updated: June 9, 2015) 17
Section IV: Action Plan(s)
This section addresses the “Plan” portion of the continuous improvement cycle. First, identify annual performance targets and the interim measures. This will be documented in the required School Target Setting Form on the next page. Then move into action planning, which should be captured in the Action Planning Form.
School Target Setting Form Directions: Complete the worksheet below. Schools are expected to set their own annual targets for the performance indicators (i.e. academic achievement, academic growth, academic growth gaps, and postsecondary and workforce readiness). At a minimum, schools should set targets for each of the performance indicators where state expectations were not met; targets should also be connected to prioritized performance challenges identified in the data narrative (section III). Consider last year’s targets (see Worksheet #1) and whether adjustments need to be made. For each annual performance target, identify interim measures that will be used to monitor progress toward the annual targets at least quarterly during the school year. Implications of Colorado Measures of Academic Success (CMAS) on Target Setting: During the 2014-15 school year, Colorado transitioned from reading, writing and math TCAP assessments to CMAS PARCC English language arts and math assessments. These assessments measure related, but different content standards and are expected to have different proficiency levels. As a result, setting targets based on the percent of students scoring proficient and advanced on TCAP is not appropriate. Furthermore, CDE does not yet know if student growth percentiles and median student growth percentiles will be available for accountability, planning or reporting use. It is known that adequate growth percentiles will not be available this school year for 2014-15 results. Target setting is still expected to occur in the UIP process during this transition period. However, some modifications in typical practice may be needed. Refer to the UIP state assessment transition guidance document on the UIP website for options and considerations.

School Code: 8242 School Name: STEELE ELEMENTARY SCHOOL
CDE Improvement Planning Template for Schools (Version 7.0 – Template Last Updated: June 9, 2015) 18
School Target Setting Form
Performance Indicators Measures/ Metrics
Priority Performance Challenges
Annual Performance Targets Interim Measures for
2015-16 Major Improvement
Strategy 2015-16 2016-17
Academic Achievement
(Status)
CMAS/PARCC, CoAlt, K-3 literacy measure (READ Act), local measures
ELA
31.4% of all students are not meeting/ exceeding expectations on CMAS ELA.
The difference in performance between students identified as FRL and students identified as Paid Lunch was 33% on CMAS ELA.
The percentage of students who Meet/Exceed Expectations on CMAS ELA will increase from 68.6% to 72% or higher.
The percentage of students identified as FRL who Meet/Exceed Expectations on CMAS ELA will increase from 40% to 45%.
The percentage of students who Meet/Exceed Expectations on CMAS ELA will increase from 72% or higher to 75% or higher.
The percentage of students identified as FRL who Meet/Exceed Expectations on CMAS ELA will increase from 45% to 50%.
ANet, EL Unit Tests, DRA progress monitoring
We will provide students with structured reading instruction that develops foundational reading skills, while focusing on providing students with strategies to increase their comprehension and ability to read increasingly difficult texts.
READ
27% of students who were identified as SBGL moved to Below Grade Level or Above. This is below the district average of 35%.
The percentage of students moving from SBGL to At/Above Grade Level will meet or exceed the district average.
The percentage of students moving from SBGL to At/Above Grade Level will meet or exceed the district average.
DRA2, Monthly Guided Reading progress monitoring, Running Records
We will provide students with structured reading instruction that develops foundational reading skills, while focusing on providing students with strategies to increase their comprehension and ability to read increasingly difficult texts.
M
S
ELA
School Code: 8242 School Name: STEELE ELEMENTARY SCHOOL
CDE Improvement Planning Template for Schools (Version 7.0 – Template Last Updated: June 9, 2015) 19
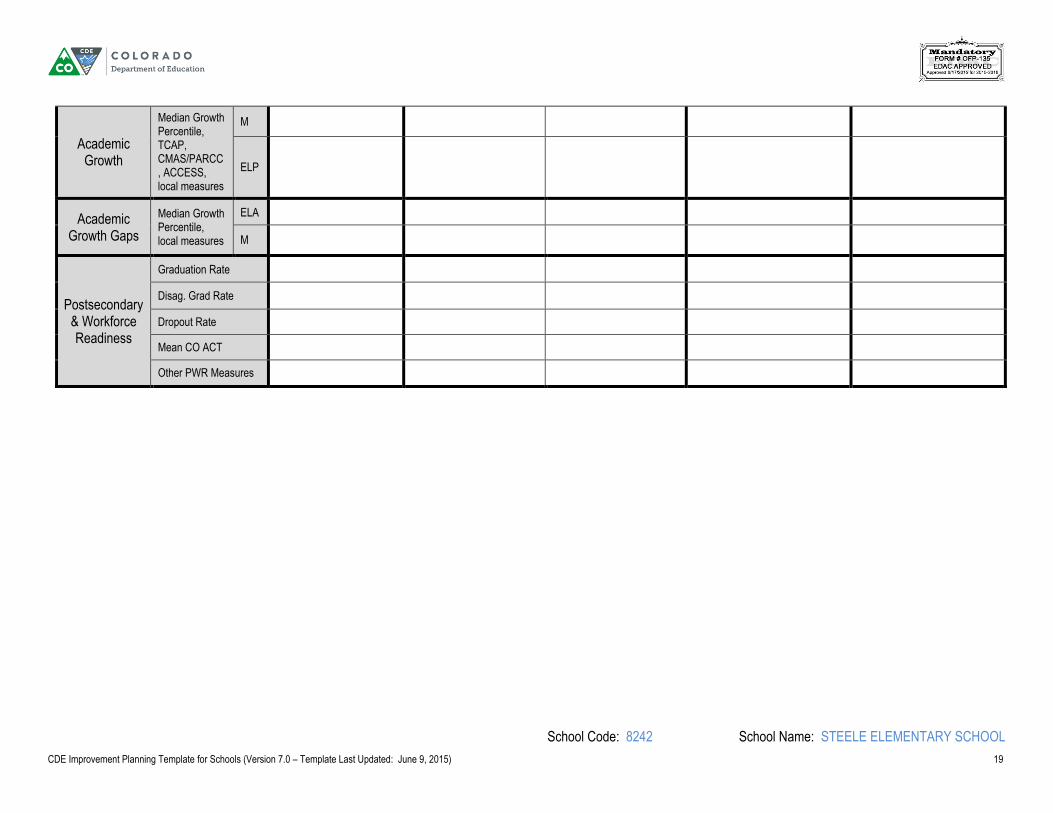
Academic Growth
Median Growth Percentile, TCAP, CMAS/PARCC, ACCESS, local measures
M
ELP
Academic Growth Gaps
Median Growth Percentile, local measures
ELA
M
Postsecondary & Workforce Readiness
Graduation Rate
Disag. Grad Rate
Dropout Rate
Mean CO ACT
Other PWR Measures

School Code: 8242 School Name: STEELE ELEMENTARY SCHOOL
CDE Improvement Planning Template for Schools (Version 7.0 – Template Last Updated: June 9, 2015) 20
Action Planning Form for 2015-16 and 2016-17 Directions: Identify the major improvement strategy(s) for 2015-16 and 2016-17 that will address the root cause(s) determined in Section III. For each major improvement strategy, identify the root cause(s) that the major improvement strategy will help to dissolve. Then, indicate which accountability provision or grant opportunity it will address. In the chart below, provide details about key action steps necessary to implement the major improvement strategy. Details should include the action steps that will be taken to implement the major improvement strategy, a general timeline, resources that will be used to implement the actions, and implementation benchmarks. Additional rows for action steps may be added. While the template provides space for three major improvement strategies, additional major improvement strategies may also be added. To keep the work manageable, however, it is recommended that schools focus on no more than 3 to 5 major improvement strategies.
Major Improvement Strategy #1: We will provide students with structured reading instruction that develops foundational reading skills, while focusing on providing students with strategies to increase their comprehension and ability to read increasingly difficult texts.
Root Cause(s) Addressed: Teachers are continuing to develop capacity to implement the CCSS ELA standards and assessments. We have not provided our students with consistent school-wide instruction in regards to foundational reading skills.
Accountability Provisions or Grant Opportunities Addressed by this Major Improvement Strategy (check all that apply):
State Accreditation Title I Focus School Tiered Intervention Grant (TIG) Diagnostic Review Grant School Improvement Support Grant
READ Act Requirements Other: ____________________________________________________________________________________________________
Description of Action Steps to Implement the Major Improvement Strategy
Timeline Key
Personnel*
Resources (Amount and Source: federal, state,
and/or local) Implementation Benchmarks
Status of Action Step* (e.g., completed, in progress, not begun)
2015-16 2016-17
Professional Development in Guided Reading
October 2015-April 2016
Principal
AA
Teacher leaders
Classroom teachers
Fountas and Pinnell GR
DPS Guided Reading Plus training
Readers Workshop PDU
DRA progress monitoring
Winter benchmark testing
In progress
Continue to solidify expectations for vertical teams in regards to phonics instruction and sight words
October 2015
SLT
Principal
Teacher Leaders
Classroom Teachers
DPS scope and sequence
FRY sight words
Mondo Curriculum Resources
Classroom observations
Running records/DRA progress monitoring collected and discussed monthly
In progress
School Code: 8242 School Name: STEELE ELEMENTARY SCHOOL
CDE Improvement Planning Template for Schools (Version 7.0 – Template Last Updated: June 9, 2015) 21
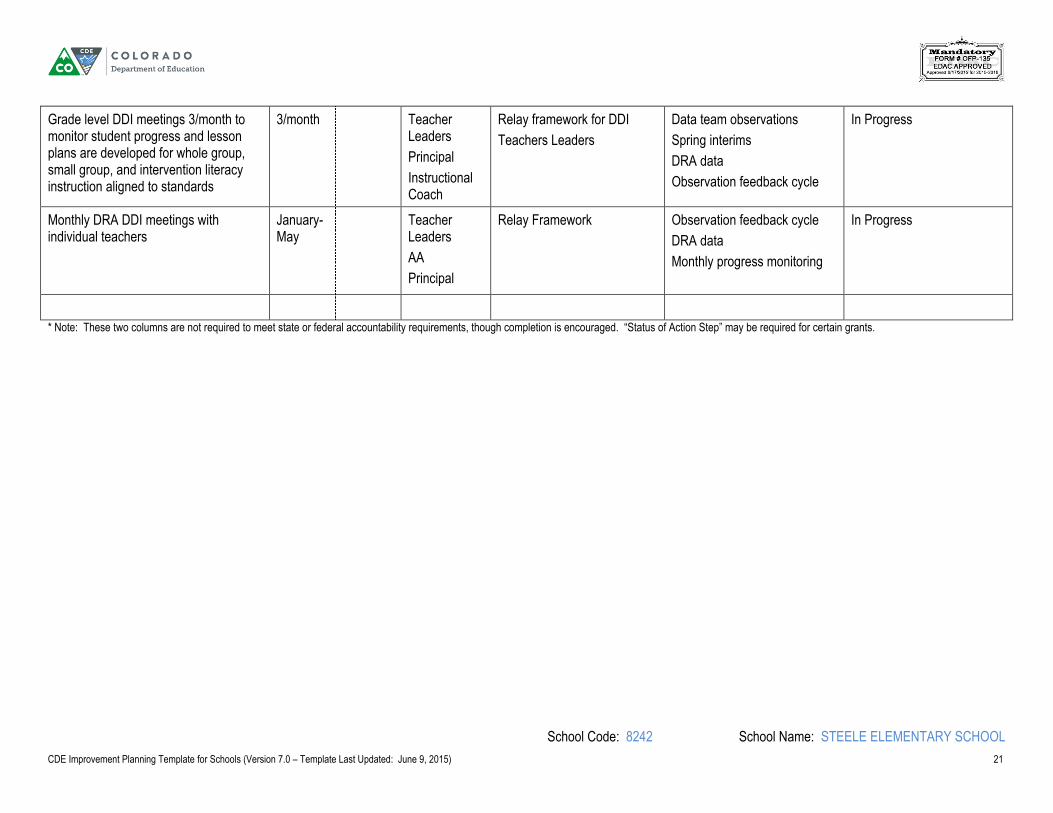
Grade level DDI meetings 3/month to monitor student progress and lesson plans are developed for whole group, small group, and intervention literacy instruction aligned to standards
3/month Teacher Leaders
Principal
Instructional Coach
Relay framework for DDI
Teachers Leaders
Data team observations
Spring interims
DRA data
Observation feedback cycle
In Progress
Monthly DRA DDI meetings with individual teachers
January-May
Teacher Leaders
AA
Principal
Relay Framework
Observation feedback cycle
DRA data
Monthly progress monitoring
In Progress
* Note: These two columns are not required to meet state or federal accountability requirements, though completion is encouraged. “Status of Action Step” may be required for certain grants.
School Code: 8242 School Name: STEELE ELEMENTARY SCHOOL
CDE Improvement Planning Template for Schools (Version 7.0 – Template Last Updated: June 9, 2015) 22
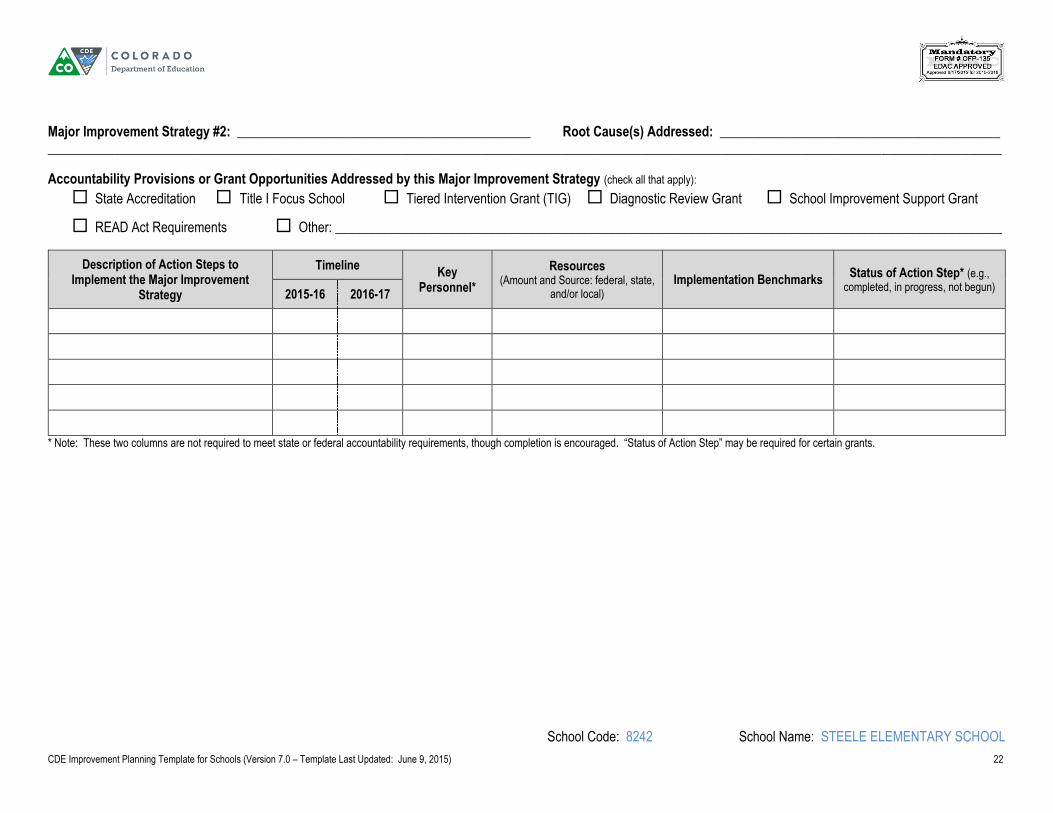
Major Improvement Strategy #2: ____________________________________________ Root Cause(s) Addressed: __________________________________________ _______________________________________________________________________________________________________________________________________________
Accountability Provisions or Grant Opportunities Addressed by this Major Improvement Strategy (check all that apply):
State Accreditation Title I Focus School Tiered Intervention Grant (TIG) Diagnostic Review Grant School Improvement Support Grant
READ Act Requirements Other: ____________________________________________________________________________________________________
Description of Action Steps to Implement the Major Improvement
Strategy
Timeline Key
Personnel*
Resources (Amount and Source: federal, state,
and/or local) Implementation Benchmarks
Status of Action Step* (e.g., completed, in progress, not begun)
2015-16 2016-17
* Note: These two columns are not required to meet state or federal accountability requirements, though completion is encouraged. “Status of Action Step” may be required for certain grants.

School Code: 8242 School Name: STEELE ELEMENTARY SCHOOL
CDE Improvement Planning Template for Schools (Version 7.0 – Template Last Updated: June 9, 2015) 23
Major Improvement Strategy #3: ____________________________________________ Root Cause(s) Addressed: __________________________________________ _______________________________________________________________________________________________________________________________________________
Accountability Provisions or Grant Opportunities Addressed by this Major Improvement Strategy (check all that apply):
State Accreditation Title I Focus School Tiered Intervention Grant (TIG) Diagnostic Review Grant School Improvement Support Grant
READ Act Requirements Other: ____________________________________________________________________________________________________
Description of Action Steps to Implement the Major Improvement
Strategy
Timeline Key
Personnel*
Resources (Amount and Source: federal, state,
and/or local) Implementation Benchmarks
Status of Action Step* (e.g., completed, in progress, not begun)
2015-16 2016-17
* Note: These two columns are not required to meet state or federal accountability requirements, though completion is encouraged. “Status of Action Step” may be required for certain grants.
Section V: Appendices
Some schools will need to provide additional forms to document accountability or grant requirements:
Additional Requirements for Turnaround Status Under State Accountability (Required)
Tiered Intervention Grantee (TIG) (Required)
Title I Schoolwide Program. Important Notice: The schoolwide addendum is one of several ways to document how a school is meeting the Title I schoolwide requirements. While schools operating a Title I schoolwide program must have a plan, use of the UIP addendum is optional. The Federal Programs Unit and the Improvement Planning Unit will be offering training in fall 2015 on schoolwide requirements and the possible pathways to meet those requirements.