Embed Size (px)
Citation preview
Q1 2015 Healthcare IT Funding and M&A Executive Summary
1 Copyright 2010-2015 | Mercom Capital Group, llc | www.mercomcapital.com | [email protected]
Executive Summary
Healthcare IT Funding and M&A 2015 First Quarter Report
Funding and merger & acquisition activity for the
Healthcare IT / Digital Health sector
http://www.mercomcapital.com
Q1 2015 Healthcare IT Funding and M&A Executive Summary
2 Copyright 2010-2015 | Mercom Capital Group, llc | www.mercomcapital.com | [email protected]
About Mercom’s Healthcare IT Funding and M&A Report
Mercom was one of the first research firms to track funding and M&A activity in the Healthcare IT
sector, starting in 2010. We refer to the industry as “Healthcare IT” while others use terms such
as digital health or ehealth, among others.
Here is how our report is different: Our report includes deals of all sizes globally to present a
complete picture of Healthcare IT funding and technology trends. As an independent research
firm, we have no conflicts of interest with companies covered in this report.
This is the most comprehensive report covering funding and M&A deals of all sizes,
globally. The trends revealed in this report give a more complete picture of the industry.
This report does not cover bioinformatics and medical devices.
All charts, graphs and trends are clearly categorized and defined by technology and sub-
technology groups.
This report includes concise deal information for every transaction.
This report covers historical trends.
As the industry evolves, our report evolves with it and we continuously improve the
information, analysis, charts and trends covered every quarter.
Our subscribers include companies and executives from venture capital, private equity,
investment banking, healthcare, healthcare IT (aka digital health and eHealth), insurance,
healthcare associations, universities, tech firms and more.
Audience Why they like our reports
Venture Capital/Private Equity leads from early-stage deals, technology trends
Investment bankers leads for funding and M&A deals, investor leads
Healthcare IT, digital health sector trends, investor targets (by funding behavior, including
technology, technology partnership targets, and more)
Insurance companies acquisition leads, investment leads, technology partnerships
Large healthcare & Tech firms acquisition leads, R&D partnerships, investment leads
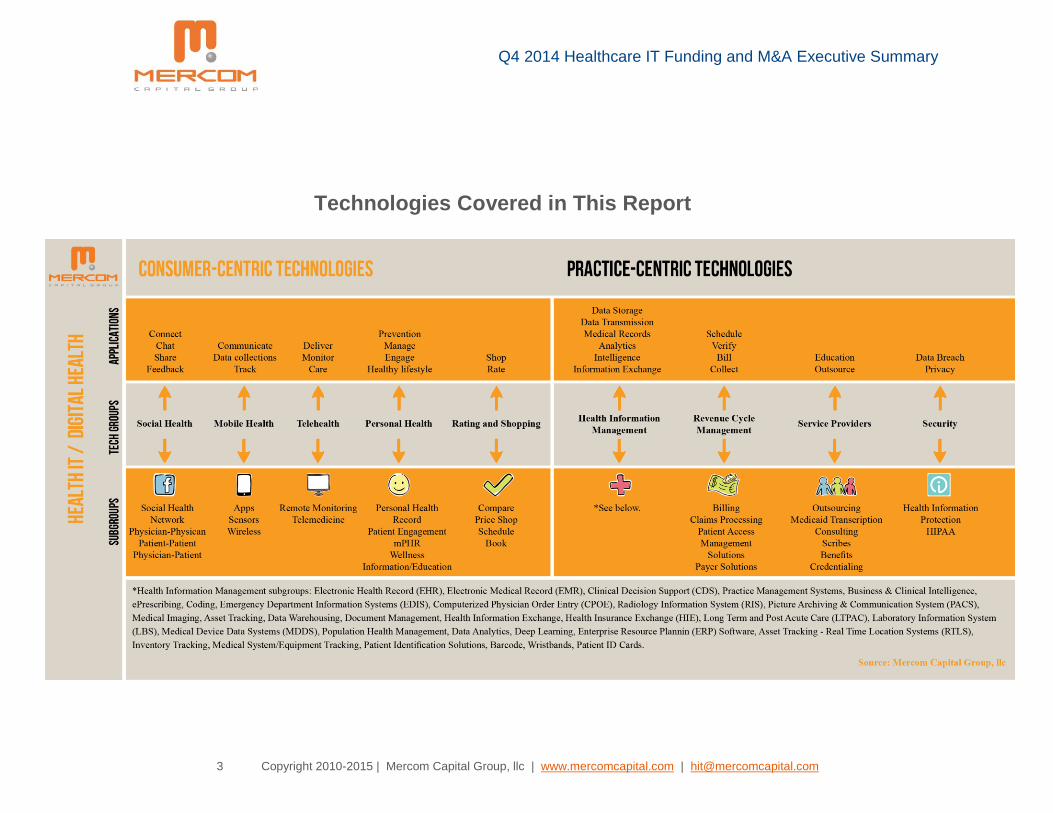
The report covers the technologies listed below and the sub-technologies under them.
Q4 2014 Healthcare IT Funding and M&A Executive Summary
3 Copyright 2010-2015 | Mercom Capital Group, llc | www.mercomcapital.com | [email protected]
Technologies Covered in This Report
Q1 2015 Healthcare IT Funding and M&A Executive Summary
4 Copyright 2010-2015 | Mercom Capital Group, llc | www.mercomcapital.com |
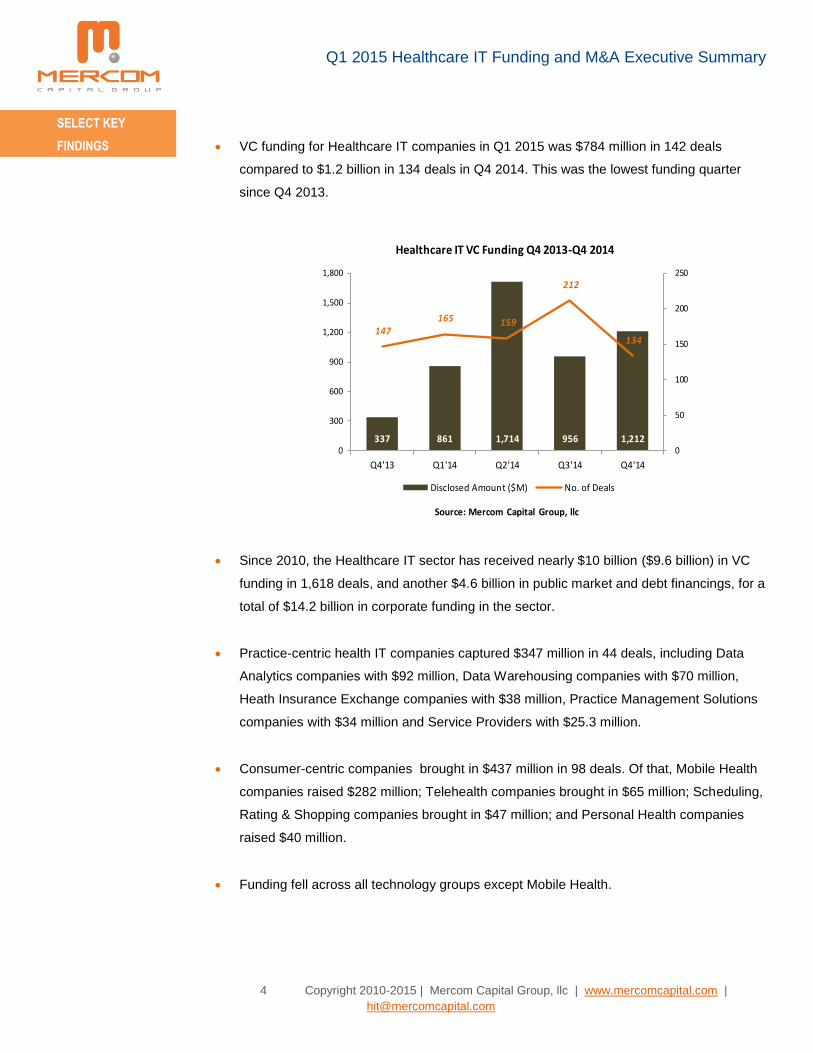
VC funding for Healthcare IT companies in Q1 2015 was $784 million in 142 deals
compared to $1.2 billion in 134 deals in Q4 2014. This was the lowest funding quarter
since Q4 2013.
337 861 1,714 956 1,212
147 165 159
212
134
0
50
100
150
200
250
0
300
600
900
1,200
1,500
1,800
Q4'13 Q1'14 Q2'14 Q3'14 Q4'14
Source: Mercom Capital Group, llc
Healthcare IT VC Funding Q4 2013-Q4 2014
Disclosed Amount ($M) No. of Deals
Since 2010, the Healthcare IT sector has received nearly $10 billion ($9.6 billion) in VC
funding in 1,618 deals, and another $4.6 billion in public market and debt financings, for a
total of $14.2 billion in corporate funding in the sector.
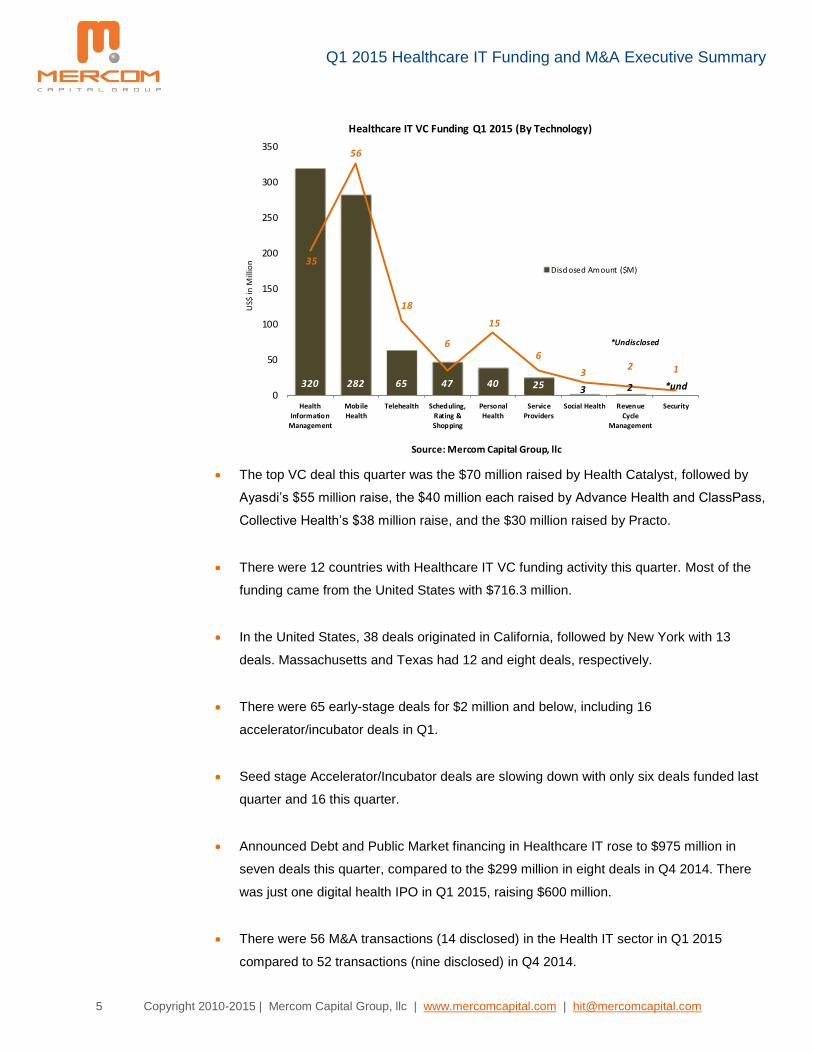
Practice-centric health IT companies captured $347 million in 44 deals, including Data
Analytics companies with $92 million, Data Warehousing companies with $70 million,
Heath Insurance Exchange companies with $38 million, Practice Management Solutions
companies with $34 million and Service Providers with $25.3 million.
Consumer-centric companies brought in $437 million in 98 deals. Of that, Mobile Health
companies raised $282 million; Telehealth companies brought in $65 million; Scheduling,
Rating & Shopping companies brought in $47 million; and Personal Health companies
raised $40 million.
Funding fell across all technology groups except Mobile Health.
SELECT KEY
FINDINGS
Q1 2015 Healthcare IT Funding and M&A Executive Summary
5 Copyright 2010-2015 | Mercom Capital Group, llc | www.mercomcapital.com | [email protected]
The top VC deal this quarter was the $70 million raised by Health Catalyst, followed by
Ayasdi’s $55 million raise, the $40 million each raised by Advance Health and ClassPass,
Collective Health’s $38 million raise, and the $30 million raised by Practo.
There were 12 countries with Healthcare IT VC funding activity this quarter. Most of the
funding came from the United States with $716.3 million.
In the United States, 38 deals originated in California, followed by New York with 13
deals. Massachusetts and Texas had 12 and eight deals, respectively.
There were 65 early-stage deals for $2 million and below, including 16
accelerator/incubator deals in Q1.
Seed stage Accelerator/Incubator deals are slowing down with only six deals funded last
quarter and 16 this quarter.
Announced Debt and Public Market financing in Healthcare IT rose to $975 million in
seven deals this quarter, compared to the $299 million in eight deals in Q4 2014. There
was just one digital health IPO in Q1 2015, raising $600 million.
There were 56 M&A transactions (14 disclosed) in the Health IT sector in Q1 2015
compared to 52 transactions (nine disclosed) in Q4 2014.
320 282 65 47 40 25 3 2 *und
35
56
18
6
15
6
32 1
0
10
20
30
40
50
60
0
50
100
150
200
250
300
350
Health
Information
Management
Mobile
Health
Telehealth Scheduling,
Rating &
Shopping
Personal
Health
Service
Providers
Social Health Revenue
Cycle
Management
Security
US$
in M
illio
n
Source: Mercom Capital Group, llc
Healthcare IT VC Funding Q1 2015 (By Technology)
Disclosed Amount ($M)
*Undisclosed
Q1 2015 Healthcare IT Funding and M&A Executive Summary
6 Copyright 2010-2015 | Mercom Capital Group, llc | www.mercomcapital.com | [email protected]
Introduction……………………………………………………………………….……...………. 3
Key Findings ……………………………….…………………………….……………… 4
2015 Healthcare IT Funding and M&A ……………………………….………………. 8
VC Funding 2010-2015 YTD…………………………………………………….……………… 8
VC Funding by Quarter …………………………………………………………………..….…. 9
VC Funding by Technology……………………………………………………………. 10
Health Information Management……….…………………….……..………. 12
Mobile Health…….…………….…………….………………………..………. 17
Telehealth…….…….………….…………….………………………..………. 25
Scheduling, Rating and Shopping………….……………..………..………. 28
Personal Health….…………….…………….………………...……..………. 29
Social Health…….…………….…………….………………………..………. 31
VC Funding by Stage……………..………………………………….….….…………. 32
VC Activity by Country…………..…………………………………………….……….. 33
VC Activity by U.S. States……………………………………………………………… 34
Trends in VC Funding Large vs Smaller Deals…………………………………….. 36
Top VC Funding Deals………..…………………… …………………………........... 37
Top VC Investors………..………………………………………………….................. 38
Accelerators/Incubators………..…………………………………………………......... 40
VC Deals………………………..………………………………….……………………. 53
VC Investors…….……………………..……………………………..…………........... 55
Debt and Public Market Financing….………………………………………………………… 65
Debt and Public Market Financing Activity ...…………..……………………………. 66
Debt and Public Market Financing Investors…………………………….................. 66
Initial Public Offering (IPO) ……………………………........................................... 67
Mergers and Acquisitions (M&A)………………………….…………………………………. 68
M&A by Technology………..…………………………………………..……….……… 69
M&A by Sub-Technology…..……..…..………………..………………………..…….. 69
Multiple Acquirers………..…………………………………………..……….………… 70
Top Five M&A Transactions……………………………………………..…………….. 71
Disclosed M&A Transactions…………................................................................... 72
M&A Transactions by Country…………................................................................... 73
M&A Transactions……….…………………………………………………….……….. 74
TABLE of
CONTENTS
Q1 2015 Healthcare IT Funding and M&A Executive Summary
7 Copyright 2010-2015 | Mercom Capital Group, llc | www.mercomcapital.com | [email protected]
Interested in Reading More?
Click here to purchase
Mercom’s Q1 2015 Healthcare IT
Funding and M&A Report.
Subscribe to Mercom’s weekly
Healthcare IT market intelligence report.
Visit:
MercomCapital.com
to purchase past reports
DISCLAIMER: © 2015 by Mercom Capital Group, llc. All rights reserved. Mercom hereby grants user a personal, non-exclusive, non-refundable, non-transferable license to use the Report for research purposes only. Mercom retains exclusive and sole ownership of all its Reports. When quoting from this report, please cite “Mercom Capital Group, llc”. Information contained in this publication is derived from carefully selected sources we believe to be reliable. Mercom its employees, affiliates, agents, and licensors do not warrant the accuracy, completeness, currentness, non-infringement, merchantability, or fitness for a particular purpose of this report. Nothing in this report constitutes or should be taken as investment advice. For information about this document, please contact us at 512-215-4452 or via email at: [email protected].