Embed Size (px)
Citation preview
Funding and performanceof healthcare systems in the
four countries of the UKbefore and after devolution
Sheelah Connolly, Gwyn Bevanand Nicholas Mays
The Nuffield Trust is a charitable trust carrying out research and policy analysis on health services. Its focus is on the reform of healthservices to improve the efficiency, effectiveness, equity and responsiveness of care. Current work themes include new forms of careprovision, commissioning, efficiency, competition and international comparisons. For more information on our work programme,and to subscribe to our free e-newsletter, visit www.nuffieldtrust.org.uk
Published by The Nuffield Trust, 59 New Cavendish Street, London W1G 7LP
Telephone: 020 7631 8450Facsimile: 020 7631 8451
Email: [email protected]: www.nuffieldtrust.org.uk
Charity number 209201
© The Nuffield Trust 2010ISBN-13 978-1-905030-40-8
Typeset by Page OneTelephone 01543 264214
Cover design by LiquidTelephone 07947 484 195
Printed by Winstonmead PrintTelephone 01509 213456
The Nuffield Trust
Contents of boxes, tables and figuresChapter 2: Devolution: background, arrangements and their implications ......................................................... 7
Box 2.1: Policy and organisational characteristics of the four countries of the UK ...................... 17
Chapter 3: Methods .......................................................... 25
Table 3.1: List of indicators included in the cross-country analysis .................................... 26
Table 3.2: List of indicators included in the comparison of Scotland, Wales and Northern Ireland and the English regions.................................. 30
Chapter 4: Cross-country comparisons ............................ 33
Figure 4.1: Male life expectancy at birth in England, Scotland, Wales and Northern Ireland (1996, 2002 and 2006) ................................ 33
Figure 4.2: Female life expectancy at birth in England, Scotland, Wales and Northern Ireland (1996, 2002 and 2006) ................................ 34
Figure 4.3: NHS expenditure per capita in England, Scotland, Wales and Northern Ireland (1996, 2002 and 2006) ................................ 35
ContentsThe authors ........................................................................ viii
Acknowledgements .............................................................. ix
Foreword .............................................................................. x
Summary ............................................................................. xi
Chapter 1: Introduction ........................................................ 3
Chapter 2: Devolution: background, arrangements and their implications ........................................................... 7
Chapter 3: Methods ............................................................ 25
Chapter 4: Cross-country comparisons ............................... 33
Chapter 5: Comparisons of Scotland, Wales and Northern Ireland with English regions.................................. 61
Chapter 6: Discussion ........................................................ 95
Appendix ........................................................................ 107
Figure 4.4: Relative per capita spend on NHS and public expenditure (2006/07; UK = 100) ................................................. 36
Figure 4.5: Hospital medical and dental staff (whole time equivalents) per 1,000 population in England, Scotland, Wales and Northern Ireland (1996, 2002 and 2006) ................... 37
Figure 4.6: General practitioners per 1,000 population in England, Scotland, Wales and Northern Ireland (1996, 2002 and 2006) ................... 38
Figure 4.7: Nursing, midwifery and health visiting staff (whole time equivalents) per 1,000 population in England, Scotland, Wales and Northern Ireland (1996, 2002 and 2006) .... 39
Figure 4.8: Management and support staff (whole time equivalents) per 1,000 population in England, Scotland, Wales and Northern Ireland (1996, 2002 and 2006) .................. 40
Figure 4.9: Total outpatient appointments per 1,000 population in England, Scotland, Wales and Northern Ireland (1996, 2002 and 2006) .... 41
Figure 4.10: Day cases per 1,000 population in England, Scotland, Wales and Northern Ireland (1996, 2002 and 2006) .............................. 42
Figure 4.11: Inpatient admissions per 1,000 population in England, Scotland, Wales and Northern Ireland (1996, 2002 and 2006) .................. 43
Figure 4.12: Outpatient appointments per hospital medical and dental staff member in England, Scotland, Wales and Northern Ireland (1996, 2002 and 2006) .................. 44
Figure 4.13: Inpatient admissions per hospital medical and dental staff member in England, Scotland, Wales and Northern Ireland (1996, 2002 and 2006) .............................. 45
Figure 4.14: Day cases per hospital medical and dental staff member in England, Scotland,Wales and Northern Ireland (1996, 2002 and 2006) .................................................. 46
Figure 4.15: Outpatient appointments per nursing, midwifery and health visiting staff member in England, Scotland, Wales and Northern Ireland (1996, 2002 and 2006) .................. 47
Figure 4.16: Inpatient admissions per nursing, midwiferyand health visiting staff member in England,Scotland, Wales and Northern Ireland(1996, 2002 and 2006) .............................. 48
Figure 4.17: Day cases per nursing, midwifery and health visiting staff member in England, Scotland, Wales and Northern Ireland (1996, 2002 and 2006) .................................................. 49
Table 4.1: Activity: operation rates (per 10,000) for selected hospital procedures in England, Scotland, Wales and Northern Ireland (1996, 2002 and 2006) .............................. 51
Chapter 5: Comparisons of Scotland, Wales and Northern Ireland with English regions .............................. 61
Figure 5.1: Populations of the nine English GORs and Scotland, Wales and Northern Ireland (2006) ............................................ 61
Table 5.1: Selected socio-economic indicators for the UK, English GORs, England, Wales, Scotland and Northern Ireland (2006) ........ 63
Figure 5.2: Selected socio-economic indicators for Scotland, Wales, Northern Ireland and the North East region of England (2006; England = 100) .............................. 64
Figure 5.3: Standardised mortality ratios (males and females separately) of the nine English GORs and England, Scotland, Wales and Northern Ireland (2006) .............................. 65
Figure 5.4: Perinatal and infant mortality rates of the nine English GORs and England, Scotland,Wales and Northern Ireland (2006).............. 66
Figure 5.5: Life expectancy at birth of the nine English GORs and England, Scotland, Wales and Northern Ireland (2006).............. 67
Figure 5.6: Percentages of the population aged 65–74 for males and 60–74 for females and aged 75 and over in the nine English GORs and England, Scotland, Wales and Northern Ireland (2006) .............................. 68
Figure 4.18: Percentage of the population waiting less than six months for day case or inpatient admission in England, Wales and Northern Ireland (1996, 2002 and 2006) .................. 52
Figure 4.19: Percentage of the population waiting less than three months for outpatient appointment in England, Wales and Northern Ireland (1996, 2002 and 2006) .... 53
Figure 4.20: Percentage of category A ambulance calls met within eight minutes in England, Scotland and Wales (1999 to 2006) ............. 54
Figure 4.21: Percentage of the population reporting satisfaction with the general running of theNHS in England, Scotland, Wales and Northern Ireland (1996, 2002 and 2006) .... 55
Figure 4.22: Percentage of the population reporting satisfaction with inpatient care in England, Scotland, Wales and Northern Ireland (1996, 2002 and 2006) .............................. 56
Figure 4.23: Percentage of the population reporting satisfaction with outpatient care in England, Scotland, Wales and Northern Ireland (1996, 2002 and 2006) .............................. 57
Figure 4.24: Percentage of the population reporting satisfaction with GP care in England, Scotland, Wales and Northern Ireland (1996, 2002 and 2006) .............................. 58
Figure 5.7: Percentages of the population reporting longstanding illness, limiting longstanding illness and restricted activity in the nine English GORs and England, Scotland, Wales and Northern Ireland (2006) ............. 69
Figure 5.8: Selected health indicators for Scotland, Wales, Northern Ireland and the North East region of England (2006; England = 100) .......................................... 70
Figure 5.9: Total NHS expenditure per capita for the nine English GORs and England, Scotland, Wales and Northern Ireland (2006) ............. 71
Table 5.2: Comparisons of SMRs and per capita spend for the nine English GORs and Scotland, Wales and Northern Ireland (2006) ................ 72
Figure 5.10: Available hospital beds per 1,000 population for the ten English SHAs and England, Scotland, Wales and Northern Ireland (2006) .............................. 73
Figure 5.11: Hospital medical and dental staff (whole time equivalents) per 1,000 population in the ten English SHAs and England, Scotland, Wales and Northern Ireland (2006) ............. 74
Figure 5.12: Nursing, midwifery and health visiting staff (whole time equivalents) per 1,000 populationin the ten English SHAs and England, Scotland,Wales and Northern Ireland (2006) ............. 75
Figure 5.13: Management and support staff (whole time equivalents) per 1,000 population in the ten English SHAs and England, Scotland, Wales and Northern Ireland (2006) ............................................ 76
Figure 5.14: General practitioners per 1,000 population in the ten English SHAs and England, Scotland, Wales and Northern Ireland (2006) .. 77
Figure 5.15: Staff per 1,000 population for Scotland, Wales, Northern Ireland and the North East region of England (2006; England = 100) .......................................... 78
Figure 5.16: Total outpatient appointments per 1,000 population in the nine GORs of England and England, Scotland, Wales and Northern Ireland (2006) .............................. 79
Figure 5.17: Day cases per 1,000 population in the nine GORs of England and England, Scotland, Wales and Northern Ireland (2006) ............. 80
Figure 5.18: Inpatient admissions per 1,000 population in the nine GORs of England and England, Scotland, Wales and Northern Ireland (2006) ............................................. 81
Figure 5.19: Treatment rates per 1,000 population for Scotland, Wales, Northern Ireland and the North East region of England (2006; England = 100) .......................................... 82
Figure 5.25: Day cases per nursing, midwifery and health visiting staff member in eight regions of England and England, Scotland, Wales and Northern Ireland (2006) ....................... 88
Figure 5.26: Percentage waiting more than 13 weeks for inpatient admission or day case for the ten English SHAs, England, Wales and Northern Ireland (March 2008) ............ 89
Table 5.3: Numbers and percentage of the populationwaiting less than 13 weeks for inpatient or day case admission or outpatient appointment in the ten English SHAs, England, Wales and Northern Ireland (March 2008) .............................................. 90
Table 5.4: Percentage of the population waiting less than six weeks, six to 12 weeks and 12 weeks or more for an inpatient admission or day case or outpatient appointment in the ten SHAs of England (March 2006) ....... 91
Box 5.1: Indicators for which Scotland, Wales and Northern Ireland are outliers as compared with English regions (2006) ........................ 93
Figure 5.20: Outpatient appointments per hospital medical and dental staff member in eight regions of England and England, Scotland, Wales and Northern Ireland (2006) ............. 83
Figure 5.21: Inpatient admissions per hospital medical and dental staff member in eight regions of England and England, Scotland, Wales and Northern Ireland (2006) ....................... 84
Figure 5.22: Day cases per hospital medical and dental staff member in eight regions of England and England, Scotland, Wales and Northern Ireland (2006) .............................. 85
Figure 5.23: Outpatient appointments per nursing, midwifery and health visiting staff member in eight regions of England and England, Scotland, Wales and Northern Ireland(2006) ........................................................ 86
Figure 5.24: Inpatient admissions per nursing, midwifery and health visiting staff member in eight regions of England and England, Scotland, Wales and Northern Ireland (2006) ........................................................ 87
viii
Sheelah Connolly is a Research Fellow at the Centre for Public Health, Queen’s University Belfast. She completedundergraduate and postgraduate degrees in Economics at theNational University of Ireland, Galway, before going on to studyHealth Economics at the University of York. Sheelah thenreturned to Galway, where she lectured for two years beforemoving to Belfast. She has lived and worked in Belfast for thepast five years, with occasional research trips to London. Herresearch to date has mainly focused on the interplay betweenarea and health status.
Gwyn Bevan is Professor of Management Science and Directorof the MSc in Public Management and Governance in theDepartment of Management at the London School of Economicsand Political Science and an associate of LSE Health and theCentre for Analysis of Risk and Regulation. Gwyn was a memberof the team that reported in 1978 on the management offinancial resources for the Royal Commission on the NHS; this
was based on fieldwork in three English regional healthauthorities and in Scotland, Wales and Northern Ireland. He hasadvised governments in Wales, Northern Ireland and Englandon the allocation of resources within each country. WhileDirector of the Office for Healthcare Performance at theCommission for Health Improvement from 2000 to 2003, Gwynfirst became aware of how differences in government policies inEngland and Wales led to differences in hospital waiting times.
Nicholas Mays is Professor of Health Policy in the HealthServices Research Unit, Department of Public Health andPolicy, London School of Hygiene and Tropical Medicine. Hewas principal health policy adviser to the New ZealandTreasury, 1998 to 2003, after five years as Director of HealthServices Research at The King’s Fund. In the 1990s, Nicholasworked at Queen’s University Belfast, where he developed aninterest in the way in which health and social services operatein the four parts of the United Kingdom.
The authors
ix
In this joint effort Sheelah Connolly collected and analysed thedata, and organised the presentation of the Figures, Tables andsources; Gwyn Bevan did most of the drafting and contextualresearch; Nicholas Mays was the principal investigator whooversaw the whole project and acted as the final editor.
All the authors are grateful to the Nuffield Trust for part-fundingthis project. Sheelah Connolly was supported by a HealthServices Fellowship from the Health Research Board, Dublin.The comments and criticisms received from the members of theadvisory group, Nick Black, Scott Greer and Frank Kee; AndyMcKeon, as a trustee of the Nuffield Trust; and threeanonymous referees from different countries of the UK, havebeen of great benefit in writing this report.
Acknowledgements
x
The Nuffield Trust has a longstanding interest in the UK’sdevolution ‘experiment’ as it applies to healthcare. The mantrafor the NHS has recently shifted from ‘quality’ to ‘quality withefficiency’, so it is timely to look at how, over ten years on fromdevolution, each of the four UK health services is faring in itsaims of delivering high-quality health services for patients, andvalue for money for taxpayers.
This report underlines the fact that the four countries havetaken very different paths in healthcare since devolution, andshows that it is far from clear that they all offer an equal benefitto patients in return for taxpayers’ investment. It offers, for thefirst time, comparisons of healthcare in Scotland, Wales andNorthern Ireland with the English regions, with which theyshare much common ground.
As part of our wider work looking at how healthcare resourcesare allocated, the Trust is publishing a follow-up study by thesame authors, looking at the implications from this study for the allocation of healthcare resources within the UK.
This report forms part of our work theme on UK andinternational comparisons. By looking at established bestpractice internationally, we aim to bring the benefits ofinternational experience to the attention of UK policy-makersand health leaders. Current work on this theme includes:
� a series of reports on lessons from the Netherlands for UKhealthcare commissioners and policy-makers
� a programme of seminars bringing together policy-makersand practitioners from the four UK countries to discusscomparative health system performance, recent advances inpredictive risk modelling, and new forms of care for peoplewith long-term conditions
� comparative studies of primary care within Europe, and inNew Zealand
� a seminar for future leaders of European healthcareorganisations
� a preparatory study testing the feasibility of comparingcancer patient pathways across Europe
� sponsoring the influential Harkness fellowships to the USA.
I do hope you will find this report of interest. To keep in touchwith our developing work programme, please visit our websitewww.nuffieldtrust.org.uk , where you can also sign up toreceive regular updates.
Dr Jennifer DixonDirector, The Nuffield Trust
Foreword
xi
The principal purpose of this report is to examine the impactsof political devolution in 1999 to the Scottish Parliament andAssemblies in Wales and Northern Ireland, on what has nowbecome, as a result, four different National Health Services(NHSs) in the four countries of the UK: England, Scotland,Wales and Northern Ireland. Much has been written on theways in which policies have diverged following devolution, inparticular in Scotland and Wales – in Northern Ireland, so farthere has been minimal development of a distinct policy fromthat of England. Some of these differences are obvious topatients. In Scotland there is free personal care for older people.In Wales the government has abolished charges forprescriptions. The governments in Scotland and NorthernIreland are to abolish prescription charges, too. But that is notthe case in England. Other policy differences are less obvious topatients but provide very different systems of governance foreach NHS. Greer has characterised these different emphases as:in England, on markets and management; in Scotland, on themedical profession and cooperation; in Wales, on localism andwider public health issues; and in Northern Ireland, onpermissive managerialism.
Following the 1997 election, the government in Englandmaintained the ‘purchaser/provider’ split, introducedthroughout the UK in 1991 as part of the policy of aiming forprovider competition within an internal market. From 2002,the government in England has sought to reintroduce providercompetition through patient choice of a plurality of providers
(NHS trusts, NHS foundation trusts, independent sectortreatment and private providers) in a system in which ‘moneyfollows the patient’. In contrast, Scotland and Wales haveabolished the purchaser/provider split and the idea of providercompetition, and recreated organisations responsible formeeting the needs of the population and running serviceswithin defined geographical areas. This is seen as making iteasier to integrate and coordinate services and thereforeimprove quality of care along the patient pathway.
The period after devolution was followed by massive increasesin funding of the NHS across the UK, but only in England wasthis extra funding, in principle, conditional on its NHS meetinga set of demanding targets (in Public Service Agreements (PSAs) with HM Treasury, with particular emphasis on thereduction of long waiting times for access to hospitals). Thegovernments of the other countries determined funding of their NHS from a global sum for devolved services based on acrude formula (the Barnett Formula) and bilateral negotiationswith HM Treasury. The outcomes of these processes were thatEngland had the lowest, and Scotland the highest, per capitaallocations for devolved services and the NHS; but in 2006/07England spent the highest proportion of its global sum on theNHS. The NHS in England was required to use the increasedfunding to meet demanding targets in the system of annual‘star ratings’, which applied from 2001 to 2005, andsubsequently in the annual ‘Health Check’. None of the otherthree countries introduced systems of public reporting of
Summary
xii
hospital waiting times and ambulance response times toemergency calls. Third, the differences highlighted in these keystatistics raise troubling questions about performance,governance and accountability.
In 2005, two of the authors reported a comparison of theperformance of the NHS in the four countries of the UKcovering the period 1996 to 2000, before and immediately afterpolitical devolution. The main findings of that analysis were theabsence of any obvious link between spending per capita andperformance. In England, strong performance managementagainst targets had resulted in much shorter waiting times inthe post-devolution period than in the other countries forwhich there were comparable data (Wales and NorthernIreland). The present analysis extends to 2006 and shows thatsince 2002 there have been large increases in spending andstaffing, falls in the crude productivity of hospital doctors andnurses; and, particularly in England, further reductions inwaiting times.
The principal findings from the cross-country longitudinalcomparisons are as follows:
� In 1996 and 2006, Scotland had the highest, and Englandthe lowest, rates per capita of expenditure, nurses, hospitalmedical and dental staff, and general practitioners (GPs)(except in 2006, when Wales had the lowest rate for GPs).The relative excess of rates in Scotland over Englandnarrowed for per capita expenditure and GPs, remainedrelatively constant for hospital medical and dental staff, but almost doubled for nursing staff.
performance which ‘named and shamed’ organisations thatfailed to meet national targets.
The terminology used in this report distinguishes betweenEngland and the three devolved countries (Scotland, Wales andNorthern Ireland); the distinction emphasises the absence of aparliament or an assembly for England. This report builds ontwo previous cross-country comparisons, the first concernedwith 1996/97 and the second comparing that year with2002/03. This third comparison adds data for 2006/07 andtherefore examines changes over a ten-year period from1996/97 to 2006/07. In this report, the years covered by eachof the three cross-country comparisons (1996/97; 2002/03;2006/07) are referred to as 1996, 2002 and 2006.
These longitudinal analyses required data that were comparableacross jurisdictions and over time: this severely restricted theamount of routinely available data that could be included inthis report. One particular problem was that the way in whichwaiting times were defined in Scotland (in particular forpatients unavailable for treatment) meant that the performance of the NHS in Scotland in reducing waiting timescould not easily be compared with that of the other countries of the UK. We make three points given these limitations. First, despite the effort and time taken to produce this report, it must be seen as a work in progress and as identifying where further analysis would be fruitful. Second, the reportdoes not claim to offer a complete rounded assessment of NHS performance across the four countries, instead the aimwas to report comparative longitudinal analysis of key statistics on funding, staffing, outputs, crude productivity,
xiii
� In 1996 and 2006, Northern Ireland had the highest, andEngland the lowest, rates per capita of management andsupport staff (which includes health and personal socialservices in Northern Ireland). The excess rate of NorthernIreland over England increased from about 70 per cent in1996 to 170 per cent in 2006.
� In 1996, Scotland had the highest rates per capita foroutpatient appointments, day cases and inpatientadmissions. In 2006, Northern Ireland had the highestrates for day cases and inpatient admissions, and Wales had the highest rates for outpatient appointments.
� In 1996, England had the lowest rates per capita foroutpatient appointments and inpatient admissions, andNorthern Ireland the lowest rates for day cases. In 2006,Scotland had the lowest rates for outpatient appointmentsand inpatient admissions, and Wales the lowest rates forday cases.
� In 1996 and 2006, Scotland had the lowest rates ofoutpatient appointments and inpatient admissions perhospital medical and dental staff member. In 1996, Englandhad the highest rates of outpatient appointments andinpatient admissions; in 2006, Wales and Northern Irelandhad the highest rates (but the regional analysis given belowshows that average rates for England are misleading).
� In 1996, Northern Ireland and Wales had the lowest ratesof outpatient appointments and inpatient admissions pernursing staff member; in 2006, Scotland had the lowestrates. In 1996, England had the highest rates; in 2006,England and Northern Ireland had the highest rates.
� England consistently had the best performance – over thetime for which comparable data exist – for waiting times forinpatients and outpatients, and for ambulance responserates to what may have been life-threatening emergencies.
In this report, the research team has supplemented thelongitudinal cross-country comparison with a cross-sectionalanalysis of the three devolved countries and English regions for2006. The main reason for this additional analysis is that someof the national averages reported for England are distorted bythe unrepresentative nature of London. The North East is morelike the three devolved countries (in terms of its size andindicators of socio-economic, demographic and morbiditycharacteristics) and therefore some of the analysis focuses ondifferences between the North East region and the threedevolved countries.
In general, the regional analysis showed that the devolvedcountries tend to be outliers (i.e. outside the distribution ofperformance across the English regions), with poorerperformance than any comparable English region (in somecases excluding London) for hospital waiting times and crudeproductivity of medical, dental and nursing staff members.Comparing Scotland with English regions (except London)showed that Scotland had the highest standardised mortalityratios, lowest life expectancy, highest levels of expenditure andstaffing, and the lowest levels of crude productivity of hospitalmedical and dental staff, and nursing staff. Comparing Walesand Northern Ireland with the North East showed that Walesand Northern Ireland had per capita expenditure similar to thatof the North East, but poorer performance in terms of hospital
xiv
Scotland would care for 70 outpatients, seven day cases and12 inpatients; and in the North East a nurse would care for142 outpatients, 14 day cases and 27 inpatients.
These differences raise questions about funding, staffing and the delivery of services:
� How could a 6 per cent additional level of funding per capitain Scotland, as compared with the North East, result inScotland having, per capita, 14 per cent more hospital doctorsand GPs, nearly 50 per cent more nurses and nearly 75 percent more non-clinical staff? Is this because the ScottishParliament has decided to spend its money differently (forexample, without the same emphasis on capital developmentthrough schemes financed by the Private Finance Initiative)?
� How could lower levels of staffing per capita in the NorthEast have delivered 18 per cent more outpatientattendances, nearly 40 per cent more day cases and over 50 per cent more inpatients than in Scotland?
� What explains the differences in crude productivity ofclinical staff? In the North East, hospital doctors treatedover 60 per cent more outpatient attendances, about 100per cent more day cases and inpatients than in Scotland;and nurses about 100 per cent more outpatientattendances, day cases and inpatients than in Scotland.
There are three troubling features of governance andaccountability following devolution. First, the UK taxpayerfunds health services in each country, but only England is held to account for its performance by the UK Treasury. Thefunding of the NHS in England is, in principle, dependent upon
waiting times, and crude productivity of hospital medical anddental staff (crude productivity of nursing staff in NorthernIreland was marginally higher than in the North East, but inWales was much lower than in the North East). The North Eastalso had a lower per capita level of non-clinical staff.
The regional analysis highlights the contrast between the NHSin Scotland and its adjacent English region, the North East.Their populations are of similar size and have correspondingcharacteristics, but are within different jurisdictions. For theyear ending March 2006, there were striking and puzzlingdifferences in terms of average expenditure, staffing and servicesprovided by each NHS for a population of 100,000:
� Expenditure and staffing in Scotland would have beenabout £180m, with 250 hospital doctors (medical anddental staff), 1,100 nurses, 730 non-clinical staff(management and support) and 81 GPs; and in the NorthEast, £170m, 180 hospital doctors, 740 nurses, 420 non-clinical staff and 71 GPs.
� The services provided in Scotland would have amounted toabout 89,300 outpatient attendances, 7,600 day cases and13,500 inpatient admissions; and in the North East, about105,000 outpatient attendances, 10,500 day cases and20,700 inpatient admissions.
There were also striking differences in average crudeproductivity for the same year:
� A hospital doctor in Scotland would care for 357 outpatients,30 day cases and 54 inpatients; and in the North East for584 outpatients, 58 day cases and 115 inpatients. A nurse in
xv
performance against the Treasury’s Public Service Agreement(PSA) targets. Since 2007, for health and other devolved services,there have been no PSA targets for the devolved governments, sotheir funding is not contingent upon their performance. Thesegovernments are held to account by their electorates specificallyfor the performance of the devolved services. Second, there is noequivalent electoral accountability for devolved services inEngland, as this accountability is exercised only through generalelections to the UK Parliament. Third, while the UK statisticsauthority has a crucial role in monitoring the quality of statisticsproduced by each country, it does not appear to have theauthority to require governments of the UK to producecomparable data on public services. The experience of theresearch team shows that the data collected on a comparablebasis over time across the four countries are extremely limited;and, if anything, devolution seems to have reduced thewillingness of the devolved administrations to collect such data.
The unusual features of devolution mean that it would now bedifficult for the Treasury to hold the devolved governments toaccount through PSA targets, but UK taxpayers have a right toknow how well the different governments are, or are not, securingvalue for their money. If the Treasury cannot hold devolvedgovernments to account for their performance through targets,then it ought to be able to require them to supply comparativedata on that performance. The authors see such comparativeinformation as a vital element in holding governments to accountfor the performance of each of the four different NHSs.
This report has identified troubling differences between the UKcountries in funding, staffing and performance that highlight
larger issues posed by devolution in terms of the way in whichmonies from UK taxpayers are allocated to the devolved countriesand accountability for devolved services in all countries. Thelimitations of the analysis have been recognised, which generallyarise from the limited amount of data available on a consistentbasis across countries and over time; but the analysis has shownthat England has the lowest per capita funding for the NHS andmakes better use of its lower level of resourcing in terms of shorterwaiting times and higher crude productivity of its staff. Otherresearchers have failed to find evidence that in the devolvedcountries, the higher levels of per capita funding, longer waitingtimes and lower crude productivity have produced materialsystematic benefits in other dimensions of quality of care.Although this merits further analysis it may be difficult, if notimpossible, to collect such evidence as this is likely to require datathat are either not readily available or have not been collected.This report will be followed by another study that will examinewhether the level of NHS funding between the four countries isequitable. The House of Lords Select Committee on the BarnettFormula critically examined the way decisions have been made onpublic spending across the four UK countries. The authors of thisreport strongly support that Committee’s recommendation thatfunding ought to take account of both the size of populations andtheir relative need for public services.
The current analysis raises the obvious question: if the extrafunding for Scotland were justified by greater need forhealthcare, why did Scotland have relatively low rates oftreatment per capita? The team also sees scope for further moredetailed work using the North East as a benchmark forcomparison with the devolved countries.
CH
APTER 1
CH
APTER 3
CH
APTER 4
Funding and performance ofhealthcare systems in the fourcountries of the UK before and afterdevolution
CH
APTER 2
CH
APTER 5
CH
APTER 6
3
CHAPTER 1INTRODUCTION
CH
APTER 1
On 1 May 1997, the (New) Labour Government won alandslide victory in the General Election with four policycommitments in its manifesto1 that shaped the governance,funding and performance of the healthcare systems in the UK.Only one of these was specific to healthcare with the promiseto ‘save the National Health Service’ by cutting costs on the‘bureaucratic processes of the internal market’, getting 100,000off waiting lists and improving the quality of care throughincreasing spending each year in ‘real terms’.
The NHS, however, had little prospect of substantial growthmonies: the manifesto made a commitment to ‘work withindepartmental ceilings for spending already announced’ (by theConservative Government), which entailed prudence in fiscalpolicy in the Blair Government’s first term; and anothermanifesto commitment made it clear that the first claim onresources for public services would be for schools, as thegovernment’s first three priorities famously were ‘Education,Education, Education’.2
This report examines the consequences for healthcare in theUK of a fourth manifesto commitment, namely devolution of
power (to the Scottish Parliament and the Welsh Assembly,which was also extended to the Northern Ireland Assembly), on funding, performance, governance and accountability of what has now become a different NHS within each of thefour countries of the UK: England, Scotland, Wales andNorthern Ireland.
Much of the work to date examining the impacts of devolutionhas focused on differences in policies, structure, values andaccountability across the four systems of healthcare.3 Thisreport draws on that literature to outline these differences, butthe original contribution comes from reporting a set ofindicators on populations, and resourcing and performance ofsystems of healthcare measured over time to raise questionsabout the funding, performance, governance and accountabilityof governments of each country. The requirement for indicatorsto be comparable over time and across countries limited therange and number available and hence the scope of this report.
The authors present two kinds of comparisons of performancebetween the different countries of the UK: first, longitudinalanalyses at three time points over ten years (1996/97, 2002/03,
FUNDING AND PERFORMANCE OF HEALTHCARE SYSTEMS IN THE FOUR COUNTRIES OF THE UK BEFORE AND AFTER DEVOLUTION
4
2006/07, hereafter referred to as 1996, 2002 and 2006) ofnational averages for each country; and second, cross-sectionalcomparisons of regions in England (for 2006, when the currentten strategic health authorities were created) with the otherthree countries, which show the limited value of comparing onevery large country, England (50 million population), with threemuch smaller ones: Scotland (five million), Wales (threemillion) and Northern Ireland (1.7 million). These comparisonsreveal two different categories of indicators: one set where thevariation within England is greater than between the average forEngland and the three other countries; and another set wherethe statistics for the other countries lie outside the range for theregions in England. The authors show that the North East is abetter benchmark for comparison with the devolved countriesthan the average for England for two reasons: the North East is more like the three devolved countries (in terms of the size of their populations and indicators of their socio-economic,demographic and morbidity characteristics); and average percapita indicators of expenditure and supply for England areheavily influenced by the high values for London, which arecaused by the high costs of labour in the capital, andconcentrations of research, teaching and training.4
The second section of this report sets the context for thecomparative analysis. It describes the background to, and thenature and arrangements for, political devolution. Following itsenactment, there was a commitment by the Prime Minister of
the UK to unprecedented and sustained real increases in spendon the NHS, which applied across the UK, to remedy aperceived crisis in the NHS from underfunding that hadresulted in inadequate investment and staffing, poor outcomesand quality of care, including long hospital waiting times.Subsequently, the government in England, unlike in the otherthree countries, linked the unprecedented increases in NHSfunding to a requirement for a transformation of performance,with targets set by the Treasury and new policies for the NHS toachieve those targets. For the devolved governments inScotland, Wales and Northern Ireland, there was neitherexternal pressure from the Treasury on their ministries ofhealth, nor did these governments put specific forms ofpressure on their own NHSs to improve their performance.
The third section outlines the methods of comparative analysisand brings out the difficulty of obtaining comparative data oneven the basic measure of hospital waiting times. The fourthand fifth sections report, respectively, inter-countrycomparisons using routinely available data at three time points(1996, 2002 and 2006), which include periods before and after devolution (except for ambulance response times which show changes since 1999); and a comparison of the English regions with the three other countries in 2006. The final section highlights findings from these comparisons and their implications for policy and research.
5
1. Labour Party (1997) New Labour: Because Britain deserves better. London:Labour Party.
2. Mattei, P, Glennerster, H and Bevan, G (2009) Raising Standards inSchools: Contrasting approaches taken by the devolved administrations in theUnited Kingdom. Forthcoming.
3. Jervis, P and Plowden, W (2003) The Impact of Political Devolution on theUK’s Health Services. London: The Nuffield Trust. Greer, S (2004) FourWay Bet: How devolution has led to four different models for the NHS. London:The Constitution Unit. Greer, S and Trench, A (2008) Health andIntergovernmental Relations in the Devolved United Kingdom. London: TheNuffield Trust. Jervis, P (2008) Devolution and Health. London: TheNuffield Trust. Greer, S (2008) ‘Devolution and divergence in UK healthpolicies’, BMJ 337: a2616. Smith, KE (2007) ‘Health inequalities inScotland and England: the contrasting journeys of ideas from researchinto policy’, Social Science & Medicine 64(7): 1438–49. Smith, KE,Hunter, DJ, Blackman, T, Elliott, E, Greene, A, Harrington, BE, Marks, L,Mckee, L and Williams, GH (2009) ‘Divergence or convergence? Healthinequalities and policy in a devolved Britain’, Critical Social Policy 29:216–42. Harrington, BE, Smith, KE, Hunter, DJ, Marks, L, Blackman, TJ,
McKee, L, Greene, A, Elliott, E and Williams, GH (2009) ‘Healthinequalities in England, Scotland, and Wales: stakeholders’ accounts andpolicy compared’, Public Health 123(1): e24–e28.
4. One indication of this is the numbers of medical students. A commonsource for these data has not been found, but, for example, London in2001/02 had nearly five times as many medical students as Scotland:London had about 4,400 (Department of Health, 2000) and Scotlandabout 900 (Calman and Paulson-Ellis, 2004). See Department of Health(2000) Service Increment for Teaching Accountability Report 1999/2000.London: Department of Health, p12. www.dh.gov.uk/en/Managingyourorganisation/Humanresourcesandtraining/EducationTrainingandDevelopment/PostRegistration/DH_4074419 ; Calman, Sir Kenneth andPaulson-Ellis, M (2004) Review of Basic Medical Education in Scotland.Edinburgh: The Stationery Office, p37. ww.scotland.gov.uk/Resource/Doc/ 47251/0013200.pdf . London is also the home to such greatinstitutions serving the whole of the UK: for example, HammersmithHospital, Great Ormond Street Hospital for Children, the Royal MarsdenHospital, and the National Hospital for Neurology and Neurosurgery at Queen Square.
7
CH
APTER 2
CHAPTER 2DEVOLUTION: BACKGROUND, ARRANGEMENTS AND THEIR IMPLICATIONS
The historical background to devolutionDevolution followed a long and complicated historicaldevelopment of governance arrangements in the UK. Historyobviously matters as we now have governance on a consistentbasis from a strong centre for the 50 million who live in England,with quite different arrangements allowing considerableautonomy for those parts with a historical claim to being distinctcountries. This brief outline of the history of the unions of thedifferent countries aims to identify key developments leading tothe creation of the United Kingdom that have had an influenceon governance before and after devolution.
The outline draws on the account by Norman Davies in TheIsles – A history,1 in which he highlights problems ofnomenclature.2 Colley (1992)3 points out that, in 1805, a Scotrepresenting a Perthshire constituency saw the word English asapplicable to describe people from any part of the UK (p162).Davies sets out to correct the ‘inability of prominent authoritiesto present the history of our Isles in accurate and unambiguous
terms’ (p xxviii). These prominent authorities included theBodleian library of Oxford University and the Library ofCongress in Washington which, in 1999, had no entry for thehistory of the United Kingdom, and their entries for GreatBritain assumed this to be identical to the history of England(pp xxxiv–xxxvi). This follows the practice of the entry in the index of early editions of the Encyclopaedia Britannica: ‘For Wales – see England’.4
Following a long and complex history,5 key developments in theformation of the current UK included historical defeats by theEnglish of the Welsh, by the Scottish of the English; and, inIreland, the bloody history that followed the plantation inUlster with events that still resonate in the Protestant andCatholic communities.6 The Statute of Rhuddlan (1284) wasimposed on, and subjugated Wales to, English jurisdictionfollowing its conquest by Edward I. The Act of Union ofEngland and Wales (1536) that followed the Tudor assault onWales clearly defined the border for the first time, and renamed
FUNDING AND PERFORMANCE OF HEALTHCARE SYSTEMS IN THE FOUR COUNTRIES OF THE UK BEFORE AND AFTER DEVOLUTION
8
the Kingdom of England the Kingdom of England and Wales.Later English common law was imposed and English declaredthe sole language of administration.7 In contrast, Scotlandremained independent with its own parliament until the mergerof the Edinburgh and Westminster Parliaments in the Act ofUnion of 1707, in which Scotland secured greater autonomythan either Wales (in its earlier union) or Ireland (in its laterunion) (p583).8 At the end of the fifteenth century, the DublinParliament had been obliged to pass Poynings’ Law, whichinvalidated all Irish legislation not previously approved inEngland, and remained on the statute book for nearly threehundred years. King James I and VI signed the Act for theconfiscation of Ulster to achieve its subjugation by theplantation (by principally English leaseholders and Scottishtenants). Ulster had previously been the most Irish, Gaelic andCatholic and traditional province of Ireland (pp479–81). Thetwo key legislative developments were: the merger of the Britishand Irish Parliaments (1800);9 and the partition of Ireland bythe Government of Ireland Act (1920), which was confirmed bythe Anglo–Irish Treaty (1921) and created the British Provinceof Northern Ireland.10
This history is relevant in understanding arrangements prior todevolution as it explains why historical dominance matters andalso key differences between the countries that, as Colley(1992)11 argues, ought not to be assumed to be similar as a‘Celtic fringe’: the Welsh and the Scottish ‘rarely definedthemselves by reference to the kind of rich Celtic nationalismthat certain Irish patriots would make so much of after the1840s’ (p14). Although Wales, in contrast to Scotland, ‘hadlost its own legal system, its religious organisation was
modelled on England’s own, and it had no universities orcapital city like Edinburgh as a focus for cultural life... as late asthe 1880s, three out of four spoke Welsh from choice’ (p13).Only in Wales does a significant population speak a nativelanguage other than English, and government publications are bilingual.
For long periods, however, for the devolved services, Wales waslittle more than an English region. The educational system inWales has been described with reference to the entry in theEncyclopaedia Britannica: for Wales see England;12 and prior todevolution, the NHS in Wales was perceived as ‘forming anadjunct to the English health service’.13
In contrast, Scotland differs from England in that: Scottishbanks issue their own currency (in notes; coins are minted on aUK-wide basis); Scottish civil law ‘contains elements that haveorigins in Roman Dutch Law rather that English Common Lawtraditions’;14 and the Scottish educational system has a systemof exams and higher education which is distinctively different.15
In Northern Ireland, history continues to wrestle with thecomplications arising from partition (into Northern Ireland andthe Republic of Ireland) and its own ‘Troubles’. In terms ofgovernance, as compared with England, Northern Ireland ismore different than Wales and less different than Scotland.Before devolution, legislation for the UK consisted of threedifferent territorial arrangements: this was on a common basisfor England and Wales; but Scotland and Northern Ireland eachhad different Acts. (Greer and Trench explain thesedifferences.16) After devolution the Scottish Parliament has a
9
wide range of legislative powers and is free to legislate on allmatters except those reserved for Westminster, which for healthand healthcare include regulation for almost all the healthprofessions. The Assembly in Northern Ireland can also legislateexcept for reserved matters. The powers of the Assembly inWales are more circumscribed and were initially limited toexecutive matters, which were those of the Welsh Office priorto devolution. There is scope for the Assembly to acquirelegislative powers, but these depend on the cumbersomeprocess of approval by a Westminster Act of Parliament or aLegislative Competence Order, an order in Council sought bythe Assembly and approved at Westminster.17
This history is also relevant in understanding the nature ofdevolution. Davies argues that the nature of the union of 1707prevented the UK from developing either a federal structure (asin Germany, where each land was established on an equal basiswith none designed to dominate the others) or unitary structure(as in France, which until recently possessed a highly centralisedcharacter in which the political nation developed within oneterritory). In contrast the UK is ‘essentially a dynasticconglomerate, which could never equalise the functions of itsfour constituent parts’ and lacks a unified legal system,centralised educational system, common cultural policy orhistory (pp870–1). Davies argues that although Scotland unitedwith England in 1707 and Ireland with England and Scotland in1800, as far as the English are concerned ‘England never unitedwith anyone’ (p552). This one-eyed perspective of the impact ofunions on England carried over to devolution which was seen torequire new elected bodies in Scotland, Northern Ireland andWales, but not in England where the UK Parliament is
responsible for both policies that apply to all four countries (forexample, defence, social security and foreign policy) and toEngland only (healthcare and education, for example), leading tothe ‘West Lothian question’, which is discussed below.
Governance of the NHS before political devolutionThe creation of the NHS in 1948 established largely the sameorganisational forms and common policies across the whole ofthe UK with access to the NHS free at the point of delivery(except for the subsequent introduction of prescription charges)and typically via a general practitioner (GP), who acts asgatekeeper to specialist services. Initial arrangements illustratehow Wales was essentially seen as an English region, withScotland and Northern Ireland seen as distinct administratively:the regulation to control the distribution of GPs was by threeMedical Practices committees: for England and Wales; forScotland; and for Northern Ireland. A hospital managementcommittee governed each hospital, and was accountable toregional hospital boards in England (with 14), Wales (one);Scotland (five),18 and a hospitals authority in Northern Ireland.19
The major reorganisation of the NHS (implemented in 1974 inEngland, Wales and Scotland, and 1973 in Northern Ireland)aimed to shift the NHS from an organisation based on hospitalsto one based on populations. This resulted in a regionalstructure in England of 14 regional health authorities (RHAs);for the other countries, the government department of healthfulfilled this role. Within English RHAs and Wales there werearea health authorities, responsible for running hospital and
CH
APTER 2
FUNDING AND PERFORMANCE OF HEALTHCARE SYSTEMS IN THE FOUR COUNTRIES OF THE UK BEFORE AND AFTER DEVOLUTION
10
community health services and planning for populations withineach area (in England and Wales these were later reorganisedinto district health authorities); and family health serviceauthorities, for family practitioner services. In Scotland, healthboards were created with the same responsibilities as areahealth authorities but they also covered family practitionerservices. In Northern Ireland, health and social service boardswere created with responsibility for health and social services.The constitution of executive teams was similar in England,Wales and Scotland, but differed in Northern Ireland (includingthe Director of Social Services, but excluding the Treasurer).20
Before political devolution, each country was subject to acommon policy that applied throughout the UK with latitudefor minor variations in the devolved countries. This ispowerfully illustrated by the controversial White Paper Workingfor Patients,21 which promulgated the policies of an internalmarket throughout the UK. This followed the ThatcherGovernment’s policy of little or no increases in ‘real’ terms for the NHS, which, together with a policy of redistribution of resources according to estimated relative need, resulted in cuts in services in London and the perception of a crisis of underfunding.22 One issue pursued as a solution to that crisis was the exploration of a greater role for private health insurance, but that was eventually sidelined, and later dropped.23
These events emphasise two ways in which England is the odd one out in the UK: only in England is there a strongConservative Party and significant independent sectors forhealthcare and schools. In the devolved countries the
implementation of the internal market was seen as anideologically driven policy invented in England and imposed on them. (Its unpopularity may have contributed to there beingno Conservative Members of Parliament in either Scotland orWales after the 1997 general election.24)
The internal market created a ‘purchaser/provider’ split based on the idea that purchasers would contract withindependent providers on grounds of price and quality with ‘money following the patient’. This meant that districthealth authorities in England and Wales, health boards inScotland, and health and social service boards in NorthernIreland became ‘purchasers’ and their hierarchical role ingoverning providers was replaced with contractualarrangements. Providers became ‘independent’ NHS Trusts.Another innovation of the internal market was the creation of new small-scale purchasing by GPs who opted to become fundholders, of which various forms emerged overtime.25 In England, the emphasis on ‘light touch regulation’ of the internal market resulted in the abolition of RHAs. This regulatory tier became a monitoring arm of the Department of Health and has been reorganised every few years.26
Within the UK, before devolution, there were three Secretariesof State, for Scotland, Wales and Northern Ireland, who were all members of the UK Cabinet. They were accountable forexpenditure within these countries on (which for simplicity willbe referred to as) ‘devolved services’, which include health andlocal authority services. Decisions on spending on socialsecurity (although identifiable within each country), defence
11
and foreign affairs, were, and still are, made on a UK-wide basis.Secretaries of State were allocated a global sum for their‘devolved services’ and were free to allocate money to theirchosen spending priorities.
In 1979, when political devolution was first being considered,the then Labour Government introduced a new formula (theBarnett Formula) for allocating annual per capita spendingincreases for ‘devolved services’. This formula has recently beenreviewed by the House of Lords Select Committee on the BarnettFormula (2009):27 the account contained here of the formuladraws on that critical and informative report. The formula beganto operate in Scotland and Northern Ireland in 1979, and inWales in 1980. Its principle is that ‘growth’ in resources for‘devolved services’ would be allocated to each country inproportion to its share of the UK’s population, with annual percapita spending increases derived from the percentage increasegranted to the English baseline. Before the formula was used,England had the lowest per capita spend: in 1976/77 per capitaspending on ‘devolved services’ was much higher than Englandin Northern Ireland (by 35 per cent) and Scotland (by 22 percent) and a little higher in Wales (by 6 per cent).
The Barnett Formula was seen, at its introduction, as a short-term measure, but continued after devolution wasenacted 20 years later and has remained in place, largelyunaltered, for 30 years. A formula designed for the long-termought to take account of the relative needs of countries’populations. The Barnett Formula fails to do so, and this is whythe House of Lords Select Committee on the Barnett Formulaconcluded that it should ‘no longer be used to determine
annual increases in the block grant for the United Kingdom’sdevolved administrations’ (p7). The Treasury’s two studies ofneeds assessment in 1979 and 1993 were disregarded, but, ifimplemented, would have meant a reduction in allocationsrelative to England in both 1979 and 1993 for Northern Irelandand Scotland; and an increase in spending in Wales in 1979but not in 1993. Although in principle the design of theBarnett Formula implies gradual convergence in per capitaspend, this did not happen for two reasons.
First, relative populations were not updated until the 1990s,despite significant changes (for example, Scotland’s share of theUK population declined from 9.3 per cent in 1976 to 8.7 percent in 1995). Second, the formula did not determine allallocations of devolved public spending: there were extraallocations negotiated bilaterally with the Treasury outside theformula, in particular to cover public sector wage increases(which appear to have benefited Scotland and Northern Ireland).
UK political devolution and accountabilityPowers were transferred to the Scottish Parliament and WelshAssembly on 1 July 1999; and to the Northern IrelandAssembly on 2 December 1999. This is a peculiar arrangementas it lacks two key elements of normal federal governance: thereis no elected body for England; and there is no basis foragreeing what should be the UK-wide elements of policy fordevolved services versus those to be determined within theconstituent countries of the UK. A possible explanation forthese arrangements is that devolution was seen as a first step tobe followed by the introduction of regional governments in
CH
APTER 2
FUNDING AND PERFORMANCE OF HEALTHCARE SYSTEMS IN THE FOUR COUNTRIES OF THE UK BEFORE AND AFTER DEVOLUTION
12
England. But that step was rejected so heavily when tried in theNorth East28 that it is now off the political agenda for ageneration. The resulting anomaly in governance is known inparliament as the West Lothian question as articulated by theMP Tam Dalyell in the House of Commons:29 that is, whyshould MPs from non-English constituencies be able to vote onpolicies for England (for healthcare, education and transport)when English MPs cannot vote on these policies for eachdevolved country (as these are matters for their own parliamentand assemblies) even though their finance comes from thebudget for the UK?
The anomaly of the absence of a parliament for England wasforcefully illustrated by the introduction of two controversialpolicies implemented in England only: foundation trusts (thataimed to free hospitals from hierarchical control by theDepartment of Health subject to scrutiny by an independentregulator) in July 2003,30 and the introduction of tuition feesfor undergraduates in January 2004.31 The governments inScotland and Wales opposed these policies, but the BlairGovernment’s majority in the House of Commons dependedon votes from MPs from Scotland and Wales.
Devolution is essentially a political arrangement with virtually nofiscal devolution: the NHS is financed by general taxation andnational insurance contributions on a UK-wide basis. Scotlandonly has very limited powers for raising extra taxes, which havenot yet been used; the report from the Commission on ScottishDevolution (chaired by Sir Kenneth Calman) recommended‘that over one third of devolved current spending would befunded by taxes decided and raised in Scotland’ (p8).32
The arrangements for devolution also mean that there are inessence two different systems for determining NHS budgets:one for England and another for the devolved countries. ForEngland, the NHS budget is the outcome of UK Cabinetagreements following negotiations between HM Treasury andthe Department of Health for England; and is, in principle,contingent on the NHS in England delivering performance thatsatisfies a set of Treasury targets set out in Public ServiceAgreements (PSA targets) agreed with the Secretary of State forHealth for England. The Labour Government’s 1998Comprehensive Spending Review (HM Treasury, 1988)33 set outPSA targets for health services in England, Scotland, Wales and,to a lesser extent, Northern Ireland. The PSA targets for 2002and 2004 (HM Treasury, 2002 and 2004)34 had targets forgovernment departments in England; for the Northern IrelandOffice, but none for health services; and excluded thegovernments of Scotland and Wales. The PSA targets for 2007(HM Treasury, 2007)35 apply to government departments inEngland only.
The baseline for allocations for ‘devolved services’ to thedevolved countries (used in the Barnett Formula) is determined by the level of allocations for these services inEngland, which have been (as for healthcare), in principle,contingent on each department delivering performance thatsatisfied its PSA targets. The global allocations for ‘devolvedservices’ in the devolved countries are then determined by theBarnett Formula and bilateral negotiations with the Treasury.Each government then decides how much of its globalallocation ought to be allocated to the NHS. This means thatthe devolved countries could, for example, decide to spend
13
extra money derived from decisions designed to improve NHSperformance in England to ensure that there are no tuition feesfor undergraduates.
There are two problems with these arrangements. First, only thegovernments of the devolved countries have direct politicalaccountability for devolved services. In England, as there is noEnglish Parliament, political accountability for these services isthrough elections to the UK Parliament, which involve bothEnglish and UK-wide issues (such as the economy, spending onsocial security, and defence and foreign policy). Second, onlythe government in England is accountable for its spendingagainst Treasury targets; for the other governments, theirfunding essentially follows allocations to England that, inprinciple, depend on the performance of these services inEngland against PSA targets.
English policies for the NHS before and after devolutionFor schools, the Blair Government continued the Conservative reforms in England and Wales throughpublication of school league tables of examination results andschool inspections by the Office for Standards in Education(OFSTED); and the quasi market (where ‘money followed thepupil’).36 But for the NHS in England and Wales, its initial setof policies were described as offering a ‘third way’ comparedwith two ‘failed’ alternatives: the ‘divisive internal marketsystem of the 1990s’, and the ‘old centralised command andcontrol policies of the 1970s’37 (the last time there had been aLabour government).
The government retained the organisational separation of‘purchasers’ from ‘providers’ created for the internal market,but abandoned the rhetoric of competition so that ‘purchasers’became ‘commissioners’: the objective of that change was thatthis would foster collaborative arrangements with providers. GPfundholding was abolished, but about 450 primary care groups(PCGs) were created within the then 90 health authorities withthe objective of securing the advantages of fundholding withoutits disadvantages (which included allegations of creating a ‘two-tier’ NHS).38 The health authorities were abolished andPCGs were later reorganised into 350 and then 150 primarycare trusts (PCTs), which in effect replaced health authorities.Within Wales there was the parallel creation of local healthgroups (LHGs) based on local authorities in place of PCGs, andthese LHGs later became local health boards (see below).
But the ‘third way’ was hampered by a lack of resources for theNHS, which resulted in another perceived ‘crisis’ ofunderfunding, which was seen as a root cause of the malaise of poor quality. There were a series of landmark failures of self-regulation by the medical profession:39 notorious examplesinclude the women who suffered from the actions ofgynaecologist Rodney Ledward40 and the excess deaths ofbabies from paediatric cardiac surgery at Bristol.41 There werelong waiting times at all points of access to the NHS: to see aGP, to be seen and treated in Accident and Emergency (A&E)Departments, to be referred for diagnosis and treatment, and tobe admitted to hospital for an elective operation. Internationalcomparisons showed the UK to have the highest mortality frommajor diseases in the 1990s.42 The Secretary of State for Healthobserved: ‘Despite the best efforts of the NHS staff and cancer
CH
APTER 2
FUNDING AND PERFORMANCE OF HEALTHCARE SYSTEMS IN THE FOUR COUNTRIES OF THE UK BEFORE AND AFTER DEVOLUTION
14
patients across the country, decades of under-investmentalongside outdated practices mean that survival rates for manyof the major cancers lag behind the rest of Europe.’43 It seemsthat the tipping point came on 17 January 2000 when, in aninterview, Lord Winston, a Labour peer and well-known doctor,described the many failings of the NHS and linked this with theappalling treatment of his 87-year-old mother, a diabetic, whenshe had been admitted to a NHS hospital:
She waited 13 hours in casualty before getting a bed in a mixed-sex ward – a place we said we would abolish. None of herdrugs were given on time, she missed meals and she was foundlying on the floor when the morning staff came on. She caught aninfection and she now has an ulcer on her leg. [He acknowledgedthere was nothing unusual about this litany.] It is normal. Theterrifying thing is that we accept it.44
Three days later, on Sunday 20 January 2000, after a televisioninterview by the Prime Minister of the UK, Tony Blair, thegovernment made the commitment to increase spending on theNHS in the UK to the European average spend on healthcare asa percentage of gross domestic product45 (its effects areillustrated by Figure 4.3, which shows the resultantunprecedented increases in per capita expenditure on the NHSin each UK country, and is discussed more fully below).
Only in England did the government make it clear that extrafunding of the NHS was to be in return for a transformation ofperformance: this was in principle contingent on satisfyingTreasury PSA targets (reducing substantially mortality rates frommajor killers; narrowing health inequalities; treating patients at atime that suits them in accordance with their medical need;
reducing waiting times; and increasing patient satisfaction).46
The government for England emphasised in the summer of2000 in The NHS Plan47 that ‘investment has to be accompaniedby reform’ (p11) and announced ambitious targets for increasesin capital development and staffing,48 reducing waiting times foraccess to the NHS,49 and improving services for patients withcancers, coronary heart disease and the mentally ill. FollowingThe NHS Plan, capital development was financed by the PrivateFinance Initiative (PFI), which had been introduced by theprevious Conservative Government. Under the PFI, privateconsortia design, finance and build projects, and run andmaintain the non-clinical services over the lifetime of theagreement (typically 30 years), with the facilities being leasedback to the public sector for an annual rental payment.50
During the Blair Government’s second term (from 2001) therewas an emphasis on delivery against a small set of politicallyimportant targets: for the NHS, Schools and Transport. Thesewere coordinated by the Prime Minister’s Delivery Unit, led bySir Michael Barber.51 The aim was to raise standards in the NHSand schools so that those who could afford it would not needto choose to pay privately for healthcare or education to ensurehigh quality.52 (Failure to do this in effect means that those withinfluence go private and become unwilling to pay high taxes fora service they do not use. This then leads to a privately-financedhigh-quality service for those who can afford to pay for it and apublicly-funded service of low quality for the rest.)
The policies of delivery created a target-driven culture.53 TheNHS Plan54 emphasised that, for the NHS in England, therewould be a new regime of performance management with a
15
radically new system of incentives that would reward successand penalise failure. This was to replace the current system,which was described as one that ‘penalises success and rewardsfailure’ (for example, by bailing out hospitals with long waitingtimes and lists by rewarding them with extra money); andhence had inadvertently created a system of perverse incentives(p28). The policy of ‘naming and shaming’ schools throughpublication of school league tables was extended to the NHSbetween 2001 and 2005, with the publication of annual ‘starratings’ of NHS organisations, in which failure to achieve thegovernment’s ‘key targets’ (dominated by waiting times forhospitals or GPs, and response time to life-threateningemergency calls by ambulances) would result in thatorganisation being ‘zero-rated’, publicly ‘named and shamed’ as ‘failing’, and with the threat of the sack for the chiefexecutive.55 56
Towards the end of this period, starting in 2002/03, anotherinternal market was gradually introduced that emphasisedprovider competition based on patient choice between publicand private providers, with a system of funding in which‘money followed the patient’57 (known as payment by results)58
which has to date had mixed results.59 From 2006 ‘star ratings’were succeeded by the annual ‘Health Check’. As Preston(2009)60 argued in The Guardian, the use of central targets toput pressure on providers to improve services has paradoxicallybecome unpopular just when there is now strong evidence ofits beneficial outcomes.61 A Times leader62 commented on thelatest Health Check by the Care Quality Commission (CQC)(2009)63 and contrasted anecdotal evidence with dramaticimprovements in reported performance:64
It is often said, and it is true, that government targets can lead to perverse consequences. Ambulances wait outside hospitalsbecause there is a target that no patient should wait more thanfour hours in A&E. It is less often said that government targets, at the same time, usually work. Ninety-eight per cent of patientsdo, indeed, now get seen in A&E in less than four hours. The CQC also reports good performances for cancer waiting times, for MRSA and Clostridium difficile infection rates –which fell by a third in 2008/09 – and for the 18-week referral totreatment waiting time.
Policies for the NHS of devolvedcountries after devolutionAfter devolution, funding of ‘devolved services’ in the devolvedcountries was neither dependent on achieving PSA targets, norwas their performance subject to the scrutiny of the PrimeMinister’s Delivery Unit, nor were there threats of middle-classexit to independent healthcare providers and schools. Thegovernments in Wales and Scotland abandoned the publication ofschool league tables in 2001: in Wales this appears to have sloweddown improvements in examination achievements in their lastyear of compulsory education, in comparison with England; andin Scotland to have stopped improvement altogether.65
Although all governments in the UK countries introducedtargets for waiting times for hospitals,66 and for response timesto life-threatening emergency calls by ambulances,67 thedevolved countries did not follow the English policy of ‘namingand shaming’. In Wales68 69 and Scotland,70 71 those working in the NHS perceived the traditional system of perverse
CH
APTER 2
FUNDING AND PERFORMANCE OF HEALTHCARE SYSTEMS IN THE FOUR COUNTRIES OF THE UK BEFORE AND AFTER DEVOLUTION
16
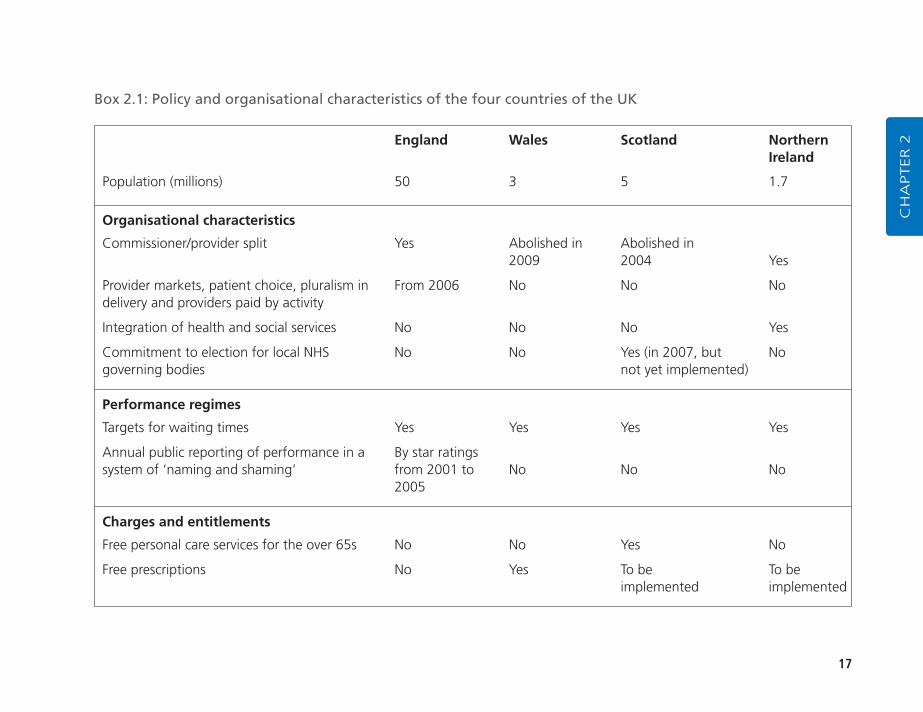
incentives to continue. The governments in Scotland72 and thenWales73 decided to abandon the purchaser/provider split and go back to a hierarchy. Greer74 75 76 characterised the policyapproaches taken in each country as follows: for England, onmarkets and management; for Scotland, on the medicalprofession and cooperation; for Wales, on localism and widerpublic health issues; and for Northern Ireland, on permissivemanagerialism. The suspension of the Northern IrelandAssembly resulted in stasis in the development of health policythrough much of the post-devolution period.77 Box 2.1 outlines differences in policy and organisational characteristicsof the four countries of the UK. The rest of this section outlineshow policy in Scotland, Wales and Northern Ireland differsfrom England.
Scotland’s distinguishing characteristics are a strong sense ofnational identity; a long tradition of high-status medicalprofessionals closely connected to the policy process; large,scarcely populated rural areas; and relatively high levels of poor health and deprivation (compared with the average forEngland, but not the Northern regions of England – see below). Jervis78 identified a number of areas, including thegovernance of the NHS, the introduction of free personal care for older people and a limited role for the private sector, where a divergent Scottish approach is evident. In 2000, the publication of the White Paper Our National Health: A plan for action, a plan for change – paved the way for a major reorganisation of the Scottish NHS:79 the NHSboards, acute hospital trusts and PCTs were brought together into 15 unified boards. The restructuring was toreduce the number of ministerial appointees by one-third;
which would lead to a greater reliance on professionals whowould, it was envisaged, work together for the benefit ofpopulation health.
In 2003, there was clear evidence of a further rejection of theinternal market with the Scottish Executive (Scotland) Act,which abolished trusts and transferred their responsibilities tothe health boards. Perhaps the most controversial policy to dateadopted by the Scottish Parliament was the decision, in 2002,to implement free personal and nursing care for people aged 65years and over.80 Smith and Babbington81 note that in Scottishhealth policy, the priority is now ‘to create an integrated healthsystem with close connections between different components.The aim is to develop care pathways by building on clinicalnetworks between specialist acute services and primary care.’
Within Wales, Greer82 argues that the initial emphasis was onlocalism which meant ‘integrating health and local governmentin order to coordinate care and focus on the widerdeterminants of health rather than treating the sick’, with theambition of transforming its NHS ‘into a national Health servicerather than a national Sickness service’. The Welsh health plan,published in February 2001, proposed to abolish the fiveexisting health authorities and to replace them with 22 localhealth boards, geographically identical to the existing localauthorities. The change took place in April 2003.83 The healthboards included representatives from local authorities to ensurelocal accountability and to reflect a new emphasis on jointworking. ‘The goal of the new design is to make sure thathealth services reflect local needs rather than inherited patternsof funding or the desires of elites.’84 A distinguishing feature of
17
CH
APTER 2England Wales Scotland Northern
Ireland
Population (millions) 50 3 5 1.7
Organisational characteristics
Commissioner/provider split Yes Abolished in Abolished in2009 2004 Yes
Provider markets, patient choice, pluralism in From 2006 No No Nodelivery and providers paid by activity
Integration of health and social services No No No Yes
Commitment to election for local NHS No No Yes (in 2007, but Nogoverning bodies not yet implemented)
Performance regimes
Targets for waiting times Yes Yes Yes Yes
Annual public reporting of performance in a By star ratingssystem of ‘naming and shaming’ from 2001 to No No No
2005
Charges and entitlements
Free personal care services for the over 65s No No Yes No
Free prescriptions No Yes To be To be implemented implemented
Box 2.1: Policy and organisational characteristics of the four countries of the UK
FUNDING AND PERFORMANCE OF HEALTHCARE SYSTEMS IN THE FOUR COUNTRIES OF THE UK BEFORE AND AFTER DEVOLUTION
18
health policy in Wales was an attempt to focus on the widersocial determinants of health, rather than just healthcare. Greerand Trench85 note that the Welsh health plan of 2000 was a‘strikingly original document that focused on health rather thanthe provision of health services and treated the NHS Wales asone more tool available to add quality and length of life,alongside education, police, transport and economicdevelopment.’86 However, there is some evidence to suggestthat the strong emphasis on public health was relatively short-lived because of public dissatisfaction with what wasregarded as the relative neglect of the health services.87
In 2003, the Welsh Wanless report, Review of Health and SocialCare in Wales,88 focused mainly on acute services. The strategy,Designed for Life,89 published in 2005, which was principallyconcerned with reforming the NHS, in looking back atimprovements to services since 2001 listed reductions inwaiting times, implying a desire to balance the emphasis on thewider determinants of health with a focus on personal healthservices’ performance. Wales, like Scotland, has moved awayfrom the English emphasis on markets and competitiontowards a system based more on cooperation and integration.Following the formation of a coalition government in 2007,Welsh Labour and Plaid Cymru published an agenda for thegovernment of Wales which explicitly rejected the use of theprivate sector and of markets in healthcare and, followingconsultation,90 has abolished the internal market and thepurchaser/provider split.91
Due in part to the suspension of devolution between 2002 and2007, and in part to concerns with sectarian representation and
constitutional arguments, there have been relatively few majordevelopments in health policy in Northern Ireland sincedevolution. The review of public administration, implementedby Westminster during the suspension of the Assembly,examined arrangements for the administration and delivery ofpublic services in Northern Ireland and identified 150 publicbodies serving a population of 1.7 million. For the healthservices, the review recommended that the four health andsocial services (HSS) boards and 18 of the 19 HSS trusts bereplaced by five new health and personal social services (HPSS)agencies. Their functions would be to assess the needs of theirpopulations, commission services, and to provide directly orsecure the provision of such services, in partnership with theindependent sector92 (hence leaving open the possibility of acontinuation of the quasi-market).
The reconfiguration of the health services is currently ongoing.It is perhaps too early to say what direction health policydevelopment in Northern Ireland will take; however, with apopulation of just 1.7 million, 50 per cent of whom live in ruralareas and with high incidence of mental illness, a system basedon England’s NHS is not likely to be feasible. As onecommentator noted, ‘the future direction is expected to containelements of Scottish redesign, Welsh localism and Englishdevolved commissioning’.93
–––––––––––––––––––––––––––––––––––––––––––––––––
1. Davies, N (1999) The Isles – A history. London: Macmillan.
2. Davies (1999) op. cit. Great Britain ought to include Wales and Scotlandbut not Northern Ireland; the UK ought to include Wales, Scotland andNorthern Ireland. As Davies points out, using the term the British Isles to
19
include the Republic of Ireland ignores the vital historical fact that thiscountry is independent of the UK (pp xxiii–xli).
3. Colley, L (1992) Britons: Forging the nation, 1707–1937. London: YaleUniversity Press.
4. Robbins, K (2001) ‘More than a footnote? Wales in British history’, NorthAmerican Journal of Welsh Studies 1(1) (Winter 2001).http://spruce.flint.umich.edu/~ellisjs/Robbins.pdf
5. Davies (1999) op. cit. points out that: ‘Until the end of the sixth century,all the main communities of Celtic Britannia were linked by swaths ofcontiguous territory’ (p176). These communities included Men of theWest (Wales), the North (Scotland), the South West (which becameCornwall, still known to its natives as Kerno). The ‘lands of the Irish’ werewell established on both sides of the Celtic sea. The new kingdom of theScottish was founded by people of Irish origin (p149) (to the North ofHadrian’s wall constructed in the second century) (p156). Offa’s dyke,created in the eighth century, ‘ensured that the “Men of the West” wouldnever escape the isolation of their peninsula, that their language andculture would develop in directions not shared by other insular Celts, andthat far into the future they would assume a national identity’ (p179).Following the Norman conquest of England, there were continuingterritorial wars between countries later known as England, Ireland, Wales,Scotland and France. In the sixteenth century, divisions within Englandwere clear: with the concentration of power in England’s South East(pp403–4) and serious rebellions in regions remote from the South East,which were quashed; in Cornwall, where the persistence of its own CelticCornish language ‘strengthened the belief that Cornwall was not just acounty of England, but a country in its own right’ (p404); and the North,which had ‘remained a land apart’ from the South East (p407).
6. Ibid. Ireland’s bloody history following the plantation includes the killingof Protestants in the Ulster rising (1641) followed by the killing ofCatholics under Cromwell’s army at Drogheda and Wexford; the siege ofthe Protestant ‘Apprentice Boys’ in Derry (1689) and the victory ofWilliam of Orange in the Battle of the Boyne (1690), and ‘BloodySunday’ (30 January 1972). For the continuing Inquiry into ‘BloodySunday’ see: www.bloody-sunday-inquiry.org.uk/index.htm
7. Ibid. ‘Unlike the attack on Ireland, which had been less than half aconquest, and unlike the abortive Edwardian conquest of Scotland, it was
in both political and military terms a complete success’ (p317). Thisconquest perpetuated the division of Wales into Marchia Walliae (theMarch of Wales), which was created following an earlier Normanonslaught, as private principalities as a barrier between the lands to theEast and Wallia Pura (Wales proper) (p241). In the first decade of thefifteenth century, under the leadership of Owain ap Gruffyd Glyn Dwr(known in English as Owen Glendower) ‘the Welsh staged the last andgreatest of their attempts to shake off English domination’, and a WelshParliament met (in 1404–05 at Machynnlleth (pp369–70). But thisstruggle for independence did not succeed.
8. Ibid. The Scottish victory over the English in the battle of Bannockburn(1314) ‘decided the independence of Scotland’ (p322) following thesuccesses of armies led by William Wallace (vividly portrayed in the filmBraveheart) and meant that the English were unable to impose theOrdinance of Scotland, which resembled the Statute of Rhuddlan, andhad sought to impose English law and government and ban all Scottishand Gaelic customs. When James VI King of Scotland became James I ofEngland and Wales (1603), he also became King of Ireland, and soughtbut failed to unite these three kingdoms in one United Kingdom (pp467–70). Davies emphasises that English and Scottish historians seethis Act in very different ways: for the Scottish this marked a historicturning point of a treaty between two independent parties; the English fail to see its significance and see this Act as Scotland being merged withEngland (p550).
9. Ibid. By two identical Acts of Union passed simultaneously in Dublin andLondon, which followed the successful defeat of the struggle forindependence in 1789, by the United Irishmen led by Theobold WolfeTone (with support from the French).
10. Ibid. This followed the Easter Rising (1916) and the British–Irish War(1919–21). The British Province of Northern Ireland included only six ofUlster’s ancient nine counties, and excluded three ‘for having too manyCatholics’ (p770). The Republic of Ireland emerged after another strugglein which the ‘pro treaty’ party led by Michael Collins was defeated by the‘anti treaty’ faction led by Eamon de Valera (p760). For details of theAnglo–Irish Treaty see http://cain.ulst.ac.uk/issues/politics/docs/ait1921.htm
11. Colley (1992) op. cit.
12. Mattei and others (2009) op. cit.
CH
APTER 2
FUNDING AND PERFORMANCE OF HEALTHCARE SYSTEMS IN THE FOUR COUNTRIES OF THE UK BEFORE AND AFTER DEVOLUTION
20
13. McClelland, S (2002) ‘Health policy in Wales – distinctive or derivative?’,Social Policy and Society 1: 325–33.
14. Scottish Executive (2004) Legal System.www.scotland.gov.uk/Resource/Doc/925/0000078.pdf
15. Mattei and others (2009) op. cit.
16. Greer and Trench (2008) op. cit.
17. This has been reviewed by the All Wales Convention (Chair Sir EmyrJones) (2009) Report. http://wales.gov.uk/docs/awc/publications/091118thereporten.pdf
18. Levitt, R and Wall, A (1984) The Reorganised National Health Service(3rd edn). London: Croom Helm.
19. Leathard, A (2000) Health Care Provision: Past, present and into the 21stcentury (2nd edn). Cheltenham: Stanley Thornes, p294.
20. Levitt and Wall (1984) op. cit.
21. Secretaries of State for Health, Wales, Northern Ireland and Scotland(1989) Working for Patients. Cm 555. London: HMSO.
22. Bevan, G and Robinson, R (2005) ‘The interplay between economic andpolitical logics: path dependency in health care in England’, Journal ofHealth Politics, Policy and Law 30(1–2): 53–78.
23. Timmins, N (1995) The Five Giants: A history of the welfare state. London:Fontana, pp460–1.
24. Norris, P (1997) ‘Anatomy of a Labour landslide’, Parliamentary Affairs 50:509–32.
25. Mays, N and Dixon, J (1996) Purchaser Plurality in UK Health Care: Is aconsensus emerging and is it the right one? London: King’s Fund.
26. The 14 RHAs were abolished in 1994 and replaced by eight regionaloffices; which were abolished in 2001 and replaced by four new regionaldirectorates of health and social care; these were abolished and replacedby 28 strategic health authorities in 2003, which were abolished andreplaced by ten strategic health authorities in 2006.
27. Select Committee on the Barnett Formula (2009) The Barnett Formula (HLPaper 139). House of Lords, London: The Stationery Office.
28. Anonymous (2004) ‘North East votes “no” to assembly’, Friday, 5November 2004. http://news.bbc.co.uk/1/hi/uk_politics/3984387.stm
29. In a debate on devolution in November 1977, Mr Dalyell said: ‘For howlong will English constituencies and English Honourable memberstolerate... at least 119 Honourable Members from Scotland, Wales andNorthern Ireland exercising an important, and probably often decisive,effect on British politics while they themselves have no say in the samematters in Scotland, Wales and Northern Ireland.’ Seehttp://news.bbc.co.uk/1/hi/uk_politics/7702326.stm
30. See Greer and Trench (2008) op. cit., pp21–2.
31. The Blair Government had a majority of only five on the vote on thelegislation in the House of Commons; 46 Scottish MPs voted in favour.See Anonymous (2004) ‘Scots MPs attacked over fees vote’, Tuesday, 27January 2004. http://news.bbc.co.uk/1/hi/scotland/3432767.stm
32. The Scottish Parliament has the power (under Part IV of the Scotland Act)to vary the basic rate of income tax applying in Scotland by up to plus orminus three pence in the pound. See the Report from the Commission onScottish Devolution (Chairman Sir Kenneth Calman) (2009) ServingScotland Better: Scotland and the United Kingdom in the 21st century.Edinburgh: Commission on Scottish Devolution.www.commissiononscottishdevolution.org.uk/
33. HM Treasury (1998) Comprehensive Spending Review. Aims and objectives.London: HM Treasury. www.hm-treasury.gov.uk/d/460.pdf
34. HM Treasury (2002) How Public Service Agreement Targets from the 2000Spending Review Translate into the 2002 Targets. London: HM Treasury.www.hm-treasury.gov.uk/d/PSA_reconciliation.pdf ; HM Treasury (2004)Spending Review 2004 Supporting Documents. London: HM Treasury.www.hm-treasury.gov.uk/psp_supporting_docs.htm
35. HM Treasury (2007) Service Transformation Agreement. London: HMSO.www.hm-treasury.gov.uk/pbr_csr07_psaindex.htm
36. Mattei and others (2009) op. cit.
37. Secretary of State for Health (1997) The New NHS: Modern, dependable.Cm 3807. London: The Stationery Office.www.dh.gov.uk/en/Publicationsandstatistics/Publications/PublicationsPolicyAndGuidance/DH_4008869
38. Hence, as Klein (1998) argued, this policy could be seen as either thephasing out, or universalising, of the idea of GP fundholding. See Klein, R.
21
(1998) ‘Why Britain is reorganizing its national health service – yet again’,Health Affairs 17(4): 111–25.
39. Abbasi, K (1998) ‘Butchers and gropers’, BMJ 317: 1599.
40. Secretary of State for Health (2000) An Inquiry into Quality and Practicewithin the National Health Service Arising from the Actions of Rodney Ledward(Chair J Ritchie). London: Department of Health.www.dh.gov.uk/en/Publicationsandstatistics/Publications/PublicationsPolicyAndGuidance/DH_4093337
41. Secretary of State for Health (2001) Learning from Bristol – Report of thepublic inquiry into children’s heart surgery at the Bristol Royal Infirmary (ChairSir Ian Kennedy). CM 5207(1). London: The Stationery Office.www.bristol-inquiry.org.uk/
42. Leatherman, S and Sutherland, K (2003) The Quest for Quality in the NHS: A mid-term evaluation of the ten-year quality agenda. London: TheStationery Office.
43. Secretary of State for Health (2002) The NHS Cancer Plan: A plan forinvestment, a plan for reform. London: Department of Health.www.dh.gov.uk/en/Publicationsandstatistics/Publications/PublicationsPolicyAndGuidance/DH_4009609
44. Riddell, M (2000) ‘The New Statesman interview – Robert Winston’,www.newstatesman.com/200001170011
45. Smee, C (2005) Speaking Truth to Power: Two decades of analysis in theDepartment of Health. Oxford: Radcliffe Press. Maynard, A and Street, A(2006) ‘Seven years of feast, seven years of famine: Boom to bust in theNHS?’, BMJ 332: 906–8.
46. The four PSA targets for 2000 were as follows. 1. Reduce substantially themortality rates from major killers by 2010: from heart disease by at least40 per cent in people under 75; from cancer by at least 20 per cent inpeople under 75; and from suicide and undetermined injury by at least20 per cent. 2. Narrow the health gap between socio-economic groupsand between the most deprived areas and the rest of the country, inchildhood and throughout life. 3. Treat patients at a time that suits themin accordance with their medical need: two-thirds of all outpatientappointments and inpatient planned admissions will be pre-booked by2003/04, on the way to 100 per cent pre-booking by 2005. 4. Reduce themaximum wait for outpatient appointment to three months, and the
maximum wait for inpatient treatment to six months by the end of 2005.Secure year on year improvements in patient satisfaction, including withstandards of cleanliness and food, as measured by independently auditedlocal surveys. HM Treasury (2002) op. cit.
47. Secretary of State for Health (2000) The NHS Plan. CM 4818-I. London:The Stationery Office. www.dh.gov.uk/en/Publicationsandstatistics/Publications/PublicationsPolicyAndGuidance/DH_4002960
48. The commitments were to: 7,000 extra beds in hospitals andintermediate care; over 100 new hospitals by 2010 and 500 new one-stop primary care centres, over 3,000 GP premises modernised and 250 new scanners, 7,500 more consultants and 2,000 more GPs, 20,000 extra nurses and 6,500 extra therapists, 1,000 more medicalschool places (p11).
49. The commitments were that by 2004 patients will be able to have a GPappointment within 48 hours, long waits in accident and emergencydepartments will be ended, by the end of 2005 the maximum waitingtime for an outpatient appointment will be three months and forinpatients, six months (pp12–13).
50. See Sussex, J (2001) The Economics of the Private Finance Initiative in theNHS. London: Office of Health Economics. Pollock, AM, Shaoul, J andVickers, N (2002) ‘Private finance and “value for money” in NHShospitals: a policy in search of a rationale?’, BMJ 324:1205–9.
51. Barber, M (2007) Instruction to Deliver: Tony Blair, the public services and thechallenge of achieving targets. London: Politico.
52. Greer quoted a Labour special adviser saying in July 2006 that anunsatisfactory NHS will make the ‘middle classes first vote against theNHS with their feet, and then with their votes’. In Greer (2008) op. cit.
53. Barber (2007) op. cit.
54. Secretary of State for Health (2000) op. cit.
55. Bevan, G and Hood, C (2006) ‘What’s measured is what matters: targetsand gaming in the English public health care system’, PublicAdministration 84(3): 517–38.
56. Bevan, G and Hamblin, R (2009) ‘Hitting and missing targets byambulance services for emergency calls: impacts of different systems ofperformance measurement within the UK’, Journal of the Royal StatisticalSociety 172(1): 1–30.
CH
APTER 2
FUNDING AND PERFORMANCE OF HEALTHCARE SYSTEMS IN THE FOUR COUNTRIES OF THE UK BEFORE AND AFTER DEVOLUTION
22
57. Secretary of State for Health (2002) Delivering the NHS Plan. Cm 5503.London: Stationery Office. www.dh.gov.uk/prod_consum_dh/groups/dh_digitalassets/@dh/@en/documents/digitalasset/dh_4059526.pdf . Allen, P (2009) ‘Restructuring the NHS again: supply-side reform inrecent English healthcare policy’, Financial Accountability and Management25(4): 373–89.
58. Dixon, J (2004) ‘Payment by results – new financial flows in the NHS’,BMJ 328: 969–70. Department of Health (2002) Reforming NHS FinancialFlows: Introducing payment by results. London: Department of Health.
59. Audit Commission and Healthcare Commission (2008) Is the TreatmentWorking? London: Audit Commission. www.audit-commission.gov.uk/reports/NATIONAL-REPORT.asp?CategoryID=andProdID=9F8B7F6A-214D-4165-BE65-716315270A82andfromREPORTSANDDATA=NATIONAL-REPORT
60. Preston, P (2009) ‘In praise of targets’, The Guardian, 19 October 2009.www.guardian.co.uk/commentisfree/2009/oct/18/targets-work-topdown-cameron
61. The Auditor General for Wales has produced three critical reports on theconsequences of a lax regime in Wales and failure to achieve nationaltargets for waiting times for hospitals and fast responses by ambulances to life-threatening emergency calls. Auditor General for Wales (2005a)NHS Waiting Times in Wales. Volume 1 – The scale of the problem. Cardiff:The Stationery Office. www.wao.gov.uk/reportsandpublications/2005.asp ; Auditor General for Wales (2005b) NHS Waiting Times inWales. Volume 2 – Tackling the problem. Cardiff: The Stationery Office.www.wao.gov.uk/reportsandpublications/2005.asp ; Auditor General forWales (2006) Ambulance Services in Wales. Cardiff: The Stationery Office.www.wao.gov.uk/reportsandpublications/1015.asp
62. Anonymous (2009) ‘The quality of care’, The Times, 15 October 2009.www.timesonline.co.uk/tol/comment/leading_article/article6875253.ece
63. Care Quality Commission (2009) Performance Ratings 2008/09. London:Care Quality Commission. www.cqc.org.uk/guidanceforprofessionals/healthcare/nhsstaff/annualhealthcheck2008/09.cfm
64. See also: Bevan and Hood (2006) op. cit.; Bevan and Hamblin (2009) op. cit.; Secretary of State for Health (2002) Delivering the NHS
Plan. Cm 5503. London: Stationery Office. www.dh.gov.uk/prod_consum_dh/groups/dh_digitalassets/@dh/@en/documents/digitalasset/dh_4059526.pdf
65. Mattei and others (2009) op. cit. The Centre for Public Policy for Regions,a joint research initiative of the Universities of Glasgow and Strathclyde(CPPR, 2009) reports the percentages of pupils in their last year ofcompulsory education who achieved five or more good grades incomparable exams in each of the four countries before and afterdevolution. The percentages for each country in 1998/99, from worst to best were: Wales, 47.5 per cent; England, 47.9 per cent; NorthernIreland, 56.0 per cent, and Scotland, 57.8 per cent. In 2006/07, the percentages, from worst to best were: Wales, 54.2 per cent; Scotland, 57.5 per cent. England, 62.0 per cent; Northern Ireland, 64.5 per cent. See CPPR (2009) Spending on School Education. Scottishgovernment budget options briefing series no 1. Table 3A: Attainment Data:The per cent of pupils in their last year of compulsory education whoachieve five or more grades A–C GCSE’s or SNQ equivalents, p5.www.cppr.ac.uk/media/media_133107_en.pdf
66. Auditor General for Wales (2005a) op. cit., p16.
67. Bevan and Hamblin (2009) op. cit.
68. Auditor General for Wales (2005b) op. cit.
69. National Assembly for Wales (2003) The Review of Health and Social Care in Wales. Cardiff: National Assembly for Wales.
70. Farrar, S, Harris, F, Scott, T and McKee, L (2004) The PerformanceAssessment Framework: Experiences and perceptions of NHSScotland.www.scotland.gov.uk/library5/health/pafr.pdf
71. Propper, C, Sutton, M, Whitnall, C and Windmeijer, F (2008a) ‘Did“targets and terror” reduce waiting times in England for hospital care?’,The B.E. Journal of Economic Analysis and Policy 8(2 (Contributions));Propper, C, Sutton, M, Whitnall, C and Windmeijer, F (2008b) Incentivesand Targets in Hospital Care: Evidence from a natural experiment, the Centrefor Market and Public Organisation 08/205, Department of Economics,University of Bristol, UK October 2008.www.bristol.ac.uk/cmpo/publications/papers/2008/
72. Woods, KJ (2001) ‘The development of integrated health care models inScotland’, International Journal of Integrated Care 1(1) www.ijic.org/
23
73. Welsh Assembly Government (2008) Proposals to Change the Structure of the NHS in Wales. Consultation Paper. Cardiff: Welsh AssemblyGovernment. www.wlga.gov.uk/english/library/nhs-structure-consulation-document/
74. Greer and Trench (2008) op. cit.
75. Greer (2004) op. cit.
76. Greer (2008) op. cit.
77. Harrington and others (2009) op. cit. argue that Greer is wrong to claim that a ‘natural experiment’ is taking place between UK countriesbecause there is common ground in each country in seeking to reduceinequalities in health. This misses the vital distinction that governmentsin each country had common policy objectives (in, for example, reducing hospital waiting times and improving the speed of responses by ambulances to life-threatening emergency calls) but chose differentpolicy instruments as the means of achieving those ends. The differences in policy instruments that Greer highlights are subject of the natural experiment.
78. Jervis (2008) op. cit.
79. Jervis and Plowden (2003) op. cit.
80. Dickinson, H, Glasby, J, Forder, J and Beesley, L (2007) ‘Free personalcare in Scotland: A narrative review’, British Journal of Social Work 37:459–74.
81. BMA Health Policy and Economic Research Unit (2007) Devolution andHealth Policy: A map of divergence within the NHS – 1st annual update, April
2007. London: British Medical Association. www.bma.org.uk/healthcare_policy/nhs_system_reform/ devolution2007.jsp
82. Greer (2004) op. cit.
83. Jervis and Plowden (2003) op. cit.
84. Greer and Trench (2008) op. cit.
85. Ibid.
86. Greer (2004) op. cit.
87. Smith and Babbington (2006) op. cit.; Jervis and Plowden (2003) op. cit.
88. Wanless, D (2003) Review of Health and Social Care in Wales. Cardiff:Welsh Assembly Government.
89. Welsh Assembly Government (2005) Designed for Life. Cardiff: WelshAssembly Government. www.wales.nhs.uk/documents/designed-for-life-e.pdf
90. Welsh Assembly Government (2008) Proposals to Change the Structure ofthe NHS in Wales.http://wales.gov.uk/consultations/healthsocialcare/nhswales/?lang=en
91. Welsh Assembly Government (2009) The Local Health Boards(Constitution, Membership and Procedures) (Wales) Regulations 2009.http://wales.gov.uk/publications/accessinfo/drnewhomepage/healthdrs/Healthdrs2009/lhbregs09/?lang=en
92. Jervis (2008) op. cit.
93. Lang, O (2007) ‘Devolution in practice: health policy. Proceedings from asummit on devolved national health services in the UK’, New Statesman,29 January 2007.
CH
APTER 2
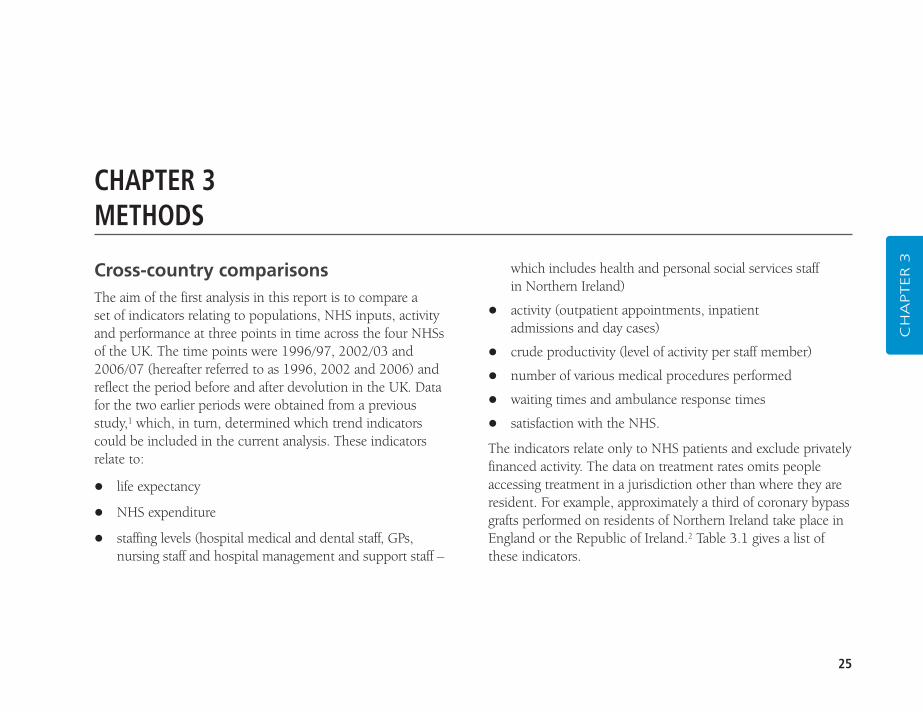
25
CH
APTER 3Cross-country comparisons
The aim of the first analysis in this report is to compare a set of indicators relating to populations, NHS inputs, activityand performance at three points in time across the four NHSsof the UK. The time points were 1996/97, 2002/03 and2006/07 (hereafter referred to as 1996, 2002 and 2006) andreflect the period before and after devolution in the UK. Datafor the two earlier periods were obtained from a previousstudy,1 which, in turn, determined which trend indicatorscould be included in the current analysis. These indicatorsrelate to:
� life expectancy
� NHS expenditure
� staffing levels (hospital medical and dental staff, GPs,nursing staff and hospital management and support staff –
CHAPTER 3METHODS
which includes health and personal social services staff in Northern Ireland)
� activity (outpatient appointments, inpatient admissions and day cases)
� crude productivity (level of activity per staff member)
� number of various medical procedures performed
� waiting times and ambulance response times
� satisfaction with the NHS.
The indicators relate only to NHS patients and exclude privatelyfinanced activity. The data on treatment rates omits peopleaccessing treatment in a jurisdiction other than where they areresident. For example, approximately a third of coronary bypassgrafts performed on residents of Northern Ireland take place inEngland or the Republic of Ireland.2 Table 3.1 gives a list ofthese indicators.
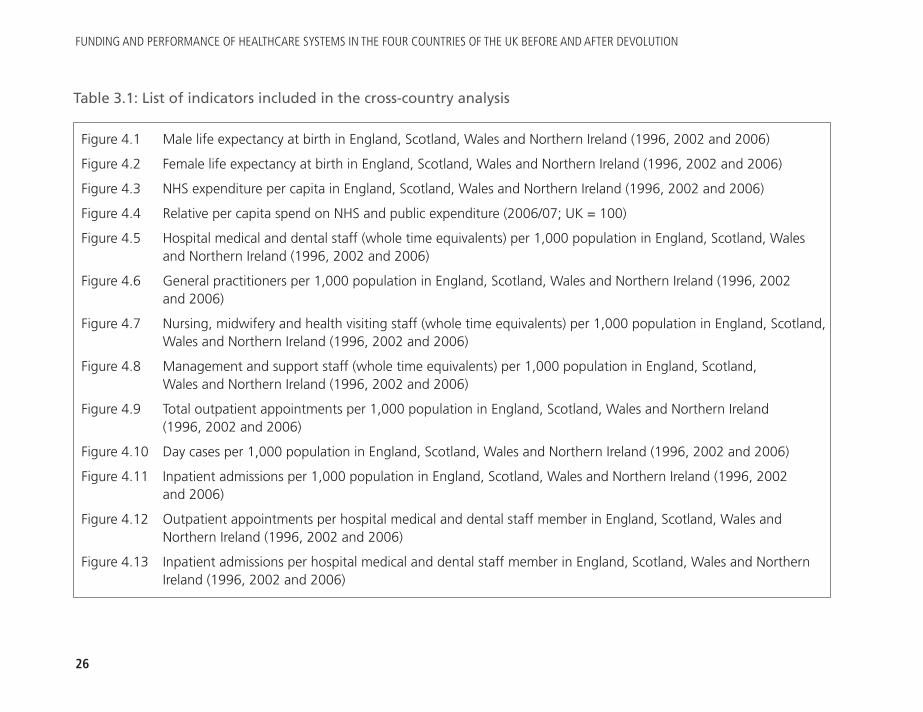
FUNDING AND PERFORMANCE OF HEALTHCARE SYSTEMS IN THE FOUR COUNTRIES OF THE UK BEFORE AND AFTER DEVOLUTION
26
Figure 4.1 Male life expectancy at birth in England, Scotland, Wales and Northern Ireland (1996, 2002 and 2006)
Figure 4.2 Female life expectancy at birth in England, Scotland, Wales and Northern Ireland (1996, 2002 and 2006)
Figure 4.3 NHS expenditure per capita in England, Scotland, Wales and Northern Ireland (1996, 2002 and 2006)
Figure 4.4 Relative per capita spend on NHS and public expenditure (2006/07; UK = 100)
Figure 4.5 Hospital medical and dental staff (whole time equivalents) per 1,000 population in England, Scotland, Wales and Northern Ireland (1996, 2002 and 2006)
Figure 4.6 General practitioners per 1,000 population in England, Scotland, Wales and Northern Ireland (1996, 2002 and 2006)
Figure 4.7 Nursing, midwifery and health visiting staff (whole time equivalents) per 1,000 population in England, Scotland, Wales and Northern Ireland (1996, 2002 and 2006)
Figure 4.8 Management and support staff (whole time equivalents) per 1,000 population in England, Scotland, Wales and Northern Ireland (1996, 2002 and 2006)
Figure 4.9 Total outpatient appointments per 1,000 population in England, Scotland, Wales and Northern Ireland (1996, 2002 and 2006)
Figure 4.10 Day cases per 1,000 population in England, Scotland, Wales and Northern Ireland (1996, 2002 and 2006)
Figure 4.11 Inpatient admissions per 1,000 population in England, Scotland, Wales and Northern Ireland (1996, 2002 and 2006)
Figure 4.12 Outpatient appointments per hospital medical and dental staff member in England, Scotland, Wales and Northern Ireland (1996, 2002 and 2006)
Figure 4.13 Inpatient admissions per hospital medical and dental staff member in England, Scotland, Wales and Northern Ireland (1996, 2002 and 2006)
Table 3.1: List of indicators included in the cross-country analysis
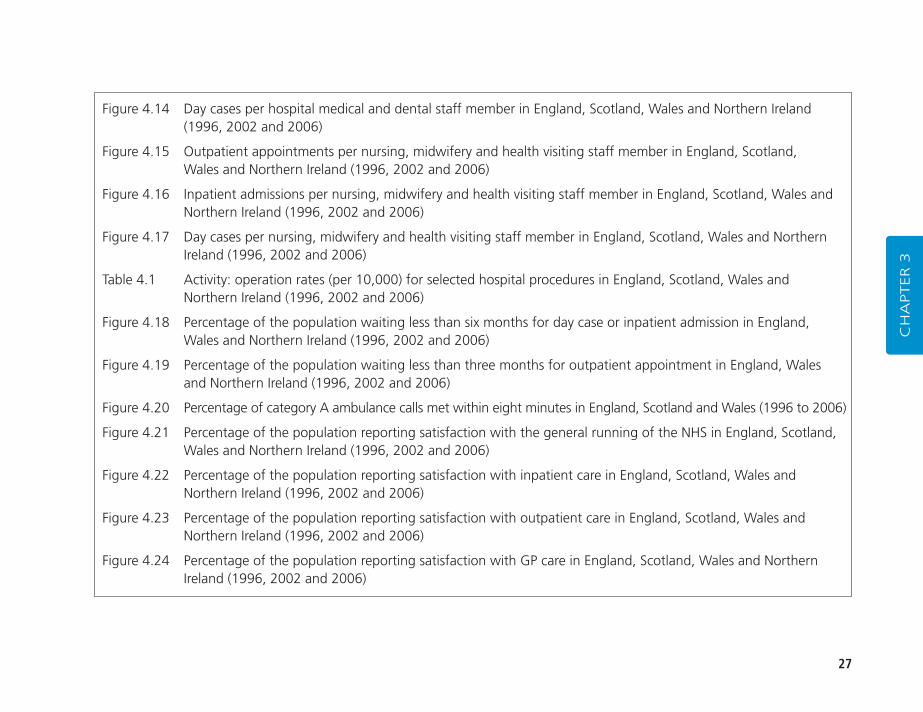
27
CH
APTER 3
Figure 4.14 Day cases per hospital medical and dental staff member in England, Scotland, Wales and Northern Ireland (1996, 2002 and 2006)
Figure 4.15 Outpatient appointments per nursing, midwifery and health visiting staff member in England, Scotland, Wales and Northern Ireland (1996, 2002 and 2006)
Figure 4.16 Inpatient admissions per nursing, midwifery and health visiting staff member in England, Scotland, Wales and Northern Ireland (1996, 2002 and 2006)
Figure 4.17 Day cases per nursing, midwifery and health visiting staff member in England, Scotland, Wales and Northern Ireland (1996, 2002 and 2006)
Table 4.1 Activity: operation rates (per 10,000) for selected hospital procedures in England, Scotland, Wales and Northern Ireland (1996, 2002 and 2006)
Figure 4.18 Percentage of the population waiting less than six months for day case or inpatient admission in England, Wales and Northern Ireland (1996, 2002 and 2006)
Figure 4.19 Percentage of the population waiting less than three months for outpatient appointment in England, Wales and Northern Ireland (1996, 2002 and 2006)
Figure 4.20 Percentage of category A ambulance calls met within eight minutes in England, Scotland and Wales (1996 to 2006)
Figure 4.21 Percentage of the population reporting satisfaction with the general running of the NHS in England, Scotland, Wales and Northern Ireland (1996, 2002 and 2006)
Figure 4.22 Percentage of the population reporting satisfaction with inpatient care in England, Scotland, Wales and Northern Ireland (1996, 2002 and 2006)
Figure 4.23 Percentage of the population reporting satisfaction with outpatient care in England, Scotland, Wales and Northern Ireland (1996, 2002 and 2006)
Figure 4.24 Percentage of the population reporting satisfaction with GP care in England, Scotland, Wales and Northern Ireland (1996, 2002 and 2006)
FUNDING AND PERFORMANCE OF HEALTHCARE SYSTEMS IN THE FOUR COUNTRIES OF THE UK BEFORE AND AFTER DEVOLUTION
28
The Appendix (see page 107) details the definition and sourceof each of the indicators included in the analysis, gives the Tableor Figure to which each indicator relates, and highlights issuessurrounding the comparability of the indicators across thecountries and over time. Much effort was expended to ensurethat the indicators included in the analysis were defined andmeasured in the same way in each of the countries and at eachtime point. However, it is still possible that some differences aredue to variation in the way that particular indicators weredefined in the four countries. If there were significant differencesin the method used to produce an indicator across the countriesor over time, then either the information is not presented or anote is attached highlighting the potential lack of comparability.In particular, policies used before 2007 for suspensions ofpatients on waiting lists in Scotland differed from policies in theother countries, making comparisons difficult. This means thatthe raw data reported by each country are misleading if used forcross-country comparisons.3 Data on Scottish waiting times has,therefore, been excluded from the analyses. There have alsobeen some changes in the definitions of day cases andoutpatients in Wales.
The second aim of the analysis is to determine how differencesin policy across the four constituent parts of the UK sincedevolution have affected the performance of the NHS in each of the countries. Such an analysis is complicated by the factthat the four countries differ not only in terms of the policypath they have chosen, but also in terms of their size,distributions of their populations between cities, towns and sparsely populated rural areas, socio-economiccharacteristics, ethnic composition and morbidity: all of
which may shape the workings of the health system regardlessof the policy path pursued.
To try and untangle the impact of policy on the health servicesfrom the impact of these other influences, the research teamundertook a cross-sectional, comparative analysis of thedevolved countries with the regions of England. A regionalanalysis has two advantages. First, the demographic and socio-economic composition of the North East and North Westregions of England are closer to those of Scotland, Wales andNorthern Ireland than the averages for England: hence,differences observed between these regions and the other threecountries are more likely to be explained by differences inpolicy. Second, this analysis brings out the heterogeneity of the regions of England, which is lost in reporting nationalaverages. Table 3.2 gives a list of indicators included in theregional analysis.
A difficulty with the regional analysis was that some indicatorsare reported for the nine government office regions (GORs),4
while others are reported for the ten strategic health authorities(SHAs). Eight of the ten SHAs in England are geographicallyidentical to the GORs; however, the South East region isdivided into two SHAs – South East Coast and South Central.As the ten SHAs were created in 2006, it is not possible tomake comparisons through time. But there may be scope for future research to develop longitudinal comparisons using the North East, the chosen region in England to comparewith the devolved countries, as the North East region can beidentified for comparative purposes from 1974 to 1996 andfrom 2003.
29
CH
APTER 3
1. Alvarez-Rosete, A, Bevan, G, Mays, N and Dixon, J (2005) ‘Effect ofdiverging policy across the NHS’, BMJ 331: 946–50.
2. Dougal, A (2009) ‘More local surgery needed’, The Journal of NorthernIreland Chest, Heart and Stroke 27: 3.
3. The difference in definition applies to patients who are suspended fromthe waiting list. In England, patients are added back to the list once theybecome available for treatment, but in Scotland these patients were notadded to the list when they became available. See Audit Scotland (2006)Tackling Waiting Times in the NHS in Scotland. Edinburgh: Audit Scotland,p52. www.audit-scotland.gov.uk/utilities/search_report.php?id=237 . In Scotland, until this practice was abolished in 2002, there were twowaiting lists – a ‘true’ and ‘deferred’ waiting list: the latter consisted ofpatients ‘unavailable for admission for a period of time for medical orsocial reasons, or if the patient did not attend on an offered admissiondate’. For those patients, although they could be selected for admission,they did not transfer back to the ‘true’ waiting list. Audit Scotland (2006) Review of the Management of Waiting Lists in Scotland. Edinburgh:
Audit Scotland, p3. www.audit-scotland.gov.uk/utilities/search_report.php?id=325 . But issues remain over ‘hidden’ waiting lists. See forexample, Anonymous (2008) ‘Hidden waiting lists “abolished” ’, Tuesday, 27 May 2008. http://news.bbc.co.uk/1/hi/scotland/7421205.stm .The definitional problems posed by the Scottish practice has been thesubject of commentaries from governments in Northern Ireland andWales. Stewart, T (2006) Comparison of UK Waiting Times Definition.Belfast: Department of Health, Social Services and Public Safety. Eason, C and Stevenson, D (2005) NHS Wales Hospital Waiting Times,30 September 2005. Cardiff: National Assembly for Wales. See alsoGodden, S and Pollock, A (2009) ‘Waiting list and waiting time statistics in Britain: a critical review’ Public Health 123(1): 47–51.www.health.ed.ac.uk/CIPHP/documents/WaitinglistandwaitingtimestatisticsinBritainacriticalreview_Godden_Pollock.pdf
4. The North East, North West, Yorkshire and The Humber, East Midlands, West Midlands, East of England, London, South East andSouth West.
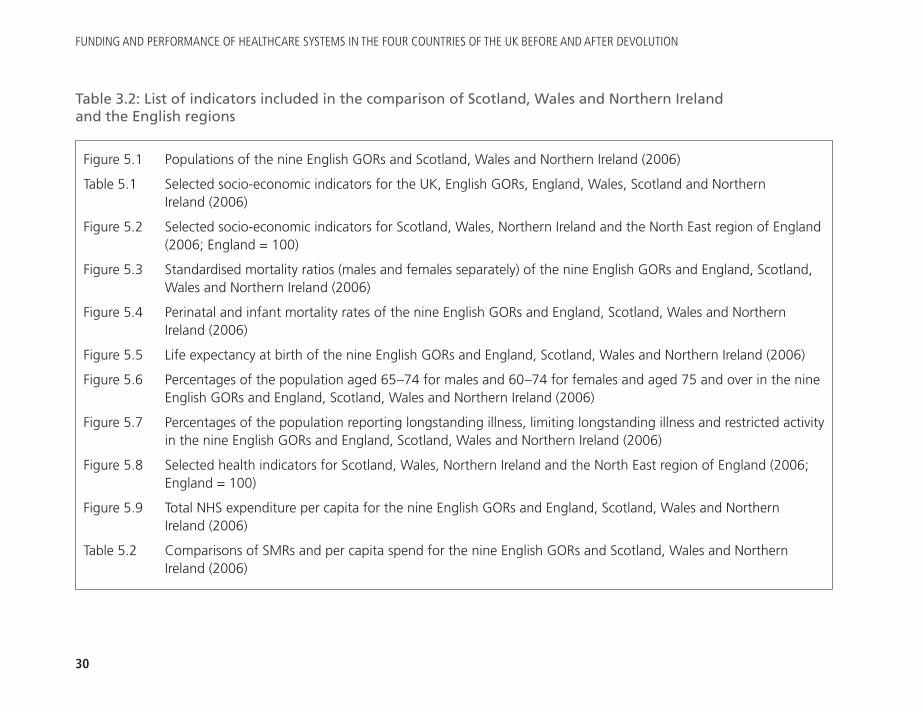
FUNDING AND PERFORMANCE OF HEALTHCARE SYSTEMS IN THE FOUR COUNTRIES OF THE UK BEFORE AND AFTER DEVOLUTION
30
Figure 5.1 Populations of the nine English GORs and Scotland, Wales and Northern Ireland (2006)
Table 5.1 Selected socio-economic indicators for the UK, English GORs, England, Wales, Scotland and Northern Ireland (2006)
Figure 5.2 Selected socio-economic indicators for Scotland, Wales, Northern Ireland and the North East region of England (2006; England = 100)
Figure 5.3 Standardised mortality ratios (males and females separately) of the nine English GORs and England, Scotland, Wales and Northern Ireland (2006)
Figure 5.4 Perinatal and infant mortality rates of the nine English GORs and England, Scotland, Wales and Northern Ireland (2006)
Figure 5.5 Life expectancy at birth of the nine English GORs and England, Scotland, Wales and Northern Ireland (2006)
Figure 5.6 Percentages of the population aged 65–74 for males and 60–74 for females and aged 75 and over in the nine English GORs and England, Scotland, Wales and Northern Ireland (2006)
Figure 5.7 Percentages of the population reporting longstanding illness, limiting longstanding illness and restricted activity in the nine English GORs and England, Scotland, Wales and Northern Ireland (2006)
Figure 5.8 Selected health indicators for Scotland, Wales, Northern Ireland and the North East region of England (2006; England = 100)
Figure 5.9 Total NHS expenditure per capita for the nine English GORs and England, Scotland, Wales and Northern Ireland (2006)
Table 5.2 Comparisons of SMRs and per capita spend for the nine English GORs and Scotland, Wales and Northern Ireland (2006)
Table 3.2: List of indicators included in the comparison of Scotland, Wales and Northern Ireland and the English regions
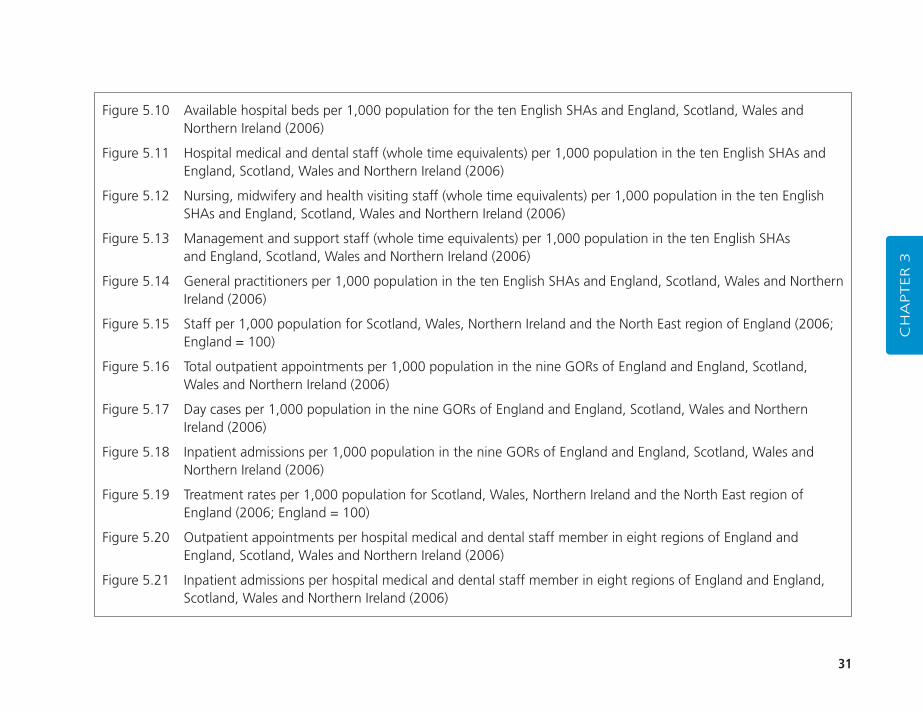
31
Figure 5.10 Available hospital beds per 1,000 population for the ten English SHAs and England, Scotland, Wales and Northern Ireland (2006)
Figure 5.11 Hospital medical and dental staff (whole time equivalents) per 1,000 population in the ten English SHAs and England, Scotland, Wales and Northern Ireland (2006)
Figure 5.12 Nursing, midwifery and health visiting staff (whole time equivalents) per 1,000 population in the ten English SHAs and England, Scotland, Wales and Northern Ireland (2006)
Figure 5.13 Management and support staff (whole time equivalents) per 1,000 population in the ten English SHAs and England, Scotland, Wales and Northern Ireland (2006)
Figure 5.14 General practitioners per 1,000 population in the ten English SHAs and England, Scotland, Wales and Northern Ireland (2006)
Figure 5.15 Staff per 1,000 population for Scotland, Wales, Northern Ireland and the North East region of England (2006; England = 100)
Figure 5.16 Total outpatient appointments per 1,000 population in the nine GORs of England and England, Scotland, Wales and Northern Ireland (2006)
Figure 5.17 Day cases per 1,000 population in the nine GORs of England and England, Scotland, Wales and Northern Ireland (2006)
Figure 5.18 Inpatient admissions per 1,000 population in the nine GORs of England and England, Scotland, Wales and Northern Ireland (2006)
Figure 5.19 Treatment rates per 1,000 population for Scotland, Wales, Northern Ireland and the North East region of England (2006; England = 100)
Figure 5.20 Outpatient appointments per hospital medical and dental staff member in eight regions of England and England, Scotland, Wales and Northern Ireland (2006)
Figure 5.21 Inpatient admissions per hospital medical and dental staff member in eight regions of England and England, Scotland, Wales and Northern Ireland (2006)
CH
APTER 3
FUNDING AND PERFORMANCE OF HEALTHCARE SYSTEMS IN THE FOUR COUNTRIES OF THE UK BEFORE AND AFTER DEVOLUTION
32
Figure 5.22 Day cases per hospital medical and dental staff member in eight regions of England and England, Scotland, Wales and Northern Ireland (2006)
Figure 5.23 Outpatient appointments per nursing, midwifery and health visiting staff member in eight regions of England and England, Scotland, Wales and Northern Ireland (2006)
Figure 5.24 Inpatient admissions per nursing, midwifery and health visiting staff member in eight regions of England and England, Scotland, Wales and Northern Ireland (2006)
Figure 5.25 Day cases per nursing, midwifery and health visiting staff member in eight regions of England and England, Scotland, Wales and Northern Ireland (2006)
Figure 5.26 Percentage waiting more than 13 weeks for inpatient admission or day case for the ten English SHAs, England, Wales and Northern Ireland (March 2008)
Table 5.3 Numbers and percentage of the population waiting less than 13 weeks for inpatient or day case admission or outpatient appointment in the ten English SHAs, England, Wales and Northern Ireland (March 2008)
Table 5.4 Percentage of the population waiting less than six weeks, six to 12 weeks and 12 weeks or more for an inpatient admission or day case or outpatient appointment in the ten SHAs of England (March 2006)
Box 5.1 Indicators for which Scotland, Wales and Northern Ireland are outliers as compared with English regions (2006)
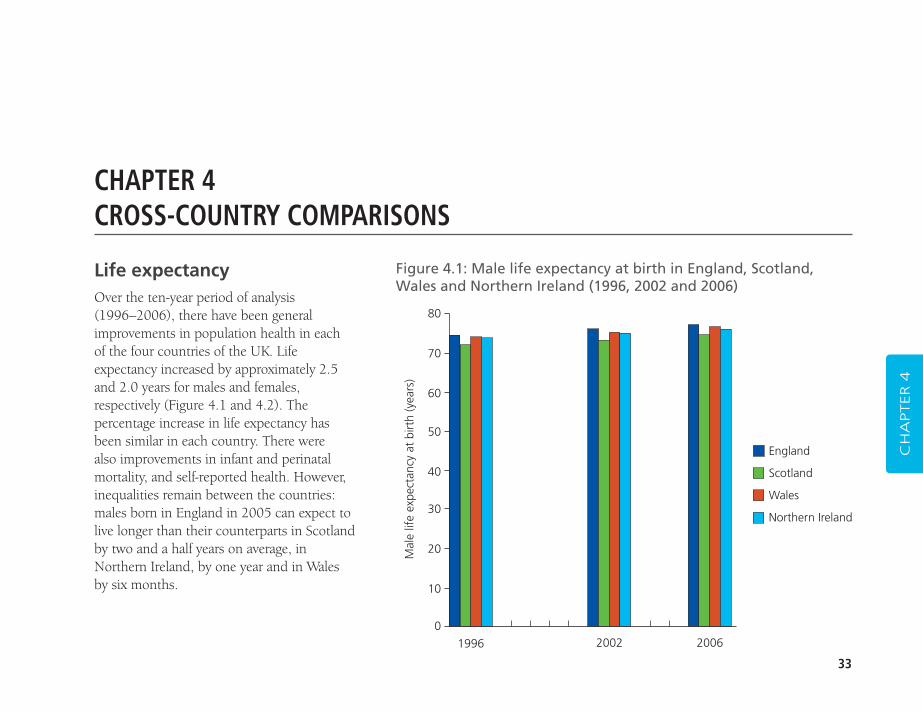
33
CH
APTER 4
CHAPTER 4CROSS-COUNTRY COMPARISONS
Figure 4.1: Male life expectancy at birth in England, Scotland,Wales and Northern Ireland (1996, 2002 and 2006)
80
70
60
50
40
30
20
10
0
Mal
e lif
e ex
pect
ancy
at
birt
h (y
ears
)
1996 2002 2006
England
Scotland
Wales
Northern Ireland
Life expectancyOver the ten-year period of analysis (1996–2006), there have been generalimprovements in population health in each of the four countries of the UK. Lifeexpectancy increased by approximately 2.5and 2.0 years for males and females,respectively (Figure 4.1 and 4.2). Thepercentage increase in life expectancy hasbeen similar in each country. There were also improvements in infant and perinatalmortality, and self-reported health. However,inequalities remain between the countries:males born in England in 2005 can expect tolive longer than their counterparts in Scotlandby two and a half years on average, inNorthern Ireland, by one year and in Wales by six months.
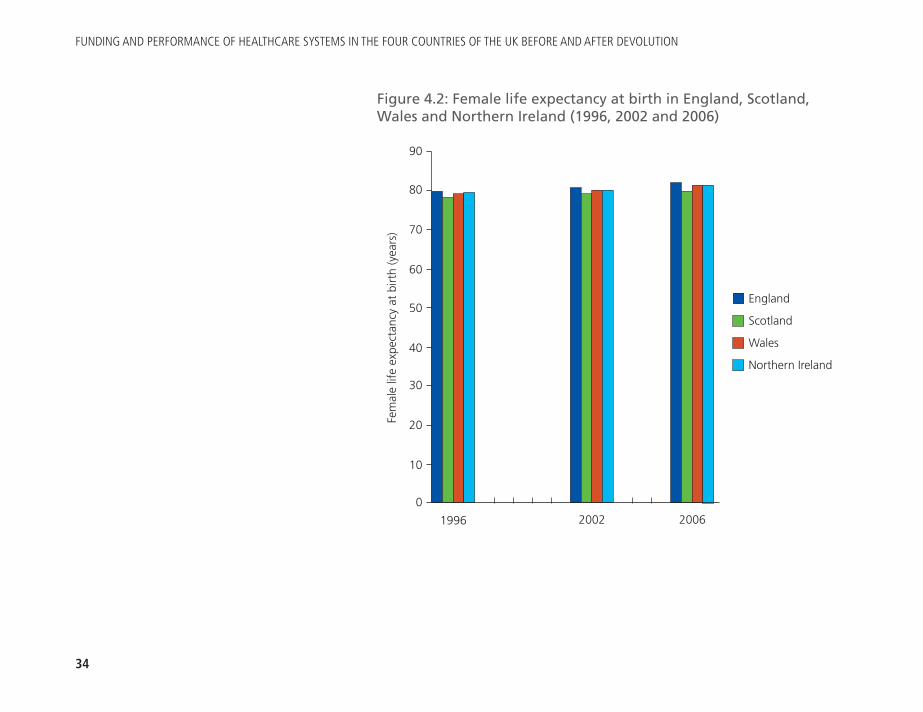
FUNDING AND PERFORMANCE OF HEALTHCARE SYSTEMS IN THE FOUR COUNTRIES OF THE UK BEFORE AND AFTER DEVOLUTION
34
Figure 4.2: Female life expectancy at birth in England, Scotland,Wales and Northern Ireland (1996, 2002 and 2006)
90
80
70
60
50
40
30
20
10
0
Fem
ale
life
expe
ctan
cy a
t bi
rth
(yea
rs)
1996 2002 2006
England
Scotland
Wales
Northern Ireland
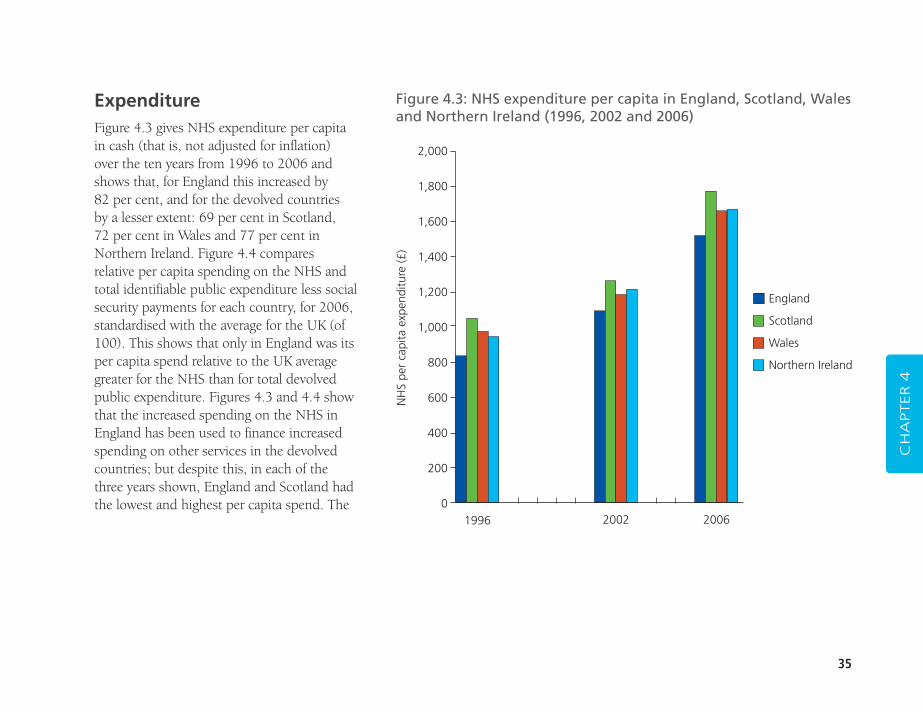
35
CH
APTER 4
Figure 4.3: NHS expenditure per capita in England, Scotland, Walesand Northern Ireland (1996, 2002 and 2006)
2,000
1,800
1,600
1,400
1,200
1,000
800
600
400
200
0
NH
S pe
r ca
pita
exp
endi
ture
(£)
1996 2002 2006
England
Scotland
Wales
Northern Ireland
ExpenditureFigure 4.3 gives NHS expenditure per capitain cash (that is, not adjusted for inflation)over the ten years from 1996 to 2006 andshows that, for England this increased by 82 per cent, and for the devolved countries by a lesser extent: 69 per cent in Scotland, 72 per cent in Wales and 77 per cent inNorthern Ireland. Figure 4.4 comparesrelative per capita spending on the NHS andtotal identifiable public expenditure less socialsecurity payments for each country, for 2006,standardised with the average for the UK (of100). This shows that only in England was itsper capita spend relative to the UK averagegreater for the NHS than for total devolvedpublic expenditure. Figures 4.3 and 4.4 showthat the increased spending on the NHS inEngland has been used to finance increasedspending on other services in the devolvedcountries; but despite this, in each of thethree years shown, England and Scotland hadthe lowest and highest per capita spend. The
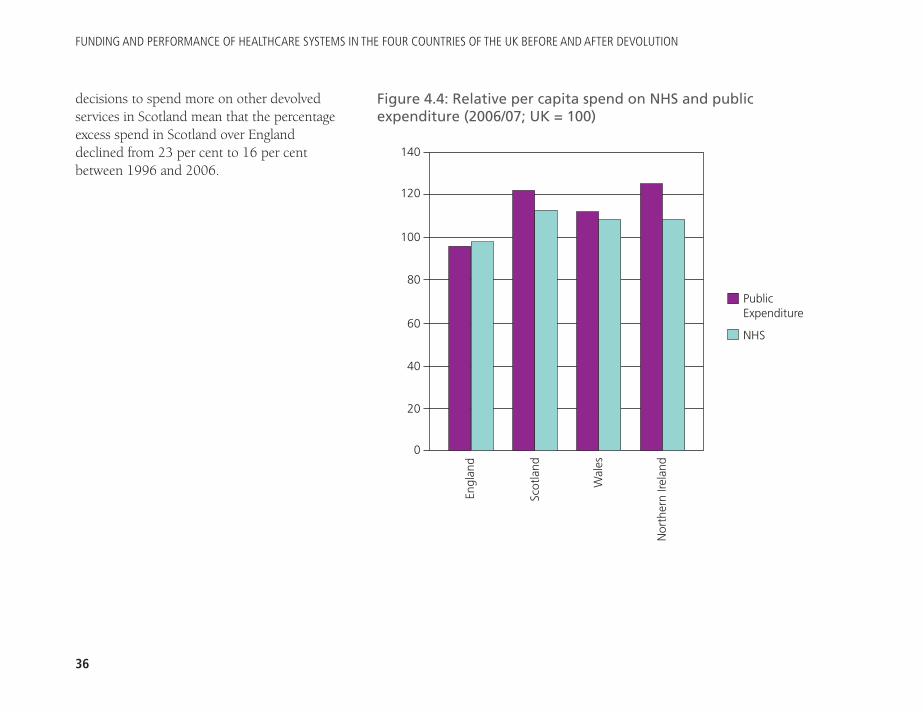
FUNDING AND PERFORMANCE OF HEALTHCARE SYSTEMS IN THE FOUR COUNTRIES OF THE UK BEFORE AND AFTER DEVOLUTION
36
decisions to spend more on other devolvedservices in Scotland mean that the percentageexcess spend in Scotland over Englanddeclined from 23 per cent to 16 per centbetween 1996 and 2006.
140
120
100
80
60
40
20
0
PublicExpenditure
NHS
Engl
and
Scot
land
Wal
es
Nor
ther
n Ire
land
Figure 4.4: Relative per capita spend on NHS and publicexpenditure (2006/07; UK = 100)
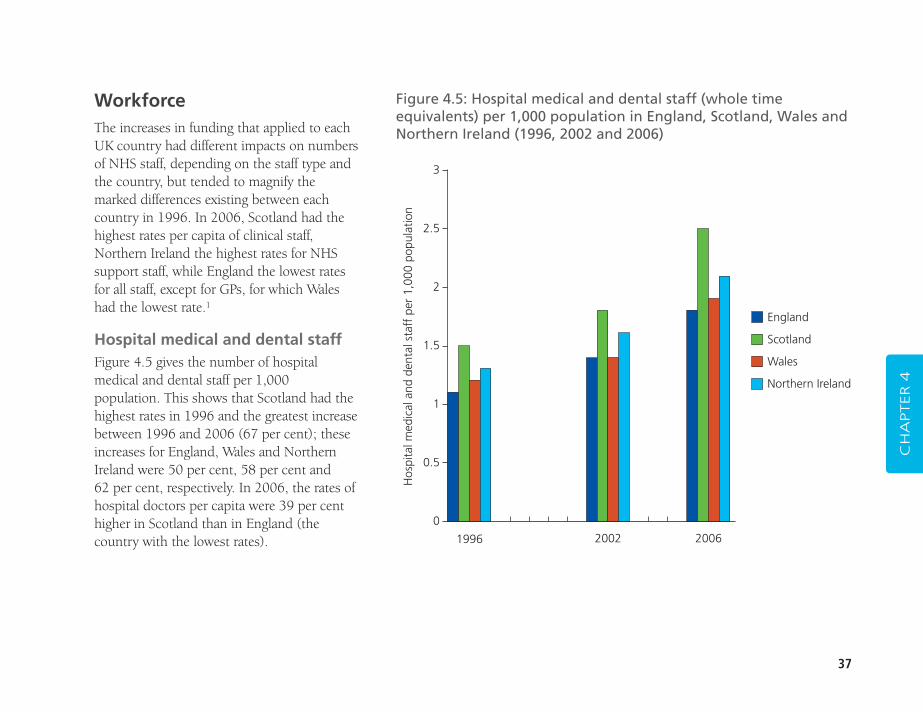
37
WorkforceThe increases in funding that applied to eachUK country had different impacts on numbersof NHS staff, depending on the staff type andthe country, but tended to magnify themarked differences existing between eachcountry in 1996. In 2006, Scotland had thehighest rates per capita of clinical staff,Northern Ireland the highest rates for NHSsupport staff, while England the lowest ratesfor all staff, except for GPs, for which Waleshad the lowest rate.1
Hospital medical and dental staffFigure 4.5 gives the number of hospitalmedical and dental staff per 1,000population. This shows that Scotland had thehighest rates in 1996 and the greatest increasebetween 1996 and 2006 (67 per cent); theseincreases for England, Wales and NorthernIreland were 50 per cent, 58 per cent and 62 per cent, respectively. In 2006, the rates ofhospital doctors per capita were 39 per centhigher in Scotland than in England (thecountry with the lowest rates).
CH
APTER 4
Figure 4.5: Hospital medical and dental staff (whole timeequivalents) per 1,000 population in England, Scotland, Wales andNorthern Ireland (1996, 2002 and 2006)
3
2.5
2
1.5
1
0.5
0
Hos
pita
l med
ical
and
den
tal s
taff
per
1,0
00 p
opul
atio
n
1996 2002 2006
England
Scotland
Wales
Northern Ireland
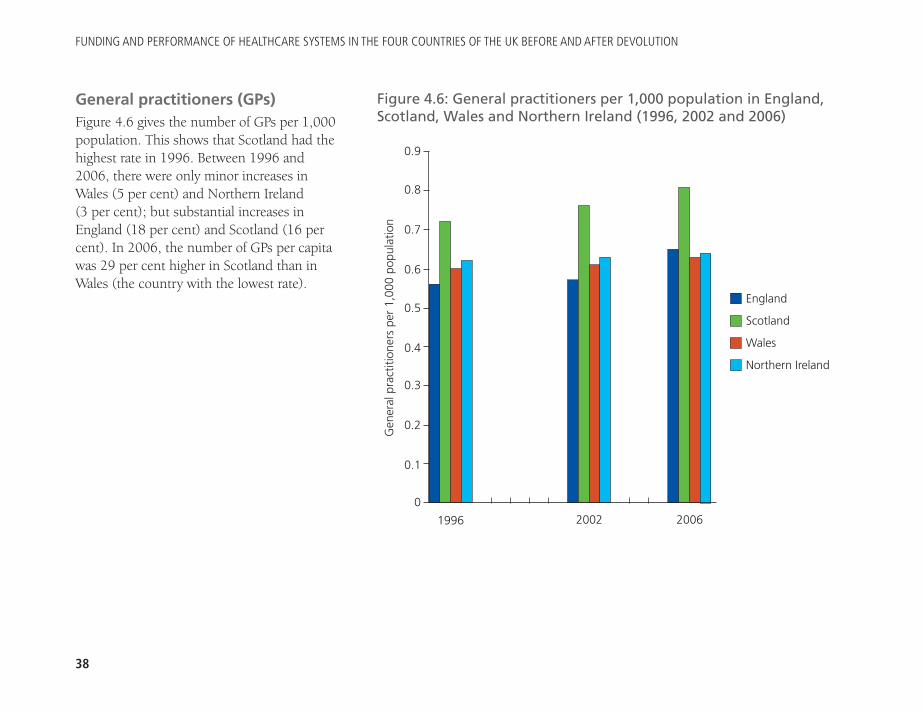
FUNDING AND PERFORMANCE OF HEALTHCARE SYSTEMS IN THE FOUR COUNTRIES OF THE UK BEFORE AND AFTER DEVOLUTION
38
General practitioners (GPs)Figure 4.6 gives the number of GPs per 1,000population. This shows that Scotland had thehighest rate in 1996. Between 1996 and2006, there were only minor increases inWales (5 per cent) and Northern Ireland (3 per cent); but substantial increases inEngland (18 per cent) and Scotland (16 percent). In 2006, the number of GPs per capitawas 29 per cent higher in Scotland than inWales (the country with the lowest rate).
Figure 4.6: General practitioners per 1,000 population in England,Scotland, Wales and Northern Ireland (1996, 2002 and 2006)
0.9
0.8
0.7
0.6
0.5
0.4
0.3
0.2
0.1
0
Gen
eral
pra
ctiti
oner
s pe
r 1,
000
popu
latio
n
1996 2002 2006
England
Scotland
Wales
Northern Ireland
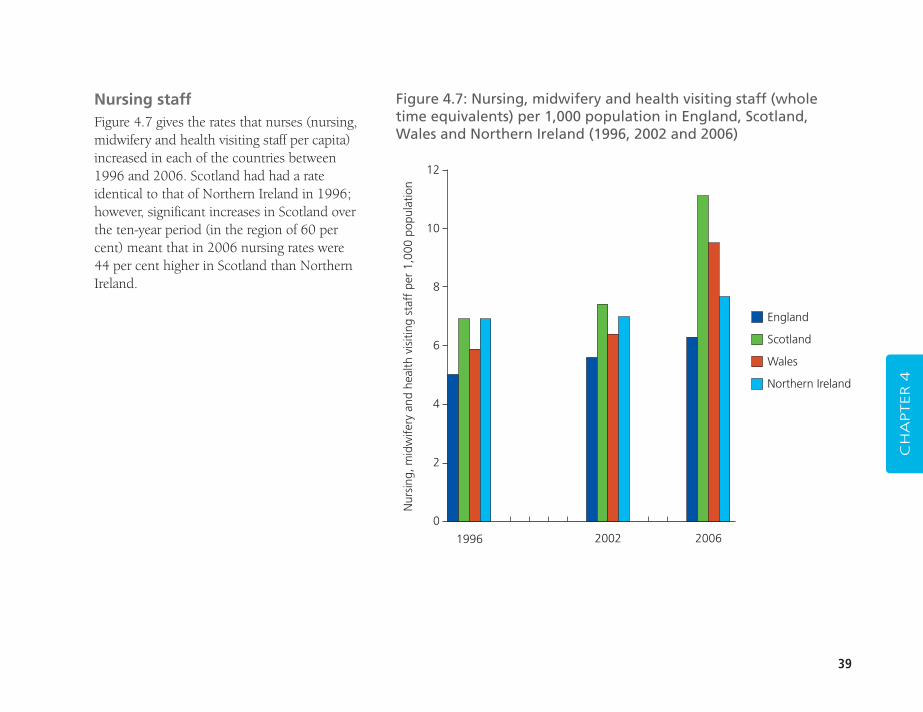
39
Nursing staffFigure 4.7 gives the rates that nurses (nursing,midwifery and health visiting staff per capita)increased in each of the countries between1996 and 2006. Scotland had had a rateidentical to that of Northern Ireland in 1996;however, significant increases in Scotland overthe ten-year period (in the region of 60 percent) meant that in 2006 nursing rates were44 per cent higher in Scotland than NorthernIreland.
CH
APTER 4
Figure 4.7: Nursing, midwifery and health visiting staff (wholetime equivalents) per 1,000 population in England, Scotland,Wales and Northern Ireland (1996, 2002 and 2006)
12
10
8
6
4
2
0
Nur
sing
, mid
wife
ry a
nd h
ealth
vis
iting
sta
ff p
er 1
,000
pop
ulat
ion
1996 2002 2006
England
Scotland
Wales
Northern Ireland
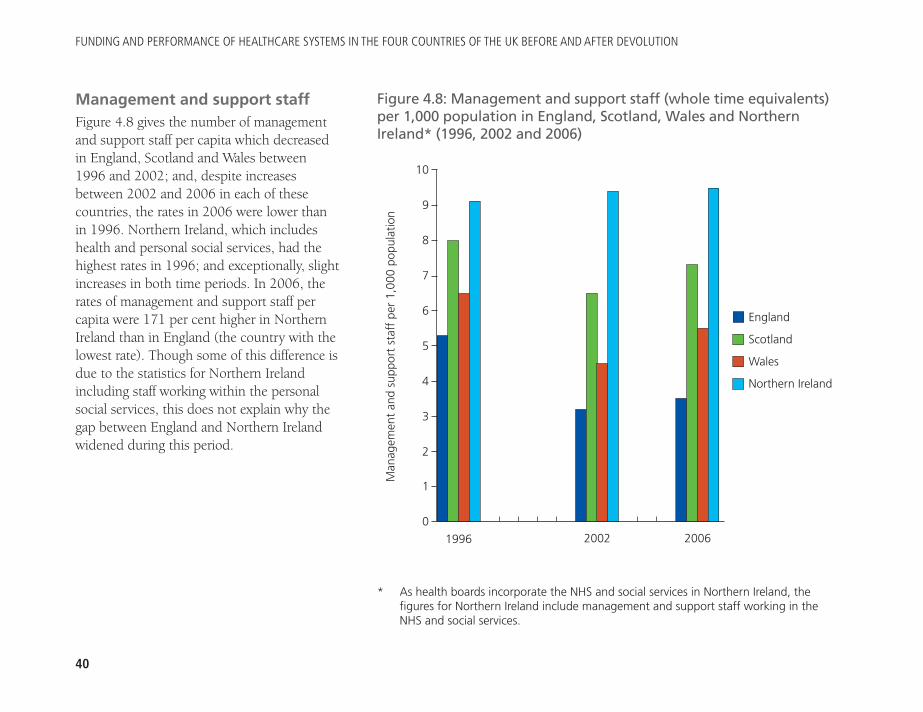
FUNDING AND PERFORMANCE OF HEALTHCARE SYSTEMS IN THE FOUR COUNTRIES OF THE UK BEFORE AND AFTER DEVOLUTION
40
Management and support staffFigure 4.8 gives the number of managementand support staff per capita which decreasedin England, Scotland and Wales between1996 and 2002; and, despite increasesbetween 2002 and 2006 in each of thesecountries, the rates in 2006 were lower thanin 1996. Northern Ireland, which includeshealth and personal social services, had thehighest rates in 1996; and exceptionally, slightincreases in both time periods. In 2006, therates of management and support staff percapita were 171 per cent higher in NorthernIreland than in England (the country with thelowest rate). Though some of this difference isdue to the statistics for Northern Irelandincluding staff working within the personalsocial services, this does not explain why thegap between England and Northern Irelandwidened during this period.
Figure 4.8: Management and support staff (whole time equivalents)per 1,000 population in England, Scotland, Wales and NorthernIreland* (1996, 2002 and 2006)
10
9
8
7
6
5
4
3
2
1
0
Man
agem
ent
and
supp
ort
staf
f pe
r 1,
000
popu
latio
n
1996 2002 2006
England
Scotland
Wales
Northern Ireland
* As health boards incorporate the NHS and social services in Northern Ireland, thefigures for Northern Ireland include management and support staff working in theNHS and social services.
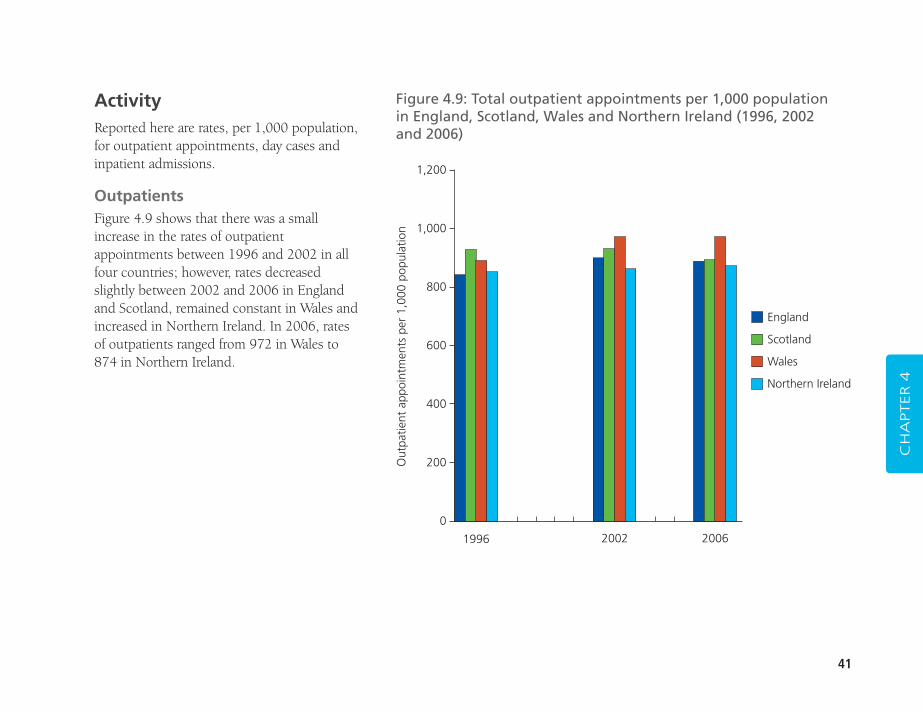
41
ActivityReported here are rates, per 1,000 population,for outpatient appointments, day cases andinpatient admissions.
OutpatientsFigure 4.9 shows that there was a smallincrease in the rates of outpatientappointments between 1996 and 2002 in allfour countries; however, rates decreasedslightly between 2002 and 2006 in Englandand Scotland, remained constant in Wales andincreased in Northern Ireland. In 2006, ratesof outpatients ranged from 972 in Wales to874 in Northern Ireland.
CH
APTER 4
Figure 4.9: Total outpatient appointments per 1,000 population in England, Scotland, Wales and Northern Ireland (1996, 2002 and 2006)
Out
patie
nt a
ppoi
ntm
ents
per
1,0
00 p
opul
atio
n
1996 2002 2006
England
Scotland
Wales
Northern Ireland
1,200
1,000
800
600
400
200
0
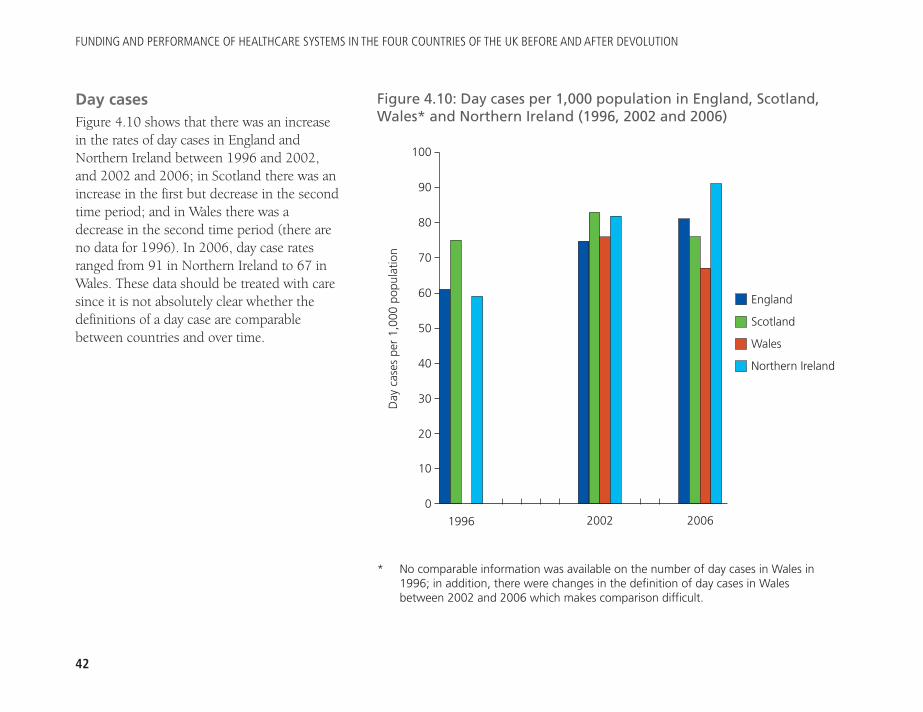
FUNDING AND PERFORMANCE OF HEALTHCARE SYSTEMS IN THE FOUR COUNTRIES OF THE UK BEFORE AND AFTER DEVOLUTION
42
Day casesFigure 4.10 shows that there was an increasein the rates of day cases in England andNorthern Ireland between 1996 and 2002,and 2002 and 2006; in Scotland there was anincrease in the first but decrease in the secondtime period; and in Wales there was adecrease in the second time period (there areno data for 1996). In 2006, day case ratesranged from 91 in Northern Ireland to 67 inWales. These data should be treated with caresince it is not absolutely clear whether thedefinitions of a day case are comparablebetween countries and over time.
Figure 4.10: Day cases per 1,000 population in England, Scotland,Wales* and Northern Ireland (1996, 2002 and 2006)
100
90
80
70
60
50
40
30
20
10
0
Day
cas
es p
er 1
,000
pop
ulat
ion
1996 2002 2006
England
Scotland
Wales
Northern Ireland
* No comparable information was available on the number of day cases in Wales in1996; in addition, there were changes in the definition of day cases in Walesbetween 2002 and 2006 which makes comparison difficult.
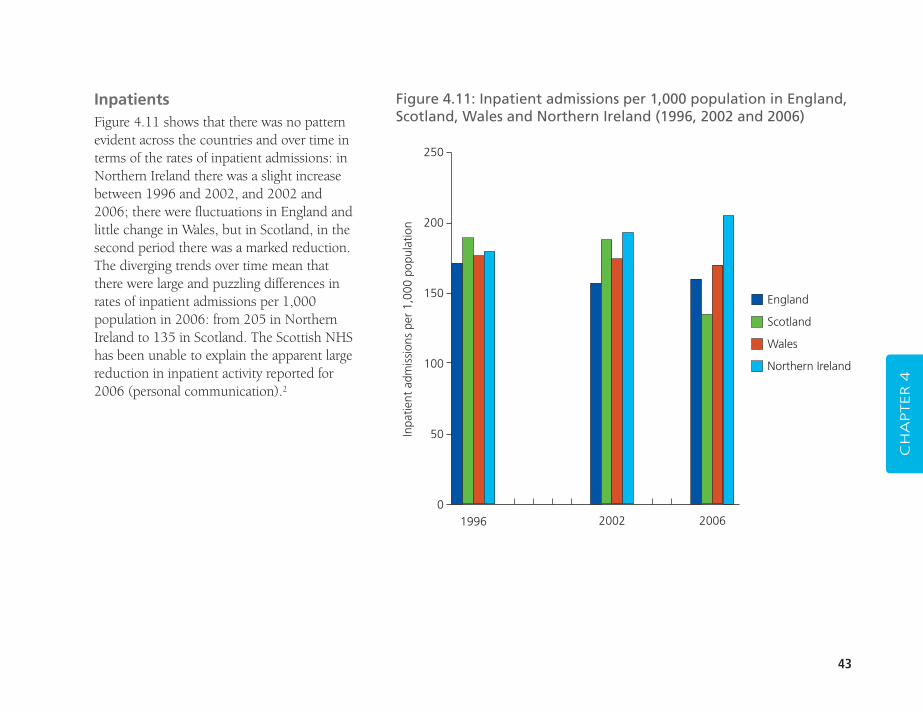
43
InpatientsFigure 4.11 shows that there was no patternevident across the countries and over time interms of the rates of inpatient admissions: inNorthern Ireland there was a slight increasebetween 1996 and 2002, and 2002 and2006; there were fluctuations in England andlittle change in Wales, but in Scotland, in thesecond period there was a marked reduction.The diverging trends over time mean thatthere were large and puzzling differences inrates of inpatient admissions per 1,000population in 2006: from 205 in NorthernIreland to 135 in Scotland. The Scottish NHShas been unable to explain the apparent largereduction in inpatient activity reported for2006 (personal communication).2
CH
APTER 4
Figure 4.11: Inpatient admissions per 1,000 population in England,Scotland, Wales and Northern Ireland (1996, 2002 and 2006)
250
200
150
100
50
01996 2002 2006
England
Scotland
Wales
Northern Ireland
Inpa
tient
adm
issi
ons
per
1,00
0 po
pula
tion
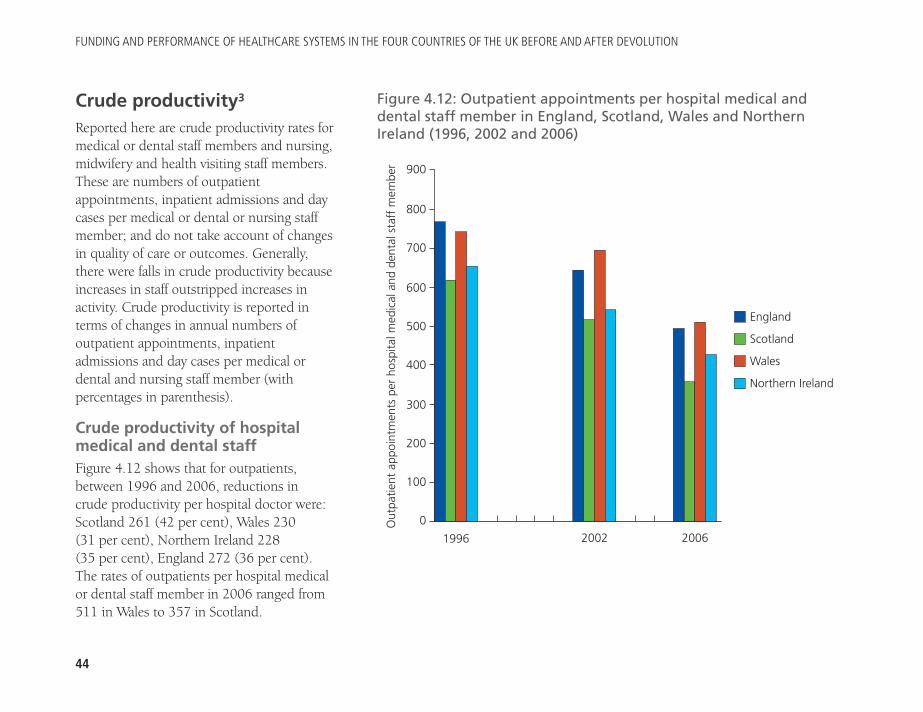
FUNDING AND PERFORMANCE OF HEALTHCARE SYSTEMS IN THE FOUR COUNTRIES OF THE UK BEFORE AND AFTER DEVOLUTION
44
Crude productivity3
Reported here are crude productivity rates formedical or dental staff members and nursing,midwifery and health visiting staff members.These are numbers of outpatientappointments, inpatient admissions and daycases per medical or dental or nursing staffmember; and do not take account of changesin quality of care or outcomes. Generally,there were falls in crude productivity becauseincreases in staff outstripped increases inactivity. Crude productivity is reported interms of changes in annual numbers ofoutpatient appointments, inpatientadmissions and day cases per medical ordental and nursing staff member (withpercentages in parenthesis).
Crude productivity of hospitalmedical and dental staffFigure 4.12 shows that for outpatients,between 1996 and 2006, reductions in crude productivity per hospital doctor were:Scotland 261 (42 per cent), Wales 230 (31 per cent), Northern Ireland 228 (35 per cent), England 272 (36 per cent). The rates of outpatients per hospital medicalor dental staff member in 2006 ranged from511 in Wales to 357 in Scotland.
Figure 4.12: Outpatient appointments per hospital medical anddental staff member in England, Scotland, Wales and NorthernIreland (1996, 2002 and 2006)
900
800
700
600
500
400
300
200
100
0Out
patie
nt a
ppoi
ntm
ents
per
hos
pita
l med
ical
and
den
tal s
taff
mem
ber
1996 2002 2006
England
Scotland
Wales
Northern Ireland
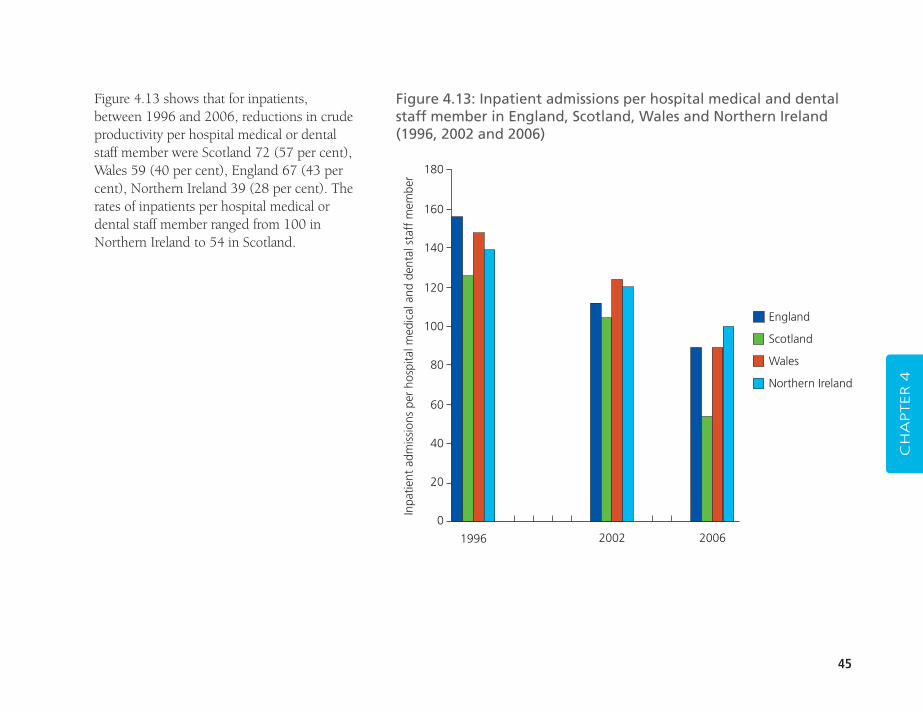
45
Figure 4.13 shows that for inpatients,between 1996 and 2006, reductions in crudeproductivity per hospital medical or dentalstaff member were Scotland 72 (57 per cent),Wales 59 (40 per cent), England 67 (43 percent), Northern Ireland 39 (28 per cent). Therates of inpatients per hospital medical ordental staff member ranged from 100 inNorthern Ireland to 54 in Scotland.
CH
APTER 4
Figure 4.13: Inpatient admissions per hospital medical and dentalstaff member in England, Scotland, Wales and Northern Ireland (1996, 2002 and 2006)
180
160
140
120
100
80
60
40
20
0
Inpa
tient
adm
issi
ons
per
hosp
ital m
edic
al a
nd d
enta
l sta
ff m
embe
r
1996 2002 2006
England
Scotland
Wales
Northern Ireland
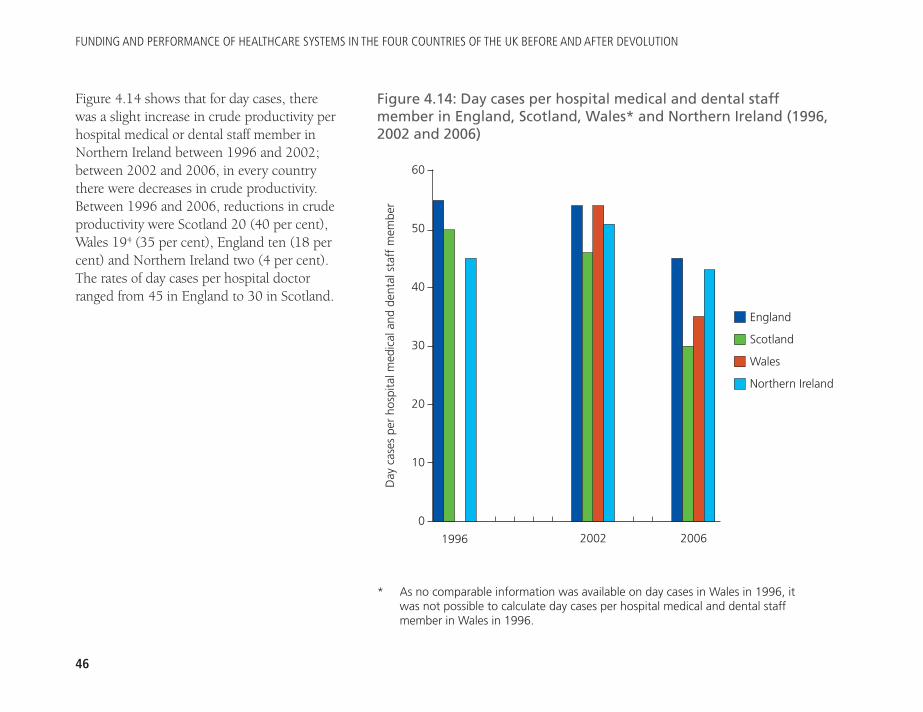
FUNDING AND PERFORMANCE OF HEALTHCARE SYSTEMS IN THE FOUR COUNTRIES OF THE UK BEFORE AND AFTER DEVOLUTION
46
Figure 4.14 shows that for day cases, therewas a slight increase in crude productivity perhospital medical or dental staff member inNorthern Ireland between 1996 and 2002;between 2002 and 2006, in every countrythere were decreases in crude productivity.Between 1996 and 2006, reductions in crudeproductivity were Scotland 20 (40 per cent),Wales 194 (35 per cent), England ten (18 percent) and Northern Ireland two (4 per cent).The rates of day cases per hospital doctorranged from 45 in England to 30 in Scotland.
Figure 4.14: Day cases per hospital medical and dental staffmember in England, Scotland, Wales* and Northern Ireland (1996,2002 and 2006)
60
50
40
30
20
10
0
1996 2002 2006
England
Scotland
Wales
Northern IrelandD
ay c
ases
per
hos
pita
l med
ical
and
den
tal s
taff
mem
ber
* As no comparable information was available on day cases in Wales in 1996, itwas not possible to calculate day cases per hospital medical and dental staffmember in Wales in 1996.
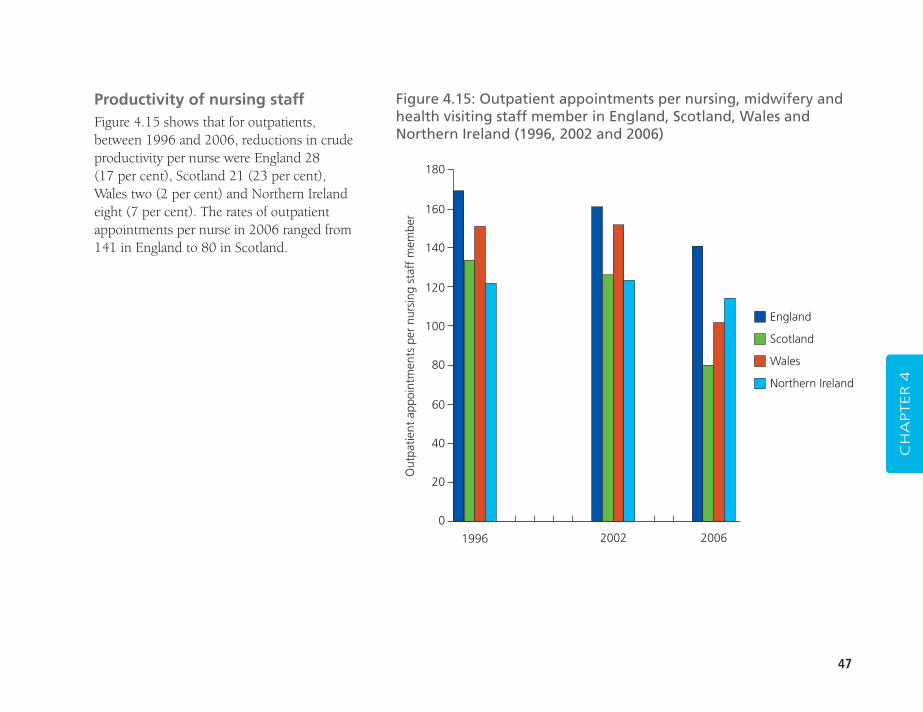
47
Productivity of nursing staffFigure 4.15 shows that for outpatients,between 1996 and 2006, reductions in crudeproductivity per nurse were England 28 (17 per cent), Scotland 21 (23 per cent),Wales two (2 per cent) and Northern Irelandeight (7 per cent). The rates of outpatientappointments per nurse in 2006 ranged from141 in England to 80 in Scotland.
CH
APTER 4
Figure 4.15: Outpatient appointments per nursing, midwifery andhealth visiting staff member in England, Scotland, Wales andNorthern Ireland (1996, 2002 and 2006)
180
160
140
120
100
80
60
40
20
0
Out
patie
nt a
ppoi
ntm
ents
per
nur
sing
sta
ff m
embe
r
1996 2002 2006
England
Scotland
Wales
Northern Ireland
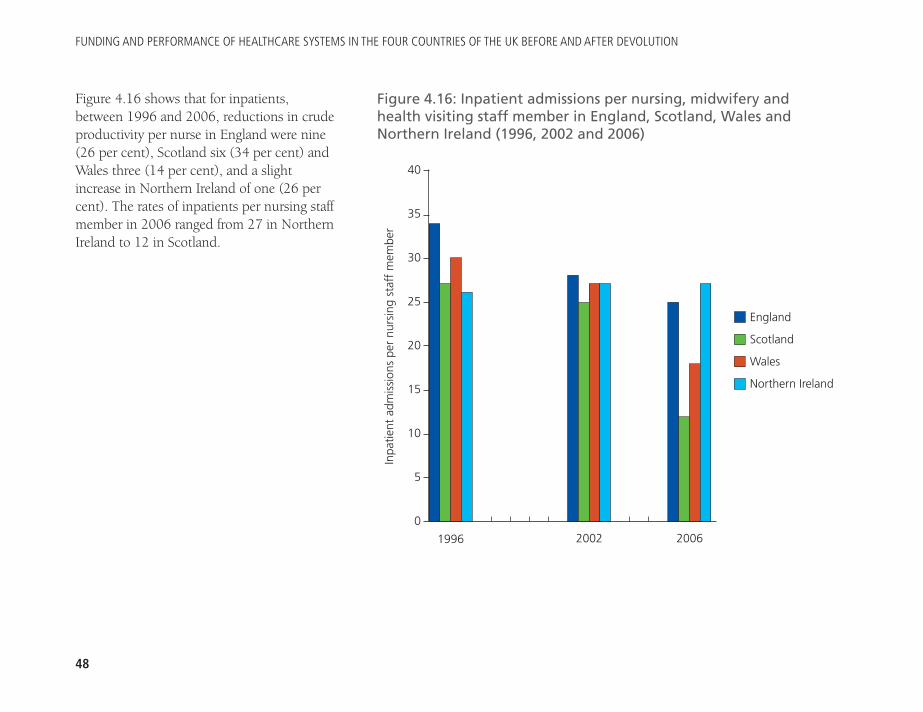
FUNDING AND PERFORMANCE OF HEALTHCARE SYSTEMS IN THE FOUR COUNTRIES OF THE UK BEFORE AND AFTER DEVOLUTION
48
Figure 4.16 shows that for inpatients,between 1996 and 2006, reductions in crudeproductivity per nurse in England were nine(26 per cent), Scotland six (34 per cent) andWales three (14 per cent), and a slightincrease in Northern Ireland of one (26 percent). The rates of inpatients per nursing staffmember in 2006 ranged from 27 in NorthernIreland to 12 in Scotland.
Figure 4.16: Inpatient admissions per nursing, midwifery andhealth visiting staff member in England, Scotland, Wales andNorthern Ireland (1996, 2002 and 2006)
40
35
30
25
20
15
10
5
0
Inpa
tient
adm
issi
ons
per
nurs
ing
staf
f m
embe
r
1996 2002 2006
England
Scotland
Wales
Northern Ireland
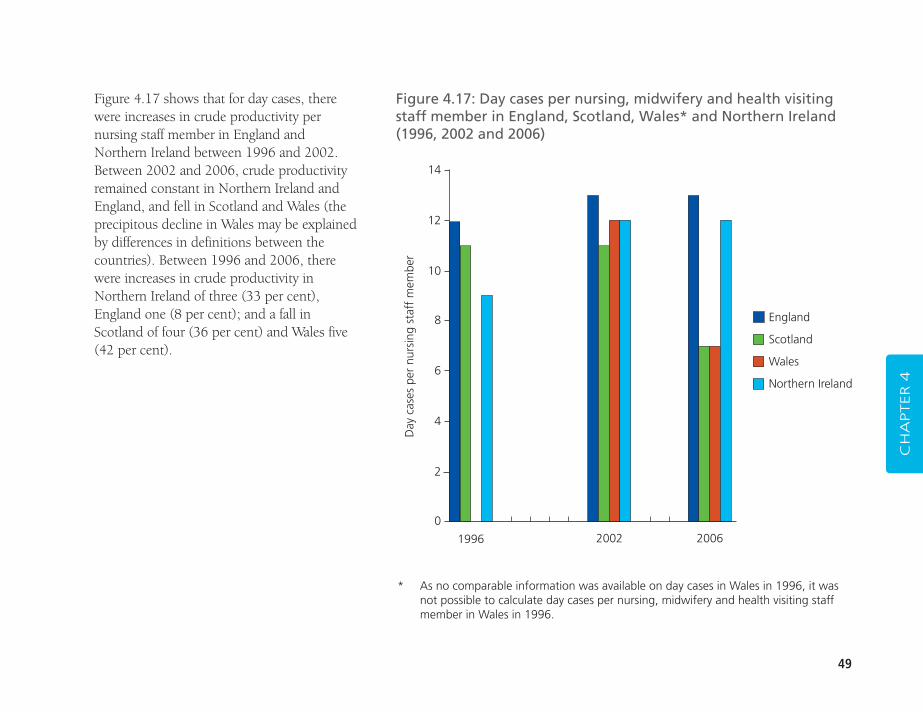
49
CH
APTER 4
Figure 4.17 shows that for day cases, therewere increases in crude productivity pernursing staff member in England andNorthern Ireland between 1996 and 2002.Between 2002 and 2006, crude productivityremained constant in Northern Ireland andEngland, and fell in Scotland and Wales (theprecipitous decline in Wales may be explainedby differences in definitions between thecountries). Between 1996 and 2006, therewere increases in crude productivity inNorthern Ireland of three (33 per cent),England one (8 per cent); and a fall inScotland of four (36 per cent) and Wales five(42 per cent).
Figure 4.17: Day cases per nursing, midwifery and health visitingstaff member in England, Scotland, Wales* and Northern Ireland(1996, 2002 and 2006)
14
12
10
8
6
4
2
0
Day
cas
es p
er n
ursi
ng s
taff
mem
ber
1996 2002 2006
England
Scotland
Wales
Northern Ireland
* As no comparable information was available on day cases in Wales in 1996, it wasnot possible to calculate day cases per nursing, midwifery and health visiting staffmember in Wales in 1996.
FUNDING AND PERFORMANCE OF HEALTHCARE SYSTEMS IN THE FOUR COUNTRIES OF THE UK BEFORE AND AFTER DEVOLUTION
50
� hip replacement
� coronary artery bypass graft.
In general, operation rates have increased through time, but there were reductions for procedures for inguinal hernia(England and Wales); varicose vein (Scotland) and coronary artery bypass grafting (CABG) (Northern Ireland).Although the most striking difference in terms of the reported operation rates is the comparatively low rates inNorthern Ireland in 2006, these statistics are complicated by procedures being provided in the Republic of Ireland (as for CABG surgery).
ProceduresReported here are operation rates per 10,000 for selectedcommon procedures (Table 4.1):
� extracapsular extraction of lens
� prosthesis of lens
� excision of gall bladder
� inguinal hernia
� total prosthetic replacement of knee joint
� varicose vein operation
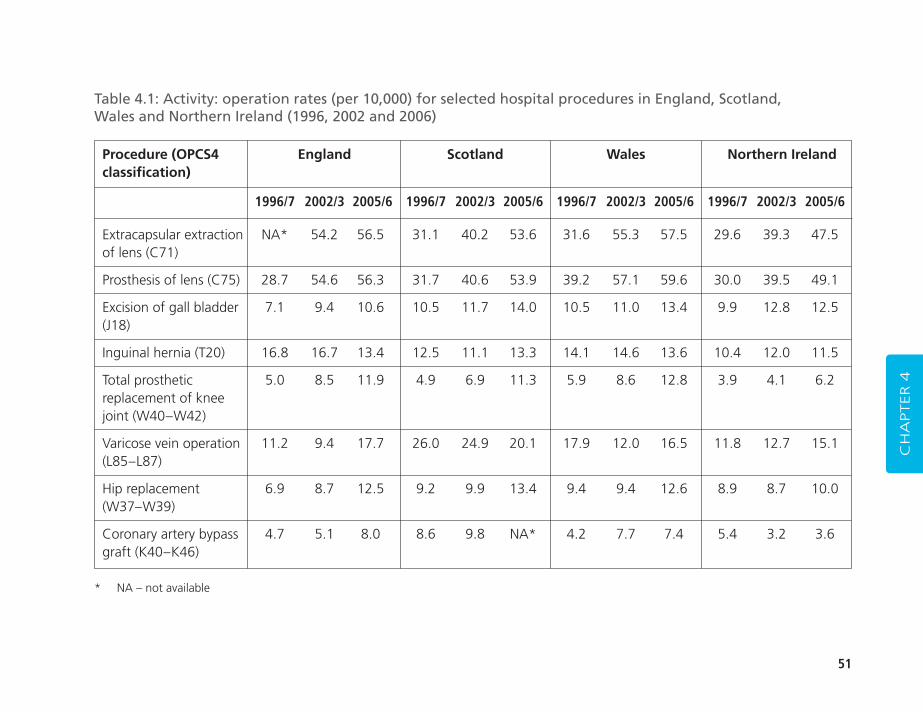
51
CH
APTER 4
Procedure (OPCS4 England Scotland Wales Northern Irelandclassification)
1996/7 2002/3 2005/6 1996/7 2002/3 2005/6 1996/7 2002/3 2005/6 1996/7 2002/3 2005/6
Extracapsular extraction NA* 54.2 56.5 31.1 40.2 53.6 31.6 55.3 57.5 29.6 39.3 47.5of lens (C71)
Prosthesis of lens (C75) 28.7 54.6 56.3 31.7 40.6 53.9 39.2 57.1 59.6 30.0 39.5 49.1
Excision of gall bladder 7.1 9.4 10.6 10.5 11.7 14.0 10.5 11.0 13.4 9.9 12.8 12.5(J18)
Inguinal hernia (T20) 16.8 16.7 13.4 12.5 11.1 13.3 14.1 14.6 13.6 10.4 12.0 11.5
Total prosthetic 5.0 8.5 11.9 4.9 6.9 11.3 5.9 8.6 12.8 3.9 4.1 6.2replacement of knee joint (W40–W42)
Varicose vein operation 11.2 9.4 17.7 26.0 24.9 20.1 17.9 12.0 16.5 11.8 12.7 15.1(L85–L87)
Hip replacement 6.9 8.7 12.5 9.2 9.9 13.4 9.4 9.4 12.6 8.9 8.7 10.0(W37–W39)
Coronary artery bypass 4.7 5.1 8.0 8.6 9.8 NA* 4.2 7.7 7.4 5.4 3.2 3.6graft (K40–K46)
Table 4.1: Activity: operation rates (per 10,000) for selected hospital procedures in England, Scotland, Wales and Northern Ireland (1996, 2002 and 2006)
* NA – not available
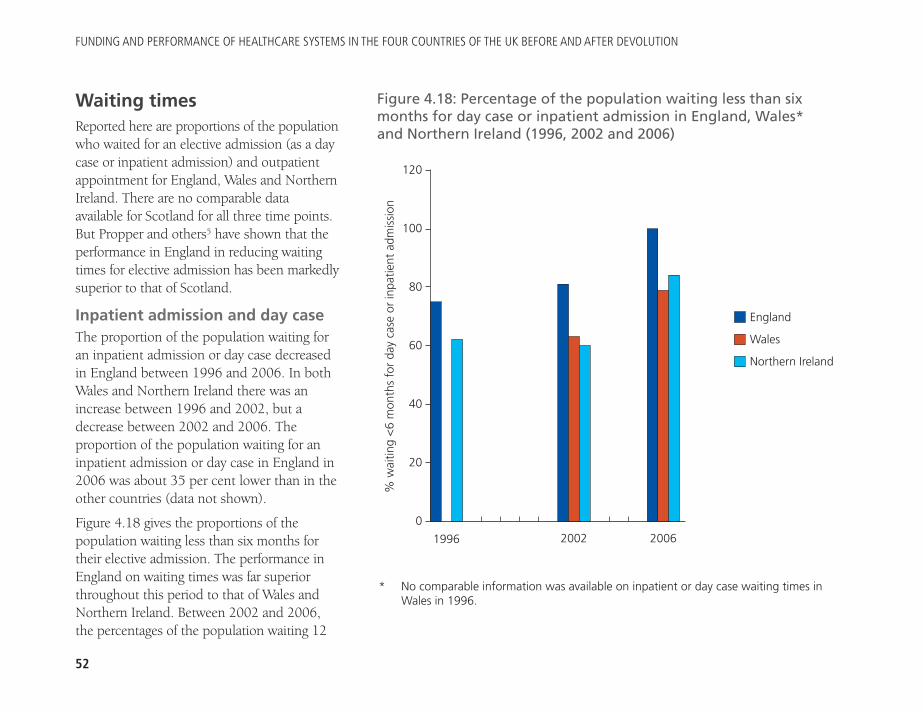
FUNDING AND PERFORMANCE OF HEALTHCARE SYSTEMS IN THE FOUR COUNTRIES OF THE UK BEFORE AND AFTER DEVOLUTION
52
Waiting timesReported here are proportions of the populationwho waited for an elective admission (as a daycase or inpatient admission) and outpatientappointment for England, Wales and NorthernIreland. There are no comparable dataavailable for Scotland for all three time points.But Propper and others5 have shown that theperformance in England in reducing waitingtimes for elective admission has been markedlysuperior to that of Scotland.
Inpatient admission and day caseThe proportion of the population waiting foran inpatient admission or day case decreasedin England between 1996 and 2006. In bothWales and Northern Ireland there was anincrease between 1996 and 2002, but adecrease between 2002 and 2006. Theproportion of the population waiting for aninpatient admission or day case in England in2006 was about 35 per cent lower than in theother countries (data not shown).
Figure 4.18 gives the proportions of thepopulation waiting less than six months fortheir elective admission. The performance inEngland on waiting times was far superiorthroughout this period to that of Wales andNorthern Ireland. Between 2002 and 2006,the percentages of the population waiting 12
Figure 4.18: Percentage of the population waiting less than sixmonths for day case or inpatient admission in England, Wales*and Northern Ireland (1996, 2002 and 2006)
120
100
80
60
40
20
0
% w
aitin
g <
6 m
onth
s fo
r da
y ca
se o
r in
patie
nt a
dmis
sion
1996 2002 2006
England
Wales
Northern Ireland
* No comparable information was available on inpatient or day case waiting times inWales in 1996.
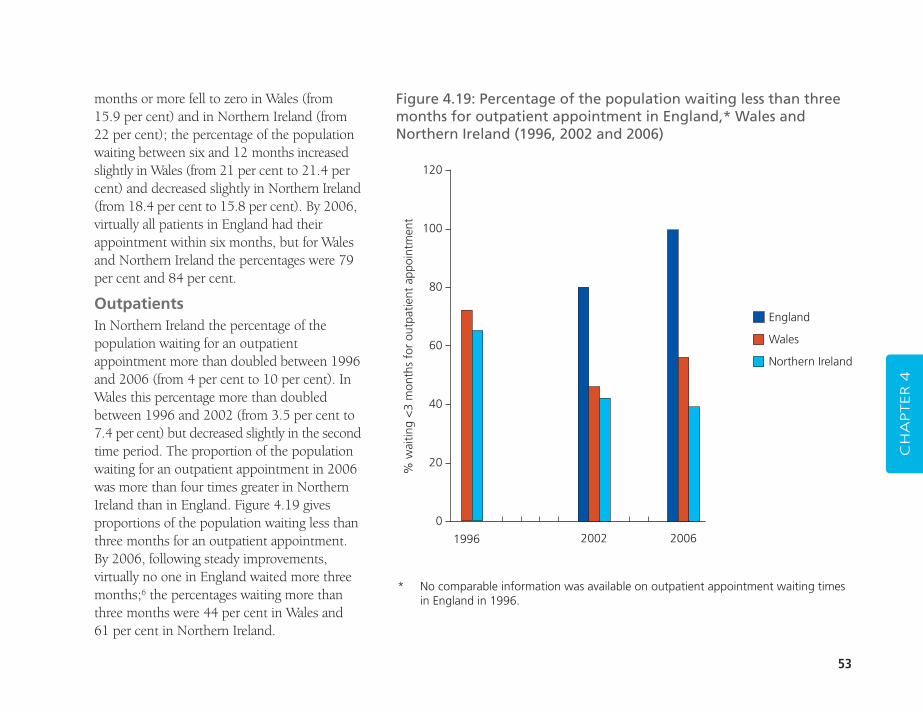
53
months or more fell to zero in Wales (from15.9 per cent) and in Northern Ireland (from22 per cent); the percentage of the populationwaiting between six and 12 months increasedslightly in Wales (from 21 per cent to 21.4 percent) and decreased slightly in Northern Ireland(from 18.4 per cent to 15.8 per cent). By 2006,virtually all patients in England had theirappointment within six months, but for Walesand Northern Ireland the percentages were 79per cent and 84 per cent.
OutpatientsIn Northern Ireland the percentage of thepopulation waiting for an outpatientappointment more than doubled between 1996and 2006 (from 4 per cent to 10 per cent). InWales this percentage more than doubledbetween 1996 and 2002 (from 3.5 per cent to7.4 per cent) but decreased slightly in the secondtime period. The proportion of the populationwaiting for an outpatient appointment in 2006was more than four times greater in NorthernIreland than in England. Figure 4.19 givesproportions of the population waiting less thanthree months for an outpatient appointment.By 2006, following steady improvements,virtually no one in England waited more threemonths;6 the percentages waiting more thanthree months were 44 per cent in Wales and 61 per cent in Northern Ireland.
CH
APTER 4
* No comparable information was available on outpatient appointment waiting timesin England in 1996.
Figure 4.19: Percentage of the population waiting less than threemonths for outpatient appointment in England,* Wales andNorthern Ireland (1996, 2002 and 2006)
120
100
80
60
40
20
0
% w
aitin
g <
3 m
onth
s fo
r ou
tpat
ient
app
oint
men
t
1996 2002 2006
England
Wales
Northern Ireland
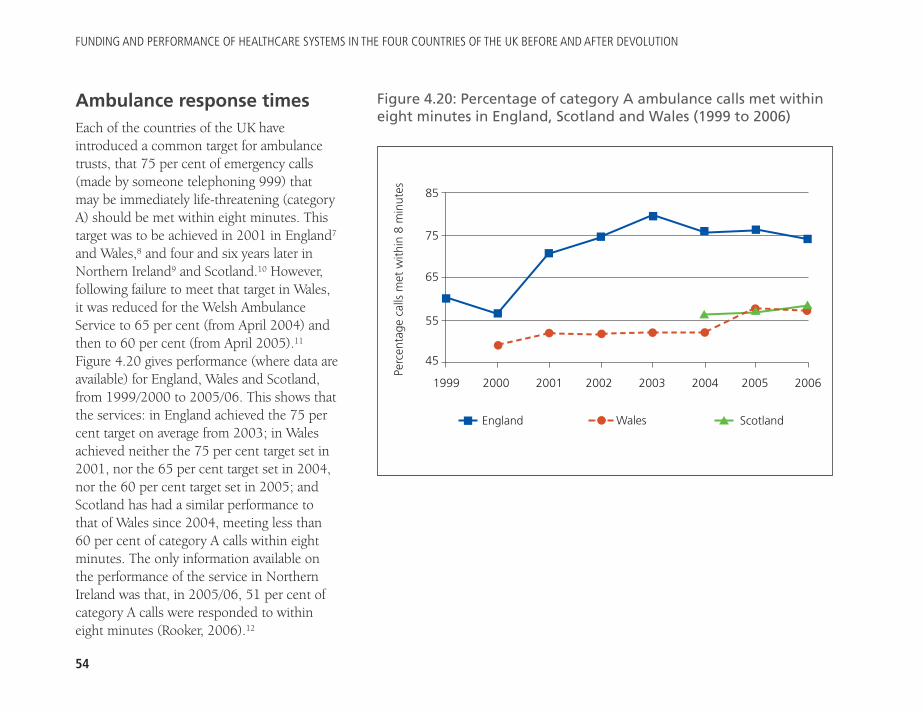
FUNDING AND PERFORMANCE OF HEALTHCARE SYSTEMS IN THE FOUR COUNTRIES OF THE UK BEFORE AND AFTER DEVOLUTION
54
Ambulance response timesEach of the countries of the UK haveintroduced a common target for ambulancetrusts, that 75 per cent of emergency calls(made by someone telephoning 999) thatmay be immediately life-threatening (categoryA) should be met within eight minutes. Thistarget was to be achieved in 2001 in England7
and Wales,8 and four and six years later inNorthern Ireland9 and Scotland.10 However,following failure to meet that target in Wales,it was reduced for the Welsh AmbulanceService to 65 per cent (from April 2004) andthen to 60 per cent (from April 2005).11
Figure 4.20 gives performance (where data areavailable) for England, Wales and Scotland,from 1999/2000 to 2005/06. This shows thatthe services: in England achieved the 75 percent target on average from 2003; in Walesachieved neither the 75 per cent target set in2001, nor the 65 per cent target set in 2004,nor the 60 per cent target set in 2005; andScotland has had a similar performance tothat of Wales since 2004, meeting less than60 per cent of category A calls within eightminutes. The only information available onthe performance of the service in NorthernIreland was that, in 2005/06, 51 per cent ofcategory A calls were responded to withineight minutes (Rooker, 2006).12
ScotlandWalesEngland
Figure 4.20: Percentage of category A ambulance calls met withineight minutes in England, Scotland and Wales (1999 to 2006)
1999 2000 2001 2002 2003 2004 2005 2006
�
�
�
�
�
� � � �
�
�
� �
�
�
�
� ��
��
85
75
65
55
45
Perc
enta
ge c
alls
met
with
in 8
min
utes
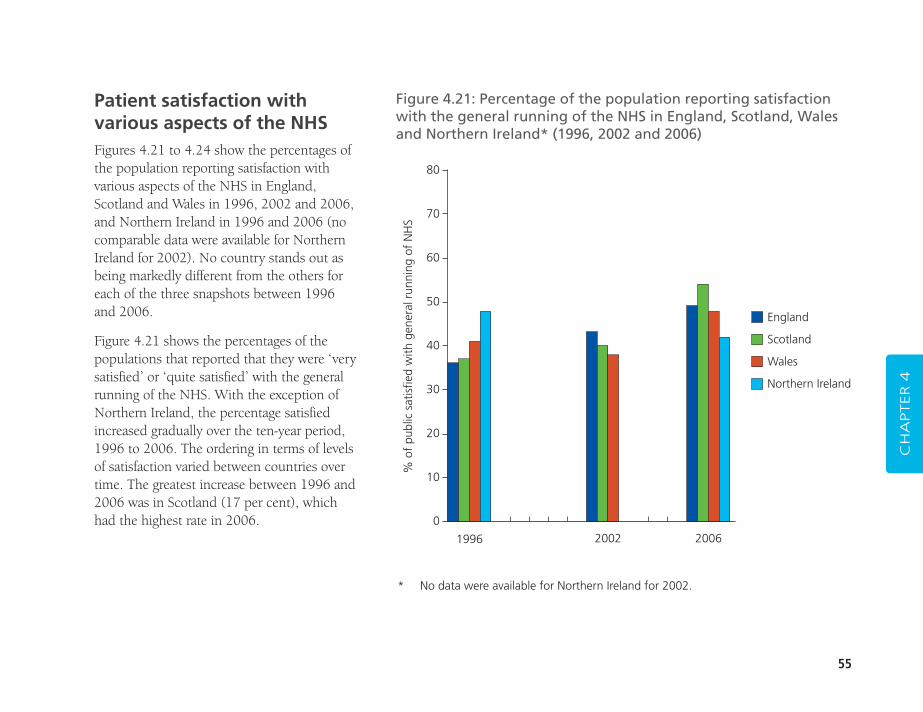
55
Patient satisfaction withvarious aspects of the NHSFigures 4.21 to 4.24 show the percentages ofthe population reporting satisfaction withvarious aspects of the NHS in England,Scotland and Wales in 1996, 2002 and 2006,and Northern Ireland in 1996 and 2006 (nocomparable data were available for NorthernIreland for 2002). No country stands out asbeing markedly different from the others foreach of the three snapshots between 1996and 2006.
Figure 4.21 shows the percentages of thepopulations that reported that they were ‘verysatisfied’ or ‘quite satisfied’ with the generalrunning of the NHS. With the exception ofNorthern Ireland, the percentage satisfiedincreased gradually over the ten-year period,1996 to 2006. The ordering in terms of levelsof satisfaction varied between countries overtime. The greatest increase between 1996 and2006 was in Scotland (17 per cent), whichhad the highest rate in 2006.
CH
APTER 4
Figure 4.21: Percentage of the population reporting satisfactionwith the general running of the NHS in England, Scotland, Walesand Northern Ireland* (1996, 2002 and 2006)
80
70
60
50
40
30
20
10
0
% o
f pu
blic
sat
isfie
d w
ith g
ener
al r
unni
ng o
f N
HS
1996 2002 2006
England
Scotland
Wales
Northern Ireland
* No data were available for Northern Ireland for 2002.
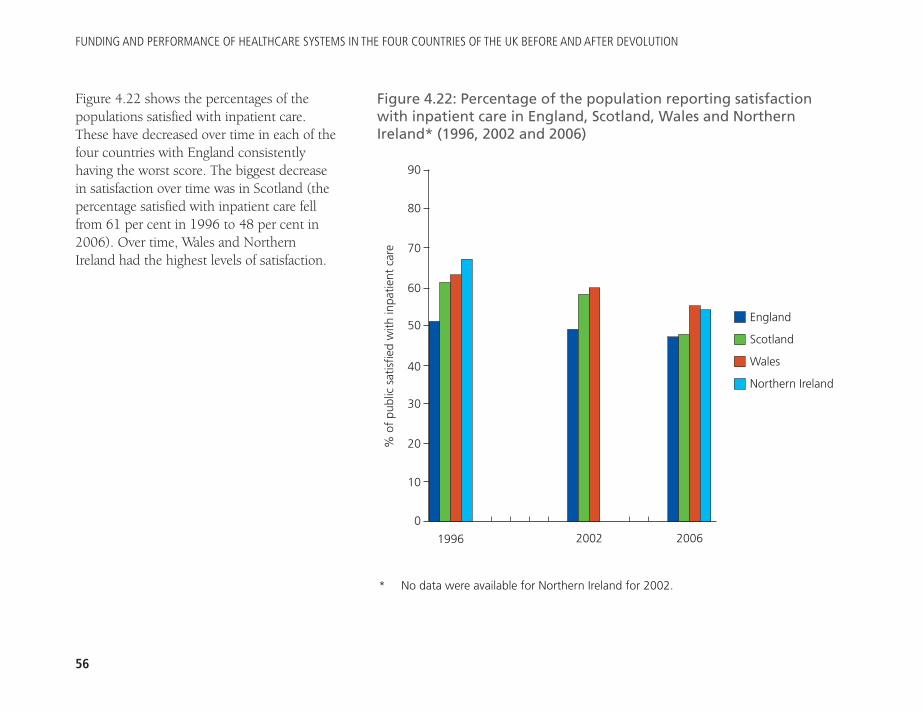
FUNDING AND PERFORMANCE OF HEALTHCARE SYSTEMS IN THE FOUR COUNTRIES OF THE UK BEFORE AND AFTER DEVOLUTION
56
Figure 4.22 shows the percentages of thepopulations satisfied with inpatient care.These have decreased over time in each of thefour countries with England consistentlyhaving the worst score. The biggest decreasein satisfaction over time was in Scotland (thepercentage satisfied with inpatient care fellfrom 61 per cent in 1996 to 48 per cent in2006). Over time, Wales and NorthernIreland had the highest levels of satisfaction.
Figure 4.22: Percentage of the population reporting satisfactionwith inpatient care in England, Scotland, Wales and NorthernIreland* (1996, 2002 and 2006)
% o
f pu
blic
sat
isfie
d w
ith in
patie
nt c
are
1996 2002 2006
England
Scotland
Wales
Northern Ireland
90
80
70
60
50
40
30
20
10
0
* No data were available for Northern Ireland for 2002.
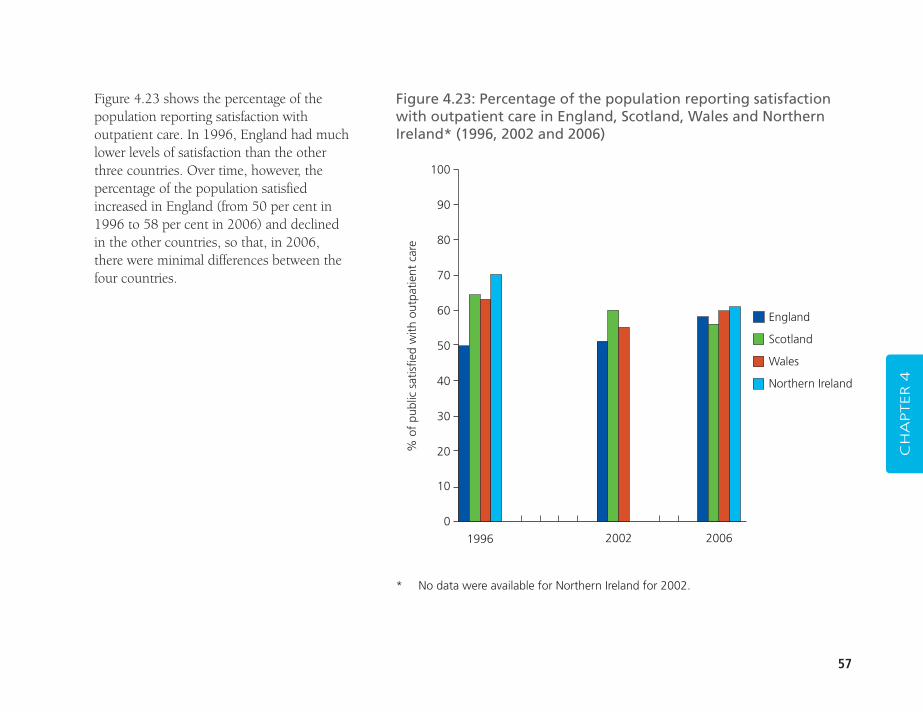
57
Figure 4.23 shows the percentage of thepopulation reporting satisfaction withoutpatient care. In 1996, England had muchlower levels of satisfaction than the otherthree countries. Over time, however, thepercentage of the population satisfiedincreased in England (from 50 per cent in1996 to 58 per cent in 2006) and declined in the other countries, so that, in 2006, there were minimal differences between thefour countries.
CH
APTER 4
Figure 4.23: Percentage of the population reporting satisfactionwith outpatient care in England, Scotland, Wales and NorthernIreland* (1996, 2002 and 2006)
100
90
80
70
60
50
40
30
20
10
0
% o
f pu
blic
sat
isfie
d w
ith o
utpa
tient
car
e
1996 2002 2006
England
Scotland
Wales
Northern Ireland
* No data were available for Northern Ireland for 2002.
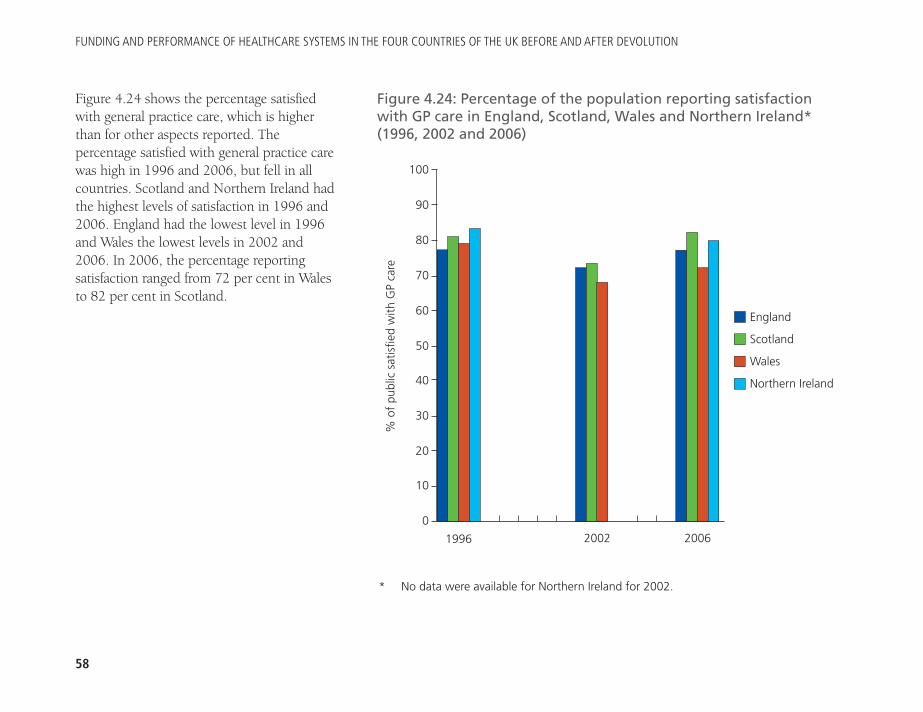
FUNDING AND PERFORMANCE OF HEALTHCARE SYSTEMS IN THE FOUR COUNTRIES OF THE UK BEFORE AND AFTER DEVOLUTION
58
Figure 4.24 shows the percentage satisfiedwith general practice care, which is higherthan for other aspects reported. Thepercentage satisfied with general practice carewas high in 1996 and 2006, but fell in allcountries. Scotland and Northern Ireland hadthe highest levels of satisfaction in 1996 and2006. England had the lowest level in 1996and Wales the lowest levels in 2002 and2006. In 2006, the percentage reportingsatisfaction ranged from 72 per cent in Walesto 82 per cent in Scotland.
Figure 4.24: Percentage of the population reporting satisfactionwith GP care in England, Scotland, Wales and Northern Ireland*(1996, 2002 and 2006)
% o
f pu
blic
sat
isfie
d w
ith G
P ca
re
1996 2002 2006
England
Scotland
Wales
Northern Ireland
100
90
80
70
60
50
40
30
20
10
0
* No data were available for Northern Ireland for 2002.
59
1. The numbers for all staff are for whole time equivalents except for GPs, forwhich the data give a head count only.
2. In Scotland, between 1996 and 2006, there was a significant reduction in inpatient admissions per 1,000 population (from 189 to 135) but little change in the rate of day cases. Hence there appears to have been no increase in day cases to compensate for the reduction in the rate ofinpatient admissions.
3. In the final section the authors refer to the comparative study of changes in hospital productivity between England and Scotland by Farrar and others (2007 and 2009). See Farrar, S, Sussex, J, Yi, D, Sutton,M, Chalkley, M, Scott, A and Ma, A (2007) National Evaluation of Paymentby Results. Aberdeen: Health Economics Research Unit. www.astrid-online.it/Politiche-/Studi--ric/HERU_report_dec07.pdf ;Farrar, S, Yi, D, Sutton, M, Chalkley, M, Sussex, J and Scott, A (2009)‘Has payment by results affected the way that English hospitals providecare? Difference-in-differences analysis’, BMJ 339: b3047.
4. Note this is over the period from 2002 to 2006.
5. Propper and others (2008a and 2008b) op. cit.
6. The percentage of the population waiting more than three months wasless than 0.05 per cent.
7. NHS Executive (1996) Review of Ambulance Service Standards. Final reportof the Steering Group. Leeds: NHS Executive.
8. National Assembly for Wales (2001) General notes for Chapter 12: PatientTransport Services. Health Statistics Wales 2001. Cardiff: NationalAssembly for Wales.
9. Rooker, Lord (2006) Ambulance Service: Northern Ireland. Lords Hansard text for 13 December 2006. www.publications.parliament.uk/pa/ld200607/ldhansrd/text/61213w0001.htm
10. Scottish Ambulance Service (2004) Your Story. 2003–2004 annual report.Edinburgh: Scottish Ambulance Service, p34.
11. Auditor General for Wales (2006) op. cit., p28. Welsh AssemblyGovernment (2007) NHS Wales: Annual operating framework 2008/2009. (WHC (2007) 086). Cardiff: Welsh Assembly Government, p34.
12. Rooker (2006) op. cit.
CH
APTER 4
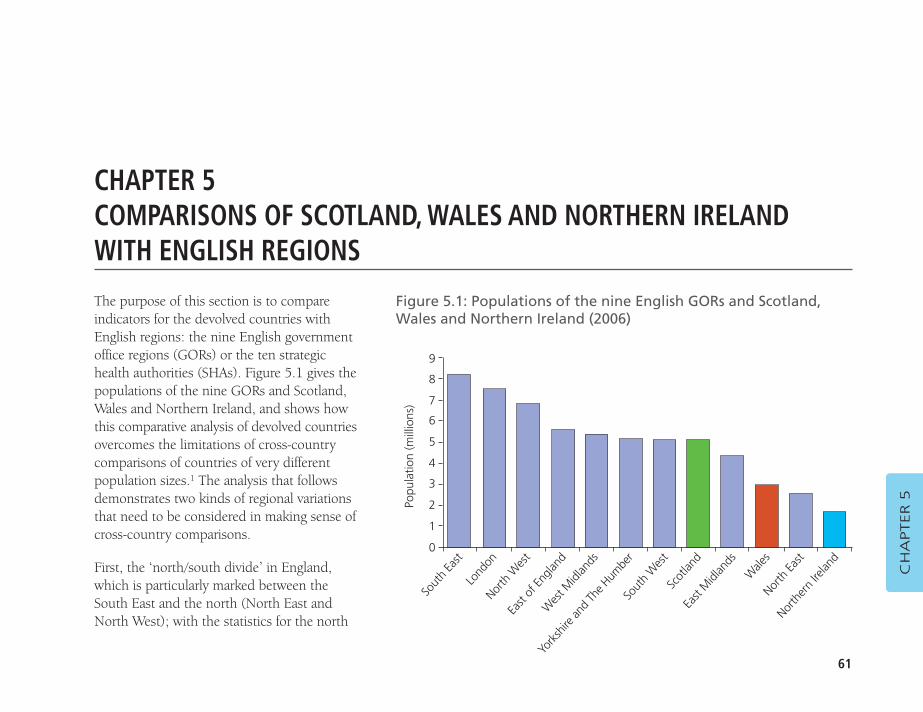
61
CH
APTER 5
CHAPTER 5COMPARISONS OF SCOTLAND, WALES AND NORTHERN IRELANDWITH ENGLISH REGIONS
Figure 5.1: Populations of the nine English GORs and Scotland,Wales and Northern Ireland (2006)
9
8
7
6
5
4
3
2
1
0
Popu
latio
n (m
illio
ns)
Sout
h Ea
stLo
ndon
North
Wes
tEa
st of
Engla
ndW
est M
idlan
ds
Sout
h W
est
Scot
land
East
Midl
ands
W
ales
North
East
North
ern
Irelan
d
York
shire
and
The H
umbe
r
The purpose of this section is to compareindicators for the devolved countries withEnglish regions: the nine English governmentoffice regions (GORs) or the ten strategichealth authorities (SHAs). Figure 5.1 gives thepopulations of the nine GORs and Scotland,Wales and Northern Ireland, and shows howthis comparative analysis of devolved countriesovercomes the limitations of cross-countrycomparisons of countries of very differentpopulation sizes.1 The analysis that followsdemonstrates two kinds of regional variationsthat need to be considered in making sense ofcross-country comparisons.
First, the ‘north/south divide’ in England,which is particularly marked between theSouth East and the north (North East andNorth West); with the statistics for the north
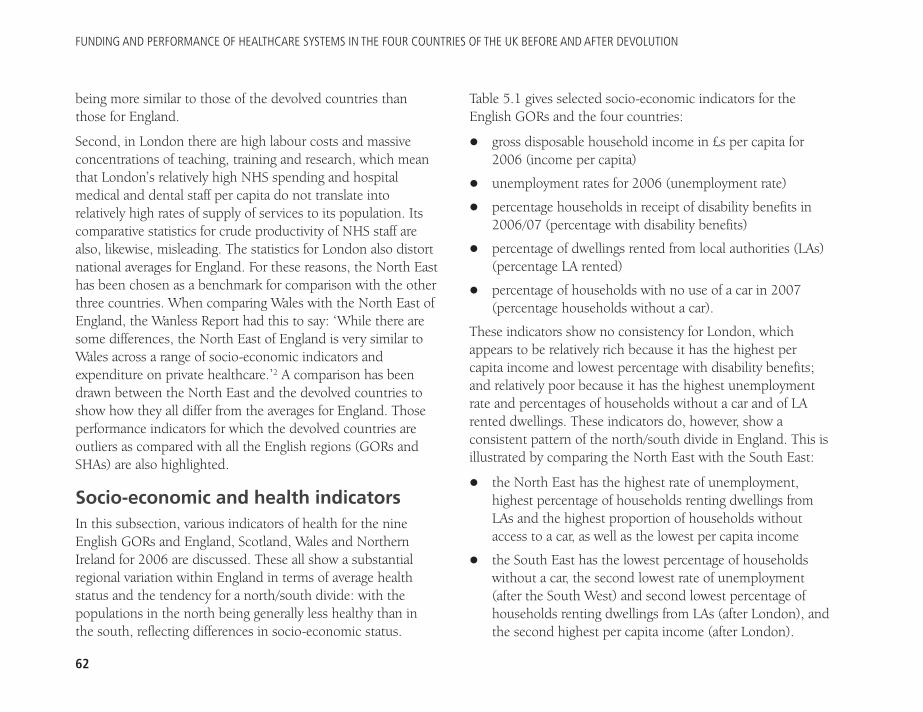
FUNDING AND PERFORMANCE OF HEALTHCARE SYSTEMS IN THE FOUR COUNTRIES OF THE UK BEFORE AND AFTER DEVOLUTION
62
being more similar to those of the devolved countries thanthose for England.
Second, in London there are high labour costs and massiveconcentrations of teaching, training and research, which meanthat London’s relatively high NHS spending and hospitalmedical and dental staff per capita do not translate intorelatively high rates of supply of services to its population. Itscomparative statistics for crude productivity of NHS staff arealso, likewise, misleading. The statistics for London also distortnational averages for England. For these reasons, the North Easthas been chosen as a benchmark for comparison with the otherthree countries. When comparing Wales with the North East ofEngland, the Wanless Report had this to say: ‘While there aresome differences, the North East of England is very similar toWales across a range of socio-economic indicators andexpenditure on private healthcare.’2 A comparison has beendrawn between the North East and the devolved countries toshow how they all differ from the averages for England. Thoseperformance indicators for which the devolved countries areoutliers as compared with all the English regions (GORs andSHAs) are also highlighted.
Socio-economic and health indicatorsIn this subsection, various indicators of health for the nineEnglish GORs and England, Scotland, Wales and NorthernIreland for 2006 are discussed. These all show a substantialregional variation within England in terms of average healthstatus and the tendency for a north/south divide: with thepopulations in the north being generally less healthy than inthe south, reflecting differences in socio-economic status.
Table 5.1 gives selected socio-economic indicators for theEnglish GORs and the four countries:
� gross disposable household income in £s per capita for2006 (income per capita)
� unemployment rates for 2006 (unemployment rate)
� percentage households in receipt of disability benefits in2006/07 (percentage with disability benefits)
� percentage of dwellings rented from local authorities (LAs)(percentage LA rented)
� percentage of households with no use of a car in 2007(percentage households without a car).
These indicators show no consistency for London, whichappears to be relatively rich because it has the highest percapita income and lowest percentage with disability benefits;and relatively poor because it has the highest unemploymentrate and percentages of households without a car and of LArented dwellings. These indicators do, however, show aconsistent pattern of the north/south divide in England. This isillustrated by comparing the North East with the South East:
� the North East has the highest rate of unemployment,highest percentage of households renting dwellings fromLAs and the highest proportion of households withoutaccess to a car, as well as the lowest per capita income
� the South East has the lowest percentage of householdswithout a car, the second lowest rate of unemployment(after the South West) and second lowest percentage ofhouseholds renting dwellings from LAs (after London), andthe second highest per capita income (after London).
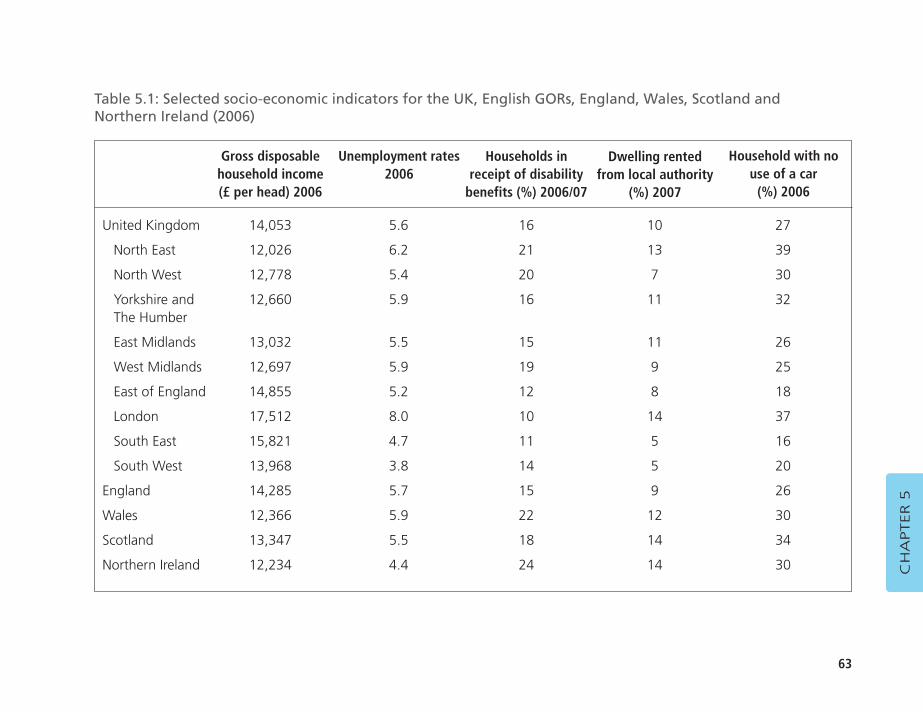
63
CH
APTER 5
United Kingdom 14,053 5.6 16 10 27
North East 12,026 6.2 21 13 39
North West 12,778 5.4 20 7 30
Yorkshire and 12,660 5.9 16 11 32The Humber
East Midlands 13,032 5.5 15 11 26
West Midlands 12,697 5.9 19 9 25
East of England 14,855 5.2 12 8 18
London 17,512 8.0 10 14 37
South East 15,821 4.7 11 5 16
South West 13,968 3.8 14 5 20
England 14,285 5.7 15 9 26
Wales 12,366 5.9 22 12 30
Scotland 13,347 5.5 18 14 34
Northern Ireland 12,234 4.4 24 14 30
Table 5.1: Selected socio-economic indicators for the UK, English GORs, England, Wales, Scotland and Northern Ireland (2006)
Gross disposable household income (£ per head) 2006
Households inreceipt of disability
benefits (%) 2006/07
Dwelling rentedfrom local authority
(%) 2007
Unemployment rates2006
Household with nouse of a car
(%) 2006
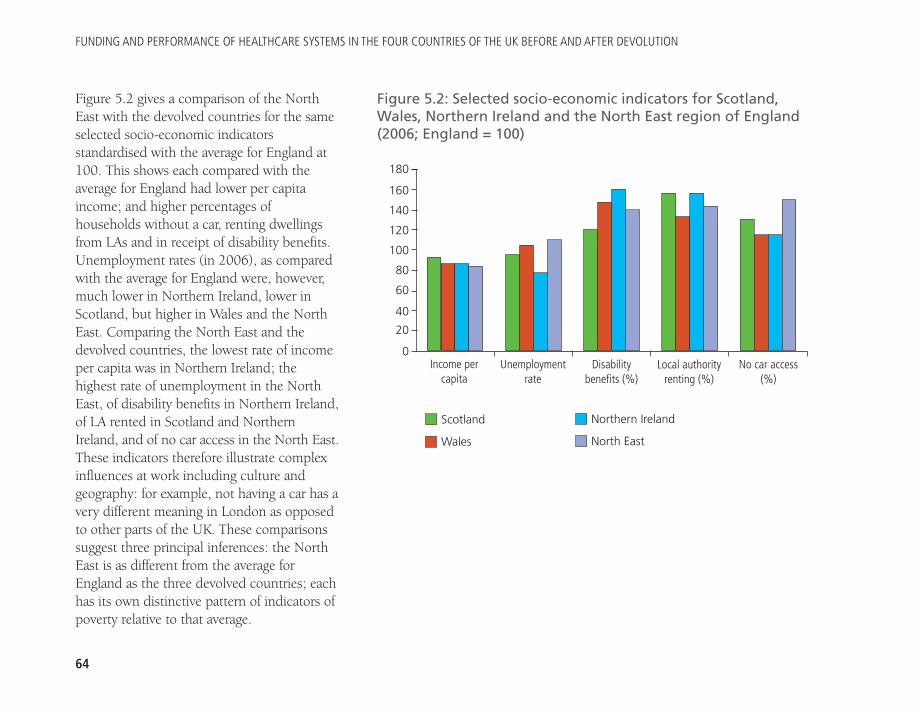
FUNDING AND PERFORMANCE OF HEALTHCARE SYSTEMS IN THE FOUR COUNTRIES OF THE UK BEFORE AND AFTER DEVOLUTION
64
Figure 5.2 gives a comparison of the NorthEast with the devolved countries for the sameselected socio-economic indicatorsstandardised with the average for England at100. This shows each compared with theaverage for England had lower per capitaincome; and higher percentages ofhouseholds without a car, renting dwellingsfrom LAs and in receipt of disability benefits.Unemployment rates (in 2006), as comparedwith the average for England were, however,much lower in Northern Ireland, lower inScotland, but higher in Wales and the NorthEast. Comparing the North East and thedevolved countries, the lowest rate of incomeper capita was in Northern Ireland; thehighest rate of unemployment in the NorthEast, of disability benefits in Northern Ireland,of LA rented in Scotland and NorthernIreland, and of no car access in the North East.These indicators therefore illustrate complexinfluences at work including culture andgeography: for example, not having a car has avery different meaning in London as opposedto other parts of the UK. These comparisonssuggest three principal inferences: the NorthEast is as different from the average forEngland as the three devolved countries; eachhas its own distinctive pattern of indicators ofpoverty relative to that average.
Figure 5.2: Selected socio-economic indicators for Scotland, Wales, Northern Ireland and the North East region of England(2006; England = 100)
180
160
140
120
100
80
60
40
20
0
Scotland
Wales
Northern Ireland
North East
Unemploymentrate
Income percapita
Disabilitybenefits (%)
Local authorityrenting (%)
No car access(%)
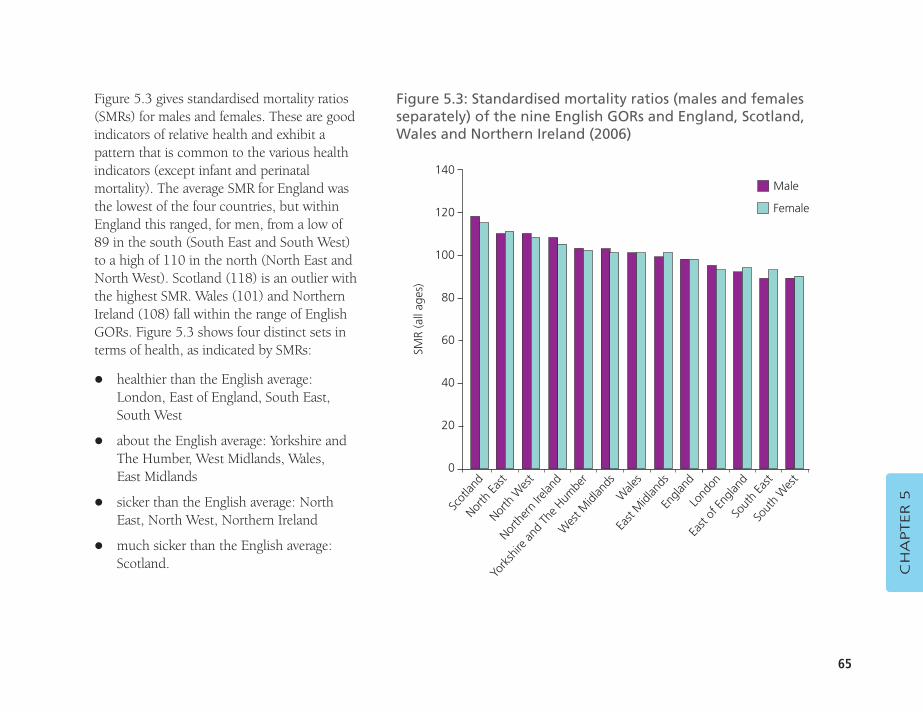
65
Figure 5.3 gives standardised mortality ratios(SMRs) for males and females. These are goodindicators of relative health and exhibit apattern that is common to the various healthindicators (except infant and perinatalmortality). The average SMR for England wasthe lowest of the four countries, but withinEngland this ranged, for men, from a low of89 in the south (South East and South West)to a high of 110 in the north (North East andNorth West). Scotland (118) is an outlier withthe highest SMR. Wales (101) and NorthernIreland (108) fall within the range of EnglishGORs. Figure 5.3 shows four distinct sets interms of health, as indicated by SMRs:
� healthier than the English average:London, East of England, South East,South West
� about the English average: Yorkshire andThe Humber, West Midlands, Wales, East Midlands
� sicker than the English average: NorthEast, North West, Northern Ireland
� much sicker than the English average:Scotland. C
HA
PTER 5
Figure 5.3: Standardised mortality ratios (males and femalesseparately) of the nine English GORs and England, Scotland, Wales and Northern Ireland (2006)
140
120
100
80
60
40
20
0
SMR
(all
ages
)
Male
Female
Scot
land
North
East
North
Wes
t
North
ern
Irelan
dW
est M
idlan
ds
Engla
ndLo
ndon
East
Midl
ands
Wale
s
East
of En
gland
Sout
h Ea
stSo
uth
Wes
t
York
shire
and
The H
umbe
r
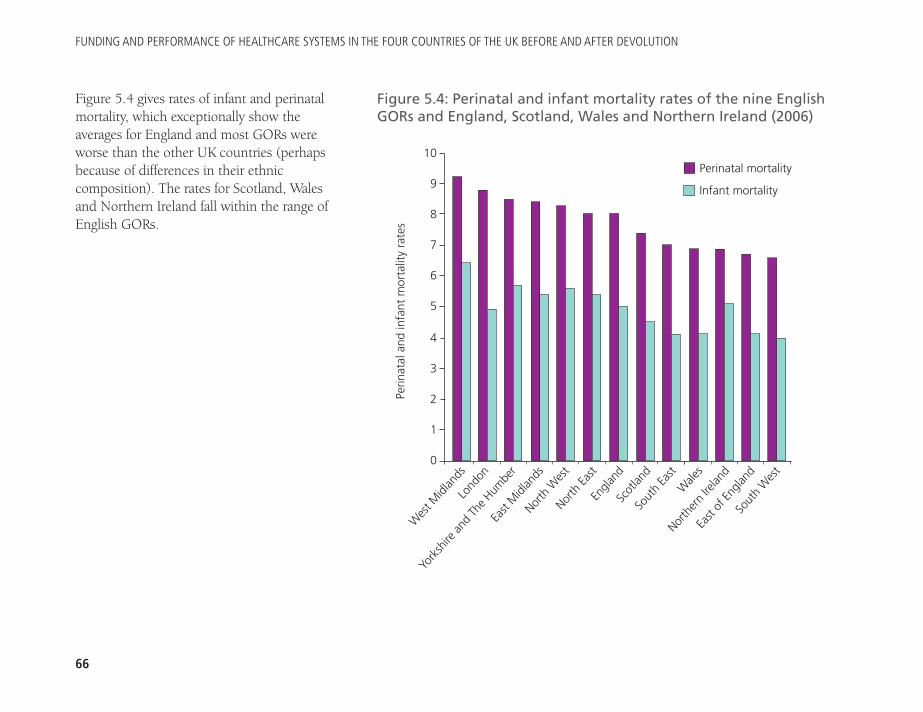
FUNDING AND PERFORMANCE OF HEALTHCARE SYSTEMS IN THE FOUR COUNTRIES OF THE UK BEFORE AND AFTER DEVOLUTION
66
Figure 5.4 gives rates of infant and perinatalmortality, which exceptionally show theaverages for England and most GORs wereworse than the other UK countries (perhapsbecause of differences in their ethniccomposition). The rates for Scotland, Walesand Northern Ireland fall within the range ofEnglish GORs.
Figure 5.4: Perinatal and infant mortality rates of the nine EnglishGORs and England, Scotland, Wales and Northern Ireland (2006)
10
9
8
7
6
5
4
3
2
1
0
Perin
atal
and
infa
nt m
orta
lity
rate
s
Perinatal mortality
Infant mortality
Wes
t Midl
ands
Lond
on
York
shire
and
The H
umbe
r
East
Midl
ands
Nor
th Ea
st
Sout
h Ea
stW
ales
Scot
land
Engla
nd
North
ern
Irelan
d
East
of En
gland
Sout
h W
est
North
Wes
t
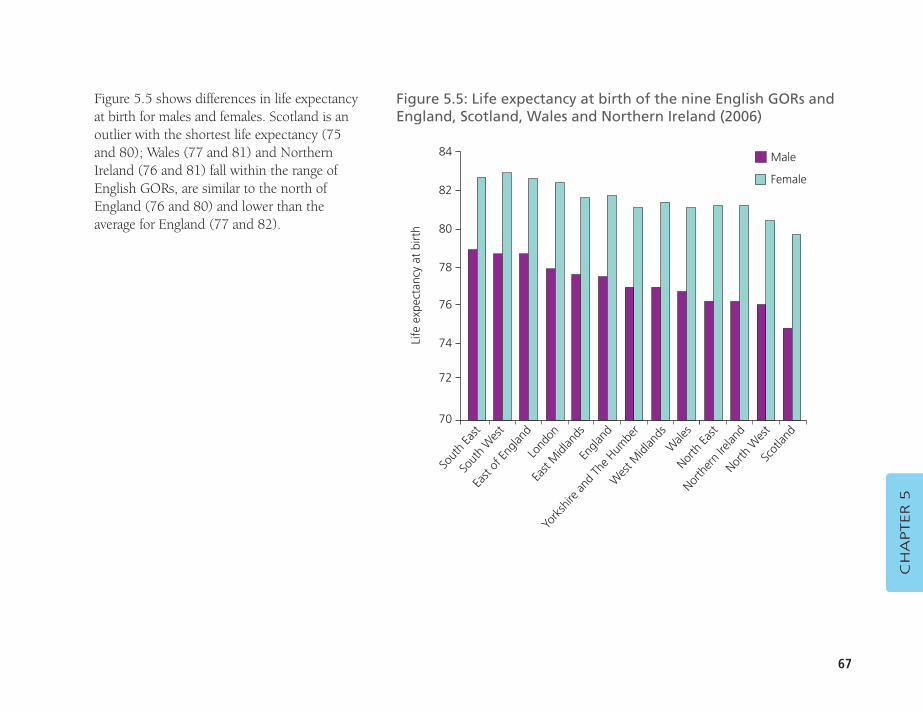
67
Figure 5.5 shows differences in life expectancyat birth for males and females. Scotland is anoutlier with the shortest life expectancy (75and 80); Wales (77 and 81) and NorthernIreland (76 and 81) fall within the range ofEnglish GORs, are similar to the north ofEngland (76 and 80) and lower than theaverage for England (77 and 82).
CH
APTER 5
Figure 5.5: Life expectancy at birth of the nine English GORs andEngland, Scotland, Wales and Northern Ireland (2006)
84
82
80
78
76
74
72
70Li
fe e
xpec
tanc
y at
birt
h
Male
Female
Sout
h Ea
stSo
uth
Wes
t
East
of En
gland
Lond
on
Engla
nd
Wale
sNor
th Ea
st
Wes
t Midl
ands
York
shire
and
The H
umbe
r
North
ern
Irelan
dNor
th W
est
Scot
land
East
Midl
ands
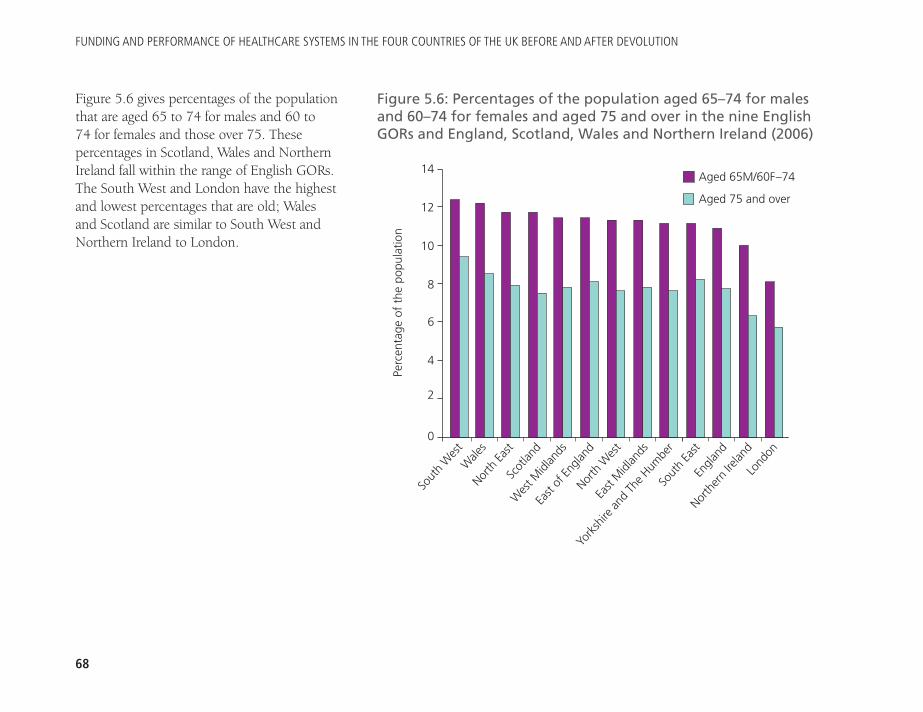
FUNDING AND PERFORMANCE OF HEALTHCARE SYSTEMS IN THE FOUR COUNTRIES OF THE UK BEFORE AND AFTER DEVOLUTION
68
Figure 5.6 gives percentages of the populationthat are aged 65 to 74 for males and 60 to 74 for females and those over 75. Thesepercentages in Scotland, Wales and NorthernIreland fall within the range of English GORs.The South West and London have the highestand lowest percentages that are old; Walesand Scotland are similar to South West andNorthern Ireland to London.
Figure 5.6: Percentages of the population aged 65–74 for malesand 60–74 for females and aged 75 and over in the nine EnglishGORs and England, Scotland, Wales and Northern Ireland (2006)
14
12
10
8
6
4
2
0
Perc
enta
ge o
f th
e po
pula
tion
Aged 65M/60F–74
Aged 75 and over
Sout
h W
est
Wale
sNor
th Ea
stSc
otlan
dEa
st of
Engla
ndYo
rksh
ire an
d Th
e Hum
ber
Sout
h Ea
st
East
Midl
ands
North
Wes
t
Engla
nd
North
ern
Irelan
dLo
ndon
Wes
t Midl
ands
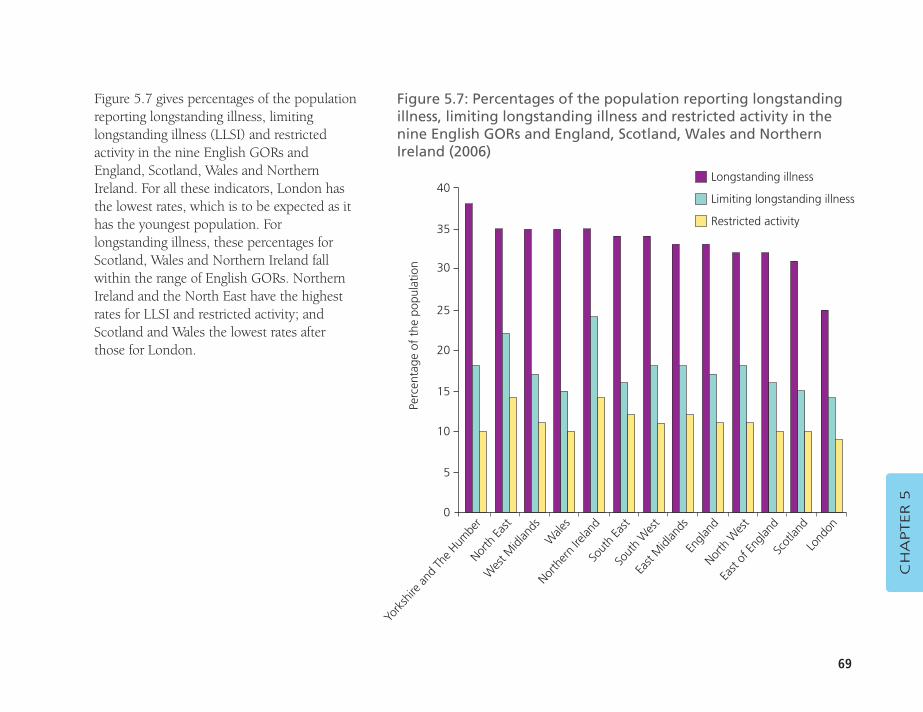
69
Figure 5.7 gives percentages of the populationreporting longstanding illness, limitinglongstanding illness (LLSI) and restrictedactivity in the nine English GORs andEngland, Scotland, Wales and NorthernIreland. For all these indicators, London hasthe lowest rates, which is to be expected as ithas the youngest population. Forlongstanding illness, these percentages forScotland, Wales and Northern Ireland fallwithin the range of English GORs. NorthernIreland and the North East have the highestrates for LLSI and restricted activity; andScotland and Wales the lowest rates afterthose for London.
CH
APTER 5
Figure 5.7: Percentages of the population reporting longstandingillness, limiting longstanding illness and restricted activity in thenine English GORs and England, Scotland, Wales and NorthernIreland (2006)
40
35
30
25
20
15
10
5
0
Perc
enta
ge o
f th
e po
pula
tion
Longstanding illness
Limiting longstanding illness
Restricted activity
York
shire
and
The H
umbe
rNor
th Ea
st
Wes
t Midl
ands
W
ales
Sout
h Ea
st
Engla
ndNor
th W
est
East
Midl
ands
Sout
h W
est
East
of En
gland
Scot
land
Lond
on
North
ern
Irelan
d
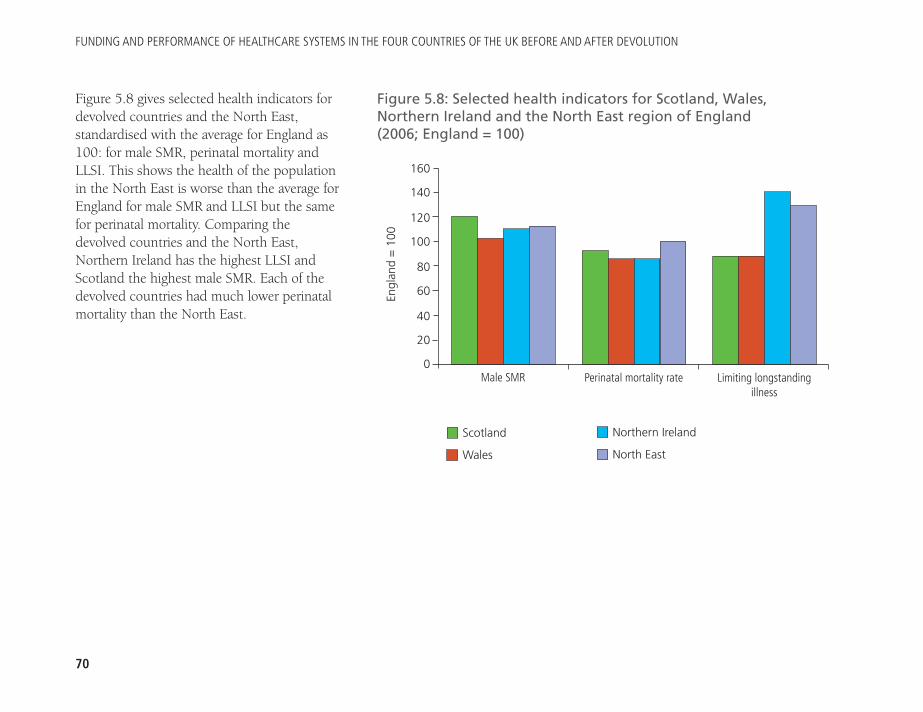
FUNDING AND PERFORMANCE OF HEALTHCARE SYSTEMS IN THE FOUR COUNTRIES OF THE UK BEFORE AND AFTER DEVOLUTION
70
Figure 5.8 gives selected health indicators fordevolved countries and the North East,standardised with the average for England as100: for male SMR, perinatal mortality andLLSI. This shows the health of the populationin the North East is worse than the average forEngland for male SMR and LLSI but the samefor perinatal mortality. Comparing thedevolved countries and the North East,Northern Ireland has the highest LLSI andScotland the highest male SMR. Each of thedevolved countries had much lower perinatalmortality than the North East.
Figure 5.8: Selected health indicators for Scotland, Wales,Northern Ireland and the North East region of England (2006; England = 100)
160
140
120
100
80
60
40
20
0
Scotland
Wales
Northern Ireland
North East
Perinatal mortality rateMale SMR Limiting longstandingillness
Engl
and
= 1
00
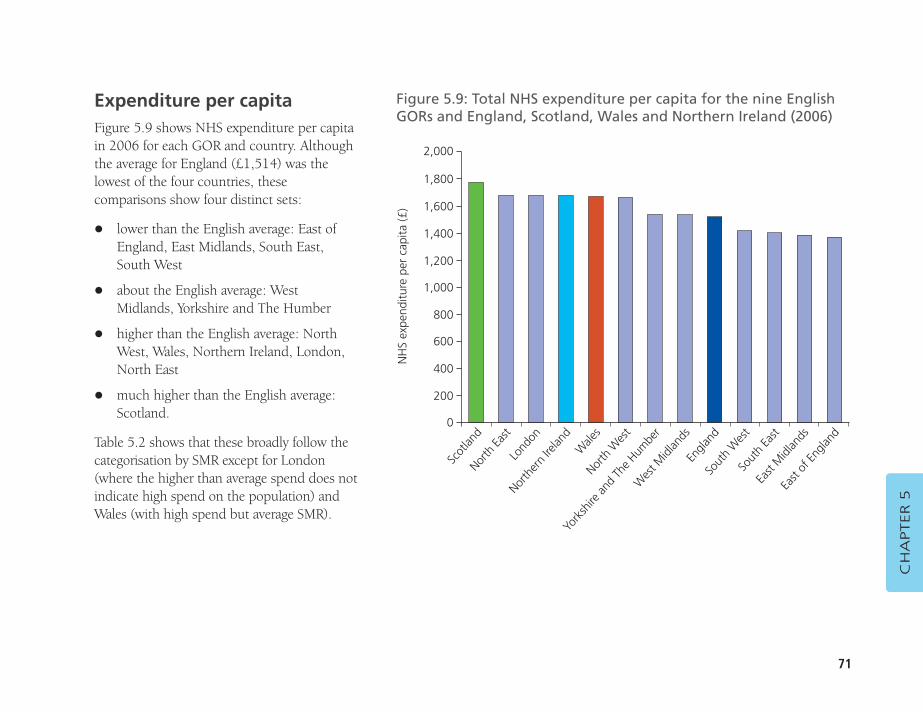
71
Expenditure per capitaFigure 5.9 shows NHS expenditure per capitain 2006 for each GOR and country. Althoughthe average for England (£1,514) was thelowest of the four countries, thesecomparisons show four distinct sets:
� lower than the English average: East ofEngland, East Midlands, South East,South West
� about the English average: WestMidlands, Yorkshire and The Humber
� higher than the English average: NorthWest, Wales, Northern Ireland, London,North East
� much higher than the English average:Scotland.
Table 5.2 shows that these broadly follow thecategorisation by SMR except for London(where the higher than average spend does notindicate high spend on the population) andWales (with high spend but average SMR).
CH
APTER 5
Figure 5.9: Total NHS expenditure per capita for the nine EnglishGORs and England, Scotland, Wales and Northern Ireland (2006)
NH
S ex
pend
iture
per
cap
ita (£
)
Scot
land
North
East
Lond
on
North
ern
Irelan
d
North
Wes
t
Engla
ndSo
uth
Wes
t
Wes
t Midl
ands
York
shire
and
The H
umbe
r
Sout
h Ea
stEa
st M
idlan
ds
East
of En
gland
Wale
s
2,000
1,800
1,600
1,400
1,200
1,000
800
600
400
200
0
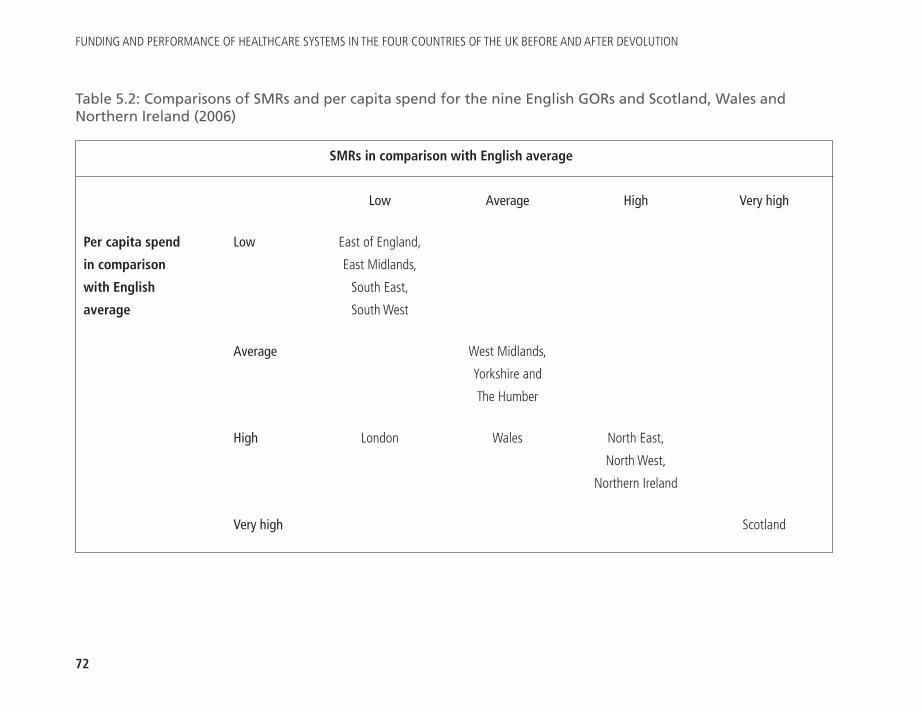
FUNDING AND PERFORMANCE OF HEALTHCARE SYSTEMS IN THE FOUR COUNTRIES OF THE UK BEFORE AND AFTER DEVOLUTION
72
Low Average High Very high
Per capita spend Low East of England,
in comparison East Midlands,
with English South East,
average South West
Average West Midlands,
Yorkshire and
The Humber
High London Wales North East,
North West,
Northern Ireland
Very high Scotland
Table 5.2: Comparisons of SMRs and per capita spend for the nine English GORs and Scotland, Wales andNorthern Ireland (2006)
SMRs in comparison with English average
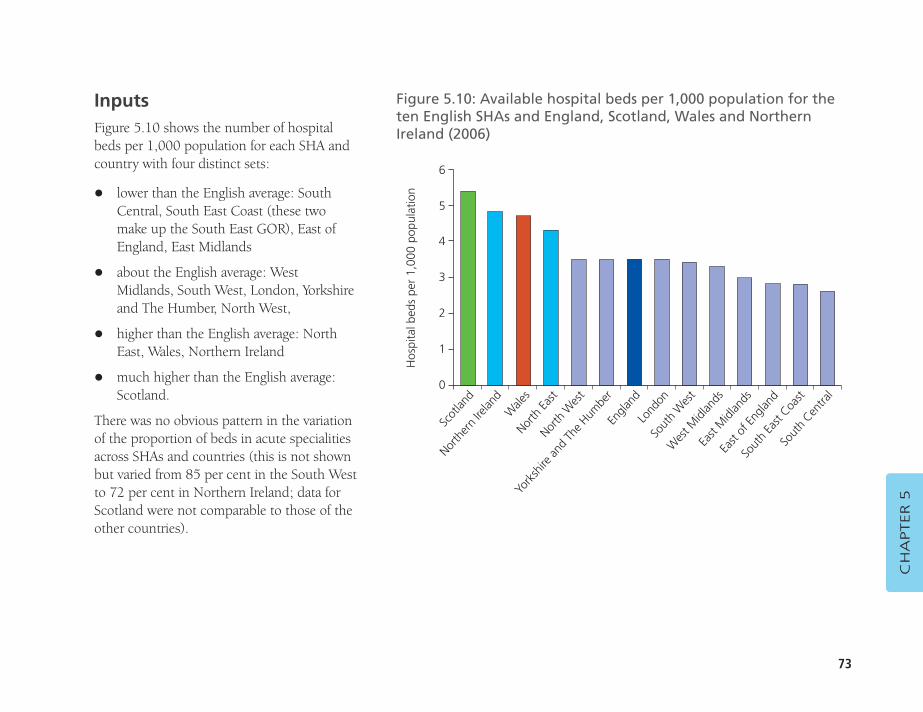
73
InputsFigure 5.10 shows the number of hospitalbeds per 1,000 population for each SHA andcountry with four distinct sets:
� lower than the English average: SouthCentral, South East Coast (these twomake up the South East GOR), East ofEngland, East Midlands
� about the English average: WestMidlands, South West, London, Yorkshireand The Humber, North West,
� higher than the English average: NorthEast, Wales, Northern Ireland
� much higher than the English average:Scotland.
There was no obvious pattern in the variationof the proportion of beds in acute specialitiesacross SHAs and countries (this is not shownbut varied from 85 per cent in the South Westto 72 per cent in Northern Ireland; data forScotland were not comparable to those of theother countries).
CH
APTER 5
Figure 5.10: Available hospital beds per 1,000 population for theten English SHAs and England, Scotland, Wales and NorthernIreland (2006)
Hos
pita
l bed
s pe
r 1,
000
popu
latio
n
Scot
land
North
ern
Irelan
dW
ales
North
East
York
shire
and
The H
umbe
r
Sout
h W
est
Wes
t Midl
ands
Lond
on
Engla
nd
East
Midl
ands
East
of En
gland
Sout
h Ea
st Coa
stSo
uth
Centra
l
North
Wes
t
6
5
4
3
2
1
0
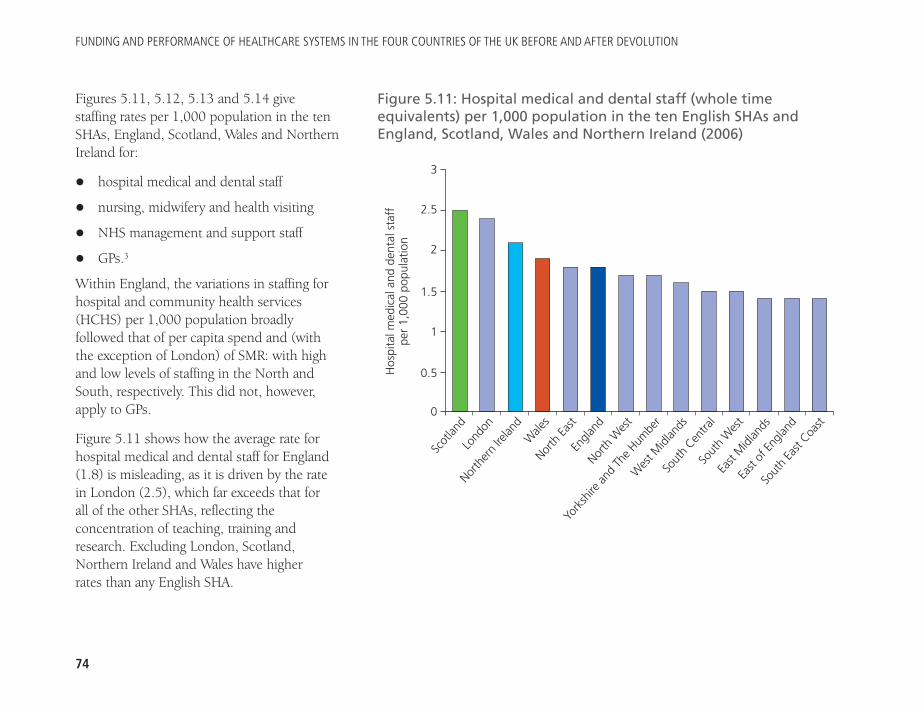
FUNDING AND PERFORMANCE OF HEALTHCARE SYSTEMS IN THE FOUR COUNTRIES OF THE UK BEFORE AND AFTER DEVOLUTION
74
Figures 5.11, 5.12, 5.13 and 5.14 givestaffing rates per 1,000 population in the tenSHAs, England, Scotland, Wales and NorthernIreland for:
� hospital medical and dental staff
� nursing, midwifery and health visiting
� NHS management and support staff
� GPs.3
Within England, the variations in staffing forhospital and community health services(HCHS) per 1,000 population broadlyfollowed that of per capita spend and (withthe exception of London) of SMR: with highand low levels of staffing in the North andSouth, respectively. This did not, however,apply to GPs.
Figure 5.11 shows how the average rate forhospital medical and dental staff for England(1.8) is misleading, as it is driven by the ratein London (2.5), which far exceeds that for all of the other SHAs, reflecting theconcentration of teaching, training andresearch. Excluding London, Scotland,Northern Ireland and Wales have higher rates than any English SHA.
Figure 5.11: Hospital medical and dental staff (whole timeequivalents) per 1,000 population in the ten English SHAs andEngland, Scotland, Wales and Northern Ireland (2006)
Hos
pita
l med
ical
and
den
tal s
taff
pe
r 1,
000
popu
latio
n
Scot
land
Lond
on
North
ern
Irelan
dW
ales
Engla
nd
Wes
t Midl
ands
Sout
h Cen
tral
York
shire
and
The H
umbe
r
North
Wes
t
Sout
h W
est
East
Midl
ands
East
of En
gland
Sout
h Ea
st Coa
st
North
East
3
2.5
2
1.5
1
0.5
0
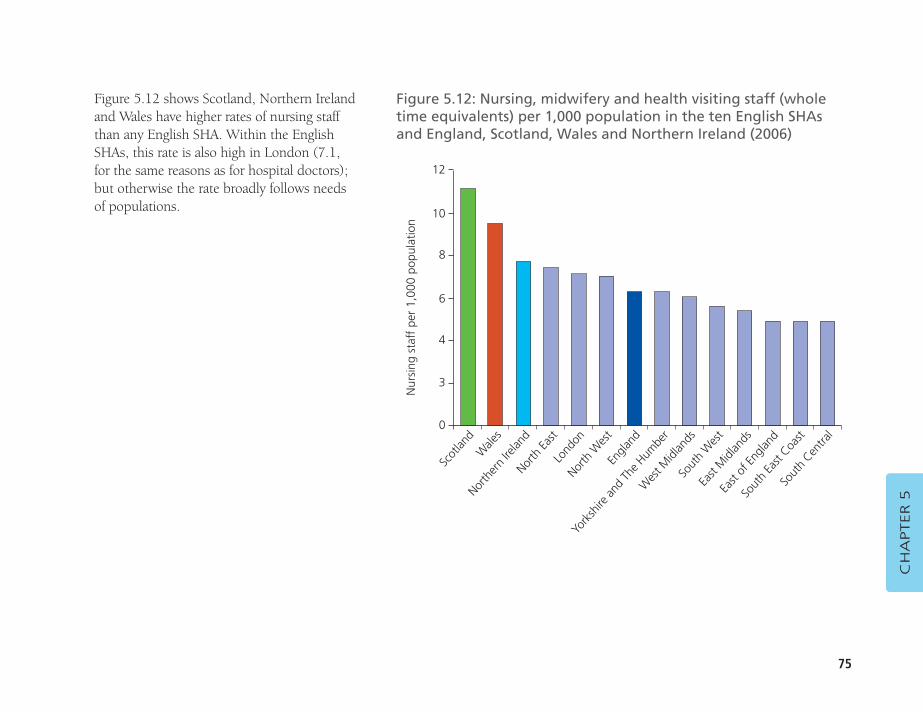
75
Figure 5.12 shows Scotland, Northern Irelandand Wales have higher rates of nursing staffthan any English SHA. Within the EnglishSHAs, this rate is also high in London (7.1,for the same reasons as for hospital doctors);but otherwise the rate broadly follows needsof populations.
CH
APTER 5
Figure 5.12: Nursing, midwifery and health visiting staff (wholetime equivalents) per 1,000 population in the ten English SHAs and England, Scotland, Wales and Northern Ireland (2006)
Nur
sing
sta
ff p
er 1
,000
pop
ulat
ion
Scot
land
Wale
s
North
ern
Irelan
dNor
th Ea
st
North
Wes
t
Wes
t Midl
ands
So
uth
Wes
t
York
shire
and
The H
umbe
r
Engla
nd
East
Midl
ands
East
of En
gland
Sout
h Ea
st Coa
stSo
uth
Centra
l
Lond
on
12
10
8
6
4
3
0
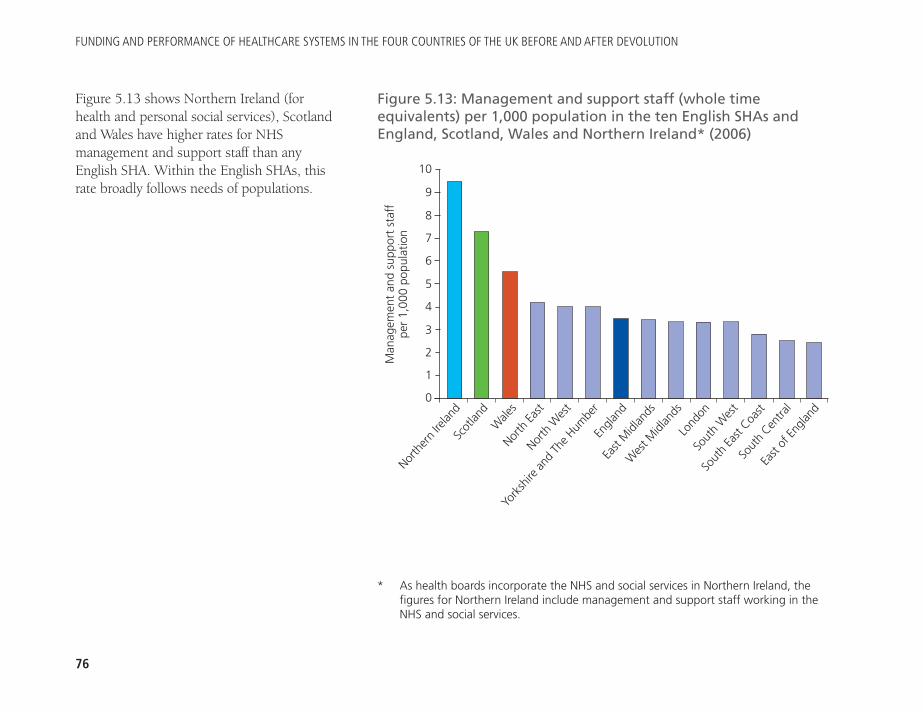
FUNDING AND PERFORMANCE OF HEALTHCARE SYSTEMS IN THE FOUR COUNTRIES OF THE UK BEFORE AND AFTER DEVOLUTION
76
Figure 5.13 shows Northern Ireland (forhealth and personal social services), Scotlandand Wales have higher rates for NHSmanagement and support staff than anyEnglish SHA. Within the English SHAs, thisrate broadly follows needs of populations.
Figure 5.13: Management and support staff (whole timeequivalents) per 1,000 population in the ten English SHAs andEngland, Scotland, Wales and Northern Ireland* (2006)
Man
agem
ent
and
supp
ort
staf
f pe
r 1,
000
popu
latio
nNor
ther
n Ire
land
Scot
land
Wale
sNor
th Ea
st
York
shire
and
The H
umbe
r
Wes
t Midl
ands
Lo
ndon
East
Midl
ands
Engla
nd
Sout
h W
est
Sout
h Ea
st Coa
st
Sout
h Cen
tral
East
of En
gland
North
Wes
t
10
9
8
7
6
5
4
3
2
1
0
* As health boards incorporate the NHS and social services in Northern Ireland, thefigures for Northern Ireland include management and support staff working in theNHS and social services.
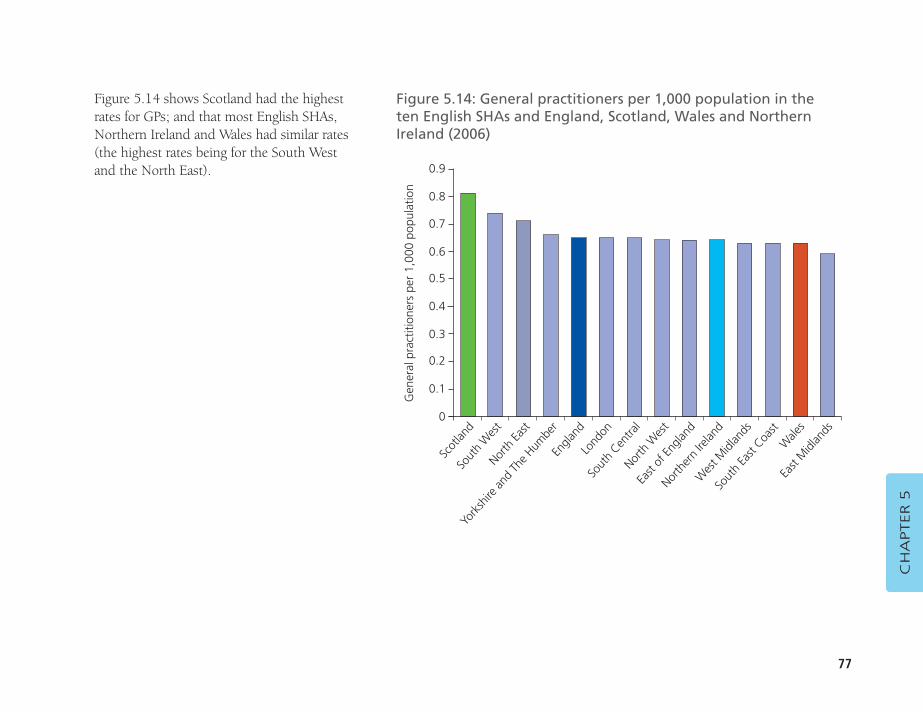
77
Figure 5.14 shows Scotland had the highestrates for GPs; and that most English SHAs,Northern Ireland and Wales had similar rates(the highest rates being for the South Westand the North East).
CH
APTER 5
Figure 5.14: General practitioners per 1,000 population in the ten English SHAs and England, Scotland, Wales and NorthernIreland (2006)
Gen
eral
pra
ctiti
oner
s pe
r 1,
000
popu
latio
n
Scot
land
Sout
h W
est
North
East
York
shire
and
The H
umbe
r
Lond
on
East
of En
gland
North
ern
Irelan
d
North
Wes
t
Sout
h Cen
tral
Wes
t Midl
ands
Sout
h Ea
st Coa
stW
ales
East
Midl
ands
Engla
nd
0.9
0.8
0.7
0.6
0.5
0.4
0.3
0.2
0.1
0
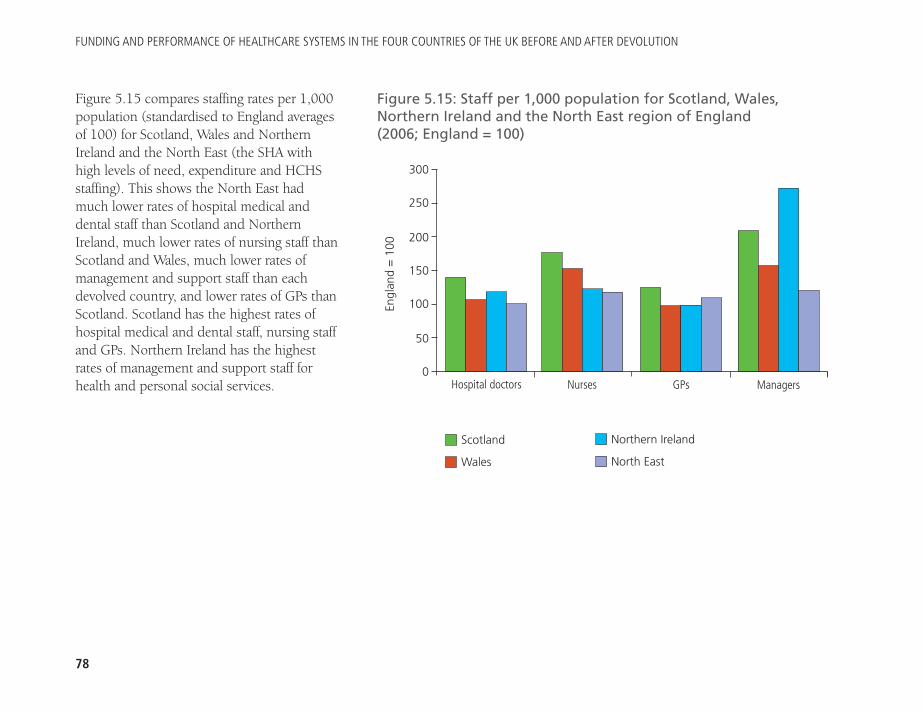
FUNDING AND PERFORMANCE OF HEALTHCARE SYSTEMS IN THE FOUR COUNTRIES OF THE UK BEFORE AND AFTER DEVOLUTION
78
Figure 5.15 compares staffing rates per 1,000population (standardised to England averagesof 100) for Scotland, Wales and NorthernIreland and the North East (the SHA withhigh levels of need, expenditure and HCHSstaffing). This shows the North East hadmuch lower rates of hospital medical anddental staff than Scotland and NorthernIreland, much lower rates of nursing staff thanScotland and Wales, much lower rates ofmanagement and support staff than eachdevolved country, and lower rates of GPs thanScotland. Scotland has the highest rates ofhospital medical and dental staff, nursing staffand GPs. Northern Ireland has the highestrates of management and support staff forhealth and personal social services.
Figure 5.15: Staff per 1,000 population for Scotland, Wales,Northern Ireland and the North East region of England (2006; England = 100)
300
250
200
150
100
50
0
Scotland
Wales
Northern Ireland
North East
NursesHospital doctors GPs ManagersEn
glan
d =
100
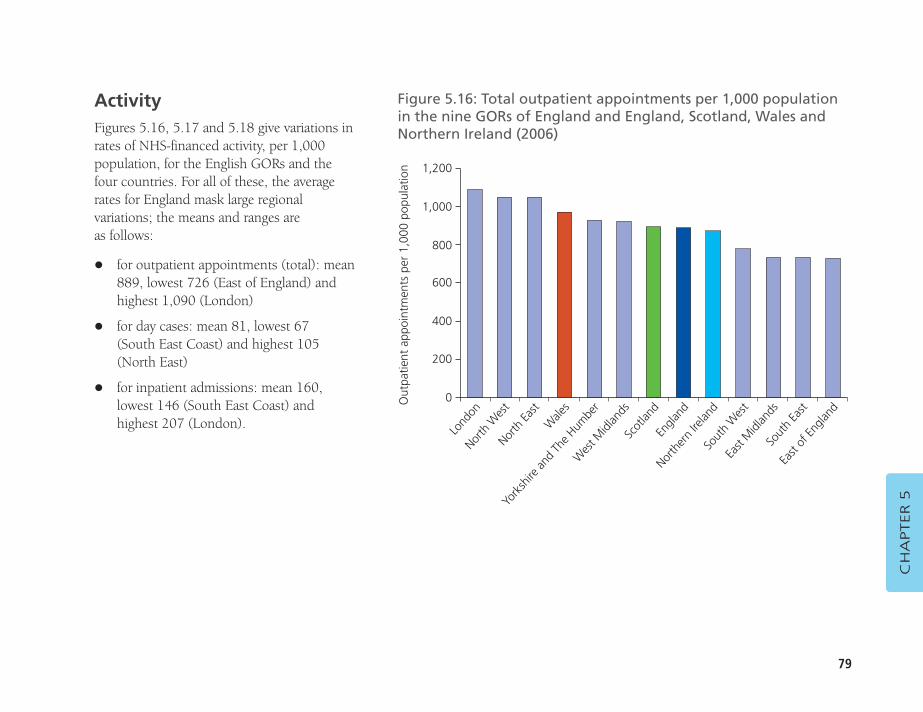
79
CH
APTER 5
ActivityFigures 5.16, 5.17 and 5.18 give variations inrates of NHS-financed activity, per 1,000population, for the English GORs and thefour countries. For all of these, the averagerates for England mask large regionalvariations; the means and ranges are as follows:
� for outpatient appointments (total): mean889, lowest 726 (East of England) andhighest 1,090 (London)
� for day cases: mean 81, lowest 67 (South East Coast) and highest 105(North East)
� for inpatient admissions: mean 160,lowest 146 (South East Coast) andhighest 207 (London).
Figure 5.16: Total outpatient appointments per 1,000 populationin the nine GORs of England and England, Scotland, Wales andNorthern Ireland (2006)
Out
patie
nt a
ppoi
ntm
ents
per
1,0
00 p
opul
atio
n
Lond
onNor
th W
est
North
East
Wale
sW
est M
idlan
ds
North
ern
Irelan
dSo
uth
Wes
t
Engla
nd
Scot
land
East
Midl
ands
Sout
h Ea
st
East
of En
gland
York
shire
and
The H
umbe
r
1,200
1,000
800
600
400
200
0
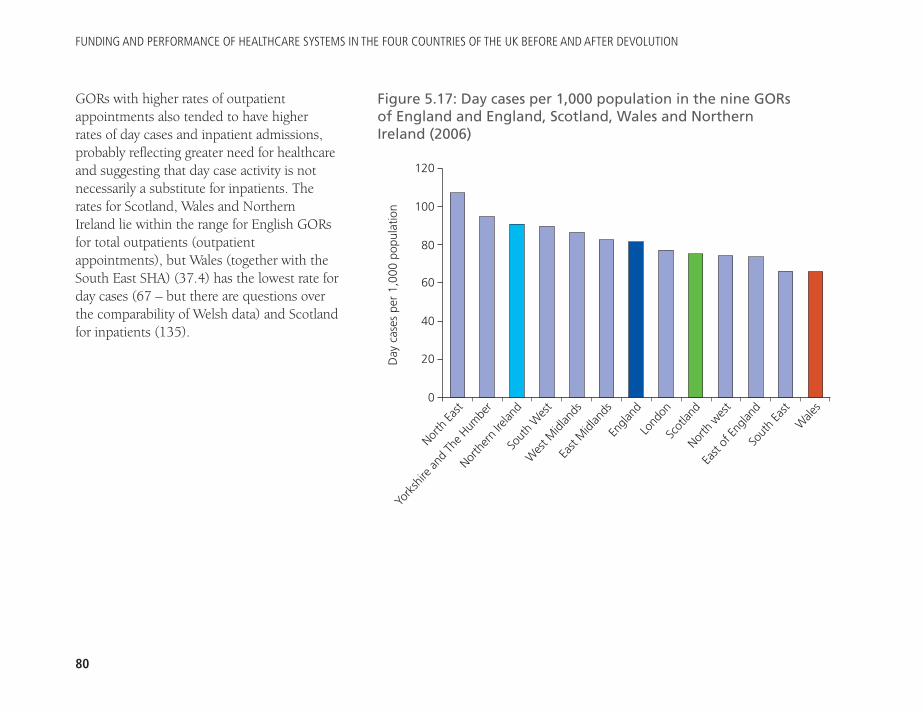
FUNDING AND PERFORMANCE OF HEALTHCARE SYSTEMS IN THE FOUR COUNTRIES OF THE UK BEFORE AND AFTER DEVOLUTION
80
GORs with higher rates of outpatientappointments also tended to have higher rates of day cases and inpatient admissions,probably reflecting greater need for healthcareand suggesting that day case activity is notnecessarily a substitute for inpatients. Therates for Scotland, Wales and Northern Ireland lie within the range for English GORsfor total outpatients (outpatientappointments), but Wales (together with theSouth East SHA) (37.4) has the lowest rate forday cases (67 – but there are questions overthe comparability of Welsh data) and Scotlandfor inpatients (135).
Figure 5.17: Day cases per 1,000 population in the nine GORs of England and England, Scotland, Wales and Northern Ireland (2006)
Day
cas
es p
er 1
,000
pop
ulat
ion
North
East
York
shire
and
The H
umbe
r
North
ern
Irelan
dSo
uth
Wes
tEa
st M
idlan
ds
Scot
land
North
wes
t
Lond
on
Engla
nd
East
of En
gland
Sout
h Ea
stW
ales
Wes
t Midl
ands
120
100
80
60
40
20
0
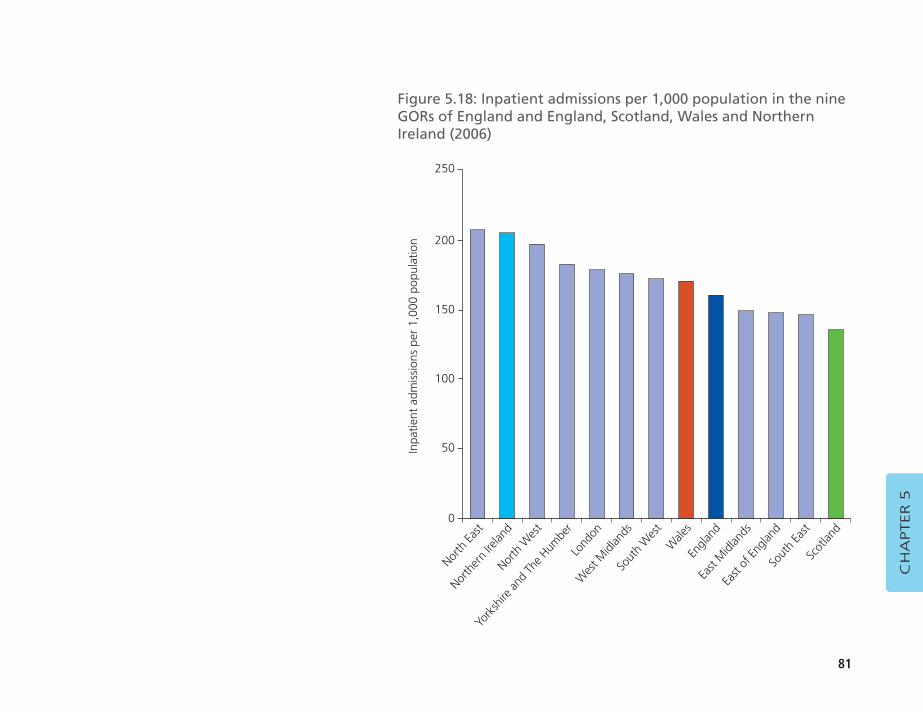
81
CH
APTER 5
Figure 5.18: Inpatient admissions per 1,000 population in the nineGORs of England and England, Scotland, Wales and NorthernIreland (2006)
Inpa
tient
adm
issi
ons
per
1,00
0 po
pula
tion
North
East
North
ern
Irelan
dNor
th W
est
York
shire
and
The H
umbe
rW
est M
idlan
ds
Engla
ndEa
st M
idlan
ds
Wale
s
Sout
h W
est
East
of En
gland
Sout
h Ea
stSc
otlan
d
Lond
on
250
200
150
100
50
0
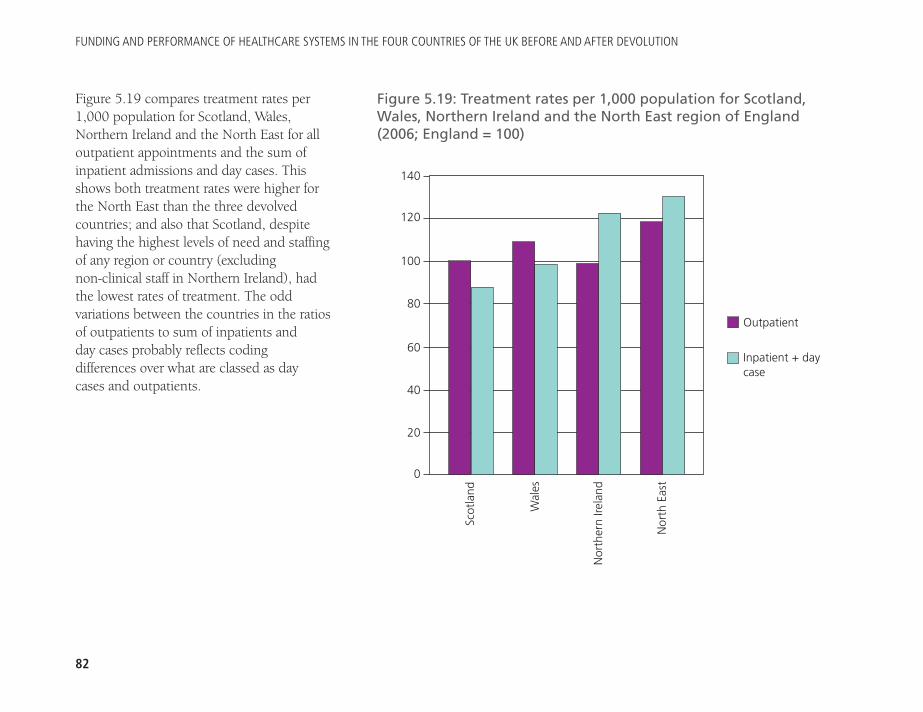
FUNDING AND PERFORMANCE OF HEALTHCARE SYSTEMS IN THE FOUR COUNTRIES OF THE UK BEFORE AND AFTER DEVOLUTION
82
Figure 5.19 compares treatment rates per1,000 population for Scotland, Wales,Northern Ireland and the North East for alloutpatient appointments and the sum ofinpatient admissions and day cases. Thisshows both treatment rates were higher forthe North East than the three devolvedcountries; and also that Scotland, despitehaving the highest levels of need and staffingof any region or country (excluding non-clinical staff in Northern Ireland), had the lowest rates of treatment. The oddvariations between the countries in the ratiosof outpatients to sum of inpatients and day cases probably reflects coding differences over what are classed as day cases and outpatients.
Figure 5.19: Treatment rates per 1,000 population for Scotland,Wales, Northern Ireland and the North East region of England(2006; England = 100)
140
120
100
80
60
40
20
0
Outpatient
Inpatient + daycase
Scot
land
Wal
es
Nor
ther
n Ire
land
Nor
th E
ast
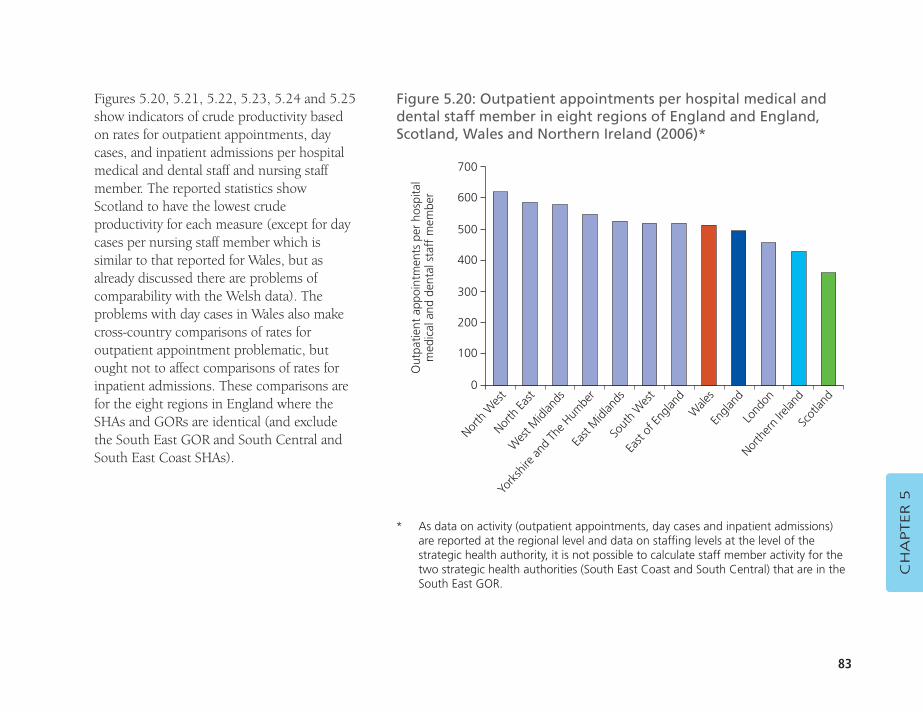
83
Figures 5.20, 5.21, 5.22, 5.23, 5.24 and 5.25show indicators of crude productivity basedon rates for outpatient appointments, daycases, and inpatient admissions per hospitalmedical and dental staff and nursing staffmember. The reported statistics showScotland to have the lowest crudeproductivity for each measure (except for daycases per nursing staff member which issimilar to that reported for Wales, but asalready discussed there are problems ofcomparability with the Welsh data). Theproblems with day cases in Wales also makecross-country comparisons of rates foroutpatient appointment problematic, butought not to affect comparisons of rates forinpatient admissions. These comparisons arefor the eight regions in England where theSHAs and GORs are identical (and excludethe South East GOR and South Central andSouth East Coast SHAs).
CH
APTER 5
Figure 5.20: Outpatient appointments per hospital medical anddental staff member in eight regions of England and England,Scotland, Wales and Northern Ireland (2006)*
Out
patie
nt a
ppoi
ntm
ents
per
hos
pita
lm
edic
al a
nd d
enta
l sta
ff m
embe
r
North
Wes
tNor
th Ea
st
Wes
t Midl
ands
York
shire
and
The H
umbe
r
Sout
h W
est
Engla
ndLo
ndon
Wale
s
East
of En
gland
North
ern
Irelan
dSc
otlan
d
East
Midl
ands
700
600
500
400
300
200
100
0
* As data on activity (outpatient appointments, day cases and inpatient admissions) are reported at the regional level and data on staffing levels at the level of thestrategic health authority, it is not possible to calculate staff member activity for thetwo strategic health authorities (South East Coast and South Central) that are in theSouth East GOR.
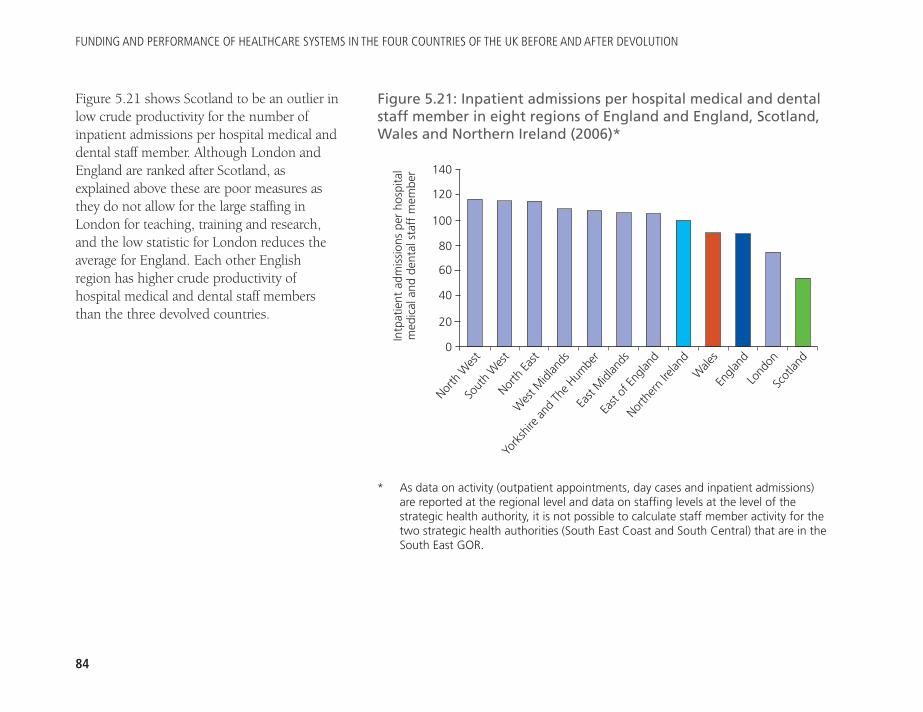
FUNDING AND PERFORMANCE OF HEALTHCARE SYSTEMS IN THE FOUR COUNTRIES OF THE UK BEFORE AND AFTER DEVOLUTION
84
Figure 5.21 shows Scotland to be an outlier inlow crude productivity for the number ofinpatient admissions per hospital medical anddental staff member. Although London andEngland are ranked after Scotland, asexplained above these are poor measures asthey do not allow for the large staffing inLondon for teaching, training and research,and the low statistic for London reduces theaverage for England. Each other Englishregion has higher crude productivity ofhospital medical and dental staff membersthan the three devolved countries.
Figure 5.21: Inpatient admissions per hospital medical and dentalstaff member in eight regions of England and England, Scotland,Wales and Northern Ireland (2006)*
Intp
atie
nt a
dmis
sion
s pe
r ho
spita
lm
edic
al a
nd d
enta
l sta
ff m
embe
r
North
Wes
tSo
uth
Wes
tNor
th Ea
st
Wes
t Midl
ands
East
Midl
ands
Wale
sEn
gland
North
ern
Irelan
d
East
of En
gland
Lond
onSc
otlan
d
York
shire
and
The H
umbe
r
140
120
100
80
60
40
20
0
* As data on activity (outpatient appointments, day cases and inpatient admissions) are reported at the regional level and data on staffing levels at the level of thestrategic health authority, it is not possible to calculate staff member activity for thetwo strategic health authorities (South East Coast and South Central) that are in theSouth East GOR.
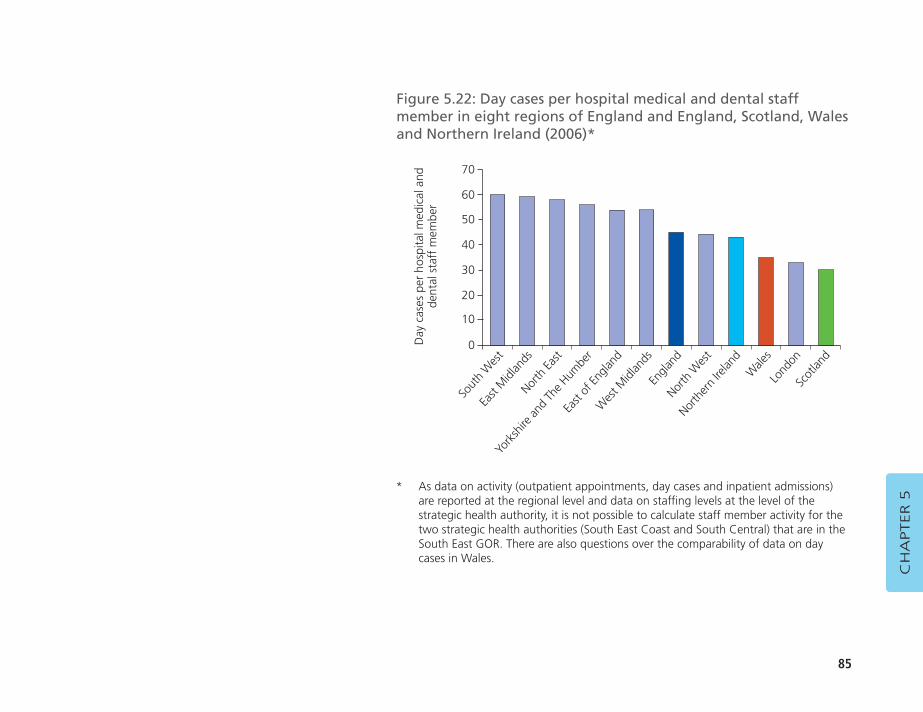
85
CH
APTER 5
Figure 5.22: Day cases per hospital medical and dental staffmember in eight regions of England and England, Scotland, Walesand Northern Ireland (2006)*
Day
cas
es p
er h
ospi
tal m
edic
al a
ndde
ntal
sta
ff m
embe
r
Sout
h W
est
East
Midl
ands
North
East
York
shire
and
The H
umbe
rW
est M
idlan
ds
North
ern
Irelan
dW
ales
North
Wes
t
Engla
nd
Lond
onSc
otlan
d
East
of En
gland
70
60
50
40
30
20
10
0
* As data on activity (outpatient appointments, day cases and inpatient admissions) are reported at the regional level and data on staffing levels at the level of thestrategic health authority, it is not possible to calculate staff member activity for thetwo strategic health authorities (South East Coast and South Central) that are in theSouth East GOR. There are also questions over the comparability of data on daycases in Wales.
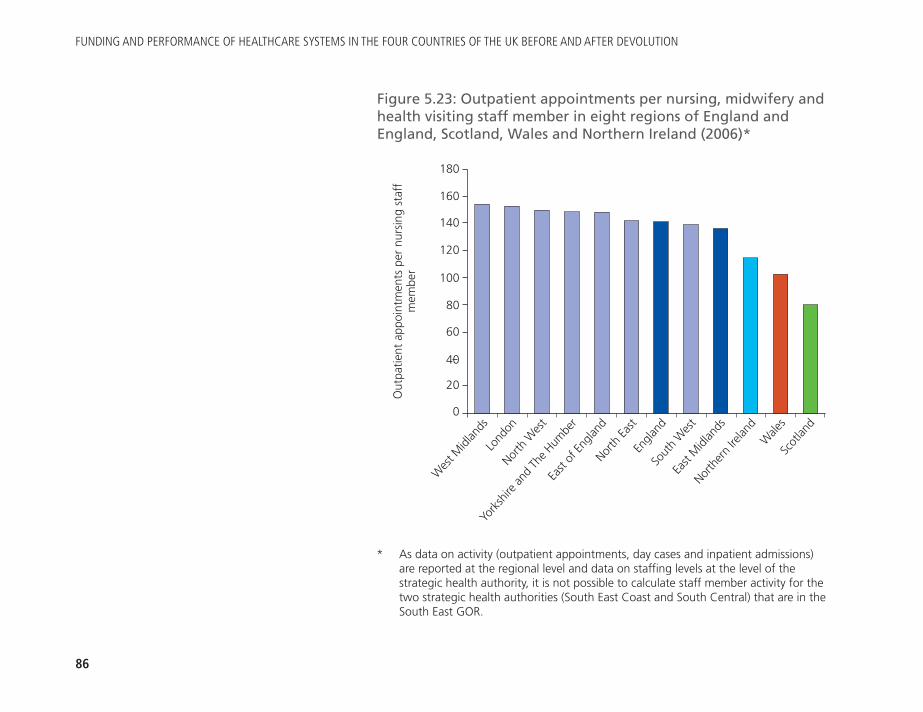
FUNDING AND PERFORMANCE OF HEALTHCARE SYSTEMS IN THE FOUR COUNTRIES OF THE UK BEFORE AND AFTER DEVOLUTION
86
Figure 5.23: Outpatient appointments per nursing, midwifery andhealth visiting staff member in eight regions of England andEngland, Scotland, Wales and Northern Ireland (2006)*
Out
patie
nt a
ppoi
ntm
ents
per
nur
sing
sta
ffm
embe
r
Wes
t Midl
ands
Lond
onNor
th W
est
York
shire
and
The H
umbe
r
North
East
East
Midl
ands
North
ern
Irelan
d
Sout
h W
est
Engla
nd
Wale
sSc
otlan
d
East
of En
gland
* As data on activity (outpatient appointments, day cases and inpatient admissions) are reported at the regional level and data on staffing levels at the level of thestrategic health authority, it is not possible to calculate staff member activity for thetwo strategic health authorities (South East Coast and South Central) that are in theSouth East GOR.
180
160
140
120
100
80
60
40
20
0
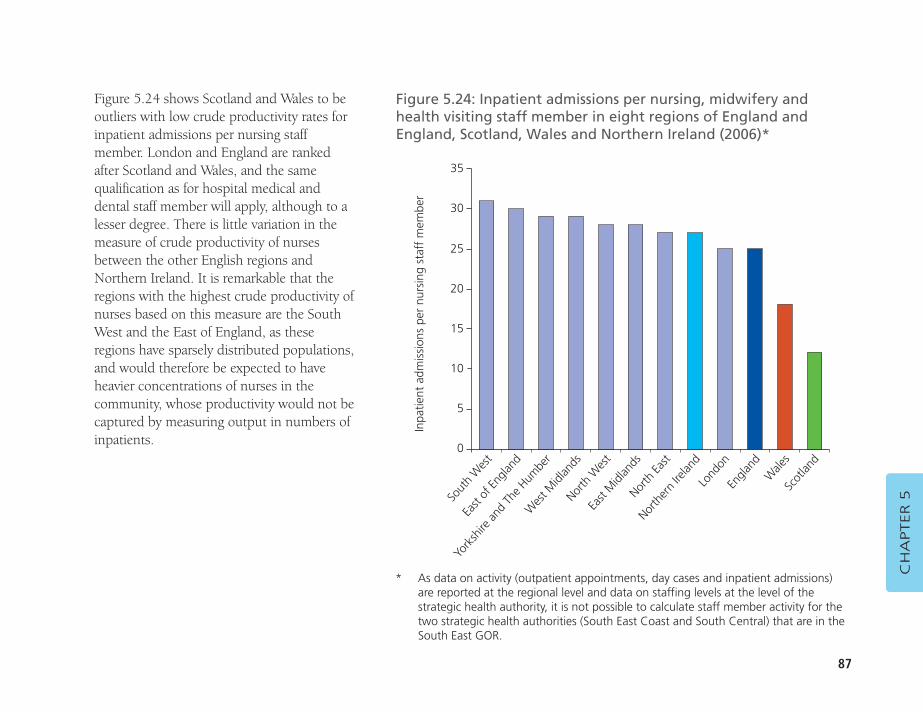
87
Figure 5.24 shows Scotland and Wales to beoutliers with low crude productivity rates forinpatient admissions per nursing staffmember. London and England are rankedafter Scotland and Wales, and the samequalification as for hospital medical anddental staff member will apply, although to alesser degree. There is little variation in themeasure of crude productivity of nursesbetween the other English regions andNorthern Ireland. It is remarkable that theregions with the highest crude productivity ofnurses based on this measure are the SouthWest and the East of England, as theseregions have sparsely distributed populations,and would therefore be expected to haveheavier concentrations of nurses in thecommunity, whose productivity would not becaptured by measuring output in numbers ofinpatients.
CH
APTER 5
Figure 5.24: Inpatient admissions per nursing, midwifery andhealth visiting staff member in eight regions of England andEngland, Scotland, Wales and Northern Ireland (2006)*
Inpa
tient
adm
issi
ons
per
nurs
ing
staf
f m
embe
r
Sout
h W
est
East
of En
gland
York
shire
and
The H
umbe
r
Wes
t Midl
ands
East
Midl
ands
Lond
onEn
gland
North
ern
Irelan
d
North
East
Wale
sSc
otlan
d
North
Wes
t
* As data on activity (outpatient appointments, day cases and inpatient admissions) are reported at the regional level and data on staffing levels at the level of thestrategic health authority, it is not possible to calculate staff member activity for thetwo strategic health authorities (South East Coast and South Central) that are in theSouth East GOR.
35
30
25
20
15
10
5
0
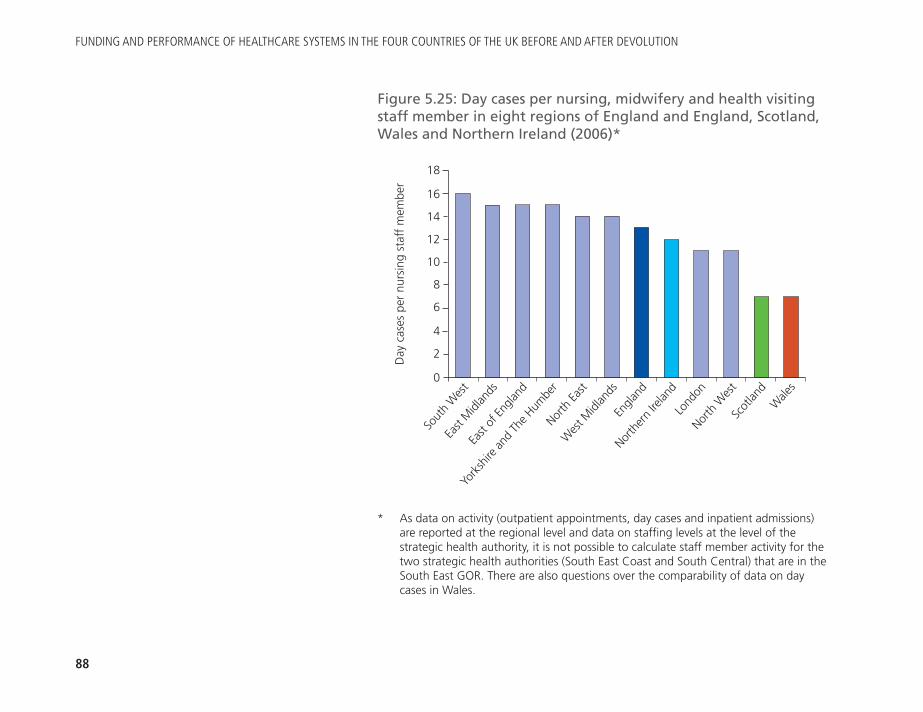
FUNDING AND PERFORMANCE OF HEALTHCARE SYSTEMS IN THE FOUR COUNTRIES OF THE UK BEFORE AND AFTER DEVOLUTION
88
Figure 5.25: Day cases per nursing, midwifery and health visitingstaff member in eight regions of England and England, Scotland,Wales and Northern Ireland (2006)*
Day
cas
es p
er n
ursi
ng s
taff
mem
ber
Sout
h W
est
East
Midl
ands
East
of En
gland
York
shire
and
The H
umbe
rW
est M
idlan
ds
Lond
onNor
th W
est
North
ern
Irelan
d
Engla
nd
Scot
land
Wale
s
North
East
* As data on activity (outpatient appointments, day cases and inpatient admissions) are reported at the regional level and data on staffing levels at the level of thestrategic health authority, it is not possible to calculate staff member activity for thetwo strategic health authorities (South East Coast and South Central) that are in theSouth East GOR. There are also questions over the comparability of data on daycases in Wales.
18
16
14
12
10
8
6
4
2
0
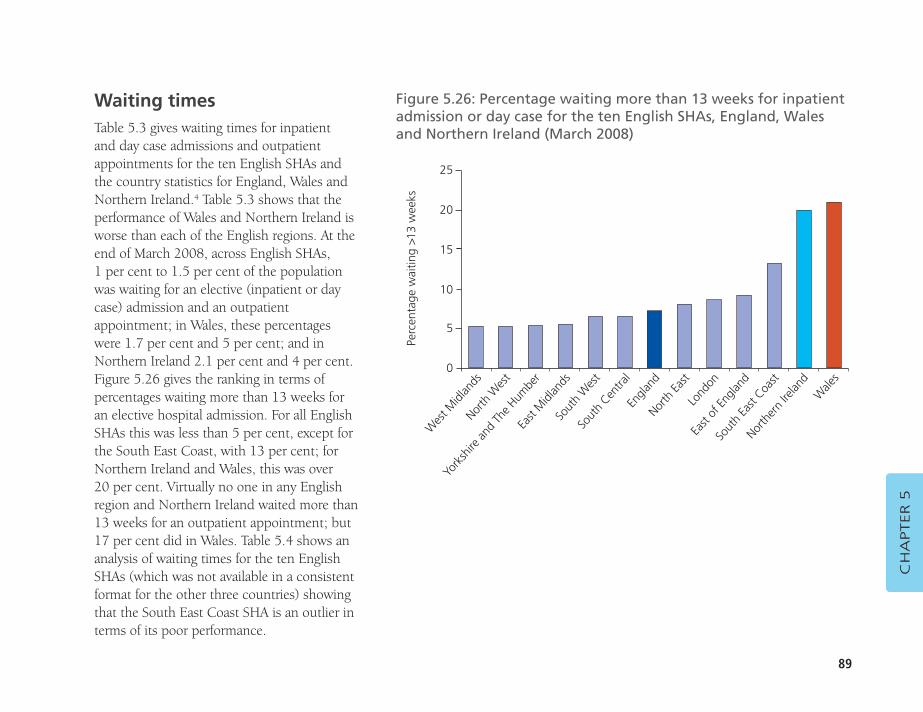
89
Waiting timesTable 5.3 gives waiting times for inpatient and day case admissions and outpatientappointments for the ten English SHAs andthe country statistics for England, Wales andNorthern Ireland.4 Table 5.3 shows that theperformance of Wales and Northern Ireland isworse than each of the English regions. At theend of March 2008, across English SHAs, 1 per cent to 1.5 per cent of the populationwas waiting for an elective (inpatient or daycase) admission and an outpatientappointment; in Wales, these percentageswere 1.7 per cent and 5 per cent; and inNorthern Ireland 2.1 per cent and 4 per cent.Figure 5.26 gives the ranking in terms ofpercentages waiting more than 13 weeks foran elective hospital admission. For all EnglishSHAs this was less than 5 per cent, except forthe South East Coast, with 13 per cent; forNorthern Ireland and Wales, this was over 20 per cent. Virtually no one in any Englishregion and Northern Ireland waited more than13 weeks for an outpatient appointment; but17 per cent did in Wales. Table 5.4 shows ananalysis of waiting times for the ten EnglishSHAs (which was not available in a consistentformat for the other three countries) showingthat the South East Coast SHA is an outlier interms of its poor performance.
CH
APTER 5
Figure 5.26: Percentage waiting more than 13 weeks for inpatientadmission or day case for the ten English SHAs, England, Walesand Northern Ireland (March 2008)
Perc
enta
ge w
aitin
g >1
3 w
eeks
Wes
t Midl
ands
Nor
th W
est
York
shire
and
The H
umbe
rEa
st M
idlan
dsSo
uth
Centra
l
Lond
on
East
of En
gland
North
East
Engla
nd
Sout
h Ea
st Coa
st
North
ern
Irelan
dW
ales
Sout
h W
est
25
20
15
10
5
0
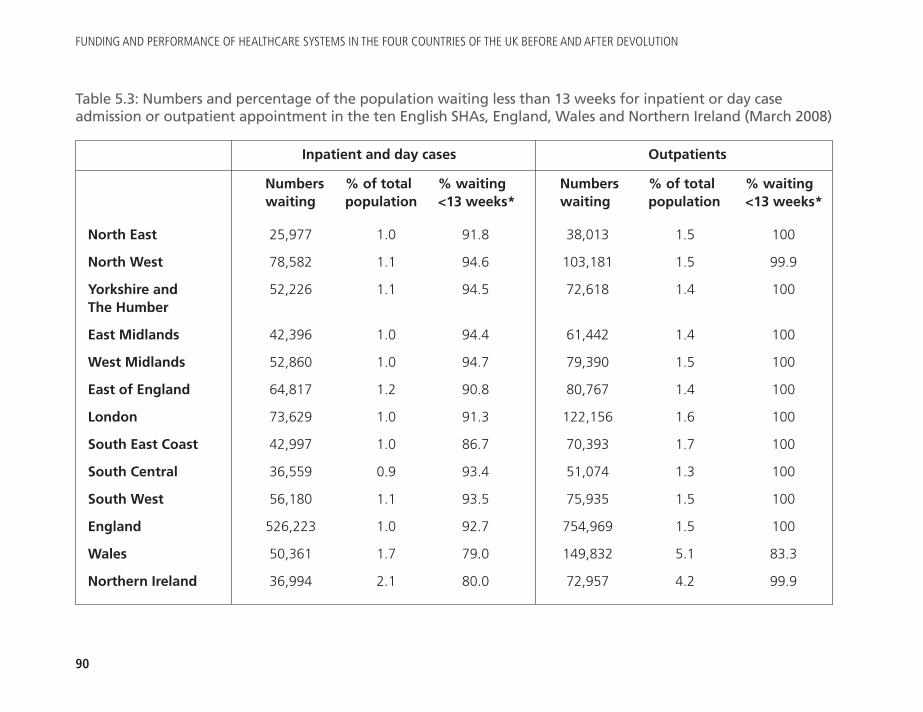
FUNDING AND PERFORMANCE OF HEALTHCARE SYSTEMS IN THE FOUR COUNTRIES OF THE UK BEFORE AND AFTER DEVOLUTION
90
Inpatient and day cases Outpatients
Numbers % of total % waiting Numbers % of total % waiting waiting population <13 weeks* waiting population <13 weeks*
North East 25,977 1.0 91.8 38,013 1.5 100
North West 78,582 1.1 94.6 103,181 1.5 99.9
Yorkshire and 52,226 1.1 94.5 72,618 1.4 100The Humber
East Midlands 42,396 1.0 94.4 61,442 1.4 100
West Midlands 52,860 1.0 94.7 79,390 1.5 100
East of England 64,817 1.2 90.8 80,767 1.4 100
London 73,629 1.0 91.3 122,156 1.6 100
South East Coast 42,997 1.0 86.7 70,393 1.7 100
South Central 36,559 0.9 93.4 51,074 1.3 100
South West 56,180 1.1 93.5 75,935 1.5 100
England 526,223 1.0 92.7 754,969 1.5 100
Wales 50,361 1.7 79.0 149,832 5.1 83.3
Northern Ireland 36,994 2.1 80.0 72,957 4.2 99.9
Table 5.3: Numbers and percentage of the population waiting less than 13 weeks for inpatient or day caseadmission or outpatient appointment in the ten English SHAs, England, Wales and Northern Ireland (March 2008)
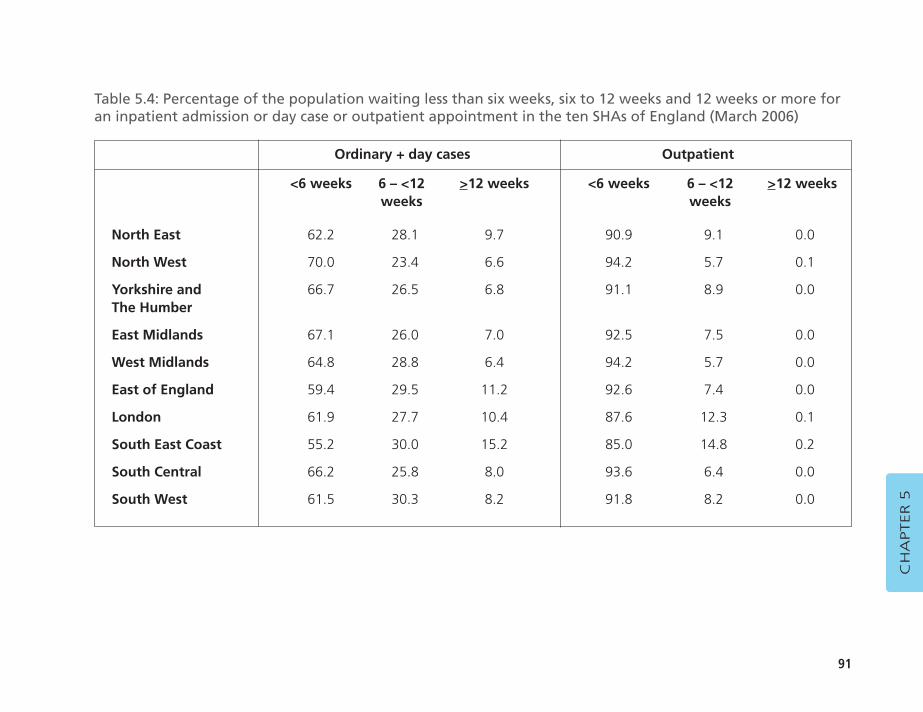
91
CH
APTER 5
Ordinary + day cases Outpatient
<6 weeks 6 – <12 >12 weeks <6 weeks 6 – <12 >12 weeksweeks weeks
North East 62.2 28.1 9.7 90.9 9.1 0.0
North West 70.0 23.4 6.6 94.2 5.7 0.1
Yorkshire and 66.7 26.5 6.8 91.1 8.9 0.0The Humber
East Midlands 67.1 26.0 7.0 92.5 7.5 0.0
West Midlands 64.8 28.8 6.4 94.2 5.7 0.0
East of England 59.4 29.5 11.2 92.6 7.4 0.0
London 61.9 27.7 10.4 87.6 12.3 0.1
South East Coast 55.2 30.0 15.2 85.0 14.8 0.2
South Central 66.2 25.8 8.0 93.6 6.4 0.0
South West 61.5 30.3 8.2 91.8 8.2 0.0
Table 5.4: Percentage of the population waiting less than six weeks, six to 12 weeks and 12 weeks or more foran inpatient admission or day case or outpatient appointment in the ten SHAs of England (March 2006)
The devolved countries as outliersBox 5.1 identifies those indicators for which Scotland, Walesand Northern Ireland are outliers, as compared with thedistribution for English regions. Box 5.1 identifies outliers inthree ways, as areas having a value more extreme than:
� the values for all English regions and the average forEngland (< or >)
� the value for all English regions except London (<* or >*)
� the value for all English regions except London and theaverage for England (<** or >**).
Box 5.1 shows Scotland to be an outlier in all domains forwhich there are comparable statistics with the highest levels of poor health; highest rates per capita of expenditure and all types of staff; the lowest rates of inpatient admissions; and the lowest rates of crude productivity for hospital doctorsand nurses.
Box 5.1 shows Wales and Northern Ireland also to be outliers insimilar ways: with high rates per capita of expenditure and stafffor HCHS (but not GPs); low crude productivity for hospitaldoctors and nurses; and poor performance in terms of longwaiting times for outpatients and inpatients.
1. In the extreme case, comparing Northern Ireland (population 1.7 million)with England (population 50 million) is misleading as about half of thepopulation of Northern Ireland live in the urban area of Belfast.
2. Wanless (2003) op. cit.
3. As above, the numbers for all staff are for whole time equivalents exceptfor GPs, for which the data give a head count only.
4. As explained above, the way Scotland reports these statistics is notcomparable with the other countries, but Propper and others (2008a and2008b) op. cit. have shown Scotland’s performance has been worse thanEngland in waiting for elective admission.
FUNDING AND PERFORMANCE OF HEALTHCARE SYSTEMS IN THE FOUR COUNTRIES OF THE UK BEFORE AND AFTER DEVOLUTION
92
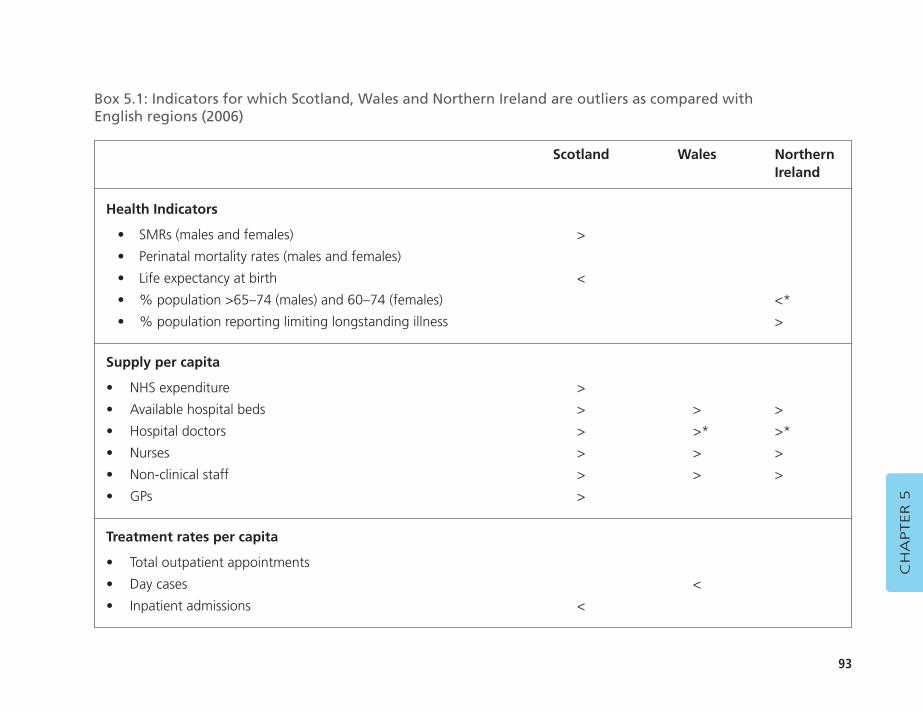
93
CH
APTER 5
Scotland Wales Northern Ireland
Health Indicators
• SMRs (males and females) >
• Perinatal mortality rates (males and females)
• Life expectancy at birth <
• % population >65–74 (males) and 60–74 (females) <*
• % population reporting limiting longstanding illness >
Supply per capita
• NHS expenditure >
• Available hospital beds > > >
• Hospital doctors > >* >*
• Nurses > > >
• Non-clinical staff > > >
• GPs >
Treatment rates per capita
• Total outpatient appointments
• Day cases <
• Inpatient admissions <
Box 5.1: Indicators for which Scotland, Wales and Northern Ireland are outliers as compared with English regions (2006)
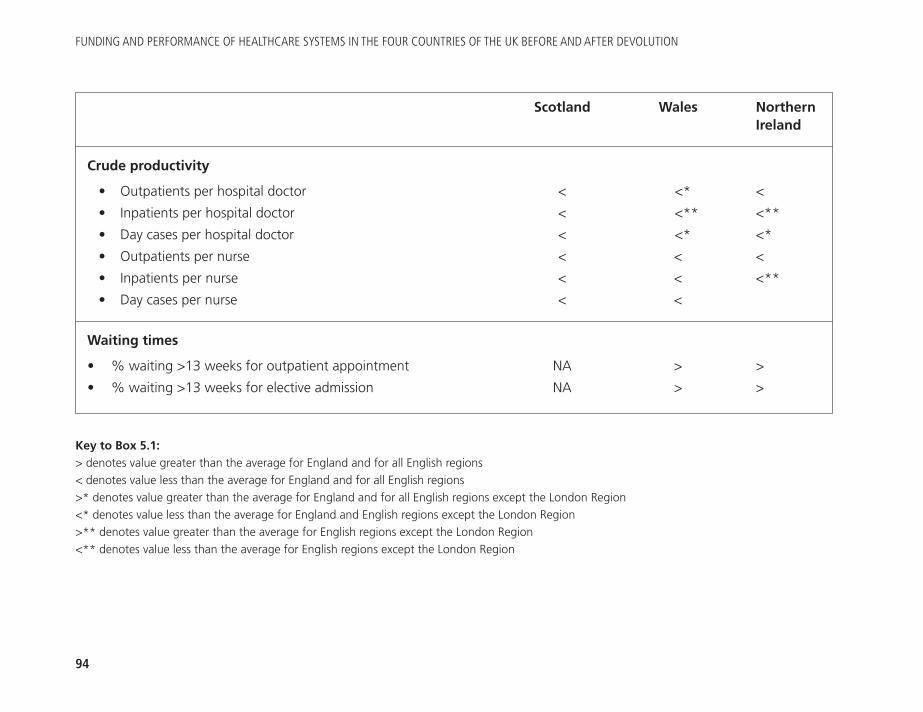
FUNDING AND PERFORMANCE OF HEALTHCARE SYSTEMS IN THE FOUR COUNTRIES OF THE UK BEFORE AND AFTER DEVOLUTION
94
Scotland Wales Northern Ireland
Crude productivity
• Outpatients per hospital doctor < <* <
• Inpatients per hospital doctor < <** <**
• Day cases per hospital doctor < <* <*
• Outpatients per nurse < < <
• Inpatients per nurse < < <**
• Day cases per nurse < <
Waiting times
• % waiting >13 weeks for outpatient appointment NA > >
• % waiting >13 weeks for elective admission NA > >
Key to Box 5.1:> denotes value greater than the average for England and for all English regions < denotes value less than the average for England and for all English regions >* denotes value greater than the average for England and for all English regions except the London Region <* denotes value less than the average for England and English regions except the London Region >** denotes value greater than the average for English regions except the London Region <** denotes value less than the average for English regions except the London Region
95
CH
APTER 6
CHAPTER 6DISCUSSION
The various commentators on policy developments followingpolitical devolution in the UK have pointed out that theresultant policy differences mean that it is no longer meaningfulto talk of a ‘UK NHS’: there are now four different NHSs withfour governments’ policies set on different paths. The period ofpolicy divergence developed over a period of massive increasesin NHS funding for each country, which financed largeincreases in staffing. Each country had targets for hospitalwaiting times and ambulance response times; but only inEngland from 2000 was there a system of public reporting inthe form of annual ‘star ratings’ and the ‘Health Check’, backedup by active performance management that sought to changethe culture from one of perversely rewarding failure (by givingextra resources to hospitals with long waiting times, forexample) to a new system of penalising managers for providerfailure and rewarding them for success in achieving targets.
From 2002, these systems were accompanied by a package ofsystem reforms designed to develop a pluralistic providermarket driven by patient choice. The target-driven approachtogether with increased funding was followed by a
transformation in waiting times for elective care: in 2001, inEngland, the targets for waiting times would allow a patienthaving been referred by a GP to wait more than two years for anelective admission to hospital; by 2008 that target was reducedto 18 weeks.
The reintroduction of a provider market, however, appears tohave had minimal impact so far.1 Government policies inScotland and Wales have increasingly diverged from those inEngland: instead of an emphasis on patients choosing betweencompeting pluralist providers, these governments favour apublicly owned NHS run by authorities that are integrated withproviders. Political devolution in the UK provides a uniqueopportunity in the form of a natural experiment to examine theimpact of diverging policies in translating inputs into servicedelivery and improving quality.
In 2005, two of the authors reported a comparison of theperformance of the NHS in the four countries of the UKcovering the period 1996 to 2002, before and immediately afterpolitical devolution. The headline findings of that analysis werethe absence of any obvious link between spending per capita
FUNDING AND PERFORMANCE OF HEALTHCARE SYSTEMS IN THE FOUR COUNTRIES OF THE UK BEFORE AND AFTER DEVOLUTION
96
and performance (the data did not suggest that the UKcountries with higher levels of real healthcare resources orexpenditure had more activity, better population health, orhigher levels of public satisfaction), and the fact that Englandhad much shorter waiting times in the post-devolution periodthan Wales or Northern Ireland (there were no comparable datafor Scotland).
This latest cross-country analysis takes the story as far as 2006and produces similar findings. Earlier this year, Sutherland andCoyle reported cross-country comparisons at various times(mainly cross-sectional) of a range of indicators of quality ofcare, using routinely collected data, across six domains ofquality: effectiveness, access and timeliness, capacity, safety,patient centredness and equity.2 Some of these domains overlapwith what has been reported here. They too found: thatScotland had the highest per capita spend and England thelowest (for 2007/08); England had the highest life expectancy(for both males and females); Scotland continued to have thehighest mortality rates in most major disease groups (but thesteepest decreases in recent years); and problems in comparingwaiting time performance (they reported median waiting timesfor selected procedures).3 Other key messages included:
� in terms of the three guidelines of the Royal College ofRadiotherapists for waiting for treatment for radiotherapy,Scotland performed relatively poorly and Northern Ireland well
� general practices in Scotland and Northern Ireland generallyrecorded the highest rates for providing care consistent withevidence-based practice
� reported rates for timely reperfusion in heart attack patientswere much lower in Wales than in England
� the lowest vaccination rates for two-year-olds were inEngland, and for flu (for the over-65s) were in Wales
� all countries face problems with healthcare associatedinfections (in particular for MRSA and Clostridium difficile),though rates for MRSA have been reduced substantially in England
� respondents in Scotland were most positive about theirquality of care (based on surveys in 2005 and 2006 by theCommonwealth Fund)
� in all countries, there were material differences in lifeexpectancy and mortality rates from major diseases betweenthe least and most socio-economically deprived sections ofthe population.
The analysis by Sutherland and Coyle of performance of thefour countries across a range of indicators in six domains ofquality of care showed that:
� across the UK, there have been improvements in qualityand outcomes, but the UK is still often worse than, forexample, other European countries4
� there were few important differences between each country
� there is no systematic pattern in which one countryconsistently performed better than any other.
In contrast, the current analysis has identified important andsystematic differences between countries in terms of waitingtimes, ambulance response times to emergency calls, and crude
97
� In 1996 and 2006, Scotland had the highest, and Englandthe lowest, rates per capita of expenditure, nurses, hospitalmedical and dental staff, and GPs (except in 2006, whenWales had the lowest rate for GPs). The relative excess ofrates in Scotland over England narrowed for per capitaexpenditure and GPs, remained relatively constant forhospital medical and dental staff, but almost doubled fornursing staff.
� In 1996 and 2006, Northern Ireland had the highest, andEngland the lowest, rates per capita of management andsupport staff (which includes health and personal socialservices in Northern Ireland). The excess rate of NorthernIreland over England increased from about 70 per cent in1996 to 170 per cent in 2006.
� In 1996, Scotland had the highest rates per capita foroutpatient appointments, day cases and inpatientadmissions. In 2006, Northern Ireland had the highestrates for day cases and inpatient admissions, and Wales hadthe highest rates for outpatient appointments.
� In 1996, England had the lowest rates per capita foroutpatient appointments and inpatient admissions, andNorthern Ireland the lowest rates for day cases. In 2006,Scotland had the lowest rates for outpatient appointmentsand inpatient admissions, and Wales the lowest rates forday cases.
� In 1996 and 2006, Scotland had the lowest rates ofoutpatient appointments and inpatient admissions perhospital medical and dental staff member. In 1996, Englandhad the highest rates of outpatient appointments and
productivity of hospital doctors and nurses. England continuesto have the lowest level of funding per capita, but appears fromthe limited data available to have a more responsive service asassessed by waiting times and seems to make better use of itskey resources – its staff. The regional analysis helps corroboratethese findings, as indicators at this level show systemicdifferences that are more likely to be due to policy differences.
The limited scope of the report is largely due to the lack ofroutinely collected data on healthcare performance that arecomparable across the four countries and over time. There arealso important gaps in data on quality of care and in patients’experiences of the NHS across the UK. In England there havebeen important developments since 2001 in annual reportingof patients’ experiences with NHS hospital and GP care.5 FromApril 2009, in England only there has been the introduction ofpatient reported outcomes following hospital discharge6 (for hipreplacements, knee replacements, groin hernia surgery andvaricose vein surgery).
The measures of crude productivity do not fully capture thevalue of outputs (changes in quality and outcomes) or costs of inputs (the large pay awards made to hospital medical anddental staff and the new GP contract).7 The authors havereported a limited set of cross-country indicators over time.Even those indicators have some problems: the differentdefinition of waiting times for patients on waiting lists inScotland; and questions over the comparability of data onWelsh day cases and outpatients, and Scottish inpatients.
The principal findings from cross-country longitudinalcomparisons are as follows:
CH
APTER 6
FUNDING AND PERFORMANCE OF HEALTHCARE SYSTEMS IN THE FOUR COUNTRIES OF THE UK BEFORE AND AFTER DEVOLUTION
98
inpatient admissions; in 2006, Wales and Northern Irelandhad the highest rates (but regional analysis given belowshows that average rates for England are misleading).
� In 1996, Northern Ireland and Wales had the lowest ratesof outpatient appointments and inpatient admissions pernursing staff member; in 2006, Scotland had the lowestrates. In 1996, England had the highest rates; in 2006,England and Northern Ireland had the highest rates.
� England consistently had the best performance – over thetime for which comparable data exist – for waiting times forinpatients and outpatients, and for ambulance responserates to what may have been life-threatening emergencies.
This report presents for the first time a comparison of the threedevolved countries with the English regions. The analysis hashighlighted the limitations of using average statistics forEngland and offers a much sounder basis for comparisons withthe three devolved countries for the following reasons:
� Size: the populations of the nine English governmentregional offices range from 2.4 to 8.2 million people and arehence more comparable than England with NorthernIreland, Wales and Scotland (with populations ranging from1.7 to five million).
� The unrepresentative nature of London distorts the nationalaverages for spending and staffing per capita, and the crudeproductivity of hospital doctors and nurses, because of thehigher costs of its labour markets; and expenditure andstaffing per capita due to the massive concentrations ofteaching, training and research.
� Population characteristics: the north/south divide meansthat the socio-economic and morbidity characteristics ofthe north are more typical of the devolved countries, andthe North East, in particular, is a much better benchmarkthan England as a whole in terms of comparing inputs,crude productivity and performance with the threedevolved countries.
The regional analysis shows that the devolved countries havenot matched the performance in England:
� All English regions had better performance than Wales andNorthern Ireland for hospital waiting times (there were nocomparable data for Scotland).
� All English regions (except London) have higher crudeproductivity of hospital doctors for inpatients thanScotland, Wales and Northern Ireland.
� All English regions (except London) have higher crudeproductivity of nurses for inpatients than Scotland or Wales(but not Northern Ireland).
� Comparing Scotland with all English regions (exceptLondon) shows that Scotland had the highest standardisedmortality ratios, lowest life expectancy, highest levels ofexpenditure and staffing, and the lowest levels of crudeproductivity of hospital doctors and nurses.
� Comparing Wales and Northern Ireland with the NorthEast shows that Wales and Northern Ireland hadexpenditure similar to that of the North East, but worseperformance in terms of hospital waiting times, ambulance
99
Farrar and others9 sought to examine the impact of the newsystem of ‘payment by results’ (PbR), introduced in England sothat hospitals are paid a fixed tariff (based on estimated nationalaverage costs) for different types of cases (defined by HealthcareResource Groups). PbR was introduced at different times forNHS Foundation Trusts and NHS (non-Foundation) Trusts from2003/04 to 2005/06. PbR creates financial incentives forhospitals to reduce costs and increase the numbers of casesthey treat, with concerns over incentives to skimp on quality or discharge patients too early. In contrast, in Scotland, therewas no tariff system for funding hospitals (other than for cross-boundary flows), and hence only weak financialincentives to reduce costs and treat more numbers.10
Farrar and others compared productivity for different types ofhospitals in England with hospitals in Scotland over the periodfrom 2003/04 to 2005/06, and estimated that productivityimproved slightly in England as compared with Scotland.11
They emphasise that PbR was not the only key differencedriving this improved productivity and specifically cited thegreater pressure on English hospitals to reduce waiting times.They found no statistically significant differences betweenhospitals in England and Scotland for the three variables theyused to measure quality (in-hospital mortality, 30-daypostsurgical mortality, and emergency readmission aftertreatment for hip fracture), except that for NHS FoundationTrusts, there was a reduction in in-hospital mortality (ascompared with hospitals in Scotland) after the impact of twoyears of PbR. They tentatively concluded that reductions inhospital costs in England had been achieved by increases inefficiency rather than reductions in quality.
response times and crude productivity of hospital doctors(crude productivity of nurses in Northern Ireland wasmarginally higher than in the North East, but in Wales wasmuch lower than in the North East). The North East alsohad a lower level of non-clinical staff.
It may, of course, be that the better relative performance of the NHS in England on the measures reported here, compared with that of the devolved countries, is offset by those countries having better performance on dimensions that were not measured in this report. However, three moredetailed studies that compared performance in England withScotland (two) and with Wales (one) found little evidence thatthis was so. Propper and others compared the effects ofdifferent policy emphases and instruments for targets forwaiting times after devolution between England and Scotland.8
They found some evidence of waiting list manipulation inEngland (where the number of suspensions and removalsincreased as a result of the policy), but their principalconclusion was (p27):
This paper provides evidence that, contrary to popular views, apolicy of targets for waiting lists in the English NHS appears tohave achieved its objectives. The length of time patients waited felland admissions for elective care rose. This fall in waiting times wasachieved without many of the gaming activities that had beenforecast. The waiting times distribution did not stack up at themaximum waiting point, the order in which patients were treatedfrom the list did not appear to change, the proportion of urgentcases treated did not fall and there is no evidence of a decrease inseveral measures of quality of care as a result of the policy.
CH
APTER 6
FUNDING AND PERFORMANCE OF HEALTHCARE SYSTEMS IN THE FOUR COUNTRIES OF THE UK BEFORE AND AFTER DEVOLUTION
100
Hauck and Street12 compared the performance of four NHShospitals on the border between England and Wales – threewere located in England and one in Wales (the North EastWales Trust) – over six financial years (from 1997/98, prior todevolution, to 2002/03). They too drew attention to thedifferent policy emphases and instruments after devolutionbetween England and Wales.13 They concluded:
There is evidence that the English hospitals exerted more effortthan the Welsh hospital over the six-year period. When comparingtrends across hospitals, there are similarities among those locatedin England and differences to the North East Wales Trust. TheEnglish hospitals increased levels of activity, reduced length of stayand undertook proportionately more day case activity over theperiod. Activity levels remained constant at the Welsh hospital, theproportion of day case activity fell, and proportionately more non-elective patients were admitted.
There is no evidence that the English hospitals achieved activityincreases by compromising on quality. Mortality rates at theEnglish hospitals remained low or declined further over the period,but the high and rising hospital mortality rates at the North EastWales Trust are cause for concern. It may be that higher mortalityrates at the North East Wales Trust are due partly to theproportionate increase in non-electives admitted to the hospital.
Hauck and Street also point out that commentators havesuggested that in the immediate post-devolution period theWelsh Minister for Health and Social Services reduced attentionon waiting-time targets in Wales and instead ‘emphasised whathas been termed “joined up working” focusing on partnerships
between health, local government and the voluntary sector’. Itis unclear whether sufficient off-setting benefits were generatedto justify the shift in policy focus, but, as they argued, thesubsequent reintroduction of targets in Wales suggests not.Indeed, in an adjournment debate in 2003, in the (UK) Houseof Commons,14 on the Welsh Wanless report,15 Members ofParliament (MPs) representing constituencies in Waleshighlighted the poor performance of the NHS in Wales onwaiting times.
Although there have been significant improvements in theperformance of the NHS in Wales thanks to the government’srecord investment in public services, waiting lists are stillunacceptably high and there is a danger that if the Assembly doesnot pursue reform as vigorously as it is pursued in England, theNHS in Wales will fall even further behind.... Of course, waitinglists and times are not the only measure of performance, but Ibelieve that they are a crucial indicator of the extent to which extrainvestment is being used effectively.... Of those Welsh residentswaiting for in-patient treatment on that date [31 March 2003], 16 per cent had been waiting for more than 12 months, comparedwith zero per cent in England, and 5,200 Welsh residents – sevenper cent of the total – had been waiting for more than 18 monthsfor treatment... some people on orthopaedic waiting lists have towait four and a half years for the operation that they need.
The NHS in each country, having experienced seven years of‘feast’ (from unprecedented annual increases in ‘real’ growth),now faces the prospect of a similar period of ‘famine’ (or at bestlittle or no ‘real’ growth).16 The government in England usedthe years of ‘feast’ to reduce long waiting times, and
101
These differences raise questions about funding, staffing anddelivery of services:
� How could a 6 per cent additional level of funding percapita in Scotland, as compared with the North East, resultin Scotland having, per capita, 14 per cent more hospitaldoctors and GPs, nearly 50 per cent more nurses, andnearly 75 per cent more non-clinical staff? Is this becausethe Scottish Parliament has decided to spend its moneydifferently (for example, without the same emphasis oncapital development through schemes financed by thePrivate Finance Initiative)?17
� How could lower levels of staffing per capita in the NorthEast have delivered 18 per cent more outpatientattendances, nearly 40 per cent more day cases and over 50 per cent more inpatients than in Scotland?
� What explains the differences in crude productivity ofclinical staff? In the North East, hospital doctors treatedover 60 per cent more outpatient attendances, about 100per cent more day cases and inpatients than in Scotland;and nurses about 100 per cent more outpatientattendances, day cases and inpatients.
These questions merit further research into changes over timeand in health outcomes. (The recent analysis by Sutherland andCoyle did not analyse variations by regions within England.)One particularly fruitful line of analysis, as suggested above,would be to compare devolved countries with the North Eastregion. This report analyses issues over equitable funding ofeach country and the accountability of each government for theperformance of its NHS.
governments in the other countries may find it hard to catch up with performance in England during the years of ‘famine’.
The regional analysis highlights the contrast between the NHSin Scotland and its adjacent English region, the North East.Their populations are of similar size and characteristics, butwithin different jurisdictions. For the year ending March 2006,there were striking and puzzling differences in terms of averageexpenditure, staffing and services provided by each NHS for apopulation of 100,000:
� Expenditure and staffing in Scotland would have beenabout £180m, with 250 hospital doctors (medical anddental staff), 1,100 nurses, 730 non-clinical staff(management and support) and 81 GPs; and in the NorthEast, £170m, 180 hospital doctors, 740 nurses, 420 non-clinical staff and 71 GPs.
� The services provided in Scotland would have amounted to about 89,300 outpatient attendances, 7,600 day cases,and 13,500 inpatient admissions; and in the North East,about 105,000 outpatient attendances, 10,500 day casesand 20,700 inpatient admissions.
There were also striking differences in average crude productivityfor the same year:
� A hospital doctor in Scotland would care for 357 outpatients,30 day cases and 54 inpatients; and in the North East for584 outpatients, 58 day cases and 115 inpatients. A nurse inScotland would care for 70 outpatients, seven day cases and12 inpatients; and in the North East a nurse would care for142 outpatients, 14 day cases and 27 inpatients.
CH
APTER 6
FUNDING AND PERFORMANCE OF HEALTHCARE SYSTEMS IN THE FOUR COUNTRIES OF THE UK BEFORE AND AFTER DEVOLUTION
102
To what extent are major differences between the countries infunding per capita justified by differences in need? For over 30years, each country has developed and implemented complexformulas to ensure that within each country, resources havebeen are allocated with the objective of equal opportunity ofaccess for equal need.18 In contrast, the Barnett Formula for‘devolved services’ has used crude, outdated populationstatistics (that benefited Scotland) and additional funding was determined in bilateral negotiations (that benefitedScotland and Northern Ireland). The House of Lords SelectCommittee on the Barnett Formula19 concluded that ‘theresulting per capita allocations are arbitrary and unfair’ (p8).The authors of this report strongly endorse the Committee’srecommendation that (p8):
Public spending per head of population should be allocated acrossthe United Kingdom on the basis of relative need, so that thoseparts of the United Kingdom which have a greater need receivemore public funds to help them pay for the additional levels ofpublic services they require as a result.
The implications of formulas that aim to do this for healthcarewill be examined in a future report. The point being made hereis that if the extra funding for Scotland were justified byincreased need for healthcare, it could be expected that Scotland would have the highest rates of hospital treatment.This was so in 1996, but, in 2006, Scotland had the lowestrates of outpatient appointments and inpatient admissions per capita.20
The vexed and crucial issue of accountability is nowconsidered. The funding of the NHS in England is, in principle,
conditional upon performance against the Treasury’s PublicService Agreement (PSA) targets. As discussed earlier, the global sum for funding ‘devolved services’ in the other UKcountries is the outcome of global allocations to England for‘devolved services’, which are in principle contingent ongovernment Departments in England achieving their TreasuryPSA targets; use of the Barnett Formula; and bilateralnegotiations with the Treasury. Each devolved country thendecides how much of that global sum to allocate to healthcare.There are no PSA targets for the devolved governments, so theirfunding is not dependent upon their performance. Thesegovernments are held to account by their electorates specificallyfor the performance of the devolved services. There aretherefore three troubling features of governance andaccountability following devolution.
First, the UK taxpayer funds health services in each country,but only England is held to account for its performance by theUK Treasury.21 Scotland has the lowest rates of crudeproductivity for hospital doctors and nurses on all the measuresreported here. So, even if Scotland were to justify its higherfunding on the basis of higher relative need, the UK taxpayermay rightly question whether the generous funding of NHSScotland has been directed not at meeting its greater needs, butat allowing its clinical staff to do less work than, for example, inthe North East of England. On the basis of the data reportedhere, the authors can only pose that question, but are not in aposition to answer it.
Second, there is no equivalent electoral accountability fordevolved services in England, as this accountability is exercised
103
then it ought to be able to require them to supply comparativedata on that performance to justify differences in spending per capita as this is the basis ostensibly used for allocatingfunds between each country. The House of Lords SelectCommittee on the Barnett Formula highlighted the problem of inadequate comparable data published by the Treasury25
(paragraph 62):
Despite its importance, the Treasury only publish limited dataabout devolved public spending, and the published official dataappear in a number of places – in the Statement of FundingPolicy, the Public Expenditure Statistical Estimates, and theannual reports of the Scotland and Wales Offices. Older published data do not distinguish clearly which level of government is responsible – United Kingdom or devolved – forparticular spending in the breakdowns published in the PublicExpenditure Statistical Estimates. There is no time seriesshowing how expenditure has changed as a result of spendingdecisions made in previous years or spending reviews. It is difficult to establish comparable levels of spending in England for devolved functions as they are different in each part of theUnited Kingdom.26
The authors of this report see such comparative information as a vital element in holding each devolved government toaccount to the UK taxpayer for performance of their own NHS.Another possibility might be for the European Union (EU) torequire comparable information to be produced by eachgovernment within the EU.
This report has identified troubling differences between the UK countries in funding, staffing and performance that
only through general elections to the UK Parliament. This alsomeans that there is no answer to the ‘West Lothian question’:why should MPs from non-English constituencies be able tovote on policies for England (for healthcare, education andtransport) when English MPs cannot vote on these policies foreach devolved country (as these are matters for their ownparliament and assemblies) even though their finance comesfrom the budget for the UK?
Third, while the UK statistics authority has a crucial role inmonitoring the quality of statistics produced by each country, it does not appear to have the authority to require governmentsof the UK to produce comparable data on public services. This report shows that the data collected on a comparable basis over time across the four countries are extremely limited;and, if anything, devolution seems to have reduced thewillingness of the devolved administrations to collect suchdata.22 The authors acknowledge that the point of devolution isto allow governments of each country to differ in their policiesand priorities.23
The unusual features of devolution mean that it would now be difficult for the Treasury to hold the devolved governmentsto account through PSA targets. Yet UK taxpayers have the rightto know how well the different governments are securing valuefor their money. It may be that the higher spending per capitain Scotland is compensated by other aspects of performancethan those reported here, but other studies24 have failed to find any evidence of this and it is likely to be difficult toproduce such evidence. If the Treasury cannot hold devolvedgovernments to account for their performance through targets,
CH
APTER 6
FUNDING AND PERFORMANCE OF HEALTHCARE SYSTEMS IN THE FOUR COUNTRIES OF THE UK BEFORE AND AFTER DEVOLUTION
104
highlight larger issues posed by devolution in terms of the way monies from the UK taxpayer are allocated to the devolvedcountries and accountability for devolved services in allcountries. The authors recognise the limitations of the analyses that arise from the data that are available on aconsistent basis across countries and over time. But the cross-sectional analysis using regional data from England, andanalyses by others, tend to confirm the principal finding thatEngland has the lowest per capita funding for the NHS andmakes better use of its lower level of resourcing in terms ofshorter waiting times and higher crude productivity of its staff. Others have also failed to find any systematic evidence that thehigher levels of per capita funding, longer waiting times and lower crude productivity of staff in the devolved countriesare associated with superiority in other dimensions of quality of care. This looks to be a subject that merits further analysis.
This report will be followed up with another that examineswhether the levels of NHS funding between the four countriesis equitable. There is also scope for further, more detailed, work using the North East region as a benchmark forcomparison with the devolved countries. Such research ought to further inform two fundamental questions. First, how do the experiences of patients and NHS staff differbetween the different countries of the UK? Second, has the‘natural experiment’ of policy differences between the four countries, funded by the UK taxpayer, resulted in thedevolved countries spending more on the NHS than England,yet doing worse?
1. Audit Commission and Healthcare Commission (2008) op. cit.
2. Sutherland, K and Coyle, N (2009) Quality in Healthcare in England, Wales,Scotland, Northern Ireland: An intra-UK chartbook. London: The HealthFoundation. This analysis shows considerable resourcefulness inobtaining data from many different sources, but an inevitableconsequence is that different indicators cover different periods: forexample, life expectancy for 1991–93 and 2005–07 (pp20–1); cancermortality and survival rates from 1993 to 2005 (pp24–33); ischaemicheart disease mortality for 1999 and 2006 (p36); indicators from theQuality and Outcomes Framework (for example, indicators of bloodpressure and cholesterol p37) for 2006/07 and 2007/08; median and90th percentile waiting times for selected procedures for 2005/06 and2006/07 (pp62–7); waiting times for radiotherapy for 2007 (p68)differences in life expectancy by levels of deprivation for 2004–06 (pp96–101).
3. Sutherland and Coyle (2009) ibid. report median and 90th percentilewaiting times for the same 11 selected procedures as reported by theOffice of National Statistics (2008) in Table 6.5 (a) Time waited in daysfor elective hospital admission: selected procedures, 2005/06 and2006/07 (p78). Unfortunately, these data are not comparable across thefour countries because they too are subject to the idiosyncratic treatmentof patients in Scotland on a waiting list who were ‘at some pointunavailable for treatment’, or if the procedure the patient was waiting for was judged to be of low clinical priority or to be of a highly specialised nature, or if the patient had failed to attend a previousappointment. See Office of National Statistics (2008) United KingdomHealth Statistics. Basingstoke: Palgrave Macmillan, p82. www.statistics.gov.uk/downloads/theme_health/UKHS3/UKHS2008web.pdf
4. This has also been highlighted for cancers because of problems of latediagnosis by the second official annual report on the cancer reformstrategy. See Department of Health (2009) Cancer Reform Strategy.Achieving local implementation – Second annual report. London: Departmentof Health, p6. http://www.dh.gov.uk/prod_consum_dh/groups/dh_digitalassets/digitalasset/dh_109339.pdf
5. Care Quality Commission (2009) About NHS Patient Surveys.www.cqc.org.uk/usingcareservices/healthcare/patientsurveys/aboutpatientsurveys.cfm
105
www.rcn.org.uk/_data/assets/pdf_file/0018/261045/afc_service_handbook.pdf . There appear to be slight variations in pay of doctors asrecommended by the Review Body on Doctors’ and Dentists’Remuneration (2008) Thirty-seventh Report 2008. Cm 7327. London: The Stationery Office, Appendix A, pp81–93.www.ome.uk.com/downloads/DDRB per cent20report.pdf
18. Bevan, G (2009) ‘The search for a proportionate care law by formulafunding in the English NHS’, Financial Accountability and Management25(4): 391–410.
19. Select Committee on the Barnett Formula (2009) op. cit.
20. Furthermore, the extraordinary differences in life expectancy withinGlasgow (using pooled data from 1998 to 2002) that ranged from 54 (inCalton) to 82 (in Lenzie N) were used to illustrate inequalities in globalhealth by the Commission on Social Determinants of Health (CSDH,2008). CSDH (2008) Closing the Gap in a Generation: Health equity throughaction on the social determinants of health. Final report of the Commissionon Social Determinants of Health. Geneva: World Health Organisation,p32. www.who.int/social_determinants/thecommission/finalreport/en/index.html
21. As mentioned above, the Calman Commission has recommended thatfunding for Scotland should be by the UK and Scottish Parliamentssharing the yield of income tax: ‘Part of the Budget of the ScottishParliament should now be found from devolved taxation under its controlrather than from grants from the UK Parliament. The main means ofachieving this should be by the UK and Scottish Parliaments sharing theyield of income tax: a. Therefore the Scottish Variable Rate of income taxshould be replaced by a new Scottish rate of income tax, collected byHMRC, which should apply to the basic and higher rates of income tax.b. To make this possible, the basic and higher rates of income tax leviedby the UK Government in Scotland should be reduced by ten pence inthe pound and the block grant from the UK to the Scottish Parliamentshould be reduced accordingly. c. Income tax on savings anddistributions should not be devolved to the Scottish Parliament, but halfof the yield should be assigned to the Scottish Parliament’s budget, with a corresponding reduction in the block grant. d. The structure of theincome tax system, including the bands, allowances and thresholdsshould remain entirely the responsibility of the UK Parliament.’ See
6. Department of Health (2009) New Guidance to Support Collection of Patient-reported Outcome Measures from April 2009.www.dh.gov.uk/en/News/Recentstories/DH_094213
7. Maynard and Street (2006) op. cit.
8. Propper and others (2008b) op. cit. They point out that in England, theGovernment took an aggressive target-based policy to reduce the verylong waiting lists for non-emergency care; but in Scotland theGovernment initially focused on the abolition of the internal market andthe reintroduction of a professionally led, integrated system based onconcepts such as managed clinical networks; and when the emphasisshifted to waiting-time targets, these were not accompanied bypublication of performance at hospital level nor were there the managerialsanctions that operated in England for failure to achieve targets.
9. Farrar and others (2007 and 2009) op. cit.
10. As unified boards were introduced in 2001, and NHS trusts ceased toexist as entities independent from their boards in 2004.
11. The largest increase was of about 2.6 per cent in volume for NHS (non-foundation) trusts (pp4–5).
12. Hauck, K and Street, A (2007) ‘Do targets matter? A comparison of English and Welsh national health priorities’, Health Economics16(3): 275–90.
13. The government in Wales in the immediate post-devolution periodabandoned targets relating to waiting lists/times. In response to pressureas patients were waiting longer in Wales than in England, targets werereintroduced in March 2001 but Wales did not introduce a system ofstrong performance management akin to that in England (see AuditorGeneral for Wales (2005b) op. cit.).
14. Hansard, House of Commons, HC Deb 18 November 2003 vol 413cc746–54. http://hansard.millbanksystems.com/commons/2003/nov/18/nhs-wales
15. Wanless (2003) op. cit.
16. Maynard and Street (2006) op. cit.
17. This is unlikely to be explained easily by differences in pay as these scalesare agreed largely on a UK-wide basis. See, for example, the NHS StaffCouncil (2009) NHS Terms and Conditions of Service Handbook.
CH
APTER 6
FUNDING AND PERFORMANCE OF HEALTHCARE SYSTEMS IN THE FOUR COUNTRIES OF THE UK BEFORE AND AFTER DEVOLUTION
106
Commission on Scottish Devolution (Chairman Sir Kenneth Calman)(2009) op. cit., p10.
22. Alvarez-Rosete and others (2005) op. cit. highlighted how they had beenunable to report details of expenditure on hospital and community healthservices, family health services and personal social services, unlike theearlier four-country comparison prior to devolution by Dixon and others(1999). See Dixon, J, Inglis, S and Klein, R (1999) ‘Is the English NHSunderfunded?’, BMJ 318: 522–6.
23. Although each country has common objectives for hospitals to reducelong waiting times for treatment and for ambulances to respond quicklyto what may be life-threatening emergencies.
24. Sutherland and Coyle (2009) op. cit.
25. Select Committee on the Barnett Formula (2009) op. cit.
26. CPPR (2009) op. cit. report spend per pupil on primary and secondaryeducation in 2007/08 in each of the four countries (rounded estimates aregiven here). For primary education, Northern Ireland £2,500; Wales, £3,200;England, £3,580; Scotland, £4,600. For secondary education: Wales andNorthern Ireland, £3,900; England, £4,260; Scotland, £6,300. See CPPR(2009) op. cit. Table 1: Spending on primary and secondary education inScotland, England, Wales and Northern Ireland – 2007/08 (£), p2. Thereport observes that the scale of the differences in spending per pupilbetween Scotland, and Wales and Northern Ireland is ‘scarcely credible’.
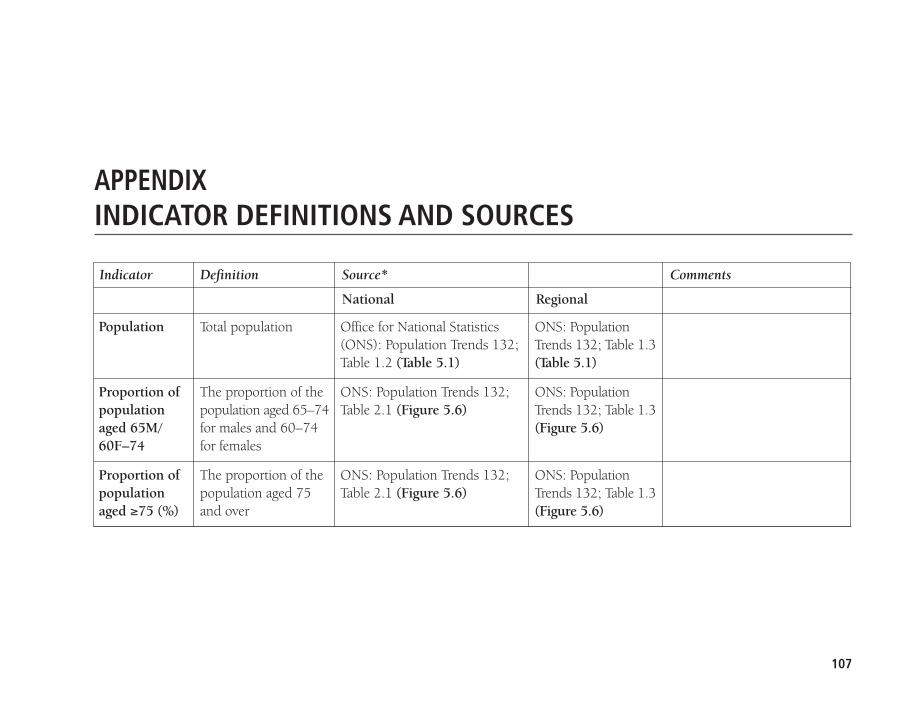
APPENDIXINDICATOR DEFINITIONS AND SOURCES
Indicator Definition Source* Comments
National Regional
107
ONS: PopulationTrends 132; Table 1.3 (Table 5.1)
ONS: PopulationTrends 132; Table 1.3 (Figure 5.6)
ONS: PopulationTrends 132; Table 1.3 (Figure 5.6)
Office for National Statistics(ONS): Population Trends 132;Table 1.2 (Table 5.1)
ONS: Population Trends 132;Table 2.1 (Figure 5.6)
ONS: Population Trends 132;Table 2.1 (Figure 5.6)
Total population
The proportion of thepopulation aged 65–74for males and 60–74for females
The proportion of thepopulation aged 75and over
Population
Proportion ofpopulationaged 65M/60F–74
Proportion ofpopulationaged ≥75 (%)
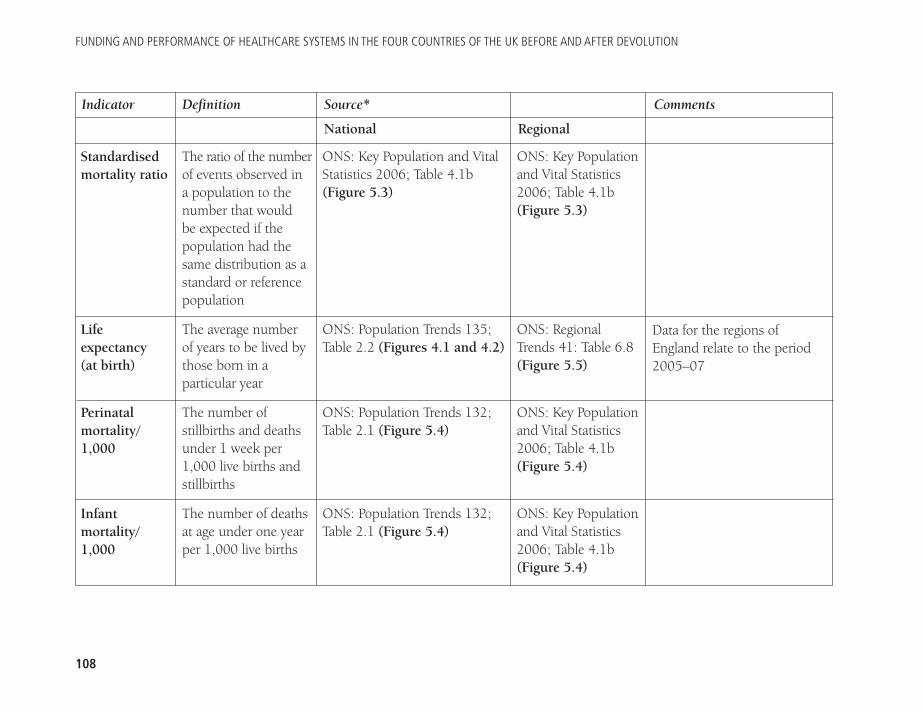
FUNDING AND PERFORMANCE OF HEALTHCARE SYSTEMS IN THE FOUR COUNTRIES OF THE UK BEFORE AND AFTER DEVOLUTION
108
Indicator Definition Source* Comments
National Regional
Standardisedmortality ratio
Lifeexpectancy (at birth)
Perinatalmortality/1,000
Infantmortality/1,000
The ratio of the numberof events observed in a population to thenumber that would be expected if thepopulation had thesame distribution as astandard or referencepopulation
The average number of years to be lived bythose born in aparticular year
The number ofstillbirths and deathsunder 1 week per1,000 live births andstillbirths
The number of deathsat age under one yearper 1,000 live births
ONS: Key Population and VitalStatistics 2006; Table 4.1b(Figure 5.3)
ONS: Population Trends 135;Table 2.2 (Figures 4.1 and 4.2)
ONS: Population Trends 132;Table 2.1 (Figure 5.4)
ONS: Population Trends 132;Table 2.1 (Figure 5.4)
ONS: Key Populationand Vital Statistics2006; Table 4.1b(Figure 5.3)
ONS: RegionalTrends 41: Table 6.8(Figure 5.5)
ONS: Key Populationand Vital Statistics2006; Table 4.1b(Figure 5.4)
ONS: Key Populationand Vital Statistics2006; Table 4.1b(Figure 5.4)
Data for the regions ofEngland relate to the period2005–07
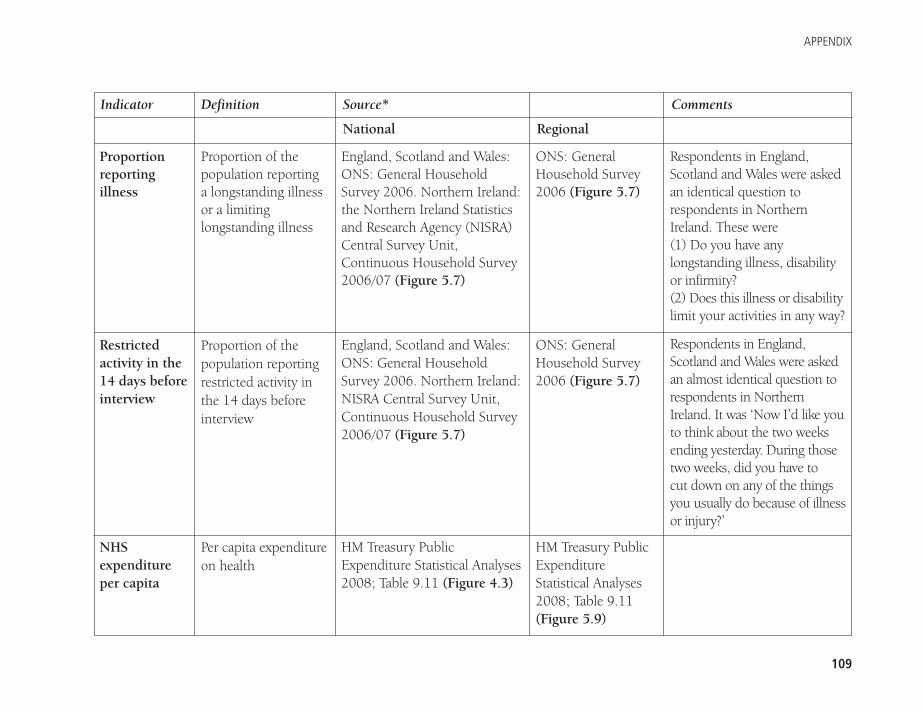
APPENDIX
109
Indicator Definition Source* Comments
National Regional
Proportionreportingillness
Restrictedactivity in the14 days beforeinterview
NHSexpenditureper capita
Proportion of thepopulation reporting a longstanding illnessor a limitinglongstanding illness
Proportion of thepopulation reportingrestricted activity inthe 14 days beforeinterview
Per capita expenditureon health
England, Scotland and Wales:ONS: General HouseholdSurvey 2006. Northern Ireland:the Northern Ireland Statisticsand Research Agency (NISRA)Central Survey Unit,Continuous Household Survey2006/07 (Figure 5.7)
England, Scotland and Wales:ONS: General HouseholdSurvey 2006. Northern Ireland:NISRA Central Survey Unit,Continuous Household Survey2006/07 (Figure 5.7)
HM Treasury PublicExpenditure Statistical Analyses2008; Table 9.11 (Figure 4.3)
ONS: GeneralHousehold Survey2006 (Figure 5.7)
ONS: GeneralHousehold Survey2006 (Figure 5.7)
HM Treasury PublicExpenditureStatistical Analyses2008; Table 9.11(Figure 5.9)
Respondents in England,Scotland and Wales were askedan identical question torespondents in NorthernIreland. These were (1) Do you have any longstanding illness, disabilityor infirmity? (2) Does this illness or disabilitylimit your activities in any way?
Respondents in England,Scotland and Wales were askedan almost identical question torespondents in NorthernIreland. It was ‘Now I’d like youto think about the two weeksending yesterday. During thosetwo weeks, did you have to cut down on any of the things you usually do because of illnessor injury?’
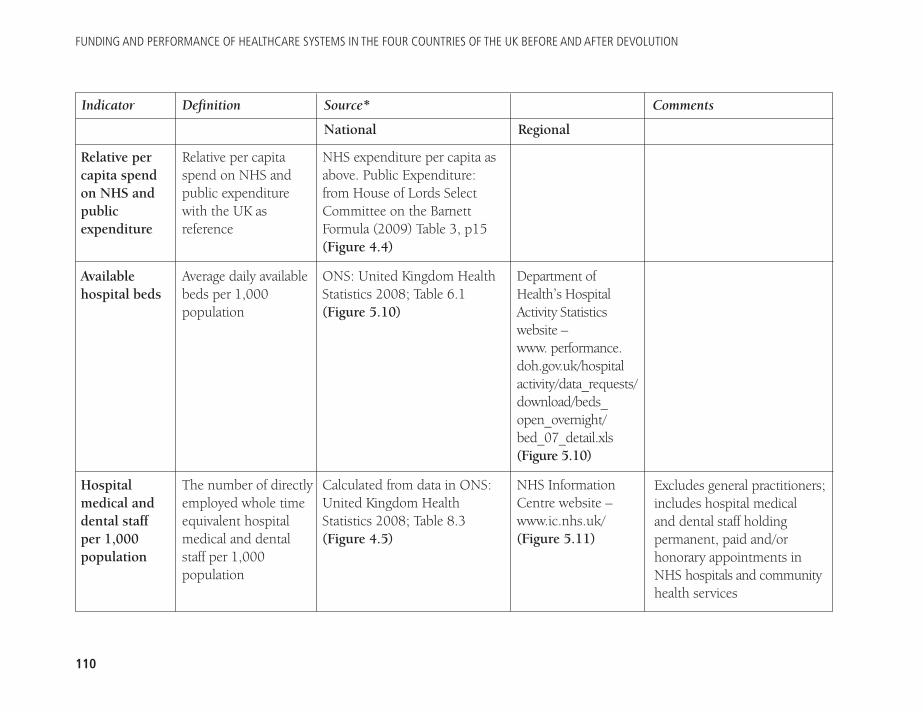
FUNDING AND PERFORMANCE OF HEALTHCARE SYSTEMS IN THE FOUR COUNTRIES OF THE UK BEFORE AND AFTER DEVOLUTION
110
Indicator Definition Source* Comments
National Regional
Relative percapita spendon NHS andpublicexpenditure
Availablehospital beds
Hospitalmedical anddental staff per 1,000population
Relative per capitaspend on NHS andpublic expenditurewith the UK asreference
Average daily availablebeds per 1,000population
The number of directlyemployed whole timeequivalent hospitalmedical and dentalstaff per 1,000population
NHS expenditure per capita asabove. Public Expenditure:from House of Lords SelectCommittee on the BarnettFormula (2009) Table 3, p15(Figure 4.4)
ONS: United Kingdom HealthStatistics 2008; Table 6.1(Figure 5.10)
Calculated from data in ONS:United Kingdom HealthStatistics 2008; Table 8.3(Figure 4.5)
Department ofHealth’s HospitalActivity Statisticswebsite –www. performance.doh.gov.uk/hospitalactivity/data_requests/download/beds_open_overnight/bed_07_detail.xls (Figure 5.10)
NHS InformationCentre website –www.ic.nhs.uk/ (Figure 5.11)
Excludes general practitioners;includes hospital medical and dental staff holdingpermanent, paid and/orhonorary appointments inNHS hospitals and communityhealth services
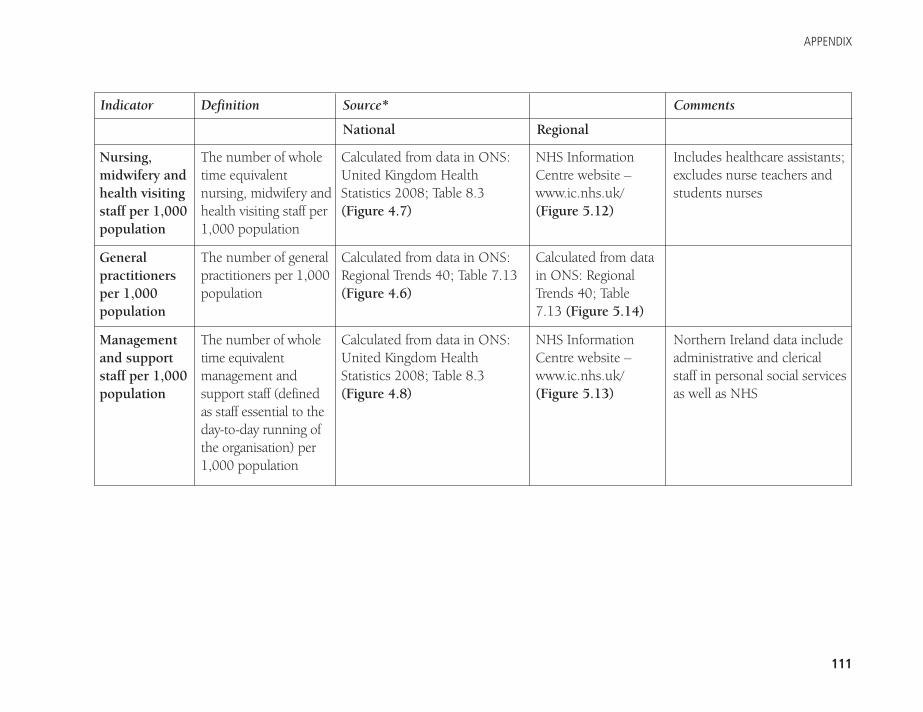
APPENDIX
111
Indicator Definition Source* Comments
National Regional
Nursing,midwifery andhealth visitingstaff per 1,000population
Generalpractitionersper 1,000population
Managementand supportstaff per 1,000population
The number of wholetime equivalentnursing, midwifery andhealth visiting staff per1,000 population
The number of generalpractitioners per 1,000population
The number of wholetime equivalentmanagement andsupport staff (defined as staff essential to theday-to-day running ofthe organisation) per1,000 population
Calculated from data in ONS:United Kingdom HealthStatistics 2008; Table 8.3(Figure 4.7)
Calculated from data in ONS:Regional Trends 40; Table 7.13(Figure 4.6)
Calculated from data in ONS:United Kingdom HealthStatistics 2008; Table 8.3(Figure 4.8)
NHS InformationCentre website –www.ic.nhs.uk/(Figure 5.12)
Calculated from datain ONS: RegionalTrends 40; Table7.13 (Figure 5.14)
NHS InformationCentre website –www.ic.nhs.uk/(Figure 5.13)
Includes healthcare assistants;excludes nurse teachers andstudents nurses
Northern Ireland data includeadministrative and clericalstaff in personal social servicesas well as NHS
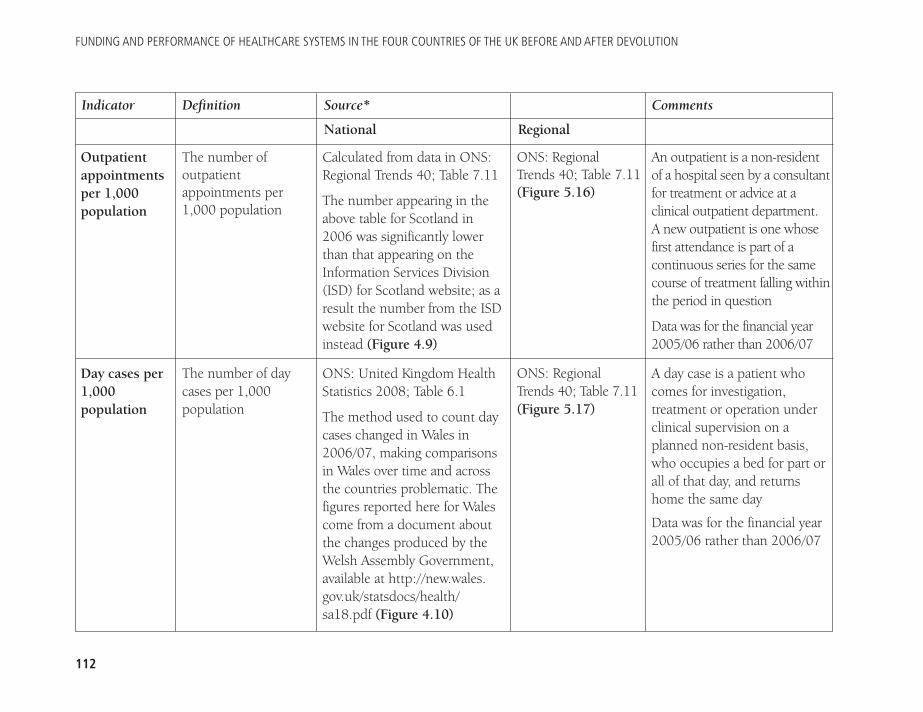
FUNDING AND PERFORMANCE OF HEALTHCARE SYSTEMS IN THE FOUR COUNTRIES OF THE UK BEFORE AND AFTER DEVOLUTION
112
Indicator Definition Source* Comments
National Regional
Outpatientappointmentsper 1,000population
Day cases per1,000population
The number ofoutpatientappointments per1,000 population
The number of daycases per 1,000population
Calculated from data in ONS:Regional Trends 40; Table 7.11
The number appearing in theabove table for Scotland in2006 was significantly lowerthan that appearing on theInformation Services Division(ISD) for Scotland website; as aresult the number from the ISDwebsite for Scotland was usedinstead (Figure 4.9)
ONS: United Kingdom HealthStatistics 2008; Table 6.1
The method used to count daycases changed in Wales in2006/07, making comparisonsin Wales over time and acrossthe countries problematic. Thefigures reported here for Walescome from a document aboutthe changes produced by theWelsh Assembly Government,available at http://new.wales.gov.uk/statsdocs/health/sa18.pdf (Figure 4.10)
ONS: RegionalTrends 40; Table 7.11(Figure 5.16)
ONS: Regional Trends 40; Table 7.11(Figure 5.17)
An outpatient is a non-residentof a hospital seen by a consultantfor treatment or advice at aclinical outpatient department. A new outpatient is one whosefirst attendance is part of acontinuous series for the samecourse of treatment falling withinthe period in question
Data was for the financial year2005/06 rather than 2006/07
A day case is a patient whocomes for investigation,treatment or operation underclinical supervision on aplanned non-resident basis,who occupies a bed for part orall of that day, and returnshome the same day
Data was for the financial year2005/06 rather than 2006/07
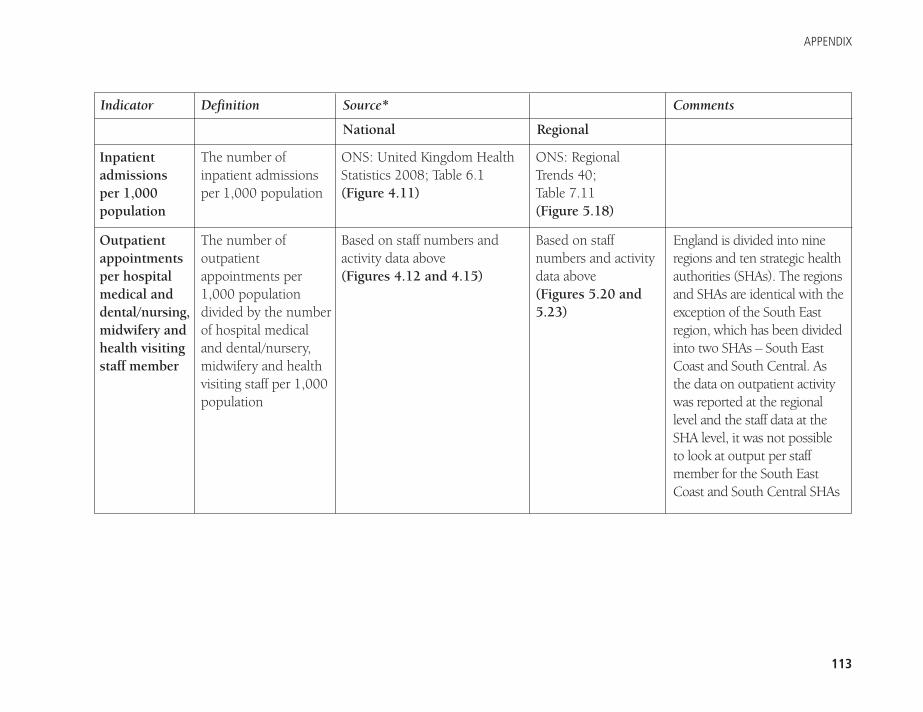
APPENDIX
113
Indicator Definition Source* Comments
National Regional
Inpatientadmissionsper 1,000population
Outpatientappointmentsper hospitalmedical anddental/nursing,midwifery andhealth visitingstaff member
The number ofinpatient admissionsper 1,000 population
The number ofoutpatientappointments per1,000 populationdivided by the numberof hospital medicaland dental/nursery,midwifery and healthvisiting staff per 1,000population
ONS: United Kingdom HealthStatistics 2008; Table 6.1(Figure 4.11)
Based on staff numbers andactivity data above (Figures 4.12 and 4.15)
ONS: RegionalTrends 40; Table 7.11 (Figure 5.18)
Based on staffnumbers and activitydata above (Figures 5.20 and5.23)
England is divided into nineregions and ten strategic healthauthorities (SHAs). The regionsand SHAs are identical with theexception of the South Eastregion, which has been dividedinto two SHAs – South EastCoast and South Central. Asthe data on outpatient activitywas reported at the regionallevel and the staff data at theSHA level, it was not possibleto look at output per staffmember for the South EastCoast and South Central SHAs
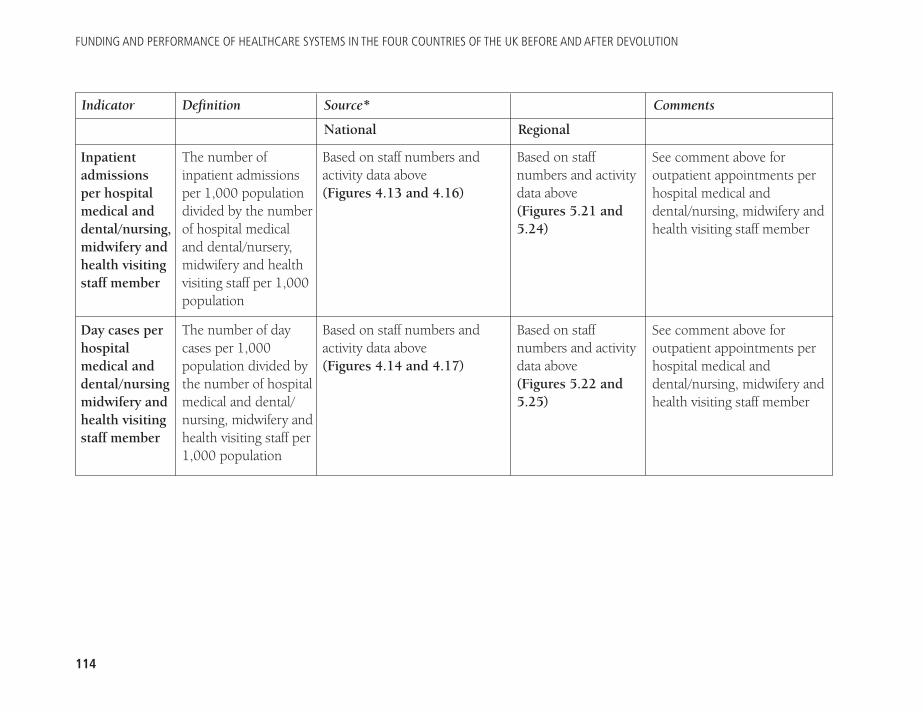
FUNDING AND PERFORMANCE OF HEALTHCARE SYSTEMS IN THE FOUR COUNTRIES OF THE UK BEFORE AND AFTER DEVOLUTION
114
Indicator Definition Source* Comments
National Regional
Inpatientadmissionsper hospitalmedical anddental/nursing,midwifery andhealth visitingstaff member
Day cases perhospitalmedical anddental/nursingmidwifery andhealth visitingstaff member
The number ofinpatient admissionsper 1,000 populationdivided by the numberof hospital medicaland dental/nursery,midwifery and healthvisiting staff per 1,000population
The number of daycases per 1,000population divided bythe number of hospitalmedical and dental/nursing, midwifery andhealth visiting staff per1,000 population
Based on staff numbers andactivity data above (Figures 4.13 and 4.16)
Based on staff numbers andactivity data above (Figures 4.14 and 4.17)
Based on staffnumbers and activitydata above (Figures 5.21 and5.24)
Based on staffnumbers and activitydata above (Figures 5.22 and5.25)
See comment above foroutpatient appointments perhospital medical anddental/nursing, midwifery andhealth visiting staff member
See comment above foroutpatient appointments perhospital medical anddental/nursing, midwifery andhealth visiting staff member
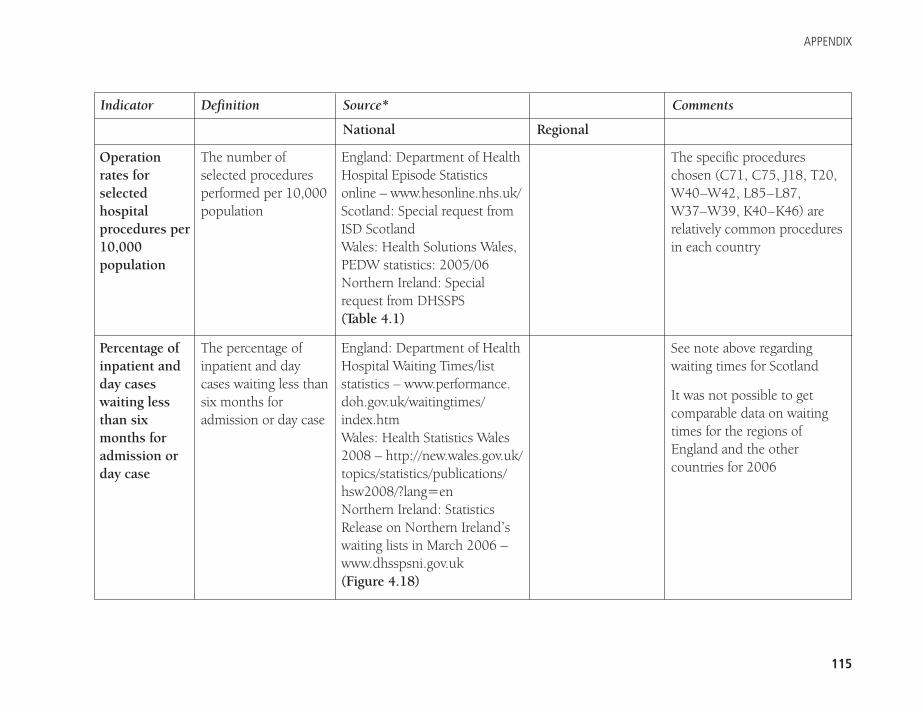
APPENDIX
115
Indicator Definition Source* Comments
National Regional
Operationrates forselectedhospitalprocedures per10,000population
Percentage ofinpatient andday caseswaiting lessthan sixmonths foradmission orday case
The number ofselected proceduresperformed per 10,000population
The percentage ofinpatient and daycases waiting less thansix months foradmission or day case
England: Department of HealthHospital Episode Statisticsonline – www.hesonline.nhs.uk/Scotland: Special request fromISD ScotlandWales: Health Solutions Wales,PEDW statistics: 2005/06Northern Ireland: Specialrequest from DHSSPS(Table 4.1)
England: Department of HealthHospital Waiting Times/liststatistics – www.performance.doh.gov.uk/waitingtimes/index.htm Wales: Health Statistics Wales2008 – http://new.wales.gov.uk/topics/statistics/publications/hsw2008/?lang=enNorthern Ireland: StatisticsRelease on Northern Ireland’swaiting lists in March 2006 –www.dhsspsni.gov.uk (Figure 4.18)
The specific procedureschosen (C71, C75, J18, T20,W40–W42, L85–L87,W37–W39, K40–K46) arerelatively common proceduresin each country
See note above regardingwaiting times for Scotland
It was not possible to getcomparable data on waitingtimes for the regions ofEngland and the othercountries for 2006
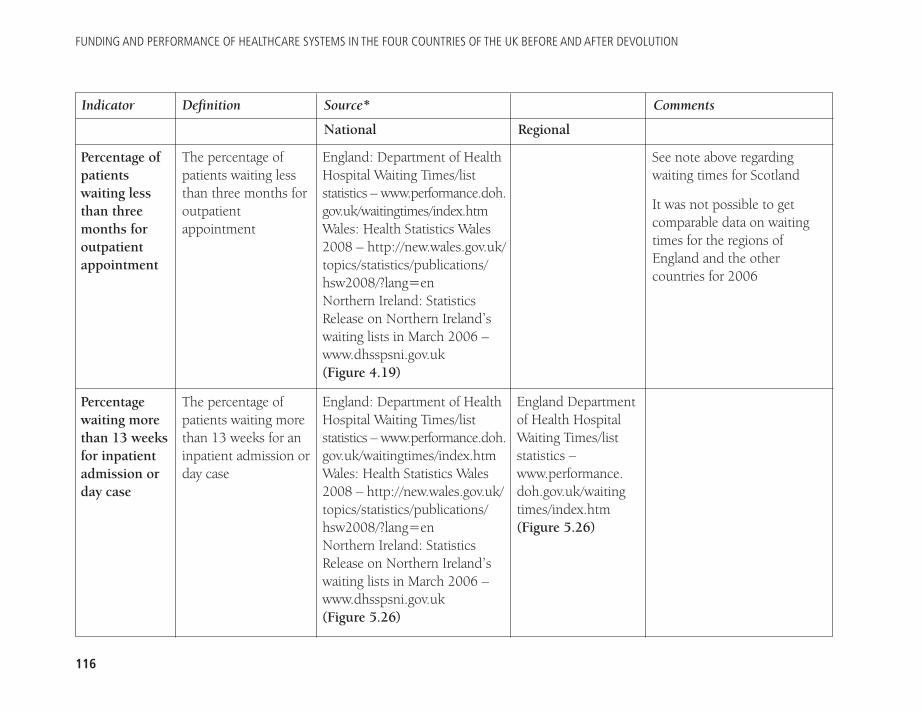
FUNDING AND PERFORMANCE OF HEALTHCARE SYSTEMS IN THE FOUR COUNTRIES OF THE UK BEFORE AND AFTER DEVOLUTION
116
Indicator Definition Source* Comments
National Regional
Percentage ofpatientswaiting lessthan threemonths foroutpatientappointment
Percentagewaiting morethan 13 weeksfor inpatientadmission orday case
The percentage ofpatients waiting lessthan three months foroutpatientappointment
The percentage ofpatients waiting morethan 13 weeks for aninpatient admission orday case
England: Department of HealthHospital Waiting Times/liststatistics – www.performance.doh.gov.uk/waitingtimes/index.htm Wales: Health Statistics Wales2008 – http://new.wales.gov.uk/topics/statistics/publications/hsw2008/?lang=enNorthern Ireland: StatisticsRelease on Northern Ireland’swaiting lists in March 2006 –www.dhsspsni.gov.uk(Figure 4.19)
England: Department of HealthHospital Waiting Times/liststatistics – www.performance.doh.gov.uk/waitingtimes/index.htm Wales: Health Statistics Wales2008 – http://new.wales.gov.uk/topics/statistics/publications/hsw2008/?lang=enNorthern Ireland: StatisticsRelease on Northern Ireland’swaiting lists in March 2006 –www.dhsspsni.gov.uk(Figure 5.26)
England Departmentof Health HospitalWaiting Times/liststatistics –www.performance.doh.gov.uk/waitingtimes/index.htm(Figure 5.26)
See note above regardingwaiting times for Scotland
It was not possible to getcomparable data on waitingtimes for the regions ofEngland and the othercountries for 2006
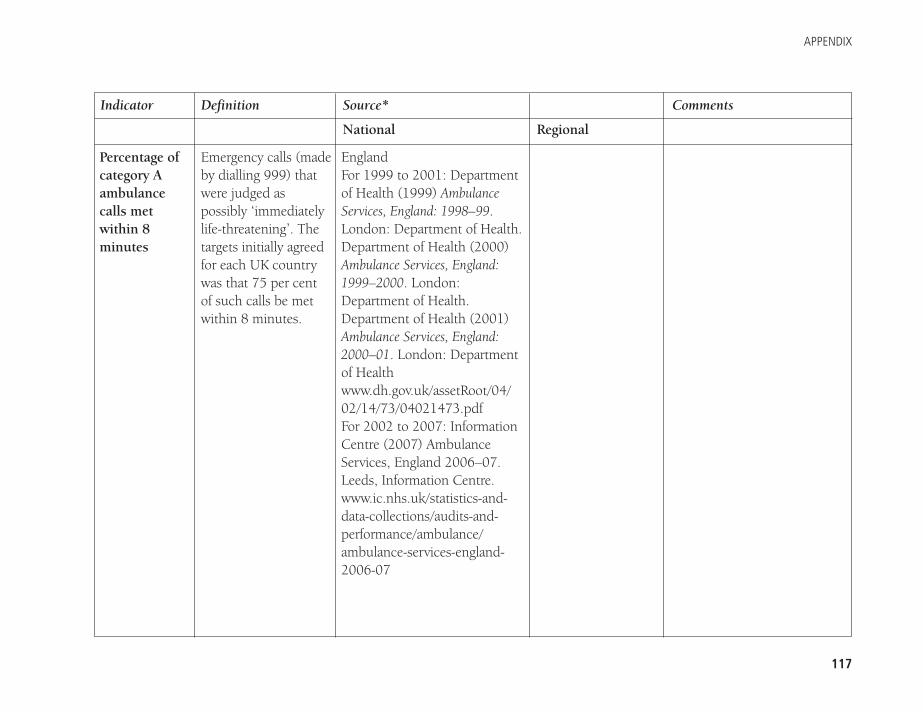
APPENDIX
117
Indicator Definition Source* Comments
National Regional
Percentage ofcategory Aambulancecalls metwithin 8minutes
Emergency calls (madeby dialling 999) thatwere judged aspossibly ‘immediatelylife-threatening’. Thetargets initially agreedfor each UK countrywas that 75 per cent of such calls be metwithin 8 minutes.
England For 1999 to 2001: Departmentof Health (1999) AmbulanceServices, England: 1998–99.London: Department of Health. Department of Health (2000)Ambulance Services, England:1999–2000. London:Department of Health.Department of Health (2001)Ambulance Services, England:2000–01. London: Departmentof Healthwww.dh.gov.uk/assetRoot/04/02/14/73/04021473.pdfFor 2002 to 2007: InformationCentre (2007) AmbulanceServices, England 2006–07.Leeds, Information Centre.www.ic.nhs.uk/statistics-and-data-collections/audits-and-performance/ambulance/ambulance-services-england-2006-07
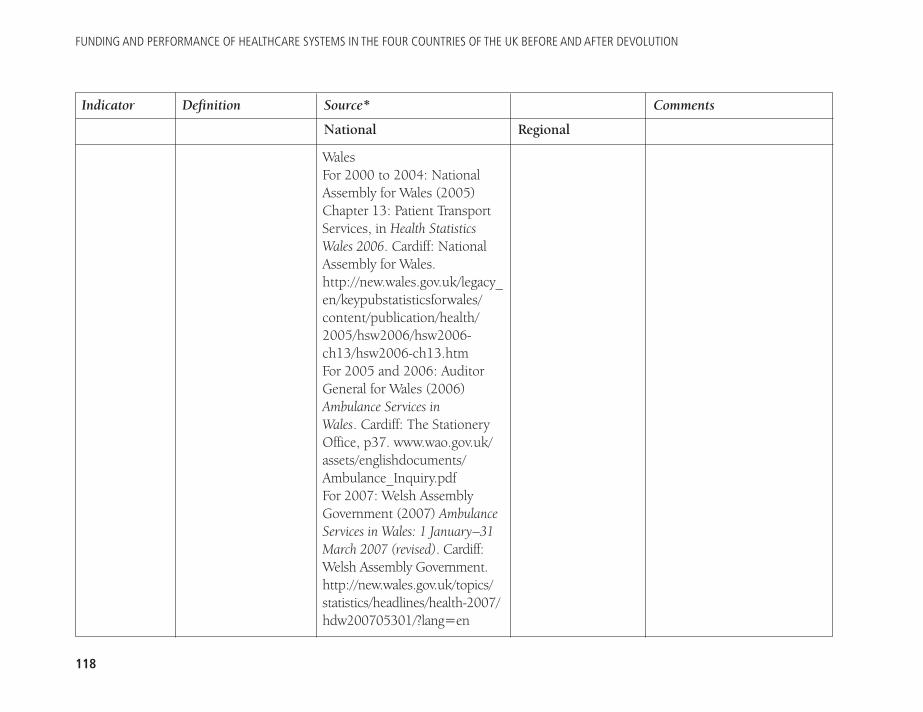
FUNDING AND PERFORMANCE OF HEALTHCARE SYSTEMS IN THE FOUR COUNTRIES OF THE UK BEFORE AND AFTER DEVOLUTION
118
Indicator Definition Source* Comments
National Regional
Wales For 2000 to 2004: NationalAssembly for Wales (2005)Chapter 13: Patient TransportServices, in Health StatisticsWales 2006. Cardiff: NationalAssembly for Wales.http://new.wales.gov.uk/legacy_en/keypubstatisticsforwales/content/publication/health/2005/hsw2006/hsw2006-ch13/hsw2006-ch13.htm For 2005 and 2006: AuditorGeneral for Wales (2006)Ambulance Services in Wales. Cardiff: The StationeryOffice, p37. www.wao.gov.uk/assets/englishdocuments/Ambulance_Inquiry.pdf For 2007: Welsh AssemblyGovernment (2007) AmbulanceServices in Wales: 1 January–31March 2007 (revised). Cardiff:Welsh Assembly Government.http://new.wales.gov.uk/topics/statistics/headlines/health-2007/hdw200705301/?lang=en
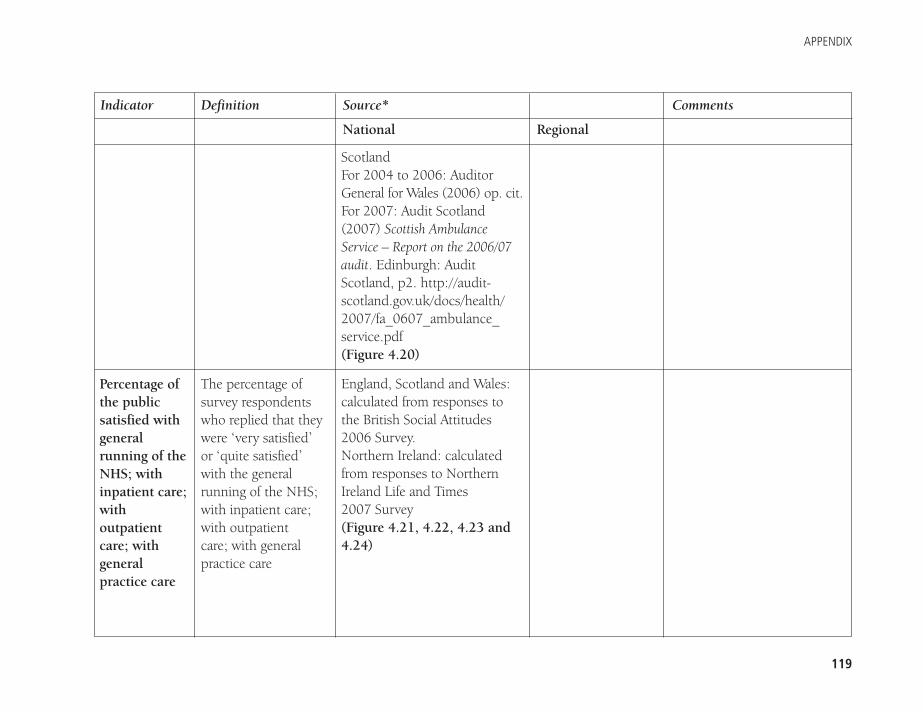
APPENDIX
119
Indicator Definition Source* Comments
National Regional
Percentage ofthe publicsatisfied withgeneralrunning of theNHS; withinpatient care;withoutpatientcare; withgeneralpractice care
The percentage ofsurvey respondentswho replied that theywere ‘very satisfied’ or ‘quite satisfied’with the generalrunning of the NHS;with inpatient care;with outpatient care; with generalpractice care
ScotlandFor 2004 to 2006: AuditorGeneral for Wales (2006) op. cit.For 2007: Audit Scotland(2007) Scottish AmbulanceService – Report on the 2006/07audit. Edinburgh: AuditScotland, p2. http://audit-scotland.gov.uk/docs/health/2007/fa_0607_ambulance_service.pdf(Figure 4.20)
England, Scotland and Wales:calculated from responses tothe British Social Attitudes2006 Survey. Northern Ireland: calculatedfrom responses to NorthernIreland Life and Times 2007 Survey(Figure 4.21, 4.22, 4.23 and4.24)
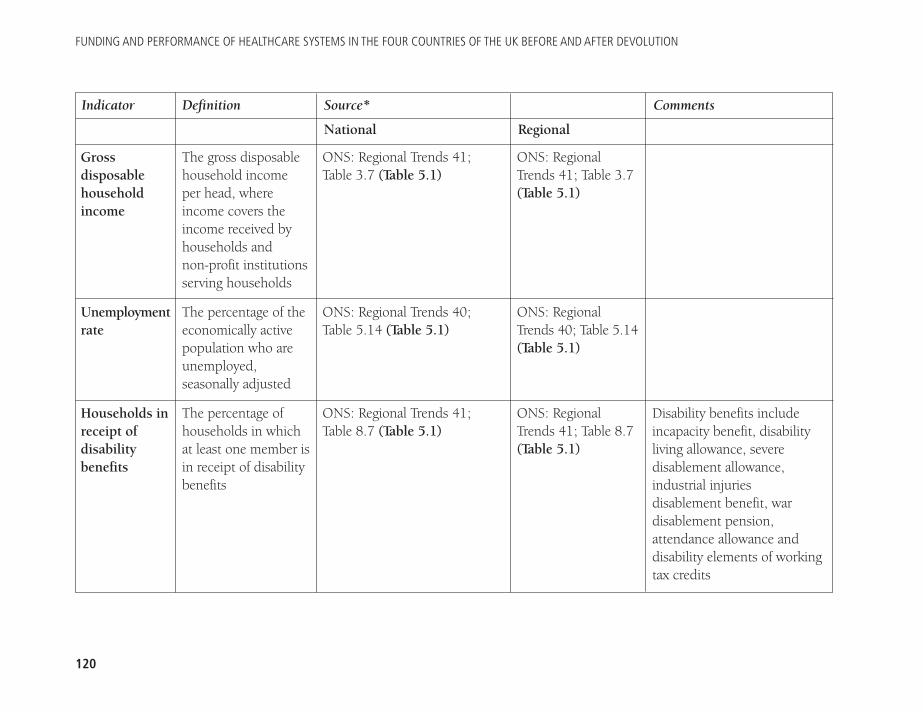
FUNDING AND PERFORMANCE OF HEALTHCARE SYSTEMS IN THE FOUR COUNTRIES OF THE UK BEFORE AND AFTER DEVOLUTION
120
Indicator Definition Source* Comments
National Regional
Grossdisposablehouseholdincome
Unemploymentrate
Households inreceipt ofdisabilitybenefits
The gross disposablehousehold income per head, whereincome covers theincome received byhouseholds and non-profit institutionsserving households
The percentage of theeconomically activepopulation who areunemployed,seasonally adjusted
The percentage ofhouseholds in whichat least one member isin receipt of disabilitybenefits
ONS: Regional Trends 41; Table 3.7 (Table 5.1)
ONS: Regional Trends 40; Table 5.14 (Table 5.1)
ONS: Regional Trends 41; Table 8.7 (Table 5.1)
ONS: RegionalTrends 41; Table 3.7(Table 5.1)
ONS: RegionalTrends 40; Table 5.14(Table 5.1)
ONS: RegionalTrends 41; Table 8.7(Table 5.1)
Disability benefits includeincapacity benefit, disabilityliving allowance, severedisablement allowance,industrial injuries disablement benefit, wardisablement pension,attendance allowance anddisability elements of workingtax credits
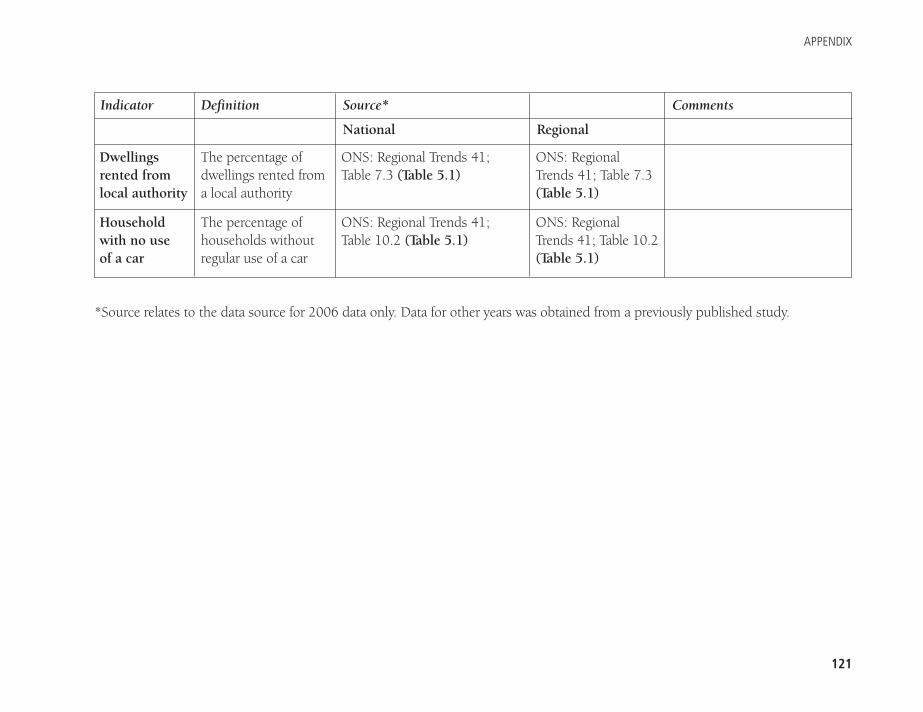
APPENDIX
121
Indicator Definition Source* Comments
National Regional
Dwellingsrented fromlocal authority
Householdwith no use of a car
The percentage ofdwellings rented froma local authority
The percentage ofhouseholds withoutregular use of a car
ONS: Regional Trends 41; Table 7.3 (Table 5.1)
ONS: Regional Trends 41; Table 10.2 (Table 5.1)
ONS: RegionalTrends 41; Table 7.3(Table 5.1)
ONS: RegionalTrends 41; Table 10.2(Table 5.1)
*Source relates to the data source for 2006 data only. Data for other years was obtained from a previously published study.
Political devolution means there are now four National HealthServices in the United Kingdom. The health services of England,Scotland, Wales and Northern Ireland are all funded by the UKtaxpayer, but have developed different systems of governanceand different methods of providing healthcare.
Funding and Performance of Healthcare Systems in the FourCountries of the UK Before and After Devolution examines theimpact of this, by looking at key performance indicators for theNHS in the four countries before and after devolution, and byundertaking a completely new comparison of NHS performance
The Nuffield Trust59 New Cavendish StreetLondon W1G 7LPEmail: [email protected]
Funding and performance of healthcare systems in thefour countries of the UK before and after devolution
in the English regions and the devolved countries. The authorssuggest that it is far from clear whether, post-devolution,patients in all four UK countries are faring equally; they alsopoint to the need for a reexamination of how healthcareresources are allocated across the UK (the subject of aforthcoming Trust report).
This report will be of interest to healthcare leaders andpolicy-makers across the UK, as well as academics and studentsinterested in healthcare and health policy, and in UK politicsgenerally, following devolution.