Embed Size (px)
Citation preview
REGIONAL FISHERIES LIVELIHOODS PROGRAMME
FOR SOUTH AND SOUTHEST ASIA (RFLP) ___________________________________________________________________________
GCP/RAS/239/SPA: RFLP Philippines Baseline Study
Executive Summary
Regional Fisheries Livelihoods Programme for South and Southeast Asia Philippines Component
JOSE RIZAL MEMORIAL STATE UNIVERSITY
Research Unit

1
1
Executive Summary
Prepared by
JOSE RIZAL MEMORIAL STATE UNIVERSITY
Dapitan City, Zamboanga del Norte
Written by
Maria Rio Abdon Naguit, Evelyn R. Campiseno, Wilson Nabua, Narcisa Bureros,
Arnel Cuivillas, Leonardo Cainta, Jane Aquino, Ana Liza Lopez, Josephine Subong, Christopher Tagupa, Wilfredo D. Carreon, Jr., Bobmil C. Flores,
Salvador Y. Campiseño, Ma. Blanca S. Sy, Ed Neil O. Maratas, Joseph Salvel R. Campiseño, Jay D. Telen, Jeremias B. Narvaez, Paterno S. Baguinat III, J
ohn Wayne V. Jacinto, Daylinda R. Laput, Clarita Bidad, Carina Romarate, Bernard Gilaga, Romie Laranjo, Renato Malate,
December 2011
2
Introduction
The primary goal of Regional Fisheries Livelihoods Programme (RFLP) is to improve
the livelihoods of small-scale fishers in the program area through targeted interventions that
will produce grass root effects of improved fisheries management and livelihood
development. The ultimate aim is to have community organizations and government
institutions at different levels supporting efforts for fisheries co-management, livelihood
development, improved quality and reduction of vulnerability in small-scale fishing
communities. Realizing this noble goal of RFLP requires data for designing and
implementing intervention programs.
The baseline study covers some selected but adjacent coastal communities in the
province of Zamboanga del Norte which is the largest province of Zamboanga Peninsula in
terms of land area. These communities, which are classified into three clusters, are situated in
important bodies of water to the fishing and canning industries in the province that provide
employment to a significant portion of the coastal population. Cluster 1 is composed of
Dapitan City, Rizal and Sibutad which are correspondingly facing Dapitan Bay and
Murceilagos Bay. Cluster 2 covers Dipolog City, Katipunan, Manukan and Roxas while
Cluster 3 includes Jose Dalman, Leon Postigo, Liloy, Salug and Sindangan. Cluster 2 is
facing Dipolog Bay and Cluster 3 is facing Sindangan Bay. Biophysical data show that all the
aforementioned bays have suffered much from intensive fishing and destructive human
activities within these waters and in terrestrial areas that resulted to the deteriorating quality
and quantity of fishery resources that feed a growing population within and outside of
Zamboanga Peninsula.
The primary method of gathering socioeconomic data was social survey using quota
sampling technique and included households located along the coasts and engaged in fishing-
related activities. Fish survey and actual resource assessment were conducted in the
aforementioned bays to generate biophysical data that described the status of coastal and
fishery resources in the said areas. Secondary data were also utilized to complement the
primary data gathered. There were key informant interviews and focus group discussions
conducted involving local government officials and natural resource managers working with
local agencies concerned with marine and fishery resources. The socioeconomic data
generated provided some insight into how the current management and utilization of the
resources within the municipal waters have been on-going as bases for developing
interventions, and subsequently in measuring impacts that promote a multi-stakeholder
approach or participation in coastal resources management. The succeeding sections highlight
the salient findings of the baseline study.
On Co-management Concept
Current understanding and expectations of the concept “co-management”
Based on what the majority of respondents had said, the prevailing perception is that
government agencies have the major responsibility in fisheries management particularly in
planning, decision-making, enforcing, studying problems, assessing and monitoring fishery
resources and implementing projects. At first glance there is the general absence of the
practice of co-management particularly on matters that require expert knowledge and
authority at certain levels in the bureaucracy. It is too generalizing, however, to say that there
3
are no indications that co-management is exhibited in some areas of natural resource
management and in what communities. In fact, there are resemblances of co-management that
can be more enhanced in some communities.
For instance, majority (57%) in Cluster 1 perceived ensuring the compliance of laws
and regulations as a shared responsibility among fishers and women’s associations as well as
government agencies. The same perception was shared in Cluster 3, specifically by 59% of
the respondents in Sindangan. But this was certainly at the lower level in the management
process and not on the upper level where certain policies and regulations were being
formulated. In Cluster 2, particularly in Manukan and Roxas, majority considered monitoring
and assessing the status of fishery resources as a joint undertaking of the government and
fishing households and organizations. Fifty-eight percent of the respondents in Leon Postigo
of Cluster 3 likewise noted this. But again this sharing of task is at the lower level in the
management process and suggests that the involvement of the community seemed to be
during the implementation only but not in the research design stage.
It was only in Jose Dalman (Cluster 3) and Dipolog (Cluster 2) where 90% and 67%,
respectively, of the respondents noted that joint planning in the management of fishery
resources was an undertaking by concerned government agencies and the associations of
fishers and women. This illustrates a co-management practice at a higher level where the
community through its representatives contributes ideas to the plans being made by people in
the government. The community does not simply wait to implement what the government
wants it to do or to comply what policies and regulations are being promulgated. However,
this was not a general perception in all the clusters of communities studied, and the cases of
Jose Dalman and Dipolog were more of exemptions. Therefore, major interventions are
required for making all stakeholders understand how they can be highly involved in matters
pertaining to the management of fisheries as commons and not to be the sole responsibility of
state agencies.
Examples of existing policies and institutions that support or inhibit co-
management and identification of areas for strengthening
The primary bases for the local ordinances of the local government units for the
management and regulations in the use of the municipal waters are the Local Government
Code of 1991 (Republic Act 7160) and the Philippine Fisheries Code of 1998 (Republic Act
8550). One of the major avenues by which participatory management is promoted is through
the creation of the Fisheries and Aquatic Resources Management Council (FARMC) in every
city and municipality, which is a multi-sectoral body tasked to formulate policies that
concerns the effective and sustainable development and use of coastal and marine areas.
Some examples of institutional or legal bases for fisheries co-management in Dapitan
Bay and Murcielagos Bay include the Strategic Agriculture and Fisheries Development Zone
(SAFDZ) of Dapitan City which was institutionalized by virtue of its Fisheries Ordinance of
2002 which also created the City Fisheries and Aquatic Resources Management Council. The
local government unit of Rizal has its Municipal Fisheries Ordinance of 2002 while Sibutad
along with the adjacent municipalities of the neighboring province of Misamis Occidental
had enacted the Unified Fisheries Ordinance for Murcielagos Bay.
The other clusters have their respective ordinances and these are legal bases that
support how co-management can be realized among stakeholders from the public and private
4
sectors as well as among local government units within the same ecological zones. With the
legal basis of co-management, the community can demand the local government units to have
the various stakeholders be involved, similarly that the latter can expect support from these
stakeholders.
The attitudes and perceptions of fishers to formal and traditional
management systems and conflict resolution system
In Cluster 1, the prevailing preference among 85% of the fishing households surveyed
was that conflict around fishery resources should be resolved amicably in the community by
local leaders only while about 7% said that this should be brought to court and be resolved
according to the provision of the law. Interestingly, 8% believed that conflict would just die
down through time without having to settle them through either the formal or traditional
management systems or conflict resolution system.
Although still constituting the majority but lower than compared with Cluster 1, 65%
of the fishing households surveyed in Cluster 3 also agreed that conflict around fishery
resources should be resolved amicably by local leaders only. Only about 9% said that this
should be brought to court which is contrasted by 26% who believed that there is no need to
settle conflict over fishery resources because this will just die out. The last two figures are
higher compared to Cluster 1.
A different preference appeared in Cluster 2 where less than the majority or 49% said
that conflict around fishery resources should be resolved amicably in the community by local
leaders. But there is an increase among those who agreed (22%) that this should be brought to
court and resolve according to the provisions of the law. Interestingly, those who believed
that conflict will just die out as time passes by without settling them is highest (29%) in
Cluster 2 among the three clusters.
Stakeholder practices in current management systems and recommendations
for improvements
It was only in Cluster 1 where almost 68% or majority of the respondents observed
that the local government units were strongly enforcing the regulations pertaining to the
protection and conservation of fishery resources together with the active participation of
fishers either as individuals or associations. This is one area in resource management where
co-management is evident and this is a good indicator that the local government unit is
interested in involving the local community. However, in Clusters 3 and 2 less than the
majority or 47% and 37%, respectively, shared the same observations about the practices of
their respective local government units in the current systems of managing their fishery
resources.
Given the above situations it was inversely the case that more respondents in Cluster 2
(31%) would say that only the government was firm in the enforcement of fishery laws and
regulations followed, by Cluster 3 (25%) and Cluster 1 (22%). It likewise follows that those
who felt that only the fishers were engaged in the enforcement without the support from the
local government units were the highest in Cluster 2 (18%), followed by Cluster 3 (12%) with
Cluster 1 (3%) having the least. Based on the observations of the respondents it appears as a
whole that co-management system is not working well and much has to be done in order for
5
the local government units, the fishing sector and other stakeholders to work together. There
is a need to review how every local Fisheries and Aquatic Resource Management Council
(FARMC) function in order to put co-management into real practice.
Current systems for conflict resolution
Majority of the respondents in all clusters reported that the aggrieved parties over the
utilization of certain fishery resources usually sought the intervention of local leaders. But the
percentage distribution was the highest in Cluster 1 (80%) and followed almost equally by
Cluster 3 (60%) and Cluster 2 (59%). This validated the earlier sentiments that conflicts
should be resolved within the local level and, as much as possible, should not be elevated to
the court to minimize or avoid litigation costs and save time would have to be spent in court
hearings. This is a good indication that co-management can be mainstreamed among the
fishing communities in the project sites by involving local leaders in conflict resolution over
resource utilization.
Gender roles and responsibilities
The respondents were asked to determine whom they observed in the community to
be doing certain social or group tasks or activities categorized into cooperative work with
manual labor, school meetings, political meetings, church meetings, preparing food for group
work, and protecting and conserving the environment. The responses showed that these tasks
were either done by men only, by women only or by both men and women. Generally, the
results showed that a plurality of the respondents in all clusters observed the aforementioned
tasks as done by both men and women in their respective communities and distributed as
follows: Cluster 1 (46%), Cluster 2 (36%) and Cluster 3 (35%).
However, it was likewise noticed that in specific communities, gender role
stereotypes existed as evident in the observation that more strenuous tasks that required
physical strengths were within the domains of men, while domestic or nurturing tasks were
within the domains of women. Interestingly, there was an overwhelming consensus that
protecting and conserving the environment was a shared responsibility of men and women.
This observation was the highest in Cluster 3 (86%), followed by Cluster 1 (74%) but
constituted less than the majority in Cluster 2 (44%). What is significant here is the
recognition of the contribution of women in environmental works and the sustainable
management of fishery resources. The women need always to be involved in the planning of
programs and projects intended for the benefit of their communities and households, and not
only the men.
Current types of stakeholder involvement in fisheries management
The immediate stakeholders of fishery resources within the project sites that covered
Dipolog Bay, Murcielagos Bay, Dapitan Bay and Sindangan Bay were the fishing households
because their means of livelihood depended upon the quality and amount of resources within
these bays. Some of these fishing households had members who were involved with the
bantay dagat, fishers associations and FARMCs and this is the situation in all clusters.
On the government side, the stakeholders were the Department of Agriculture through
the Bureau of Fisheries and Aquatic Resources, the Department of Environment and Natural
Resources, the Department of Interior and Local Government through the Philippine National
6
Police, and the Department of Social Welfare and Development that particularly looks into
the welfare of women and minors in the fishing industry.
Meanwhile, the various academic institutions of higher learning (e.g. Jose Rizal
Memorial State University, Silliman University) within and outside the project areas and non-
government organizations like the PIPULI Foundation had been involved and interested in
the protection and conservation of the resources within the aforementioned bays. The other
academic institutions included Mindanao State University-Naawan and De La Salle
University whose research works had helped in understanding the condition of these bays.
Perceptions of fishers and resource managers relating to the state of fisheries
resources and allocation of benefits from fishers
People who are directly engaged with certain resources for their sustenance and
survival can certainly tell the status of these resources over time. This is the rationale behind
the use of perception as information for approximating the state of fisheries and allocation of
the benefits to fishers. The results show that the resources within the targeted bays were
perceived to have deteriorated as compared with the past. In Cluster 1, 50% perceived the
state of fisheries within Dipolog Bay and Murcielagos Bay to have deteriorated while others
said that their conditions had not changed; others believed that they had been better off, while
others had no answer. The percentage in Cluster 2 of those who perceived the worsening state
of Dipolog Bay was 58% or higher, so much so in Cluster 3 where almost 61% perceived the
same bad state with the fisheries within Sindangan Bay.
Although there were efforts to control the encroachment of big or commercial fishers
into the municipal waters who compete with the poor subsistence fishers, these have not been
totally prevented or stopped. In Cluster 1 and 3, respectively, 5% of the respondents
complained of being deprived of their rightful access to municipal fishery resources because
of the encroachment of commercial fishers. It was in Cluster 2 that more or 21% of the
respondents were bothered by the encroachment of commercial fishers because they could
not compete with the more efficient fishing gears of these fishers. There is that need to
persistently and consistently enforce the prohibition of commercial fishing within the
municipal waters, both for insiders and outsiders, because they can intensively fish and deny
equal benefits to subsistence fishers who only contend with the kind of fishing gears they
have.
Safety at Sea and Vulnerability Reduction
Current legal frameworks and guidance for safety at sea measures
Among the sites in Cluster 1, only the Municipality of Rizal has no legal framework
regarding safety at sea during the study while Sibutad has The Municipal Disaster Risk
Reduction and Management Council (MDRRMC) and Dapitan has the Disaster Coordinating
Council (CDCC). These municipalities have legal basis for appropriating funds for projects
these council introduced to the budget office of the government or to non-government
organizations.
Unfortunately, there were no data provided for Cluster 2 for this section but it was
presumed that there were local legal mechanisms which serve as bases for enforcement of
7
safety measures and implementation of programs to secure the lives of fishing households
and other sectors that depended upon the sea for livelihood. Every local government is
mandated by the Department of Interior and Local Government to formulate plans and
policies for reducing risk and disasters of their constituencies.
Only the municipality of Salug in Cluster 3 ha a plan on safety at sea and has a
general search and rescue plan under the supervision of the police unit. Nonetheless, the rest
of the municipalities also have the Municipal Disaster Risk Reduction and Management
Council (MDRRMC) which more or less with goals similar with that of Salug. The local
ordinances pertaining to ensuring safety of fishers and in regulating their activities are
informed by the provisions of the Fisheries Code.
Current levels of awareness of fishers and their household members
regarding safety at sea measures
Among the several safety measures presented to the respondents, the importance of
checking weather report every fishing trip was foremost in the list of safety measures at sea
that the respondents were aware of and which they presumably practiced. Clusters 1 and 2
had equally 92% of the total respondents who expressed awareness of this measure while
only 86% were from Cluster 3. Moreover, 88% of the respondents from Cluster 2 said that
they brought radios or communication equipment every fishing trip while 69% and 67% of
those from Cluster 1 and Cluster 3, respectively, answered that they regularly checked the
conditions of their fishing boats if these still were seaworthy.
The first safety measure was preemptive which would tell them not to proceed in
fishing when the weather was bad or when there was an advisory for small boats not to go out
to the sea, thus preventing any impairment to happen. Meanwhile, the second safety measure
was preparatory in nature for whatever eventualities, like during bad weather. This measure
would permit the boat to travel and to bring home safe and alive the fishers, or to call for
assistance if ever the worst situation would occur while they were at sea. Although there were
other safety measures presented during the survey only in the aforementioned measures
where the majority of the respondents were admittedly aware of and are presumed to have
actually practice these as mentioned earlier.
Perceptions of fishers and community members about incidences of accidents
in targeted communities
There were varied perceptions about incidences of sea accidents in the study sites
which may be attributed to the differential safety measures adopted by households and the
preparations they had during times of natural calamities. For instance in Cluster 1, almost
48% of respondents observed that the incidence of sea accidents during the past 12 months
was the same compared five years—no improvement or decrease. Those who said that there
were fewer incidences during the stated period compared five years constituted only about
32% while almost 14% reported more incidences of sea accidents.
On the contrary, the respondents from Cluster 3 were divided on this matter wherein
one group reported that the incidence of accidents had actually increased (33.98%) while
another, of almost the same percentage (33.69%), said there were no changes, similar to the
perception in Cluster 1. Only about 25% said that there were fewer incidences during the
8
stated period compared five years ago. However, a better picture was depicted by the
respondents from Cluster 2 where a plurality (46%) considered fewer incidences of sea
accidents at recent period as compared to five years ago while 29% said that there were no
changes and it could either be higher or lower.
The current disaster preparedness systems in use and the facilities in place to
utilize
The disaster preparedness systems or measures that the respondents had identified and
adopted were more focused on the safety and survival of their households. But this did not
mean that the local government units did not have their respective systems which must have
been provided in the plans that they had prepared. In fact, those systems or mechanisms that
concerned other households or the whole community were likewise identified by the minority
of the respondents. These included conducting disaster preparedness meeting, identifying
evacuation centers to easily move those affected, organizing search and rescue teams and
conducting drills in cases of earthquake and fire.
In Cluster 1, the primary preparation of 72% of households against disaster during
calamities was the storing of enough food when going out from the house, like during
typhoons, seemed impossible and risky. This was followed by about 52% of the respondents
who specifically stored resources for lighting when there were typhoons. The same pattern
was noted in Cluster 3 but the percentages of responses were lower compared in Cluster 1.
Storing food and resources for lighting were reported by 57% and 43% of the respondents
from Cluster 3, respectively. The two preparations were reinforcing each other. Meanwhile,
in Cluster 2, 51% of the households of the respondents said that moving to elevated areas was
what they did specifically at times when typhoon occurred and flooding was a possible
consequence. The storing of enough food was second on their list (43%) particularly that
going out to fish during typhoon was impossible.
The level of confidence of fishers to avoid accidents and if necessary to
recover from them
The respondents’ levels of confidence on their households and community in terms of
avoiding and recovering from did not necessarily fit together. This means that, for them, it
was either the household only or the community only could avoid or recover. The data show
varied perceptions but the common trend was that the avoidance and recovery confidence
levels of the respondents were lower for their households as compared to confidence level on
their communities. In Cluster 1, for example, about 26% rated only up to 20% their level of
confidence that the members of their households could avoid accidents at sea while fishing,
while 42% said that they had up to 80% level of confidence for their community. Meanwhile,
30% rated less or only up to 40% their confidence level for their households to recover from
accidents in contrast to the 35% who rated the chance of the community up to 80%.
The situation in Cluster 3 was more improved than that of Cluster 1. A plurality of the
respondents (29%) rated up to 60% their level of confidence that the members of their
households could avoid accidents at sea while fishing while 33% rated up to 60% the chance
of their communities. On the other hand, 27% equally rated up to 40% and up to 60% their
confidence levels (or on the average 50%) that their households could recover from accidents
while 32% gave up to 60% in the case of their respective communities. The case of Cluster 3
showed that although their avoidance confidence levels were the same for household and
9
community, their confidence level for recovery from accidents of their families was generally
lower as compared to the communities surveyed.
The situation in Cluster 2 first showed that confidence levels for avoidance of
accidents were similar for households and community, but in the recovery, the chance of the
households was lower than that of the community. The modal levels of confidence of all the
respondents from Cluster 2 for their households and communities to avoid accidents at sea
were equally pegged up to 80% of the time. But they were divided on their perceptions or
they were not very sure about their households’ ability to recover from accidents, if such
become inevitable, similar to their communities. Their confidence level for the recovery of
their household was up to 60% only while it was up to 80% for their communities.
State of communication and early warning systems in the project site
The respondents were presented a list of early warning systems or devices that ranged
from that which was privately owned or operated to that which was installed for the
community. They were then asked the ability of each of these to warn the community of
impending disaster or calamity. In Cluster 1, the most relied upon and the one considered as
more reliable up to 100% of the time by 61% of the respondent was radio announcement.
This was followed by the use of cell phones according to 58% to warn the community about
potential danger brought about by a typhoon. Since not all households owned a television,
only 54% considered it as more effective.
Cellphone messages were considered by 75% of the respondents from Cluster 2 to
have the ability to warn them about disasters up to 80% of the time. Although radio and
televisions were also rated to have the same ability, only 69% and 61%, respectively, gave
this rating which put the cellphone the most able warning devise. The ability of village
courier to warn them was rated by 60% of the respondents to be only up to 40% of the time.
Meanwhile, in Cluster 3, the most relied upon and considered more able to warn them about
disasters up to 100% of the time was radio announcement, similar to the case of Cluster 1 but
the percentage of respondents who said this was lower—only 46%. This was followed by
television announcement according to 40% of the respondents. Since not all households
owned cell phones, 42% considered it as only up to 40% effective.
Generally, the data show that personally owned communication systems were
considered more effective or able by majority of the respondents from all clusters compared
those operated by the community such as sirens, bells, megaphones and related others. There
is a need to examine further how community-based warning systems are working in the
project sites because modern technology-mediated devices are being considered more able.
Perhaps the latter have to be integrated into the community-based warning systems but they
have to be seriously and efficiently operated.
Post-Harvest and Marketing
The current levels of post-harvest skills, knowledge and practices
In Cluster 1, the post-harvest activities they practiced which they reportedly had
acquired up to 100% of the needed knowledge and skills were salting, chilling, brining,
freezing and sun drying. But not all the households surveyed were engaged in these because a
10
significant number admitted to have not ventured into post-harvest activities. Only very few
were into canning, fermenting, packaging, smoking and sauce making but they were very
knowledgeable and skillful to some of these activities.
Similar situation prevails in Cluster 2 where majority of the households were engaged
in sun drying, salting, chilling and freezing because these tasks did not require too much
technical skills and resources. The Dipolog respondents were comparatively the most skillful
particularly in canning, brining and freezing because it has the sardines production industry.
As a whole, up to 60% of the needed knowledge and skills for doing certain tasks was the
modal level of knowledge and skills of all households engaged in post harvest activities.
Meanwhile, in Cluster 3 only 16% of all the households surveyed were into fish
processing and mostly were from Salug. They admittedly have only up to 20% of the
knowledge and skills needed in all post harvest practices they rated. These practice included
brining, canning, fermenting, packaging, sun drying, smoking, sauce making, freezing,
chilling and salting. It was only in salting where they rated to have between up to 40% to
80% levels of knowledge and skills.
Degree of perceived influence on the market by fishers and fish processers
In all clusters, 84% of all the respondents agreed that the local fishers had exerted
some influence in the market but it was presumed that the degree and circumstances may
vary if they were either into subsistence and commercial fishing. The demand for protein
food from the sea among city dwellers and food establishments must have been recognized
by the respondents as the major reason why the local fishers determine the situation in the
market for this food product. This also held true with fish processors but whose influence was
intervened by how the fishers behave who were their sources of the raw materials in
processing.
The volume and quality of fish they supplied to the market determines the social
dynamics and economic transactions between the fish traders and consumers. But aside from
the supply and quality of fish, the respondents were also asked whether or not price was
another area of influence that the fishers had exerted upon the market. The results show that
for Cluster 1, price was a more influential factor (80.87%) compared to supply (56.09%) and
quality (26.09%) of fish. The respondents both from Cluster 2 and 3 tended to agree that
supply was a more influential factor. The distribution of the responses shows the following
trends: Cluster 2: supply (77.36%), price (14.34%) and quality (8.30%) and Cluster 3: supply
(70.02%), price (20.15%) and quality (8.60%).
Participation of women and children in fish product processing and
marketing
The participation of women and children in fish product processing and marketing
varied across cluster as observed by the respondents but the trend constantly shows that the
women or wives were more involved or engaged compared to the men or husbands.
Similarly, the daughters participated more compared to the sons but the former tended to do
the tasks done by their mothers. This suggests the presence of gender role issues both in
terms of the types of activities to perform appropriate to expected roles and the relationships
between members of the family. Mothers and daughters tended to work together while fathers
and sons tended to work together.
11
Based on the percentage distribution of observations that fathers, mothers, sons and
daughters were involved in particular post-harvesting activities, Cluster 1 data show that 14%
of the mothers were more engaged in these activities as compared to about 9% of the
husbands. Correspondingly, more daughters (6%) compared to the sons (3%) also engaged in
those tasks done by their mothers. In Cluster 2, 21% reported the wives as compared to 15%
of the husbands were more involved, while more reported the daughters’ greater involvement
(8.00%) compared to the sons (5.00%). It is in Cluster 3 where the highest frequency of
observations were noted among wives (20%) who were more involved in post-harvesting
activities compared to their husbands (16%). This cluster also had the highest percentage of
daughters (17%) who participated in post-harvesting activities of their parents as compared to
the sons (5%).
Level of awareness and knowledge in safe, sanitary and healthy ways of food
processing and preservation
Based on the percentage of respondents who said they were aware of the list of safe,
sanitary and healthy ways of food processing and preservation presented to them during the
survey, the tally shows that on the average 86% of those who were aware of these were from
Cluster 3 and 77% from Cluster 1 but it is only 29% from Cluster 2. More than the majority
of the respondents in Cluster 3 were reportedly aware of each of the 13 ways presented to
them. However, this was not the case in Clusters 1 and 2 where the responses were skewed.
Less than half of the respondents from Cluster 1 were aware and knowledgeable about cold
storage equipment, cleaning schedule and water and ice samples analysis. The third measure
is very important in terms of ensuring that the water being used for cleaning the fish and
making ice were not contaminated. This protects the welfare of the consuming public.
Meanwhile, in Cluster 2, less that 50% of the respondents were aware of the remaining 13
sets of safety, sanitary and healthy measures presented to them. This may explain why, on the
average, the respondents from this cluster were the least aware as compared to those from the
two other clusters.
Livelihoods Enhancement and Diversification
Perceptions of prosperity
Perceptions may be subjective but the experience of abundance or scarcity is always
relative to the situation of people being asked how they feel about their past, present and
future conditions. In Cluster 1, about 67% of the respondents perceived the present economic
condition of their households to be poorer compared to five years ago, while 25% perceived
no changes and 8% considered their condition at present as better than in the past. Their
perception on how poor their households are at present was reinforced by the same
perceptions for their community held by almost 57% of the respondents. The trend in the
perception about the economic conditions of households reflects the economic condition of
the community. This means that poor communities are likewise perceived to have poor
households.
The condition in Cluster 3 was perhaps better off or not compared in Cluster 1
because majority or about 55% considered their present condition to be similar to that of five
years ago (which may be better or poorer) while about 41% considered the present to be
12
poorer. Only about 4% perceived a better condition at present. The trend in the data suggest
that the present must have become more difficult for Cluster 3 particularly for fishing
households that heavily depended upon the fisheries for livelihood. Similarly, almost 50% of
the same respondents perceived the economic condition of their community to have not
changed, while 30% said it was getting better compared five years ago. The difference in the
perceived economic conditions of the household and community implies that the respondents
did not feel that any improvement in the community trickled down to the household level.
Incidentally, there were no data available about the perceptions of prosperity of the
respondents in Cluster 2 but their responses on livelihood availability hinted that they
likewise find their present economic condition as difficult but had the possibility of
improving in the future. This certainly confirms the perceptions of difficult life at present by
the respondents from Clusters 1 and 3 which must be a consequence of the deteriorating
conditions of fishery resources and the limited opportunity for getting alternative livelihoods
or employment.
Attitudes toward changing or diversifying livelihoods
Although majority of the respondents (57.39%) from Cluster 1 were willing to change
livelihoods but this response may be dependent to the kinds of works available which were
within their capacity and were immediately available in the community. In fact, the majority
who were willing come only from Sibutad (96.39) while majority from Dapitan (68.00%) and
Rizal (57.45%) were not willing whose present livelihoods were generally related to fishing.
Meanwhile, in Cluster 2, 52% did not favor changing their current livelihood sources,
but this seemed to be true only to those from Roxas where 100% did not favor livelihood
change (which incidentally influenced the general trend of the data). In contrast, majority
from Manukan (71.70%), Katipunan (68.00%) and Dipolog (52.94%) favored the idea of
looking for better or more livelihood opportunities. This was the reverse trend of Cluster 1.
In Cluster 3, although about 54% favor changing their livelihoods this was also true to
some communities only and not the general picture as seen in the other clusters. Only the
majority of the respondents from Liloy (93.10%) and Sindangan (65.40%) were willing to
change livelihoods while those from Leon Postigo (100.00%), Salug (96.90%) and Jose
Dalman (60.80%) were not willing. Although the data show no pattern of interaction between
the perception of the diversity of livelihoods and attitude towards change in livelihood, their
decisions may be viewed as reflection to their beliefs of what opportunities lie ahead or
available to them.
Micro-finance Services
Levels of awareness of accessing financial services
Generally, the lending agencies owned by individuals or organizations were the most
popular to the respondents from all the clusters. The Center for Agriculture and Rural
Development (CARD) and other lending agencies were known to the respondents, and in
fact, 81% of those from Cluster 1availed of the services of these agencies. Only about 19%
have mentioned the rural banks from where they also derived financial services. The same is
noticed in Cluster 2 where 56% are aware of various lending agencies or individuals which
13
they also patronized for their financial needs but almost 44% are aware of rural banks, which
is higher compared to those in Cluster 1.
More or less, compared to Cluster 2, the same proportions of the respondents (57%)
from Cluster 3 were aware of various lending agencies or individuals as well as those aware
of rural banks (42%) which were located even beyond the project sites. But more of the
respondents from Cluster 3 (26%) were familiar with CARD as compared to those from
Cluster 2 (18%). It appears that the respondents were more inclined to access financial
services from lending organizations when available on their communities rather than the rural
banks.
Levels of satisfaction of the different formal financial institutions
Only in Cluster 1 (71%) and 2 (75%) where significant percentages of households
surveyed had availed of services from formal financial institutions up to the period of the
study. In Cluster 3 only 31% did which is significantly lower from those in the two other
clusters. The rural banks and lending agencies are the formal financial institutions patronized
by the households of the respondents.
The proportion of respondents from Cluster 1 who were generally “satisfied” with the
services or operational features of the formal financial institutions constitute 60% of the total
surveyed. The operational features rated included loan requirements (e.g. collateral and
documents needed to make loans), repayment procedure (e.g., schedule and mode), proximity
(i.e. location), interest rates (i.e. if high or enough) and dealing with clients (i.e. whether very
impersonal or not). In Clusters 2 and 3, 56% and 51%, respectively, said that they were also
generally “satisfied” with the formal financial institutions they transacted with. Interestingly,
Cluster 3 had the lowest percentage that availed of financial services as well as those satisfied
with these services.
Levels of satisfaction of the different informal financial institutions
The informal financing sectors reported by the respondents which they had likewise
transacted with included persons and not agencies or organizations. They were the money
lenders, middle buyers, relatives and friends; but unlike the formal financial institutions the
former offer only loans and not savings like in the case of the rural banks. Their satisfaction
ratings were similar across the operational features of the informal financing sectors such as
loan requirements, repayment procedure, proximity, interest rates and dealing with clients.
In Cluster 1, 58% of the respondents were generally “satisfied” of the informal
financing sectors which was a little lower compared those satisfied with the formal financing
institutions. Those who rated “satisfied” in Clusters 2 and 3 constitute 55% and 47%
respectively, of the total respondents from each of these clusters and show the same trend in
ratings like in Cluster 1 when compared with their satisfaction ratings with the formal
financial institutions. Generally, more of the respondents from all the clusters are “satisfied”
with the formal financial institutions as compared to those “satisfied” with the informal
sectors.
Comparative access of women to financial services
14
Oftentimes the husband is seen as a dominant figure in the family, particularly in
decision-making or financial matters, because it is the traditional notion of many Filipinos.
The data from this study show otherwise. In Cluster 1, 43% of the respondents reported the
wives to be more responsible for accessing financial services as compared to the 18% who
reported the husbands. But this did not automatically mean that the wives could decide for
themselves about money matters. Time availability and the social characters of husbands and
wives with regards to borrowing money were factors to consider in understanding the said
differential access. Meanwhile, 38% of the households had these services accessed by both
husbands and wives.
The above actual situation which debunks the notion of male dominance in financial
matters is further supported by the observations of respondents in the other clusters. In
Cluster 2, although 45% reported that accessing financial services was done by both the
husband and wife, those who reported that wives alone were responsible were greater (44%)
than those who said that only the husbands availed of the mentioned services (11%). The
same trend was noted in Cluster 3, but those who reported that accessing financial services
was done by both the husbands and wives was 75%, which was higher compared in Cluster 2.
But again, those who reported that the financial transaction was done by the wives only were
greater (21%) than those who reported by husband only (9%).
Existence of information and education mechanisms on lending
Although only fewer from Cluster 3 had accessed the services of the formal financial
institutions, 92% admitted that they had attended training related to lending which was the
highest if compared to the other clusters. Nonetheless, in Clusters 1 and 2, 70% and 58%,
respectively, said that they had also attended such training which further implies the existence
of information and education mechanisms to ensure the ability of borrowers to comply with
their loan obligations.
Suggestions to improve lending relationships and savings
The inability to borrow money or to make productive use of borrowed money negates
the real notion of raising capital as investment which could help the poor fishers away from
their marginalized social position. Along this notion the respondents were asked to suggest
ways how to improve lending relationships and savings. Foremost on the list was excellent
ability to pay and this is true to all the respondents from Cluster 1 (62%), Cluster 2 (69%) and
Cluster 3 (88%). This suggestion was clearly directed to the borrower and implies that when
the loan or borrowed money was already released it was then the major responsibility of the
borrower to make it grow and then save the excess so the obligation to the financial
institutions can be satisfied.
For the part of the lenders or the financial institutions or sectors, the suggestions given
imply the need for providing a more conducive arrangement or financial atmosphere that
would allow the borrower to avail of their services as well as to repay. In Cluster 1, 27%
suggested that they should be considerate and this was also among the suggestions of the 7%
of the respondents from Cluster 3. Meanwhile, 17% of the respondents from Cluster 2
suggested that offering of low interest rate to keep their clients who would surely be
benefited from the transactions. Generally, a combination of these suggestions will be equally
helpful to the financial institutions as well as to the borrowers.
15
Conclusions and Recommendations
In general, all four bays in Zamboanga del Norte covered by the study have suffered
much from intensive fishing and destructive human activities within these waters and in
terrestrial areas that resulted to the deteriorating quality and quantity of fishery resources that
feed a growing population within and outside of Zamboanga Peninsula. Seminars and
workshops on marine resources should be conducted to educate and empower fishers on the
importance of fish sanctuary and other marine resources. Major interventions are also
required for making all stakeholders understand how they can be highly involved in matters
pertaining to the management of fisheries as commons and not to be the sole responsibility of
state agencies. Delineation of municipal waters should be done across all bays in order to
demarcate the boundaries between municipalities which are very necessary in fisheries
management.
Fishing households appeared to be not fully exposed to highly technical fish
processing such as canning, fermenting, packaging and sauce making, since they also needed
resources which were not available in most target communities. However, they generally had
an orientation and awareness on safe, sanitary and healthy ways of food processing. Thus,
trainings on different fish processing techniques should be conducted for housewives and
other members of the fishing households across all bays.
Moreover, majority of the fishing households said that their present condition was
poorer compared to five years ago and that they did not have other sources of livelihood aside
from fishing, a situation that had definitely affected their income due deteriorating fishery
resources. As a whole, the fishing households favored livelihood change.
Formal and informal financial institutions were accessible across all Bays and
perceived satisfying services rendered. In gender factor, wives were able to access more
financial services compared to husband due to the personality of the latter.
Safety at sea measures across all Bays are generally done, determined and ensured by
the locals themselves, commonly by checking weather reports before and during sea trip by
bringing radio and ensuring the conditions of their fishing boats during fishing. These safety
measures were actually immediate and common to local fishers which did not require highly
technical skills and resources. However, it is imperative that Coast Guard should actively
monitor the fishing activities in all the Bays and to ensure the fishers’ safety.
Furthermore, on the basis of the baseline values obtained in this study, it is suggested
that indicators established for the monitoring and evaluation of the RFLP should also
include the number of City and municipal Fisheries and Resource management councils
(MFARMCs) established and strengthened to co-manage municipal waters and to improve
the conditions of marine habitats and fishery resources (fish density, fish species diversity,
live coral cover, seagrass cover, mangrove density and catch per unit effort).
16
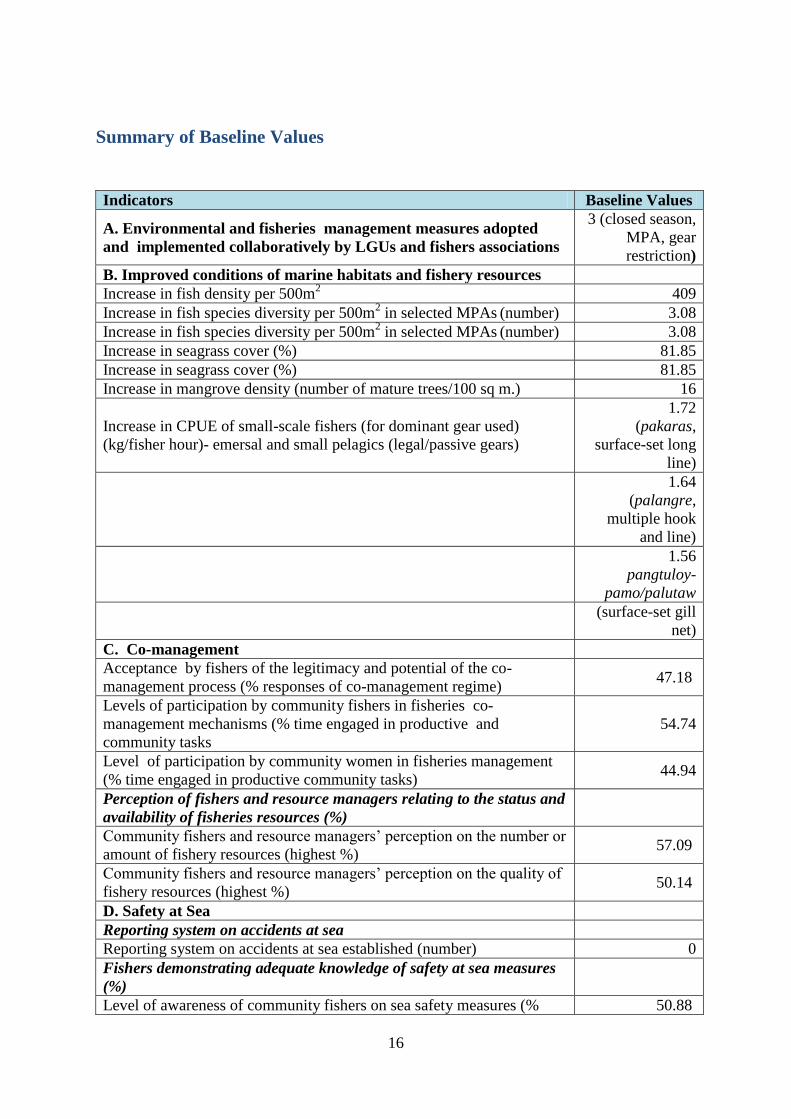
Summary of Baseline Values
Indicators Baseline Values
A. Environmental and fisheries management measures adopted
and implemented collaboratively by LGUs and fishers associations
3 (closed season,
MPA, gear
restriction)
B. Improved conditions of marine habitats and fishery resources
Increase in fish density per 500m2 409
Increase in fish species diversity per 500m2 in selected MPAs
(number)
3.08
Increase in fish species diversity per 500m2 in selected MPAs
(number)
3.08
Increase in seagrass cover (%) 81.85
Increase in seagrass cover (%) 81.85
Increase in mangrove density (number of mature trees/100 sq m.) 16
Increase in CPUE of small-scale fishers (for dominant gear used)
(kg/fisher hour)- emersal and small pelagics (legal/passive gears)
1.72
(pakaras,
surface-set long
line)
1.64
(palangre,
multiple hook
and line)
1.56
pangtuloy-
pamo/palutaw
(surface-set gill
net)
C. Co-management
Acceptance by fishers of the legitimacy and potential of the co-
management process (% responses of co-management regime) 47.18
Levels of participation by community fishers in fisheries co-
management mechanisms (% time engaged in productive and
community tasks
54.74
Level of participation by community women in fisheries management
(% time engaged in productive community tasks) 44.94
Perception of fishers and resource managers relating to the status and
availability of fisheries resources (%)
Community fishers and resource managers’ perception on the number or
amount of fishery resources (highest %) 57.09
Community fishers and resource managers’ perception on the quality of
fishery resources (highest %) 50.14
D. Safety at Sea
Reporting system on accidents at sea
Reporting system on accidents at sea established (number) 0
Fishers demonstrating adequate knowledge of safety at sea measures
(%)
Level of awareness of community fishers on sea safety measures (% 50.88
17
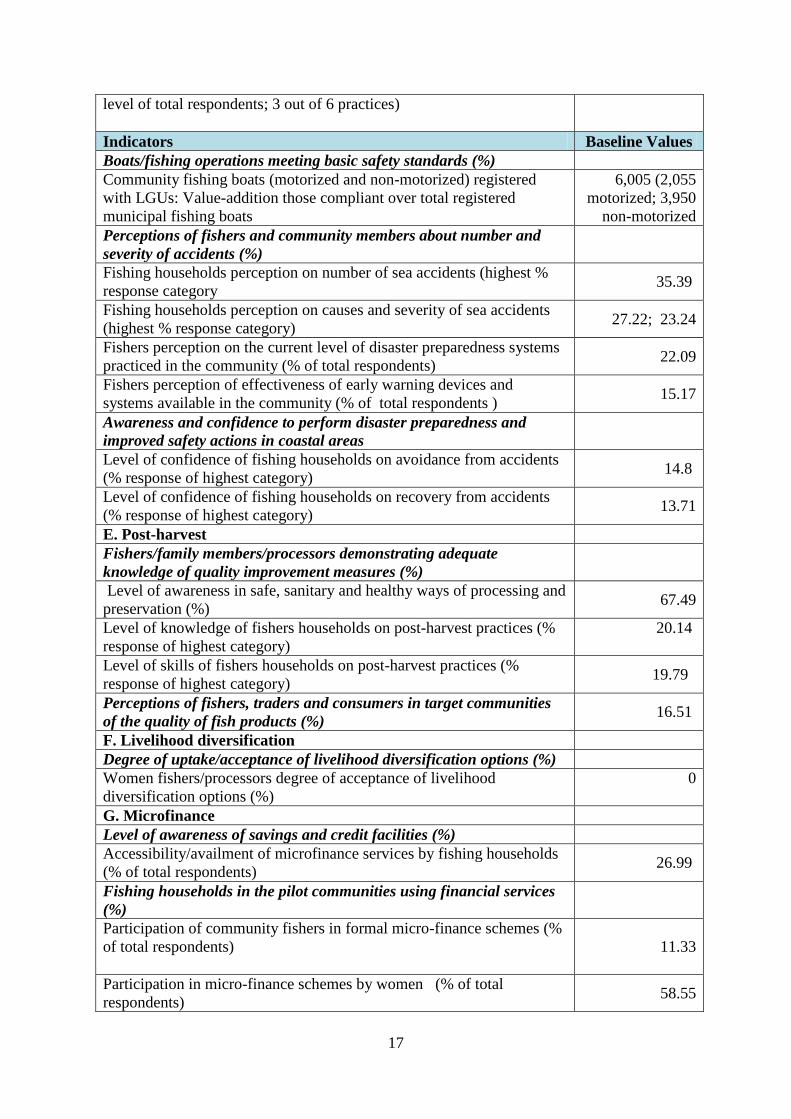
level of total respondents; 3 out of 6 practices)
Indicators Baseline Values
Boats/fishing operations meeting basic safety standards (%)
Community fishing boats (motorized and non-motorized) registered
with LGUs: Value-addition those compliant over total registered
municipal fishing boats
6,005 (2,055
motorized; 3,950
non-motorized
Perceptions of fishers and community members about number and
severity of accidents (%)
Fishing households perception on number of sea accidents (highest %
response category 35.39
Fishing households perception on causes and severity of sea accidents
(highest % response category) 27.22; 23.24
Fishers perception on the current level of disaster preparedness systems
practiced in the community (% of total respondents) 22.09
Fishers perception of effectiveness of early warning devices and
systems available in the community (% of total respondents ) 15.17
Awareness and confidence to perform disaster preparedness and
improved safety actions in coastal areas
Level of confidence of fishing households on avoidance from accidents
(% response of highest category) 14.8
Level of confidence of fishing households on recovery from accidents
(% response of highest category) 13.71
E. Post-harvest
Fishers/family members/processors demonstrating adequate
knowledge of quality improvement measures (%)
Level of awareness in safe, sanitary and healthy ways of processing and
preservation (%) 67.49
Level of knowledge of fishers households on post-harvest practices (%
response of highest category)
20.14
Level of skills of fishers households on post-harvest practices (%
response of highest category) 19.79
Perceptions of fishers, traders and consumers in target communities
of the quality of fish products (%) 16.51
F. Livelihood diversification
Degree of uptake/acceptance of livelihood diversification options (%)
Women fishers/processors degree of acceptance of livelihood
diversification options (%)
0
G. Microfinance
Level of awareness of savings and credit facilities (%)
Accessibility/availment of microfinance services by fishing households
(% of total respondents) 26.99
Fishing households in the pilot communities using financial services
(%)
Participation of community fishers in formal micro-finance schemes (%
of total respondents)
11.33
Participation in micro-finance schemes by women (% of total
respondents) 58.55
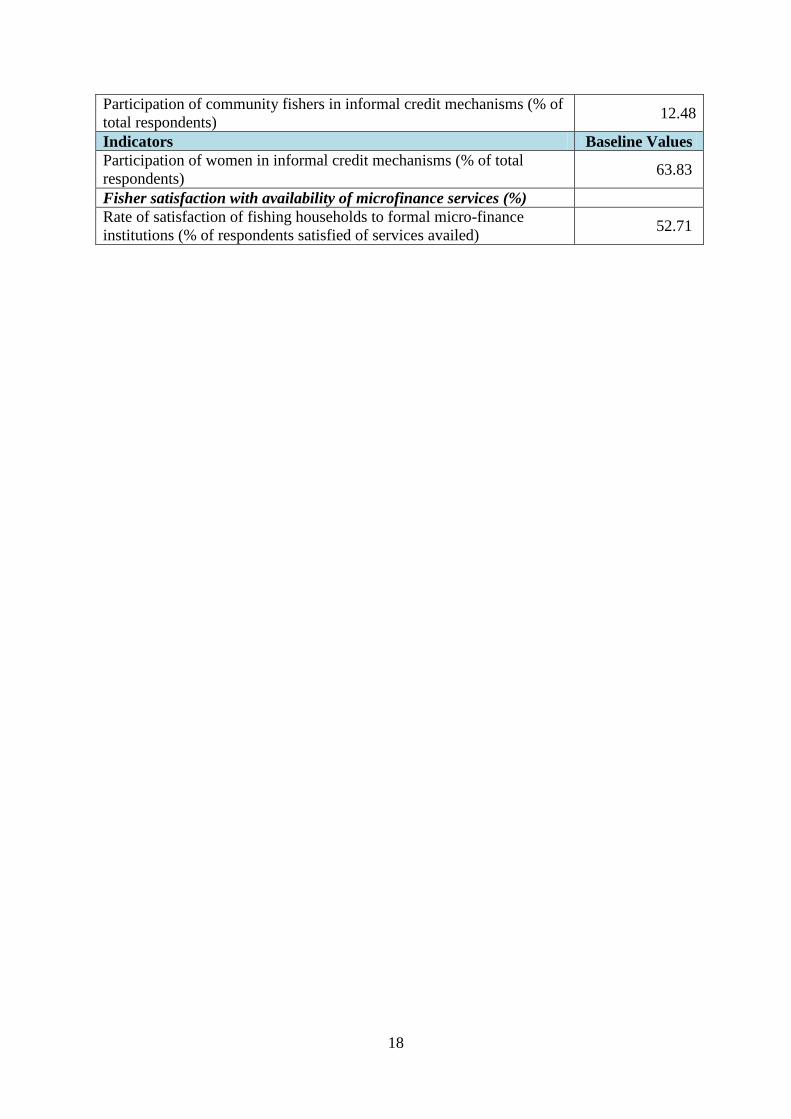
18
Participation of community fishers in informal credit mechanisms (% of
total respondents) 12.48
Indicators Baseline Values
Participation of women in informal credit mechanisms (% of total
respondents) 63.83
Fisher satisfaction with availability of microfinance services (%)
Rate of satisfaction of fishing households to formal micro-finance
institutions (% of respondents satisfied of services availed) 52.71

19