Embed Size (px)
Citation preview
i
Executive Summary
The Columbia Lake Stewardship Society (CLSS) began monitoring the water quality of Columbia Lake on April 20, 2014 and has continued while the lake is ice free through to October 2016. In 2016 water quality monitoring of Columbia Lake began on March 20, 2016 and ended on October 2, 2016. Monitoring included approximately bi-weekly monitoring of selected water quality indicator parameters and approximately monthly sampling of water for chemical analysis.
Eleven monitoring events were conducted and six sets of water quality samples submitted for chemical analysis. Nineteen water quality analyses (nitrate, total phosphorous and dissolve phosphorous) were run on the collected samples. Caro Analytical of Kelowna provided the analytical services.
CLSS water quality program is administered, implemented and interpreted entirely by volunteers. Further, the water quality program for 2016 involved more volunteers than had participated in previous years.
Their contribution is gratefully acknowledged.
The water quality monitoring program conducted by CLSS involves collecting three types of information:
• Observations about cloud cover, water surface disturbance (waves), and air temperature because changes in these conditions affect other measurements and may account for variations in the quantitative data collected:
• Measurements of:
o the depth of water at each sampling locations,
o the depth of clear water using the Secchi disk,
o water temperature,
o turbidity,
o conductance,
o pH and
o dissolved oxygen.
• Chemical analyses of water samples for total and dissolved phosphorous.
ii
There are five main findings from the 2016 water quality monitoring program.
1. The evaluation of the lake’s water quality would benefit by establishing Water Quality Objectives specific to Columbia Lake.
2. The collected information shows that in both 2015 and 2016 as the turbidity increases in the later portion of the year the conductivity of the water declines. This finding suggests that turbidity increases are created by disturbance of the lake (lifting of mineral sediments and organic particulates into the water) and growth of aquatic micro-organisms and not by increases in salt (as might be created by surface evaporation).
3. The information collected for S4, although in many ways incomplete, points to two probable sources of water entering the lake at its south end: groundwater inflow across the width of the south shore of the lake and surface water drainage from the southwest corner. The contribution of these sources to the lake needs to be confirmed.
4. Dissolved oxygen profiles suggest that the lake is a healthy ecological system. From season to season and year to year losses of dissolved oxygen as the lake warms up may not be the best for fish in the lake. But these variations are part of the natural processes occurring within the lake and should be expected.
5. Columbia Lake contains some elements (most noticeably chloride) that do not typically occur naturally in the rocks and soils surrounding the lake. Although well less than the concentration that makes the lake water unsafe for other uses (usually 230 m/L is the limit for chloride in drinking water), the chloride concentration is noticeably greater than other lakes and needs to be monitored carefully. However, this finding is based on only one analytical result and needs to be confirmed with additional water quality testing.
iii
Water Quality Monitoring and Program Summary
Executive Summary i
Table of Contents iii
1.0 Introduction 1
2.0 Monitoring Program 1
2.1 Historical Information 2
2.2 Volunteers 4
2.3 Purpose 4
2.4 Water Quality Objectives 4
2.5 Monitoring Parameters 6
2.6 Stations and Monitoring Events 6
3.0 Water Quality and Monitoring Results 7
3.1 Temperature 7
3.2 Secchi Disk Measurements 8
3.3 Turbidity 9
3.4 Conductivity 10
3.5 pH 11
3.6 Dissolved Oxygen 12
3.7 Nitrate 14
3.8 Total and Dissolved Phosphorous 15
4.0 Comparison to Nearby Lakes 18
5.0 Continuous Improvements 21
6.0 Probable Influences on Water Quality 23
iv
List of Tables Table 1: Water Temperature and Dissolved Oxygen Concentration, S1 January 2016 14
Table 2: Comparison of selected water quality parameters to other lakes 19
List of Figures
Figure 1: Monitoring Locations 3
Figure 2: Water Temperature 8
Figure 3: Turbidity 10
Figure 4: Conductivity 11
Figure 5: PH 12
Figure 6: Dissolved Oxygen 13
Figure 7: Total Phosphorous 16
Figure 8: Total and Dissolved Phosphorous 17
Figure 9: Ratio of Total to Dissolved Phosphorous 18
v
List of Appendices Appendix A: Monitoring parameters and their application to understanding water quality changes
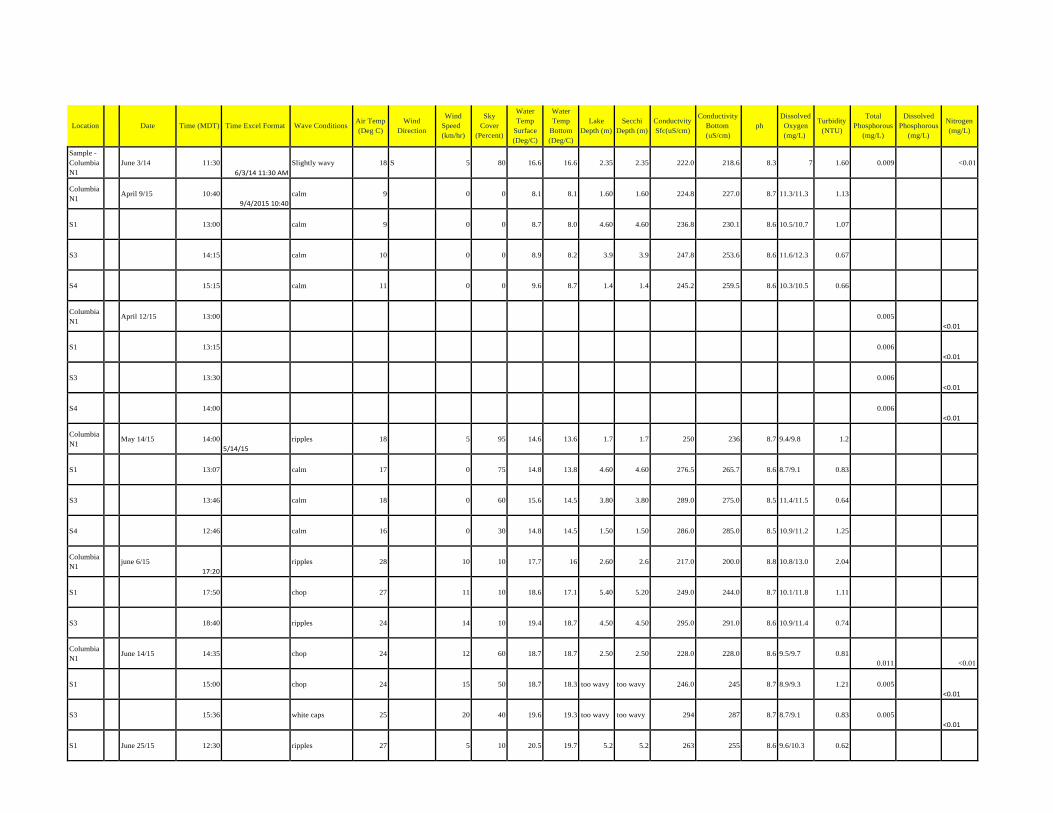
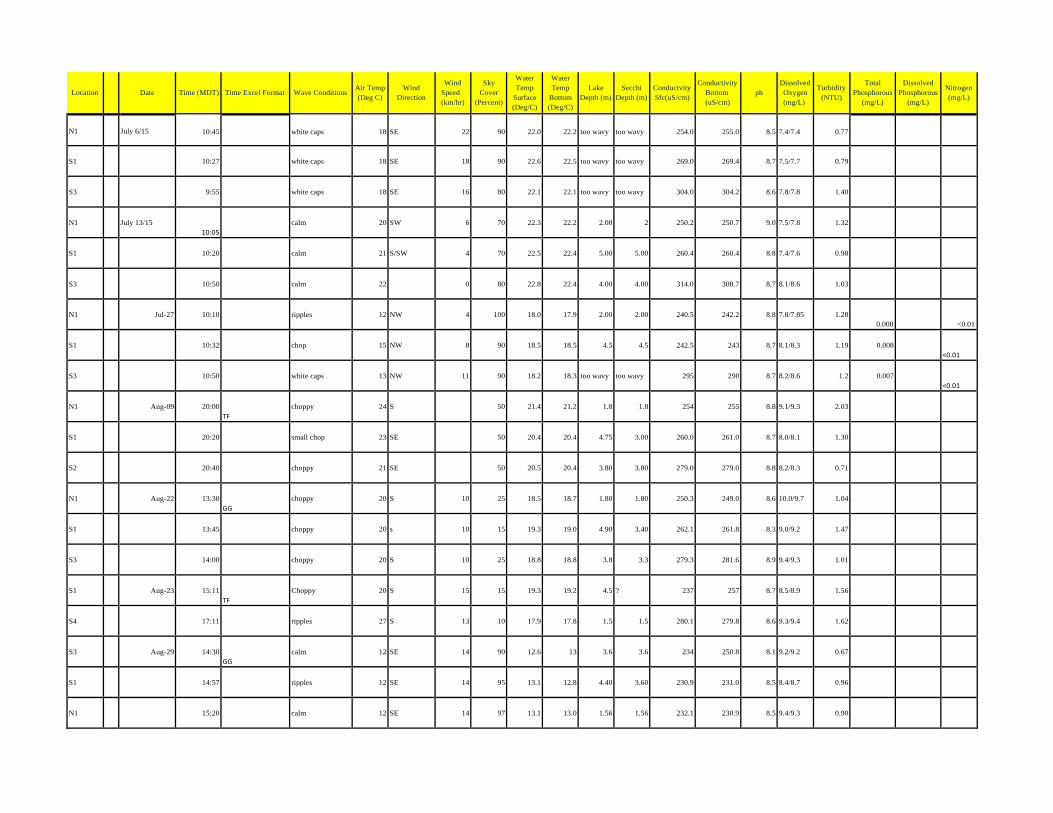
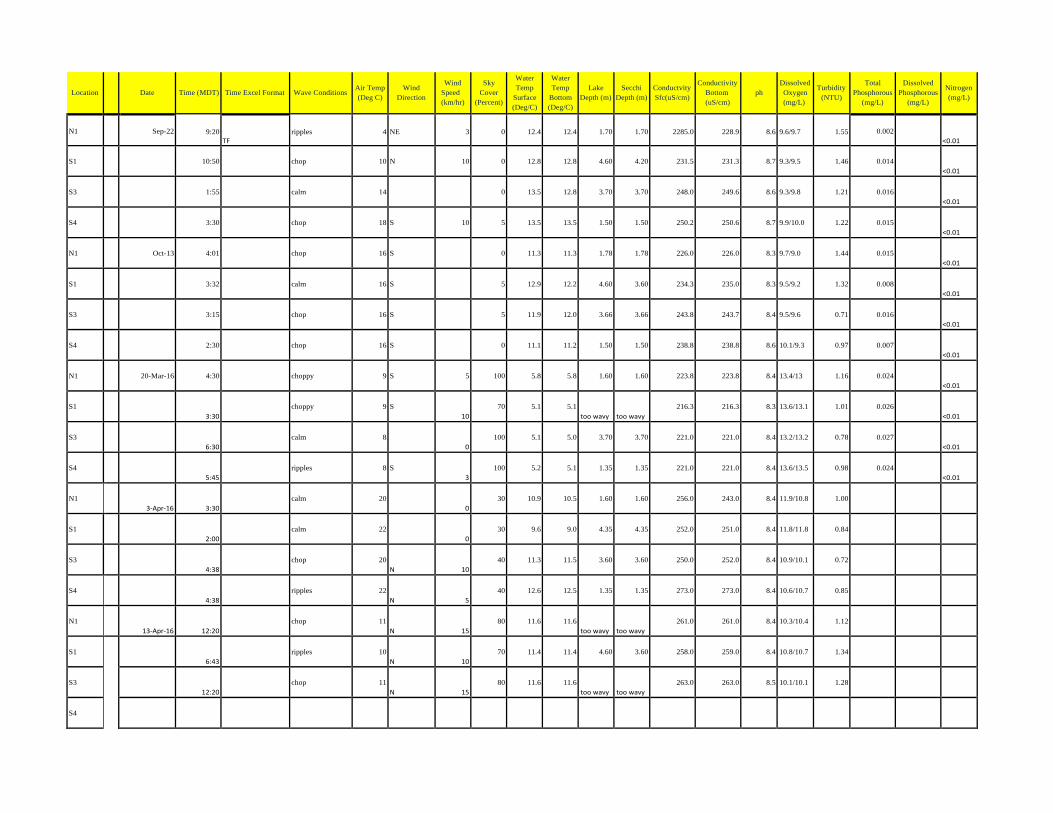
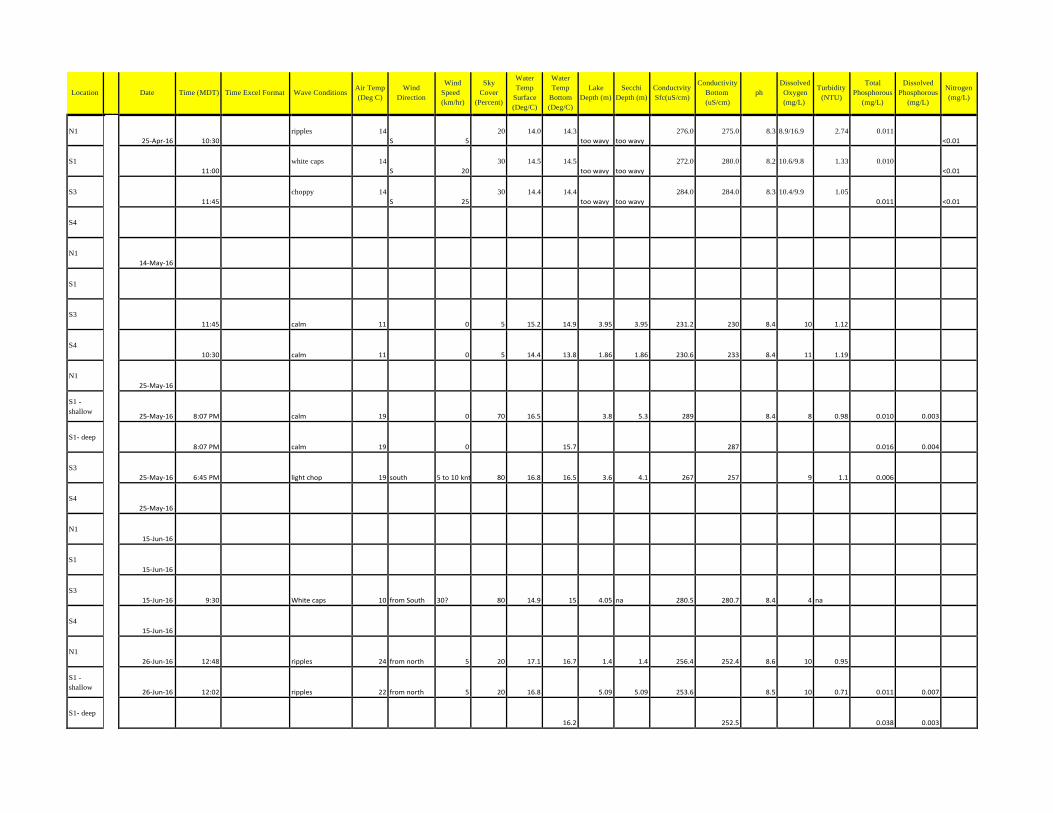
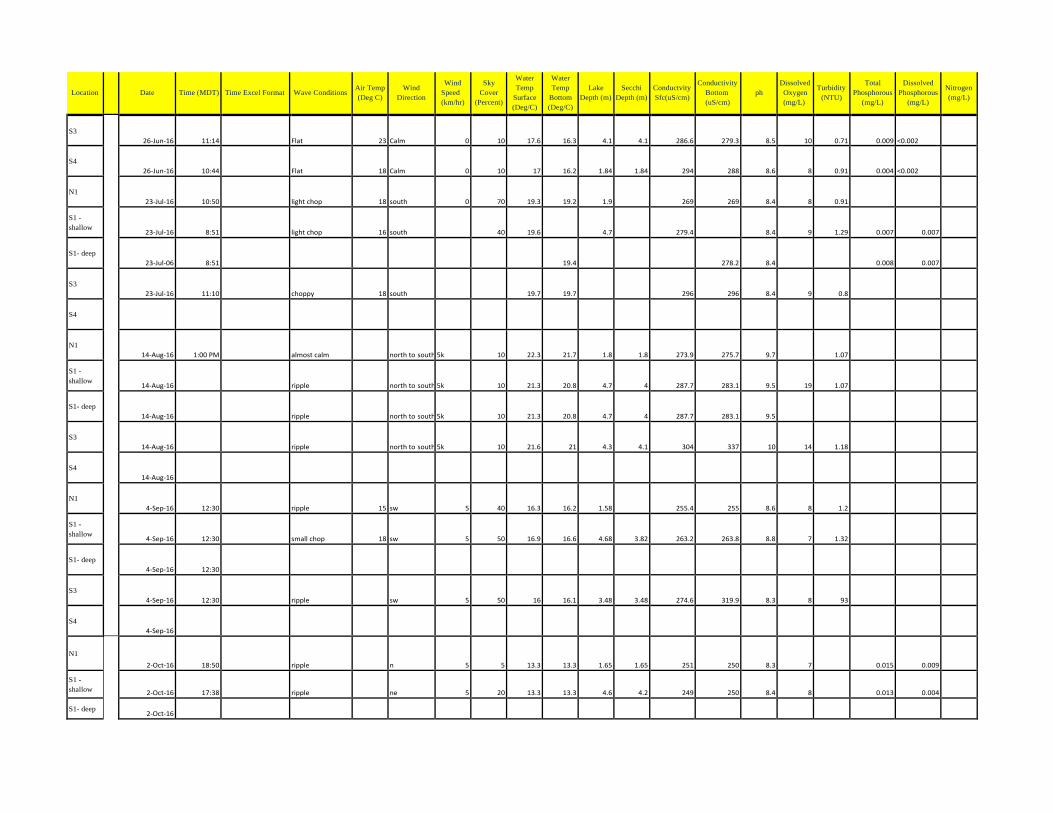
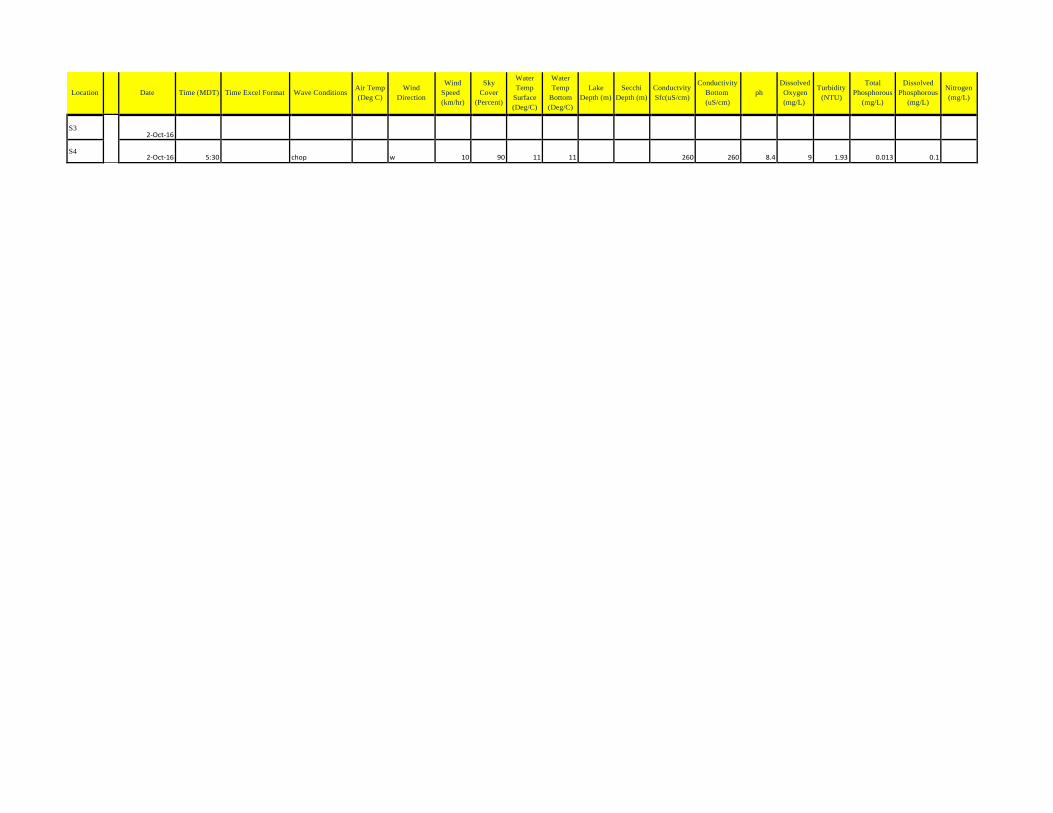
Appendix B: Spreadsheet of collected Water Quality information
Appendix C: Water Quality Information for Columbia Lake, Lake Windermere and Moyie Lake
1
WATER QUALITY MONITORING PROGRAM SUMMARY
1. Introduction
Columbia Lake, located in the East Kootenay region of British Columbia between the villages of Fairmont Hot Springs and Canal Flats, is the headwater of the Columbia River drainage system. Water from Columbia Lake drains to the north through the Columbia River into Late Windermere and from Lake Windermere into the Columbia Wetlands north of the town of Invermere. The Columbia River flows through the town of Golden further north of the wetlands before flowing south through the Arrow Lakes system and exiting Canada south of Nelson BC. Because Columbia Lake is a headwater lake, the quality of water draining from the lake potentially influences the water quality received downstream.
In response to concerns about future development along the lake and the consequent impact on the quality of the lake’s water, the Columbia Lake Management Strategy was written by Urban Systems in 1997. One of the recommendations in that strategy was monitoring of the lake. The Columbia Lake Stewardship Society (CLSS) began monitoring the lake’s water quality on April 20, 2014 and has continued the monitoring program while the lake is ice free through to October 2016. For 2016 water quality monitoring of Columbia Lake began on March 20, 2016 and ended on October 2, 2016. Monitoring included approximately bi-weekly monitoring of selected water quality indicator parameters and approximately monthly sampling of water for chemical analysis.
This summary of water quality monitoring results is presented in section 2.0 to 6.0. Section 2.0 describes the water quality monitoring program. Section 3.0 summarizes the water quality monitoring results. Section 4.0 compares the water quality of Columbia Lake to nearby lakes. Section 5.0 provides some continuous improvements to the program for implementation in subsequent years. Section 6.0 describes probable influences on the water quality of Columbia Lake.
2.0 Monitoring Program
Sections 2.1 through 2.6 provide information on the water quality program conducted by CLSS on Columbia Lake. The information is provided as follows:
• Section 2.1 Historical information - summarizes the inception of the water quality program and changes to the program implemented since the program began in 2014;
• Section 2.2 Volunteers - identifies the individuals involved in the program and their engagement in 2016;
• Section 2.3 Purpose – states the purpose of the monitoring program undertaken by CLSS and provided for ease of reference;
• Section 2.4 Objectives – describes the overall objectives and specific guidelines used to evaluate the water quality conditions on the lake.
• Section 2.5 Monitoring parameters – lists the parameters monitored on the lake and how these parameters are useful in assessing changes in the lake’s condition;
2
• Section 2.6 Stations and Events – identifies the monitoring stations and the sampling events conducted on the lake in 2016.
2.1 Historical information
The water quality monitoring program of Columbia Lake was initiated by the CLSS in 2014 in response to recommendations contained in the Columbia Lake Management Strategy (Urban Systems, 1997) indicating that a water quality and water level monitoring program be established. In 2014 the water quality confirmed that the lake’s condition was consistent with the conditions used to form the strategy. At that time four stations for monitoring lake quality conditions were established. However, in 2015, two changes to the water quality monitoring program were made. These changes were:
• The location of two stations, station S4 moved 2.4 km and station S3 moved 1.7 km southward to better align with the locations specified in the strategy.
• This new location for S4 places the site in shallow water, which is difficult to access by motor boats for sampling, and might cause disturbance of lake sediments that alter the turbidity measurements.
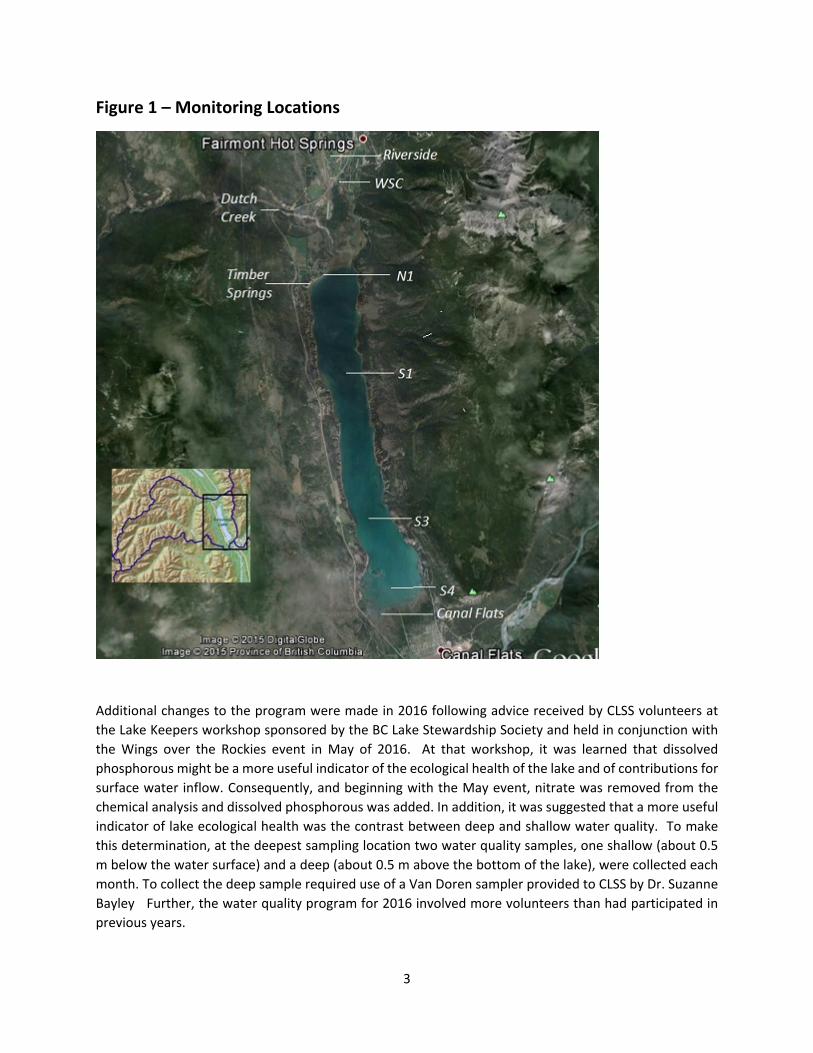
The current station locations are shown on Figure 1 and summarized from north to south along the lake as:
Station location Northing Easting
N1 N50.28769 W115.87126
S1 N50.25329 W115.86256
S3 N50.20107 W115.84820
S4 N50.17533 W115.83442
3
Figure 1 – Monitoring Locations
Additional changes to the program were made in 2016 following advice received by CLSS volunteers at the Lake Keepers workshop sponsored by the BC Lake Stewardship Society and held in conjunction with the Wings over the Rockies event in May of 2016. At that workshop, it was learned that dissolved phosphorous might be a more useful indicator of the ecological health of the lake and of contributions for surface water inflow. Consequently, and beginning with the May event, nitrate was removed from the chemical analysis and dissolved phosphorous was added. In addition, it was suggested that a more useful indicator of lake ecological health was the contrast between deep and shallow water quality. To make this determination, at the deepest sampling location two water quality samples, one shallow (about 0.5 m below the water surface) and a deep (about 0.5 m above the bottom of the lake), were collected each month. To collect the deep sample required use of a Van Doren sampler provided to CLSS by Dr. Suzanne Bayley Further, the water quality program for 2016 involved more volunteers than had participated in previous years.
4
2.2 Volunteers
CLSS water quality program is administered, implemented and interpreted entirely by volunteers. For the program in 2016 the following volunteers and their contribution is gratefully acknowledged:
• Cathy and Jim Coombs – monitoring in July; • Tracy Flynn – overall program administration and management, on-the-lake
training of new volunteers and monitoring in March, September and October; • Ed Gilmour – monitoring in April and May; • Gary Gray – monitoring in August; • Dave Hubbard - assistance with dissolved oxygen measurement beneath the ice; • Dave and Donna Rae – assistance with on-the-lake training: • Barb and Kevin Stromquist – monitoring in June; • Nancy Wilson and Tom Dance – on-the-lake training in spring and early summer, data
compilation and graphing, monitoring in May and June, data interpretation and reporting • Darin Yuzyk – monitoring in May
2.3 Purpose
The purpose of the water quality monitoring program undertaken by the CLSS is to provide baseline water quality information against which the impacts of current and future activities on the lake and in the surrounding lands that drain into the lake can be identified. This purpose helps to satisfy the main missions for establishing the CLSS:
• To act as a citizen based water stewardship group for Columbia Lake; • To implement activities which monitor and help maintain the ecological health of Columbia Lake; • To communicate and network with others, as required to achieve these two prior activities.
2.4 Water Quality Objectives
To identify potentially harmful changes in water quality, collected quantitative water quality information is compared to water quality standards as established by regulatory bodies.
The Province of British Columbia provides water quality guidance in two forms: one form is to use a set of numerical guidelines or criteria (Water Quality Guidelines – WQG’s) and the other is to apply a set of water quality objectives (WQO’s). BC has established a variety of guidelines (WQGs) or criteria useful for judging the quality of water used for drinking water, for agricultural use, for aquatic life and for recreational purposes. These guidelines are for broad application on a province wide basis and do not consider local
5
land uses or ambient lake conditions and thus may be over or under protective of a particular lake’s conditions and development pressure.
The other form of water quality guidance use to assist in management and to assist in ensuring the sustainability of water resources is the use of water quality objectives (WQO’s). Water quality objectives are an extension of WQG’s. WQO’s may be established by:
• Direct adoption of WQG’s for each monitoring parameter; • Establishing the upper limit of background concentration for each monitoring parameter; or • Deriving a site specific WQO based upon data collected at the site.
The process to establish WQO’s has yet to be undertaken by CLSS.
Because no WQO’s have been set for Columbia Lake, the water quality information collected is compared to the values established within the Lake Windermere management plan. These objectives are:
Parameter Objectives (revised for Lake Windermere in 2010)
Turbidity <1 NTU (Average) during clear flow periods < 5 NTU (Maximum) during clear flow periods
5 NTUS (measured as the 95th percentile of measurement) during turbid flow periods
Phosphorous 0.010 mg/L (maximum) Temperature <20o in June (average) < 25o in July (average) <23o in August (average) PH no recommended objective Dissolved oxygen > 5 mg/L instantaneous minimum >8 mg/L 30-day mean Conductance no recommended objective The WQO’s for Lake Windermere are set with a different water quality monitoring program than that applied by CLSS to Columbia Lake. The Lake Windermere objectives suggest that some form of continuous monitoring is in place to establish measured instantaneous or mean values and thus are not strictly suitable for application to Columbia Lake.
A methodology for CLSS to begin to establish WQO’s as the next years monitoring program begins is suggested in Section 5.
6
2.5 Monitoring Parameters
The water quality monitoring program conducted by CLSS involves collecting three types of information:
• Observations about cloud cover, water surface disturbance (waves), and air temperature because changes in these conditions affect other measurements and may account for variations in the quantitative data collected:
• Measurements of: o the depth of water at each sampling locations, o the depth of clear water using the Secchi disk, o water temperature, o turbidity, o conductance, o pH and o dissolved oxygen.
• Chemical analyses of water samples for total and dissolved phosphorous.
Appendix A provides information on the contribution of each of the measured parameters to our understanding of the water quality of Columbia Lake. Dissolved oxygen was measured in two ways during the 2016 monitoring events: by using a hand-held meter previously calibrated for dissolved oxygen concentrations and by a wet chemical technique. The wet chemical technique involved on-the- water titration to precipitate oxygen demanding dissolved organic and metals (iron) from the water sample. The dissolved oxygen concentration was measured from the number of drops of reagent needed to change the water colour from yellow to clear. The moving platform of the boat and recognition of colour changes by different volunteers make this method less precise. Section 5 provides a recommendation to acquire a hand held dissolved oxygen meter for subsequent years.
As much as lake conditions allowed, water temperature, and conductance were measured at both “shallow” and “deep” depths. Shallow refers to measurements in the upper 0.5 metres of the lake (an arms’ reach for practical purposes) while deep refers to measurements made about 0.5 metres from the lake bottom as measured using the Secchi disk.
2.6 Stations and Monitoring Events
Water quality monitoring was undertaken at each of the four stations identified in Section 2.1 as weather conditions allowed.
The 2016 monitoring program began on March 20, 2016 soon after the ice left the lake’s surface. This early start was due primarily to the unusually warm winter. The last set of water quality monitoring information was collected on October 2, 2016.
Eleven monitoring events were conducted and six sets of water quality samples submitted by the volunteers for chemical analysis. Nineteen water quality analyses (nitrate, total phosphorous and dissolved phosphorous) were run on the collected samples. Caro Analytical of Kelowna provided the analytical services.
7
The Spreadsheet in Appendix B provides the observations, measurements and chemical analysis collected during 2016 and is provided with the information collected in prior years for ease of reference.
3.0 Water Quality Monitoring Results The water quality monitoring results obtained in 2016 are summarized by:
• Comparing the results to the results obtained from 2014 and 2015; • Identifying where and when the maximum and minimum concentrations were measured; • Describing noticeable trends in concentrations along the lake (from south to north); and • Comparing the results to the objectives established for Lake Windermere for those
parameters that have established objectives.
3.1 Temperature
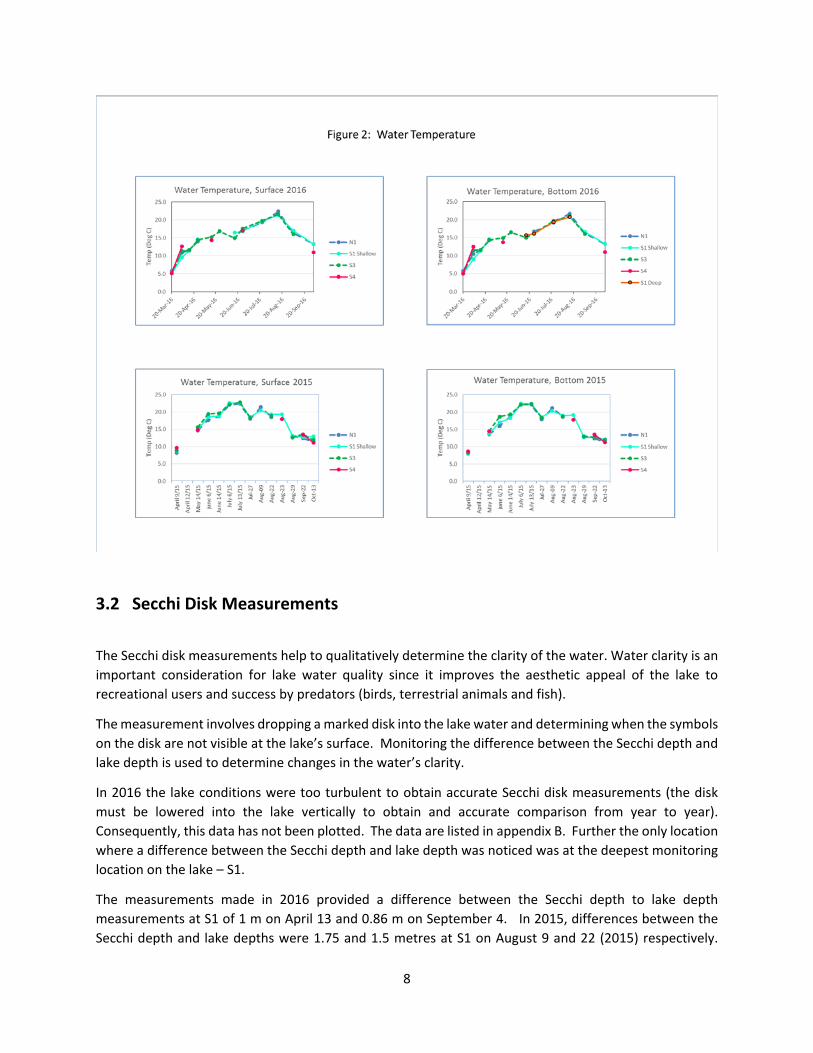
Figure 2 plots the temperature measured at shallow and deep depths for 2015 and 2016.
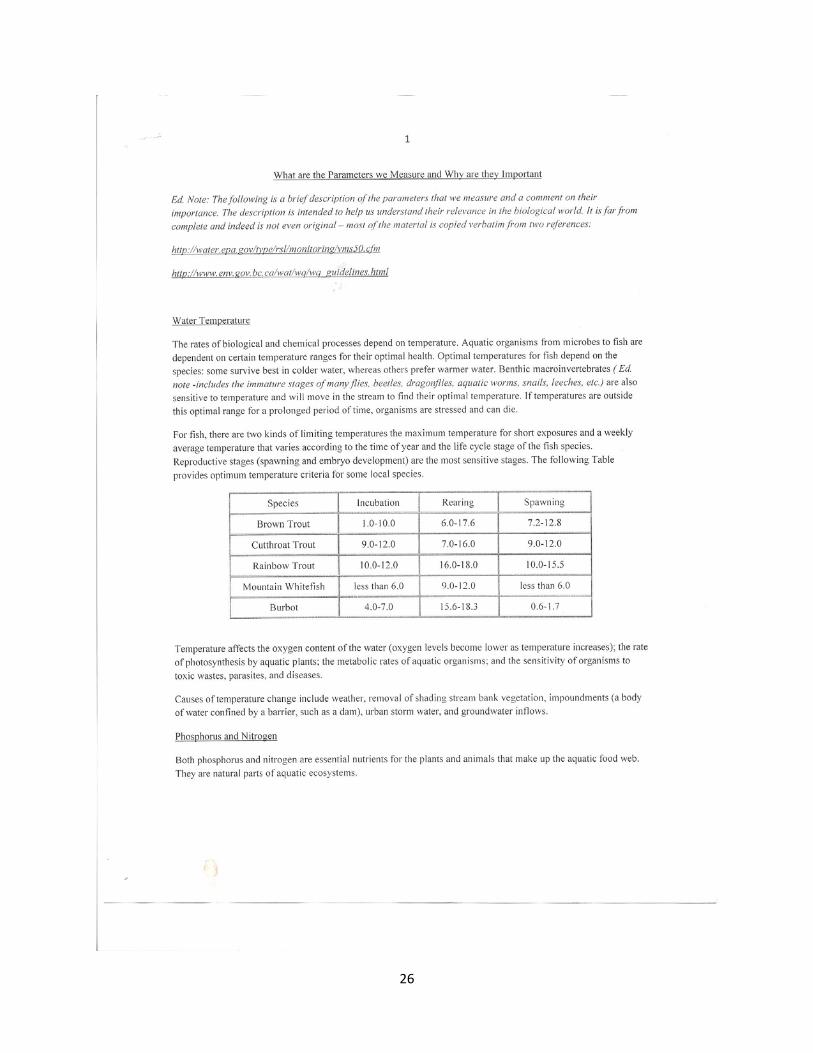
Lake temperature is an important ecological condition because, at high temperatures the quantity of dissolved oxygen available for fish declines and creates a potential environmental stressor reducing the mobility of fish. (We understand that temperatures greater than 20o C can so dramatically stress fish that fish kills may occur). Further, higher water temperatures increase the degradation of organic matter and creates potentially cloudy, murky or odorous water.
Overall, the trend in temperature measurements made in 2016 agree with those made in 2015. The lowest lake temperatures are measured in the early spring when the ice has just left the lake, the temperatures peak in the summer months when meteorological conditions are warmest and decline in the autumn as the air temperature cools (although these cooler temperatures do not reach the minimum measured in the spring). For 2015 the peak temperature occurred in mid-July. However, in 2016, because of cooler late spring and early summer temperatures, the peak temperature of the lake water did not occur until August.
In 2016 the lake temperature rose from a minimum of 5.2o C at S4 on March 20, 2016 to a maximum of 22.3o C at N1 in August. The shallow and deep temperatures on all sampling events did not vary by more than a degree or two, a finding attributable to the relatively shallow depth of Columbia Lake and mixing by wave action. Further, within any particular monitoring event along the lake, the variation in temperature did not vary by more than a degree or two.
The August 2016 measurements of 22.3o C at N1 (a maximum of 22.8o C was measured at S3 on July 13 of 2015) approach the maximum average water temperature objective set for Lake Windermere of 23o C.
8
3.2 Secchi Disk Measurements
The Secchi disk measurements help to qualitatively determine the clarity of the water. Water clarity is an important consideration for lake water quality since it improves the aesthetic appeal of the lake to recreational users and success by predators (birds, terrestrial animals and fish).
The measurement involves dropping a marked disk into the lake water and determining when the symbols on the disk are not visible at the lake’s surface. Monitoring the difference between the Secchi depth and lake depth is used to determine changes in the water’s clarity.
In 2016 the lake conditions were too turbulent to obtain accurate Secchi disk measurements (the disk must be lowered into the lake vertically to obtain and accurate comparison from year to year). Consequently, this data has not been plotted. The data are listed in appendix B. Further the only location where a difference between the Secchi depth and lake depth was noticed was at the deepest monitoring location on the lake – S1.
The measurements made in 2016 provided a difference between the Secchi depth to lake depth measurements at S1 of 1 m on April 13 and 0.86 m on September 4. In 2015, differences between the Secchi depth and lake depths were 1.75 and 1.5 metres at S1 on August 9 and 22 (2015) respectively.
9
Because the lake depth at the date of measurement was practically the same over the two years (4.75m in 2015 and 4.68m in 2016) a comparison from year to year suggests the lake is clearer in 2016 than in 2015. However, the Secchi disk measurements are influenced by the elapsed time since the most recent storm events, and the cloud cover and wave action on the day the measurements were taken and therefore this suggestion may be premature.
3.3 Turbidity
Turbidity measurements are another means of measuring the clarity (or in contrast the cloudiness or murkiness) of the water but, unlike the Secchi disk, these measurements are made in terms of NTU’s (Nephelometric Turbidity Units) - a quantifiable measure of turbidity. The turbidity of the lake water is influenced mostly by the growth of phytoplankton in the lake and the amount of suspended sediments in the water. These sediments are introduced by surface water draining into the lake and lake disturbances created by wave action and recreational boats that bring bottom lake sediments into the water. Organic matter that decays in the water as it warms up is also a significant contributor to the lake’s murkiness. The turbidity is also influenced by some chemical reactions that create insoluble precipitates (carbonates mostly) but this is not as great a contributor as suspended mineral sediments and organic debris.
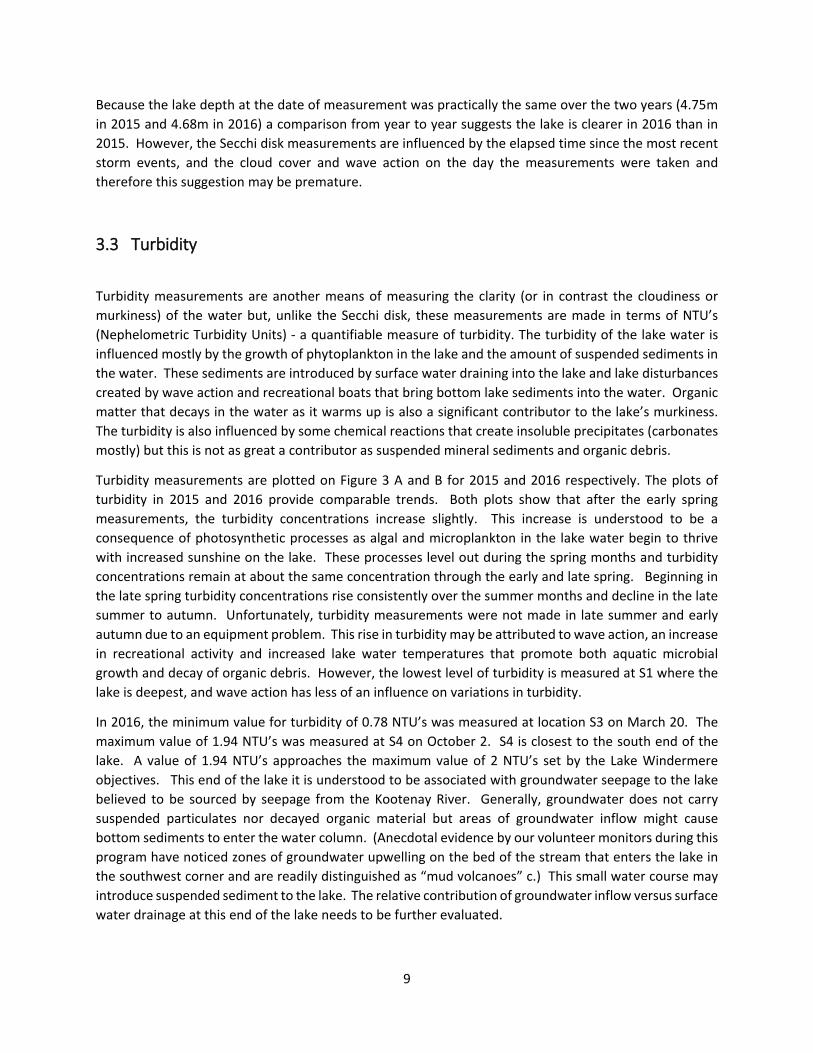
Turbidity measurements are plotted on Figure 3 A and B for 2015 and 2016 respectively. The plots of turbidity in 2015 and 2016 provide comparable trends. Both plots show that after the early spring measurements, the turbidity concentrations increase slightly. This increase is understood to be a consequence of photosynthetic processes as algal and microplankton in the lake water begin to thrive with increased sunshine on the lake. These processes level out during the spring months and turbidity concentrations remain at about the same concentration through the early and late spring. Beginning in the late spring turbidity concentrations rise consistently over the summer months and decline in the late summer to autumn. Unfortunately, turbidity measurements were not made in late summer and early autumn due to an equipment problem. This rise in turbidity may be attributed to wave action, an increase in recreational activity and increased lake water temperatures that promote both aquatic microbial growth and decay of organic debris. However, the lowest level of turbidity is measured at S1 where the lake is deepest, and wave action has less of an influence on variations in turbidity.
In 2016, the minimum value for turbidity of 0.78 NTU’s was measured at location S3 on March 20. The maximum value of 1.94 NTU’s was measured at S4 on October 2. S4 is closest to the south end of the lake. A value of 1.94 NTU’s approaches the maximum value of 2 NTU’s set by the Lake Windermere objectives. This end of the lake it is understood to be associated with groundwater seepage to the lake believed to be sourced by seepage from the Kootenay River. Generally, groundwater does not carry suspended particulates nor decayed organic material but areas of groundwater inflow might cause bottom sediments to enter the water column. (Anecdotal evidence by our volunteer monitors during this program have noticed zones of groundwater upwelling on the bed of the stream that enters the lake in the southwest corner and are readily distinguished as “mud volcanoes” c.) This small water course may introduce suspended sediment to the lake. The relative contribution of groundwater inflow versus surface water drainage at this end of the lake needs to be further evaluated.
10
In general, the highest values for turbidity occur at N1, the furthest north monitoring location and the location closest to the Columere Park boat dock, drainage from Dutch Creek into the lake and surface drainage from the lake via the Columbia River. This higher turbidity may be caused by the accumulation of suspended sediment (mineral sediments and organic debris) because drainage from the lake is focused at this north end. Figure 3 shows that the lowest values are measured at S3 close to the south end of the lake. The lake is deeper at S3 than at S4 where the greatest turbidity measurements were made and this difference in depth may account for the decline in turbidity values between S4 and S3.
3.4 Conductivity
Conductivity or conductance is a measure of the electrical conductivity of the lake water, a measure of the soluble salts the lake water contains. These soluble salts consist of both mineral salts dissolved from particulate sediments in the lake water or carried into the lake by groundwater inflows and surface water drainage. A portion of the conductivity of the lake water is also due to soluble organic matters that create weak acids as they dissolve (like vinegars) but usually this contribution of organic acids to the conductance is considered a minor contributor.
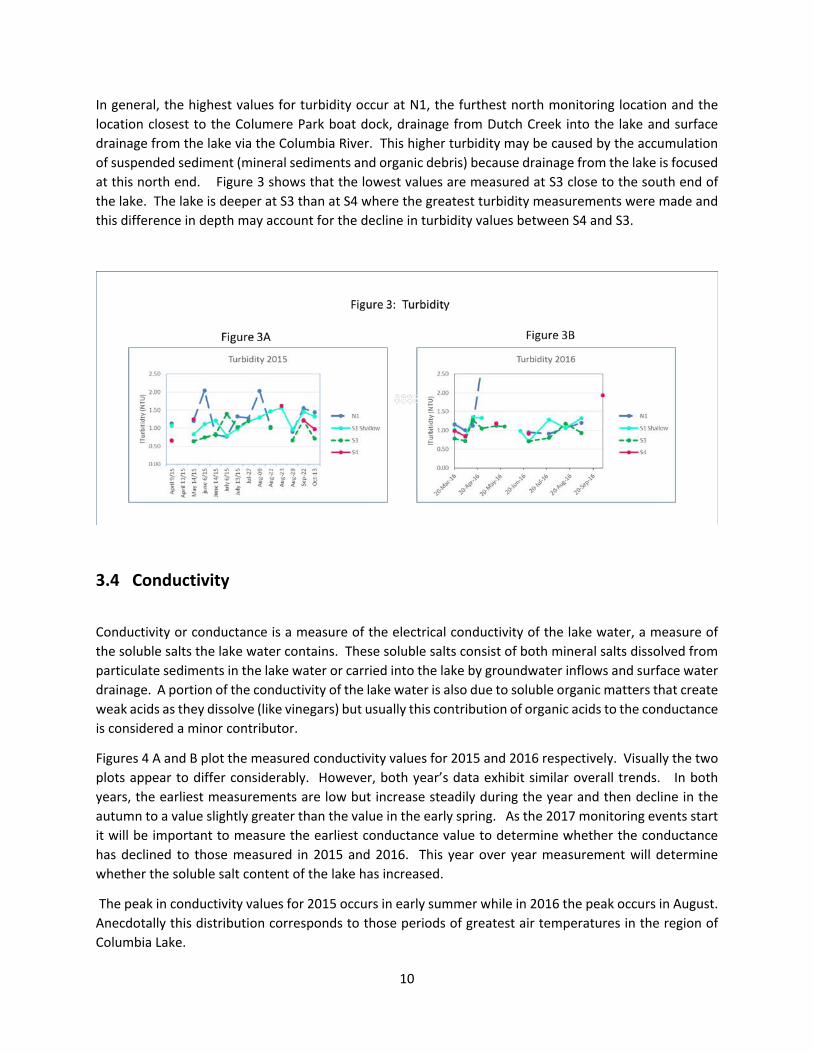
Figures 4 A and B plot the measured conductivity values for 2015 and 2016 respectively. Visually the two plots appear to differ considerably. However, both year’s data exhibit similar overall trends. In both years, the earliest measurements are low but increase steadily during the year and then decline in the autumn to a value slightly greater than the value in the early spring. As the 2017 monitoring events start it will be important to measure the earliest conductance value to determine whether the conductance has declined to those measured in 2015 and 2016. This year over year measurement will determine whether the soluble salt content of the lake has increased.
The peak in conductivity values for 2015 occurs in early summer while in 2016 the peak occurs in August. Anecdotally this distribution corresponds to those periods of greatest air temperatures in the region of Columbia Lake.
11
In 2016 the minimum conductivity measurement of 216.3 uS/cm was made at S1 during the March 20 monitoring event. The maximum conductivity measurement of 304 uS/cm was measured at S3 on August 14. Between shallow and deep depths there was less than 10 uS/cm difference between the measured values. Also, along the lake, the smaller values for the conductivity occur to the north of the lake (N1) while greater values occur to the south end of the lake (S3 and S4). If we consider that the south end of the lake is where the greatest inflow due to groundwater occurs, this finding suggests that soluble salts in the groundwater contribute to the overall conductivity. Any land activity over the groundwater contributing area will influence the quantity of soluble salts flowing into the lake.
There are no objective values set for Lake Windermere and thus a relative judge of the significance of these concentrations has not been provided.
3.5 PH PH is a measure of the acidity (PH values less than 7) or alkalinity (PH values greater than 7) of the lake water.
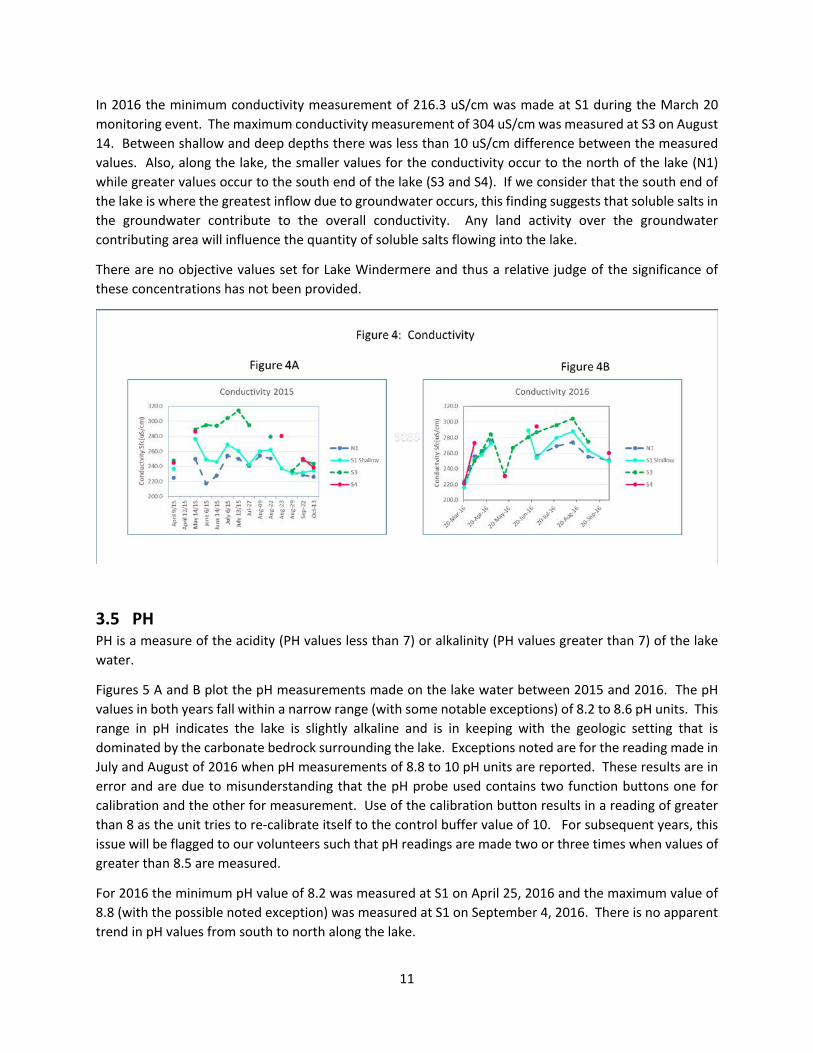
Figures 5 A and B plot the pH measurements made on the lake water between 2015 and 2016. The pH values in both years fall within a narrow range (with some notable exceptions) of 8.2 to 8.6 pH units. This range in pH indicates the lake is slightly alkaline and is in keeping with the geologic setting that is dominated by the carbonate bedrock surrounding the lake. Exceptions noted are for the reading made in July and August of 2016 when pH measurements of 8.8 to 10 pH units are reported. These results are in error and are due to misunderstanding that the pH probe used contains two function buttons one for calibration and the other for measurement. Use of the calibration button results in a reading of greater than 8 as the unit tries to re-calibrate itself to the control buffer value of 10. For subsequent years, this issue will be flagged to our volunteers such that pH readings are made two or three times when values of greater than 8.5 are measured.
For 2016 the minimum pH value of 8.2 was measured at S1 on April 25, 2016 and the maximum value of 8.8 (with the possible noted exception) was measured at S1 on September 4, 2016. There is no apparent trend in pH values from south to north along the lake.
12
There are no objectives for pH established by the Lake Windermere management plan. However, the Canadian Council of Ministers of the Environment (CCME) suggest that pH values greater than 6.5 and less than 8.5 are necessary for the protection of drinking water and an upper pH value of 9 for protection of aquatic life.
3.6 Dissolved Oxygen
Water containing dissolved oxygen is essential for photosynthetic processes in the lake and provides oxygen that allows aquatic and amphibious fauna to thrive. The only mechanical source of dissolved oxygen is precipitation falling directly on the lake or snow melt. Lake surface disturbances that create turbulence and waves produced by winds also introduce oxygen to the lake. Some dissolved oxygen will also be provided by the inflow of surface drainage to the lake but little oxygen enters the lake with any groundwater inflow. Oxygen is also a major by-product of the photosynthetic processes.
The saturation level of oxygen is between 8 and 14 mg/L depending upon the temperature with oxygen more readily soluble in cooler water than in warmer waters (i.e. 8 mg/L at water temperatures of 25o C and 14 mg/L at water temperatures of 1o C).
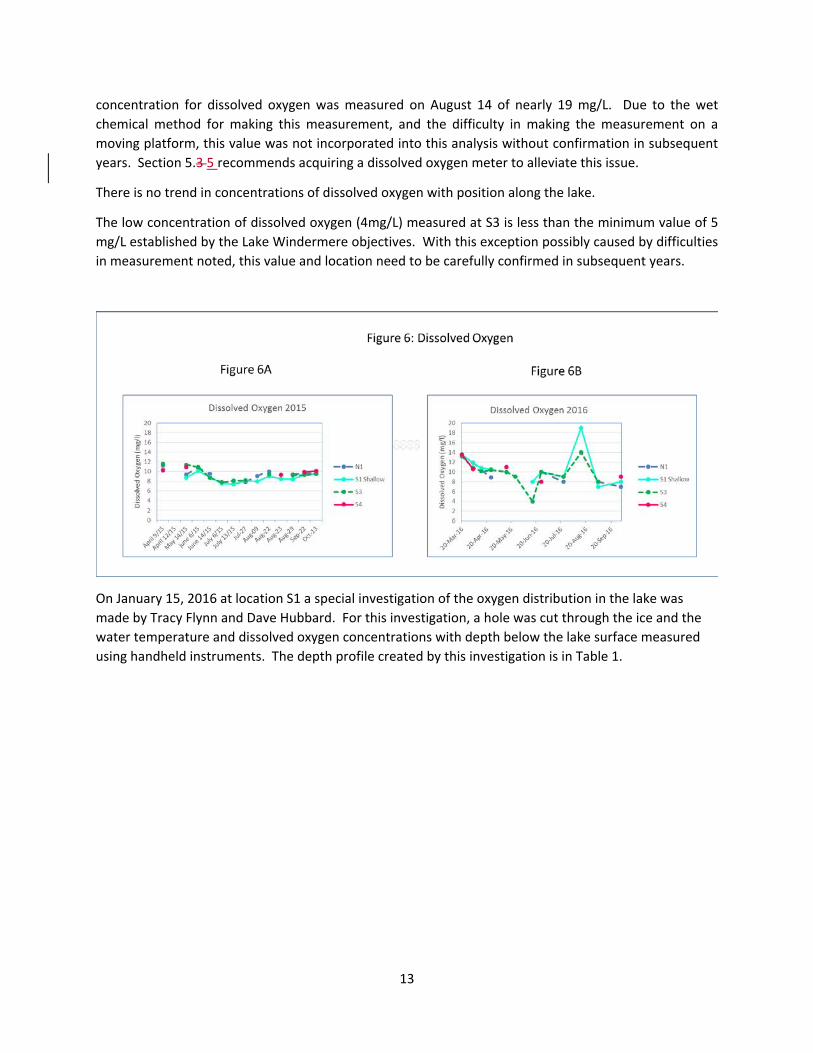
Figures 6 A and B plot the dissolved oxygen measurements made on the lake for 2015 and 2016. Both years exhibit comparable trends in dissolved oxygen concentrations. The maximum dissolved oxygen concentrations are measured in the early spring soon after the lake ice disappears. Dissolved oxygen concentrations decline during the later spring and summer. This is understood to be a consequence of lake water warming and photosynthetic processes beginning to occur with the warming trend. Later in August and September, when declining photosynthetic processes lessen, the consumption of oxygen from the lake water decreases and the oxygen concentration increases.
During 2016 and with the noted exceptions, the maximum dissolved oxygen concentration of 13.6 mg/L was measured at S1 and S4 on March 20, the earliest sampling date on the lake. The minimum concentration for dissolved oxygen of 4mg/L was measured at S3 on June 15. An exceptional
13
concentration for dissolved oxygen was measured on August 14 of nearly 19 mg/L. Due to the wet chemical method for making this measurement, and the difficulty in making the measurement on a moving platform, this value was not incorporated into this analysis without confirmation in subsequent years. Section 5.3 5 recommends acquiring a dissolved oxygen meter to alleviate this issue.
There is no trend in concentrations of dissolved oxygen with position along the lake.
The low concentration of dissolved oxygen (4mg/L) measured at S3 is less than the minimum value of 5 mg/L established by the Lake Windermere objectives. With this exception possibly caused by difficulties in measurement noted, this value and location need to be carefully confirmed in subsequent years.
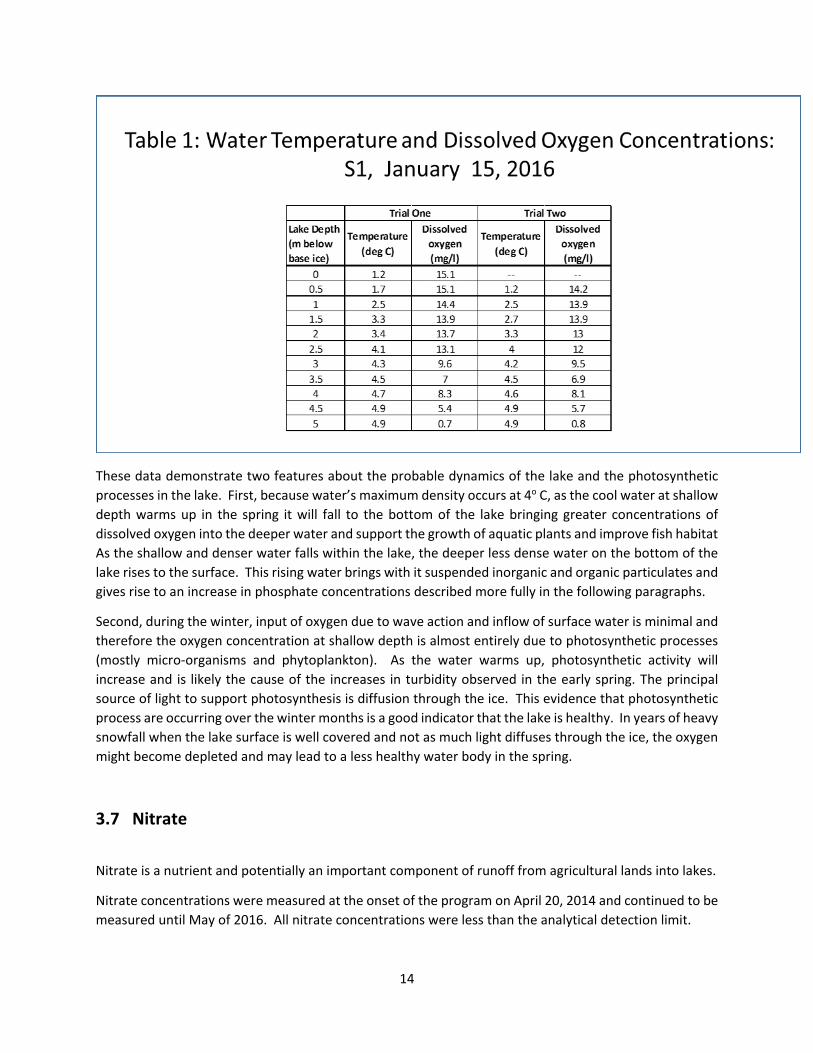
On January 15, 2016 at location S1 a special investigation of the oxygen distribution in the lake was made by Tracy Flynn and Dave Hubbard. For this investigation, a hole was cut through the ice and the water temperature and dissolved oxygen concentrations with depth below the lake surface measured using handheld instruments. The depth profile created by this investigation is in Table 1.
14
These data demonstrate two features about the probable dynamics of the lake and the photosynthetic processes in the lake. First, because water’s maximum density occurs at 4o C, as the cool water at shallow depth warms up in the spring it will fall to the bottom of the lake bringing greater concentrations of dissolved oxygen into the deeper water and support the growth of aquatic plants and improve fish habitat As the shallow and denser water falls within the lake, the deeper less dense water on the bottom of the lake rises to the surface. This rising water brings with it suspended inorganic and organic particulates and gives rise to an increase in phosphate concentrations described more fully in the following paragraphs.
Second, during the winter, input of oxygen due to wave action and inflow of surface water is minimal and therefore the oxygen concentration at shallow depth is almost entirely due to photosynthetic processes (mostly micro-organisms and phytoplankton). As the water warms up, photosynthetic activity will increase and is likely the cause of the increases in turbidity observed in the early spring. The principal source of light to support photosynthesis is diffusion through the ice. This evidence that photosynthetic process are occurring over the winter months is a good indicator that the lake is healthy. In years of heavy snowfall when the lake surface is well covered and not as much light diffuses through the ice, the oxygen might become depleted and may lead to a less healthy water body in the spring.
3.7 Nitrate
Nitrate is a nutrient and potentially an important component of runoff from agricultural lands into lakes.
Nitrate concentrations were measured at the onset of the program on April 20, 2014 and continued to be measured until May of 2016. All nitrate concentrations were less than the analytical detection limit.
15
3.8 Total and dissolved phosphorous
Phosphorous is a nutrient essential for plant growth. It is a nutrient that is provided naturally by drainage of water courses to the lake but also by wastewater discharge and agricultural practices.
Aquatic plants and particularly microscopic plants are the principal feed stock of phytoplankton which are consumed by small fish and invertebrates which eventually become the feed stock of larger fish and aquatic/ amphibious vertebrates. Thus, a healthy lake must have phosphorous but it is a nutrient that is usually in short supply in freshwater systems. However, an overabundance of phosphorous will cause algal blooms and deterioration of oxygen concentrations and the death of aquatic invertebrates and fish.
Phosphorous occurs in both inorganic (derived from the dissolution of minerals in sediments) and organic forms (derived from decayed organics animal and vegetable). The measure Total Phosphorous includes both particulate and dissolved phosphorous. Dissolved inorganic phosphorous is the form required for plant growth while animals (including phytoplankton) can use both inorganic and organic forms. This information has been obtained from SEAWA, the south east Alberta Water Alliance and dated, 2014.
The analysis conducted to date does not distinguish between inorganic and organic phosphorous and perhaps this distinction needs to be implemented in future years as more data on the proportions of total and dissolved phosphorous are available.
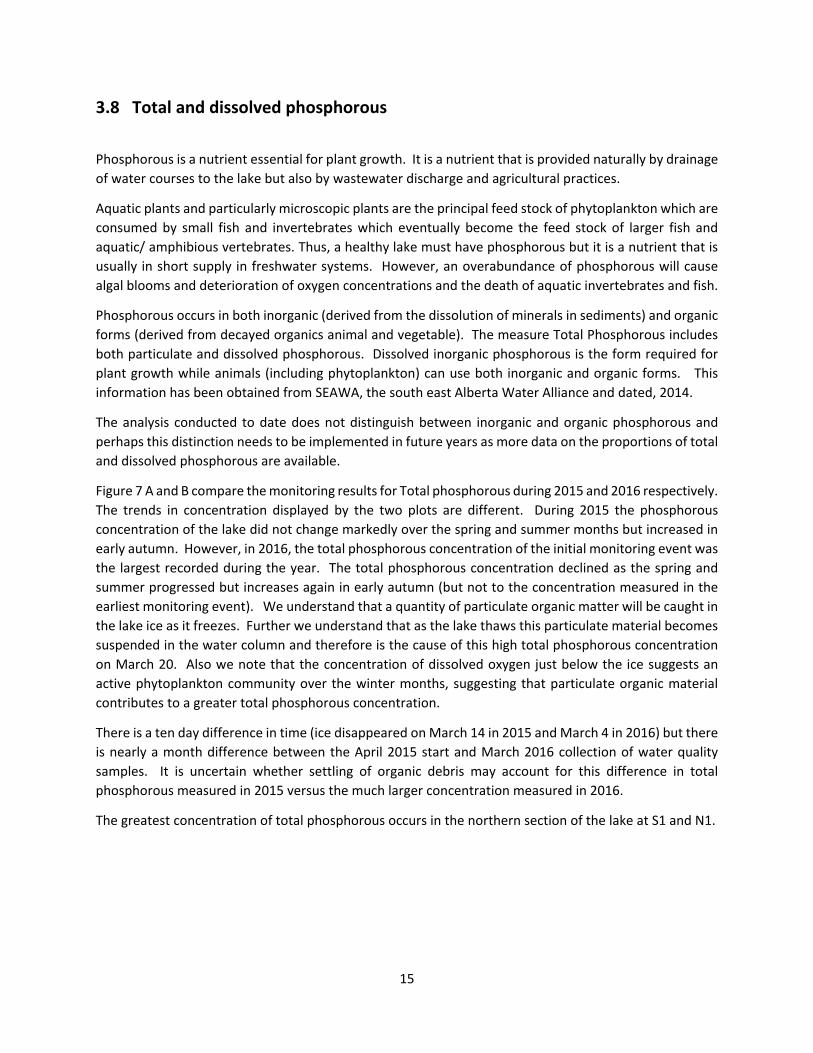
Figure 7 A and B compare the monitoring results for Total phosphorous during 2015 and 2016 respectively. The trends in concentration displayed by the two plots are different. During 2015 the phosphorous concentration of the lake did not change markedly over the spring and summer months but increased in early autumn. However, in 2016, the total phosphorous concentration of the initial monitoring event was the largest recorded during the year. The total phosphorous concentration declined as the spring and summer progressed but increases again in early autumn (but not to the concentration measured in the earliest monitoring event). We understand that a quantity of particulate organic matter will be caught in the lake ice as it freezes. Further we understand that as the lake thaws this particulate material becomes suspended in the water column and therefore is the cause of this high total phosphorous concentration on March 20. Also we note that the concentration of dissolved oxygen just below the ice suggests an active phytoplankton community over the winter months, suggesting that particulate organic material contributes to a greater total phosphorous concentration.
There is a ten day difference in time (ice disappeared on March 14 in 2015 and March 4 in 2016) but there is nearly a month difference between the April 2015 start and March 2016 collection of water quality samples. It is uncertain whether settling of organic debris may account for this difference in total phosphorous measured in 2015 versus the much larger concentration measured in 2016.
The greatest concentration of total phosphorous occurs in the northern section of the lake at S1 and N1.
16
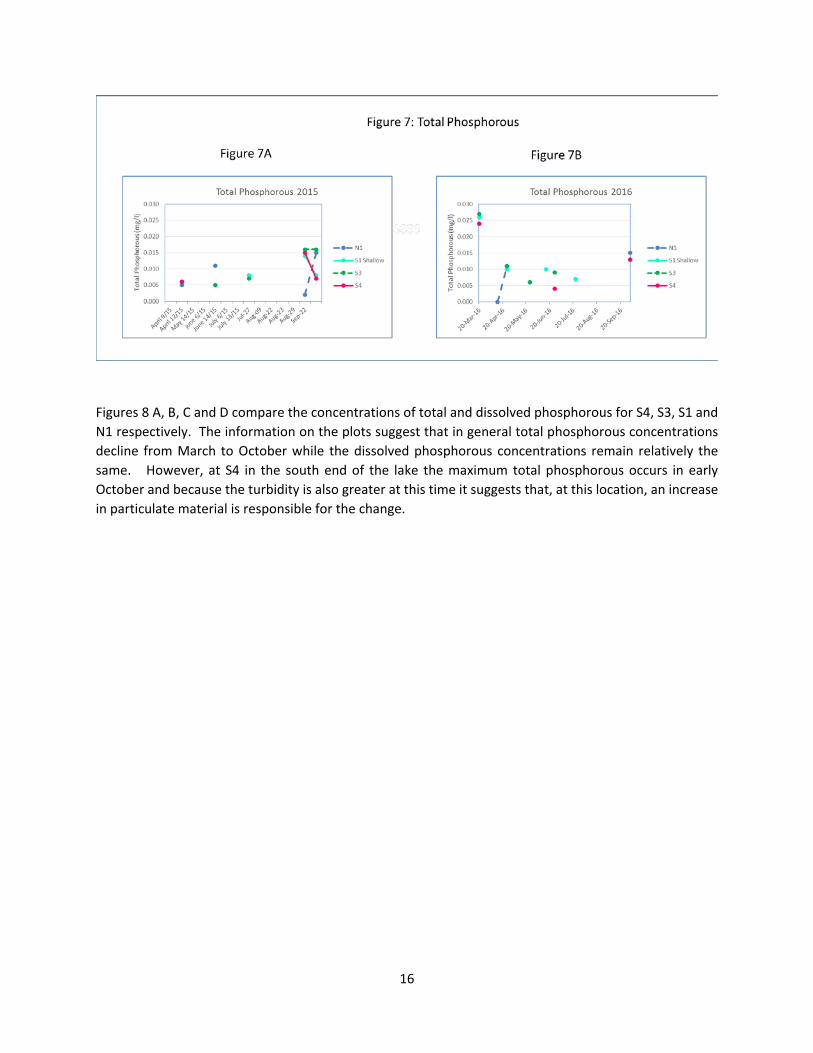
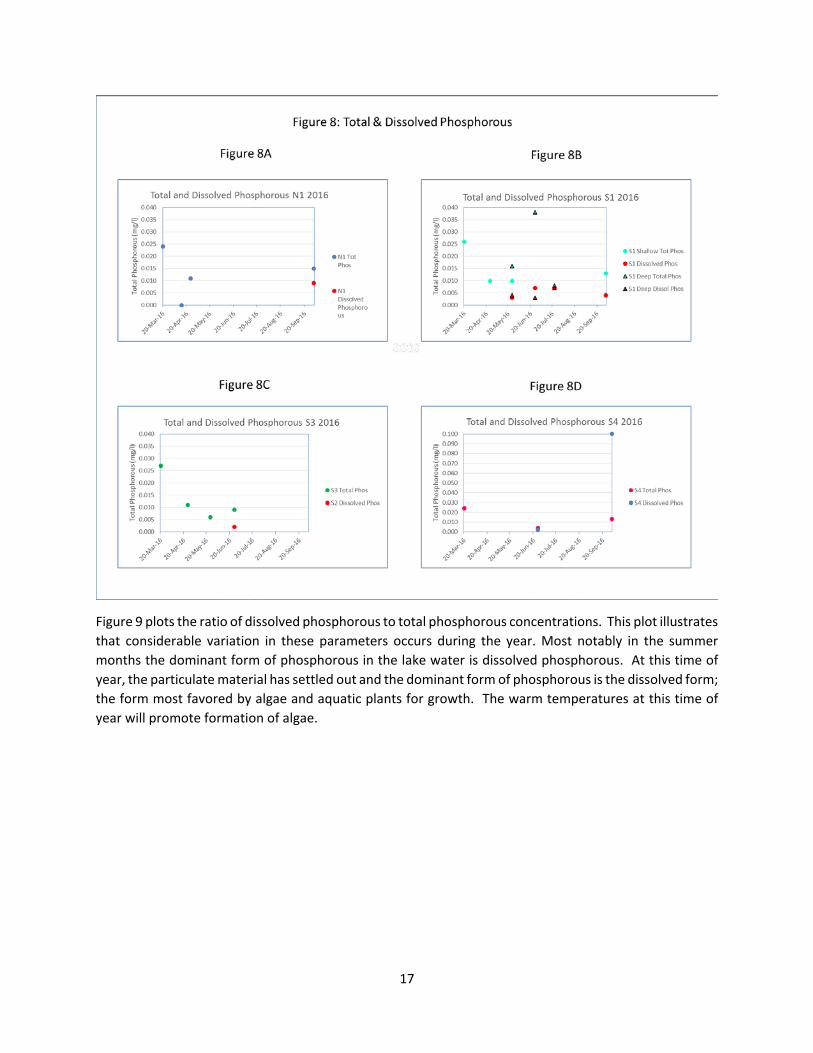
Figures 8 A, B, C and D compare the concentrations of total and dissolved phosphorous for S4, S3, S1 and N1 respectively. The information on the plots suggest that in general total phosphorous concentrations decline from March to October while the dissolved phosphorous concentrations remain relatively the same. However, at S4 in the south end of the lake the maximum total phosphorous occurs in early October and because the turbidity is also greater at this time it suggests that, at this location, an increase in particulate material is responsible for the change.
17
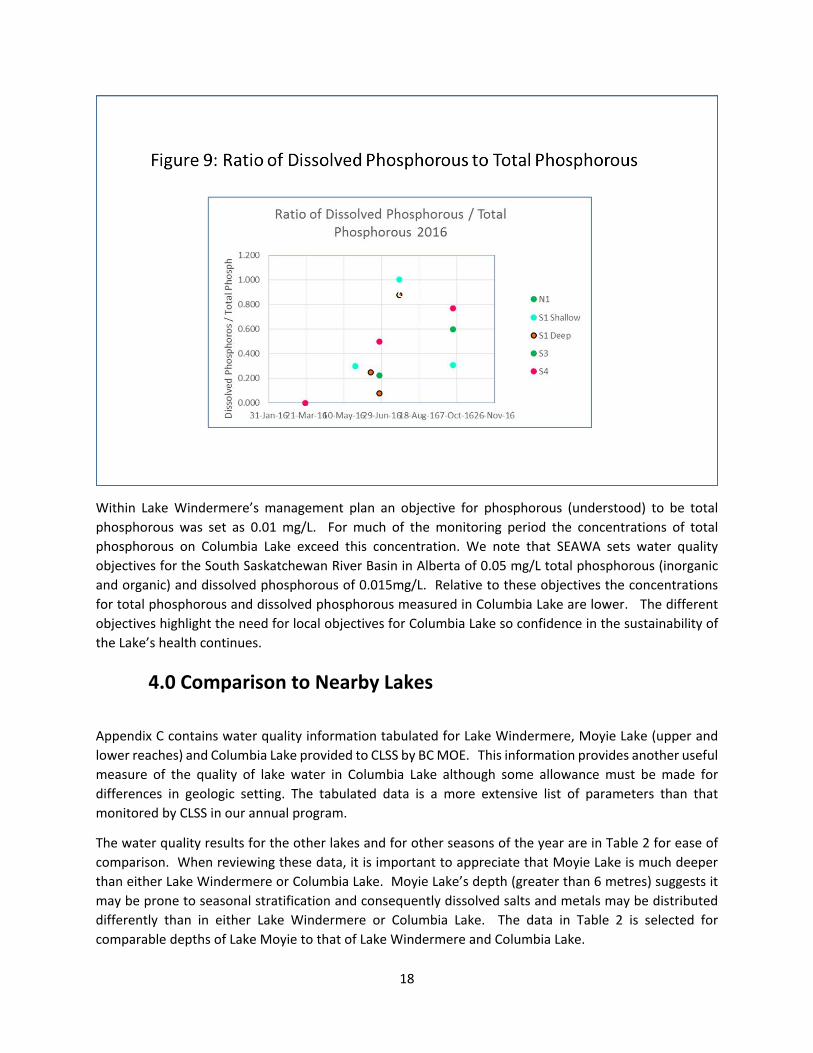
Figure 9 plots the ratio of dissolved phosphorous to total phosphorous concentrations. This plot illustrates that considerable variation in these parameters occurs during the year. Most notably in the summer months the dominant form of phosphorous in the lake water is dissolved phosphorous. At this time of year, the particulate material has settled out and the dominant form of phosphorous is the dissolved form; the form most favored by algae and aquatic plants for growth. The warm temperatures at this time of year will promote formation of algae.
18
Within Lake Windermere’s management plan an objective for phosphorous (understood) to be total phosphorous was set as 0.01 mg/L. For much of the monitoring period the concentrations of total phosphorous on Columbia Lake exceed this concentration. We note that SEAWA sets water quality objectives for the South Saskatchewan River Basin in Alberta of 0.05 mg/L total phosphorous (inorganic and organic) and dissolved phosphorous of 0.015mg/L. Relative to these objectives the concentrations for total phosphorous and dissolved phosphorous measured in Columbia Lake are lower. The different objectives highlight the need for local objectives for Columbia Lake so confidence in the sustainability of the Lake’s health continues.
4.0 Comparison to Nearby Lakes
Appendix C contains water quality information tabulated for Lake Windermere, Moyie Lake (upper and lower reaches) and Columbia Lake provided to CLSS by BC MOE. This information provides another useful measure of the quality of lake water in Columbia Lake although some allowance must be made for differences in geologic setting. The tabulated data is a more extensive list of parameters than that monitored by CLSS in our annual program.
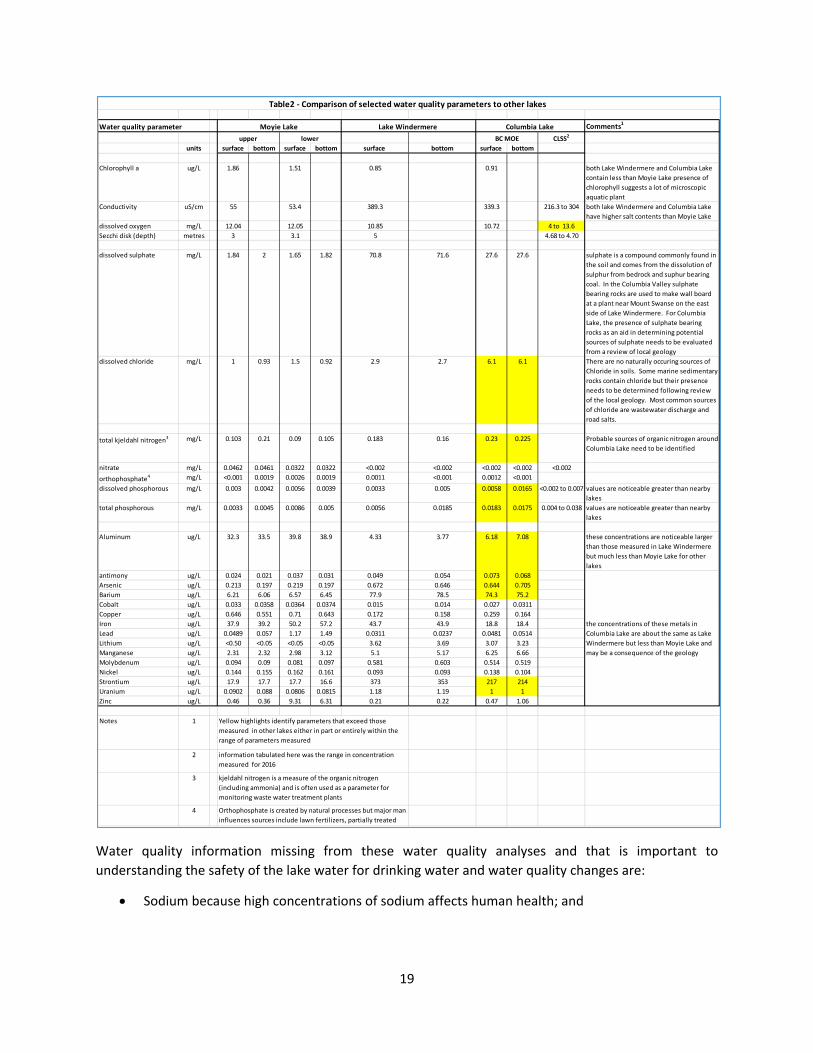
The water quality results for the other lakes and for other seasons of the year are in Table 2 for ease of comparison. When reviewing these data, it is important to appreciate that Moyie Lake is much deeper than either Lake Windermere or Columbia Lake. Moyie Lake’s depth (greater than 6 metres) suggests it may be prone to seasonal stratification and consequently dissolved salts and metals may be distributed differently than in either Lake Windermere or Columbia Lake. The data in Table 2 is selected for comparable depths of Lake Moyie to that of Lake Windermere and Columbia Lake.
19
Water quality information missing from these water quality analyses and that is important to understanding the safety of the lake water for drinking water and water quality changes are:
• Sodium because high concentrations of sodium affects human health; and
Water quality parameter Comments1
CLSS2
units surface bottom surface bottom surface bottom surface bottom
Chlorophyll a ug/L 1.86 1.51 0.85 0.91 both Lake Windermere and Columbia Lake contain less than Moyie Lake presence of chlorophyll suggests a lot of microscopic aquatic plant
Conductivity uS/cm 55 53.4 389.3 339.3 216.3 to 304 both lake Windermere and Columbia Lake have higher salt contents than Moyie Lake
dissolved oxygen mg/L 12.04 12.05 10.85 10.72 4 to 13.6Secchi disk (depth) metres 3 3.1 5 4.68 to 4.70
dissolved sulphate mg/L 1.84 2 1.65 1.82 70.8 71.6 27.6 27.6 sulphate is a compound commonly found in the soil and comes from the dissolution of sulphur from bedrock and suphur bearing coal. In the Columbia Valley sulphate bearing rocks are used to make wall board at a plant near Mount Swanse on the east side of Lake Windermere. For Columbia Lake, the presence of sulphate bearing rocks as an aid in determining potential sources of sulphate needs to be evaluated from a review of local geology
dissolved chloride mg/L 1 0.93 1.5 0.92 2.9 2.7 6.1 6.1 There are no naturally occuring sources of Chloride in soils. Some marine sedimentary rocks contain chloride but their presence needs to be determined following review of the local geology. Most common sources of chloride are wastewater discharge and road salts.
total kjeldahl nitrogen3 mg/L 0.103 0.21 0.09 0.105 0.183 0.16 0.23 0.225 Probable sources of organic nitrogen around Columbia Lake need to be identified
nitrate mg/L 0.0462 0.0461 0.0322 0.0322 <0.002 <0.002 <0.002 <0.002 <0.002orthophosphate4 mg/L <0.001 0.0019 0.0026 0.0019 0.0011 <0.001 0.0012 <0.001dissolved phosphorous mg/L 0.003 0.0042 0.0056 0.0039 0.0033 0.005 0.0058 0.0165 <0.002 to 0.007 values are noticeable greater than nearby
lakes total phosphorous mg/L 0.0033 0.0045 0.0086 0.005 0.0056 0.0185 0.0183 0.0175 0.004 to 0.038 values are noticeable greater than nearby
lakes
Aluminum ug/L 32.3 33.5 39.8 38.9 4.33 3.77 6.18 7.08 these concentrations are noticeable larger than those measured in Lake Windermere but much less than Moyie Lake for other lakes
antimony ug/L 0.024 0.021 0.037 0.031 0.049 0.054 0.073 0.068Arsenic ug/L 0.213 0.197 0.219 0.197 0.672 0.646 0.644 0.705Barium ug/L 6.21 6.06 6.57 6.45 77.9 78.5 74.3 75.2Cobalt ug/L 0.033 0.0358 0.0364 0.0374 0.015 0.014 0.027 0.0311Copper ug/L 0.646 0.551 0.71 0.643 0.172 0.158 0.259 0.164Iron ug/L 37.9 39.2 50.2 57.2 43.7 43.9 18.8 18.4Lead ug/L 0.0489 0.057 1.17 1.49 0.0311 0.0237 0.0481 0.0514Lithium ug/L <0.50 <0.05 <0.05 <0.05 3.62 3.69 3.07 3.23Manganese ug/L 2.31 2.32 2.98 3.12 5.1 5.17 6.25 6.66Molybdenum ug/L 0.094 0.09 0.081 0.097 0.581 0.603 0.514 0.519Nickel ug/L 0.144 0.155 0.162 0.161 0.093 0.093 0.138 0.104Strontium ug/L 17.9 17.7 17.7 16.6 373 353 217 214Uranium ug/L 0.0902 0.088 0.0806 0.0815 1.18 1.19 1 1Zinc ug/L 0.46 0.36 9.31 6.31 0.21 0.22 0.47 1.06
Notes 1
2
3
4 Orthophosphate is created by natural processes but major man influences sources include lawn fertilizers, partially treated
the concentrations of these metals in Columbia Lake are about the same as Lake Windermere but less than Moyie Lake and may be a consequence of the geology
information tabulated here was the range in concentration measured for 2016
Table2 - Comparison of selected water quality parameters to other lakes
Columbia Lake
Yellow highlights identify parameters that exceed those measured in other lakes either in part or entirely within the range of parameters measured
kjeldahl nitrogen is a measure of the organic nitrogen (including ammonia) and is often used as a parameter for monitoring waste water treatment plants
BC MOE
Lake Windermere Moyie Lake upper lower
20
• Bicarbonate because bicarbonate affects the ability of treatment systems to treat waters to drinking water standards and influences the impact of metals (e.g. aluminum on aquatic invertebrates – fish).
Dissolved sulphate, barium, and strontium are measured in the waters of Lake Windermere and Columbia Lake at concentrations much greater than those measured on Moyie Lake. Sulphate may come from the geologic materials that drain into the two lakes. Both barium and strontium are present in sulphide/sulphate bearing rocks.
We understand that the wall board plant near Mount Swansea on the east side of Lake Windermere may use sulphide/sulphate bearing rocks to make the wall board. There are also several mineral hot springs along Columbia Valley including the mineral hot springs at Fairmont that are sulphurous. Columbia Lake is upstream of Lake Windermere and before natural sources of sulphate are cited as the source of dissolved sulphate, barium and strontium, a review of the geologic setting of Columbia Lake should be undertaken. In many fresh water bodies, sulphate concentrations increases from season to season due to evaporation of surface water. Trends in sulphate concentrations from season to season need to be monitored to confirm that evaporation is not a possible reason for increased concentrations.
Of interest is that no detectable concentration for selenium are reported in any of the lakes. Selenium is an element also associated with sulphide/sulphate bearing minerals and coal. But selenium is an element that is of greater concern for protection of freshwater aquatic life than are barium and strontium. To protect freshwater aquatic life therefore it may be necessary to monitor the change in sulphate concentrations and, where substantial concentration increases occur, to begin monitoring concentrations of selenium.
Chloride does not come from natural sources (although it is a common constituent of marine sedimentary rocks, none are believed to be present on the mountains surrounding Columbia Lake). The most common source of chloride in fresh waters are waste water disposal and drainage of road salts along highways were salt is used to control dust or to gain traction on icy roads. The chloride concentration in Columbia Lake is much greater than in Lake Windermere or Moyie Lake. Although the concentrations measured are not at a level that impacts use of the lake water, the difference in concentration is notable.
Organic nitrogen (measured as total kjeldahl nitrogen TKN) is frequently used as an indicator that agricultural runoff or waste water is an influence on water quality. The information collected by BC MOE indicates that concentrations in Columbia Lake are greater than those measured in Lake Windermere or Moyie Lake. The source of the organic nitrogen cannot be determined with the information available.
The concentrations of orthophosphate and dissolved phosphorous are about the same as the other two lakes. However, the concentration of total phosphorous is greater than those measured in Lake Windermere or Moyie Lake respectively. All forms of phosphate may be attributed to natural processes in the lake but phosphorous is also a component of waste water and agricultural runoff. Monitoring of these parameters needs to be continued.
For many of the metals, Columbia Lake and Lake Windermere provide greater concentrations than those measured at comparable depths in Moyie Lake. This finding is currently attributed to the differences in geologic setting but trends in the concentrations need to be monitored. If the metals come from a mineral
21
source, the concentrations should remain constant over time – allowing for a small variation due to natural conditions.
The tables provided by BC MOE are inserted directly into Appendix C and have not been altered by CLSS for inclusion in the appendix. The data provided by BC MOE are entitled “Spring” sampling because the samples were collected in April of 2015. This title suggests to us that perhaps additional samples were collected at other times of the year and for more years than 2015. Inspection of the BC MOE files has not discovered any additional information but additional searching of the files will be undertaken to confirm this suggestion and to obtain any readily available information. CLSS has requested funding for a more extensive list of analyses at least once per year and perhaps this funding will not be required if such analyses are already in progress by BC MOE.
5.0 Continuous Improvements
The following suggestions/recommendations of changes to the water quality program are provided in keeping with the overall purpose of the CLSS.
1. Information Collection
Various government agencies have undertaken some testing of water quality of the East Kootenay Region including Columbia Lake. The readily available information has been compiled here in Section 4. We suggest that more information is available but inspection of files on the internet indicates that relevant information on the water quality of Columbia Lake is dated 1985. CLSS needs to work with BC’s government agencies to determine their plan for monitoring the lake. We note that the lake was monitored by BC MOE in April of 2015 in conjunction with Moyie Lake and Lake Windermere but cannot determine whether this is one event or an annual event.
2. Water Quality Objectives (WQO’s)
Various articles of advice on the procedures required to establish WQO’s are published on BC MOE’s files on the internet pages. Review and relevance of these documents (for example some of the guidance in these articles dates to the mid 1990’s) needs to be considered to justify the level of effort needed to set WQO’s.
WQO’s for Columbia Lake are needed that consider the geologic setting, background information collected to date and BC MOE’s published water quality guidelines (WQG’s) for use in management of drinking water, agricultural and recreational use and protection of freshwater aquatic life. Some elements like sulphate and the metals will be a consequence of erosion and drainage from the surrounding mountains and may require a greater WQO than that provided within BC MOE’s guidelines. Background information needs to be considered because the WQG’s set by BC are province wide guidelines and may be over or under protective of Columbia Lake.
22
As a preliminary set of objectives, it is recommended that the most stringent guidelines from BC’s WQG’s be tabulated and the rationale for their inclusion documented. When CLSS has collected sufficient information to allow upper limits of background concentrations to be defined, a site- specific or site-adapted set of WQO’s as permitted by BC and sensitive to the conditions at Columbia Lake will be established. (Typically, 5 to 8 sets of data are required for statistical values to be useful). Setting this site specific WQO’s should be an on-going activity for future reporting on water quality monitoring programs.
This work should be done before the water quality monitoring program begins in 2017. This set of WQO’s will be modified as background conditions of Columbia Lake are more solidly defined. While this work is underway information on the geologic setting (geomorphology and types of rock surrounding the lake) should be compiled. The geologic conditions along the lake should also be directed at defining where subsurface flows and outflow from the lake occur. Land use over these inflow areas will be a factor in determining the potential for changes in the lake’s water quality.
3. Analytical parameters
A broader list of analytical parameters should be undertaken at least twice per year. That list should include heavy and trace metals, common salts (calcium, magnesium, sodium, potassium, bicarbonate, sulphate and chloride and nutrients (nitrate, TKN, orthophosphate, total phosphorous and dissolved phosphorous). We note that BC’s most recent sampling of water in Columbia Lake (April of 2015) was at a time of year when the water quality of the lake (judging by the turbidity, conductance and phosphorous) are at the lowest concentrations and before persistent wave action and lake disturbance by recreational users begins. A second sampling for the extended list when these parameters concentrations have increased or after periods of busy activity on the lake would be helpful in determining the overall seasonal variation in the quality of lake water.
4. Control limits
Control limits should be set when sufficient water quality data is available to set statistical measures (mean and standard deviation). These calculated values lend scientific credibility to any subsequent contention by CLSS that the lake water is changing and that those changes are not due to natural variability in the measured parameters.
5. Additional Equipment
An oxygen meter should be purchased for use in the on the lake monitoring program. The wet chemical method currently used is difficult to accurately apply on a moving boat platform and is subject to misreading the colorimetric indicators.
23
6.0 Probable influences on water quality
There are five main findings from the 2016 water quality monitoring program.
1. CLSS is in the process of identifying seasonal changes and variations in water quality due to natural processes (baseline water quality). The evaluation of the lake’s water quality would benefit by establishing WQO. Turbidity measurement on the north end of the lake and south end of the lake suggest that these areas are more sensitive to surface disturbances and inflows of groundwater and surface water than elsewhere on the lake. We are concerned about turbidity because the material that causes the turbidity (sediments and organic debris) can limit the suitability of the lake water for drinking water and aquatic habitat.
2. Turbidity and conductivity are useful companion measurements because they provide different measures of the content of the lake water. Turbidity primarily measures the amount of suspended material (mineral and organic particulates) and conductivity the content of dissolved salt. The collected information shows (Figures 3 and 4) that in both 2015 and 2016 as the turbidity increases in the later portion of the year the conductivity of the water declines. This finding suggests that turbidity increases are created by disturbance of the lake (lifting of mineral sediments and organic particulates into the water) and growth of aquatic micro-organisms and not by increases in salt (as might be created by surface evaporation).
Further, Figure 7 indicates that, except for S4, generally the total and dissolved phosphorous concentrations remain relatively constant over the spring summer and into the early autumn. If we assume that the turbidity increase is due primarily to organic debris then the increase in turbidity can be attributed to drift of suspended organic material to the north end of the lake. In contrast, if it is assumed that the turbidity is due to inorganic sediments then the increase in turbidity can be attributed to lake disturbance – either waves, surface water inflow or recreational activity. The cause of the turbidity increases may become more evident as additional monitoring information is collected.
3. The information collected for S4, although in many ways incomplete, points to two probable sources of water entering the lake at its south end: groundwater inflow across the width of the south shore of the lake and surface water drainage from the southwest corner. The contribution of these sources to the lake needs to be confirmed. Developments on the south shore of the lake may create surface erosion of sediments that drain to the lake and will clog aquatic habitats. With more intensive land use, leaching of fertilizers from soils used for lawns, golf courses and parks infiltrates to the groundwater and directly affects the quality of the groundwater draining to the lake.
4. Dissolved oxygen profiles suggest that the lake is a healthy ecological system. From season to season and year to year losses of dissolved oxygen as the lake warms up may not be the best for fish in the lake. But these year to year variations are part of the natural processes occurring within the lake and should be expected.
24
5. Columbia Lake contains some elements (most noticeably chloride) that do not typically occur naturally in the rocks and soils surrounding the lake. Although well less than the concentration that makes the lake water unsafe for other uses (usually 230 m/L is the limit for chloride in drinking water), the chloride concentration is noticeably greater than other lakes and needs to be monitored carefully. However, this finding is based on only one analytical result and needs to be confirmed with additional water quality testing.
25
Appendix A
Monitoring parameters and their application to understanding water quality changes
26
27
28
Appendix B Spreadsheet of Collected Water Quality Information
Location
Date
Time (MDT)
Time Excel Format
Wave Conditions
Air Temp (Deg C)
Wind
Direction
Wind Speed (km/hr)
Sky Cover
(Percent)
Water Temp
Surface (Deg/C)
Water Temp
Bottom (Deg/C)
Lake
Depth (m)
Secchi
Depth (m)
Conductvity Sfc(uS/cm)
Conductivity Bottom (uS/cm)
ph Dissolved Oxygen (mg/L)
Turbidity
(NTU)
Total Phosphorous
(mg/L)
Dissolved Phosphorous
(mg/L)
Nitrogen (mg/L)
Sample - Columbia N1
June 3/14
11:30
6/3/14 11:30 AM
Slightly wavy
18
S
5
80
16.6
16.6
2.35
2.35
222.0
218.6
8.3
7
1.60
0.009
<0.01
Columbia N1
April 9/15
10:40
9/4/2015 10:40
calm
9
0
0
8.1
8.1
1.60
1.60
224.8
227.0
8.7 11.3/11.3
1.13
S1
13:00 calm
9
0
0
8.7
8.0
4.60
4.60
236.8
230.1
8.6 10.5/10.7
1.07
S3
14:15 calm
10
0
0
8.9
8.2
3.9
3.9
247.8
253.6
8.6 11.6/12.3
0.67
S4
15:15 calm
11
0
0
9.6
8.7
1.4
1.4
245.2
259.5
8.6 10.3/10.5
0.66
Columbia N1
April 12/15
13:00
0.005 <0.01
S1
13:15 0.006
<0.01
S3
13:30 0.006
<0.01
S4
14:00 0.006
<0.01
Columbia N1
May 14/15
14:00
5/14/15
ripples
18
5
95
14.6
13.6
1.7
1.7
250
236
8.7 9.4/9.8
1.2
S1
13:07 calm
17
0
75
14.8
13.8
4.60
4.60
276.5
265.7
8.6 8.7/9.1
0.83
S3
13:46 calm
18
0
60
15.6
14.5
3.80
3.80
289.0
275.0
8.5 11.4/11.5
0.64
S4
12:46 calm
16
0
30
14.8
14.5
1.50
1.50
286.0
285.0
8.5 10.9/11.2
1.25
Columbia N1
june 6/15
17:20
ripples
28
10
10
17.7
16
2.60
2.6
217.0
200.0
8.8 10.8/13.0
2.04
S1
17:50 chop
27
11
10
18.6
17.1
5.40
5.20
249.0
244.0
8.7 10.1/11.8
1.11
S3
18:40 ripples
24
14
10
19.4
18.7
4.50
4.50
295.0
291.0
8.6 10.9/11.4
0.74
Columbia N1
June 14/15
14:35
chop
24 12
60
18.7
18.7
2.50
2.50
228.0
228.0
8.6
9.5/9.7
0.81
0.011
<0.01
S1
15:00 chop
24
15
50
18.7
18.3 too wavy
too wavy
246.0
245
8.7
8.9/9.3
1.21
0.005
<0.01
S3
15:36 white caps
25
20
40
19.6
19.3 too wavy
too wavy
294
287
8.7
8.7/9.1
0.83
0.005
<0.01
S1
June 25/15
12:30 ripples
27
5
10
20.5
19.7
5.2
5.2
263
255
8.6 9.6/10.3
0.62
Location
Date
Time (MDT)
Time Excel Format
Wave Conditions
Air Temp (Deg C)
Wind
Direction
Wind Speed (km/hr)
Sky Cover
(Percent)
Water Temp
Surface (Deg/C)
Water Temp
Bottom (Deg/C)
Lake
Depth (m)
Secchi
Depth (m)
Conductvity Sfc(uS/cm)
Conductivity Bottom (uS/cm)
ph Dissolved Oxygen (mg/L)
Turbidity
(NTU)
Total Phosphorous
(mg/L)
Dissolved Phosphorous
(mg/L)
Nitrogen (mg/L)
N1
July 6/15
10:45
white caps
18 SE
22
90
22.0
22.2
too wavy
too wavy
254.0
255.0
8.5
7.4/7.4
0.77
S1
10:27 white caps
18
SE
18
90
22.6
22.5
too wavy
too wavy
269.0
269.4
8.7
7.5/7.7
0.79
S3
9:55 white caps
18
SE
16
80
22.1
22.1
too wavy
too wavy
304.0
304.2
8.6
7.8/7.8
1.40
N1
July 13/15
10:05
calm
20
SW
6
70
22.3
22.2
2.00
2
250.2
250.7
9.0
7.5/7.8
1.32
S1
10:20 calm
21
S/SW
4
70
22.5
22.4
5.00
5.00
260.4
260.4
8.8
7.4/7.6
0.98
S3
10:50 calm
22
0
80
22.8
22.4
4.00
4.00
314.0
308.7
8.7 8.1/8.6
1.03
N1
Jul-27
10:10 ripples
12
NW
4
100
18.0
17.9
2.00
2.00
240.5
242.2
8.8
7.8/7.85
1.28
0.008
<0.01
S1
10:32 chop
15
NW
8
90
18.5
18.5
4.5
4.5
242.5
243
8.7
8.1/8.3
1.19
0.008
<0.01
S3
10:50 white caps
13
NW
11
90
18.2
18.3
too wavy
too wavy
295
290
8.7
8.2/8.6
1.2
0.007
<0.01
N1
Aug-09
20:00 TF
choppy
24
S
50
21.4
21.2
1.8
1.8
254
255
8.8 9.1/9.3
2.03
S1
20:20 small chop
23
SE
50
20.4
20.4
4.75
3.00
260.0
261.0
8.7 8.0/8.1
1.30
S2
20:40 choppy
21
SE
50
20.5
20.4
3.80
3.80
279.0
279.0
8.8 8.2/8.3
0.71
N1
Aug-22
13:30 GG
choppy
20
S
10
25
18.5
18.7
1.80
1.80
250.3
249.0
8.6
10.0/9.7
1.04
S1
13:45 choppy
20
s
10
15
19.3
19.0
4.90
3.40
262.1
261.8
8.3
9.0/9.2
1.47
S3
14:00 choppy
20
S
10
25
18.8
18.8
3.8
3.3
279.3
281.6
8.9
9.4/9.3
1.01
S1
Aug-23
15:11 TF
Choppy
20
S
15
15
19.3
19.2
4.5
?
237
257
8.7
8.5/8.9
1.56
S4
17:11 ripples
27
S
13
10
17.9
17.8
1.5
1.5
280.1
279.8
8.6
9.3/9.4
1.62
S3
Aug-29
14:30 GG
calm
12
SE
14
90
12.6
13
3.6
3.6
234
250.8
8.1
9.2/9.2
0.67
S1
14:57 ripples
12
SE
14
95
13.1
12.8
4.40
3.60
230.9
231.0
8.5
8.4/8.7
0.96
N1
15:20 calm
12
SE
14
97
13.1
13.0
1.56
1.56
232.1
230.9
8.5
9.4/9.3
0.90
Location
Date
Time (MDT)
Time Excel Format
Wave Conditions
Air Temp (Deg C)
Wind
Direction
Wind Speed (km/hr)
Sky Cover
(Percent)
Water Temp
Surface (Deg/C)
Water Temp
Bottom (Deg/C)
Lake
Depth (m)
Secchi
Depth (m)
Conductvity Sfc(uS/cm)
Conductivity Bottom (uS/cm)
ph Dissolved Oxygen (mg/L)
Turbidity
(NTU)
Total Phosphorous
(mg/L)
Dissolved Phosphorous
(mg/L)
Nitrogen (mg/L)
N1
Sep-22
9:20 TF
ripples
4
NE
3
0
12.4
12.4
1.70
1.70
2285.0
228.9
8.6
9.6/9.7
1.55
0.002
<0.01
S1
10:50 chop
10
N
10
0
12.8
12.8
4.60
4.20
231.5
231.3
8.7
9.3/9.5
1.46
0.014
<0.01
S3
1:55 calm
14
0
13.5
12.8
3.70
3.70
248.0
249.6
8.6 9.3/9.8
1.21
0.016
<0.01
S4
3:30 chop
18
S
10
5
13.5
13.5
1.50
1.50
250.2
250.6
8.7
9.9/10.0
1.22
0.015
<0.01
N1
Oct-13
4:01 chop
16
S
0
11.3
11.3
1.78
1.78
226.0
226.0
8.3 9.7/9.0
1.44
0.015
<0.01
S1
3:32 calm
16
S
5
12.9
12.2
4.60
3.60
234.3
235.0
8.3 9.5/9.2
1.32
0.008
<0.01
S3
3:15 chop
16
S
5
11.9
12.0
3.66
3.66
243.8
243.7
8.4 9.5/9.6
0.71
0.016
<0.01
S4
2:30 chop
16
S
0
11.1
11.2
1.50
1.50
238.8
238.8
8.6 10.1/9.3
0.97
0.007
<0.01
N1
20-Mar-16
4:30 choppy
9
S
5
100
5.8
5.8
1.60
1.60
223.8
223.8
8.4
13.4/13
1.16
0.024
<0.01
S1
3:30
choppy
9
S
10
70
5.1
5.1
too wavy
too wavy
216.3
216.3
8.3
13.6/13.1
1.01
0.026
<0.01
S3
6:30
calm
8
0
100
5.1
5.0
3.70
3.70
221.0
221.0
8.4
13.2/13.2
0.78
0.027
<0.01
S4
5:45
ripples
8
S
3
100
5.2
5.1
1.35
1.35
221.0
221.0
8.4
13.6/13.5
0.98
0.024
<0.01
N1
3-Apr-16
3:30
calm
20
0
30
10.9
10.5
1.60
1.60
256.0
243.0
8.4
11.9/10.8
1.00
S1
2:00
calm
22
0
30
9.6
9.0
4.35
4.35
252.0
251.0
8.4
11.8/11.8
0.84
S3
4:38
chop
20
N
10
40
11.3
11.5
3.60
3.60
250.0
252.0
8.4
10.9/10.1
0.72
S4
4:38
ripples
22
N
5
40
12.6
12.5
1.35
1.35
273.0
273.0
8.4
10.6/10.7
0.85
N1
13-Apr-16
12:20
chop
11
N
15
80
11.6
11.6
too wavy
too wavy
261.0
261.0
8.4
10.3/10.4
1.12
S1
6:43
ripples
10
N
10
70
11.4
11.4
4.60
3.60
258.0
259.0
8.4
10.8/10.7
1.34
S3
12:20
chop
11
N
15
80
11.6
11.6
too wavy
too wavy
263.0
263.0
8.5
10.1/10.1
1.28
S4
Location
Date
Time (MDT)
Time Excel Format
Wave Conditions
Air Temp (Deg C)
Wind
Direction
Wind Speed (km/hr)
Sky Cover
(Percent)
Water Temp
Surface (Deg/C)
Water Temp
Bottom (Deg/C)
Lake
Depth (m)
Secchi
Depth (m)
Conductvity Sfc(uS/cm)
Conductivity Bottom (uS/cm)
ph Dissolved Oxygen (mg/L)
Turbidity
(NTU)
Total Phosphorous
(mg/L)
Dissolved Phosphorous
(mg/L)
Nitrogen (mg/L)
N1
25-Apr-16
10:30
ripples
14
S
5
20
14.0
14.3
too wavy
too wavy
276.0
275.0
8.3
8.9/16.9
2.74
0.011
<0.01
S1
11:00
white caps
14
S
20
30
14.5
14.5
too wavy
too wavy
272.0
280.0
8.2
10.6/9.8
1.33
0.010
<0.01
S3
11:45
choppy
14
S
25
30
14.4
14.4
too wavy
too wavy
284.0
284.0
8.3
10.4/9.9
1.05
0.011
<0.01
S4
N1
14-May-16
S1
S3
11:45
calm
11
0
5
15.2
14.9
3.95
3.95
231.2
230
8.4
10
1.12
S4
10:30
calm
11
0
5
14.4
13.8
1.86
1.86
230.6
233
8.4
11
1.19
N1
25-May-16
S1 - shallow
25-May-16
8:07 PM
calm
19
0
70
16.5
3.8
5.3
289
8.4
8
0.98
0.010
0.003
S1- deep
8:07 PM
calm
19
0
15.7
287
0.016
0.004
S3
25-May-16
6:45 PM
light chop
19
south
5 to 10 knt
80
16.8
16.5
3.6
4.1
267
257
9
1.1
0.006
S4
25-May-16
N1
15-Jun-16
S1
15-Jun-16
S3
15-Jun-16
9:30
White caps
10
from South
30?
80
14.9
15
4.05
na
280.5
280.7
8.4
4
na
S4
15-Jun-16
N1
26-Jun-16
12:48
ripples
24
from north
5
20
17.1
16.7
1.4
1.4
256.4
252.4
8.6
10
0.95
S1 - shallow
26-Jun-16
12:02
ripples
22
from north
5
20
16.8
5.09
5.09
253.6
8.5
10
0.71
0.011
0.007
S1- deep
16.2
252.5
0.038
0.003
Location
Date
Time (MDT)
Time Excel Format
Wave Conditions
Air Temp (Deg C)
Wind
Direction
Wind Speed (km/hr)
Sky Cover
(Percent)
Water Temp
Surface (Deg/C)
Water Temp
Bottom (Deg/C)
Lake
Depth (m)
Secchi
Depth (m)
Conductvity Sfc(uS/cm)
Conductivity Bottom (uS/cm)
ph Dissolved Oxygen (mg/L)
Turbidity
(NTU)
Total Phosphorous
(mg/L)
Dissolved Phosphorous
(mg/L)
Nitrogen (mg/L)
S3
26-Jun-16
11:14
Flat
23
Calm
0
10
17.6
16.3
4.1
4.1
286.6
279.3
8.5
10
0.71
0.009
<0.002
S4
26-Jun-16
10:44
Flat
18
Calm
0
10
17
16.2
1.84
1.84
294
288
8.6
8
0.91
0.004
<0.002
N1
23-Jul-16
10:50
light chop
18
south
0
70
19.3
19.2
1.9
269
269
8.4
8
0.91
S1 - shallow
23-Jul-16
8:51
light chop
16
south
40
19.6
4.7
279.4
8.4
9
1.29
0.007
0.007
S1- deep
23-Jul-06
8:51
19.4
278.2
8.4
0.008
0.007
S3
23-Jul-16
11:10
choppy
18
south
19.7
19.7
296
296
8.4
9
0.8
S4
N1
14-Aug-16
1:00 PM
almost calm
north to south
5k
10
22.3
21.7
1.8
1.8
273.9
275.7
9.7
1.07
S1 - shallow
14-Aug-16
ripple
north to south
5k
10
21.3
20.8
4.7
4
287.7
283.1
9.5
19
1.07
S1- deep
14-Aug-16
ripple
north to south
5k
10
21.3
20.8
4.7
4
287.7
283.1
9.5
S3
14-Aug-16
ripple
north to south
5k
10
21.6
21
4.3
4.1
304
337
10
14
1.18
S4
14-Aug-16
N1
4-Sep-16
12:30
ripple
15
sw
5
40
16.3
16.2
1.58
255.4
255
8.6
8
1.2
S1 - shallow
4-Sep-16
12:30
small chop
18
sw
5
50
16.9
16.6
4.68
3.82
263.2
263.8
8.8
7
1.32
S1- deep
4-Sep-16
12:30
S3
4-Sep-16
12:30
ripple
sw
5
50
16
16.1
3.48
3.48
274.6
319.9
8.3
8
93
S4
4-Sep-16
N1
2-Oct-16
18:50
ripple
n
5
5
13.3
13.3
1.65
1.65
251
250
8.3
7
0.015
0.009
S1 - shallow
2-Oct-16
17:38
ripple
ne
5
20
13.3
13.3
4.6
4.2
249
250
8.4
8
0.013
0.004
S1- deep 2-Oct-16
Location Date Time (MDT) Time Excel Format Wave Conditions Air Temp (Deg C)
Wind Direction
Wind Speed (km/hr)
Sky Cover
(Percent)
Water Temp
Surface (Deg/C)
Water Temp
Bottom (Deg/C)
Lake Depth (m)
Secchi Depth (m)
Conductvity Sfc(uS/cm)
Conductivity Bottom (uS/cm)
ph Dissolved Oxygen (mg/L)
Turbidity (NTU)
Total Phosphorous
(mg/L)
Dissolved Phosphorous
(mg/L)
Nitrogen (mg/L)
S3 2-Oct-16
S4 2-Oct-16 5:30 chop w 10 90 11 11 260 260 8.4 9 1.93 0.013 0.1
Appendix C
Water Quality Information for Columbia Lake, Lake Windermere and Moyie Lake
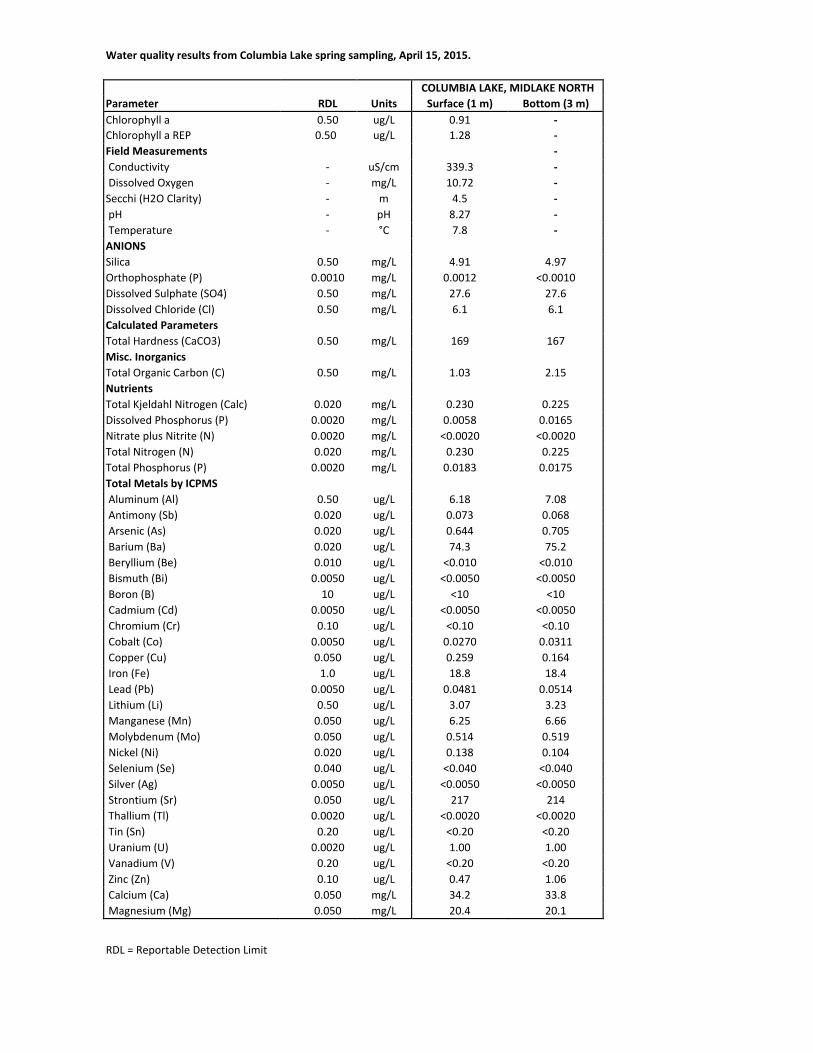
Water quality results from Columbia Lake spring sampling, April 15, 2015.
COLUMBIA LAKE, MIDLAKE NORTH Parameter RDL Units Surface (1 m) Bottom (3 m) Chlorophyll a 0.50 ug/L 0.91 - Chlorophyll a REP 0.50 ug/L 1.28 - Field Measurements - Conductivity - uS/cm 339.3 - Dissolved Oxygen - mg/L 10.72 -
Secchi (H2O Clarity) - m 4.5 - pH - pH 8.27 - Temperature - °C 7.8 -
ANIONS Silica 0.50 mg/L 4.91 4.97 Orthophosphate (P) 0.0010 mg/L 0.0012 <0.0010 Dissolved Sulphate (SO4) 0.50 mg/L 27.6 27.6 Dissolved Chloride (Cl) 0.50 mg/L 6.1 6.1 Calculated Parameters Total Hardness (CaCO3) 0.50 mg/L 169 167 Misc. Inorganics Total Organic Carbon (C) 0.50 mg/L 1.03 2.15 Nutrients Total Kjeldahl Nitrogen (Calc) 0.020 mg/L 0.230 0.225 Dissolved Phosphorus (P) 0.0020 mg/L 0.0058 0.0165 Nitrate plus Nitrite (N) 0.0020 mg/L <0.0020 <0.0020 Total Nitrogen (N) 0.020 mg/L 0.230 0.225 Total Phosphorus (P) 0.0020 mg/L 0.0183 0.0175 Total Metals by ICPMS Aluminum (Al) 0.50 ug/L 6.18 7.08 Antimony (Sb) 0.020 ug/L 0.073 0.068 Arsenic (As) 0.020 ug/L 0.644 0.705 Barium (Ba) 0.020 ug/L 74.3 75.2 Beryllium (Be) 0.010 ug/L <0.010 <0.010 Bismuth (Bi) 0.0050 ug/L <0.0050 <0.0050 Boron (B) 10 ug/L <10 <10 Cadmium (Cd) 0.0050 ug/L <0.0050 <0.0050 Chromium (Cr) 0.10 ug/L <0.10 <0.10 Cobalt (Co) 0.0050 ug/L 0.0270 0.0311 Copper (Cu) 0.050 ug/L 0.259 0.164 Iron (Fe) 1.0 ug/L 18.8 18.4 Lead (Pb) 0.0050 ug/L 0.0481 0.0514 Lithium (Li) 0.50 ug/L 3.07 3.23 Manganese (Mn) 0.050 ug/L 6.25 6.66 Molybdenum (Mo) 0.050 ug/L 0.514 0.519 Nickel (Ni) 0.020 ug/L 0.138 0.104 Selenium (Se) 0.040 ug/L <0.040 <0.040 Silver (Ag) 0.0050 ug/L <0.0050 <0.0050 Strontium (Sr) 0.050 ug/L 217 214 Thallium (Tl) 0.0020 ug/L <0.0020 <0.0020 Tin (Sn) 0.20 ug/L <0.20 <0.20 Uranium (U) 0.0020 ug/L 1.00 1.00 Vanadium (V) 0.20 ug/L <0.20 <0.20 Zinc (Zn) 0.10 ug/L 0.47 1.06 Calcium (Ca) 0.050 mg/L 34.2 33.8 Magnesium (Mg) 0.050 mg/L 20.4 20.1
RDL = Reportable Detection Limit
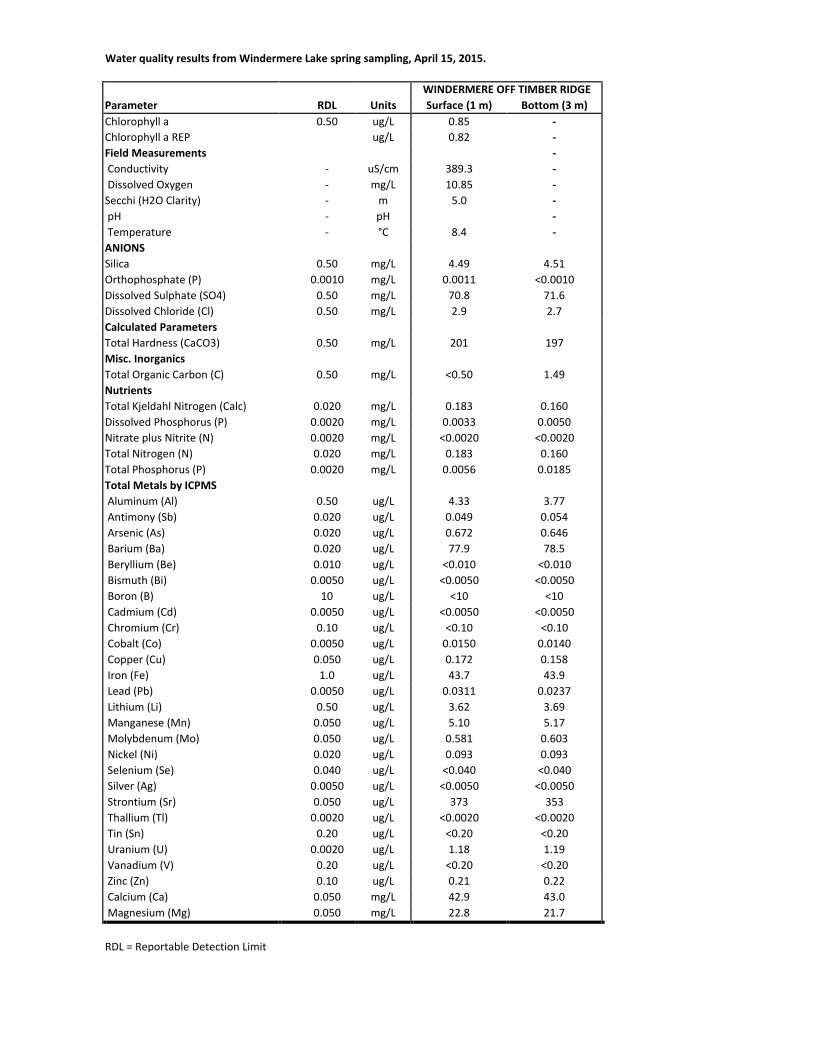
Water quality results from Windermere Lake spring sampling, April 15, 2015.
WINDERMERE OFF TIMBER RIDGE Parameter RDL Units Surface (1 m) Bottom (3 m) Chlorophyll a 0.50 ug/L 0.85 - Chlorophyll a REP ug/L 0.82 - Field Measurements - Conductivity - uS/cm 389.3 - Dissolved Oxygen - mg/L 10.85 -
Secchi (H2O Clarity) - m 5.0 - pH - pH - Temperature - °C 8.4 -
ANIONS Silica 0.50 mg/L 4.49 4.51 Orthophosphate (P) 0.0010 mg/L 0.0011 <0.0010 Dissolved Sulphate (SO4) 0.50 mg/L 70.8 71.6 Dissolved Chloride (Cl) 0.50 mg/L 2.9 2.7 Calculated Parameters Total Hardness (CaCO3) 0.50 mg/L 201 197 Misc. Inorganics Total Organic Carbon (C) 0.50 mg/L <0.50 1.49 Nutrients Total Kjeldahl Nitrogen (Calc) 0.020 mg/L 0.183 0.160 Dissolved Phosphorus (P) 0.0020 mg/L 0.0033 0.0050 Nitrate plus Nitrite (N) 0.0020 mg/L <0.0020 <0.0020 Total Nitrogen (N) 0.020 mg/L 0.183 0.160 Total Phosphorus (P) 0.0020 mg/L 0.0056 0.0185 Total Metals by ICPMS Aluminum (Al) 0.50 ug/L 4.33 3.77 Antimony (Sb) 0.020 ug/L 0.049 0.054 Arsenic (As) 0.020 ug/L 0.672 0.646 Barium (Ba) 0.020 ug/L 77.9 78.5 Beryllium (Be) 0.010 ug/L <0.010 <0.010 Bismuth (Bi) 0.0050 ug/L <0.0050 <0.0050 Boron (B) 10 ug/L <10 <10 Cadmium (Cd) 0.0050 ug/L <0.0050 <0.0050 Chromium (Cr) 0.10 ug/L <0.10 <0.10 Cobalt (Co) 0.0050 ug/L 0.0150 0.0140 Copper (Cu) 0.050 ug/L 0.172 0.158 Iron (Fe) 1.0 ug/L 43.7 43.9 Lead (Pb) 0.0050 ug/L 0.0311 0.0237 Lithium (Li) 0.50 ug/L 3.62 3.69 Manganese (Mn) 0.050 ug/L 5.10 5.17 Molybdenum (Mo) 0.050 ug/L 0.581 0.603 Nickel (Ni) 0.020 ug/L 0.093 0.093 Selenium (Se) 0.040 ug/L <0.040 <0.040 Silver (Ag) 0.0050 ug/L <0.0050 <0.0050 Strontium (Sr) 0.050 ug/L 373 353 Thallium (Tl) 0.0020 ug/L <0.0020 <0.0020 Tin (Sn) 0.20 ug/L <0.20 <0.20 Uranium (U) 0.0020 ug/L 1.18 1.19 Vanadium (V) 0.20 ug/L <0.20 <0.20 Zinc (Zn) 0.10 ug/L 0.21 0.22 Calcium (Ca) 0.050 mg/L 42.9 43.0 Magnesium (Mg) 0.050 mg/L 22.8 21.7
RDL = Reportable Detection Limit
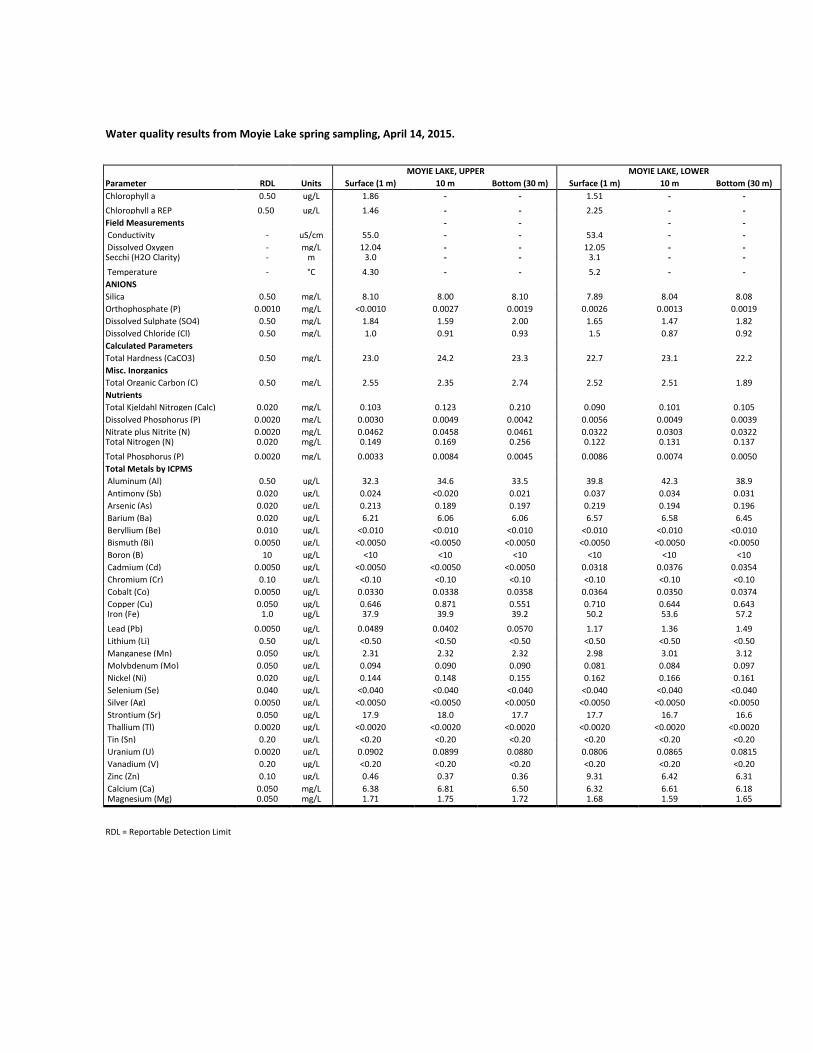
Water quality results from Moyie Lake spring sampling, April 14, 2015.
MOYIE LAKE, UPPER MOYIE LAKE, LOWER Parameter RDL Units Surface (1 m) 10 m Bottom (30 m) Surface (1 m) 10 m Bottom (30 m) Chlorophyll a 0.50 ug/L 1.86 - - 1.51 - - Chlorophyll a REP 0.50 ug/L 1.46 - - 2.25 - - Field Measurements - - - - Conductivity - uS/cm 55.0 - - 53.4 - - Dissolved Oxygen - mg/L 12.04 - - 12.05 - - Secchi (H2O Clarity) - m 3.0 - - 3.1 - -
Temperature - °C 4.30 - - 5.2 - - ANIONS Silica 0.50 mg/L 8.10 8.00 8.10 7.89 8.04 8.08 Orthophosphate (P) 0.0010 mg/L <0.0010 0.0027 0.0019 0.0026 0.0013 0.0019 Dissolved Sulphate (SO4) 0.50 mg/L 1.84 1.59 2.00 1.65 1.47 1.82 Dissolved Chloride (Cl) 0.50 mg/L 1.0 0.91 0.93 1.5 0.87 0.92 Calculated Parameters Total Hardness (CaCO3) 0.50 mg/L 23.0 24.2 23.3 22.7 23.1 22.2 Misc. Inorganics Total Organic Carbon (C) 0.50 mg/L 2.55 2.35 2.74 2.52 2.51 1.89 Nutrients Total Kjeldahl Nitrogen (Calc) 0.020 mg/L 0.103 0.123 0.210 0.090 0.101 0.105 Dissolved Phosphorus (P) 0.0020 mg/L 0.0030 0.0049 0.0042 0.0056 0.0049 0.0039 Nitrate plus Nitrite (N) 0.0020 mg/L 0.0462 0.0458 0.0461 0.0322 0.0303 0.0322 Total Nitrogen (N) 0.020 mg/L 0.149 0.169 0.256 0.122 0.131 0.137 Total Phosphorus (P) 0.0020 mg/L 0.0033 0.0084 0.0045 0.0086 0.0074 0.0050 Total Metals by ICPMS Aluminum (Al) 0.50 ug/L 32.3 34.6 33.5 39.8 42.3 38.9 Antimony (Sb) 0.020 ug/L 0.024 <0.020 0.021 0.037 0.034 0.031 Arsenic (As) 0.020 ug/L 0.213 0.189 0.197 0.219 0.194 0.196 Barium (Ba) 0.020 ug/L 6.21 6.06 6.06 6.57 6.58 6.45 Beryllium (Be) 0.010 ug/L <0.010 <0.010 <0.010 <0.010 <0.010 <0.010 Bismuth (Bi) 0.0050 ug/L <0.0050 <0.0050 <0.0050 <0.0050 <0.0050 <0.0050 Boron (B) 10 ug/L <10 <10 <10 <10 <10 <10 Cadmium (Cd) 0.0050 ug/L <0.0050 <0.0050 <0.0050 0.0318 0.0376 0.0354 Chromium (Cr) 0.10 ug/L <0.10 <0.10 <0.10 <0.10 <0.10 <0.10 Cobalt (Co) 0.0050 ug/L 0.0330 0.0338 0.0358 0.0364 0.0350 0.0374 Copper (Cu) 0.050 ug/L 0.646 0.871 0.551 0.710 0.644 0.643 Iron (Fe) 1.0 ug/L 37.9 39.9 39.2 50.2 53.6 57.2 Lead (Pb) 0.0050 ug/L 0.0489 0.0402 0.0570 1.17 1.36 1.49 Lithium (Li) 0.50 ug/L <0.50 <0.50 <0.50 <0.50 <0.50 <0.50 Manganese (Mn) 0.050 ug/L 2.31 2.32 2.32 2.98 3.01 3.12 Molybdenum (Mo) 0.050 ug/L 0.094 0.090 0.090 0.081 0.084 0.097 Nickel (Ni) 0.020 ug/L 0.144 0.148 0.155 0.162 0.166 0.161 Selenium (Se) 0.040 ug/L <0.040 <0.040 <0.040 <0.040 <0.040 <0.040 Silver (Ag) 0.0050 ug/L <0.0050 <0.0050 <0.0050 <0.0050 <0.0050 <0.0050 Strontium (Sr) 0.050 ug/L 17.9 18.0 17.7 17.7 16.7 16.6 Thallium (Tl) 0.0020 ug/L <0.0020 <0.0020 <0.0020 <0.0020 <0.0020 <0.0020 Tin (Sn) 0.20 ug/L <0.20 <0.20 <0.20 <0.20 <0.20 <0.20 Uranium (U) 0.0020 ug/L 0.0902 0.0899 0.0880 0.0806 0.0865 0.0815 Vanadium (V) 0.20 ug/L <0.20 <0.20 <0.20 <0.20 <0.20 <0.20 Zinc (Zn) 0.10 ug/L 0.46 0.37 0.36 9.31 6.42 6.31 Calcium (Ca) 0.050 mg/L 6.38 6.81 6.50 6.32 6.61 6.18 Magnesium (Mg) 0.050 mg/L 1.71 1.75 1.72 1.68 1.59 1.65
RDL = Reportable Detection Limit