Embed Size (px)
Citation preview

GARTNER CONSULTING
CONFIDENTIAL AND PROPRIETARY
This presentation, including any supporting materials, is owned by Gartner, Inc. and/or its affiliates and is for
the sole use of the intended Gartner audience or other intended recipients. This presentation may contain
information that is confidential, proprietary or otherwise legally protected, and it may not be further copied,
distributed or publicly displayed without the express written permission of Gartner, Inc. or its affiliates.
© 2016 Gartner, Inc. and/or its affiliates. All rights reserved.
Prepared for: XYZ Company
Executive Programs & IT Key Metrics Data
Executive Assessment
May 2016
Version #1

CONFIDENTIAL AND PROPRIETARY
EP ITKMD Executive Assessment | © 2016 Gartner, Inc. and/or its affiliates. All rights reserved. 1
Content
Assessment Overview & Description of Comparison Groups
Key Data Input
IT Spending Metrics Comparison
IT Spending as a percent of Total Revenues
IT Spending as a percent of Operating Expenses
IT Spending per Company Employee
Capital vs. Operational IT Spending
IT Spending Distribution (HW, SW, Personnel, Outsourcing)
IT Spending Distribution (Run, Grow, Transform)
IT Cost Distribution by IT Functional Area
IT Staffing Metrics Comparison
IT Employees as a percent of Company Employees
In House vs. Contract IT Employees
IT Staffing Distribution by IT Functional Area
IT Security Metrics Comparison
IT Outsourcing Metrics Comparison
Applications Metrics Comparison
CONFIDENTIAL AND PROPRIETARY
EP ITKMD Executive Assessment | © 2016 Gartner, Inc. and/or its affiliates. All rights reserved. 2
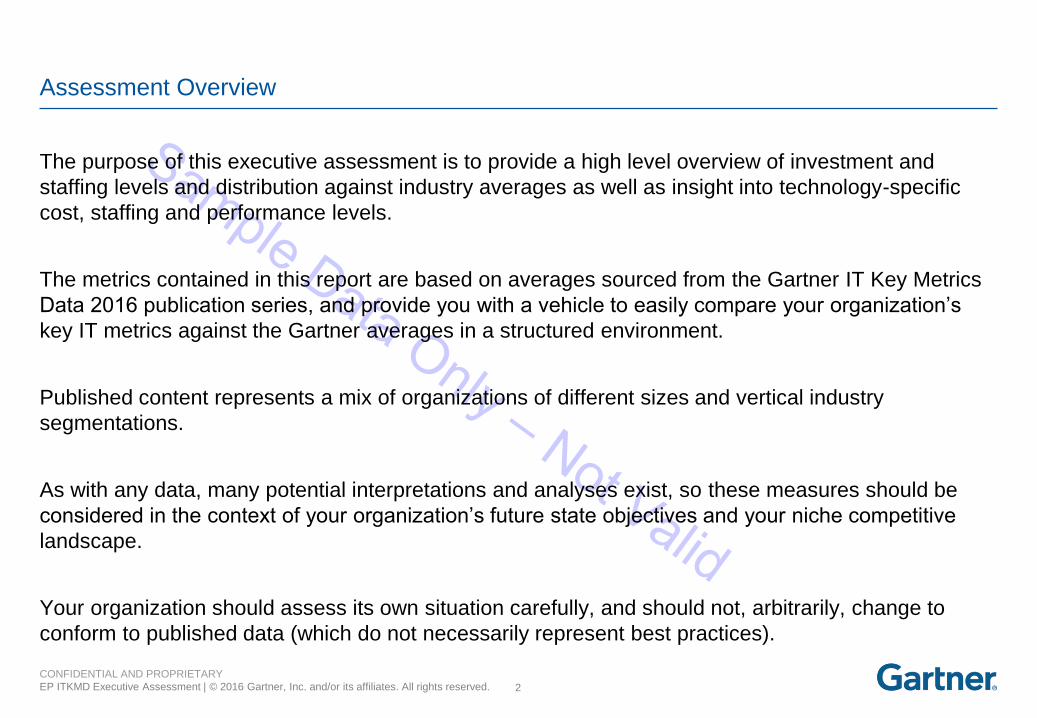
Assessment Overview
The purpose of this executive assessment is to provide a high level overview of investment and
staffing levels and distribution against industry averages as well as insight into technology-specific
cost, staffing and performance levels.
The metrics contained in this report are based on averages sourced from the Gartner IT Key Metrics
Data 2016 publication series, and provide you with a vehicle to easily compare your organization’s
key IT metrics against the Gartner averages in a structured environment.
Published content represents a mix of organizations of different sizes and vertical industry
segmentations.
As with any data, many potential interpretations and analyses exist, so these measures should be
considered in the context of your organization’s future state objectives and your niche competitive
landscape.
Your organization should assess its own situation carefully, and should not, arbitrarily, change to
conform to published data (which do not necessarily represent best practices).

CONFIDENTIAL AND PROPRIETARY
EP ITKMD Executive Assessment | © 2016 Gartner, Inc. and/or its affiliates. All rights reserved. 3
Description of Comparison Groups
Industry analysis:
For measures by industry this analysis explores an organization’s total IT capital and operational
(excluding depreciation and amortization) spending and staffing levels. Your organization has been
compared to organizations within your industry sector.
Non-industry analysis:
For the Security Metrics Comparison, Outsourcing Metrics Comparison and Applications Metrics
Comparison sections your organization has been compared to the full database for each of the IT
functional areas analyzed.

4
CONFIDENTIAL AND PROPRIETARY
EP ITKMD Executive Assessment | © 2016 Gartner, Inc. and/or its affiliates. All rights reserved.
Industry Comparison Analysis

CONFIDENTIAL AND PROPRIETARY
EP ITKMD Executive Assessment | © 2016 Gartner, Inc. and/or its affiliates. All rights reserved. 5
IT Spending as percent of Total Revenues
= Range = Industry Average = Middle Quartiles = XYZ Company
Source: Gartner Benchmark Analytics - IT Key Metrics Data
3.7%
4.6%
0%
5%
10%
15%
20%
25%

CONFIDENTIAL AND PROPRIETARY
EP ITKMD Executive Assessment | © 2016 Gartner, Inc. and/or its affiliates. All rights reserved. 6
IT Spending as percent of Operating Expenses
= Range = Industry Average = Middle Quartiles = XYZ Company
Source: Gartner Benchmark Analytics - IT Key Metrics Data
5.1%
8.2%
0%
5%
10%
15%
20%
25%

CONFIDENTIAL AND PROPRIETARY
EP ITKMD Executive Assessment | © 2016 Gartner, Inc. and/or its affiliates. All rights reserved. 7
IT Spending per Company Employee
= Range = Industry Average = Middle Quartiles = XYZ Company
Source: Gartner Benchmark Analytics - IT Key Metrics Data
$12,000
$8,000
$0
$5,000
$10,000
$15,000
$20,000
$25,000
$30,000
$35,000
$40,000

CONFIDENTIAL AND PROPRIETARY
EP ITKMD Executive Assessment | © 2016 Gartner, Inc. and/or its affiliates. All rights reserved. 8
IT Spending Distribution
Capital & Operational Spending
Source: Gartner Benchmark Analytics - IT Key Metrics Data
70%
65%
30%
35%
0% 20% 40% 60% 80% 100%
Industry Average
XYZ Company
Operational
Capital

CONFIDENTIAL AND PROPRIETARY
EP ITKMD Executive Assessment | © 2016 Gartner, Inc. and/or its affiliates. All rights reserved. 9
IT Spending Distribution
Hardware, Software, Personnel, Outsourcing
Source: Gartner Benchmark Analytics - IT Key Metrics Data
0% 20% 40% 60% 80% 100%
Industry Average
XYZ Company
Industry Average XYZ Company
Hardware 15% 20%
Software 25% 20%
Personnel (includingOccupancy)
40% 30%
Outsourcing (including PublicCloud & Transmission)
20% 30%
CONFIDENTIAL AND PROPRIETARY
EP ITKMD Executive Assessment | © 2016 Gartner, Inc. and/or its affiliates. All rights reserved. 10
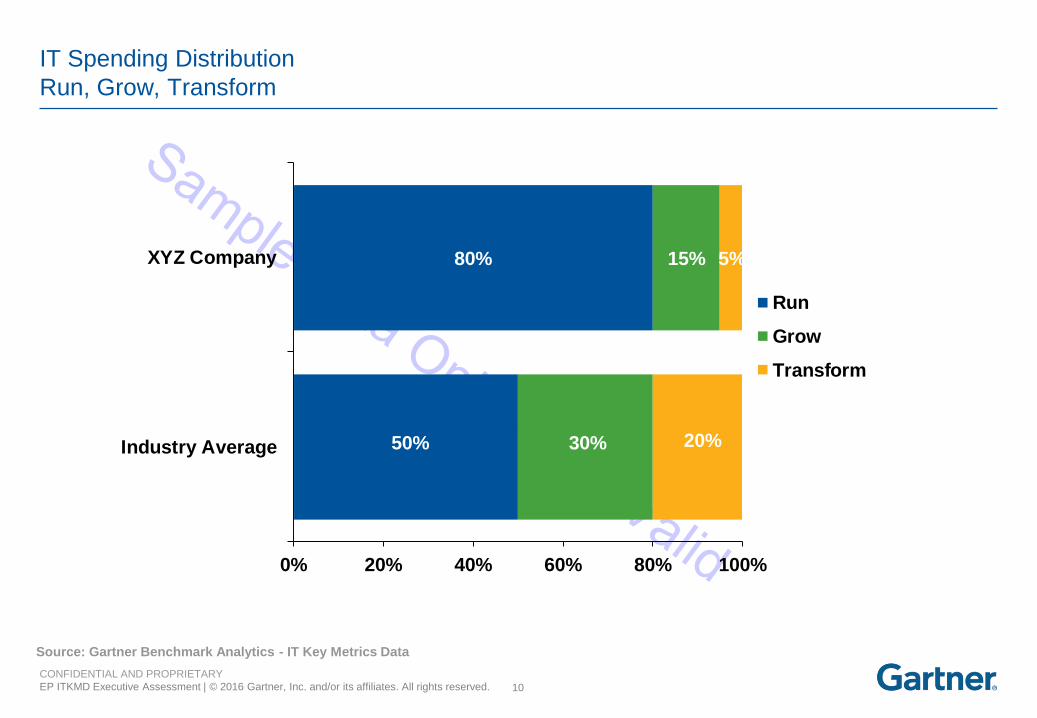
IT Spending Distribution
Run, Grow, Transform
Source: Gartner Benchmark Analytics - IT Key Metrics Data
50%
80%
30%
15%
20%
5%
0% 20% 40% 60% 80% 100%
Industry Average
XYZ Company
Run
Grow
Transform

CONFIDENTIAL AND PROPRIETARY
EP ITKMD Executive Assessment | © 2016 Gartner, Inc. and/or its affiliates. All rights reserved. 11
IT Cost Distribution
By IT Functional Area
Source: Gartner Benchmark Analytics - IT Key Metrics Data
0% 10% 20% 30% 40% 50% 60% 70% 80% 90% 100%
Industry Average
XYZ Company
Industry Average XYZ Company
Data Center 19% 20%
End-User Computing 11% 10%
IT Service Desk 10% 10%
Voice Network 6% 10%
Data Network 7% 10%
Application Development 18% 10%
Application Support 18% 10%
IT Management 7% 10%
Finance & Administration 4% 10%

CONFIDENTIAL AND PROPRIETARY
EP ITKMD Executive Assessment | © 2016 Gartner, Inc. and/or its affiliates. All rights reserved. 12
IT Employees as percent of Total Employees
= Range = Industry Average = Middle Quartiles = XYZ Company
Source: Gartner Benchmark Analytics - IT Key Metrics Data
5.0%3.4%
0%
5%
10%
15%
20%
25%

CONFIDENTIAL AND PROPRIETARY
EP ITKMD Executive Assessment | © 2016 Gartner, Inc. and/or its affiliates. All rights reserved. 13
IT Staffing Distribution
In House vs. Contract Employees
Source: Gartner Benchmark Analytics - IT Key Metrics Data
50%
90%
50%
10%
0% 20% 40% 60% 80% 100%
Industry Average
XYZ Company
In House
Contractors

CONFIDENTIAL AND PROPRIETARY
EP ITKMD Executive Assessment | © 2016 Gartner, Inc. and/or its affiliates. All rights reserved. 14
IT Staffing Distribution
By IT Functional Area
Source: Gartner Benchmark Analytics - IT Key Metrics Data
0% 10% 20% 30% 40% 50% 60% 70% 80% 90% 100%
Industry Average
XYZ Company
Industry Average XYZ Company
Data Center 14% 20%
End-User Computing 11% 10%
IT Service Desk 8% 10%
Voice Network 5% 10%
Data Network 9% 10%
Application Development 21% 10%
Application Support 19% 10%
IT Management 8% 10%
Finance & Administration 5% 10%

CONFIDENTIAL AND PROPRIETARY
EP ITKMD Executive Assessment | © 2016 Gartner, Inc. and/or its affiliates. All rights reserved. 15
IT Staffing Distribution
By Role
Based on Full Database
Source: Gartner Benchmark Analytics - IT Key Metrics Data
55%
50%
35%
30%
10%
20%
0% 20% 40% 60% 80% 100%
Database Average
XYZ Company
Infrastructure Operationsand Software Engineering
Technology and ProcessManagement
Finance, Governance andControl

16
CONFIDENTIAL AND PROPRIETARY
EP ITKMD Executive Assessment | © 2016 Gartner, Inc. and/or its affiliates. All rights reserved.
IT Security Comparison Analysis
Comparison group based on full security database
(across all industries)

CONFIDENTIAL AND PROPRIETARY
EP ITKMD Executive Assessment | © 2016 Gartner, Inc. and/or its affiliates. All rights reserved. 17
IT Infrastructure* Security Spending as a percent of IT Spending
= Range = Average = Middle Quartiles = XYZ Company
Source: Gartner Benchmark Analytics - IT Key Metrics Data
* This data for this chart is based on the combination of Operational Infrastructure Security and Infrastructure Vulnerability Mgt and Security .Analytics.
Based on Full Security Database
1.5%
3.0%
0%
2%
4%
6%
8%
10%
12%

CONFIDENTIAL AND PROPRIETARY
EP ITKMD Executive Assessment | © 2016 Gartner, Inc. and/or its affiliates. All rights reserved. 18
IT Operational Infrastructure Security Spending Distribution
Source: Gartner Benchmark Analytics - IT Key Metrics Data
Based on Full Security Database
0% 20% 40% 60% 80% 100%
Average
XYZ Company
Average XYZ Company
Identity and Access Management 20% 25%
Network Security 30% 25%
Endpoint Security 20% 25%
Data Security 30% 25%

CONFIDENTIAL AND PROPRIETARY
EP ITKMD Executive Assessment | © 2016 Gartner, Inc. and/or its affiliates. All rights reserved. 19
IT Applications Security Spending as a percent of IT Spending
= Range = Average = Middle Quartiles = XYZ Company
Source: Gartner Benchmark Analytics - IT Key Metrics Data
Based on Full Security Database
0.3%
1.5%
0%
1%
2%
3%

CONFIDENTIAL AND PROPRIETARY
EP ITKMD Executive Assessment | © 2016 Gartner, Inc. and/or its affiliates. All rights reserved. 20
Governance, Risk, and Compliance Management Spending as a percent of IT Spending
= Range = Average = Middle Quartiles = XYZ Company
Source: Gartner Benchmark Analytics - IT Key Metrics Data
Based on Full Security Database
2.0%
4.1%
0%
1%
2%
3%
4%
5%
6%
7%
8%
9%
10%

CONFIDENTIAL AND PROPRIETARY
EP ITKMD Executive Assessment | © 2016 Gartner, Inc. and/or its affiliates. All rights reserved. 21
IT Infrastructure* Security FTEs as a percent of IT FTEs
= Range = Average = Middle Quartiles = XYZ Company
Source: Gartner Benchmark Analytics - IT Key Metrics Data
Based on Full Security Database
* This data for this chart is based on the combination of Operational Infrastructure Security and Infrastructure Vulnerability Mgt and Security .Analytics.
1.5%
3.2%
0%
2%
4%
6%
8%
10%
12%
14%

CONFIDENTIAL AND PROPRIETARY
EP ITKMD Executive Assessment | © 2016 Gartner, Inc. and/or its affiliates. All rights reserved. 22
IT Operational Infrastructure Security FTEs Distribution
Source: Gartner Benchmark Analytics - IT Key Metrics Data
Based on Full Security Database
0% 20% 40% 60% 80% 100%
Average
XYZ Company
Average XYZ Company
Identity and Access Management 20% 25%
Network Security 30% 25%
Endpoint Security 20% 25%
Data Security 30% 25%

CONFIDENTIAL AND PROPRIETARY
EP ITKMD Executive Assessment | © 2016 Gartner, Inc. and/or its affiliates. All rights reserved. 23
IT Applications Security FTEs as a percent of IT FTEs
= Range = Average = Middle Quartiles = XYZ Company
Source: Gartner Benchmark Analytics - IT Key Metrics Data
Based on Full Security Database
0.3%
1.4%
0%
1%
2%
3%
4%

CONFIDENTIAL AND PROPRIETARY
EP ITKMD Executive Assessment | © 2016 Gartner, Inc. and/or its affiliates. All rights reserved. 24
Governance, Risk, and Compliance Management FTEs as a percent of IT FTEs
= Range = Average = Middle Quartiles
Source: Gartner Benchmark Analytics - IT Key Metrics Data
Based on Full Security Database
= XYZ Company
2.3%
4.2%
0%
1%
2%
3%
4%
5%
6%
7%
8%
9%
10%

25
CONFIDENTIAL AND PROPRIETARY
EP ITKMD Executive Assessment | © 2016 Gartner, Inc. and/or its affiliates. All rights reserved.
IT Outsourcing Comparison Analysis
Comparison group based on full outsourcing database
(across all industries)

CONFIDENTIAL AND PROPRIETARY
EP ITKMD Executive Assessment | © 2016 Gartner, Inc. and/or its affiliates. All rights reserved. 26
IT Outsourcing Spending as a percent of IT Spending
Source: Gartner Benchmark Analytics - IT Key Metrics Data
= Range = Average = Middle Quartiles = XYZ Company
Based on Full Outsourcing Database
20%
30%
0%
10%
20%
30%
40%
50%
60%
70%
80%
90%
100%
CONFIDENTIAL AND PROPRIETARY
EP ITKMD Executive Assessment | © 2016 Gartner, Inc. and/or its affiliates. All rights reserved. 27
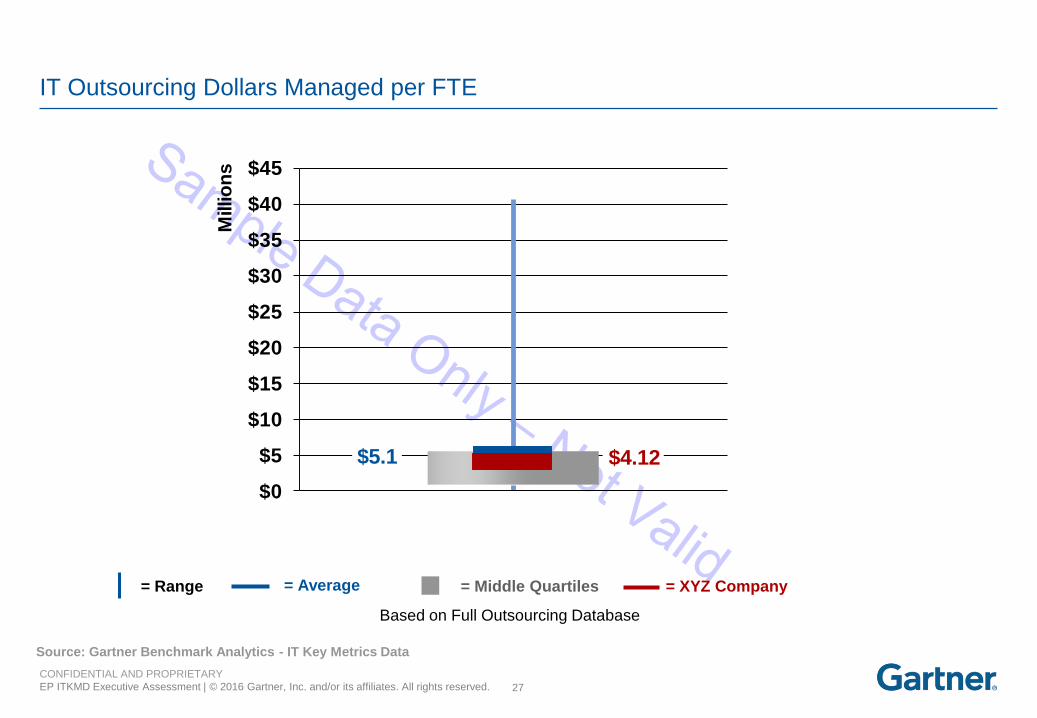
IT Outsourcing Dollars Managed per FTE
= Range = Average = Middle Quartiles = XYZ Company
Source: Gartner Benchmark Analytics - IT Key Metrics Data
Based on Full Outsourcing Database
$5.1 $4.12
$0
$5
$10
$15
$20
$25
$30
$35
$40
$45
Millio
ns

28
CONFIDENTIAL AND PROPRIETARY
EP ITKMD Executive Assessment | © 2016 Gartner, Inc. and/or its affiliates. All rights reserved.
Applications Comparison Analysis
Comparison group based on full applications database
(across all industries)

CONFIDENTIAL AND PROPRIETARY
EP ITKMD Executive Assessment | © 2016 Gartner, Inc. and/or its affiliates. All rights reserved. 29
Applications Costs - Build vs Buy
Based on Full Applications Database
0% 20% 40% 60% 80% 100%
Average
XYZ Company
Average XYZ Company
In-House 50% 30%
Packaged 30% 65%
Software as a Service 20% 5%
Build vs Buy Cost Distribution

CONFIDENTIAL AND PROPRIETARY
EP ITKMD Executive Assessment | © 2016 Gartner, Inc. and/or its affiliates. All rights reserved. 30
Applications Project Measures
Source: Gartner Benchmark Analytics - IT Key Metrics Data
= Range = Average = Middle Quartiles = XYZ Company
Based on Full Applications Database
20%
45%
0%
10%
20%
30%
40%
50%
60%
70%
80%
90%
100%
Percentage of Projects in Queue

CONFIDENTIAL AND PROPRIETARY
EP ITKMD Executive Assessment | © 2016 Gartner, Inc. and/or its affiliates. All rights reserved. 31
Applications Project Measures
Source: Gartner Benchmark Analytics - IT Key Metrics Data
= Range = Average = Middle Quartiles = XYZ Company
Based on Full Applications Database
59%
18%
75%
15%
-20%
0%
20%
40%
60%
80%
100%
Percentage of Projects Completed on Time Variance From Planned Lifecycle

CONFIDENTIAL AND PROPRIETARY
EP ITKMD Executive Assessment | © 2016 Gartner, Inc. and/or its affiliates. All rights reserved. 32
Applications Project Measures
Source: Gartner Benchmark Analytics - IT Key Metrics Data
= Range = Average = Middle Quartiles = XYZ Company
Based on Full Applications Database
62%
19%
59%
12%
-40%
-20%
0%
20%
40%
60%
80%
100%
Percentage of Projects Completed onBudget
Variance From Planned Budget
CONFIDENTIAL AND PROPRIETARY
EP ITKMD Executive Assessment | © 2016 Gartner, Inc. and/or its affiliates. All rights reserved. 33
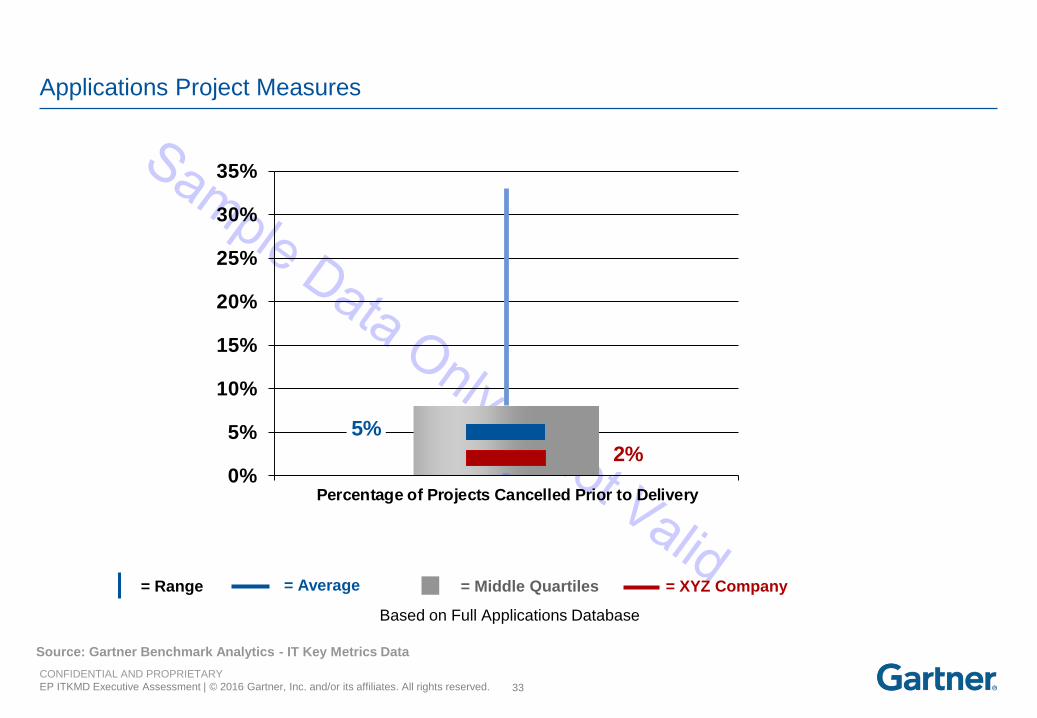
Applications Project Measures
Source: Gartner Benchmark Analytics - IT Key Metrics Data
= Range = Average = Middle Quartiles = XYZ Company
Based on Full Applications Database
5%
2%0%
5%
10%
15%
20%
25%
30%
35%
Percentage of Projects Cancelled Prior to Delivery

CONFIDENTIAL AND PROPRIETARY
EP ITKMD Executive Assessment | © 2016 Gartner, Inc. and/or its affiliates. All rights reserved. 34
Applications Project Measures
Source: Gartner Benchmark Analytics - IT Key Metrics Data
Based on Full Applications Database
0% 20% 40% 60% 80% 100%
Average
XYZ Company
Average XYZ Company
% Did not meet expectations 5% 3%
%Somewhat disappointing 20% 68%
% Somewhat successful 50% 24%
% Outstanding success 25% 5%
Percentage of Projects Perceived by Customers as:

CONFIDENTIAL AND PROPRIETARY
EP ITKMD Executive Assessment | © 2016 Gartner, Inc. and/or its affiliates. All rights reserved. 35
Applications Project Measures
Based on Full Applications Database
Source: Gartner Benchmark Analytics - IT Key Metrics Data
0% 20% 40% 60% 80% 100%
Average
XYZ Company
Average XYZ Company
% Functionality 34% 25%
% Missed Schedule 31% 25%
% Quality 20% 25%
% Cost 15% 25%
For projects that were rated as 'Did not meet expectations' or 'Somewhat disappointing', Percentage related that way because of:

CONFIDENTIAL AND PROPRIETARY
EP ITKMD Executive Assessment | © 2016 Gartner, Inc. and/or its affiliates. All rights reserved. 36
Applications Project Measures
Source: Gartner Benchmark Analytics - IT Key Metrics Data
Based on Full Applications Database
4
5
4
2
5
3.0
4.0
3.0
2.0
2.5
0
1
2
3
4
5
Poor InitialScope
Scope Creep ResourceAvailability
TechnicalExpertise
ShiftingPriorities
Significant Cause of Projects Being Late/Overbudget
XYZ Company
Average
Scale of 1 - 5. 1 = Not Significant, 5 = Highly Significant

CONFIDENTIAL AND PROPRIETARY
EP ITKMD Executive Assessment | © 2016 Gartner, Inc. and/or its affiliates. All rights reserved. 37
Information Provided by
Gartner Benchmark Analytics
We can help you better understand where
you are today, where you can improve, and
how to position for the future
For information regarding Gartner Benchmark Analytics, email
[email protected] or visit gartner.com/benchmarking
For questions regarding this report, email [email protected]
For more information regarding Gartner IT Key Metrics Data reports visit
gartner.com/ITKMD

CONFIDENTIAL AND PROPRIETARY
EP ITKMD Executive Assessment | © 2016 Gartner, Inc. and/or its affiliates. All rights reserved. 38
Gartner’s proven approach to comparative measurement will embed
continuous improvement within your organization
Understand how you
compare to others
Establish
Investment
& Performance
Baselines
Identify
Opportunities
for
Optimization
Comparative
Analysis with Peers
& Best Practices
Measure.
Optimize.
Transform.
Detailed plan for
optimizing
performance
Establish where
you are today
Ongoing benchmark programs optimize investment and drive improved service and satisfaction levels
Ongoing program
to enact and
enable change

Gartner delivers the technology-related
insight necessary for our clients to make the
right decisions, every day.
39