Embed Size (px)
Citation preview
California Department of Transportation
F
May 2015
EXECUTIVE ACT BOOKLET
Table of Contents u Planning and Modal Programs .................... 2-9 u Sustainability
- Environment, Equity, and Economics..................... 10-25 u Financial Information ........................ 26-37 u Maintenance, Operations, and Project Delivery 38-47 u Appendix ........................................... 48-53
Booklet Frequently Asked Questions .......................... 49 Web Resources ................................................ 50-51 Caltrans District Offices and District Directors .......... 52-53
Cover photo: Protected bicycle lanes provide clearly defined routes that are beneficial to cycling commuters and automobile drivers alike. The cover photo- graph was taken in Menlo Park in Santa Clara County.
For individuals with sensory disabilities, this document is available in braille, large print, in audio form, or on computer disk. To obtain a copy in one of these alternative formats, please write to:
Caltrans Public Affairs Office 1120 N Street, Mail Stop 49 Sacramento, CA 95814
or call: Paulette Lautaret (916) 657-4726 i 1
Caltrans Mission, Vision, Goals and Values
Our Mission: Provide a safe, sustainable, integrated and efficient transportation system to enhance
California’s economy and livability Our Vision:
A performance-driven, transparent and accountable organization that values its people, resources and
partners, and meets new challenges through leadership, innovation and teamwork
Our Goals: Safety and Health - Stewardship and Efficiency -
Sustainability, Livability and Economy - System Performance - Organizational Excellence
Our Values: Integrity - Commitment - Teamwork - Innovation
Malcolm Dougherty, Director California Department of Transportation
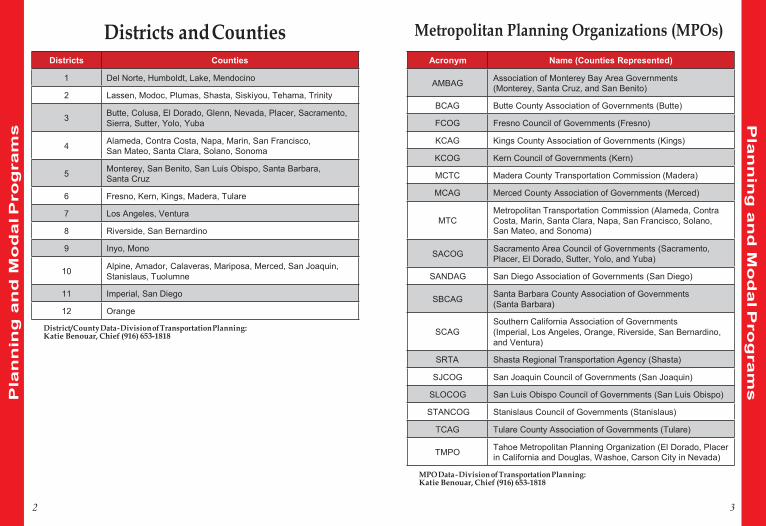
Districts Counties
1 Del Norte, Humboldt, Lake, Mendocino
2 Lassen, Modoc, Plumas, Shasta, Siskiyou, Tehama, Trinity
3 Butte, Colusa, El Dorado, Glenn, Nevada, Placer, Sacramento, Sierra, Sutter, Yolo, Yuba
4 Alameda, Contra Costa, Napa, Marin, San Francisco,
San Mateo, Santa Clara, Solano, Sonoma
5 Monterey, San Benito, San Luis Obispo, Santa Barbara, Santa Cruz
6 Fresno, Kern, Kings, Madera, Tulare
7 Los Angeles, Ventura
8 Riverside, San Bernardino
9 Inyo, Mono
10 Alpine, Amador, Calaveras, Mariposa, Merced, San Joaquin, Stanislaus, Tuolumne
11 Imperial, San Diego
12 Orange
Acronym Name (Counties Represented)
AMBAG Association of Monterey Bay Area Governments (Monterey, Santa Cruz, and San Benito)
BCAG Butte County Association of Governments (Butte)
FCOG Fresno Council of Governments (Fresno)
KCAG Kings County Association of Governments (Kings)
KCOG Kern Council of Governments (Kern)
MCTC Madera County Transportation Commission (Madera)
MCAG Merced County Association of Governments (Merced)
MTC
Metropolitan Transportation Commission (Alameda, Contra Costa, Marin, Santa Clara, Napa, San Francisco, Solano, San Mateo, and Sonoma)
SACOG Sacramento Area Council of Governments (Sacramento,
Placer, El Dorado, Sutter, Yolo, and Yuba)
SANDAG San Diego Association of Governments (San Diego)
SBCAG Santa Barbara County Association of Governments (Santa Barbara)
SCAG
Southern California Association of Governments (Imperial, Los Angeles, Orange, Riverside, San Bernardino, and Ventura)
SRTA Shasta Regional Transportation Agency (Shasta)
SJCOG San Joaquin Council of Governments (San Joaquin)
SLOCOG San Luis Obispo Council of Governments (San Luis Obispo)
STANCOG Stanislaus Council of Governments (Stanislaus)
TCAG Tulare County Association of Governments (Tulare)
TMPO Tahoe Metropolitan Planning Organization (El Dorado, Placer in California and Douglas, Washoe, Carson City in Nevada)
Districts and Counties Metropolitan Planning Organizations (MPOs)
District/County Data - Division of Transportation Planning: Katie Benouar, Chief (916) 653-1818
MPO Data - Division of Transportation Planning: Katie Benouar, Chief (916) 653-1818
2 3
Pla
nn
ing
an
d M
od
al P
rog
ram
s P
lan
nin
g a
nd
Mo
da
l Pro
gra
ms
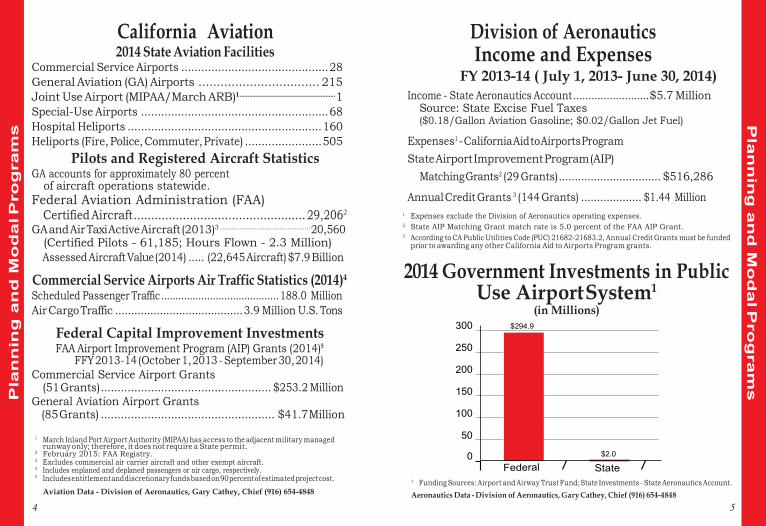
$294.9
$2.0
California Aviation 2014 State Aviation Facilities
Commercial Service Airports ............................................ 28 General Aviation (GA) Airports ................................. 215 Joint Use Airport (MIPAA/March ARB)1 ............................................................ 1 Special-Use Airports ........................................................ 68 Hospital Heliports .......................................................... 160 Heliports (Fire, Police, Commuter, Private) ....................... 505
Pilots and Registered Aircraft Statistics GA accounts for approximately 80 percent
of aircraft operations statewide. Federal Aviation Administration (FAA)
Certified Aircraft ................................................. 29,2062
GA and Air Taxi Active Aircraft (2013)3 ............................................... 20,560 (Certified Pilots - 61,185; Hours Flown - 2.3 Million) Assessed Aircraft Value (2014) ..... (22,645 Aircraft) $7.9 Billion
Commercial Service Airports Air Traffic Statistics (2014)4
Scheduled Passenger Traffic ......................................... 188.0 Million Air Cargo Traffic ........................................ 3.9 Million U.S. Tons
Federal Capital Improvement Investments FAA Airport Improvement Program (AIP) Grants (2014)5
FFY 2013-14 (October 1, 2013 - September 30, 2014) Commercial Service Airport Grants
(51 Grants) ................................................... $253.2 Million General Aviation Airport Grants
(85 Grants) .................................................... $41.7 Million
Division of Aeronautics Income and Expenses
FY 2013-14 ( July 1, 2013- June 30, 2014) Income - State Aeronautics Account ......................... $5.7 Million
Source: State Excise Fuel Taxes ($0.18/Gallon Aviation Gasoline; $0.02/Gallon Jet Fuel)
Expenses1 - California Aid to Airports Program State Airport Improvement Program (AIP)
Matching Grants2 (29 Grants) ................................ $516,286
Annual Credit Grants 3 (144 Grants) ................... $1.44 Million Expenses exclude the Division of Aeronautics operating expenses. State AIP Matching Grant match rate is 5.0 percent of the FAA AIP Grant. According to CA Public Utilities Code (PUC) 21682-21683.2, Annual Credit Grants must be funded prior to awarding any other California Aid to Airports Program grants.
1
2
3
2014 Government Investments in Public Use Airport System1
(in Millions)
1 March Inland Port Airport Authority (MIPAA) has access to the adjacent military managed runway only; therefore, it does not require a State permit. February 2015: FAA Registry. Excludes commercial air carrier aircraft and other exempt aircraft. Includes enplaned and deplaned passengers or air cargo, respectively. Includes entitlement and discretionary funds based on 90 percent of estimated project cost.
Aviation Data - Division of Aeronautics, Gary Cathey, Chief (916) 654-4848
2
3
4
5 1 Funding Sources: Airport and Airway Trust Fund; State Investments - State Aeronautics Account. Aeronautics Data - Division of Aeronautics, Gary Cathey, Chief (916) 654-4848
4 5
State
Pla
nn
ing
an
d M
od
al P
rog
ram
s P
lan
nin
g a
nd
Mo
da
l Pro
gra
ms
Year Ridership
2014 5.36
2013 5.52
2012 5.60
2011 5.57
2010 5.23
2009 5.06
2008 5.58
California Mass Transportation (Including Motor Bus, Rail, Street Car,Trolley, Demand Response, Rail Rapid Transit, Ferry Boats and Other)
Selected Transit Statistics1
FY 2013-14 Passenger Trips .................................................... 1.35 Billion Passenger Fares ................................................... $1.58 Billion Vehicle Miles ................................................. 537 Million Number of Revenue Vehicles .............................. 18 Thousand
Operating Revenues and Capital Additions..... $8.05 Billion 1 Source: State Controller’s Office - Transit Operators and Non-Transit Claimant’s Annual Report FY
2010-11 (The most current data available - the 2011-2014 Reports have not been published yet).
State Transit Funds Distributed Statewide FY 2013-14
Transportation Development Act (TDA) ............ $1.9 Billion State Transportation Improvement Program
(STIP).................................................$390 Thousand
California Mass Transportation (cont.) Federal Transit Funds Distributed Statewide5
FY 2013-14 (FFY 2014)
FTA 5310 - Elderly and Disabled Specialized Transportation ........................................... $33.7 Million3
FTA 5311 and 5311(F) - Non-Urbanized Area Formula Program .................................. $26.9 Million
FTA 5311 (B) - Rural Transit Assistance Program (RTAP) .............................. $370 Thousand
1 $59,500 of this figure is “federalized” = provided by the Federal Transit Administration. More Proposition 1B information on on pages 34 - 37. To be distributed in FY 2015-16. To be continuously appropriated =10% of Total Green House Gas Reduction Fund proceeds. Federal Transit Administration (FTA) Apportionment.
California Intercity Rail Ridership By Calendar Year (in Millions)
2
3 4
5
1
Clean Air and Transportation Improvement Program (Proposition 116) .................................................... $0
State Local Partnership Program (SLPP) ........................... $0 Proposition 1A - High Speed Rail .............. $150.2 Million Proposition 1B2 - Public Transportation Modernization,
Improvement and Service Enhancement Account (PTMISEA) ........................................... $293 Million
Low Carbon Transit Operations Program (LCTOP) ........................................... $25 Million3
Transit and Intercity Rail Capital Program (TIRCP) ...........................................$25 Million3,4 Note: Ridership shown is the combined ridership for the Pacific Surfliner, San Joaquin, and Capitol
Corridor routes. California Intercity Rail Data - Division of Rail and Mass Transportation, Bruce Roberts, Chief (916) 654-7293
6 7
Pla
nn
ing
an
d M
od
al P
rog
ram
s P
lan
nin
g a
nd
Mo
da
l Pro
gra
ms
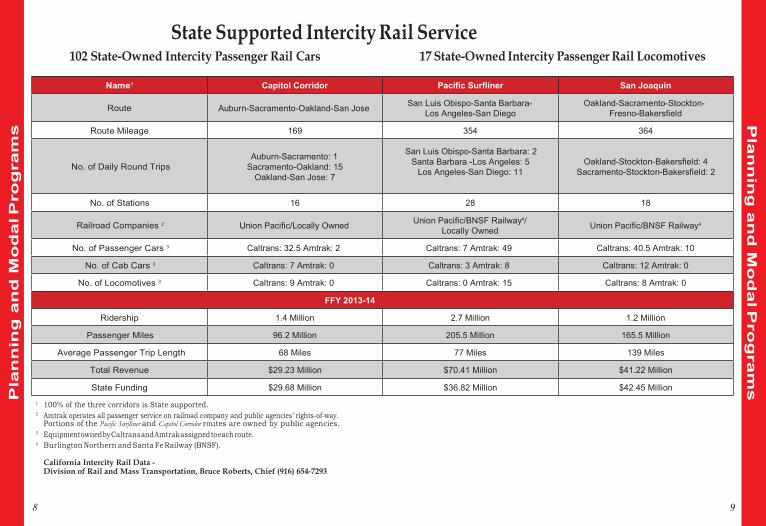
Name1 Capitol Corridor Pacific Surfliner San Joaquin
Route
Auburn-Sacramento-Oakland-San Jose San Luis Obispo-Santa Barbara- Los Angeles-San Diego
Oakland-Sacramento-Stockton- Fresno-Bakersfield
Route Mileage 169 354 364
No. of Daily Round Trips
Auburn-Sacramento: 1
Sacramento-Oakland: 15 Oakland-San Jose: 7
San Luis Obispo-Santa Barbara: 2 Santa Barbara -Los Angeles: 5
Los Angeles-San Diego: 11
Oakland-Stockton-Bakersfield: 4 Sacramento-Stockton-Bakersfield: 2
No. of Stations 16 28 18
Railroad Companies 2
Union Pacific/Locally Owned Union Pacific/BNSF Railway4/
Locally Owned
Union Pacific/BNSF Railway4
No. of Passenger Cars 3 Caltrans: 32.5 Amtrak: 2 Caltrans: 7 Amtrak: 49 Caltrans: 40.5 Amtrak: 10
No. of Cab Cars 3 Caltrans: 7 Amtrak: 0 Caltrans: 3 Amtrak: 8 Caltrans: 12 Amtrak: 0
No. of Locomotives 3 Caltrans: 9 Amtrak: 0 Caltrans: 0 Amtrak: 15 Caltrans: 8 Amtrak: 0
FFY 2013-14
Ridership 1.4 Million 2.7 Million 1.2 Million
Passenger Miles 96.2 Million 205.5 Million 165.5 Million
Average Passenger Trip Length 68 Miles 77 Miles 139 Miles
Total Revenue $29.23 Million $70.41 Million $41.22 Million
State Funding $29.68 Million $36.82 Million $42.45 Million
State Supported Intercity Rail Service 102 State-Owned Intercity Passenger Rail Cars 17 State-Owned Intercity Passenger Rail Locomotives
1 100% of the three corridors is State supported. Amtrak operates all passenger service on railroad company and public agencies’ rights-of-way. Portions of the Pacific Surfliner and Capitol Corridor routes are owned by public agencies. Equipment owned by Caltrans and Amtrak assigned to each route. Burlington Northern and Santa Fe Railway (BNSF).
California Intercity Rail Data - Division of Rail and Mass Transportation, Bruce Roberts, Chief (916) 654-7293
2
3 4
8 9
Pla
nn
ing
an
d M
od
al P
rog
ram
s P
lan
nin
g a
nd
Mo
da
l Pro
gra
ms
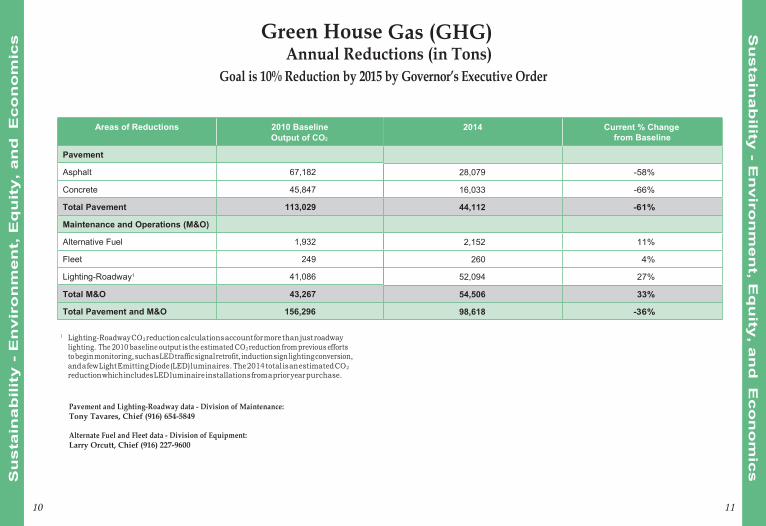
Areas of Reductions
2010 Baseline Output of CO2
2014
Current % Change from Baseline
Pavement Asphalt 67,182 28,079 -58%
Concrete 45,847 16,033 -66%
Total Pavement 113,029 44,112 -61%
Maintenance and Operations (M&O) Alternative Fuel 1,932 2,152 11%
Fleet 249 260 4%
Lighting-Roadway1 41,086 52,094 27%
Total M&O 43,267 54,506 33%
Total Pavement and M&O 156,296 98,618 -36%
Green House Gas (GHG) Annual Reductions (in Tons)
Goal is 10% Reduction by 2015 by Governor’s Executive Order
1 Lighting-Roadway CO2 reduction calculations account for more than just roadway lighting. The 2010 baseline output is the estimated CO2 reduction from previous efforts to begin monitoring, such as LED traffic signal retrofit, induction sign lighting conversion, and a few Light Emitting Diode (LED) luminaires. The 2014 total is an estimated CO2
reduction which includes LED luminaire installations from a prior year purchase.
Pavement and Lighting-Roadway data - Division of Maintenance: Tony Tavares, Chief (916) 654-5849
Alternate Fuel and Fleet data - Division of Equipment: Larry Orcutt, Chief (916) 227-9600
10 11
Su
sta
ina
bility
- En
viro
nm
en
t, Eq
uity
, an
d E
co
no
mic
s S
us
tain
ab
ilit
y -
En
vir
on
men
t, E
qu
ity
, an
d E
co
no
mic
s
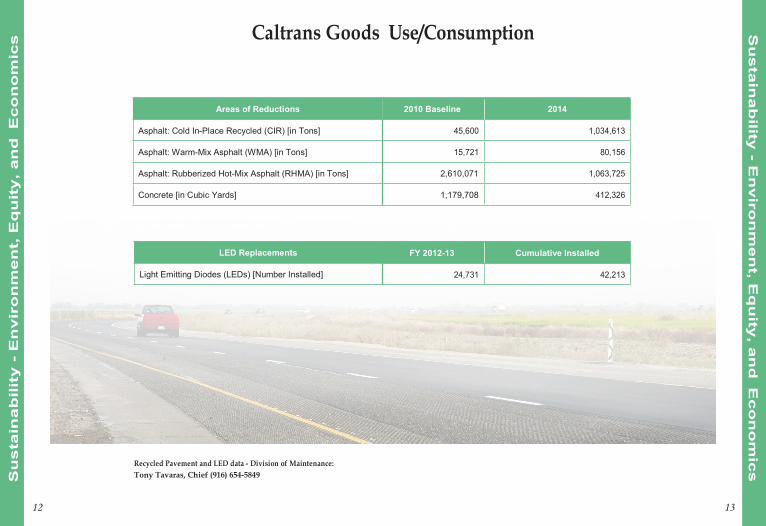
LED Replacements FY 2012-13 Cumulative Installed
Light Emitting Diodes (LEDs) [Number Installed] 24,731 42,213
Areas of Reductions 2010 Baseline 2014
Asphalt: Cold In-Place Recycled (CIR) [in Tons] 45,600 1,034,613
Asphalt: Warm-Mix Asphalt (WMA) [in Tons] 15,721 80,156
Asphalt: Rubberized Hot-Mix Asphalt (RHMA) [in Tons] 2,610,071 1,063,725
Concrete [in Cubic Yards] 1,179,708 412,326
Caltrans Goods Use/Consumption
Recycled Pavement and LED data - Division of Maintenance: Tony Tavaras, Chief (916) 654-5849
12 13
Su
sta
ina
bility
- En
viro
nm
en
t, Eq
uity
, an
d E
co
no
mic
s S
us
tain
ab
ilit
y -
En
vir
on
men
t, E
qu
ity
, an
d E
co
no
mic
s
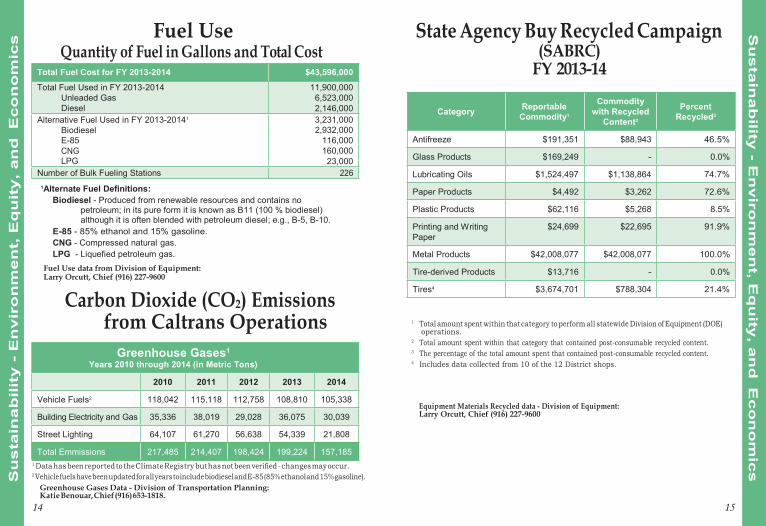
Total Fuel Cost for FY 2013-2014 $43,596,000 Total Fuel Used in FY 2013-2014
Unleaded Gas Diesel
11,900,000 6,523,000 2,146,000
Alternative Fuel Used in FY 2013-20141
Biodiesel E-85 CNG LPG
3,231,000 2,932,000
116,000 160,000 23,000
Number of Bulk Fueling Stations 226
Greenhouse Gases1 Years 2010 through 2014 (in Metric Tons)
2010 2011 2012 2013 2014
Vehicle Fuels2 118,042 115,118 112,758 108,810 105,338
Building Electricity and Gas 35,336 38,019 29,028 36,075 30,039
Street Lighting 64,107 61,270 56,638 54,339 21,808
Total Emmissions 217,485 214,407 198,424 199,224 157,185
Category
Reportable
Commodity1
Commodity with Recycled
Content2
Percent Recycled3
Antifreeze $191,351 $88,943 46.5%
Glass Products $169,249 - 0.0%
Lubricating Oils $1,524,497 $1,138,864 74.7%
Paper Products $4,492 $3,262 72.6%
Plastic Products $62,116 $5,268 8.5%
Printing and Writing Paper
$24,699
$22,695
91.9%
Metal Products $42,008,077 $42,008,077 100.0%
Tire-derived Products $13,716 - 0.0%
Tires4 $3,674,701 $788,304 21.4%
Fuel Use Quantity of Fuel in Gallons and Total Cost
State Agency Buy Recycled Campaign (SABRC)
FY 2013-14
1Alternate Fuel Definitions: Biodiesel - Produced from renewable resources and contains no
petroleum; in its pure form it is known as B11 (100 % biodiesel) although it is often blended with petroleum diesel; e.g., B-5, B-10.
E-85 - 85% ethanol and 15% gasoline. CNG - Compressed natural gas. LPG - Liquefied petroleum gas.
Fuel Use data from Division of Equipment: Larry Orcutt, Chief (916) 227-9600
Carbon Dioxide (CO2) Emissions from Caltrans Operations 1 Total amount spent within that category to perform all statewide Division of Equipment (DOE)
operations. Total amount spent within that category that contained post-consumable recycled content. The percentage of the total amount spent that contained post-consumable recycled content. Includes data collected from 10 of the 12 District shops.
2
3 4
Equipment Materials Recycled data - Division of Equipment: Larry Orcutt, Chief (916) 227-9600
1 Data has been reported to the Climate Registry but has not been verified - changes may occur. 2 Vehicle fuels have been updated for all years to include biodiesel and E-85 (85% ethanol and 15% gasoline).
Greenhouse Gases Data - Division of Transportation Planning: Katie Benouar, Chief (916) 653-1818.
14 15
Su
sta
ina
bility
- En
viro
nm
en
t, Eq
uity
, an
d E
co
no
mic
s S
us
tain
ab
ilit
y -
En
vir
on
men
t, E
qu
ity
, an
d E
co
no
mic
s
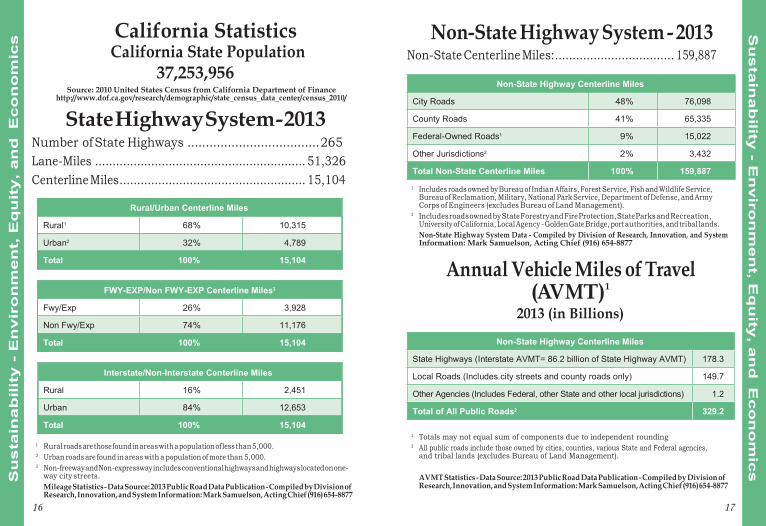
Interstate/Non-Interstate Centerline Miles
Rural 16% 2,451
Urban 84% 12,653
Total 100% 15,104
FWY-EXP/Non FWY-EXP Centerline Miles3
Fwy/Exp 26% 3,928
Non Fwy/Exp 74% 11,176
Total 100% 15,104
Rural/Urban Centerline Miles
Rural1 68% 10,315
Urban2 32% 4,789
Total 100% 15,104
Non-State Highway Centerline Miles
City Roads 48% 76,098
County Roads 41% 65,335
Federal-Owned Roads1 9% 15,022
Other Jurisdictions2 2% 3,432
Total Non-State Centerline Miles 100% 159,887
Non-State Highway Centerline Miles
State Highways (Interstate AVMT= 86.2 billion of State Highway AVMT) 178.3
Local Roads (Includes city streets and county roads only) 149.7
Other Agencies (Includes Federal, other State and other local jurisdictions) 1.2
Total of All Public Roads2 329.2
California Statistics California State Population
37,253,956 Source: 2010 United States Census from California Department of Finance
http://www.dof.ca.gov/research/demographic/state_census_data_center/census_2010/
State Highway System - 2013 Number of State Highways .................................... 265 Lane-Miles ............................................................ 51,326 Centerline Miles ..................................................... 15,104
Non-State Highway System - 2013 Non-State Centerline Miles: .................................. 159,887
1 Includes roads owned by Bureau of Indian Affairs, Forest Service, Fish and Wildlife Service, Bureau of Reclamation, Military, National Park Service, Department of Defense, and Army Corps of Engineers (excludes Bureau of Land Management). Includes roads owned by State Forestry and Fire Protection, State Parks and Recreation, University of California, Local Agency - Golden Gate Bridge, port authorities, and tribal lands. Non-State Highway System Data - Compiled by Division of Research, Innovation, and System Information: Mark Samuelson, Acting Chief (916) 654-8877
2
Annual Vehicle Miles of Travel (AVMT)1
2013 (in Billions)
1 Totals may not equal sum of components due to independent rounding All public roads include those owned by cities, counties, various State and Federal agencies, and tribal lands (excludes Bureau of Land Management).
1 Rural roads are those found in areas with a population of less than 5,000. Urban roads are found in areas with a population of more than 5,000. Non-freeway and Non-expressway includes conventional highways and highways located on one- way city streets. Mileage Statistics - Data Source: 2013 Public Road Data Publication - Compiled by Division of Research, Innovation, and System Information: Mark Samuelson, Acting Chief (916) 654-8877
2
2
3
AVMT Statistics - Data Source: 2013 Public Road Data Publication - Compiled by Division of Research, Innovation, and System Information: Mark Samuelson, Acting Chief (916) 654-8877
16 17
Su
sta
ina
bility
- En
viro
nm
en
t, Eq
uity
, an
d E
co
no
mic
s S
us
tain
ab
ilit
y -
En
vir
on
men
t, E
qu
ity
, an
d E
co
no
mic
s
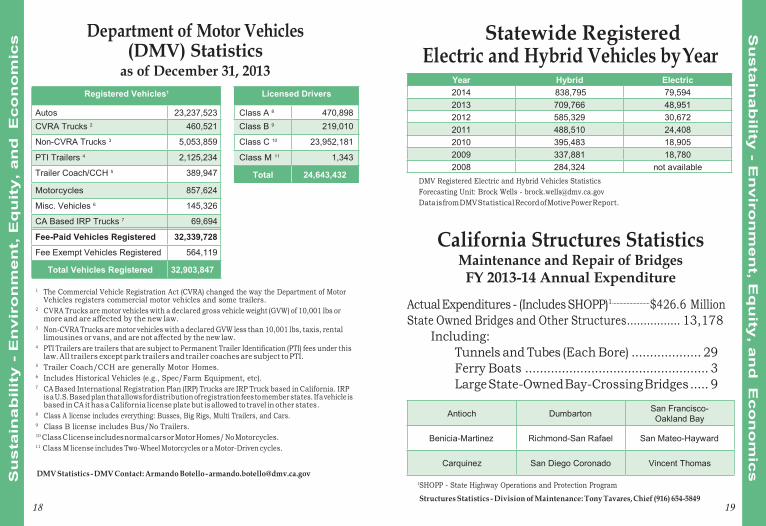
Licensed Drivers
Class A 8 470,898 Class B 9 219,010
Class C 10 23,952,181
Class M 11 1,343
Total 24,643,432
Registered Vehicles1
Autos 23,237,523 CVRA Trucks 2 460,521
Non-CVRA Trucks 3 5,053,859
PTI Trailers 4 2,125,234
Trailer Coach/CCH 5 389,947
Motorcycles 857,624
Misc. Vehicles 6 145,326
CA Based IRP Trucks 7 69,694
Fee-Paid Vehicles Registered 32,339,728
Fee Exempt Vehicles Registered 564,119
Total Vehicles Registered 32,903,847
Antioch Dumbarton San Francisco- Oakland Bay
Benicia-Martinez Richmond-San Rafael San Mateo-Hayward
Carquinez San Diego Coronado Vincent Thomas
Year Hybrid Electric 2014 838,795 79,594 2013 709,766 48,951 2012 585,329 30,672 2011 488,510 24,408 2010 395,483 18,905 2009 337,881 18,780 2008 284,324 not available
Department of Motor Vehicles (DMV) Statistics
as of December 31, 2013
Statewide Registered Electric and Hybrid Vehicles by Year
DMV Registered Electric and Hybrid Vehicles Statistics Forecasting Unit: Brock Wells - [email protected] Data is from DMV Statistical Record of Motive Power Report.
California Structures Statistics Maintenance and Repair of Bridges FY 2013-14 Annual Expenditure
Actual Expenditures - (Includes SHOPP)1 .......................... $426.6 Million State Owned Bridges and Other Structures ................ 13,178
Including: Tunnels and Tubes (Each Bore) ................... 29 Ferry Boats .................................................. 3 Large State-Owned Bay-Crossing Bridges ..... 9
1 The Commercial Vehicle Registration Act (CVRA) changed the way the Department of Motor Vehicles registers commercial motor vehicles and some trailers. CVRA Trucks are motor vehicles with a declared gross vehicle weight (GVW) of 10,001 lbs or more and are affected by the new law. Non-CVRA Trucks are motor vehicles with a declared GVW less than 10,001 lbs, taxis, rental limousines or vans, and are not affected by the new law. PTI Trailers are trailers that are subject to Permanent Trailer Identification (PTI) fees under this law. All trailers except park trailers and trailer coaches are subject to PTI. Trailer Coach/CCH are generally Motor Homes. Includes Historical Vehicles (e.g., Spec/Farm Equipment, etc). CA Based International Registration Plan (IRP) Trucks are IRP Truck based in California. IRP is a U.S. Based plan that allows for distribution of registration fees to member states. If a vehicle is based in CA it has a California license plate but is allowed to travel in other states. Class A license includes everything: Busses, Big Rigs, Multi Trailers, and Cars. Class B license includes Bus/No Trailers.
2
3
4
5
6
7
8
9
10 Class C license includes normal cars or Motor Homes/ No Motorcycles. 11 Class M license includes Two-Wheel Motorcycles or a Motor-Driven cycles.
DMV Statistics - DMV Contact: Armando Botello - [email protected] 1SHOPP - State Highway Operations and Protection Program
Structures Statistics - Division of Maintenance: Tony Tavares, Chief (916) 654-5849 18 19
Su
sta
ina
bility
- En
viro
nm
en
t, Eq
uity
, an
d E
co
no
mic
s S
us
tain
ab
ilit
y -
En
vir
on
men
t, E
qu
ity
, an
d E
co
no
mic
s
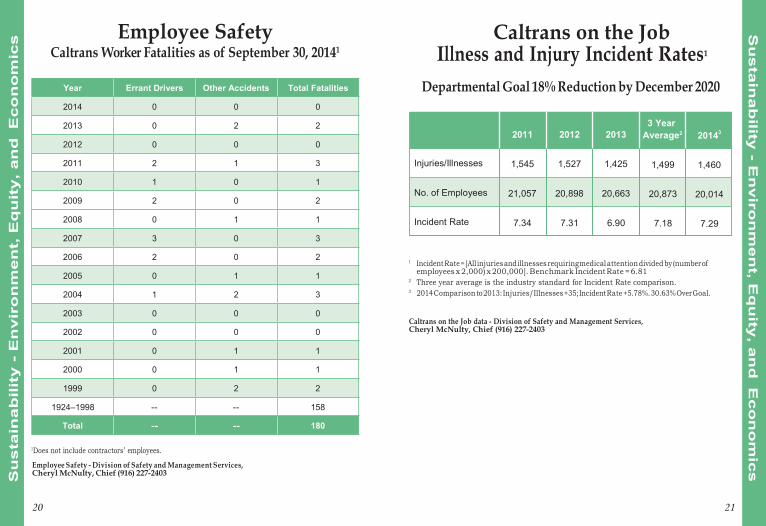
Year Errant Drivers Other Accidents Total Fatalities
2014 0 0 0
2013 0 2 2
2012 0 0 0
2011 2 1 3
2010 1 0 1
2009 2 0 2
2008 0 1 1
2007 3 0 3
2006 2 0 2
2005 0 1 1
2004 1 2 3
2003 0 0 0
2002 0 0 0
2001 0 1 1
2000 0 1 1
1999 0 2 2
1924–1998 -- -- 158
Total -- -- 180
2011
2012
2013
3 Year Average2
20143
Injuries/Illnesses 1,545 1,527 1,425
1,499
1,460
No. of Employees
21,057
20,898
20,663
20,873
20,014
Incident Rate
7.34
7.31
6.90
7.18
7.29
Employee Safety Caltrans Worker Fatalities as of September 30, 20141
Caltrans on the Job Illness and Injury Incident Rates1
Departmental Goal 18% Reduction by December 2020
1 Incident Rate = [All injuries and illnesses requiring medical attention divided by (number of employees x 2,000) x 200,000]. Benchmark Incident Rate = 6.81 Three year average is the industry standard for Incident Rate comparison. 2014 Comparison to 2013: Injuries/Illnesses +35; Incident Rate +5.78%. 30.63% Over Goal.
2
3
Caltrans on the Job data - Division of Safety and Management Services, Cheryl McNulty, Chief (916) 227-2403
1Does not include contractors’ employees.
Employee Safety - Division of Safety and Management Services, Cheryl McNulty, Chief (916) 227-2403
20 21
Su
sta
ina
bility
- En
viro
nm
en
t, Eq
uity
, an
d E
co
no
mic
s S
us
tain
ab
ilit
y -
En
vir
on
men
t, E
qu
ity
, an
d E
co
no
mic
s
Year Women Men Minorities Caucasian
2014 25.4% 74.6% 52.8% 47.2%
2013 25.4% 74.6% 52.3% 47.7%
2012 26.02% 75.98% 51.4% 48.6%
2011 25.7% 74.3% 51.8% 48.2%
2010 25.9% 74.1% 51.7% 48.3%
2009 26.3% 73.7% 51.3% 48.7%
2008 26.5% 73.5% 50.9% 49.1%
2007 26.5% 73.5% 50.3% 49.7%
2006 26.4% 73.6% 49.8% 50.2%
Employee Category
2010 2011 2012 2013 2014 No. % No. % No. % No. % No. %
Engineering 8,330 42% 8,100 42% 7,949 41% 7,746 41% 7,536 40%
Maintenance 4,870 24% 4,747 25% 4,974 26% 4,883 26% 4,760 25%
All Others 6,709 34% 6,382 33% 6,524 33% 6,350 33% 6,479 35% Total 19,909 100% 19,229 100% 19,447 100% 19,979 100% 18,775 100%
Caltrans Full-Time Employees1
Number and Percentage per Category2
as of September 30 each Year
Small Business and Disabled Veteran Business Enterprise (DVBE)
FY 2013-14 Participation Rates
Small Business / Microbusiness Participation Total Dollars Awarded for State Funded
Contracts and Procurements ................. $1,074,833,766 Small/Micro Business Participation ............... $303,566,873 Percentage ........................................................ 28.24% Summary of Departmental
Ethnicity/Gender Percentages1
Years 2006-2014 as of September 30 each Year Disabled Veteran Business Enterprise (DVBE) Total Dollars Awarded for State Funded
Contracts and Procurements ................. $1,074,833,766 Dollars of DVBE Participation.................. $40,695,744 Percentage .......................................................... 3.79%
Source: Contracting Activity Report, DPAC, FY2013-14
SB-DVBE Statistics - Office of Business and Economic Opportunity (OBEO): Angela M. Shell, Assistant Director (916) 324-0990
1 The employment summary reflects all time bases and tenures for employee primary positions except additional and retired annuitant positions. Percentage numbers are rounded on the top chart. Employee and Ethnicity/Gender Percentages Data - Division of Human Resources: Lydia Lewis, Chief (916) 227-5328
2
22 23
Su
sta
ina
bility
- En
viro
nm
en
t, Eq
uity
, an
d E
co
no
mic
s S
us
tain
ab
ilit
y -
En
vir
on
men
t, E
qu
ity
, an
d E
co
no
mic
s
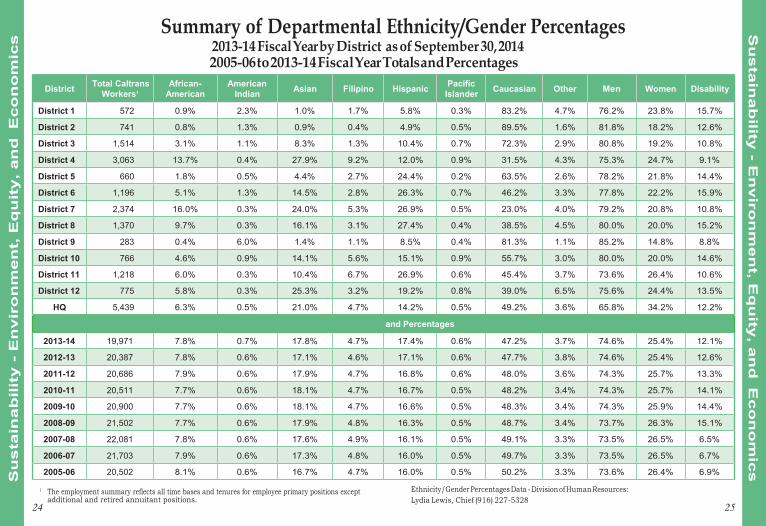
District Total Caltrans Workers1
African- American
American Indian Asian Filipino Hispanic Pacific
Islander Caucasian Other Men Women Disability
District 1 572 0.9% 2.3% 1.0% 1.7% 5.8% 0.3% 83.2% 4.7% 76.2% 23.8% 15.7%
District 2 741 0.8% 1.3% 0.9% 0.4% 4.9% 0.5% 89.5% 1.6% 81.8% 18.2% 12.6%
District 3 1,514 3.1% 1.1% 8.3% 1.3% 10.4% 0.7% 72.3% 2.9% 80.8% 19.2% 10.8%
District 4 3,063 13.7% 0.4% 27.9% 9.2% 12.0% 0.9% 31.5% 4.3% 75.3% 24.7% 9.1%
District 5 660 1.8% 0.5% 4.4% 2.7% 24.4% 0.2% 63.5% 2.6% 78.2% 21.8% 14.4%
District 6 1,196 5.1% 1.3% 14.5% 2.8% 26.3% 0.7% 46.2% 3.3% 77.8% 22.2% 15.9%
District 7 2,374 16.0% 0.3% 24.0% 5.3% 26.9% 0.5% 23.0% 4.0% 79.2% 20.8% 10.8%
District 8 1,370 9.7% 0.3% 16.1% 3.1% 27.4% 0.4% 38.5% 4.5% 80.0% 20.0% 15.2%
District 9 283 0.4% 6.0% 1.4% 1.1% 8.5% 0.4% 81.3% 1.1% 85.2% 14.8% 8.8%
District 10 766 4.6% 0.9% 14.1% 5.6% 15.1% 0.9% 55.7% 3.0% 80.0% 20.0% 14.6%
District 11 1,218 6.0% 0.3% 10.4% 6.7% 26.9% 0.6% 45.4% 3.7% 73.6% 26.4% 10.6%
District 12 775 5.8% 0.3% 25.3% 3.2% 19.2% 0.8% 39.0% 6.5% 75.6% 24.4% 13.5%
HQ 5,439 6.3% 0.5% 21.0% 4.7% 14.2% 0.5% 49.2% 3.6% 65.8% 34.2% 12.2%
and Percentages
2013-14 19,971 7.8% 0.7% 17.8% 4.7% 17.4% 0.6% 47.2% 3.7% 74.6% 25.4% 12.1%
2012-13 20,387 7.8% 0.6% 17.1% 4.6% 17.1% 0.6% 47.7% 3.8% 74.6% 25.4% 12.6%
2011-12 20,686 7.9% 0.6% 17.9% 4.7% 16.8% 0.6% 48.0% 3.6% 74.3% 25.7% 13.3%
2010-11 20,511 7.7% 0.6% 18.1% 4.7% 16.7% 0.5% 48.2% 3.4% 74.3% 25.7% 14.1%
2009-10 20,900 7.7% 0.6% 18.1% 4.7% 16.6% 0.5% 48.3% 3.4% 74.3% 25.9% 14.4%
2008-09 21,502 7.7% 0.6% 17.9% 4.8% 16.3% 0.5% 48.7% 3.4% 73.7% 26.3% 15.1%
2007-08 22,081 7.8% 0.6% 17.6% 4.9% 16.1% 0.5% 49.1% 3.3% 73.5% 26.5% 6.5%
2006-07 21,703 7.9% 0.6% 17.3% 4.8% 16.0% 0.5% 49.7% 3.3% 73.5% 26.5% 6.7%
2005-06 20,502 8.1% 0.6% 16.7% 4.7% 16.0% 0.5% 50.2% 3.3% 73.6% 26.4% 6.9%
Summary of Departmental Ethnicity/Gender Percentages 2013-14 Fiscal Year by District as of September 30, 2014 2005-06 to 2013-14 Fiscal Year Totals and Percentages
Ethnicity/Gender Percentages Data - Division of Human Resources: Lydia Lewis, Chief (916) 227-5328
1 The employment summary reflects all time bases and tenures for employee primary positions except additional and retired annuitant positions.
24 25
Su
sta
ina
bility
- En
viro
nm
en
t, Eq
uity
, an
d E
co
no
mic
s S
us
tain
ab
ilit
y -
En
vir
on
men
t, E
qu
ity
, an
d E
co
no
mic
s
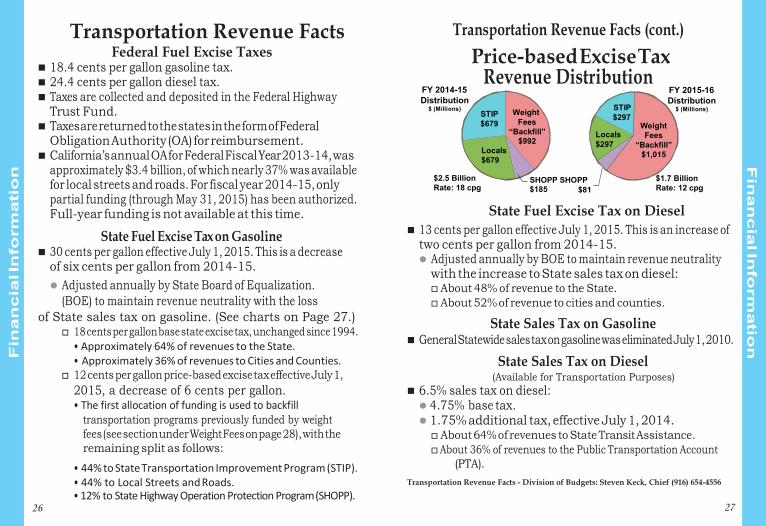
Transportation Revenue Facts (cont.) Price-based Excise Tax
Revenue Distribution STIP
FY 2014-15 Distribution
$ (Millions)
FY 2015-16 Distribution
$ (Millions) Weight Fees
“Backfill” $992
STIP $679
$297 Weight Fees
“Backfill” $1,015
Locals $297
Locals $679
$2.5 Billion Rate: 18 cpg
$1.7 Billion Rate: 12 cpg
SHOPP SHOPP $185 $81
Transportation Revenue Facts Federal Fuel Excise Taxes
18.4 cents per gallon gasoline tax. 24.4 cents per gallon diesel tax. Taxes are collected and deposited in the Federal Highway
Trust Fund. Taxes are returned to the states in the form of Federal
Obligation Authority (OA) for reimbursement. California’s annual OA for Federal Fiscal Year 2013-14, was
approximately $3.4 billion, of which nearly 37% was available for local streets and roads. For fiscal year 2014-15, only partial funding (through May 31, 2015) has been authorized. Full-year funding is not available at this time.
State Fuel Excise Tax on Gasoline 30 cents per gallon effective July 1, 2015. This is a decrease
of six cents per gallon from 2014-15. Adjusted annually by State Board of Equalization.
(BOE) to maintain revenue neutrality with the loss of State sales tax on gasoline. (See charts on Page 27.)
18 cents per gallon base state excise tax, unchanged since 1994. • Approximately 64% of revenues to the State. • Approximately 36% of revenues to Cities and Counties.
12 cents per gallon price-based excise tax effective July 1, 2015, a decrease of 6 cents per gallon. • The first allocation of funding is used to backfill
transportation programs previously funded by weight fees (see section under Weight Fees on page 28), with the remaining split as follows:
• 44% to State Transportation Improvement Program (STIP). • 44% to Local Streets and Roads. • 12% to State Highway Operation Protection Program (SHOPP).
26
State Fuel Excise Tax on Diesel 13 cents per gallon effective July 1, 2015. This is an increase of
two cents per gallon from 2014-15. Adjusted annually by BOE to maintain revenue neutrality
with the increase to State sales tax on diesel: About 48% of revenue to the State. About 52% of revenue to cities and counties.
State Sales Tax on Gasoline General Statewide sales tax on gasoline was eliminated July 1, 2010.
State Sales Tax on Diesel (Available for Transportation Purposes)
6.5% sales tax on diesel: 4.75% base tax. 1.75% additional tax, effective July 1, 2014. About 64% of revenues to State Transit Assistance. About 36% of revenues to the Public Transportation Account
(PTA). Transportation Revenue Facts - Division of Budgets: Steven Keck, Chief (916) 654-4556
27
Fin
an
cia
l Info
rmatio
n F
ina
nc
ial I
nfo
rma
tio
n
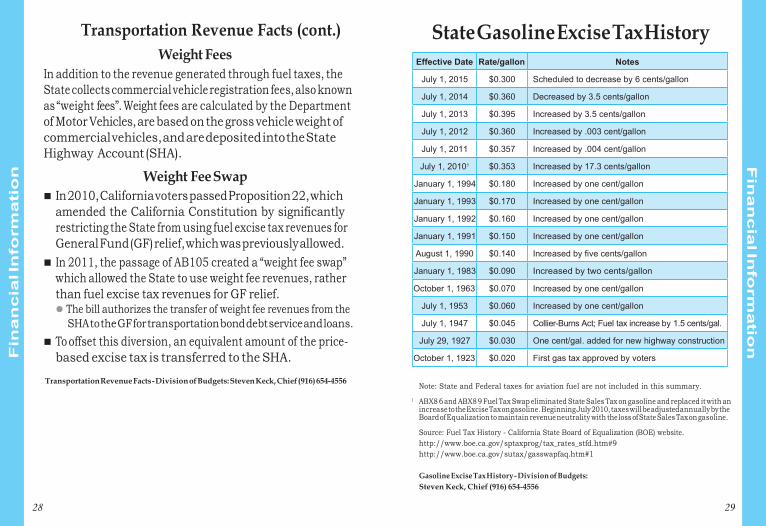
Effective Date Rate/gallon Notes
July 1, 2015 $0.300 Scheduled to decrease by 6 cents/gallon
July 1, 2014 $0.360 Decreased by 3.5 cents/gallon
July 1, 2013 $0.395 Increased by 3.5 cents/gallon
July 1, 2012 $0.360 Increased by .003 cent/gallon
July 1, 2011 $0.357 Increased by .004 cent/gallon
July 1, 20101 $0.353 Increased by 17.3 cents/gallon
January 1, 1994 $0.180 Increased by one cent/gallon
January 1, 1993 $0.170 Increased by one cent/gallon
January 1, 1992 $0.160 Increased by one cent/gallon
January 1, 1991 $0.150 Increased by one cent/gallon
August 1, 1990 $0.140 Increased by five cents/gallon
January 1, 1983 $0.090 Increased by two cents/gallon
October 1, 1963 $0.070 Increased by one cent/gallon
July 1, 1953 $0.060 Increased by one cent/gallon
July 1, 1947 $0.045 Collier-Burns Act; Fuel tax increase by 1.5 cents/gal.
July 29, 1927 $0.030 One cent/gal. added for new highway construction
October 1, 1923 $0.020 First gas tax approved by voters
Transportation Revenue Facts (cont.) Weight Fees
In addition to the revenue generated through fuel taxes, the State collects commercial vehicle registration fees, also known as “weight fees”. Weight fees are calculated by the Department of Motor Vehicles, are based on the gross vehicle weight of commercial vehicles, and are deposited into the State Highway Account (SHA).
Weight Fee Swap In 2010, California voters passed Proposition 22, which
amended the California Constitution by significantly restricting the State from using fuel excise tax revenues for General Fund (GF) relief, which was previously allowed.
In 2011, the passage of AB105 created a “weight fee swap” which allowed the State to use weight fee revenues, rather than fuel excise tax revenues for GF relief. The bill authorizes the transfer of weight fee revenues from the
SHA to the GF for transportation bond debt service and loans. To offset this diversion, an equivalent amount of the price-
based excise tax is transferred to the SHA.
Transportation Revenue Facts - Division of Budgets: Steven Keck, Chief (916) 654-4556
State Gasoline Excise Tax History
Note: State and Federal taxes for aviation fuel are not included in this summary.
ABX8 6 and ABX8 9 Fuel Tax Swap eliminated State Sales Tax on gasoline and replaced it with an increase to the Excise Tax on gasoline. Beginning July 2010, taxes will be adjusted annually by the Board of Equalization to maintain revenue neutrality with the loss of State Sales Tax on gasoline.
Source: Fuel Tax History - California State Board of Equalization (BOE) website. http://www.boe.ca.gov/sptaxprog/tax_rates_stfd.htm#9 http://www.boe.ca.gov/sutax/gasswapfaq.htm#1
1
Gasoline Excise Tax History - Division of Budgets: Steven Keck, Chief (916) 654-4556
28 29
Fin
an
cia
l Info
rmatio
n F
ina
nc
ial I
nfo
rma
tio
n
Capital Allocations
Actual Projected
2011-12 2012-13 2013-14 2014-15
Proposition 1B1 $3,946 $1,139 $246 $40
State Transportation Improvement Program (STIP)
$372
$336
$519
$551
State Highway Operations and Protection Program (SHOPP)2
$1,894
$1,095
$1,835
$1,800
Total Capital Allocations $6,212 $2,570 $2,600 $2,391
Total Gross State Product Gain $12,920 $5,346 $5,400 $5,000
Jobs Created - Actual And Projected
Total Jobs Created in California
Actual Projected
2011-12 2012-13 2013-14 2014-15
111,900 46,300 46,800 43,000
County Duration Est. 2015 Revenue
Alameda 2015-2045 $301 Contra Costa 1989-2034 $81 Fresno 1987-2027 $72 Imperial 1990-2050 $14 Los Angeles (1% Tax) Permanent $1,538 Los Angeles (Measure R) 2009-2039 $769 Madera 1990-2027 $8 Marin 2005-2025 $27 Napa (Measure T)2 2018-2043 (Est.) - Orange 1991-2041 $326 Riverside 1989-2039 $172 Sacramento 1989-2039 $111 San Bernardino 1990-2040 $175 San Diego 1988-2048 $278 San Francisco 1990-2034 $95 San Joaquin 1991-2041 $57 San Mateo 1989-2033 $85 Santa Barbara 1990-2040 $37 Santa Clara 1996-2036 (Est.) $221 Santa Clara - (BART Ext 0.125%) 2013-2043 (Est.) $55 Sonoma (0.25%) 2005-2025 $23 Sonoma-Marin (SMART 0.25%) 2009-2029 $36 Tulare 2007-2037 $32 Total Estimated 2014 Revenue $4,513
State Transportation Construction Capital Allocations (in Millions)
and Jobs Created
Countywide Transportation Sales Tax Measures1 (cont.)
Self-Help Counties - Temporary 0.5% Tax (in Millions)
1 Includes STIP Augmentation and SHOPP Augmentation projects Includes SHOPP Minor projects. Allocations per 4th Quarter Finance Report. 2
Capital Allocations - Division of Transportation Programming: Bruce DeTerra, Chief (916) 654-4013 Product Gain/Jobs Created - Division of Transportation Planning: Katie Benouar, Chief (916) 653-1818
Countywide Transportation Sales Tax Measures
Transit Districts (Permanent 0.5% Tax) • BART (Alameda, Contra Costa, San Francisco)
• San Mateo • Santa Clara • Santa Cruz
1 Article XIIIB of the State Constitution provides the authority and requirements for the imposition of local sales tax measures subject to voter approval. Revised Revenue Estimates for 2014 (estimates were updated in 2013 for this report). Napa will impose a one-half of one percent transactions and use tax for 25 years (Measure T). This tax will fund local street and road improvements and will be implemented once the Flood Protection tax (Measure A) expires. Measure A is expected to expire by 2018. Sales Tax Measure Data - Economic Analysis Branch - Division of Transportation Planning: Katie Benouar, Chief (916) 653-1818
2
30 31
Fin
an
cia
l Info
rmatio
n F
ina
nc
ial I
nfo
rma
tio
n
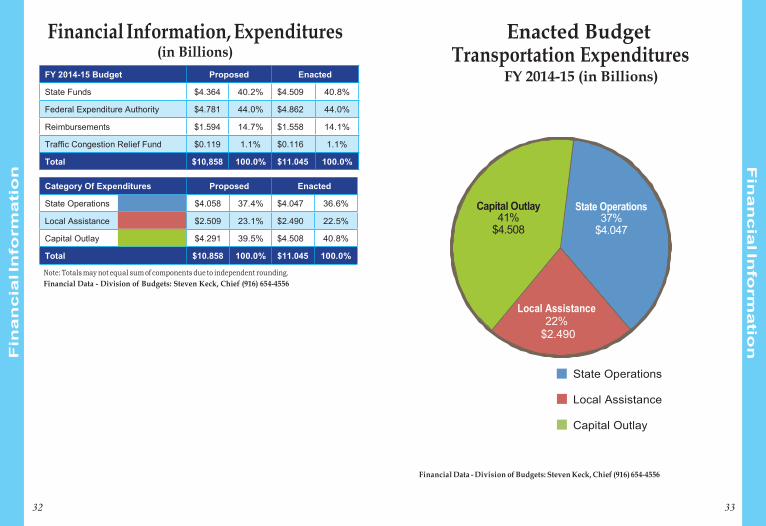
Category Of Expenditures Proposed Enacted
State Operations $4.058 37.4% $4.047 36.6%
Local Assistance $2.509 23.1% $2.490 22.5%
Capital Outlay $4.291 39.5% $4.508 40.8%
Total $10.858 100.0% $11.045 100.0%
FY 2014-15 Budget Proposed Enacted
State Funds $4.364 40.2% $4.509 40.8%
Federal Expenditure Authority $4.781 44.0% $4.862 44.0%
Reimbursements $1.594 14.7% $1.558 14.1%
Traffic Congestion Relief Fund $0.119 1.1% $0.116 1.1%
Total $10,858 100.0% $11.045 100.0%
Capital Outlay 41%
$4.508
State Operations 37%
$4.047
Local Assistance 22%
$2.490
State Operations
Local Assistance
Capital Outlay
Financial Information, Expenditures (in Billions)
Enacted Budget Transportation Expenditures
FY 2014-15 (in Billions)
Note: Totals may not equal sum of components due to independent rounding. Financial Data - Division of Budgets: Steven Keck, Chief (916) 654-4556
Financial Data - Division of Budgets: Steven Keck, Chief (916) 654-4556
32 33
Fin
an
cia
l Info
rmatio
n F
ina
nc
ial I
nfo
rma
tio
n
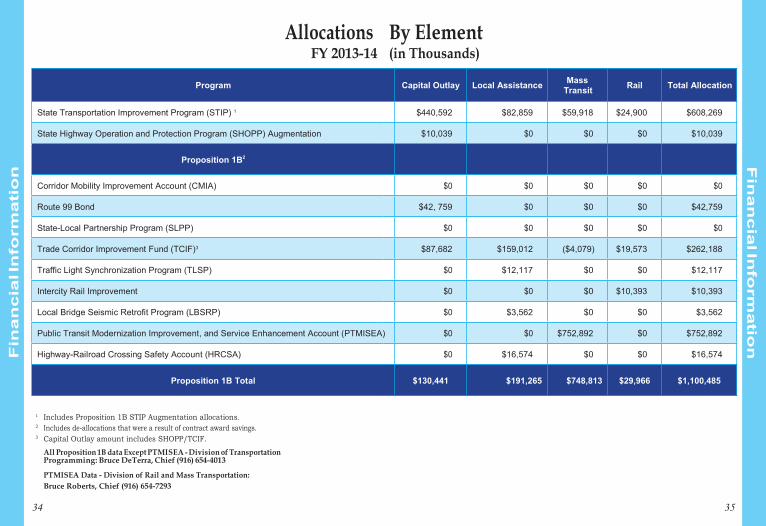
Program
Capital Outlay
Local Assistance Mass
Transit
Rail
Total Allocation
State Transportation Improvement Program (STIP) 1 $440,592 $82,859 $59,918 $24,900 $608,269
State Highway Operation and Protection Program (SHOPP) Augmentation $10,039 $0 $0 $0 $10,039
Proposition 1B2
Corridor Mobility Improvement Account (CMIA) $0 $0 $0 $0 $0
Route 99 Bond $42, 759 $0 $0 $0 $42,759
State-Local Partnership Program (SLPP) $0 $0 $0 $0 $0
Trade Corridor Improvement Fund (TCIF)3 $87,682 $159,012 ($4,079) $19,573 $262,188
Traffic Light Synchronization Program (TLSP) $0 $12,117 $0 $0 $12,117
Intercity Rail Improvement $0 $0 $0 $10,393 $10,393
Local Bridge Seismic Retrofit Program (LBSRP) $0 $3,562 $0 $0 $3,562
Public Transit Modernization Improvement, and Service Enhancement Account (PTMISEA) $0 $0 $752,892 $0 $752,892
Highway-Railroad Crossing Safety Account (HRCSA) $0 $16,574 $0 $0 $16,574
Proposition 1B Total
$130,441
$191,265
$748,813
$29,966
$1,100,485
Allocations FY 2013-14
By Element (in Thousands)
1 2
3
Includes Proposition 1B STIP Augmentation allocations. Includes de-allocations that were a result of contract award savings. Capital Outlay amount includes SHOPP/TCIF.
All Proposition 1B data Except PTMISEA - Division of Transportation Programming: Bruce DeTerra, Chief (916) 654-4013
PTMISEA Data - Division of Rail and Mass Transportation: Bruce Roberts, Chief (916) 654-7293
34 35
Fin
an
cia
l Info
rmatio
n F
ina
nc
ial I
nfo
rma
tio
n
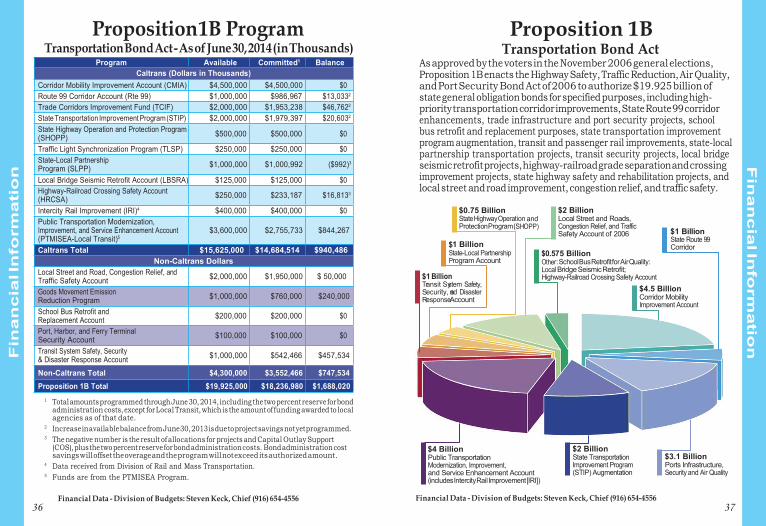
Program Available Committed1 Balance Caltrans (Dollars in Thousands)
Corridor Mobility Improvement Account (CMIA) $4,500,000 $4,500,000 $0 Route 99 Corridor Account (Rte 99) $1,000,000 $986,967 $13,0332
Trade Corridors Improvement Fund (TCIF) $2,000,000 $1,953,238 $46,7622
State Transportation Improvement Program (STIP) $2,000,000 $1,979,397 $20,6032
State Highway Operation and Protection Program (SHOPP) $500,000 $500,000 $0
Traffic Light Synchronization Program (TLSP) $250,000 $250,000 $0 State-Local Partnership Program (SLPP) $1,000,000 $1,000,992 ($992)3
Local Bridge Seismic Retrofit Account (LBSRA) $125,000 $125,000 $0 Highway-Railroad Crossing Safety Account (HRCSA) $250,000 $233,187 $16,8133
Intercity Rail Improvement (IRI)4 $400,000 $400,000 $0 Public Transportation Modernization, Improvement, and Service Enhancement Account (PTMISEA-Local Transit)5
$3,600,000
$2,755,733
$844,267
Caltrans Total $15,625,000 $14,684,514 $940,486 Non-Caltrans Dollars
Local Street and Road, Congestion Relief, and Traffic Safety Account $2,000,000 $1,950,000 $ 50,000
Goods Movement Emission Reduction Program $1,000,000 $760,000 $240,000
School Bus Retrofit and Replacement Account $200,000 $200,000 $0
Port, Harbor, and Ferry Terminal Security Account $100,000 $100,000 $0
Transit System Safety, Security & Disaster Response Account $1,000,000 $542,466 $457,534
Non-Caltrans Total $4,300,000 $3,552,466 $747,534 Proposition 1B Total $19,925,000 $18,236,980 $1,688,020
$2 Billion Local Street and Roads, Congestion Relief, and Traffic Safety Account of 2006
tion SH $1 Billion
State Route 99 Corridor
75 Billion r: School Bus Retrofit for Air Quality: l Bridge Seismic Retrofit; way-Railroad Crossing Safety Account $1
Tr S R
$4.5 Billion Corridor Mobility Improvement Account
$2 Billion State Transportation Improvement Program (STIP) Augmentation
$4 Billion Public Transportation Modernization, Improvement, and Service Enhancement Account (includes Intercity Rail Improvement [IRI])
$3.1 Billion Ports Infrastructure, Security and Air Quality
$ S P
Billion ansit Sy ecurity, a esponse
and
OPP)
$0.5Othe Loca High
$0.75 Billion State Highway Opera Protection Program (
1 Billion tate-Local Partnership rogram Account
stem Safety, nd Disaster Account
Proposition 1B Program Transportation Bond Act - As of June 30, 2014 (in Thousands)
Proposition 1B Transportation Bond Act
As approved by the voters in the November 2006 general elections, Proposition 1B enacts the Highway Safety, Traffic Reduction, Air Quality, and Port Security Bond Act of 2006 to authorize $19.925 billion of state general obligation bonds for specified purposes, including high- priority transportation corridor improvements, State Route 99 corridor enhancements, trade infrastructure and port security projects, school bus retrofit and replacement purposes, state transportation improvement program augmentation, transit and passenger rail improvements, state-local partnership transportation projects, transit security projects, local bridge seismic retrofit projects, highway-railroad grade separation and crossing improvement projects, state highway safety and rehabilitation projects, and local street and road improvement, congestion relief, and traffic safety.
1 Total amounts programmed through June 30, 2014, including the two percent reserve for bond administration costs, except for Local Transit, which is the amount of funding awarded to local agencies as of that date. Increase in available balance from June 30, 2013 is due to project savings not yet programmed. The negative number is the result of allocations for projects and Capital Outlay Support (COS), plus the two percent reserve for bond administration costs. Bond administration cost savings will offset the overage and the program will not exceed its authorized amount. Data received from Division of Rail and Mass Transportation. Funds are from the PTMISEA Program.
2
3
4
5
Financial Data - Division of Budgets: Steven Keck, Chief (916) 654-4556 Financial Data - Division of Budgets: Steven Keck, Chief (916) 654-4556 36 37
Fin
an
cia
l Info
rmatio
n F
ina
nc
ial I
nfo
rma
tio
n
Annual Maintenance and Repair of Bridges $165.2
Non-Landscaped Weed Control $19.8
Maintenance of Landscaped Property (36,084 irrigated, 3,341 non-irrigated landscape acres)
$66.8
Litter and Debris Removal $62.7
Safety Roadside Maintenance and Cleanup (87 Roadside Rests Statewide)
$12.8
Highway Lighting1 (79,338 luminaires) $28.5
Highway Signalized Intersections1
(4,724 total highway signalized intersections) $13.4
Lane Striping (81,071 linear miles) $11.0
Roadbed (HM 1) $329.8 22%
Roadside (HM 2) $306.8 21%
Bridges/Structures (HM 3) $165.2 11%
Traffic Guidance and Electrical (HM 4) $123.4 8%
Facility and Auxiliary Services (HM 5) $147.4 10%
Snow and Storm Control (HM 6) $37.8 3%
Radio (HM 7) $34.4 2%
Total $1479.3 100%
Volunteer Adoptions 2,339
Sponsored Adoptions 779
Suspended Permits (still active, under construction, etc.) 63
Total Adoptions 3,181
Litter Removal Groups 2,780
Graffiti Removal Groups 39
Wildflower Groups 15
Tree Planting Groups 40
Vegetation Management Groups 244
Estimated Shoulder Miles Adopted for Litter Removal 10,178
Amount of Litter Collected (cubic yards) in FY 2013-14 16,134
Estimated Acreage for: Wildflower Vegetation Management Tree Planting
45
1,220 120
Estimated Participants 13,681
Estimated Value of Litter Collection to the State $20.52 Million
Selected Maintenance Costs FY 2013-14 Actual Expenditures and Encumbrances (in Millions)
Adopt-A-Highway Program as of July 30, 2014
1Maintenance and power costs included, cost does not include utility bills paid directly by Locals.
General Maintenance 1
FY 2013-14 Actual Expenditures and Encumbrances (in Millions)
Adopt-A-Highway Data - Division of Maintenance: Tony Tavares, Chief (916) 654-5849
Roadside Vista Points1 ..................................................................................................................... 146 Roadside Rest Areas2 ................................................................................................... 87
1 Park and Rides and Vista Points are “location types” not adoption types, therefore they are not tracked separately. For example, a litter removal adoption may be located at a park and ride. Adoptions are not permitted at rest areas. Roadside Data - Division of Design: Tim Craggs, Chief (916) 654-3858
1 Includes: Highway Maintenance (HM) contracts, and State forces for Personal Services (PS) and Operating Expenses (OE). Maintenance Data - Division of Maintenance: Tony Tavares, Chief (916) 654-5849
2
38 39
Ma
inte
na
nc
e, O
pe
ratio
ns
, an
d P
roje
ct D
eliv
ery
Ma
inte
na
nc
e,
Op
era
tio
ns
, a
nd
Pro
jec
t D
eli
ve
ry
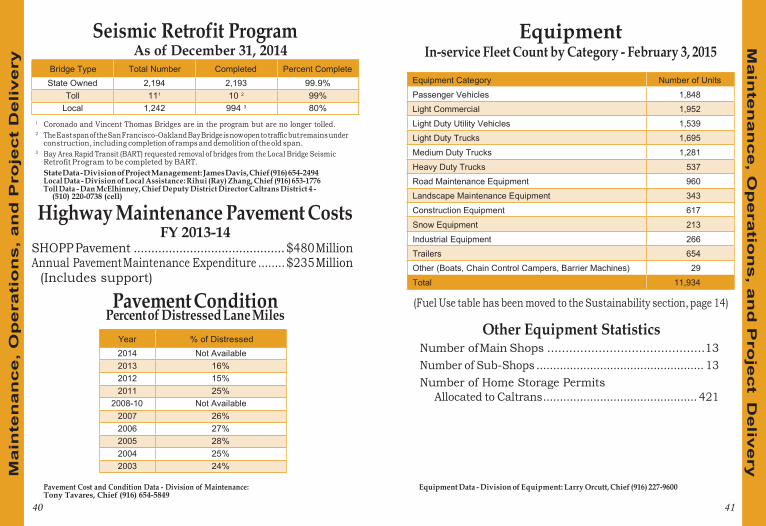
Bridge Type Total Number Completed Percent Complete State Owned 2,194 2,193 99.9%
Toll 111 10 2 99% Local 1,242 994 3 80%
Year % of Distressed 2014 Not Available 2013 16% 2012 15% 2011 25%
2008-10 Not Available 2007 26% 2006 27% 2005 28% 2004 25% 2003 24%
Equipment Category Number of Units Passenger Vehicles 1,848 Light Commercial 1,952 Light Duty Utility Vehicles 1,539 Light Duty Trucks 1,695 Medium Duty Trucks 1,281 Heavy Duty Trucks 537 Road Maintenance Equipment 960 Landscape Maintenance Equipment 343 Construction Equipment 617 Snow Equipment 213 Industrial Equipment 266 Trailers 654 Other (Boats, Chain Control Campers, Barrier Machines) 29 Total 11,934
Seismic Retrofit Program As of December 31, 2014
Equipment In-service Fleet Count by Category - February 3, 2015
1 Coronado and Vincent Thomas Bridges are in the program but are no longer tolled. The East span of the San Francisco-Oakland Bay Bridge is now open to traffic but remains under construction, including completion of ramps and demolition of the old span. Bay Area Rapid Transit (BART) requested removal of bridges from the Local Bridge Seismic Retrofit Program to be completed by BART. State Data - Division of Project Management: James Davis, Chief (916) 654-2494 Local Data - Division of Local Assistance: Rihui (Ray) Zhang, Chief (916) 653-1776 Toll Data - Dan McElhinney, Chief Deputy District Director Caltrans District 4 -
2
3
(510) 220-0738 (cell)
Highway Maintenance Pavement Costs FY 2013-14
SHOPP Pavement ........................................... $480 Million Annual Pavement Maintenance Expenditure ........ $235 Million
(Includes support)
Pavement Condition (Fuel Use table has been moved to the Sustainability section, page 14)
Other Equipment Statistics Number of Main Shops ........................................... 13 Number of Sub-Shops .................................................. 13 Number of Home Storage Permits
Allocated to Caltrans .............................................. 421
Percent of Distressed Lane Miles
Pavement Cost and Condition Data - Division of Maintenance: Tony Tavares, Chief (916) 654-5849
Equipment Data - Division of Equipment: Larry Orcutt, Chief (916) 227-9600
40 41
Ma
inte
na
nc
e, O
pe
ratio
ns
, an
d P
roje
ct D
eliv
ery
Ma
inte
na
nc
e,
Op
era
tio
ns
, a
nd
Pro
jec
t D
eli
ve
ry
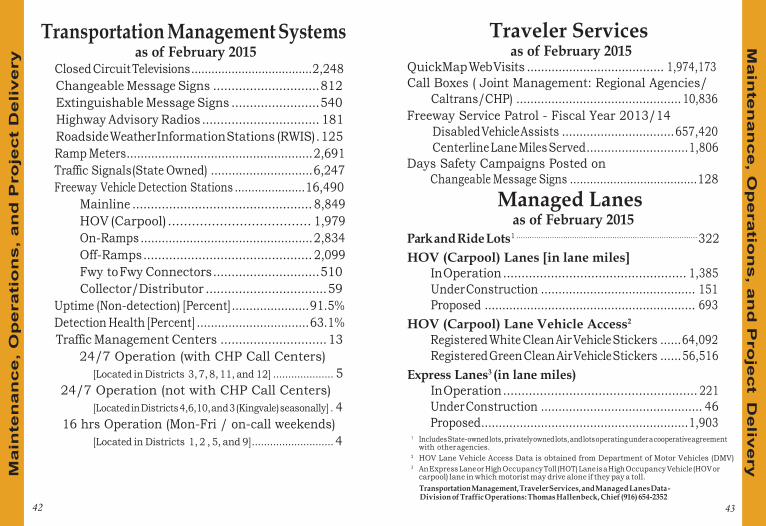
Traveler Services as of February 2015
QuickMap Web Visits ....................................... 1,974,173 Call Boxes ( Joint Management: Regional Agencies/
Caltrans/CHP) ............................................... 10,836 Freeway Service Patrol - Fiscal Year 2013/14
Disabled Vehicle Assists ................................ 657,420 Centerline Lane Miles Served ............................. 1,806
Days Safety Campaigns Posted on Changeable Message Signs ...................................... 128
Managed Lanes as of February 2015
Park and Ride Lots1 ................................................................................. 322 HOV (Carpool) Lanes [in lane miles]
In Operation .................................................. 1,385 Under Construction ............................................ 151 Proposed ............................................................ 693
HOV (Carpool) Lane Vehicle Access2
Registered White Clean Air Vehicle Stickers ...... 64,092 Registered Green Clean Air Vehicle Stickers ...... 56,516
Express Lanes3 (in lane miles) In Operation ..................................................... 221 Under Construction .............................................. 46 Proposed ........................................................... 1,903
Transportation Management Systems as of February 2015
Closed Circuit Televisions .................................... 2,248 Changeable Message Signs ............................. 812 Extinguishable Message Signs ........................ 540 Highway Advisory Radios ................................ 181 Roadside Weather Information Stations (RWIS) . 125 Ramp Meters ..................................................... 2,691 Traffic Signals (State Owned) ............................. 6,247 Freeway Vehicle Detection Stations ..................... 16,490
Mainline ................................................. 8,849 HOV (Carpool) .................................... 1,979 On-Ramps ................................................. 2,834 Off-Ramps .............................................. 2,099 Fwy to Fwy Connectors ............................. 510 Collector/Distributor ................................. 59
Uptime (Non-detection) [Percent] ...................... 91.5% Detection Health [Percent] ................................ 63.1% Traffic Management Centers ............................. 13
24/7 Operation (with CHP Call Centers) [Located in Districts 3, 7, 8, 11, and 12] .................... 5
24/7 Operation (not with CHP Call Centers) [Located in Districts 4,6,10, and 3 (Kingvale) seasonally] . 4
16 hrs Operation (Mon-Fri / on-call weekends) [Located in Districts 1, 2 , 5, and 9] ........................... 4 Includes State-owned lots, privately owned lots, and lots operating under a cooperative agreement
with other agencies. HOV Lane Vehicle Access Data is obtained from Department of Motor Vehicles (DMV) An Express Lane or High Occupancy Toll (HOT) Lane is a High Occupancy Vehicle (HOV or carpool) lane in which motorist may drive alone if they pay a toll. Transportation Management, Traveler Services, and Managed Lanes Data - Division of Traffic Operations: Thomas Hallenbeck, Chief (916) 654-2352
43
1
2
3
42
Ma
inte
na
nc
e, O
pe
ratio
ns
, an
d P
roje
ct D
eliv
ery
Ma
inte
na
nc
e,
Op
era
tio
ns
, a
nd
Pro
jec
t D
eli
ve
ry
Year
Collisions Number of Fatalities
Number of Injuries Total Fatal Injury
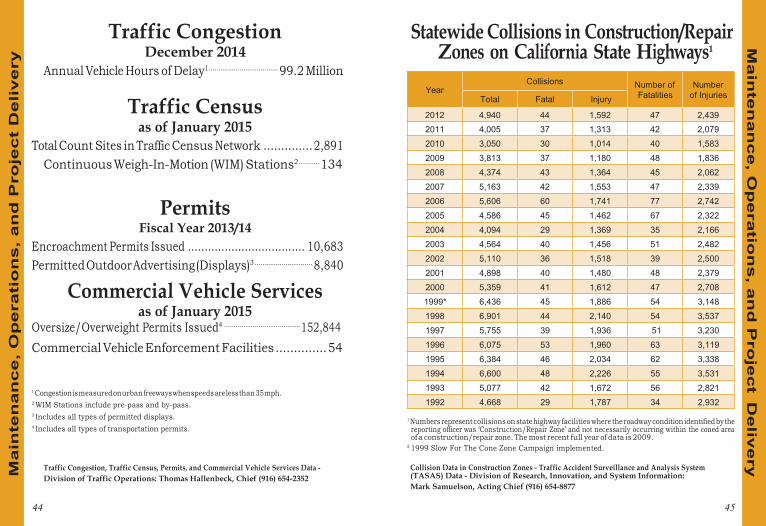
2012 4,940 44 1,592 47 2,439 2011 4,005 37 1,313 42 2,079 2010 3,050 30 1,014 40 1,583 2009 3,813 37 1,180 48 1,836 2008 4,374 43 1,364 45 2,062 2007 5,163 42 1,553 47 2,339 2006 5,606 60 1,741 77 2,742 2005 4,586 45 1,462 67 2,322 2004 4,094 29 1,369 35 2,166 2003 4,564 40 1,456 51 2,482 2002 5,110 36 1,518 39 2,500 2001 4,898 40 1,480 48 2,379 2000 5,359 41 1,612 47 2,708 1999* 6,436 45 1,886 54 3,148 1998 6,901 44 2,140 54 3,537 1997 5,755 39 1,936 51 3,230 1996 6,075 53 1,960 63 3,119 1995 6,384 46 2,034 62 3,338 1994 6,600 48 2,226 55 3,531 1993 5,077 42 1,672 56 2,821 1992 4,668 29 1,787 34 2,932
Traffic Congestion December 2014
Annual Vehicle Hours of Delay1 .................................... 99.2 Million
Statewide Collisions in Construction/Repair Zones on California State Highways1
Traffic Census as of January 2015
Total Count Sites in Traffic Census Network .............. 2,891 Continuous Weigh-In-Motion (WIM) Stations2 .......... 134
Permits Fiscal Year 2013/14
Encroachment Permits Issued ................................... 10,683 Permitted Outdoor Advertising (Displays)3 .............................. 8,840
Commercial Vehicle Services as of January 2015
Oversize/Overweight Permits Issued4 ........................................ 152,844 Commercial Vehicle Enforcement Facilities .............. 54
1 Congestion is measured on urban freeways when speeds are less than 35 mph. 2 WIM Stations include pre-pass and by-pass. 3 Includes all types of permitted displays. 4 Includes all types of transportation permits.
1 Numbers represent collisions on state highway facilities where the roadway condition identified by the reporting officer was ‘Construction/Repair Zone’ and not necessarily occurring within the coned area of a construction/repair zone. The most recent full year of data is 2009.
2 1999 Slow For The Cone Zone Campaign implemented.
Traffic Congestion, Traffic Census, Permits, and Commercial Vehicle Services Data - Division of Traffic Operations: Thomas Hallenbeck, Chief (916) 654-2352
Collision Data in Construction Zones - Traffic Accident Surveillance and Analysis System (TASAS) Data - Division of Research, Innovation, and System Information: Mark Samuelson, Acting Chief (916) 654-8877
44 45
Ma
inte
na
nc
e, O
pe
ratio
ns
, an
d P
roje
ct D
eliv
ery
Ma
inte
na
nc
e,
Op
era
tio
ns
, a
nd
Pro
jec
t D
eli
ve
ry
Year
Collisions Number of Fatality Rate (Per
100 MVM1) Total Fatal Injury Fatalities Injuries
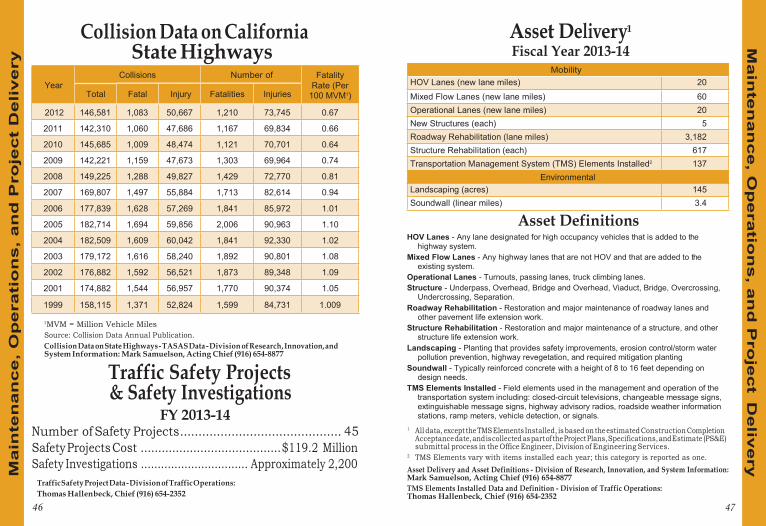
2012 146,581 1,083 50,667 1,210 73,745 0.67
2011 142,310 1,060 47,686 1,167 69,834 0.66
2010 145,685 1,009 48,474 1,121 70,701 0.64
2009 142,221 1,159 47,673 1,303 69,964 0.74
2008 149,225 1,288 49,827 1,429 72,770 0.81
2007 169,807 1,497 55,884 1,713 82,614 0.94
2006 177,839 1,628 57,269 1,841 85,972 1.01
2005 182,714 1,694 59,856 2,006 90,963 1.10
2004 182,509 1,609 60,042 1,841 92,330 1.02
2003 179,172 1,616 58,240 1,892 90,801 1.08
2002 176,882 1,592 56,521 1,873 89,348 1.09
2001 174,882 1,544 56,957 1,770 90,374 1.05
1999 158,115 1,371 52,824 1,599 84,731 1.009
Mobility HOV Lanes (new lane miles) 20 Mixed Flow Lanes (new lane miles) 60 Operational Lanes (new lane miles) 20 New Structures (each) 5 Roadway Rehabilitation (lane miles) 3,182 Structure Rehabilitation (each) 617 Transportation Management System (TMS) Elements Installed2 137
Environmental Landscaping (acres) 145 Soundwall (linear miles) 3.4
Collision Data on California State Highways
Asset Delivery1
Fiscal Year 2013-14
Asset Definitions HOV Lanes - Any lane designated for high occupancy vehicles that is added to the
highway system. Mixed Flow Lanes - Any highway lanes that are not HOV and that are added to the
existing system. Operational Lanes - Turnouts, passing lanes, truck climbing lanes. Structure - Underpass, Overhead, Bridge and Overhead, Viaduct, Bridge, Overcrossing,
Undercrossing, Separation. Roadway Rehabilitation - Restoration and major maintenance of roadway lanes and
other pavement life extension work. Structure Rehabilitation - Restoration and major maintenance of a structure, and other
structure life extension work. Landscaping - Planting that provides safety improvements, erosion control/storm water
pollution prevention, highway revegetation, and required mitigation planting Soundwall - Typically reinforced concrete with a height of 8 to 16 feet depending on
design needs. TMS Elements Installed - Field elements used in the management and operation of the
transportation system including: closed-circuit televisions, changeable message signs, extinguishable message signs, highway advisory radios, roadside weather information stations, ramp meters, vehicle detection, or signals.
1MVM = Million Vehicle Miles Source: Collision Data Annual Publication. Collision Data on State Highways - TASAS Data - Division of Research, Innovation, and System Information: Mark Samuelson, Acting Chief (916) 654-8877
Traffic Safety Projects & Safety Investigations
FY 2013-14 Number of Safety Projects ............................................ 45 Safety Projects Cost ........................................ $119.2 Million Safety Investigations ................................ Approximately 2,200
Traffic Safety Project Data - Division of Traffic Operations: Thomas Hallenbeck, Chief (916) 654-2352
46
1 All data, except the TMS Elements Installed, is based on the estimated Construction Completion Acceptance date, and is collected as part of the Project Plans, Specifications, and Estimate (PS&E) submittal process in the Office Engineer, Division of Engineering Services. TMS Elements vary with items installed each year; this category is reported as one. 2
Asset Delivery and Asset Definitions - Division of Research, Innovation, and System Information: Mark Samuelson, Acting Chief (916) 654-8877 TMS Elements Installed Data and Definition - Division of Traffic Operations: Thomas Hallenbeck, Chief (916) 654-2352
47
Ma
inte
na
nc
e, O
pe
ratio
ns
, an
d P
roje
ct D
eliv
ery
Ma
inte
na
nc
e,
Op
era
tio
ns
, a
nd
Pro
jec
t D
eli
ve
ry
Booklet Frequently Asked Questions Is the Executive Fact Booklet (EFB) available online?
The EFB is available on our internal website at: http://onramp.dot.ca.gov/docs/ExecutiveFactBooklet.pdf The booklet is available on the internet at: http://www.dot.ca.gov/hq/tsip/data_library/EFB/2015_EFB.pdf
Appendix
Appendix .............................................. 48-53 Booklet Frequently Asked Questions ............ 49 Web Resources .................................... 50-51 Caltrans District Offices
and District Directors ............................. 52-53 What years are reported in the EFB?
Each division or program reports the latest data they have available. Data are reported using California (State) Fiscal Years or calendar years if years are noted singularly. If Federal Fiscal years are used, this is noted on the table as FFY.
What is the current production schedule for the EFB? The EFB is scheduled to be produced approximately the fifth month of the calendar year.
Who maintains final production approval? Caltrans Division of Public Affairs
Who is in charge of compilation and production of the EFB? Division of Research, Innovation, and System Information: Mark Samuelson, Acting Chief (916) 654-8877
Contacts: Paulette Lautaret ............................................... (916) 657-4726
[email protected] Jahangir Kashkooli ............................................ (916) 654-8170
48 49
Fre
qu
en
tly A
sk
ed
Qu
es
tion
s
Ap
pen
dix
Web Resources Caltrans Projects
www.dot.ca.gov/projects.htm Caltrans Statewide Press Releases
www.dot.ca.gov/hq/paffairs/news/pressrel/ Contract Awards Services
dot.ca.gov/hq/esc/oe/contract_awards_services.html Environmental Analysis
Caltrans’ Internet Home: External Caltrans site www.dot.ca.gov
Caltrans’ Intranet Home: Internal Caltrans site onramp.dot.ca.gov
Accounting: CT Travel Guide/Vendor Pmts/EFT/ www.dot.ca.gov/hq/asc/index.htm
Active Transportation Program (ATP) www.dot.ca.gov/hq/LocalPrograms/atp/ www.dot.ca.gov/hq/env
Live Traffic Cameras: State freeway roadside monitoring video.dot.ca.gov
Local Assistance District Contacts www.dot.ca.gov/hq/LocalPrograms/dlae.htm
Local Assistance Program Information www.dot.ca.gov/hq/LocalPrograms/programInformation.htm
MAP-21(Moving Ahead for Progress in the 21st Century) Programming - dot.ca.gov/hq/transprog/map21.htm Nat’l Hwy System - dot.ca.gov/hq/tsip/hseb/map21nhs.html
Mile Marker: A Caltrans Performance Report dot.ca.gov/ctjournal/MileMarker/index.html
Public Mailing Lists - Send messages to members/subscribe lists.dot.ca.gov/mailman/listinfo
QuickMap - Real-time Traffic Google Map quickmap.dot.ca.gov
Standard Environmental Reference (SER) Environmental document Procedures - www.dot.ca.gov/ser/
State Planning (CA Transp Plan, CA Interregional Blueprint) www.dot.ca.gov/hq/tpp/offices/osp/index.html
Traffic Census-Traffic Volumes-Monthly Vehicle Miles of Travel traffic-counts.dot.ca.gov
Work Zone Safety: “Slow for the Cone Zone” travel trips www.dot.ca.gov/hq/maint/workzone/
Caltrans Improvement Project www.dot.ca.gov/CIP/
Adopt-A-Hwy Program: Organizations help maintain sections adopt-a-highway.dot.ca.gov
Advertised Projects: Projects for bid www.dot.ca.gov/hq/esc/oe/weekly_ads/index.php
Alternative Fuels Locator: US Dept of Energy www.afdc.energy.gov/locator/stations/
Amtrak California: Timetables/Stations/Routes/Deals www.amtrak.com/home/
Aviation Planning/Engineering/Permits/Grants www.dot.ca.gov/hq/planning/aeronaut/
CA Transportation Commission: Hwy/Passenger Rail/Transit Improvements in CA - www.catc.ca.gov
California Road System (CRS) Maps www.dot.ca.gov/hq/tsip/hseb/crs_maps/
California Transportation Plan (CTP) www.dot.ca.gov/hq/tpp/californiatransportationplan2040/index.shtml
Caltrans Construction Contract Standards www.dot.ca.gov/hq/esc/oe/standards.php
Caltrans Earth Web-based Transportation Database www.dot.ca.gov/hq/tsip/gis/caltrans_earth/overview.php
Caltrans Improvement Project http://www.dot.ca.gov/CIP/
Caltrans Local Offices dot.ca.gov/localoffice.htm
Caltrans Performance Measurement System (PeMS) Traffic data - pems.dot.ca.gov/
50 51
Ca
ltran
s W
eb
Res
ou
rce
s C
alt
ran
s W
eb
Res
ou
rce
s
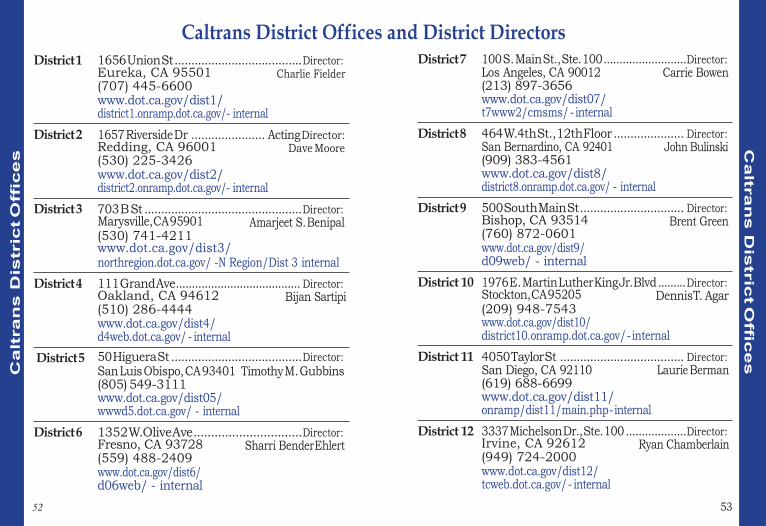
Caltrans District Offices and District Directors District 7 100 S. Main St., Ste. 100 .......................... Director: District 1 1656 Union St ...................................... Director:
Los Angeles, CA 90012 (213) 897-3656 www.dot.ca.gov/dist07/ t7www2/cmsms/ - internal
Carrie Bowen Eureka, CA 95501 (707) 445-6600 www.dot.ca.gov/dist1/ district1.onramp.dot.ca.gov/- internal
Charlie Fielder
District 8 464 W. 4th St., 12th Floor ..................... Director: District 2 1657 Riverside Dr ...................... Acting Director: San Bernardino, CA 92401 (909) 383-4561 www.dot.ca.gov/dist8/ district8.onramp.dot.ca.gov/ - internal
John Bulinski Redding, CA 96001 (530) 225-3426 www.dot.ca.gov/dist2/ district2.onramp.dot.ca.gov/- internal
Dave Moore
District 9 500 South Main St ............................... Director: District 3 703 B St ............................................... Director: Bishop, CA 93514 (760) 872-0601 www.dot.ca.gov/dist9/ d09web/ - internal
Brent Green Marysville, CA 95901 (530) 741-4211
Amarjeet S. Benipal
www.dot.ca.gov/dist3/ northregion.dot.ca.gov/ -N Region/Dist 3 internal
District 10 1976 E. Martin Luther King Jr. Blvd ......... Director: District 4 111 Grand Ave ....................................... Director: Stockton, CA 95205 (209) 948-7543
Dennis T. Agar Oakland, CA 94612 (510) 286-4444 www.dot.ca.gov/dist4/ d4web.dot.ca.gov/ - internal
Bijan Sartipi
www.dot.ca.gov/dist10/ district10.onramp.dot.ca.gov/ - internal
District 11 4050 Taylor St ..................................... Director: District 5 50 Higuera St ....................................... Director: San Luis Obispo, CA 93401 Timothy M. Gubbins (805) 549-3111 www.dot.ca.gov/dist05/ wwwd5.dot.ca.gov/ - internal
San Diego, CA 92110 (619) 688-6699 www.dot.ca.gov/dist11/ onramp/dist11/main.php - internal
Laurie Berman
District 12 3337 Michelson Dr., Ste. 100 ................... Director: District 6 1352 W. Olive Ave ............................... Director: Irvine, CA 92612 (949) 724-2000 www.dot.ca.gov/dist12/ tcweb.dot.ca.gov/ - internal
Ryan Chamberlain Fresno, CA 93728 (559) 488-2409 www.dot.ca.gov/dist6/ d06web/ - internal
Sharri Bender Ehlert
52 53
Ca
ltran
s D
istric
t Offic
es
Ca
ltra
ns
Dis
tric
t O
ffic
es
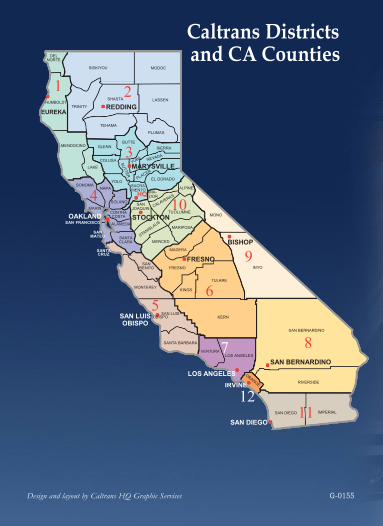
Caltrans Districts and CA Counties DEL
NORTE
SISKIYOU MODOC
1 HUMBOLDT
2 SHASTA LASSEN
TRINITY REDDING EUREKA
TEHAMA
PLUMAS
BUTTE
3 MENDOCINO GLENN SIERRA
COLUSA
MARYSVILLE LAKE
EL DORADO YOLO SONOMA
4 SACRA- ALPINE NAPA MENTO AMA- HQ DOR
SAN JOAQUIN 10 SOLANO
MARIN
OAKLAND SAN FRANCISCO
CONTRA COSTA
TUOLUMNE STOCKTON MONO
ALAMEDA MARIPOSA
SAN MATEO SANTA
CLARA MERCED BISHOP
FRESNO 9 INYO
SANTA CRUZ
MADERA
SAN BENITO FRESNO
TULARE
6 MONTEREY KINGS
5 SAN LUIS SAN LUIS OBISPO
OBISPO KERN
SAN BERNARDINO
8 SAN BERNARDINO
VENTURA 7 SANTA BARBARA
LOS ANGELES
LOS ANGELES RIVERSIDE IRVINE
12 SAN DIEGO 11 IMPERIAL
SAN DIEGO
Design and layout by Caltrans HQ Graphic Services G-0155


![Sacramento-San Joaquin Delta Regional Ecosystem ... › Issues › fish › DeltaSmelt-1[1].pdf · Sacramento-San Joaquin Delta Regional Ecosystem Restoration Implementation Plan](https://img.pdfslide.us/doc/110x75/5f1fc9f6b0ee6d10ab1c372f/sacramento-san-joaquin-delta-regional-ecosystem-a-issues-a-fish-a-deltasmelt-11pdf.jpg)