Embed Size (px)
Citation preview
Executive Compensation*
Kevin J. MurphyMarshall School of Business
University of Southern California
June 1999
Abstract
This paper summarizes the empirical and theoretical research on executivecompensation and provides a comprehensive and up-to-date description of paypractices (and trends in pay practices) for chief executive officers (CEOs). Topicsdiscussed include the level and structure of CEO pay (including detailed analysesof annual bonus plans, executive stock options, and option valuation),international pay differences, the pay-setting process, the relation between CEOpay and firm performance (“pay-performance sensitivities”), the relation betweensensitivities and subsequent firm performance, relative performance evaluation,executive turnover, and the politics of CEO pay.
Keywords: Executive compensation, incentives, agency theory, turnover,managerial labor market
*This research has been influenced significantly by my co-authors Michael Jensen, Robert Gibbons, JeroldZimmerman, and George Baker, and also by Sherwin Rosen, Ed Lazear, and Karen Wruck. I also thank mypractitioner-colleagues from Towers Perrin, including Michael Carter, Brian Dunn, Julie Kohler, Gary Locke,Paula Todd, Peter Watson, and especially Michael Davis. In addition, I am grateful for helpful comments on anearlier draft from Rajesh Aggarwal, James Brickley, Jennifer Carpenter, Harry DeAngelo, Linda DeAngelo,Joetta Forsyth, Robert Gibbons, Kevin Hallock, Joseph Haubrich, David Hirshliefer, Bengt Holmstrom,Takao Kato, Charles O’Reilly, Paul Oyer, Darius Palia, Robert Parrino, Karen Van Nuys, David Yermack,Mark Zenner, and Jerry Zimmerman.

Executive Compensation
by
Kevin J. Murphy
I. Introduction
Few issues in the history of the modern corporation have attracted the attention garnered
by executive compensation in United States companies. Once relegated to the relative obscurity
of business periodicals, executive pay has become a international issue debated in Congress
and routinely featured in front-page headlines, cover stories, and television news shows.
Several inextricably linked factors have contributed to the widespread interest in executive pay.
First is the undisputed escalation in chief executive officer (CEO) compensation: as shown in
Figure 1, the median cash compensation paid to S&P 500 CEOs has more than doubled since
1970 (in 1996-constant dollars), and median total realized compensation (including gains from
exercising stock options) has nearly quadrupled. Second is the populist attack on wealth that
followed the so-called “excesses of the 1980s,” associated with the perception that high CEO
salaries are coupled to layoffs, plant closings, and corporate downsizing (Murphy, 1995,
1997). Third is the bull market of the 1990s, creating windfalls for CEOs whose pay is
increasingly tied to company stock-price performance.
There has also been an explosion in academic research on executive compensation. As
evident in Figure 1, CEO pay research has grown even faster than CEO paychecks,
skyrocketing from 1-2 papers per year prior to 1985 to sixty papers in 1995.1 Only a handful
of studies of executive compensation were published prior to 1980, including pioneering
works by Roberts (1956), Baumol (1959), and Lewellen and Huntsman (1970). Most early
studies focused on whether pay was more closely tied to company size or company profits, the
answer proving to be both relatively uninteresting and hopelessly lost in multicollinearity
problems (Ciscel and Carroll, 1980; Rosen, 1992).
The modern history of executive compensation research began in the early 1980s and
paralleled the emergence and general acceptance of agency theory.2 The separation of
ownership and control in modern corporations is, after all, the quintessential agency problem 1 Data on executive compensation papers from Hallock and Murphy (1999), based initially on a search of the
Social Science Citation Index database. The 1985 jump in executive pay studies can be traced directly to a1984 University of Rochester conference on “Managerial Compensation and the Managerial Labor Market;”proceedings published the following year in the Journal of Accounting and Economics.
2 Influential papers include Jensen and Meckling (1976), Mirrlees (1974, 1976), Ross (1973), Holmstrom(1979, 1982), Fama (1980), Lazear and Rosen (1981), and Grossman and Hart (1983).

JUNE 1999 EXECUTIVE COMPENSATION PAGE 2
suggested by Berle and Means (1932) and formalized by Jensen and Meckling (1976), and the
executive labor market is a natural laboratory for testing its implications. Early studies in this
area focused on documenting the relation between CEO pay and company performance
(Coughlan and Schmidt, 1985; Murphy, 1985, 1986; Jensen and Murphy, 1990a; Abowd,
1990; Leonard, 1990). Others examined whether CEOs are terminated following poor
performance (Weisbach, 1988; Warner, Watts, and Wruck, 1988) and whether CEOs are
reward for performance measured relative to the market or industry (Antle and Smith, 1986;
Gibbons and Murphy, 1990).
The evolving literature has been truly interdisciplinary, spanning accounting, economics,
finance, industrial relations, law, organizational behavior, and strategy. Accountants, for
example, have explored whether accounting-based bonuses lead managers to manipulate
earnings and have compared the relative efficacy of accounting-based and stock-based
performance measures.3 Financial economists have studied the association between executive
compensation and corporate performance, investment decisions, capital structure, dividend
policies, mergers, and diversification.4 Industrial organization economists have documented
the effects of regulation and deregulation on executive compensation, and have examined the
game-theoretic effects of strategic interactions on compensation policy.5 While most research
in the area has evolved as tests or applications of agency theory, sociologists and
organizational behaviorists have examined non-agency-theoretic issues such as social
comparisons and the behavioral effects of wage dispersion. 6
In spite of the exploding interdisciplinary literature, executive compensation has received
relatively scant attention from labor economists.7 However, even though the managerial labor
market is small and specialized, there are ample reasons to encourage labor-oriented research in
the area. Executive compensation offers opportunities to analyze many concepts central to labor
economics, including incentives, marginal productivity, contracts, promotions, separations,
3 The seminal article on earnings manipulation is Healy (1985); see also Pourciau (1993) and Holthausen,
Larcker, and Sloan (1995). Lambert and Larcker (1988), Sloan (1993), Bushman and Indjejikian (1993), andBaiman and Verrecchia (1995) analyze accounting-based vs. stock-based performance measures.
4 See, for example, Agrawal and Mandelker (1987) on financing decisions, John and John (1993) on capitalstructure, Agrawal and Walkling (1994) on takeovers, Mehran, Nogler, and Schwartz (1998) on liquidationpolicy, and Lambert (1986), Campbell, Chan, and Marino (1989), Smith and Watts (1992), Hirshleifer andSuh (1992), and Bizjak, Brickley, and Coles (1993) on investment behavior.
5 See, for example, Carroll and Ciscel (1982), Hubbard and Palia (1995), Joskow, Rose and Wolfram (1996)on regulation and compensation, and Aggrawal and Samwick (1997) and Kedia (1997) on strategicinteractions.
6 See, for example, O’Reilly, Main and Crystal (1988), Tosi and Gomez-Mejia (1989, 1994), Virany,Tushman, and Romanelli (1992), Boeker (1992), Cowherd and Levine (1992), Hambrick and Cannella(1993), Finkelstein (1996), O’Reilly C., Wade, and Pollock (1998), and Hambrick and Siegel (1998).
7 A notable exception is the proceedings from a conference on “Do Incentives Matter” published as asupplement to the 1990 Industrial and Labor Relations Review.

JUNE 1999 EXECUTIVE COMPENSATION PAGE 3
and careers. Although compensation contracts are multi-dimensional and complex, the publicly
available data are relatively clean: detailed biographic and compensation data for individual
executives in publicly owned corporations are widely available and easily matched to company
performance data. In addition, an increasing number of researchers are gaining access to
proprietary and increasingly rich data on performance measures and bonus contracts and on
individual compensation far below the top executive rank.8
The objective of this paper is to foster research in executive compensation by providing a
rich and up-to-date description of executive incentive contracts, and by reviewing and updating
much of the relevant empirical and theoretical research on executive compensation and
turnover. The institutional details, summary statistics, and regression analyses are based on a
variety of sources including four comprehensive databases: the Annual Compensation Surveys
published in Forbes covering 1970 to 1996, Compustat’s “ExecuComp” database covering
CEOs in the S&P 500, the S&P Mid-Cap 400, and the S&P Small-Cap 600 from 1992
through 1996, detailed data from 1,000 large companies in 1992 based on an analysis of
corporate proxy statements, and a proprietary survey of bonus plans in 177 large companies
conducted by Towers Perrin in 1996. In addition, I report international comparisons of
executive pay practices based on Towers Perrin’s 1997 Worldwide Total Remuneration
survey. An emerging lesson from the analyses is that it matters where you look and when you
look: there is a great deal of heterogeneity in pay practices across firms, industries, and
countries, and there have been dramatic shifts in pay practices across time.
Section II analyzes the level and structure of executive compensation packages, and
serves as a primer on executive compensation. Most executive pay packages contain four basic
components: a base salary, an annual bonus tied to accounting performance, stock options, and
long-term incentive plans (including restricted stock plans and multi-year accounting-based
performance plans). I begin this section with a descriptive analysis of how the level and
composition of CEO pay in the US varies across industries and with company size, and
document the substantial increases in CEO pay between 1992 and 1996. Next, I discuss the
emerging international evidence on executive compensation, contrasting US pay practices with
those in other countries. Then, I consider each component of pay in detail, describing how
salaries are set, how annual and multi-year bonus arrangements are structured, and how stock
options are awarded and valued. Particular attention is devoted to describing the performance
measures, performance standards, and pay-performance structures used in annual incentive
plans. Finally, I analyze the relative influence of the board of directors, the compensation
committee, and managers in determining executive pay practices. 8 Research relying on proprietary data from compensation consulting include Abowd (1990), Leonard (1990),
Holthausen, Larcker, and Sloan (1995), Bushman, Indjejikian, and Smith (1997), and Murphy (1998).

JUNE 1999 EXECUTIVE COMPENSATION PAGE 4
Section III explores the relation between CEO pay and performance. The section begins
with a summary and critique of the traditional principal-agent framework as applied to
executive incentive contracts. Next, I summarize the empirical evidence on the relation between
pay and performance, distinguishing between explicit aspects (CEO pay is explicitly related to
accounting returns through annual bonuses, and to stock-price appreciation through stock
options and restricted stock) and implicit aspects (CEO pay may be implicitly tied to
performance through year-to-year adjustments in salary levels, target bonuses, and option and
restricted stock grant sizes). I show that total pay-performance sensitivities vary with industry
and company size, and document changes in the sensitivities from 1992 through 1996 driven
primarily by increases in stock-options incentives. I also analyze CEO stock ownership from
1987 through 1996, documenting that CEO stock holdings excluding options have increased in
dollar-value but decreased when expressed as a percentage of the company’s outstanding
stock. I then consider the theory and evidence related to relative performance evaluation (RPE)
for top executives: I document the explicit use of RPE in accounting-based bonus plans, and
discuss the virtual absence of RPE in stock option plans. Finally, I describe the evidence on
the effect of CEO pay-performance sensitivities on subsequent company performance.
Section IV considers executive turnover and its relation to company performance. Casual
empiricism, based on several recent highly publicized forced resignations, suggests that CEO
firings have become more commonplace in the 1990s. However, I document that the link
between turnover and performance has declined rather than increased over the past decade. In
addition, I present results suggesting that turnover is driven by executive age and not
performance in the largest firms, and by performance and not (primarily) executive age in
smaller firms. Finally, I document that CEOs have become less likely to depart at “normal”
retirement ages, and show (following Huson, Parrino, and Starks, 1998) that companies are
increasingly likely to replace CEOs through outside hires rather than through internal
promotions.
Section V considers the politics of pay. Public disclosure of executive pay virtually
guarantees that third parties such as rank-and-file employees, labor unions, consumer groups,
Congress, and the media affect the type of contracts written between management and
shareholders. In this section, I analyze the causes and consequences of the ongoing
controversy over CEO pay, and describe the effect of politics and public perception in
determining the structure and level of executive compensation.
Section VI summarizes the emerging stylized facts, and provides some suggestions for
future research in executive compensation. Although the field is fairly well-developed,
researchers have just begun exploring recently available public and proprietary datasets and

JUNE 1999 EXECUTIVE COMPENSATION PAGE 5
exploring the institutional details and the explicit features of executive contracts. The richness
of the compensation and performance data offers many unexploited opportunities for research
in labor economics, finance, accounting, and management.
II. The Level and Structure of Executive Compensation
1. Introduction
Although there is substantial heterogeneity in pay practices across firms and industries,
most executive pay packages contain four basic components: a base salary, an annual bonus
tied to accounting performance, stock options, and long-term incentive plans (including
restricted stock plans and multi-year accounting-based performance plans). In addition,
executives participate in “broad-based” employee benefit plans and also receive special
benefits, including life insurance and supplemental executive retirement plans (SERPs). In
contrast to mid-level management “employment at will” arrangements, top executives
increasingly negotiate formal employment contracts. These formal contracts typically last five
years and specify minimum base salaries, target bonus payments (with or without guarantees),
and severance arrangements in the event of separation or change in corporate control.
Figure 2 illustrates the relative importance of the various components of compensation
for CEOs in the S&P 500, and also documents how the level and composition of pay varies
across years for four industry groups: mining & manufacturing (two-digit SIC codes 10-29);
financial services (SIC 60-69); utilities (SIC 49), and other industries (including wholesale and
retail trade, and service industries). The bar height in each panel depicts median total
compensation in 1996-constant dollars, including salaries, realized bonuses, the grant-date
value of options granted during the year (using ExecuComp’s “modified” Black-Scholes
formula; see the Appendix), restricted stock grants (valued at grant-date face value), payouts
from accounting-based long-term incentive plans, and miscellaneous other compensation. Pay
component percentages are derived from ExecuComp data by computing the percentages for
each CEO, and averaging across CEOs.
Several stylized facts emerge from Figure 2. First, pay levels vary by industry: CEOs in
electric utilities earn significantly lower levels of compensation than their counterparts in other
industries, while CEOs in financial services companies earn higher pay.9 Second, the level of
9 See, for example, Carroll and Ciscel (1982), Murphy (1987), and Joskow, Rose and Wolfram (1996) on
executive compensation in electric utilities. Barro and Barro (1990), Crawford, Ezzell, and Miles (1995) andHubbard and Palia (1995) analyze pay practices in banking; the latter two studies document increases in

JUNE 1999 EXECUTIVE COMPENSATION PAGE 6
compensation has increased substantially between 1992 and 1996: median pay levels (in 1996
constant dollars) for manufacturing CEOs, for example, have increased 55% from $2.0 million
in 1992 to almost $3.2 million in 1996. Over the same time period, median pay in financial
services has increased 53% to $4.6 million, while pay in utilities has increased 34% to $1.5
million. Third, the increase in pay is largely attributable to increases in the grant-date value of
stock option grants.10 During the early 1990s, stock options replaced base salaries as the single
largest component of compensation (in all sectors except utilities). Option grants in
manufacturing firms swelled from 27% to 36% of total compensation, more than doubling in
dollar terms.
Figure 3 depicts the effect of company size on firm pay for industrial companies (defined
as all companies except utilities and financial services). The figure shows pay trends for CEOs
in four size categories: the S&P 500 industrials with above-median sales, S&P 500 industrials
with below-median sales, S&P 400 Mid-Cap Industrials, and S&P 600 Small-Cap Industrials.
Figure 3 shows that the increase in option compensation and the increase in total compensation
holds across size groups. Moreover, the figure illustrates the best-documented stylized fact
regarding CEO pay: CEO pay is higher in larger firms.
It is not surprising that compensation increases with company size; larger firms, for
example, may employ better-qualified and better-paid managers (Rosen, 1982; Kostiuk 1990).
More surprising, at least historically, has been the consistency of the relation across firms and
industries. Baker, Jensen, and Murphy (1988) summarize Conference Board data on the
relation between CEO cash compensation and firm sales from 1973-83 and document pay-sales
elasticities in the .25 to .35 range, implying that a firm that is 10% larger will pay its CEO
about 3% more. Rosen (1992) summarizes academic research covering a variety of industries
and a variety of time periods in both the US and the UK, concluding that the “relative
uniformity [of estimates] across firms, industries, countries, and periods of time is notable and
puzzling because the technology that sustains control and scale should vary across these
disparate units of comparison.”
Recent data suggest that the relation between CEO pay and company size has weakened
over time. Table 1 shows the elasticity of CEO cash compensation to company revenues for
S&P 500 CEOs, by industry group, for five-year periods beginning in 1970 and for the period
1995-96. Pay/sales elasticities for manufacturing firms ranged between .22 and .26 until the
mid-1990s, when the elasticity jumped to .32. Elasticities in financial services firms dropped
CEO pay in banking in the late 1980s and early 1990s (relative to pay in other industries) which theauthors attribute to deregulation.
10 Hall and Liebman (1998) show that the increase in option compensation has increased monotonically sincethe early 1980s.

JUNE 1999 EXECUTIVE COMPENSATION PAGE 7
from .30 in the 1970s to only .09 in the early 1990s (rebounding to .22 in 1995-96);
elasticities in utilities have similarly declined. Moreover, as suggested by the bracketed R-
squares in Table 1, the “explanatory power” of firm sales has declined over time in all
industries.
2. International Comparisons
Figure 4 shows the level and composition of CEO pay in 23 countries, based on data
reported in Towers Perrin’s 1997 Worldwide Total Remuneration report. The data depict the
consulting company’s estimates of “typical” or “competitive” pay for a representative CEO in
an industrial company with approximately US $250 million in annual revenues.11 This firm
size corresponds roughly to US companies in the S&P Small Cap 600, and the level and
structure of CEO pay for the US in Figure 4 is nearly identical to that suggested by Figure 3.12
Figure 4 supports the commonly held view that US executives are paid more than their
international counterparts: the total pay for the representative CEO in the US is more than
double the average total pay elsewhere. More interestingly, the data show that US executives
are paid differently than CEOs elsewhere: US CEOs receive a larger fraction of their pay in the
form of stock options, and a lower fraction in the form of salaries, than any of their global
counterparts. Indeed, stock options (and other long-term incentives) are absent in nine of the
23 countries surveyed, and comprise less than 5% of total pay in 13 of the 23 countries.
There is a growing interest from researchers (as well as practitioners) on the level and
structure of executive compensation outside the United States, including the United Kingdom
(Cosh, 1975; Main, O’Reilly, and Crystal, 1994; Conyon, Gregg, and Machin, 1995; Cosh
and Hughes, 1997; Conyon, 1997), Japan (Kato and Rockel, 1992; Kaplan, 1994a, 1997;
Kato, 1997), Germany (Kaplan, 1994b, 1997), Canada (Zhou, 1999), Spain (Angel and
Fumás, 1997), Italy (Brunello, Graziano, and Parigi, 1999), Denmark (Eriksson and Lausten,
1996), China (Groves, Hong, McMillan, and Naughton, 1995) and Bulgaria (Jones and Kato,
1996). Although many of the country-specific studies attempt international comparisons (for
example, Conyon and Schwalbach, 1997, contrast pay practices within ten European
countries), such comparisons are made difficult by substantial heterogeneity in (1) available
data; (2) regression specifications (including definitions of the dependent and independent
11 In conducting this survey, Towers Perrin asked executive pay consultants in each of the 23 countries
represented in Figure 4 to use local-market conditions to formulate competitive pay recommendations for ahypothetical CEO in a $250 million industrial company, as of April 1, 1997. Survey responses in localcurrencies are converted into US dollars using April 1977 exchange rates.
12 In particular, the median CEO in the S&P Small-Cap 600 (Figure 3) has total 1996 compensation of$898,000, comprised of salaries (44%), bonuses (18%), options (30%), and other (9%). In comparison, therepresentative CEO in Figure 4 has total compensation of $901,000, comprised of salaries (42%), bonuses(20%), options (28%), and other (10%).

JUNE 1999 EXECUTIVE COMPENSATION PAGE 8
variables); and (3) institutional details such as tax and exchange rates, and restrictions on
insider trading.13
The most comprehensive international comparison to date in the academic literature is
Abowd and Bognanno (1995), who use data from four international consulting firms to
analyze 1984-1992 pay in twelve OECD countries (Belgium, Canada, France, Germany, Italy,
Japan, the Netherlands, Spain, Sweden, Switzerland, the UK, and the US). They adjust for
tax rates (on both direct pay and perquisites), purchasing power, and public benefits, and find
that pay for US CEOs exceeds pay in other countries even after adjusting for these differences.
Interestingly, they find that the “US premium” is limited to the CEO: there is no significant
difference between US vs. international pay practices for lower-level executives and
production workers.
Although our understanding of international differences in executive compensation
practices is far from complete, several results emerge from the existing research. First, the
elasticity of cash compensation to company size is remarkably constant across countries: Zhou
(1999), for example, reports pay-size elasticities for the US, Japan, the UK, and Canada of
.282, .247, .261, and .247, respectively. Second, the elasticity of cash compensation to stock-
price performance, and the relation between CEO turnover and performance is roughly
comparable in the US, Japan, and Germany (Kang and Shivdasani, 1995; Kaplan, 1994a,
1994b, 1997). Third, stock-based incentives from stock options and stock ownership are
much higher in the US than in other countries (Abowd and Bognanno, 1995; Kaplan, 1997).
A final, but more speculative, result emerging from the existing data is that pay levels
and structures are converging, reflecting an increasingly global market for managerial talent.
Canadian and Mexican companies, for example, routinely now include US companies in peer
groups used to determine competitive pay levels. US companies routinely export pay practices
(including stock option grants) to executives of foreign subsidiaries, putting pressure on the
pay policies of local competitors. And, foreign companies acquiring US subsidiaries face huge
internal pay inequities, often resolved by increasing home-country executive pay. In addition,
legal prohibitions on granting executive stock options in Japan were lifted in April 1997,
13 See Hebner and Kato (1997) for US vs. Japan comparison of the insider-trading component of executive
compensation.

JUNE 1999 EXECUTIVE COMPENSATION PAGE 9
resulting in (or from) a swell of interest in US-style compensation;14 interest in stock options is
exploding elsewhere in the Pacific Rim and in Europe and Latin America.15
3. The Components of CEO Pay
3.1. Base Salaries
Base salaries for CEOs are typically determined through competitive “benchmarking,”
based primarily on general industry salary surveys (except for utilities and financial
institutions, which utilize industry-specific surveys), and supplemented by detailed analyses of
selected industry or market peers. The surveys, which report a variety of pay percentiles (e.g.,
25th, 50th, 75th), typically adjust for company size either through size groupings or through
simple log-linear regressions of Log(Salary) on Log(Size). Size is traditionally measured using
company revenues, although market capitalization is increasingly used (especially in start-ups
with low revenues but high capitalization).
The near-universal use of surveys in determining base salaries has several implications
relevant to understanding levels and trends in CEO compensation. First, as suggested by
Baker, Jensen, and Murphy (1988) and Rosen (1992), the size adjustments in the survey
instruments both formalize and reinforce the observed relation between compensation and
company size. Second, since salaries below the 50th percentile are often labeled “below
market” while those between the 50th and 75th are considered “competitive,” the surveys have
contributed to a “ratchet” effect in base salary levels. Third, while the surveys adjust for
company size and (less frequently) industry, they do not contain criteria many labor
economists consider relevant for predicting earnings levels, including age, experience,
education, and performance. Moreover, company size is at best an imperfect proxy for
managerial skill requirements, job complexity, and span of control. Thus, to the extent that
base salaries reflect any of these potentially important variables, they are reflected in
discretionary adjustments in the target percentiles rather than incorporated as formal criteria.
Executives devote substantial attention to the salary-determination process, even though
salaries comprise a declining percentage of total compensation. First, base salaries are a key
component of executive employment contracts (which typically guarantee minimum increases
in base salaries for the subsequent five years). Second, since base salaries represent the “fixed
14 Pressures to repeal the prohibition reflected, in part, perceptions in Japan that stock-based incentives in the
US have contributed to its relatively robust stock-market performance. Ironically, as recently in 1991, tradenegotiations between the US and Japan dissolved into accusations that US competitiveness was hindered byits “excessive” executive compensation practices (Murphy, 1995).
15 A notable exception is the UK, where stock option (or “share option”) plans have declined in favor ofperformance share plans payable, in part, based on relative stock-market performance.

JUNE 1999 EXECUTIVE COMPENSATION PAGE 10
component” in executive contracts, risk-averse executives will naturally prefer a dollar increase
in base salary to a dollar increase in “target” bonus or variable compensation.16 Finally, most
components of compensation are measured relative to base salary levels. Target bonuses, for
example, are typically expressed as a percentage of base salary, while option grants are
expressed as a multiple of base salary. Defined pension benefits and severance arrangements
also depend on salary levels. Consequently, each dollar increase in base salary has positive
repercussions on many other compensation components.
3.2. Annual Bonus Plans
Virtually every for-profit company offers an annual bonus plan covering its top
executives and paid annually based on a single-year’s performance. In spite of their prevalence
and importance, however, most descriptions of executive bonus plans in the literature are
anecdotal, non-representative, or gleaned from voluntary (and non-random) disclosures in
company proxy statements. In this section, I offer a systematic description of bonus plans,
based on what I believe to be the most comprehensive data on annual incentive plans available.
My primary data source on bonus plan design is the “Annual Incentive Plan Design
Survey” conducted in 1996-97 by Towers Perrin. The Towers Perrin survey, based on
responses to an extensive questionnaire augmented by an analysis of company plan
documents, contains detailed data on 264 annual incentive plans for top-level managers.
Excluding private companies, foreign companies, and subsidiaries, and eliminating companies
with incomplete data, results in a sample of bonus plans from 177 publicly traded US
corporations.17 The number of eligible participants in the sample plans varies from 1 to 25,000
(the median plan has 123 participants); coverage ranges from plans covering only the CEO to
plans covering all company employees.
In spite of substantial heterogeneity across companies and industries, executive bonus
plans can be categorized in terms of three basic components: performance measures,
performance standards, and the structure of the pay-performance relation. Figure 5 illustrates
these basic components for a “typical” bonus plan. Under the typical plan, no bonus is paid
until a threshold performance (usually expressed as a percentage of the performance standard)
is achieved, and a “minimum bonus” (usually expressed as a percentage of the target bonus) is
paid at the threshold performance. Target bonuses are paid for achieving the performance
standard, and there is typically a “cap” on bonuses paid (again expressed as a percentage or
16 For example, “exchange” programs in which executives accept a salary reduction in return for restricted
stock or stock options typically include premiums of 20%-30% for restricted stock and 100%-200% forstock options, reflecting the increased riskiness of the stock-based instruments.
17 See Murphy (1998) for a more detailed description of this database, including a list of survey participants.

JUNE 1999 EXECUTIVE COMPENSATION PAGE 11
multiple of the target bonus). The range between the threshold and cap is labeled the “incentive
zone,” indicating the range of performance realizations where incremental improvement in
performance corresponds to incremental improvement in bonuses.
One result that emerges from the descriptive analysis below is that annual bonus
contracts are largely explicit, with at most a limited role for discretion. Discretion in annual
bonuses shows up in a variety of possible ways. In some firms, boards can exercise discretion
in allocating a fixed bonus pool among participating executives, but the discretion in this case
affects only individual allocations and not the overall amount of the payouts. In addition, the
CEO (and other executives) will have some portion of their bonus depend on “individual
performance.” Although there is a subjective flavor here, individual performance often includes
performance relative to some pre-determined objectives or strategic milestones; in any case, the
weight on individual performance rarely exceeds about 25% of the executive’s bonus. Finally,
boards can also make discretionary “adjustments” to reported earning numbers.18 In almost all
cases, board-level discretion can generate small adjustments in bonus payments, but discretion
is rarely the primary determinant.
P ERFORMANCE M EASURES. Table 2 describes the performance measures used in the 177 annual
incentive plans for companies divided into three industry groups: utilities (SIC 4900-4999),
financial companies (SIC 6000-6999), and industrials (all other SIC categories). Less than half
of the companies use a single performance measure in their incentive plan; most companies use
two or more measures. In most cases, the multiple measures are “additive” and can essentially
be treated like separate plans.19 In other cases, the measures are multiplicative, in which the
bonus paid on one performance measure might be increased or diminished depending on the
realization of another measure.20 In still other cases, bonus payments are determined by a
“matrix” of performance measures.
While companies use a variety of financial and non-financial performance measures,
almost all companies rely on some measure of accounting profits. Table 2 shows that 65 of the
68 sample companies using a single performance measure use an accounting measure,
including revenues, net income, pre-tax income, operating profits (EBIT), or economic value
added.21 Accounting profits also account for 189 of the 307 measures (62%) used by
18 Dechow, Huson, and Sloan (1994), for example, show that boards seem to take “restructuring charges” out
of payouts.19 An example of additive measures is a plan in which 75% of the bonus is based on net income and 25% is
based on sales growth, with a separate schedule relating bonus payments to each performance measure.20 An example here would be a bonus pool equal to 5% of income if stock-price performance exceeds a median
performance in a peer group, but only 3% if stock-price performance falls short of median.21 The distribution of performance measures is consistent with that reported by Perry and Zenner (1997), who
extracted measures from the compensation committee reports in recent proxy statements.
JUNE 1999 EXECUTIVE COMPENSATION PAGE 12
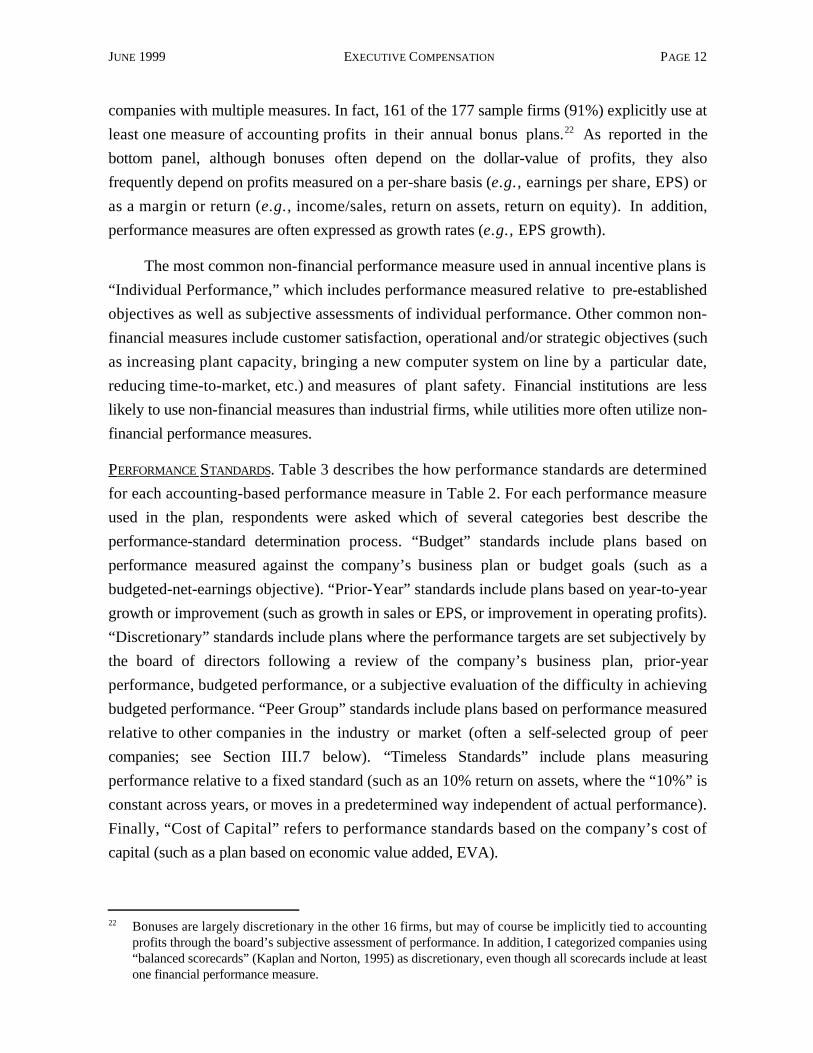
companies with multiple measures. In fact, 161 of the 177 sample firms (91%) explicitly use at
least one measure of accounting profits in their annual bonus plans.22 As reported in the
bottom panel, although bonuses often depend on the dollar-value of profits, they also
frequently depend on profits measured on a per-share basis (e.g., earnings per share, EPS) or
as a margin or return (e.g., income/sales, return on assets, return on equity). In addition,
performance measures are often expressed as growth rates (e.g., EPS growth).
The most common non-financial performance measure used in annual incentive plans is
“Individual Performance,” which includes performance measured relative to pre-established
objectives as well as subjective assessments of individual performance. Other common non-
financial measures include customer satisfaction, operational and/or strategic objectives (such
as increasing plant capacity, bringing a new computer system on line by a particular date,
reducing time-to-market, etc.) and measures of plant safety. Financial institutions are less
likely to use non-financial measures than industrial firms, while utilities more often utilize non-
financial performance measures.
P ERFORMANCE S TANDARDS. Table 3 describes the how performance standards are determined
for each accounting-based performance measure in Table 2. For each performance measure
used in the plan, respondents were asked which of several categories best describe the
performance-standard determination process. “Budget” standards include plans based on
performance measured against the company’s business plan or budget goals (such as a
budgeted-net-earnings objective). “Prior-Year” standards include plans based on year-to-year
growth or improvement (such as growth in sales or EPS, or improvement in operating profits).
“Discretionary” standards include plans where the performance targets are set subjectively by
the board of directors following a review of the company’s business plan, prior-year
performance, budgeted performance, or a subjective evaluation of the difficulty in achieving
budgeted performance. “Peer Group” standards include plans based on performance measured
relative to other companies in the industry or market (often a self-selected group of peer
companies; see Section III.7 below). “Timeless Standards” include plans measuring
performance relative to a fixed standard (such as an 10% return on assets, where the “10%” is
constant across years, or moves in a predetermined way independent of actual performance).
Finally, “Cost of Capital” refers to performance standards based on the company’s cost of
capital (such as a plan based on economic value added, EVA).
22 Bonuses are largely discretionary in the other 16 firms, but may of course be implicitly tied to accounting
profits through the board’s subjective assessment of performance. In addition, I categorized companies using“balanced scorecards” (Kaplan and Norton, 1995) as discretionary, even though all scorecards include at leastone financial performance measure.

JUNE 1999 EXECUTIVE COMPENSATION PAGE 13
Respondents could “check” as many categories as relevant, and could also write-in
additional categories (although no respondents did so). In addition to these six survey
responses, I inferred performance standards in two cases. First, when the performance
measure in the plan was specified as a growth measure, I define the standard as prior-year
performance. Second, when the performance measure is economic value added (EVA), I
define the standard as the company’s cost of capital.
Most performance standards for accounting-profit performance measures are based on a
single criterion. For example, as reported in Table 3, the 125 industrial companies in the
sample use a total of 240 accounting-based measures. The performance standards for 164
(68%) of these measures are based on a single criteria, including budgets (54%), prior-year
performance (14%), board discretion (8%), peer-group comparisons (14%), timeless
standards (4%), and cost of capital (6%). The performance standards for the remaining 76
measures are based on a combination of criteria, including budgets (70%), prior-year
performance (66%), board discretion (59%), peer-group comparisons (16%), timeless
standards (9%), and cost of capital (7%). The percentages here sum to 227%, implying that,
conditional on using multiple criteria, an average of 2.3 criteria are used in setting performance
standards.
P AY -P ERFORMANCE S TRUCTURES. Payouts from bonus plans are determined in a variety of
different ways; the top panel of Table 4 documents the prevalence of various payout methods.
The most common payout method (for all but financial companies) is the “80/120” plan
illustrated in Figure 5. Under a strict 80/120 plan, no bonus is paid unless performance
exceeds 80% of the performance standard, and bonuses are capped once performance exceeds
120% of the performance standard. Although 80 and 120 are the modal choice for the
performance threshold and performance cap, other common combinations (in descending order
of frequency) include 90/110, 95/100, 50/150, 80/110, 90/120, and 80/140 plans. For lack of
a better descriptor (and consistent with industry jargon), I call all these plans “80/120” plans
regardless of the specific values for threshold and caps. As reported in Table 4, 42% of
industrial companies and 39% of utility companies adopt 80/120-type bonus plans. Overall, 67
of the 177 (38%) sample firms report using the 80-120 approach.
The next most common type of plan, used by 55 of the 177 (31%) sample firms, is
called the “Modified Sum-of-Targets” approach. Under this method, each plan participant is
assigned a target bonus, and the sum of the target bonuses across individual participants
defines a target bonus pool. At year-end, the actual bonus pool is determined by modifying the
target pool up or down depending on whether actual performance exceeds or falls short of the
performance standard. The pool is set to zero unless threshold performance is reached, and the
JUNE 1999 EXECUTIVE COMPENSATION PAGE 14
pool is capped (typically at some multiple of the summed target bonuses). The bonus pool is
typically divided among participants based on their individual target bonuses, although some
portion of the pool may fund discretionary awards to recognize individual performance.
Although mechanically different from 80/120 plans, the payout schedule from the sum-of-
targets approach is qualitatively identical to that under the 80/120 approach and is therefore
captured by the illustrative plan in Figure 5. These two payout methods account for about 70%
of the plans in the sample.
The remaining payout methods include formula-based plans (accounting for only 16 of
the 177 of the sample plans) and discretionary plans (8 of 177). The typical formula-based plan
determines a bonus pool which is allocated to individuals based on a combination of target
bonuses and individual performance. Under the typical discretionary plan, the board meets at
year-end to assess subjectively the organization’s (or an individual’s) performance based on a
variety of financial and non-financial criteria, and determines the magnitude of the company’s
bonus pool.
Although the pay-performance relation depicted in Figure 5 is linear between the
threshold and cap, the second panel of Table 4 shows that the incentive zone is more often
convex in industrials and concave in utilities. Table 4 also shows that 56% of the general
industry sample firms pay positive bonuses at the threshold, while only 14% pay zero bonuses
(the remaining firms have discretionary thresholds and indeterminate payouts at threshold).
Finally, consistent with the illustration in Figure 5, payout plans are capped in 154 of the 177
sample firms (87%). As shown in Table 4, plans in the financial sector are slightly less likely
to be capped than in utilities and in industrials.
I NCENTIVE I MPLICATIONS. Although virtually all annual bonus plans provide incentives to
increase company profits, plans such as that illustrated in Figure 5 suggest a plethora of
additional incentives, most conflicting with stated company objectives.
Incentive effects of performance measures. As documented in Table 2, the primary
determinant of executive bonuses is accounting profits. Accounting data are verifiable and
widely understood, and pass what practitioners call the “line of sight” criteria for acceptable
performance measures: managers understand and can “see” how their day-to-day actions affect
year-end profitability. However, it is important to note two fundamental problems with all
accounting measures. First, accounting profits are inherently backward-looking and short-run,
and managers focused only on accounting profits may avoid actions that reduce current
profitability but increase future profitability, such as cutting R&D (Dechow and Sloan, 1991).
Second, accounting profits can be manipulated, either through discretionary adjustments in
“accruals” or by shifting earnings across periods (Healy, 1985).

JUNE 1999 EXECUTIVE COMPENSATION PAGE 15
Incentive effects of performance standards. Table 3 shows that performance standards
are typically based on budgets and/or prior-year performance, and often allow for some board-
level discretion. Performance standards cause problems whenever the employees measured
relative to the standard have influence over the standard-setting process. Standards based on
budgets and prior-year performance are particularly susceptible to this problem. Budget-based
performance standards, for example, create incentives to “sandbag” the budget process and to
avoid actions this year that might have an undesirable effect on next year’s budget. Similarly,
standards based on prior-year performance lead to the “ratchet effect” and shirking, since
managers know that good current performance will be penalized in the next period through an
increased performance standard. In contrast, timeless standards, standards based on the cost of
capital, and standards based on the performance of an industry peer group are not as easily
influenced by the participants in the bonus plan. However, even these standards are influenced
to some degree, such as when the timeless standards are initially set or the external peer group
initially defined. In Murphy (1998), I analyze the role of performance standards in more detail,
and show that CEOs in companies using “externally determined” standards have more highly
variable bonuses than CEOs in companies with “internally determined” standards. In addition,
I show that income smoothing is prevalent in companies using internal standards, but not in
companies using external standards.
Incentive effects of pay-performance structures. As suggested by Figure 5 and
documented in Table 4, the “incentive zone” in most annual incentive plans consists of a fairly
narrow band of performance outcomes straddling the performance standard. Since bonuses are
based on cumulative annual performance, and since managers can revise their daily effort and
investment decisions based on assessments of year-to-date performance, the non-linearities in
the typical bonus plan causes predictable incentive problems (Holmstrom and Milgrom, 1987).
In particular, if year-to-date performance suggests that annual performance will exceed that
required to achieve the bonus cap, managers will withhold effort and will attempt to
“inventory” earnings for use in a subsequent year (Healy, 1985). Similarly, if expected
performance is far below the incentive zone, managers will again discount the bonus
opportunity, especially near the end of the year when achieving the threshold performance level
seems highly unlikely. When expected performance is moderately below the incentive zone,
the discontinuity in bonus payments at threshold yields strong incentives to achieve the
performance threshold (through counterproductive earnings manipulation as well as through
hard work), because the pay-performance slope at the threshold is effectively infinite.23
23 Healy (1985) assumed that bonuses were continuous at the performance threshold, and hypothesized that
managers would take discretionary accruals (to shift earnings to a following period) whenever performancefell short of the threshold or exceeded the cap. Later work by Gaver, Gaver, and Austin (1995) and

JUNE 1999 EXECUTIVE COMPENSATION PAGE 16
3.3. Stock Options
Stock options are contracts which give the recipient the right to buy a share of stock at a
pre-specified “exercise” (or “strike”) price for a pre-specified term. Executive options typically
become “vested” (i.e., exercisable) over time: for example, 25% might become exercisable in
each of the four years following grant. Executive options are non-tradable, and are typically
forfeited if the executive leaves the firm before vesting (although “accelerated vesting” is a
commonly negotiated severance arrangement, especially following a change in control).
Conceptually, the parameters of an option contract suggest a multitude of design
possibilities: for example, exercise prices could be “indexed” to the industry or market, options
could be forfeited unless a performance “trigger” is reached, option terms could match the
expected executive horizons, etc. In practice, however, there is little cross-sectional variation in
granting practices: most options expire in ten years and are granted with exercise prices equal
to the “fair market value” on date of grant. Table 5 documents these regularities, based on the
option-grant practices of 1,000 large companies in 1992.24 As reported, less than two thirds
(627) of the CEOs in the 1,000 sample firms received options in 1992, but many of these 627
CEOs received multiple grants (853 total grants).25 Five companies canceled and replaced
previously granted options subsequent to a large stock-price decline,26 while 26 companies
granted “reload” options (120 total grants) to replace shares used to finance the exercise of
existing options.27 Ignoring these special cases, 618 companies made 728 “regular” option
grants to their CEOs during fiscal 1992.
Holthausen, Larcker, and Sloan (1995) confirm that managers manipulate earnings downward when the capis exceeded, but actually manipulate earnings upwards when below the threshold. The authors interpret thesefindings as rejecting the hypothesis that managers manipulate earnings in response to their bonus plans.However, given that substantial bonuses are paid for meeting the threshold (with zero bonuses paid belowthe threshold, as in Figure 5), we expect that managers will manipulate earnings upward as long as there isa realistic chance of achieving the threshold.
24 The sample covered in Table 5, described in Murphy (1993, 1996), includes the 1,060 largest companies(ranked by 12/31/92 market capitalization) filing proxy statements between January and September 1993.The sample excludes 42 companies with 1992 initial public offerings, 13 companies where the CEO is paidby another company (usually the parent of a subsidiary), and 5 companies that merged or went bankruptafter December 1992, leaving 1,000 companies with fiscal closings from October 1992 through June 1993,with December 1992 market capitalization ranging from $355 million to $75.9 billion (median $1.26billion).
25 Of the 373 companies not granting options to the CEO in 1992, 120 made option grants to other proxy-listed executives.
26 Although “repricing” options through cancellations and reissues has received substantial attention in boththe business and academic press (see, as respective examples, Crystal and Foulkes, 1988 and Saly, 1994),repricing of executive options has been extremely rare since 1988, driven both by the bull market andincreased SEC repricing disclosure requirements. Companies can currently circumvent the punitivedisclosure requirements by repricing options for lower-level executives (without triggering disclosure) whileissuing new options for senior managers (without canceling existing options).
27 Reload provisions issue new options to replace shares sold to pay the exercise price of exercised options.The new options are granted at fair market value with a term equal to the remaining term on the option

JUNE 1999 EXECUTIVE COMPENSATION PAGE 17
As documented in Panel B of Table 5, the exercise price equals the grant-date fair market
value in 95% of the regular option grants. About 3% of the grants were made with exercise
prices below the grant-date price (“discount options”) while half that many grants had exercise
prices above the grant-date price (“premium options”). Out of the 1,000 sample firms, only
one offered “indexed options” (where the exercise price varies with the return on a market or
industry index), while another two firms had exercise prices that grew over time in a
predetermined manner.
Panel C of Table 5 shows that about 83% of the grants had ten-year terms, while another
13% had terms less than ten years and 4% had terms exceeding ten years (including one grant
with no expiration date). Two firms out of the 1,000 sample firms had “performance triggered”
expiration dates. In one of these, the options were forfeited unless the stock price reached a
pre-determined price hurdle and performance exceeded the market index within a specified
period of time; in the other, the options had a five-year term unless performance exceeded a
pre-determined price hurdle, in which case the term was extended to ten years.
Stock options reward only stock-price appreciation and not total shareholder return, since
the latter includes dividends. As shown in Panel D of Table 5, a handful of companies offer
“dividend protection” for executive stock options. Although dividend protection can be
accomplished a variety of ways (including decreasing exercise prices when paying dividends
or expressing stock prices on a pre-dividend basis), the most common approach is to pay the
executive accumulated dividends (plus interest) upon exercise of the underlying options.
Yermack (1995) analyzes the determinants of option grants, and concludes that cross-
sectional patterns in grants are not well-explained by agency or financial contracting theory.
Kole (1997) analyzes the “vesting schedule” of option grants, distinguishing between the
“minimum wait” (the time from the grant-date until any options can be exercised) and the
“average wait” (the average time until all options can be exercised). She finds that both the
minimum and average wait times are longer in R&D-intensive firms, and are longer in
chemicals, machinery, and producer firms than in metals, food and consumer firm.
I NCENTIVE I MPLICATIONS. Stock options provide a direct link between managerial rewards and
share-price appreciation, since the payout from exercising options increases dollar for dollar
with increases in the stock price. The incentives from stock options do not, however, mimic
the incentives from stock ownership, for several reasons. First, since options reward only
exercised. Since executives often exercise options from several prior grants (all with different remainingterms), reload provisions often result in what appears to be several simultaneous option grants, each withthe same exercise price (fair market value) but with a variety of expiration dates. See Hemmer, Matsunaga,and Shevlin (1998) for an analysis of the valuation and optimal exercise for reload options.

JUNE 1999 EXECUTIVE COMPENSATION PAGE 18
stock-price appreciation and not total shareholder returns (which include dividends), executives
holding options have incentives to avoid dividends and to favor share repurchases.28 Second,
since the value of options increase with stock-price volatility, executives with options have
incentives to engage in riskier investments.29 Finally, options lose incentive value once the
stock price falls sufficiently below the exercise price that the executive perceives little chance of
exercising: this “loss of incentives” is a common justification for option repricings following
share-price declines.
V ALUATION I SSUES. Most applications of executive stock options in both research and practice
require placing a “value” on the options as of the grant date. In constructing such a value, it is
important to distinguish between two often-confused but fundamentally different valuation
concepts: the cost to the company of granting the option and the value to an executive from
receiving the option. In this subsection, I demonstrate that options cost more to shareholders to
grant than they are worth to executive-recipients, and should therefore only be granted if the
“incentive effect” (i.e., the increased performance created by improved stock-based incentives)
exceeds the difference between the company’s cost and the executive’s value.
The company’s “opportunity cost” of an option grant (ignoring, for the moment, the
incentive effect) is appropriately measured as the amount an outside investor would pay for the
option. The outside investor is generally free to trade or sell the option, and can also take
actions (such as short-selling the underlying stock) to hedge away the risk of the option.
Company executives, in contrast, cannot trade or sell their options, and are also forbidden
from hedging the risks by short-selling company stock. In addition, while outside investors
tend to be well-diversified (holding small amounts of stock in a large number of companies),
company executives are inherently undiversified, with their physical as well as human capital
invested disproportionately in their company. For these reasons, company executives will
generally place a much lower value on company stock options than would outside investors.30
28 Lambert, Lanen, and Larcker (1989) find that “expected dividends” decrease following the initial adoption of
top-management stock option plans. Lewellen, Loderer, and Martin (1987) find that dividend payout ratiosare negatively (but not significantly) related to CEO stock-based compensation.
29 DeFusco, Johnson, and Zorn (1990) find that stock-price volatility increases, and traded bond pricesdecrease, after the approval of executive stock option plans. Similarly, Agrawal and Mandelker (1987) findthat managers of firms whose return volatility is increased by an acquisition have higher optioncompensation than managers whose volatility declined. Hirshleifer and Suh (1992) argue that option plans(or other plans with “convex” payouts) help mitigate the effects of executive risk aversion by givingmanagers incentives to adopt rather than avoid risky projects.
30 However, to the extent that company executives have superior information regarding company prospectsand can “time” their option grants accordingly (Yermack, 1997), executives may actually value optionshigher than would outside investors.

JUNE 1999 EXECUTIVE COMPENSATION PAGE 19
The best known and most widely utilized method for calculating the company’s cost of
granting an executive stock option is the Black-Scholes (1973) formula, presented and
discussed in the Appendix. Black and Scholes demonstrated that, since investors can hedge,
options can be valued as if investors were risk neutral and all assets appreciate at the risk-free
rate. Under the risk-neutrality assumption, option values can be estimated by computing the
expected value of the option upon exercise (assuming that the expected return on the stock is
the risk-free rate), and discounting this expected value to the grant date using the risk-free rate.
This risk-neutrality assumption forms the basis of modern option pricing theory and is central
to all option pricing models and methodologies, including binomial models, arbitrage pricing
models, and Monte Carlo methodologies (Hull, 1993).
In spite of its prevalence in practice, there are many drawbacks to using the Black-
Scholes formula in calculating the cost of an executive stock option. First, the Black-Scholes
formula assumes constant dividend yields and stock-price volatilities, assumptions which seem
sensible for short-term traded options (usually expiring in six months or less) but less sensible
for options expiring in a decade. Second, executive stock options are subject to forfeiture if the
executive leaves the firm prior to vesting; this probability of forfeiture reduces the cost of
granting the option and thus implies that the Black-Scholes formula overstates option values.
Finally, the Black-Scholes formula assumes that options can only be exercised at the expiration
date, but executive options can be exercised immediately upon vesting, which typically occurs
relatively early in the option’s term. The opportunity to exercise early has ambiguous
implications for the cost of granting options. On one hand, the right to exercise early increases
the amount an outside investor would pay for the option, and hence increases the option’s cost.
On the other hand, risk-averse undiversified executives tend to exercise much earlier than
would a rational outside investor, and these early exercise decisions reduce the company’s cost
of granting options.31
There is no accepted methodology, and little research, on estimating the value of a stock
option to an executive-recipient.32 Intuitively, the valuation will depend on the executive’s risk
aversion, his or her wealth, the fraction of that wealth invested in company stock, and the
likelihood that the executive will remain with the company until the option is vested. Table 6
estimates the “certainty equivalent” value of stock options, calculated as the amount of cash the
31 See, for example, Huddart (1998). In essence, the appropriate valuation methodology is the usual binomial
valuation (which allows for early exercise) but with a catch: the exercise decision is not made by theinvestor but rather by a “third party” (in this case, an executive who for a variety of reasons is not expectedto make the same exercise decisions as an unrestricted outside investor). Carpenter (1998) argues that optionvaluation incorporating executive exercise patterns can be approximately replicated by adding exogenous“departure rates” to a conventional binomial analysis.
32 One important exception is Lambert, Larcker and Verrecchia (1991).

JUNE 1999 EXECUTIVE COMPENSATION PAGE 20
executive would willingly give up to receive one option, assuming constant relative risk
aversion and assuming the option and the rest of his portfolio is held for ten years. Three
options are considered: a discount option with an exercise price of 50% of the grant-date
market value, a fair market value (FMV) option, and a premium option with an exercise price
of 200% of the grant-date value. In addition, the table estimates the value of a grant of
restricted stock, which (ignoring dividends) is equivalent to a stock option with an exercise
price of zero.
Table 6 shows how an option’s value to the executive-recipient depends on the
executive’s risk aversion and diversification and on the riskiness of the option. For example,
the table shows that a FMV 10-year option on a $30 non-dividend-paying stock has a Black-
Scholes value of $17.60. Assuming that the executive holds 50% of his wealth in company
securities (equally divided between stock and options), he would be willing to pay the full
Black-Scholes value if his risk aversion was low (RRA=1.0), but would only pay $7.80 and
$4.28 for relative risk aversion of 2.0 and 3.0, respectively. Similarly, assuming relative risk
aversion of 2.0, the value of a FMV option falls from $7.80 to $3.57 as his stock holdings (as
a fraction of his wealth) increase from 50% to 75%, and falls to $1.62 when his stock holdings
account for 90% of his wealth.
The risk premium demanded for accepting options in lieu of cash increases with the
riskiness of the option, which in turn reflects (in part) the probability that the option will expire
unexercised. Suppose, for example, that the executive has relative risk aversion of 2.0 and
holds 50% of his wealth in company securities. As reported in Table 6, the executive would
only be willing to give up $19.94 to receive a share of restricted stock worth $30, suggesting a
risk premium of 50%. The similarly calculated risk premium for discount options, FMV
options, and premium options is 79%, 125%, and 237%, respectively: the lower the
probability of exercise, the higher the risk premium.
T AX AND A CCOUNTING I SSUES. Stock options seem a natural way to tie executive pay to company
stock-price performance. However, in spite of the obvious incentive implications, the
popularity of stock options reflects in large part their favorable tax and accounting treatment. In
particular, stock options offer an attractive way to defer taxable income, and are largely
invisible from corporate accounting statements.
Stock options represent a relatively unique form of deferred compensation in which the
recipient has substantial discretion in determining when to realize taxable income. The granting
of a stock option does not constitute a taxable event for either the company or the executive-
recipient. What happens later depends on whether the stock options are “qualified” (called
“Incentive Stock Options” or ISOs) or “non-qualified.” For non-qualified options, the spread

JUNE 1999 EXECUTIVE COMPENSATION PAGE 21
between the market price upon exercise and the original exercise price constitutes taxable
personal income to the executive, and a compensation-expense deduction for the company. For
qualified options, the executive pays nothing upon exercise (provided that he continues to hold
the stock), and pays capital gains taxes when he eventually sells the stock; the corporation,
however, cannot deduct the gain on a qualified option as a compensation expense. Most option
grants are non-qualified, although recent tax law changes (reducing the capital gains tax rate
from 28% to 20% or less) have made granting qualified options relatively more attractive.33
As long as stock options have a pre-specified exercise price and expiration date,
companies incur an accounting charge equal to the grant-date “spread” between the market
price and the exercise price (amortized over the life of the option).34 This “quirk” in the US
financial accounting rules—which implies no accounting charge for fair-market-value and
premium options—creates a gap between the economic and accounting costs of options. As
demonstrated in the preceding subsection, options are an expensive way to convey
compensation because risk-averse managers will demand large premiums for accepting risky
options rather than safer cash. But, stock option compensation is essentially “free” from an
accounting perspective, explaining (I believe) the popularity of “broad-based” company-wide
option programs that are difficult to rationalize from an incentive standpoint.35 In addition, the
accounting rules apply only to options with fixed exercise prices and expiration terms, and not
to indexed options, performance-triggered options, or options with variable terms. Thus, the
accounting treatment explains in large part the tendency documented in Table 5 of granting only
“regular” options, even when more exotic options would be beneficial from both an incentive
and economic-cost perspective. Explaining why managers remain fixated on accounting rather
than economic profit (apart from the obvious link to their bonus payments) is, however,
beyond the scope of this paper.
W HY H AVE O PTIONS I NCREASED O VER T IME ? The most pronounced trend in executive
compensation in the 1980s and 1990s has been the explosion in stock option grants, which on
a Black-Scholes basis now constitute the single largest component of CEO pay. Although the
33 Prior to the recent reduction in capital gains rates, non-qualified options were jointly tax advantageous,
since the loss in deductibility for the corporation more than offset the difference between personal incometax and capital gains rates. The recent reduction has narrowed the advantages somewhat, but not reversedthem because (1) most executives sell the shares immediately following exercise of qualified options and donot meet the holding requirements for capital gains; (2) many executives exercising qualified options aresubject to the “alternative minimum tax,” and (3) there are restrictions on the granting and exercisability ofqualified options which continue to be unattractive.
34 The current accounting rules for stock and options issued to employees are defined by APB Opinion No.25, issued in October 1972. In the early 1990s, the Financial Accounting Standard Board (FASB) consideredexplicit accounting charges for options, but adopted instead enhanced footnote disclosure.
35 Although there is currently no accounting charge associated with granting options, outstanding options willlower a company’s earnings per share when measured on a fully diluted basis.

JUNE 1999 EXECUTIVE COMPENSATION PAGE 22
forces underlying this trend have not been documented or established in the literature, I believe
that political, economic, mechanical, and behavioral factors have all contributed to the trend.
The controversy over CEO pay in the early 1990s was caused by a combination of
political and economic forces (Murphy, 1995, 1997). The political forces (described in more
detail in Section V below) reflected an attack on wealth that followed the so-called “excesses of
the 1980s,” while the economic forces reflected that traditional executive pay practices
established in the 1960s and 1970s were ill-suited for the 1980s and 1990s economies where
creating shareholder value involves innovation and entrepreneurism in some sectors, and
downsizing, layoffs, obtaining concessions from unions, and in extreme cases even exit in
other sectors. Most shareholder and academic criticisms of CEO pay at the time focused on the
lack of meaningful rewards for superior performance and meaningful penalties for failure.
Similarly, although the populist attack was implicitly focused on reducing pay levels, it was
couched in terms of increasing the relation between pay and performance. Both of these forces
combined to facilitate more pay for performance, predominately in the form of stock options.
The mechanical explanation for the explosion in stock options is rooted in institutional
details on granting practices and exacerbated by the recent bull market. According to a 1997
Towers Perrin survey, 40% of large companies grant options on a “fixed value” basis, 40% on
a “fixed share” basis, and the remaining 20% use a variety of other methods. Under fixed-
value grants, the number of options granted is determined by dividing a dollar-value target
award (typically determined using compensation surveys that express grant targets as a
multiple of base salary) by the Black-Scholes option value.36 Under fixed-share grants, the
number of shares is determined at one date (using the same surveys), and fixed for several
years. Thus, in periods of escalating stock prices, the Black-Scholes value of shares granted
under fixed-share programs will also escalate. Moreover, since the companies with fixed-share
programs participate in compensation surveys, the survey multiples will increase, which in
turn will increase grants in companies with fixed-value programs. The net result is a ratcheting
of option grants that corresponds to an escalating stock market.
The behavioral explanation for the stock option trend—which, by definition, will be
unsatisfactory to economists—reflects an increased executive acceptance of stock options
caused by nearly two decades of a sustained bull market. The current cohort of executives has
not experienced a major market downturn: even the October 1987 crash was, in retrospect, a
minor event for an executive holding long-lived stock options. The overwhelming majority of
36 For example, if the target award was $200,000 and the Black-Scholes value was $20, the CEO would
receive options on 10,000 shares of stock. But, if the Black-Scholes value was $10, the CEO would receiveoptions on 20,000 shares of stock.

JUNE 1999 EXECUTIVE COMPENSATION PAGE 23
stock options issued since 1980 have been exercised well in-the-money, creating substantial
fortunes for many CEOs. Newly appointed CEOs were not around in the early 1970s during
the last sustained decline in stock prices. During this earlier period, companies systematically
discontinued their “underwater” option programs and replaced them with accounting-based
performance plans with higher likelihoods of payouts. Therefore, during prolonged market
upturns it is not surprising that companies systematically scale back their accounting-based
performance plans in favor of seemingly more-lucrative option programs.
3.4. Other Forms of Compensation
R ESTRICTED S TOCK . Approximately 28% of the S&P 500 firms granted restricted stock to their
CEOs in 1996; these grants account for an average of 6.1% of total compensation (and 22% of
compensation for CEOs receiving grants). The grants are “restricted” in the sense that shares
are forfeited under certain conditions (usually related to employee longevity). The forfeiture
possibility allows favorable tax treatment (executives do not pay taxes on the shares until the
restrictions lapse) and accounting treatment (the “cost” is amortized over the vesting period,
and recorded as the grant-date stock price even if prices have increased since the grant).
Kole (1997) shows that restricted stock plans are more common in chemicals,
machinery, and producer firms than in metals, food and consumer firms, and are more
common in R&D-intensive firms than in non-R&D firms. Moreover, the average vesting
period for restricted stock grants (i.e., the average time until the restrictions are lifted) is longer
in chemicals, machinery, and producer firms (averaging 50 months) than in metals, food and
consumer firm (averaging 20 months).
L ONG -T ERM I NCENTIVE P LANS . In addition to bonus plans based on annual performance, many
companies offer “long-term incentive plans” (LTIPs), typically based on rolling-average three-
or five-year cumulative performance. Approximately 27% of the S&P 500 CEOs received
LTIP payouts in 1996; these payouts for 5.5% of 1996 total compensation (and 20% of
compensation for those CEOs receiving payouts). The structure of the typical long-term
incentive plans is similar to the structure of annual bonus plans illustrated in Figure 5.
R ETIREMENT P LANS . In addition to participating in company-wide retirement programs, top
executives routinely participate in supplemental executive retirement plans (SERPs). SERPs
are non-qualified for tax purposes and can take a variety of different forms, including defined
benefits based on “credited” years of service (which can deviate substantially from “actual”
years of service) or variable benefits based on inflation or company performance. The
compensation data in Figures 1 through 3 ignore retirement-related compensation because (1) it
is difficult or ultimately arbitrary to convert the future payments into current annual

JUNE 1999 EXECUTIVE COMPENSATION PAGE 24
compensation; (2) payouts from SERPs are not disclosed, because the retired recipients are no
longer company executives, and (3) the discussion of retirement plans in publicly available
proxy statements is insufficient to calculate the actual value of these plans. Indeed, the
vagueness of disclosure, coupled with anecdotes of high payouts in a few publicized cases,
have led some observers to call SERPs the ultimate form of “stealth compensation.”
4. Who Sets CEO Pay?
Part of the controversy over CEO compensation reflects a perception that CEOs
effectively set their own pay levels. In fact, in most companies, ultimate decisions over
executive pay are made by outside members of the board of directors who are keenly aware of
the conflicts of interest between managers and shareholders over the level of pay. There is no
doubt, however, that CEOs and other top managers exert at least some influence on both the
level and structure of their pay.
Most large US corporations have a compensation committee consisting of two or more
“outside” directors.37 Although all major decisions related to top-level pay are passed through
this committee, the committee rarely conducts market studies of competitive pay levels or
initiates or proposes new incentive plans, and only seldom retains its own compensation
experts. Rather, initial recommendations for pay levels and new incentive plans typically
emanate from the company’s human resource department, often working in conjunction with
outside accountants and compensation consultants.38 These recommendations are usually sent
to top managers for approval and revision before being delivered to the compensation
committee for consideration. The CEO typically participates in all committee deliberations,
except for discussions specifically dealing with the level of the CEO’s pay. The committee
either accepts the recommendations or sends them back for revision. If accepted, the committee
passes its recommendations for the approval of the full board of directors.
The fact that initial recommendations are made by company management and not by the
compensation committee does not necessarily imply corruption or a failure of corporate
governance systems. Compensation committees, which typically meet only six to eight times a
year, lack both the time and expertise to be involved in the minutia of pay design. Optimally,
37 “Outsiders” are typically defined as directors who are neither current nor past employees, and who have no
strong business ties to the corporation. In fact, companies need such a committee to qualify for exemptionunder IRS §162(m), which places a $1 million limit on the deductibility of compensation for the CEO andother “proxy-named” executives.
38 Executive compensation responsibility naturally varies with company size and complexity. Very largecompanies often have a fully staffed “Office of Executive Compensation,” headed by a vice president whoreports to either the Senior VP of Human Resources or to a VP of Compensation and Benefits (who, inturn, reports to the SVP of HR). In smaller companies, executive compensation responsibility typicallyrests with the executive responsible for human resources.

JUNE 1999 EXECUTIVE COMPENSATION PAGE 25
the role of the committee is not to set pay levels and programs, but rather to define and enforce
the company’s compensation strategy, and to monitor the process while being mindful that
executives (like other individuals) prefer more to less. The committee must also be prepared to
thwart clear violations of shareholder interests, which in most cases means “pushing back” on
seemingly excessive pay recommendations.
The empirical evidence on CEO influence over the compensation committee is somewhat
mixed. In a sample of 105 firms from 1984, O’Reilly, Main, and Crystal (1988) analyze
compensation-committee members who are themselves executives in other firms, and find that
CEO pay is positively related to executive pay at the committee members’ firms. Main,
O’Reilly, and Wade (1995) investigate how CEOs “manage” their compensation committees in
ways that result in higher pay, and conclude that outside board members act not as independent
evaluators of CEO performance, but rather as partners in an effort to make the firm more
successful. In a sample of 161 firms in 1993, Newman and Mozes (1997) finds that the level
of CEO pay is significantly higher, and the pay-performance relation significantly lower, when
the compensation committee contains at least one “insider.” Anderson (1997) focuses on 50
CEOs who sit on their compensation committees (and are subsequently removed), and
compares pay of these firms to a control sample. Based on 1985-94 proxy data, he finds that
CEOs who sit on their own committees receive lower levels of pay and tend to have very high
stock ownership, acting much more like manager/owners than self-serving agents.
Based on my own observation and extensive discussions with executives, board
members, and compensation consultants, I tend to dismiss the cynical scenario of entrenched
compensation committees rubber-stamping increasingly lucrative pay programs with a wink
and a nod. Although there are undoubtedly exceptions, outside board members approach their
jobs with diligence, intelligence, and integrity, regardless of whether they have social or
business ties with the CEO. However, judgment calls tend systematically to favor the CEO.
Faced with a range of market data on competitive pay levels, committees tend to error on the
high side. Faced with a choice between a sensible compensation plan and a slightly inferior
plan favored by the CEO, the committee will defer to management. Similarly, faced with a
discretionary choice on bonus-pool funding, the committee will tend to over- rather than under-
fund. The amounts at stake in any particular case are typically trivial from a shareholder’s
perspective, but the overall impact of the bias has likely contributed to the ratcheting of pay
levels evident in Figures 1 through 3.

JUNE 1999 EXECUTIVE COMPENSATION PAGE 26
III. The Relation Between Pay and Performance
1. Introduction
Most research on the relation between executive compensation and company performance
has been firmly (if not always explicitly) rooted in agency theory: compensation plans are
designed to align the interests of risk-averse self-interested executives with those of
shareholders. I begin this section by summarizing the traditional principal-agent framework
based on unidimensional managerial actions, critique its limitations, and sketch intuitively the
implications from a more general framework that acknowledges the complexity and unlimited
scope of managerial actions. Next, I summarize the empirical evidence on the relation between
pay and performance, distinguishing between explicit aspects (CEO pay is explicitly related to
accounting returns through annual bonuses, and to stock-price appreciation through stock
options and restricted stock) and implicit aspects (CEO pay may be implicitly tied to
performance through year-to-year adjustments in salary levels, target bonuses, and option and
restricted stock grant sizes). I then analyze the relation between CEO pay and relative
performance. The section concludes with a summary of the evidence on whether increases in
CEO pay-performance sensitivities affect subsequent company performance.
2. Principal-Agent Theory and Executive Compensation
Providing a comprehensive survey of the optimal contracting literature is beyond the
scope of this paper.39 It is useful, however, to outline the framework and the insights
emerging from the pioneering work by Mirrlees (1974, 1976), Holmstrom (1979), Grossman
and Hart (1983), and others. In a typical “hidden action” model, the CEO is assumed to take
actions, a, to produce stochastic shareholder value, x(a), receiving compensation w(x,z) and
utility u(w,a), where z is a vector of other observable measures in the contract. The CEO’s
utility funciton and the production function linking the CEO’s actions to output are common
knowledge to both shareholders and the CEO, but only the CEO observes the actions taken.
That is, the shareholders know precisely what actions they want the CEO to take but cannot
directly observe the CEO’s actions. The optimal contract, w(x,z), maximizes the risk-neutral
shareholders’ objective, x-w, subject to an incentive compatibility constraint (the CEO chooses
actions to maximize u(w,a)), and a participation constraint (the expected utility of the contract
must exceed the CEO’s reservation utility).
The fundamental insight emerging from the traditional principal-agent models is that the
optimal contract mimics a statistical inference problem: the payouts depend on the likelihood
that the desired actions were in fact taken. This “informativeness principle” introduced by
39 See Hart and Holmstrom (1987) for an excellent early survey on the contracting literature.

JUNE 1999 EXECUTIVE COMPENSATION PAGE 27
Holmstrom (1979) suggests that payouts are based on stock-based measures, x, not because
shareholders desire higher stock prices but rather because realizations of x provide information
useful in determining which actions the CEO took. This formulation also makes clear the role
for additional performance measures (such as accounting returns) in the CEO’s incentive
contract: non-stock-based measures will be used to the extent that they provide information
relevant in assessing whether the CEO indeed took the desired action. In fact, if these other
measures constitute a “sufficient statistic” for the CEO’s actions, stock-based measures need
not be used at all.
Taken literally, it is difficult to use the informativeness principle to construct empirically
refutable hypotheses regarding the structure or shape of actual executive incentive contracts.
While Section II shows that actual contracts are typically linear in stock prices (above an
exercise price for stock options), the relation between pay and stock-price performance
predicted by the informativeness principle can be convex, linear, concave, and need not be
positive through its entire range.40 In addition, while actual contracts are non-linearly related to
a variety of non-stock-based measures (see Figure 5 and Table 2), the principle offers little
guidance in determining which of these measures are “incrementally informative” about CEO
actions.41
Taken less literally, the traditional principal-agent model yields several important and
practical insights useful in understanding existing contracts (and, normatively, in designing
better ones). In particular, the models highlight the trade-off between risk and incentives, as
illustrated by the simple agency model.42 Suppose that firm value is given by x = e + ε, where
e is executive effort, and ε is (normally distributed) uncontrollable noise, ε ≈ N(0,σ2).
Moreover, suppose that managerial contracts take the simple linear form w(x) = s + bx, where
s is a fixed salary and b is the sharing rate (or “pay-performance sensitivity”). Assuming that
40 For example, suppose that unusually high realizations of stock prices could only come from sub-optimal
actions (such as gambling all corporate assets in a Las Vegas casino). Then, the optimal contract wouldpunish these high realizations while rewarding lower realizations.
41 The major empirical prediction of the informativeness principle has been to establish a role for relativeperformance evaluation (RPE) in incentive contracts; see the discussion in Section III.7 below. In addition,Banker and Datar (1989) use the informativeness principle to develop predictions regarding the trade-offbetween stock-based and accounting-based performance measures based on signal-to-noise ratios; seeLambert and Larcker (1988), Bushman and Indjejikian (1993), and Baiman and Verrecchia (1995) forempirical applications of the Banker and Datar approach.
42 Gibbons (1997) persuasively argues that existing contractual arrangements must reflect more than the trade-off between risk and incentives. But, this trade-off lies at the heart of the publicly traded corporation: thecomparative advantage of the corporate form of organization is precisely that well-diversified atomisticshareholders are better able than managers to bear risk.

JUNE 1999 EXECUTIVE COMPENSATION PAGE 28
the executive has exponential utility, U(x) = -er(W-c(e)), where r is the executive’s absolute risk
aversion and c(e) is the convex disutility of effort, the optimal sharing rate is given by: 43
b = 1
1 + rσ2c". (1)
Equation (1) implies that the optimal pay-performance sensitivity will equal b=1 when output is
certain (σ2 = 0) or executives are risk-neutral (r = 0). Incentives will be weaker for more risk-
averse executives (∂b/∂r < 0), and will also be weaker the greater the uncontrollable noise in
firm value (∂b/∂σ2 < 0).
There are legitimate reasons not to take the informativeness principle literally. First, the
traditional model assumes that the shareholders know which CEO actions maximize firm value:
if actions were observable then a zero-risk forcing contract could be designed that induces the
CEO to take the first-best actions. But the reason shareholders entrust their money to self-
interested CEOs is based on shareholder beliefs that CEOs have superior skill or information in
making investment decisions. Unobservable actions cannot be the driving force underlying
executive contracts: even if shareholders (or boards of directors) could directly monitor CEO
actions, they could not tell whether the actions were appropriate given the circumstances.
Shareholder uncertainty about the production function linking CEO actions to firm value leads
naturally to contracts based on the principal’s objective (e.g., increasing shareholder wealth)
rather than on measures that are incrementally informative of CEO actions (e.g., accounting
returns or direct monitoring of CEO actions).
Second, as stressed by Holmstrom (1992), CEOs can choose from a much richer set of
actions than contemplated under the original principal-agent framework. Although the CEO’s
“action space” is typically defined as unidimensional effort, it is widely acknowledged that the
fundamental shareholder-manager agency problem is not getting the CEO to work harder, but
rather getting him to choose actions that increase rather than decrease shareholder value. In
general, increasing shareholder wealth involves investing in positive net present value projects,
increasing profits on existing capital, and diverting resources from negative net present value
projects. There is a wide array of actions that affect shareholder value, including defining the
business strategy, choosing between debt and equity financing, making dividend and
repurchase decisions, identifying acquisition and divestiture targets, selecting industries and
markets to enter or exit, allocating capital across business units, setting budgets for developing
new products and businesses, hiring productive (and firing unproductive) subordinates, and
43 For similar derivations of the optimal pay-performance sharing rate, see Lazear and Rosen (1981),
Holmstrom and Milgrom (1991), Gibbons and Murphy (1992a), Milgrom and Roberts (1992), and Gibbonsand Waldman (1999).
JUNE 1999 EXECUTIVE COMPENSATION PAGE 29
designing, implementing, and maintaining the nexus of implicit and explicit contracts that
defines the organization. Expanding the set of potential actions that affect shareholder value
diminishes the role for “informativeness” and increases the benefit of tying pay to the
principal’s objective rather than to measures of inputs.
Allowing managers to choose from an unlimited action space also has implications for
the use of other performance measures and standards, z, in the contract. Payments based on
incrementally informative z’s can distort incentives when managers allocate their efforts across
a variety of different tasks.44 They can sandbag the budget process to achieve performance
targets.45 They can attenuate the benefits of relative performance evaluation by taking
unproductive actions that lower the performance of the peer group.46 They can shift accounting
returns across periods by accelerating or delaying revenues and costs.47 They can monitor
year-to-date performance and adjust actions daily to maximize bonuses based on cumulative
annual performance.48 They can make accounting choices that artificially inflate or deflate
reported earnings.49 They can make investment choices (such as cuts in R&D) that increase
short-run profits at the expense of long-run profitability.50 These unintended but predictable
side effects of manipulable measures and standards are a cost that must be weighed against
“informativeness” when determining the components and structure of the incentive contract.
Expanding the managerial action set has two primary implications for optimal incentive
contracts. First, the payouts are predicted to be positively related to the principal’s objective
(increasing shareholder value) and to other “less noisy” measures that provide imperfect
incentives to take actions generally consistent with value maximization. Accounting measures,
for example, should be used most strongly when (i) accounting returns contain less noise than
stock prices (Banker and Datar, 1989), and (ii) the actions that affect accounting returns are
closely correlated with the actions that affect stock prices (Baker, 1992). Second, expanded
managerial actions lead naturally to incentive structures that are linear rather than convex or
concave (Holmstrom and Milgrom, 1987; Hart and Holmstrom, 1987). For example, when
contracts are linear and constant across periods, managers have fewer incentives to adjust
effort based on year-to-date performance or to shift earnings across periods to maximize
44 Holmstrom and Milgrom (1991), Baker (1992).45 Murphy (1998).46 Gibbons and Murphy (1990). See also Lazear (1989) on sabotaging the peer group, Dye (1984) and
Mookherjee (1984) on unproductive collusion, Carmichael (1988), Dye (1992) and Lewellen, Park, and Ro(1996) on the choice of a reference group.
47 Oyer (1998) and Murphy (1998).48 Holmstrom and Milgrom (1987).49 Healy (1985), Gaver, Gaver, and Austin (1995) and Holthausen, Larcker, and Sloan (1995)50 Dechow and Sloan (1991) and Gibbons and Murphy (1992b).

JUNE 1999 EXECUTIVE COMPENSATION PAGE 30
current bonuses, because decisions that increase current earnings at the expense of future
earnings will have a symmetric consequence for executive bonuses.
3. The Implicit Relation Between Pay and Shareholder Wealth
An executive’s wealth is explicitly (and mechanically) tied to the principal’s objective
(creating shareholder wealth) through his holdings of stock, restricted stock, and stock
options. In addition, CEO wealth is implicitly tied to stock-price performance through
accounting-based bonuses (reflecting the correlation between accounting returns and stock-
price performance) and through year-to-year adjustments in salary levels, target bonuses, and
option and restricted stock grant sizes.
The CEO pay literature has yet to reach a consensus on the appropriate methodologies
and metrics to use in evaluating the implicit relation between CEO pay and company stock-
price performance. However, following Jensen and Murphy (1990b), Murphy (1993), and
Hall and Liebman (1998), the analysis below shows that virtually all of the sensitivity of pay to
corporate performance for the typical CEO is attributable to the explicit rather than the implicit
part of the CEO’s contract. Consequently, the methodological dispute related to measuring
CEO pay-performance relations is largely second-order, and I will describe only briefly the
different approaches and issues involved.
Year-to-year performance-related changes in total compensation are typically modeled as:
(CEO Pay)it = γi + αit + βi(Performance), (2)
where γi is a CEO or firm-specific effect that varies across CEOs but does not vary over time
for a given CEO, αi is a CEO or firm-specific time trend, “Performance” is a vector of
contemporaneous and lagged performance measures, and βi is the corresponding vector of
coefficients.
Conceptually, (2) could be estimated directly for each executive, though doing so
requires a prohibitively long time series in most cases.51 Instead, most researchers assume that
time trends and pay-performance relations are constant across executives (αi = α and βi = β),
and estimate (2) using fixed-effect methodologies or first-differences:
∆(CEO Pay)it = α + β∆(Performance)it. (3)
The methodological issues in estimating (3) involve choosing which components of
compensation to include, and choosing the performance measures and lag structures. In
51 Lambert and Larcker (1988), Janakiraman, Lambert, and Larcker (1992), and Jensen and Murphy (1990b)
estimate separate regressions, by executive.

JUNE 1999 EXECUTIVE COMPENSATION PAGE 31
addition, researchers must choose whether to measure pay in dollars or logarithms, and
whether to measure performance in dollars or in rates of return. These latter choices determine
whether the regression coefficients are interpreted as “pay-performance sensitivities” or “pay-
performance elasticities.” For example, the specification used by Jensen and Murphy (1990a)
to analyze pay-performance sensitivities for cash compensation is
∆(Cash Compensation)it = a + b∆(Shareholder Value)it, (4)
where ∆(Shareholder Value)t is defined as the rate of return realized by shareholders, rt,
multiplied by the beginning-or-period market value, Vt-1. In contrast, the specification used by
Coughlan and Schmidt (1985) and Murphy (1986) is:
∆ln(Cash Compensation)it = α + β∆ln(Shareholder Value)it, (5)
where ∆ln(Shareholder Value)t ignores share issues or repurchases and therefore equals the
continuously accrued rate of return on common stock, rt. The estimated coefficient β is the
elasticity of cash compensation with respect to shareholder value (or, following Rosen, 1992,
the “semi-elasticity” of pay with respect to the rate of return).
Neither the sensitivity nor elasticity approach strictly dominates the other. The primary
advantage of the elasticity approach is that it produces a better “fit” in the sense that rates of
return explain more of the cross-sectional variation of ∆ln(CEO Pay) than changes in
shareholder value explain of ∆(CEO Pay). In addition, while pay-performance sensitivities
vary monotonically with firm size (larger firms having smaller b’s), the elasticity is relatively
invariant to firm size (Gibbons and Murphy, 1992a).
The primary advantage of the sensitivity approach is that sensitivities have a more natural
economic interpretation. The pay-performance sensitivity represents the executive’s “share” of
value creation. Since agency costs arise when agents receive less than 100% of the value of
output, the “sharing rate” seems a natural measure of the severity of the agency problem;
elasticities have no corresponding agency-theoretic interpretation. Moreover, sensitivities are
directly analogous to the executive’s fractional stockholdings and, indeed, sensitivities and
fractional holdings can be added together to form a more comprehensive measure of how the
CEO’s wealth varies with company performance. The elasticity counterpart to “full” pay-
performance sensitivity (including stock and option holdings)—the elasticity of the CEO’s
wealth with respect to firm value—require unavailable data on non-firm-related CEO wealth.
Table 7 shows the estimated pay-performance sensitivities and elasticities for S&P 500
CEOs grouped by industry and by decade, based on pooled cross-sectional time-series
regressions of (4) and (5). All data are adjusted for inflation; cash compensation (including
JUNE 1999 EXECUTIVE COMPENSATION PAGE 32
salaries, bonuses, and small amounts of other cash pay) is in thousands of 1996-constant
dollars, while the change in shareholder wealth is in millions of 1996-constant dollars. Panel
A, based on S&P 500 Industrials, shows that pay-performance elasticities have nearly tripled
from β=.09 in the 1970s to β=.26 during the first seven years of the 1990s. Over the same
time period, pay-performance sensitivities have more than tripled from b=.004 (representing a
.4¢ change in CEO salary and bonus for each $1,000 change in shareholder wealth) to b=.014
(1.4¢ per $1,000). Panels B and C, based respectively on financial services firms and utilities,
shows equally dramatic increases in pay-performance sensitivities and elasticities for cash
compensation.
Figure 6 shows graphically the estimated pay-performance sensitivities and elasticities
for S&P 500 CEOs based on annual regressions of (4) and (5) from 1971 through 1996. Two
facts emerge. First, replicating the result from Table 7, there has been a general increase in the
relation between cash compensation and company stock-price performance over the past 25
years, measured either by sensitivities or elasticities. Second, there appears to be more year-to-
year variation in pay-performance sensitivities and than elasticities, and the variance in both
appears to have increased in the 1990s.
The definition of CEO pay in (4) and (5) includes realized bonuses, which (recalling
Table 2) are explicitly related to accounting profitability but only implicitly related to stock-
price performance. Recognizing the explicit nature of bonuses provides insights into existing
empirical results on the relation between cash compensation and stock-price performance. For
example, several researchers, including Jensen and Murphy (1990a), Joskow and Rose (1994)
and Boschen and Smith (1995), have explored the relation between ∆(CEO Pay) and lagged
shareholder return and concluded that the coefficient on contemporaneous return is large and
significant, the coefficient on lagged performance smaller but still significant, with mixed (but
generally insignificant) results for prior lags. Since bonuses are based on accounting returns
and not stock prices, the results in the literature are likely explained by the time-series
correlations between accounting and stock returns. Since stock returns are forward-looking, in
the sense that current announcements of events that affect future profitability will be
immediately impounded into stock prices, it is not surprising that contemporaneous accounting
returns are correlated with contemporaneous and lagged shareholder returns, with the
correlation decreasing with additional lags. Ultimately, the (as-of-yet unwritten) definitive
study of the lag structure of CEO pay and performance must acknowledge the explicit nature of
bonuses and therefore begin with a careful analysis of the time-series properties and
correlations of shareholder and accounting returns.

JUNE 1999 EXECUTIVE COMPENSATION PAGE 33
4. The Explicit Relation Between Pay and Shareholder Wealth
Executive wealth is explicitly related to stock-price performance through performance-
related changes in the value of the executives’ holdings of stock, restricted stock, and stock
options. As noted in the preceding subsection, pay-performance sensitivities represent the
CEO’s “share” of value creation. When shareholder wealth increases by one dollar, the value
of the CEO’s restricted and unrestricted stockholdings increase by the CEO’s fractional
ownership of company shares. For example, if the CEO holds 5% of the company’s stock, his
wealth from stock will increase by 5¢ for every $1 increase in shareholder value, and his pay-
performance sensitivity will equal his fractional ownership, bstock = .05.
Calculating pay-performance sensitivities for the CEO’s option holdings is slightly more
difficult than for stock holdings, because option values do not change dollar-for-dollar with
changes in the stock price. If the CEO holds options on 5% of the company’s stock, each $1
increase in shareholder wealth will increase the CEO’s wealth from options by
boptions =.05∂V∂P , where ∂V
∂P<1 is the change in the Black-Scholes value of the option with
respect to changes in the stock price.52 Figure 7 illustrates how ∂V∂P (called the option’s
“delta;” see the Appendix) varies with the stock price and exercise price. As shown in the
figure, the slope of the Black-Scholes value is approximately ∂V∂P=.60 when the stock price
is close to the exercise price (assuming a 3% dividend yield), suggesting that an at-the-money
option increases in value by about 60¢ whenever stock prices increase by $1.00. The slope is
substantially lower than .60 for out-of-the-money options, and (ignoring dividends)
approaches ∂V∂P = 1.00 for deep in-the-money options.
Calculating pay-performance sensitivities for options requires exercise price and
expiration-term information for each outstanding option grant. As a practical matter, the
sensitivity for current grants can be computed precisely for US CEOs (because the required
data are publicly disclosed), but the sensitivity for prior grants must be approximated. In
particular, in the following sensitivity calculations I treat options granted in prior years as a
single grant with five years remaining and an exercise price equal to the year-end stock price
less the “intrinsic value” (i.e., the current “spread” between the stock price and exercise price)
per share of the unexercised options.53 Pay-performance sensitivities for both current and prior
52 More formally, suppose that the CEO holds N stock options, and suppose that shareholder wealth increases
by $1. If there are S total shares outstanding, the stock price P will increase by ∆P=$1/S, and the value ofthe CEO’s options will increase by N∆P(∂V/∂P), where V is the Black-Scholes value of each option.Substituting for ∆P, the pay-performance sensitivity for stock options is given by (N/S)(∂V/∂P), or theCEO’s options held as a fraction of total shares outstanding multiplied by the “slope” of the Black-Scholesvaluation. For examples of this approach, see Jensen and Murphy (1990b), Murphy (1993), and Yermack(1995).
53 US proxy statements provide information on the number and intrinsic value of options held at the end ofthe fiscal year (based on the fiscal year-end stock price, P). The number (N) and intrinsic value (Y) of
JUNE 1999 EXECUTIVE COMPENSATION PAGE 34
grants are then calculated as (Options Granted)/(Shares Outstanding))• ∂(OptionVal)∂P , using
the actual exercise price and term for current grants, and the approximate price and term for
prior grants. Apart from the approximation for prior grants, the calculation can be made at a
point in time based on data from a single-year’s proxy statement.
5. Total Pay-Performance Sensitivities
Figure 8 shows median pay-performance sensitivities for S&P 500 CEOs, by industry,
from 1992 through 1996. Sensitivities are scaled to reflect changes in CEO wealth per $1,000
change in shareholder wealth. The explicit sensitivities for stock, restricted stock, and stock
options are calculated as described in the preceding subsection. Implicit sensitivities for cash
compensation are determined by first estimating pay-performance elasticities for each year and
for each of the four major industry groups in Figure 8. This industry-level elasticity is
converted into a company-specific pay-performance sensitivity by multiplying by the CEO’s
salary and bonus, and dividing by the market value of the company’s common stock (in
$1000s). The pay-performance sensitivity for accounting-based long-term incentive plans is
determined by dividing the LTIP payment received by the CEO in each year by the change in
shareholder wealth over the period covered by the plan.54
Several stylized facts emerge from Figure 8. First, pay-performance sensitivities are
driven primary by stock options and stock ownership, and not through other forms of
compensation (see also Jensen and Murphy, 1990b; Murphy 1993; Hall and Liebman 1998).
For example, 95% of the estimated 1996 pay-performance sensitivity for CEOs in
manufacturing companies reflects stock options (64%) and stock (31%). This result is not
sensitive to the methodology for estimating pay-performance relations for cash compensation
and LTIPs, since the magnitude of these compensation components are small relative to year-
to-year variance in the dollar value of options and stock. Second, pay-performance sensitivities
vary across industries, and are particularly lower in regulated utilities. Third, pay-performance
sensitivities have become larger from 1992 to 1996. Finally, the increase in pay-performance
sensitivities has been driven almost exclusively by stock option grants.
Figure 9 depicts the effect of company size on firm pay-performance sensitivities for
industrial companies, and illustrates another stylized fact: pay-performance sensitivities are
previously granted options is calculated by subtracting new grants from total outstanding options, andadjusting the year-end intrinsic value of the new grants from the total intrinsic value. I treat the previouslygranted options as a single prior grant with exercise price X, where N(P-X)=Y, or X=P-(Y/N).
54 For example, the LTIP sensitivity for companies using three-year performance is determined by dividing thepayout in year t by the change in shareholder wealth in t, t-1, and t-2. To avoid negative sensitivities and tomitigate the effects of large LTIP awards paid for poor stock-price performance, the LTIP sensitivity isassumed to be zero whenever shareholder returns failed to exceed 5% annually over the performance period.

JUNE 1999 EXECUTIVE COMPENSATION PAGE 35
smaller in larger firms. The 1996 median pay-performance sensitivity for the largest half of the
S&P 500 is $4.36 per $1,000 (reflecting an effective ownership share of about b=.44%),
compared to $7.69 per $1,000 (b=.77%) for the smaller S&P 500 firms. The median pay-
performance sensitivities for S&P Mid-Cap and Small-Cap firms are $15.38 per $1,000
(b=1.54%) and $28.23 per $1,000 (b=2.82%), respectively. Moreover, Figure 9 suggests that
the increase in pay-performance sensitivities documented in Figure 8 is largely a phenomenon
associated with large S&P 500 companies, and not with mid-size and smaller companies.
The inverse relation between company size and pay-performance sensitivities is not
surprising, since risk-averse and wealth-constrained CEOs of large firms can feasibly “own”
only a tiny fraction of the company cash flows through their stock, options, and incentive
compensation. Nor does the inverse relation invalidate pay-performance sensitivities as a
meaningful metric for measuring CEO incentives; rather, the result merely underscores that
increased agency problems are a cost of company size that must be weighed against the
benefits of expanded scale and scope. The inverse relation does suggest, however, the
importance of allowing for size-related heterogeneity when making comparisons across
industry groups, time periods, or countries.
Company size is the most important but not the only source of heterogeneity in calculated
pay-performance sensitivities. The distributions of both stock and option ownership are highly
skewed, and average sensitivities are much higher than the median sensitivities depicted in
Figures 8 and 9. Indeed, an important advantage of analyzing explicit incentives (based on
actual contracts) rather than implicit incentives (based on pooled cross-sectional time-series
data) is that the explicit approach better identifies the heterogeneity. The next step, of course, is
explaining the cross-sectional heterogeneity in pay-performance sensitivities.55
Jensen and Murphy (1990a) conclude that CEO pay-performance sensitivities are “low”
in the sense that they correspond to a median sharing rate of only about .325% for their sample
of Forbes executives from 1970-1988. The analysis in Figure 8, although based on the S&P
500 rather than the Forbes 800, shows that pay-performance sensitivities have nearly doubled
to .6% by 1996. In spite of the sensitivity increase, however, there remains a large gap
between the interests of managers and shareholders. For example, each $10 million of
perquisite consumption (e.g., a new headquarters building, or pet acquisition, or a corporate
jet) costs the CEO only about $60,000 (or, based on the median annual compensation in Figure
2 of $3.2 million, one week’s compensation). Similarly, resisting a hostile takeover attempt 55 Garen’s (1994) analysis of agency-theoretic heterogeneity is a promising start; see also Aggarwal and
Samwick (1999). However, much of the variation in sensitivities is driven by CEO stockholdings, outsideof the control of shareholders and therefore outside the scope of the traditional principal-agent framework.See Himmelberg, Hubbard, and Palia (1998) for an analysis of the determinants of managerial ownership.

JUNE 1999 EXECUTIVE COMPENSATION PAGE 36
promising a $500 million premium to shareholders will personally “cost” the typical CEO
about a year’s compensation, which is substantial, but likely small compared to the lost power
and prestige of running a large corporation.
Several researchers have disputed the Jensen-Murphy estimates on econometric and
theoretic grounds. The econometric criticisms are easily dismissed, since there are no
econometric issues involved in determining the performance measure or estimating the explicit
relation between performance and the value of an executive’s stock and option holdings. The
theoretic criticisms, however, clearly have merit. Haubrich (1994), for example, correctly
points out that the Jensen-Murphy estimates, however low, may well be consistent with the
predictions of agency theory for sufficiently risk-averse executives. Moreover, as emphasized
by Hall and Liebman (1998) and others, modest movements in shareholder returns can lead to
large swings in executive wealth even when the pay-performance sensitivity is small: b∆V can
be large even when b is small, for sufficiently large ∆V. For example, a 10% shareholder
return for a $10 billion company will increase the median CEO’s wealth by $6 million
(assuming b=.6%). However, while factors such as executive risk aversion and company size
and volatility can “explain” low pay-performance sensitivities, these factors exacerbate rather
than mitigate the large conflict of interest between managers and shareholders.
6. Trends in CEO Stock Ownership
Stock ownership provides the most direct link between shareholder and CEO wealth.
Figure 10 describes CEO stock ownership ignoring stock options from 1987 through 1996 and
documents a curious result of the prolonged bull market: the value of stock held by S&P 500
CEOs has increased substantially over the past decade, while the percentage of shares held by
the CEO has been declining. For example, among S&P 500 manufacturing firms, median CEO
ownership has increased from $3.5 million to over $6 million, while median percentage
ownership has fallen from .14% to .11%.56 Similarly, the median percentage ownership in
financial services companies increased from .07% to .12% between 1987 and 1989, and fallen
slightly since 1989. In contrast, the dollar value of median stock ownership in financial firms
has increased tenfold from $1.3 million to over $11 million from 1987 to 1996.57 Median
ownership in utilities has nearly doubled from $0.7 million to $1.5 million from 1987 to 1996,
while median percentage ownership has fallen from .05% to .03%. Finally, median ownership
in “all other S&P 500 industries” has increase from $5.0 million to $6.9 million, while median
percentage ownership has fallen from .35% to .14%. In part, these trends reflect the increasing
56 The average ownership has increased from $19 million to $74 million over this same time period, while
the average percentage ownership has fallen from over 1.1% to .8%.57 Average ownership in financial firms has increased from $8 million to $110 million over the same period.

JUNE 1999 EXECUTIVE COMPENSATION PAGE 37
prevalence of “stock ownership guidelines” (i.e, board-level mandates stipulating ownership
targets expressed in dollars, or as a multiple of base salary). When stock prices are increasing,
executives can sell stock and still achieve the guideline.
Researchers as well as practitioners would likely be split on whether the evidence in
Figure 10 implies that incentives from stock ownership have increased or decreased over the
past decade. The only meaningful measure of CEO incentives and the severity of the agency
problem is, however, the percentage ownership (that is, the pay-performance sensitivity) and
not the dollar value of ownership. As an example to illustrate the distinction, suppose that a
CEO is considering perquisites (headquarters, pet acquisitions, corporate jets) that he
personally values at $1 million but costs shareholders $100 million. The CEO’s decision will
depend solely on his percentage ownership and not his dollar ownership.58 Alternatively,
suppose that a risk-averse CEO is considering a risky project that has a small but positive net
present value. The CEO will be less likely to adopt the project when his dollar ownership is
higher, since dollar holdings essentially measures the extent to which the CEO is undiversified.
Therefore, in terms of the conflicts of interest between managers and shareholders, increases in
percentage ownership holding dollar ownership constant reduces agency problems related to
perquisite consumption, while increasing dollar ownership holding percentage ownership
constant increases agency problems related to risk taking.59
In interpreting the results of Figure 10, it is important to note that the definition of stock
ownership ignores outstanding options. As suggested by Figures 8 and 9, the “fully diluted”
percentage of stock owned by executives has increased substantially over the past decade, even
though direct stock ownership has declined. Consistent with Ofek and Yermack (1997), the
results in Figure 10 suggest that executives with large stock option holdings rationally reduce
their unrestricted stock holdings, likely reflecting both a desire to diversify and to consume.
Moreover, the fact that declines in ownership have been more than offset by increases in option
grants underscores the importance of recognizing options in studies of the relation between
management ownership and corporate performance (e.g., Morck, Shleifer, and Vishny, 1988;
McConnell and Servaes, 1990; Himmelberg, Hubbard, and Palia, 1998)
58 In particular, he will adopt the project if he owns less than 1% of the company’s stock, and reject it if he
owns more, independent of the dollar value of his holdings. Of course, to the extent that perquisites such ascorporate jets and pet projects have income elasticities exceeding unity, we expect that wealthier managerswill be more likely to pursue perquisites, ceteris paribus.
59 Note that management-led leveraged buyouts, in which existing managers buy the company fromshareholders using debt and proceeds from selling their old shares, are an example of how managers cansubstantially increase percentage ownership while holding dollar ownership constant.

JUNE 1999 EXECUTIVE COMPENSATION PAGE 38
7. Relative Performance Evaluation (RPE)
A major empirical prediction of agency theory concerns the use of relative performance
evaluation (RPE) in incentive contracts (Holmstrom, 1982). RPE is a direct implication of the
informativeness principle with unidimensional executive actions: if the stochastic component of
company performance contains an industry or market effect as well as an idiosyncratic effect,
then “taking out the noise” through RPE is incrementally informative in assessing the actions
taken by the CEO. Relative performance evaluation remains a strong prediction of the model
after expanding the managerial action set, since paying based on relative performance provides
essentially the same incentives as paying based on absolute performance, while insulating risk-
averse managers from the common shocks.
I MPLICIT R ELATIVE P ERFORMANCE E VALUATION . Existing studies of RPE have focused on the
implicit relation between CEO cash compensation, company performance, and market and/or
industry performance.60 Gibbons and Murphy (1990) document the strongest support for the
RPE hypothesis, finding that changes in CEO pay are positively and significantly related to
firm performance, but negatively and significantly related to industry and market performance,
ceteris paribus. In addition, Gibbons and Murphy find that CEO performance is more likely to
be evaluated relative to aggregate market movements than relative to industry movements.
Table 8 replicates and updates their analysis based on the following pooled cross-sectional
time-series regression for companies grouped according to major industry and decade:
∆ln(CEO Pay) = α + β(Shareholder Return) + γ(Industry and/or Market Return).
Panel A of Table 8 shows that CEO pay in S&P 500 industrials is positively and
significantly related to firm performance but negatively related to two-digit SIC industry
performance (columns (1), (4), and (7)) and market performance (columns (2), (5), and (8)).
Columns (3), (6), and (9) include both industry and market performance as explanatory
variables. The market-return coefficient is negative and significant in all three regressions,
suggesting that market risks are partially filtered out of executive compensation after
controlling for industry returns. Holding market returns constant, however, CEO pay growth
is negatively and significantly related to two-digit industry returns only in the 1980s, and
insignificantly related to industry performance over earlier and later time periods. These results
support the Gibbons-Murphy conclusion that performance is more likely to be evaluated
relative to aggregate market movements than relative to industry movements. The results also
suggest that RPE among S&P 500 industrials was less important in the 1970s than in the
1980s and 1990s.
60 See, for example, Coughlan and Schmidt (1985), Murphy (1985), Antle and Smith (1986), Gibbons and
Murphy (1990), Janakiraman, Lambert, and Larcker (1992), and Sloan (1993).

JUNE 1999 EXECUTIVE COMPENSATION PAGE 39
Panel B of Table 8 finds little evidence of RPE among S&P 500 financial services
companies in the 1970s or 1980s. The results for the 1990s is similar to the results from
industrial companies: CEO pay in financial services is more likely to be evaluated relative to
aggregate market movements than industry movements. Finally, Panel C of Table 8 finds no
evidence for RPE among S&P 500 utilities in any time period.
E XPLICIT R ELATIVE P ERFORMANCE E VALUATION The descriptive analysis of CEO pay contracts in
Section II suggests that the scope for RPE in actual explicit contracts is rather limited.
Although stock options could theoretically be indexed to industry or market movements,
indexed options are virtually nonexistent in practice. Similarly, the payouts from restricted
stock (as well as stock directly held without restriction) are based solely on absolute returns
and not relative returns. Payouts from annual bonus plans could be based on relative returns,
but, as documented in Table 3, only a minority of industrial companies utilize external peer-
groups in determining performance standards.
Table 9 describes the use of relative performance evaluation in annual bonus plans, based
on the Towers Perrin survey of 177 large US companies described in detail in Section II.3.2.
Just over one-fifth of the 125 surveyed industrials companies use some form of RPE in annual
bonus plans. However, while agency theory predicts measuring performance relative to the
mean or median of the peer group, companies using RPE tend to use it somewhat differently.
In particular, among the industrial companies using RPE, only five (19%) evaluate
performance relative to the mean or median of the industry or market. More frequently,
bonuses are based on a percentile ranking of performance (e.g., a schedule indicating the
bonuses paid for achieving 25th, 50th, and 75th percentile performance relative to a peer
group). Ten respondents (representing 38% of industrial companies using RPE) indicated that
peer-group performance was considered in the standard-determination process, but did not
specify how it was used. In most cases, RPE is based on the performance of specific industry
peers identified and selected by the company; this peer group may or may not correspond to the
peer group used in the company proxy statements.61
Table 9 shows that explicit RPE is used more extensively in financial-services firms and
utilities than in industrial companies: 57% of the financial-services firms, and 42% of the
utilities report using RPE in their annual bonuses, compared to only 21% of the industrials.
Similar to the results for industrials, RPE is based on the performance of specific industry
61 As part of the enhanced SEC proxy disclosure requirements introduced in October 1992, companies must
provide a chart showing their five-year stock-price performance measured relative to the market and to an“industry peer group” which may be either self-selected or a published industry index.

JUNE 1999 EXECUTIVE COMPENSATION PAGE 40
peers, and RPE-based bonuses typically depend on percentile performance (rather than
performance measured relative to the peer-group mean or median).
The results on explicit RPE in Table 9 seem at odds with the results on implicit RPE in
Table 8. In particular, while Table 8 suggests that relative performance is an important
determinant of year-to-year changes in cash compensation, Table 9 suggests that few industrial
companies explicitly tie pay to relative performance. In addition, while Table 8 shows that
implicit RPE is most likely based on the market rather than the industry, Table 9 shows than
companies using RPE seldom use broad-based market peer groups. Finally, while Table 8
provides stronger support for the RPE hypothesis for industrials than for utilities and financial
services companies, Table 9 shows that the prevalence of explicit RPE contracts is actually
higher in utilities and financial services than in industrials.
The differences in Tables 8 and 9 may be explained by differences in sample composition
and time periods analyzed. More important, I believe, is the fact that the implicit RPE relations
in Table 9 are based on relative stock-market performance, and yet annual bonuses are directly
tied to accounting profits and not stock-market returns. Sloan (1993) shows that accounting
profits are more closely correlated with “market-adjusted returns” than with raw returns. Thus,
the market effect documented by Gibbons and Murphy (1990) and replicated in Table 8 may
simply reflect the correlation between accounting profits and market-adjusted stock returns.
As discussed in Section II.3.3, the absence of indexed stock option plans reflects, in
part, both unfavorable accounting consequences and the fact that fully indexed options expire
worthless half of the time. Still, the paucity of RPE in options and other components of
executive compensation remains a puzzle worth understanding. One potential explanation
concerns the costs of obtaining performance data for industry peers: relative accounting data
are only available at annual (or at best quarterly) intervals, and only then with a substantial lag.
However, while their are problems in measuring relative accounting performance, relative
stock-price data are available instantaneously at trivial cost. Another explanation for the paucity
of RPE is that executives can construct RPE on their own account, by “selling short” industry
or market portfolios commensurate with their stock and option holdings. However, there is to
my knowledge no evidence (including anecdotal accounts) supporting this investment
behavior, and it seems unlikely that executives have the financial resources available to offset
fully their holding in company stock and options. Similarly, although companies might avoid
RPE in anticipation of executives “undoing” RPE through long positions in industry or market
portfolios, it is unclear why executives would want to undo RPE. Finally, there may be
strategic reasons (such as covert collusion) why companies avoid RPE (Aggrawal and
Samwick, 1997).

JUNE 1999 EXECUTIVE COMPENSATION PAGE 41
8. Do Incentives Matter?
Over the past decade, academics, institutional shareholders, and shareholder-activist
groups have called for tying CEO pay more directly to changes in shareholder wealth. These
pressures have played at least some role in the increasing prevalence of stock ownership
guidelines and the recent explosion in stock option grants. Underlying the push towards
increasing the sensitivity of CEO pay to stock-price performance is the belief that such policies
will improve management incentives and subsequent company performance. Unfortunately,
although there is a plethora of evidence on dysfunctional consequences of poorly designed pay
programs, there is surprisingly little direct evidence that higher pay-performance sensitivities
lead to higher stock-price performance.62 In this subsection, I comment on the difficulty of
conducting this seemingly straightforward experiment, and then describe some of the
approaches taken by researchers to address this important question.
E XPERIMENTAL D IFFICULTY : E FFICIENT C APITAL M ARKETS. The scarcity of empirical evidence
linking stock-based compensation to shareholder returns reflects financial economists’ belief in
efficient capital markets: the current stock price reflects all publicly available (and some
privately available) information. Information on managements’ pay-performance sensitivities is
publicly available and thus already incorporated into stock prices. For example, suppose there
are two firms, Firm A with high pay-performance sensitivities and Firm B with low
sensitivities. Investors, realizing that Firm A has better managerial incentives, will bid up the
price of Firm A until the expected risk-adjusted returns from investing in Firm A are exactly
equal to the expected risk-adjusted returns from Firm B. An experiment that measures pay-
performance sensitivities at a point in time, and examines shareholder returns over subsequent
years will, therefore, find no difference in the average returns based on initial stockholdings.
The result that current incentives have no effect on expected subsequent returns does not
mean incentives are unimportant. In fact, managers in Firm A are predicted to be working
harder, smarter, and more in the interest of shareholders than managers of Firm B. In addition,
the scenario described assumes that markets are completely efficient and incorporate all relevant
information regarding managerial incentives. Subsequent stock returns can clearly be affected
when relevant information is non-public (such as the details of annual bonus plans, or
unannounced commitments for future option grants) or when shareholders misestimate or
misinterpret compensation’s impact on managerial behavior.
Another experimental difficulty is that aggressive and innovative incentive plans are often
introduced as a “last resort” by troubled companies. Gilson and Vetsuypens (1993), for
62 Exceptions include Masson (1971) and Abowd (1990), who offer evidence suggesting that stock-based
incentives improve subsequent stock-price performance.
JUNE 1999 EXECUTIVE COMPENSATION PAGE 42
example, document significant increases in stock-option compensation for companies in
financial distress. Dial and Murphy (1995) document significant increases in stock-based
compensation at General Dynamics and other defense firms forced into decline and financial
jeopardy following the end of the Cold War. In contrast, many historically successful
companies (e.g., General Electric) adopt mundane and traditional compensation plans
characterized by large base salaries with modest bonus and option opportunities. One
hypothesis is that aggressive pay plans are not needed in rapidly growing and successful
organizations, because growth provides ample promotion opportunities and because pay tends
to rise with company size. In any case, cross-sectional comparisons of pay structures and
company performance will lead to misleading conclusions about the impact of managerial
incentives.
E VENT -S TUDY A NALYSES. Under the efficient-markets hypothesis, the effect of increased
managerial incentives—through increased stock ownership or introduction of new stock-based
compensation plans—will be incorporated into the stock price upon announcement. Therefore,
the natural test for analyzing the effect of managerial incentives is to analyze the stock-price
reaction to announcements of stock-based plans and increased managerial shareholdings. The
general problem in identifying this effect is that the announcement “dates” are often
ambiguous. The appropriate date for increased shareholdings, for example, might be the date
the transaction was anticipated, or actually made, or disclosed in insider-transaction filings
with the SEC. Similarly, the appropriate “announcement date” for new compensation plans
might be the date management passed the proposal to the board for approval, the date the board
agreed on the plan, the date the plan was printed in the proxy statement, the release date for the
proxy, the SEC-stamp date for the proxy, or the date the proxy was actually delivered to
shareholders and the media.
An relevant early study is Brickley, Bhagat, and Lease (1985) who document a 2.4%
abnormal return (that is, return after factoring out all market effects) for firms adopting stock-
based compensation plans. The authors carefully screen for other announcements made in the
proxy, and consider a variety of possible announcement dates. More recently, Yermack (1997)
finds that stock prices increase after (non-publicly announced) grants of executive stock
options. In both cases, the results are consistent with reduced agency costs but are also
consistent with a more sinister hypothesis: executives push to adopt options programs, and
time option grants, in anticipation of announcements likely to boost stock prices.63
63 Yermack (1997) assumes that executives control the timing of option grants, and receive grants just prior
to the release of favorable information. I believe a more sensible interpretation of Yermack’s data is thatoption grants are largely exogenous, and executives “time” the release of the favorable information untilafter the exogenous option grant. This interpretation is based on the facts that (1) most large corporations

JUNE 1999 EXECUTIVE COMPENSATION PAGE 43
E VIDENCE ON M ANAGERIAL S TOCKHOLDINGS AND Q-R ATIOS. Several researchers have attempted to
circumvent the implications of efficient capital markets by examining the relation between
management stockholdings and company performance as measured by Tobin’s Q-Ratio,
defined as the market value of the firm divided by the replacement costs of the assets. The
earliest and best-known study of management holdings and Q-Ratios is Morck, Shleifer, and
Vishny (1988). They find that firm performance increases with managerial holdings when
managers hold between 0% and 5% of the outstanding stock. They document a negative (but
weak) relationship between management holdings and performance when managers hold
between 5% and 25% of the stock (which they attribute to an “entrenchment effect”), and a
renewed positive relation for holdings exceeding 25%. McConnell and Servaes (1990) re-
examine the evidence on managerial stockholdings and firm value, and find that Q’s increase as
share ownership becomes concentrated in the hands of the managers and boardmembers until
insider ownership exceeds 40% or 50% of the outstanding shares. More recently, Mehran
(1995) finds that firm performance (measured by Tobin’s Q and return on assets) is positively
related to the percentage of executive compensation that is stock-based, and the percentage of
equity held by management. However, Himmelberg, Hubbard, and Palia (1998) control for
the endogeneity of ownership, and find little evidence that changes in managerial ownership
affect performance.
E VIDENCE FROM LBO S AND M ANAGEMENT B UYOUTS. Leveraged management buyouts are a natural
testing ground for stock-based incentives, since (for the most part) the same managers are
managing the same assets and employees before and after the restructuring, and the primary
differences are changes in the incentives (derived from increased equity holdings, increased
stock-based compensation, the discipline of debt, and the increased monitoring from the LBO-
association). Kaplan (1989, 1991) finds that, subsequent to LBO transactions, CEO holdings
increase from about 1% of the firm to 6.4%, while the holdings for the top-management team
increase to over 20%. He also finds that operating income increases by more than 20% by the
third post-buyout year (relative to the pre-buyout period) and that cash flows increase by 80%.
Pre-buyout public shareholders earn an average 38% market-adjusted return at the buyout. For
LBO companies making the “round trip” back to public ownership, Kaplan estimates an
additional market-adjusted return of 42% for the investors in the post-buyout capital.
In addition to Kaplan’s large-scale data analysis, there have been numerous case studies
that describe the effects of incentives in highly leveraged organizations. For example, an LBO
make option grants at a fixed time each year (e.g., following the March compensation committee meeting),and (2) Yermack finds no evidence that executives receive larger quantities of options prior to favorableannouncements. Option exercises may also be unrelated to timing: Carpenter and Remmers (1998) find noevidence that options are exercised in advance of unfavorable announcements (or adverse stock-priceperformance).

JUNE 1999 EXECUTIVE COMPENSATION PAGE 44
at Cain Chemical produced a 100% return in nine months (Jensen and Barry, 1991) and O. M.
Scott’s LBO produced similar results (Baker and Wruck, 1989). Leveraged recapitalizations at
Sealed Air and other firms have produced spectacular increases in shareholder value (Wruck,
1994). In all of these studies and cases, the authors document systematic changes in
managerial behavior consistent with the changes in stock-based managerial incentives.
Overall, the evidence is consistent with the hypothesis that stock-based incentives are
important drivers of managerial actions and corporate performance. There remains little direct
evidence, however, on the returns a company can expect from introducing aggressive
performance-based compensation plans. The evidence is, at best, suggestive, and I believe that
fully analyzing and documenting the effect of executive incentives on subsequent performance
is a fruitful, if not critical, direction for future research in executive compensation.
IV. Executive Turnover and Company Performance
Closely related to research on executive compensation is the growing body of research
on company financial performance surrounding CEO turnover (Murphy and Zimmerman,
1993). Several stylized facts regarding CEO turnover emerge from the literature. First, as
documented in the pioneering studies by Coughlan and Schmidt (1985) and Warner, Watts,
and Wruck (1988), there is an inverse relation between net-of-market performance and the
probability of management turnover.64 Second, the magnitude of the turnover-performance
relation is strongest in companies dominated by independent outside directors (Weisbach,
1988). Third, companies performing poorly relative to their industry are most likely to hire a
replacement CEO from outside the firm (Parrino, 1997). Fourth, following management
changes there are greater frequencies of asset write-offs (Strong and Meyer, 1987; Elliott and
Shaw, 1988), income-reducing accounting method changes (Moore, 1973), income-reducing
accounting accruals (Pourciau, 1993), and divestitures of previous acquisitions (Weisbach,
1992).65
64 See also Weisbach (1988), Gilson (1989), Jensen and Murphy (1990), Gibbons and Murphy (1990),
Murphy and Zimmerman (1993), Kaplan (1994a, 1994b), Denis and Denis (1995), Hadlock and Lumar(1997), Parrino (1997), Mikkelson and Partch (1997), and Huson, Parrino, and Starks (1998). Internationalcomparisons of executive turnover include Kang and Shivdasani (1995), Kaplan (1994a, 1994b, and 1997).
65 The post-turnover behavior has generally been interpreted as incoming managers boosting future earnings atthe expense of transition-year earnings by writing off unwanted operations and unprofitable divisions (thatis, by taking an earnings “bath” that can be blamed on their predecessors). Murphy and Zimmerman (1993),however, control for the endogeneity of CEO turnover and show that post-turnover behavior is drivenprimarily by pre-turnover deteriorating performance rather than by managerial discretion.

JUNE 1999 EXECUTIVE COMPENSATION PAGE 45
The negative relation between stock-price performance and subsequent turnover has
generally been interpreted as evidence that boards fire poorly performing CEOs. However,
until very recently, managers were rarely openly fired from their positions. Warner, Watts, and
Wruck (1988), for example, analyzed 272 firms from 1963-78 and found only a single case of
an outright firing and only 10 cases in which poor performance was cited as one of the reasons
for the separation. Weisbach (1988) examined 286 management changes for 1974-83 and
found only nine cases in which boards mention performance as a reason why the CEO was
replaced. These data seem at odds with the highly publicized recent management changes at
companies such as American Express, Apple Computer, Digital, Eastman Kodak, IBM and
Westinghouse, suggesting that forced resignations have become more commonplace, and
indicating a potential “regime shift” in disciplinary management turnover in the 1990s.
Two recent studies, Mikkelson and Partch (1997) and Huson, Parrino, and Starks
(1998), have analyzed secular changes in turnover-performance relations. Mikkelson and
Partch compare the relation between CEO turnover and company performance for
approximately 200 firms during two periods: an “active takeover market” from 1984-88 and an
“inactive takeover market” from 1989-93. They document a slight decrease in “CEO departure
rates” across the two five-year periods: 39% of their sample CEOs left their firms in the earlier
period, compared to 34% in the later period.66 Moreover, for their 1984-88 sample they find
that CEOs performing in the lowest quartile of performance (measured by industry-relative
operating performance) are significantly more likely to depart than CEOs performing in the top
quartile. However, they find no relation between CEO departure rates and quartile performance
over the 1989-93 period. They conclude that disciplinary management turnover has declined,
and suggest that this decline is associated with the decline in takeover activity.
Huson, Parrino, and Starks (1998) analyze 1,316 CEO successions from 1971 to 1994.
They divide their sample into four six-year periods, 1971-76, 1977-82, 1983-88, and 1989-
94. In addition to analyzing the performance-determinants of period-by-period departure rates,
the authors distinguish between “forced” and “voluntary” departures and examine whether the
replacement CEO is promoted from within the company or appointed from outside the
company.67 In contrast to the Mikkelson-Partch results, Huson, Parrino, and Starks document
that frequencies of forced turnover and outside succession have increased over time, and
66 This difference is not statistically significant. However, when the authors analyze “complete management
changes,” defined as changes in three job titles (often held by the same individual)—CEO, President, andChairman—they find a significant secular decline in management departures.
67 The authors define forced departures as (1) public firings reported in the Wall Street Journal and (2)departures in which the incumbent CEO is younger than 60 and does not leave for health reasons or forother employment. Outside replacements are defined as executives serving in the firm less than one yearprior to being appointed CEO.

JUNE 1999 EXECUTIVE COMPENSATION PAGE 46
conclude that internal monitoring by boards of directors has become more effective in recent
years, in spite of the decline in takeover activity. Resolving the differences between the results
in these two studies is beyond the scope of this paper.68 However, in the remainder of this
section, I will describe some basic facts and trends in CEO departure and turnover-
performance sensitivities to help reconcile these results and to encourage future research in this
important area.
Figure 11 shows year-by-year departure rates for S&P 500 CEOs grouped according to
whether company performance over the prior two years fell below or above the bottom quartile
of performance for S&P 500 companies. For purposes of this analysis, departure rates are
defined as the percentage of CEOs serving in their last fiscal year, and performance is defined
as the two-year return to shareholders minus the value-weighted two-year return of all
Compustat companies in the same two-digit SIC industry. Departure rates for poorly
performing CEOs range from 22.5% in 1971 to 7.7% in 1976 (averaging 15.0%) while
departure rates for better-performing CEOs range from 15.6% in 1970 to 8.0% in 1986
(averaging 10.8%). Departure rates for poorly performing CEOs exceeded those for better-
performing CEOs in all but three of the 26 years in the sample, suggesting that the probability
of CEO departure is higher following bad performance than following good.
Most studies of CEO turnover have attempted to distinguish between “normal”
retirements and abnormal separations driven by poor performance. The natural proxy for
normal retirement is the executive’s age, since older CEOs are likely to leave their positions for
reasons having nothing to do with performance. Figure 12 describes the distribution of CEO
age-at-departure, for S&P 500 CEOs grouped by decade and by whether their net-of-industry
stock performance is below or above the bottom quartile. The figure is based on 1,089 CEO
departures from 1970 through 1995, and illustrates the well-documented result that CEOs are
most likely to leave their firm at ages 64 or 65. In fact, across the 26-year sample, 32.8% of
the CEOs left their firms at ages 64 or 65, and 62% of the CEOs left the firm between the ages
of 60-66. However, the figure shows that the prevalence of departing upon “normal
retirement” has diminished over time. In particular, the percentage of good performers retiring
at age 64 or 65 (i.e., the right-hand column of Figure 12) fell from 39% in the 1970s to 35% in
the 1980s to only 29% in the 1990s.
68 Huson, Parrino, and Starks conclude that the differences may reflect secular changes in the measures used by
boards to evaluate CEO performance. In particular, while Mikkelson and Partch find a decline in the relationbetween turnover and industry-relative accounting profits, Huson, Parrino, and Starks replicate this findingin their data, but find an increased relation between turnover and the change in industry-relative accountingprofits.

JUNE 1999 EXECUTIVE COMPENSATION PAGE 47
Figure 12 also shows that the prevalence of normal retirement varies with company
performance. In particular, 35% of the 780 CEOs performing above the bottom quartile retired
at ages 64 or 65, compared to only 28% of the 309 poor performing CEOs. Executives in
poor-performing companies tend to depart at younger ages: 34% of the poor-performing CEOs
left before age 60, compared to only 24% of the CEOs from better-performing companies.
Prior research on management turnover has generally interpreted these results as reflecting
CEOs who were implicitly (but rarely publicly) fired for poor performance before reaching
normal retirement ages.
Table 10 reports coefficients from ordinary least-squares regressions predicting the
annual probability of CEO turnover as a function of firm performance and a dummy variable
for retirement-aged CEOs.69 In order to test whether performance-related dismissals have
increased in recent years, I estimate the following regression for the 1970s, 1980s, and for
1990-95:
Prob(Turnover) = a + b Dummy = 1if age ≥ 64
+ c1
net -of - industryreturn
+ c2
lagged net -of -industry return
(6)
The dependent variable is equal to 1 if the CEO is serving in his last full fiscal year and 0
otherwise. Column (1) reports “pooled” 1970-95 results for S&P 500 Industrials (which
exclude utilities and financial services). The regression intercept of .0784 implies that a young
executive in an average-performing firm (i.e., realizing zero net-of-industry returns) has a
departure probability of about 7.9%. The positive and significant coefficient on the retirement-
age dummy of .2849 implies that an average-performing old CEO (i.e., over 63 years old) has
an annual departure probability of about 36.3% (that is, .0784 + .2849). The negative and
significant coefficient on contemporaneous net-of-industry performance of -.0188 implies that
a young executive realizing returns 30% below the industry average (roughly corresponding to
the bottom quartile) has a departure probability of 8.5%. Thus, consistent with prior research,
column (1) shows that poor performance increases departure probabilities, although the
economic significance of the turnover-performance relation (measured by the increased
departure probability associated with poor performance) is fairly small (Jensen and Murphy,
1990a).
Columns (2), (3), and (4) of Table 10 compare the results from turnover-performance
regressions for S&P 500 CEOs in the 1970s, 1980s, and 1990-95, respectively. The
coefficient on the retirement-age dummy remains positive and significant in all three
regressions, but diminishes over time (consistent with Figure 12). The coefficient on
69 I also estimated turnover probabilities using logistic methodologies and obtained qualitatively identical
results; I focus on the OLS results because of efficiencies in interpretation and exposition.

JUNE 1999 EXECUTIVE COMPENSATION PAGE 48
contemporaneous net-of-industry performance increases (in absolute value) from -.0514 in the
1970s to -.0769 in the 1980s, but then falls to an insignificant -.0042 in the 1990s. The
coefficient on lagged performance falls monotonically (in absolute value), but is statistically
insignificant in all three regressions. Therefore, consistent with the Mikkelson-Partch results, I
find that the relation between management turnover and stock-price performance has declined
since the 1980s. Moreover, even when statistically significant, the effect is economically small:
it is difficult to conclude that the “threat of termination” provided meaningful CEO incentives in
the 1970s and 1980s; this conclusion is even more difficult to reach based on 1990s data.
Columns (5) through (8) of Table 10 show how the relation between performance and
turnover varies with company size for CEOs in industrial companies in the S&P 500, the S&P
Mid-Cap 400, and the S&P Small-Cap 600, based on 1992-95 data from Compustat’s
ExecuComp database. The coefficient on the retirement-age dummy variable is monotonically
increasing in company size: annual departure probabilities for average-performing “old” CEOs
are 42.2% for large S&P 500 firms, 27.5% for small S&P 500 firms, 17.4% for Mid-Cap
firms, and 15.3% for Small-Cap firms. The coefficient on current net-of-industry performance
is statistically significant only for Small-Cap firms. Taken together, the results suggest that
turnover is driven by executive age and not performance in the largest firms, and by
performance and not (primarily) executive age in smaller firms.
Although most research on CEO turnover focuses on the characteristics of departing
CEOs, Parrino (1997) and Huson, Parrino, and Starks (1998) analyze the relation between
company performance and the characteristics of the newly appointed CEO. These papers find
that poorly performing companies often replace CEOs through external appointments rather
than internal promotions. In addition, Huson, Parrino, and Starks document that the
prevalence of outside appointments has increased substantially since the late 1980s.
Figure 13 describes the distribution of tenure-in-company for new CEOs, for S&P 500
companies grouped by decade and by whether their net-of-industry stock performance is below
or above the bottom quartile. The figure is based on 1,005 CEO hires among S&P 500
companies from 1971 through 1996, and replicates the Huson-Parrino-Starks finding that
outside hiring is more commonplace in the 1990s. In particular, in the 1970s only 31 of 373
new hires (8.3%) came from outside of the company. During the 1980s, 36 of the 347
(10.4%) new hires came from outside the company. During the first seven years of the 1990s,
54 of 285 new hires (18.9%) were new to the company. Over the same time period, the
percentage of “seasoned executives” (defined as executives with tenure exceeding 20 years)
promoted to CEOs fell from 58% to 46%.

JUNE 1999 EXECUTIVE COMPENSATION PAGE 49
Figure 13 also replicates the finding that outside hires are more likely following poor
performance than following good performance. In particular, across the 26-year sample,
15.8% of the new hires in poorly performing firms came from outside, compared to 10.6% for
companies performing above the bottom quartile of net-of-industry stock-price performance.
However, the difference in outside hiring prevalence explained by poor performance has
diminished over time. For example, in the 1970s, 14% of new CEOs in poor performing firms
came from outside, compared to only 6% in good performing firms. In the 1980s, the
percentage of outside hires among poor performance remained at 14%, while the prevalence of
outside hiring among good performers grew to 9%. By the 1990s, the percentage of outside
hires in poor and good performing firms was, respectively, 21% and 18%.
The year-by-year prevalence of outside hiring is explored in Figure 14. The figure shows
outside hiring percentages for S&P 500 companies above and below the bottom performance
quartile. Outside hiring for poorly performing CEOs ranges from 0% (in six years) to over
45% in 1996 (averaging 14.6%). Outside hiring in better-performing companies ranges from
0% (in three years) to 21% in 1991 and 1995 (averaging 10.1%). Outside hiring percentages
for poorly performing CEOs exceeded those for better-performing CEOs in 15 of the 26
sample years.
Taken together, the results in Table 10 and Figures 11 through 14 offer mixed support
for the regime shift in executive turnover suggested by a few highly publicized management
changes. On one hand, performance-related turnover has diminished rather than increased in
recent years, and turnover among S&P 500 CEOs in the 1990s is statistically unrelated to
stock-price performance. On the other hand, there has been a dramatic increase in replacing
CEOs through external hires rather than internal promotions. Although the causes and
consequences of this shift is left to future research, I believe the increased prevalence of
outside hiring reflects a regime shift with important implications for management incentives
and organizational performance.
V. The Politics of Pay
No survey of US executive compensation is complete without some discussion regarding
the political factors that influence the level and structure of CEO pay. As emphasized by Jensen
and Murphy (1990a), CEO pay contracts are not a private matter between a principal and an
agent. The public disclosure of executive pay required by the Securities and Exchange
Commission (SEC) virtually guarantees that third parties such as rank-and-file employees,

JUNE 1999 EXECUTIVE COMPENSATION PAGE 50
labor unions, consumer groups, Congress, and the media affect the type of contracts written
between management and shareholders.
Although the business press had followed CEO pay for decades,70 CEO pay did not
really become a public “issue” until 1991. Feature stories on CEO pay aired on the nightly
news broadcasts of the three major networks in the Spring of 1991, and CNN, 60 Minutes and
Nightline devoted segments to CEO pay. The controversy heightened with the November 1991
introduction of Graef Crystal’s (1991) expose on CEO pay, In Search of Excess, and exploded
following President George Bush’s ill-timed pilgrimage to Japan in January 1992,
accompanied by an entourage of highly paid US executives. What was meant to be a plea for
Japanese trade concessions dissolved into accusations that US competitiveness was hindered
by its excessive executive compensation practices as attention focused on the “huge pay
disparities between top executives in the two countries.”71
Consistent with Time magazine’s labeling of CEO pay as the “populist issue that no
politician can resist,”72 CEO pay became a major political issue. High CEO salaries emerged as
a bipartisan campaign issue among the leading candidates in the 1992 presidential election.73
Legislation had been introduced in the House of Representatives disallowing deductions for
compensation exceeding 25 times the lowest-paid worker, and the “Corporate Pay
Responsibility Act” was introduced in the Senate to give shareholders’ more rights to propose
compensation-related policies.74 The SEC preempted the pending Senate bill in February 1992
by requiring companies to include non-binding shareholder resolutions about CEO pay in
company proxy statements,75 and announced sweeping the new rules affecting the disclosure
of top executive compensation in the annual proxy statement in October 1992. In 1993, the
Internal Revenue Service defined non-performance-related compensation in excess of $1
million as “unreasonable” and therefore not deductible as an ordinary business expense for 70 Forbes, for example, began its annual survey of executive compensation in 1971.71 “SEC to push for Data on Pay of Executives,” Wall Street Journal (January 21, 1992). An interesting
postscript to Bush’s 1991 trip is that, by 1997, Japanese executives were claiming that Japan’scompetitiveness was hindered by its out-dated executive compensation practices, and pushed for governmentreforms to allow US-style stock options for Japanese executives.
72 Thomas McCarroll, “The Shareholders Strike Back: Executive Pay,” Time (May 5, 1992).73 “Politics and Policy—Campaign ’92: From Quayle to Clinton, Politicians Are Pouncing on the Hot Issue
of Top Executive’s Hefty Salaries,” Wall Street Journal, January 15, 1992. Bill Clinton promised to “endthe practice of allowing companies to take unlimited tax deductions for excessive executive pay;” DanQuayle warned that corporate boards should “curtail some of these exorbitant salaries paid to corporateexecutives that are unrelated to productivity;” Bob Kerry called it “unacceptable” for corporate executives tomake millions of dollars while their companies are posting losses; Paul Tsonga argued that “excessive payis hurting Americas ability to compete in the international market;” and Pat Buchanen argued “you can’thave executives running around making $4 million while their workers are being laid off.”
74 “Executive Pay (A Special Report),” Wall Street Journal, April 22, 1992.75 “Shareholder Groups Cheer SEC’s Moves On Disclosure of Executive Compensation,” Wall Street Journal
(February 14, 1992).

JUNE 1999 EXECUTIVE COMPENSATION PAGE 51
corporate income tax purposes, and the Financial Accounting Standards Board proposed
deducting the value of stock options upon grant from corporate earnings.
By the mid-1990s, media and political attention focused on the growing disparity
between CEO pay and average worker pay, and on escalating CEO pay in downsizing
companies. Newsweek ran a February 1996 cover story on “Corporate Killers: The Hitmen,”
which identified CEOs both by their salaries and by how many employees had been fired in
recent restructurings (Sloan, 1996). In September 1996 a national coalition of labor, religious,
student, and community groups called “Jobs With Justice” held rallies and marches in 33 cities
“to denounce corporations that downsized and cut wages and benefits for working people
while increasing compensation for corporate executives.” In 1997, the AFL-CIO launched a
website focusing exclusively on “exorbitant pay schemes that have created unprecedented
inequities in the American workplace” and described as a “working families’ guide to
monitoring and curtailing the excessive salaries, bonuses and perks in CEO compensation
packages.”76
Figure 15 illustrates relative trends in CEO pay and worker compensation contributing to
the ongoing controversy over CEO pay levels. In 1970, the average S&P 500 CEO made about
30 times more than the average production worker.77 By 1996, the average S&P 500 CEO
received cash compensation nearly 90 times greater than the average earnings for production
workers, and total realized compensation (including gains from exercising stock options) of
210 times the earnings for production workers. Moreover, since downsizing increases stock
prices in industries saddled with excess capacity (Jensen, 1993), layoff announcements have
generally increased the value of executive stock options, further fueling resentment among
disgruntled and displaced workers.
Jensen and Murphy (1990a,b) predicted that the populist attack on CEO pay would lead
to both lower pay levels and lower pay-performance sensitivities. However, as documented in
this paper, both the level of CEO pay and the sensitivity of CEO wealth to stock-price
performance have increased substantially since the pay controversy “peaked” in the early
1990s. The increase in pay levels and sensitivities, reflecting in large part the recent explosion
in stock option grants, is consistent with the Jensen-Murphy normative prescriptions (that
companies should increase pay sensitivities regardless of the political cost) but inconsistent
with their “implicit regulation” hypothesis.
76 Quotes taken from the AFL-CIO website, http://aflcio.paywatch.org/ceopay. This website also discusses
Teamsters publications titled America’s Least Valuable Directors and Runaway Executive Pay at UnionPacific and the Clubby Board of Directors Responsible for It.
77 Production worker pay calculated as 52*(avg. weekly hours of production workers)*(avg. hourly earnings ofproduction workers), based on data from the Current Employment Statistics, Bureau of Labor Statistics.

JUNE 1999 EXECUTIVE COMPENSATION PAGE 52
One interpretation of the recent trends in CEO pay is that a bull market is the “best
defense” against political pressure. The US Congress cannot effectively regulate CEO pay
without widespread shareholder consent, and shareholders in a bull market are relatively
complacent. Still, there is ample evidence that politics and public perception play an important
role in determining the structure and level of executive compensation, even in a bull market.
DeAngelo and DeAngelo (1991), for example, study the US steel industry in the 1980s and
document that CEOs receive lower cash compensation in union-negotiation years than in other
years, interpreting these cuts as representing “symbolic sacrifices that encourage all
stakeholders to participate in the concessions needed to salvage the firm.” Joskow, Rose, and
Wolfram (1996) analyze the relation between CEO pay and firm characteristics in the electric
utility industry, and conclude that political pressures constrain CEO pay levels in that industry.
Murphy (1996) finds that managers adopt disclosure methodologies that reduce reported or
perceived compensation, interpreting this evidence as supporting the hypothesis that managers
bear nonpecuniary costs from high reported levels of compensation. Dial and Murphy (1995)
document the political pressures on pay at General Dynamics, leading the company to replace a
controversial bonus plan with conventional stock options. Zenner and Perry (1997) and Rose
and Wolfram (1997) analyze the impact of the $1 million “cap” on deductibility of non-
performance-pay, finding that companies subject to the cap have reduced relative levels of base
salaries, while increasing stock options and other performance-related pay.
Organizational Behaviorists have focused on the potential political costs of wage
disparities among the top management group and between executives and lower level
workers.78 From an economic perspective, high pay disparity across hierarchical levels can
strengthen incentives for employees in promotion tournaments (Lazear and Rosen, 1981).
However, from a sociological and psychological perspective, perceived “pay inequities” lead to
lower productivity and product quality, decreased employee morale, and increased turnover.79
Understanding the effects of pay inequities in organizations, and understanding more generally
the role of politics in shaping compensation practices, seems a natural direction for future
research in executive compensation.
78 See, for example, Cowherd and Levine (1992), Finkelstein (1996), O’Reilly C., Wade, and Pollock (1998),
and Hambrick and Siegel (1998).79 See O’Reilly C., Wade, and Pollock (1998) for a survey of the extensive literature on social comparison
theory (Festinger, 1954) as applied to employees and executives. In addition, see Lazear (1989) for aneconomic model incorporating the effects of such social comparisons in organizations.

JUNE 1999 EXECUTIVE COMPENSATION PAGE 53
VI. Conclusion
The objective of this paper is to encourage research in executive compensation by
equipping potential researchers with a comprehensive description of pay practices and a
representative summary of the empirical and theoretical research. The paper is largely
descriptive, and focused on the explicit rather than the implicit aspects of executive incentive
contracts.
This paper has documented and updated several cross-sectional stylized facts, and has
shown how executive compensation practices vary with company size, industry, and country.
For example, the analysis has shown that (1) levels of pay are higher, and pay-performance
sensitivities are lower, in larger firms; (2) levels of pay and pay-performance sensitivities are
lower in regulated utilities than in industrial firms; (3) levels of pay and pay-performance
sensitivities are higher in the US than in other countries. The analysis has also documented that
pay-performance sensitivities are driven primary by stock options and stock ownership and not
through other forms of compensation.
The paper has also documented several recent trends in executive compensation and
turnover. In particular, levels of pay and pay-performance sensitivities in the US have
increased substantially over the past decade, driven primarily by an explosion in stock-option
compensation. In addition, although the relation between company performance and executive
turnover has weakened over the past decade, CEOs in the 1990s are less likely to depart at
“normal” retirement ages than in earlier years, and are more likely to be replaced through
outside hires rather than through internal promotions.
Although the theoretical and empirical literature on executive compensation is fairly well
developed, it is far from complete and there are many issues worthy of continued research. For
example, while the recent increase in CEO pay levels is well documented, the factors
underlying the trend (e.g., the bull market and a “ratchet effect” caused by compensation
surveys) are not. Why have stock options become such an important part of the compensation
package in recent years? Why are US executives paid more than their foreign counterparts? Are
international practices converging? And, what are causes and consequences of the effects of the
growing disparity between CEO and rank-and-file pay?
The parameters of the executive contract also merit additional attention. Why are
executive bonus contracts inherently non-linear while stock-based pay is inherently linear?
Why are performance standards in bonus plans typically based on annual budgets rather than
on external measures such as the cost of capital or peer-group performance? Why is there so
little variation in option parameters (e.g., exercise prices, expiration terms) across companies?

JUNE 1999 EXECUTIVE COMPENSATION PAGE 54
Why are executives allowed, if not encouraged, to exercise options immediately upon vesting
rather than holding them until expiration? Why is RPE scarce, and observed only for
accounting returns and not stock returns?
Perhaps the most important area for future research is on the effect of CEO incentives on
subsequent company performance. Although there is ample evidence that CEOs (and other
employees) respond predictably to dysfunctional compensation arrangements, it is more
difficult to document that the increase in stock-based incentives has led CEOs to work harder,
smarter, and more in the interest of shareholders. Do executives understand how their actions
affect shareholder value? Has the increase in stock-based incentives contributed to the recent
bull market, or resulted from it? Do increases in broad-based stock incentives for lower-level
employees lead to improved stock-price performance?
Finally, I believe our understanding of the relative importance of accounting-based
bonuses and stock-based compensation is far from complete. The fact that stock-based
compensation accounts for most of the variation in executive wealth (see, for example, Figures
8 and 9) does not imply that executive incentives are driven primarily by stock rather than
accounting performance. Many CEOs understand how their actions affect accounting profits,
but do not understand how their actions affect shareholder value. Rational managers will
naturally focus on increasing accounting bonuses and devote less attention to stock prices if
they know how to affect the former but not the latter.
Labor economists have traditionally focused on markets rather than firms, not because
labor inside organizations is unimportant but rather because data inside organizations are
unavailable and inherently messy. The managerial labor market offers a unique and data-rich
environment to analyze many concepts central to labor economics, including incentives,
marginal productivity, contracts, promotions, separations, and careers. Even when results for
executives cannot be easily extrapolated to other labor groups, the results are important in their
own right: top managers are critical and highly visible inputs into the corporate production
function, and understanding better their role can enrich our understanding of both incentives
and organizations.

JUNE 1999 EXECUTIVE COMPENSATION PAGE 55
Appendix
Option Valuation and the Black-Scholes Formula
The Black-Scholes option valuation formula, modified to incorporate continuous
dividend payments, is given by
Option Value = Pe− ln(1+d)T N(z) − Xe− ln(1+ r)TN(z − σ T ),
where:
P = Grant-date stock price
X = Exercise price
T = Expiration term (years)
d = Annualized dividend yield
σ = Annual stock-price volatility
r = Risk-free interest rate
z = ln(P/X) + (ln(1+ r) − ln(1+ d) +σ 2/2)T
σ T
N() = Cumulative normal distribution function.
The risk-free rate (for options denominated in US dollars) is typically defined as the
annualized yield US Treasury securities maturing on the option’s expiration date.
Conceptually, dividend yields and stock-price volatilities correspond to anticipated yields and
volatilities over the option term. As a practical matter, however, these parameters are typically
computed based on historical data. For example, volatilities are most often defined as
12 times the standard deviation of ln(1+Monthly Return), measured over the prior 36, 48, or
60 months. Similarly, dividend yields are typically measured as the annualized yield over the
past one, two, or three years. In both cases, outliers are omitted; ExecuComp’s “modified”
Black-Scholes involves adjusting volatility and yield estimates towards their historical mean.

JUNE 1999 EXECUTIVE COMPENSATION PAGE 56
References
Abowd, J. (1990), “Does Performance-Based Managerial Compensation Affect CorporatePerformance?” Industrial and Labor Relations Review, 43(3), S52-73.
Abowd, J., and M. Bognanno (1995), “International Differences in Executive and ManagerialCompensation,” in R. Freeman, and L. Katz, ed., Differences and Changes in WageStructures, Chicago: The University of Chicago Press, 67-103.
Aggarwal, R. and A. Samwick (1997), “Executive Compensation, Strategic Competition, andRelative Performance Evaluation: Theory and Evidence,” Dartmouth College.
Aggarwal, R. and A. Samwick (1999), “The Other Side of the Tradeoff: The Impact of Riskon Executive Compensation,” Journal of Political Economy 107(1): 65-105.
Agrawal, A. and G. Mandelker (1987), “Managerial Incentives and Corporate Investment andFinancing Decisions,” Journal of Finance, 42(4), 823-37.
Agrawal, A. and R. Walkling (1994), “Executive Careers and Compensation SurroundingTakeover Bids” Journal of Finance, 49(3), 985-1014.
Anderson, R. (1997), “Compensation Committees: It Matters Who Sets Pay.” Washington andLee University.
Angel, P. and V. Fumás (1997), “The Compensation of Spanish Executives: A Test of aManagerial Talent Allocation Model.” International Journal of Industrial Organization,15(4), 511-531.
Antle, R. and A. Smith (1986), “An Empirical Investigation of the Relative PerformanceEvaluation of Corporate Executives,” Journal of Accounting Research, 24(1), 1-39.
Baiman, S. and R. Verrecchia (1995), “Earnings and Price-Based Compensation Contracts inthe Presence of Discretionary Trading and Incomplete Contracting,” Journal ofAccounting and Economics, 20(1), 93-121.
Baker, G., M. Jensen and K. J. Murphy (1988), “Compensation and Incentives: Practice vs.Theory,” Journal of Finance, 43(3), 593-616.
Baker, G. (1992), “Incentive Contracts and Performance Measurement.” Journal of PoliticalEconomy 100, 598-614.
Baker, G. and K. Wruck (1989), “Organizational Changes and Value Creation in LeveragedBuyouts: The Case of O.M. Scott & Sons Company,” Journal of Financial Economics,25, 163-190.
Banker, R. and S. Datar (1989), “Sensitivity, Precision, and Linear Aggregation ofAccounting Signals,” Journal of Accounting Research, 27(1) 21-39.
Barro, R. and J. Barro (1990), “Pay, Performance, and Turnover of Bank CEOs,” Journal ofLabor Economics, 8(4), 448-481.
Baumol, W. (1959), Business Behavior, Value and Growth, New York.

JUNE 1999 EXECUTIVE COMPENSATION PAGE 57
Berle, A. A. and G. C. Means (1932), The Modern Corporation and Private Property, NewYork.
Bizjak, J., J. Brickley and J. Coles (1993), “Stock-Based Incentive Compensation andInvestment Behavior,” Journal of Accounting and Economics, 16(1-2-3), 349-72.
Black, F. and M. Scholes (1973), “The Pricing of Options and Corporate Liabilities,” Journalof Political Economy, 81, 637-59.
Boeker, W. (1992), “Power and Managerial Dismissal: Scapegoating at the Top,”Administrative Science Quarterly, 37, 400-421.
Boschen, J. and K. Smith (1995), “You Can Pay Me Now and You Can Pay Me Later: TheDynamic Response of Executive Compensation to Firm Performance,” Journal ofBusiness , 68(4), 577-608.
Brickley, J., S. Bhagat and R. Lease (1985), “The Impact of Long-range ManagerialCompensation Plans on Shareholder Wealth,” Journal of Accounting and Economics,7(1-3), 115-29.
Brunello, G., C. Graziano, and B. Parigi (1999), “Executive Compensation and FirmPerformance in Italy,” University of Udine.
Bushman, R. and R. Indjejikian (1993), “Accounting Income, Stock Price, and ManagerialCompensation,” Journal of Accounting and Economics, 16(1-2-3), 3-23.
Bushman, R., R. Indjejikian, and A. Smith (1996), “CEO Compensation: The Role ofIndividual Performance Evaluation,” Journal of Accounting and Economics, 21(2),161-193.
Campbell, T., Y. Chan, and Marino, A. (1989), “Incentive contracts for Managers whoDiscover and Manage Investment Projects,” Journal of Economic Behavior andOrganizations, 12, 353-364.
Carmichael, H. L. (1988), “Incentives in Academia: Why Is There Tenure?” Journal ofPolitical Economy, 96(3), 453-473.
Carroll, T. and D. Ciscel (1982), “The Effects of Regulation on Executive Compensation.”Review of Economics and Statistics 64(3): 505-509.
Carpenter, J. (1998), “The Exercise and Valuation of Executive Stock Options,” Journal ofFinancial Economics 48(2): 127-158.
Carpenter, J. and B. Remmers (1998), “Stock Price Performance Following Insider OptionExercise,” Stern School of Business, New York University.
Ciscel, D. and T. Carroll (1980), “The Determinants of Executive Salaries: An EconometricSurvey,” Review of Economics and Statistics, 62(1), 7-13.
Conyon, M., P. Gregg, and S. Machin (1995), “Taking Care of Business: ExecutiveCompensation in the United Kingdom.” The Economic Journal, 105, 704-714.
Conyon, M. (1997), “Corporate Governance and Executive Compensation.” InternationalJournal of Industrial Organization, 15(4), 493-510.

JUNE 1999 EXECUTIVE COMPENSATION PAGE 58
Conyon, M. and J. Schwalbach (1997), “European Differences in Executive Pay andCorporate Governance,” Warwick Business School.
Cosh, A. (1975), “The Remuneration of Chief Executives in the United Kingdom,” EconomicJournal, 85, 75-94
Cosh, A and A. Hughes (1997), “Executive Remuneration, Executive Dismissal andInstitutional Shareholdings.” International Journal of Industrial Organization, 15(4),469-492.
Coughlan, A. and R. Schmidt (1985), “Executive Compensation, Management Turnover, andFirm Performance: An Empirical Investigation,” Journal of Accounting andEconomics, 7(1-3), 43-66.
Cowherd, D. and D. Levine (1992), “Product Quality and Pay Equity Between Lower-LevelEmployees and Top Management: An Investigation of Distributive Justice Theory,”Administrative Science Quarterly, 37, 302-320.
Crawford, A., J. Ezzell and J. Miles (1995), “Bank CEO Pay-Performance Relations and theEffects of Deregulation,” Journal of Business, 68(2), 231-56.
Crystal, G. and F. Foulkes (1988), “Don’t Bail Out Underwater Options,” Fortune (March14).
Crystal, G. (1991), In Search of Excess: The Overcompensation of American Executives, W.W. Norton & Company: New York.
DeAngelo, H. and L. DeAngelo (1991), “Union Negotiations and Corporate Policy: A Studyof Labor Concessions in the Domestic Steel Industry during the 1980s,” Journal ofFinancial Economics, 30(1), 3-44.
Dechow, P. and R. Sloan (1991), “Executive Incentives and the Horizon Problem,” Journal ofAccounting and Economics, 14(1), 51-89.
Dechow, P., M. Huson and R. Sloan (1994), “The Effect of Restructuring Charges onExecutives’ Cash Compensation,” Accounting Review, 69(1), 138-56.
DeFusco, R., R. Johnson, and T. Zorn (1990), “The Effect of Executive Stock Option Planson Stockholders and Bondholders,” Journal of Finance 45(2), 617-627.
Denis, D. R. and D. K. Denis (1995), “Performance Changes Following Top ManagementDismissals,” Journal of Finance, 50, 1029-1057.
Dial, J. and K. J. Murphy (1995), “Incentives, Downsizing, and Value Creation at GeneralDynamics,” Journal of Financial Economics, 37(3), 261-314.
Dye, R. (1984) “The Trouble with Tournaments,” Economic Inquiry, 22(1), 147-49.
Dye, R. (1984), “Relative Performance Evaluation and Project Selection.” Journal ofAccounting Research, 30(1), 27-52.
Elliott, J., and W. Shaw (1988), “Write-offs as accounting procedures to manageperceptions,” Journal of Accounting Research (Supplement) 26, 91-119.

JUNE 1999 EXECUTIVE COMPENSATION PAGE 59
Eriksson, T. and M. Lausten (1996), “Managerial Pay and Firm Performance: DanishEvidence,” Aarhus Business School.
Fama, E. (1980), “Agency Problems and the Theory of the Firm,” Journal of PoliticalEconomy, 88(2), 288-307.
Festinger, L. (1954), “A Theory of Social Comparison Processes,” Human Relations, 7, 117-140.
Finkelstein, S. (1996), “Understanding Pay Dispersion within Top Management Teams: ASocial Comparison Perspective,” Amos Tuck School of Business, Dartmouth College.
Garen, J. (1994), “Executive Compensation and Principal-Agent Theory,” Journal of PoliticalEconomy, 102(6), 1175-1199.
Gaver, J., K. Gaver and J. Austin (1995), “Additional Evidence on Bonus Plans and IncomeManagement,” Journal of Accounting and Economics, 19(1), 3-28.
Gibbons, R. (1997), “Incentives and Careers in Organizations,” in D. Kreps and K. Wallis,eds, Advances in Economic Theory and Econometrics (Cambridge University Press) 1-37.
Gibbons, R. and K. J. Murphy (1990), “Relative Performance Evaluation for Chief ExecutiveOfficers,” Industrial and Labor Relations Review, 43(3), 30s-51s.
Gibbons, R. and K. J. Murphy (1992a), “Optimal Incentive Contracts in the Presence ofCareer Concerns: Theory and Evidence,” Journal of Political Economy, 100(3), 468-505.
Gibbons, R. and K. J. Murphy (1992b), “Does Executive Compensation Affect Investment?”Journal of Applied Corporate Finance , Vol. 5, No. 2.
Gibbons, R. and M. Waldman (1998), “Careers in Organizations: Theory and Evidence,” inO. Ashenfelter and D. Card (eds.), Handbook of Labor Economics, vol. 3, North-Holland.
Gilson, S. (1989), “Management Turnover and Financial Distress,” Journal of FinancialEconomics, 25, 241-262.
Gilson, S. and M. Vetsuypens (1993), “CEO Compensation in Financially Distressed Firms:An Empirical Analysis,” Journal of Finance, 48(2), 425-58.
Grossman, S. and O. Hart (1983), “An Analysis of the Principal-Agent Problem,”Econometrica, 51, 7-45.
Groves, T. Y. Hong, J. McMillan, and B. Naughton (1995), “China’s Evolving ManagerialLabor Market,” Journal of Political Economy, 103(4), 873-892.
Hadlock, C. and G. Lumar (1997), “Compensation, Turnover, and Top ManagementIncentives: Historical Evidence,” Journal of Business 70, 153-187.
Hall, B. and Leibman, J. (1998). “Are CEOs Really Paid Like Bureaucrats?” Quarterly Journalof Economics, 113(3): 653-691.

JUNE 1999 EXECUTIVE COMPENSATION PAGE 60
Hallock, K. and K. J. Murphy (1999), The Economics of Executive Compensation, EdwardElgar Publishing Limited.
Hambrick, D. and A. Cannella (1993), “Relative Standing: A Framework for UnderstandingDepartures of Acquired Executives,” Academy of Management Journal, 36(4), 733-762.
Hambrick, D. and P. Siegel (1998), “Pay Dispersion within Top Management Groups:Evidence of its Harmful Effects on Performance of High-Technology Firms.”Columbia University.
Hart, O. and B. Holmstrom (1987), “The Theory of Contracts.” In T. Bewley (ed.), Advancesin Economic Theory, Fifth World Congress. Cambridge: University Press.
Haubrich, J. (1994), “Risk Aversion, Performance Pay, and the Principal-Agent Problem,”Journal of Political Economy, 102(2), 258-76.
Healy, P. (1985), “The Effect of Bonus Schemes on Accounting Decisions,” Journal ofAccounting and Economics, 7, 85-107.
Hebner, K. and T. Kato (1997), “Insider Trading and Executive Compensation: Evidencefrom the US and Japan,” International Review of Economics and Finance, 6(3), 223-37.
Hemmer, T., S. Matsunaga, and T. Shevlin (1998), “Optimal Exercise and the Cost ofGranting Employee Stock Options with a Reload Provision,” Journal of AccountingResearch 36(2): 231-255.
Himmelberg, C., R. G. Hubbard, and D. Palia (1998). “Understanding the Determinants ofManagerial Ownership and the Link Between Ownership and Performance,” ColumbiaUniversity.
Hirshleifer, D. and R. Suh (1992), “Risk, Managerial Effort, and Project Choice,” Journal ofFinancial Intermediation, 2, 308-345.
Holmstrom, B. (1979), “Moral Hazard and Observability,” The Bell Journal of Economics,10, 74-91.
Holmstrom, B. (1982), “Moral Hazard in Teams,” The Bell Journal of Economics, 13(2),324-40.
Holmstrom, B. (1992), “Contracts and the Market for Executives: Comment,” in ContractEconomics, edited by Lars Wein and Hans Wijkander, Blackwell Publishers.
Holmstrom, B. and P. Milgrom (1987), “Aggregation and Linearity in the Provision ofIntertemporal Incentives” Econometrica, 55, 303-328.
Holmstrom, B. and P. Milgrom (1991), “Multitask Principal-Agent Analyses: IncentiveContracts, Asset Ownership, and Job Design.” Journal of Law, Economics, andOrganization, 7, pp. 24-52.
Holthausen, R., D. Larcker and R. Sloan (1995), “Annual Bonus Schemes and theManipulation of Earnings,” Journal of Accounting and Economics, 19(1), 29-74.

JUNE 1999 EXECUTIVE COMPENSATION PAGE 61
Holthausen, R., D. Larcker and R. Sloan (1995), “Business Unit Innovation and the Structureof Executive Compensation,” Journal of Accounting and Economics, 19(2-3), 279-313.
Hubbard, R. and D. Palia (1995), “Executive Pay and Performance: Evidence from the USBanking Industry,” Journal of Financial Economics, 39(1), 105-30.
Huddart, S. (1998), “Patterns of Stock Option Exercise in the United States,” in J. Carpenterand D. Yermack, eds., Executive Compensation and Shareholder Value, NYU andKluwer Academic Publishers, Norwell, MA, 118-140.
Hull, J. (1993), Options, Futures, and Other Derivative Securities, 2nd Edition, Prentice Hall:New Jersey.
Huson, M., R. Parrino and L. Starks (1998), “The Effectiveness of Internal MonitoringMechanisms: Evidence from CEO Turnover Between 1971 and 1994,” University ofTexas.
Janakiraman, S., R. Lambert and D. Larcker (1992), “An Empirical Investigation of theRelative Performance Evaluation Hypothesis,” Journal of Accounting Research, 30(1),53-69.
Jensen, M. (1993). “The Modern Industrial Revolution, Exit, and the Failure of InternalControl Systems,” Journal of Finance, 48(3), 831-857.
Jensen, M. and B. Barry (1991). “Gordon Cain and the Sterling Group (A).” HBS Case 9-492-021.
Jensen, M. and K. J. Murphy (1990a), “Performance Pay and Top-Management Incentives,”Journal of Political Economy, 98(2), 225-64.
Jensen, M. and K. J. Murphy (1990b), “CEO Incentives: It’s Not How Much, but How,”Harvard Business Review. (May/June)
Jensen, M. and W. Meckling (1976), “Theory of the Firm: Managerial Behavior, AgencyCosts and Ownership Structure,” Journal of Financial Economics, 3, 305-360.
John, T. and K. John (1993), “Top-Management Compensation and Capital Structure,”Journal of Finance, 48(3), 949-74.
Jones, D. and T. Kato (1996), “The Determinants of Chief Executive Compensation inTransitional Economies: Evidence from Bulgaria,” Labour Economics, 3(3), 319-336.
Joskow, P. and N. Rose (1994), “CEO Pay and Firm Performance: Dynamics, Asymmetries,and Alternative Performance Measures.” NBER Working Paper No. 4976.
Joskow, P., N. Rose and C. Wolfram (1996), “Political Constraints on ExecutiveCompensation: Evidence from the Electric Utility Industry,” Rand Journal ofEconomics, 27(1), 165-82.
Kang, J. and A. Shivdasani (1995), “Firm Performance, Corporate Governance, and TopExecutive Turnover in Japan,” Journal of Financial Economics, 38(1), 29-58.
Kaplan, R. and D. Norton (1992), “The Balanced Scorecard: Measures That DrivePerformance,” Harvard Business Review. (January/February), 71-79.

JUNE 1999 EXECUTIVE COMPENSATION PAGE 62
Kaplan, S. (1989), “The Effects of Management Buyouts on Operating Performance andValue,” Journal of Financial Economics, 24(2) (October), pp. 217-254.
Kaplan, S. (1991), “The Staying Power of Leveraged Buyouts,” Journal of FinancialEconomics, 29(2), 287-314.
Kaplan, S. (1994a), “Top Executive Rewards and Firm Performance: A Comparison of Japanand the United States,” Journal of Political Economy, 102(3), 510-46.
Kaplan, S. (1994b), “Top Executives, Turnover, and Firm Performance in Germany,” Journalof Law, Economics and Organization, 10(1), 142-59.
Kaplan, S. (1997), “Top Executive Incentives in Germany, Japan, and the US: AComparison,” University of Chicago.
Kato, T. and M. Rockel (1992). “Experiences, Credentials, and Compensation in the Japaneseand US Managerial Labor Markets: Evidence from New Micro Data,” Journal of theJapanese and International Economy, 6(1) 30-51.
Kato, T. (1997), “Chief Executive Compensation and Corporate Groups in Japan: NewEvidence from Micro Data.” International Journal of Industrial Organization, 15(4),493-510.
Kedia, S. (1997). “Strategic Interactions in Executive Compensation Contracts,” HarvardUniversity.
Kole, S. (1997). “The Complexity of Compensation Contracts,” Journal of FinancialEconomics, 43(1), 79-104.
Kostiuk, P. (1990), “Firm Size and Executive Compensation,” Journal of Human Resources,25(1), 90-105.
Lambert, R. (1986), “Executive Effort and the Selection of Risky Projects,” Rand Journal ofEconomics, 17(1), 77-88.
Lambert, R., W. Lanen, and D. Larcker (1989), “Executive Stock Option Plans and CorporateDividend Policy,” Journal of Financial and Quantitative Analysis, 24(4), 409-425.
Lambert, R. and D. Larcker (1988), “An Analysis of the Use of Accounting and MarketMeasures of Performance in Executive Compensation Contracts,” Journal ofAccounting Research, 25, 85-129.
Lambert, R., D. Larcker and R. Verrecchia (1991), “Portfolio Considerations in ValuingExecutive Compensation,” Journal of Accounting Research, 29(1), 129-49.
Lazear, E. and S. Rosen (1981), “Rank-Order Tournaments as Optimum Labor Contracts,”Journal of Political Economy, 89(5), 841-864.
Lazear, E. (1989), “Pay Equality and Industrial Politics,” Journal of Political Economy, 97,561-80.
Leonard, J. (1990), “Executive Pay and Firm Performance,” Industrial and Labor RelationsReview, 43(3), S13-29.

JUNE 1999 EXECUTIVE COMPENSATION PAGE 63
Lewellen, W. and B. Huntsman (1970), “Managerial Pay and Corporate Performance,”American Economic Review, 60(4), 710-20.
Lewellen, W., C. Loderer, and K. Martin (1987), “Executive Compensation and ExecutiveIncentive Problems: An Empirical Analysis,” Journal of Accounting and Economics, 9,287-310.
Lewellen, W., T. Park, and B. Ro (1996), “Self-Serving Behavior in Managers’ DiscretionaryInformation Disclosure Decisions,” Journal of Accounting and Economics, 21(2) 227-252.
Main, G., C. O’Reilly, and J. Wade (1995). “The CEO, the Board of Directors, and ExecutiveCompensation: Economic and Psychological Perspectives,” Industrial and CorporateChange, 11, 606-628.
Main, G., C. O’Reilly, and G. Crystal (1994). “Over Here and Over There: A Comparison ofTop Executive Pay in the UK and the USA,” Contributions to Labour Studies, 4, 115-127.
Masson, R. (1971), “Executive Motivations, Earnings, and Consequent Equity Performance,”Journal of Political Economy, 79(6), 1278-1292.
McConnell, J. and H. Servaes (1990), “Additional Evidence on Equity Ownership andCorporate Value,” Journal of Financial Economics, 27(2) (October), pp. 595-612.
Mehran, H. (1995), “Executive Compensation Structure, Ownership, and Firm Performance,”Journal of Financial Economics, 38(2), 163-84.
Mehran, H., G. Nogler, and K. Schwartz (1998), “CEO Incentive Plans and CorporateLiquidation Policy” Journal of Financial Economics, (forthcoming).
Mikkelson, W. and M. Partch (1997), “The Decline of Takeovers and Disciplinary Turnover,”Journal of Financial Economics, 44, 205-228.
Milgrom, P. and J. Roberts (1992), Economics, Organizations, and Management, NewJersey: Prentice Hall.
Mirrlees, J. (1974), “Notes on Welfare Economics, Information, and Uncertainty,” in M.Balch, D. McFadden, and S. Wu, eds, Essays on Economic Behavior Under Uncertainty(North Holland, Amsterdam).
Mirrlees, J. (1976), “The Optimal Structure of Incentives and Authority within anOrganization,” Bell Journal of Economics, 7, 105-131.
Mookherjee, D. (1984) “Optimal Incentive Schemes with Many Agents,” Review of EconomicStudies, 51(3), 433-446.
Moore, M. (1973), “Management Changes and Discretionary Accounting Decisions,” Journalof Accounting Research 11, 100-107.
Morck, R., A. Shleifer and R. Vishny (1988), “Management Ownership and MarketValuation: An Empirical Analysis,” Journal of Financial Economics, 20, 293-316.
Murphy, K. J. (1985), “Corporate Performance and Managerial Remuneration: An EmpiricalAnalysis,” Journal of Accounting and Economics, 7(1-3), 11-42.

JUNE 1999 EXECUTIVE COMPENSATION PAGE 64
Murphy, K. J. (1986), “Incentives, Learning, and Compensation: a Theoretical and EmpiricalInvestigation of Managerial Labor Contracts,” Rand Journal of Economics, 17(1), 59-76.
Murphy, K. J. (1987), “Executive Compensation in Regulated Utilities,” University ofRochester.
Murphy, K. J. (1993), “Executive Compensation in Corporate America 1993,” UnitedShareholders Association.
Murphy, K. J. (1995), “Politics, Economics, and Executive Compensation,” University ofCincinnati Law Review, 63(2).
Murphy, K. J. (1996), “Reporting Choice and the 1992 Proxy Disclosure Rules,” Journal ofAccounting, Auditing, and Finance, 11(3), 497-515.
Murphy, K. J. (1997), “Executive Compensation and the Modern Industrial Revolution.”International Journal of Industrial Organization, 15(4), 417-426
Murphy, K. J. (1998), “Performance Standards in Incentive Contracts,” University ofSouthern California.
Murphy, K. J. and J. Zimmerman (1993), “Financial Performance Surrounding CEOTurnover,” Journal of Accounting and Economics, 16(1-2-3), 273-315.
Newman, H. and H. Mozes (1997), “Compensation Committee Composition and its Influenceon CEO Compensation Practices,” Fordham University.
Ofek, E. and D. Yermack (1997), “Taking Stock: Does Equity-Based Compensation IncreaseManagers’ Ownership?” Stern School of Business, New York University.
O’Reilly, C., B. Main and G. Crystal (1988), “CEO Compensation as Tournament and SocialComparison: A Tale of Two Theories,”Administrative Science Quarterly, 33, 257-274.
O’Reilly, C., J. Wade, and T. Pollock (1998), “Overpaid CEOs and Underpaid Managers:Equity and Executive Compensation.” Stanford University.
Oyer, P. (1998), “Fiscal Year Ends and Non-Linear Incentive Contracts: The Effect onBusiness Seasonality,” Quarterly Journal of Economics, 113(1): 149-85.
Parrino, R. (1997). “CEO Turnover and Outside Succession: A Cross-Sectional Analysis,”Journal of Financial Economics, 46, 165-197.
Perry, T., and M. Zenner (1997), “Pay for Performance? Government Regulation and theStructure of Compensation Contracts.” University of North Carolina.
Pourciau, S. (1993), “Earnings Management and Nonroutine Executive Changes,” Journal ofAccounting and Economics, 16(1-2-3), 317-36.
Roberts, D. (1956), “A General Theory of Executive Compensation Based on StatisticallyTested Propositions,” Quarterly Journal of Economics, 70(2), 270-294.
Rose, N. and C. Wolfram (1997), “Regulating CEO Pay: Assessing the Impact of the Tax-Deductibility Cap on Executive Compensation,” MIT (December).

JUNE 1999 EXECUTIVE COMPENSATION PAGE 65
Rosen, S. (1982), “Authority, Control, and the Distribution of Earnings,” The Bell Journal ofEconomics, 13(2), 311-323.
Rosen, S. (1992), “Contracts and the Market for Executives,” in Contract Economics, editedby Lars Wein and Hans Wijkander, Blackwell Publishers.
Ross, S. (1973), “The Economic Theory of Agency: The Principal’s Problem,” AmericanEconomic Review. 63, 134-39.
Saly, J. (1994), “Repricing Executive Stock Options in a Down Market,” Journal ofAccounting and Economics, 18(3), 325-356.
Sloan, A. (1996) “Corporate Killers: The Hitmen,” Newsweek (February 26).
Sloan, R. (1993), “Accounting Earnings and Top Executive Compensation,” Journal ofAccounting and Economics, 16(1-2-3), 55-100.
Smith, C. and R. Watts (1992), “The Investment Opportunity Set and Corporate Financing,Dividend, and Compensation Policies,” Journal of Financial Economics, 32(3), 263-92.
Strong, J., and J. Meyer (1987), “Asset writedowns: managerial incentives and securityreturns,” Journal of Finance 20, 643-663.
Tosi, H. and L. Gomez-Mejia (1989), “The Decoupling of CEO Pay and Performance: AnAgency Theory Perspective,” Administrative Science Quarterly, 34, 169-189.
Tosi, H. and L. Gomez-Mejia (1994), “CEO Compensation Monitoring and FirmPerformance,” Academy of Management Journal, 37(4), 1002-1016.
Virany, B., M. Tushman, and E. Romanelli (1992), “Executive Succession and OrganizationOutcomes in Turbulent Environments: An Organization Learning Approach,”Organization Science, 3(1) 72-91.
Warner, J., R. Watts and K. Wruck (1988), “Stock Prices and Top Management Changes,”Journal of Financial Economics, 20, 461-92.
Weisbach, M. (1988), “Outside Directors and CEO Turnover,” Journal of FinancialEconomics, 20(1-2), 431-60.
Weisbach, M. (1993), “The CEO and the Firm’s Investment Decisions,” Journal of FinancialEconomics, 37(2), 159-188.
Wruck, K. (1994), Financial Policy, Internal Control, and Performance: Sealed AirCorporation’s Leveraged Special Dividend, Journal of Financial Economics, volume36, pp. 157-192.
Yermack, D. (1995), “Do Corporations Award CEO Stock Options Effectively?” Journal ofFinancial Economics, 39(2-3), 237-69.
Yermack, D. (1997), “Good Timing: CEO Stock Option Awards and Company NewsAnnouncements,”Journal of Finance, 52(2), 449-476
Zhou, X. (1999), “CEO Pay, Firm Size, and Corporate Performance: Evidence from Canada,”Canadian Journal of Economics (forthcoming).

JUNE 1999 EXECUTIVE COMPENSATION PAGE 66
Table 1
Estimated Elasticity of CEO Salary and Bonus with Respect to Firm Revenues, 1970-1996
Year
Industry1970-1974
1975-1979
1980-1984
1985-1989
1990-1994
1995-1996
Mining &Manufacturing
.246[.37]
.251[.40]
.222[.30]
.225[.24]
.263[.30]
.323[.18]
FinancialServices
.299[.48]
.293[.48]
.262[.42]
.269[.28]
.091[.02]
.220[.08]
Utilities.344[.33]
.341[.29]
.283[.17]
.234[.11]
.219[.16]
.211[.13]
Other.244[.33]
.191[.23]
.150[.15]
.130[.06]
.186[.10]
.198[.11]
Note: R2 in brackets. Elasticities computed from regressions of Log(Salary & Bonus) on Log(Sales) for S&P 500companies,

JUNE 1999 EXECUTIVE COMPENSATION PAGE 67
Table 2
Performance Measures Used in Annual Incentive Plans in 177 Large U. S. Corporations
Industrials(n=125)
Finance & Insurance(n=21)
Utilities(n=31)
Firms with a SinglePerformance Measure
50 11 7
Performance Measures(Number of Firms)
Earningsa (32)EBITb (7)EVAc (5)Discretionary (2)Indiv. Perform (2)Other Financial (2)
Earningsa (8)EBITb (2)Discretionary (1)
Earningsa (6)EVAc (1)
Firms with Two or MorePerformance Measure
75 10 24
Are Measures Additive? Yes=83% Yes=70% Yes=67%
Performance Measures(Number of Firms)
Earningsa (80)EBITb (32)Indiv. Perform (25)Sales (21)Cust. Satisf. (6)Strategic Goals (5)Stock Price (5)Discretionary (4)Op. Objective (4)EVAc (3)
Other: Financial (11) Non-Financial (13)
Earningsa (19)Indiv. Perform (3)Sales (1)Op. Objectives (1)
Other: Financial (1) Non-Financial (0)
Earningsa (23)Costs (9)Op. Objectives (7)Cust. Satisf. (6)EBITb (6)Sales (3)Safety (3)Strategic Goals (3)Indiv. Perform (2)Stock Price (2)EVAc (1)
Other: Financial (3) Non-Financial (5)
Is accounting performancemeasured in absolute dollars,expressed as a return (e.g.,ROE), measured per-share(e.g., EPS), and/or measuredas the growth or changefrom prior year?
Dollar Value 44%Margin/Return 20%Per Share 19%
Growth Rates: Dollar Value 10% Margin/Return 1% Per Share 6%
Dollar Value 19%Margin/Return 52%Per Share 26%
Growth Rates: Dollar Value 4%
Dollar Value 22%Margin/Return 32%Per Share 34%
Growth Rates: Dollar Value 5% Per Share 5%
Source: Data extracted from Towers Perrin’s Annual Incentive Plan Design Survey, 1997.aEarnings includes net income, pre-tax net income, and returns on assets, equity, and capital.bEBIT (Earnings before Interest and Taxes) includes Operating Income, EBITDA, and other cash flow measures.cEVA (Economic Value Added) generally equals a measure of operating income less a charge for capital.

JUNE 1999 EXECUTIVE COMPENSATION PAGE 68
Table 3
Performance Standards Used in Annual Incentive Plans in 177 Large U. S. Corporations
Industrials(n=125)
Finance & Insurance(n=21)
Utilities(n=31)
Performance Standards Basedon a Single Criterion
Number ofEarnings-Based Measures
164 24 23
Performance Standards(% of Measures)
Budget 54%Prior-Year 14%Discretionary 8%Peer Group 14%Timeless Std 4%Cost of Capital 6%
Budget 38%Prior-Year 8%Discretionary 4%Peer Group 46%Timeless Std 4%Cost of Capital 0%
Budget 35%Prior-Year 9%Discretionary 30%Peer Group 26%Timeless Std 0%Cost of Capital 0%
Performance Standards Basedon Multiple Criteria
Number ofEarnings-Based Measures
76 15 23
Performance Standards(% of Measures)
Budget 70%Prior-Year 66%Discretionary 59%Ext. Peer Group 16%Timeless Std 9%Cost of Capital 7%
Budget 87%Prior-Year 47%Discretionary 47%Ext. Peer Group 53%Timeless Std 0%Cost of Capital 0%
Budget 70%Prior-Year 48%Discretionary 74%Ext. Peer Group 17%Timeless Std 9%Cost of Capital 9%
Source: Data extracted from Towers Perrin’s Annual Incentive Plan Design Survey, 1997. Earnings-based measures includesales, operating income, EVA, cash flow, EBIT, pre-tax income, and net income.

JUNE 1999 EXECUTIVE COMPENSATION PAGE 69
Table 4
Pay-Performance Relations in Annual Incentive Plans in 177 Large U. S. Corporations
Industrials(n=125)
Finance & Insurance(n=21)
Utilities(n=31)
Type of Payouts:
“80/120” Plansa
Formula-Based Poolb
Modified “Sum-of-Targets”c
Discretionary Poold
Other
42%10%29%5%
15%
14%14%43%10%19%
39%
32%3%
26%
Shape of Payouts in“Incentive Zone”:
ConvexLinear
ConcaveMixture (2+ Measures)
Discretionary/Other
27%16%15%9%
33%
14%38%10%
38%
13%16%23%3%
45%
Bonus Paid at “Threshold”Performance?
YesNo
Discretionary/Other
56%14%
30%
48%
52%
58%7%
36%
Bonus Capped?
YesNo
87%13%
81%19%
90%10%
Source: Data extracted from Towers Perrin’s Annual Incentive Plan Design Survey, 1997. Payout-shapes based onearnings-based performance measures, including sales, operating income, EVA, cash flow, EBIT, pre-tax income, andnet income.
aPlan depicted in Figure 5 in which threshold performance is defined in terms of some percentage (typically 80%) of targetperformance, and the bonus cap is reached at some higher percentage (typically 120%) of target performance.
bA typical formula-based pool is “5% of Net Income in excess of 12% Return on Equity.” Once determined, the pool isallocated to individuals based on formula and/or discretion.
cThe bonus pool under a “sum-of-targets” approach equals the sum of each participant’s target bonus, modified up or downdepending on company performance. The pool is then allocated to individuals based either on formula or discretion.
dUnder a typical discretionary pool, top managers and the compensation committee review a variety of year-endperformance measures, and subjectively determine the magnitude of the bonus pool.

JUNE 1999 EXECUTIVE COMPENSATION PAGE 70
Table 5
Distribution of CEO Option Grants for 1,000 Companies in Fiscal 1992a
Type of Option GrantNumber of
CompaniesbNumber of
Grants
CEO received no options in fiscal 1992 373
CEO received options in fiscal 1992 627 853
A. Type of Option
Replacement Optionsc 5 5
Reload Optionsd 26 120
Regular Option Grants 618 728
B. Exercise Prices (Regular Grants)
Exercise price is Fair Market Value (FMV) 601 692
“Discount” (Exercise Price < FMV) 21 22
“Premium” (Exercise Price > FMV) 6 11
Exercise Price increases over time 2 2
Exercise Price indexed to market or peers 1 1
C. Term of Option (Regular Grants)
Term< 5 years 14 14
Term = 5 years 36 41
5 years < Term < 10 years 36 41
Term = 10 years 528 602
Term > 10 years 23 27
Term depends on Performance 2 2
D. Dividend Protection (Regular Grants)
Yes 7 8
No 611 720
a Data extracted from company proxy statements (see Murphy, 1993, 1995). Fiscal 1992 includessample firms with fiscal closings from October 1992 through June 1993.
b Totals do not add to 1,000 because some firms grant options in multiple categories.c Replacement options are previously granted options that are reissued at lower exercise prices
following large declines in the company’s stock price.d Reload options are new options granted to replace shares used to finance exercise of existing
options.

JUNE 1999 EXECUTIVE COMPENSATION PAGE 71
Table 6
Certainty-Equivalent Values of Stock Options to Undiversified, Risk-Averse Executives
RestrictedStock
DiscountOption
FMVOption
PremiumOption
Stock Price: $30.00 $30.00 $30.00 $30.00
Exercise Price: $0 $15.00 $30.00 $60.00
Black-Scholes Value: $30.00 $22.88 $17.60 $11.12
Relative RiskAversion
% of Wealthin Firm
1.0 50% $30.00 $22.88 $17.60 $11.12
1.0 75% $27.03 $17.46 $13.43 $6.51
1.0 90% $22.90 $13.38 $7.88 $4.43
2.0 50% $19.94 $12.76 $7.80 $3.30
2.0 75% $14.31 $7.42 $3.57 $1.17
2.0 90% $10.73 $4.33 $1.62 $0.45
3.0 50% $15.67 $8.63 $4.28 $1.27
3.0 75% $10.90 $4.31 $1.36 $.25
3.0 90% $7.84 $2.04 $0.39 $0.05
Note: The certainty equivalent is calculated as the amount of cash the executive would willingly give up to receiveone option, assuming constant relative risk aversion and assuming that all stock and options are held for tenyears. Wealth invested in firm is assumed to be divided between (non-dividend-paying) stock and options;wealth invested elsewhere is assumed to grow at the risk-free rate, rf=7%. The distribution of stock prices in10 years is assumed to be lognormal with volatility σ=.31 and expected value (rf + β(rm-rf) - σ2/2)T, whereT=10, r m=13%, and β=1.

JUNE 1999 EXECUTIVE COMPENSATION PAGE 72
Table 7
CEO Pay-Performance Elasticities and Sensitivities for Cash Compensation, by Industry
Dependent Variable:∆ ln(Cash Compensation)
Dependent Variable:∆(Cash Compensation)
Independent Variable 1970s 1980s 1990-1996
1970s 1980s 1990-1996
A. S&P 500 INDUSTRIALS(1) (2) (3) (4) (5) (6)
Intercept.0476(11.8)
.0423(8.1)
.0593(6.2)
35.47(9.5)
63.08(6.8)
76.70(4.1)
Ln(1+Return).0940(7.8)
.2143(11.8)
.2625(8.1)
— — —
∆(Shareholder Wealth) — — —.0042(3.1)
.0173(5.7)
.0138(4.1)
R2 .0273 .0558 .0281 .0042 .0136 .0078
Sample Size 2,192 2,353 2,263 2,192 2,341 2,103
B. S&P 500 FINANCE
Intercept.0478(5.7)
.0620(5.3)
.0312(1.9)
26.47(4.4)
30.19(1.4)
296.6(1.3)
Ln(1+Return).1072(4.0)
.2889(6.6)
.4918(9.7)
— — —
∆(Shareholder Wealth) — — —.0164(3.6)
.1406(7.6)
.0875(1.1)
R2 .0556 .1135 .1921 .0450 .1476 .0034
Sample Size 270 339 399 270 339 372
C. S&P 500 UTILITIES
Intercept.0252(4.4)
.0736(7.3)
.0677(5.1)
9.888(3.2)
47.28(5.6)
47.37(3.3)
Ln(1+Return).0732(3.3)
.0880(2.1)
.3983(6.4)
— — —
∆(Shareholder Wealth) — — —.0165(3.0)
.0108(1.4)
.0507(4.3)
R2 .0410 .0160 .1389 .0347 .0072 .0731
Sample Size 252 285 256 252 285 232
Note:t-statistics in parentheses. Sample is based on all CEOs included in the S&P 500. Data prior to 1992 extracted fromForbes Annual Compensation Surveys; data in 1992 and later from Compustat’s ExecuComp database. Compensationin thousands of 1996-constant dollars; shareholder wealth measured in $millions. Cash pay includes salaries,bonuses, and small amounts of other cash compensation.

JUNE 1999 EXECUTIVE COMPENSATION PAGE 73
Table 8
Coefficients of Ordinary Least Squares Regressions of ∆ ln(CEO Cash Compensation) onFirm, Industry, and Market Rates of Return on Common Stock, 1970-1996
Dependent Variable: ∆ ln(Cash Compensation)
Independent Variable 1970s 1980s 1990-1996
A. S&P 500 INDUSTRIALS(1) (2) (3) (4) (5) (6) (7) (8) (9)
Ln(1+Return).1112(6.7)
.1147(7.7)
.1129(6.8)
.2740(12.8)
.2581(13.4)
.2774(13.0)
.3158(10.8)
.3392(12.5)
.3504(9.6)
Ln(1+Industry Return)-.0360(-1.5)
—.0088(0.3)
-.1894(-5.2)
—-.0918(-2.1)
-.1756(-3.5)
—-.0621(-1.2)
Ln(1+Market Return) —-.0601(-2.3)
-.0671(-1.8)
—-.3196(-6.3)
-.2494(-4.1)
—-.4928(-5.6)
-.4436(-4.5)
R2 .0283 .0297 .0297 .0665 .0714 .0732 .0333 .0415 .0420
Sample Size 2,192 2,192 2,192 2,354 2,354 2,354 2,264 2,264 2,264
B. S&P 500 FINANCE
Ln(1+Return).0778(1.8)
.1173(2.7)
.0946(2.1)
.2687(5.0)
.2845(7.6)
.2691(5.0)
.6988(9.4)
.6993(9.9)
.7070(9.5)
Ln(1+Industry Return).0473(0.8)
—.1349(1.6)
.0667(0.7)
—.0602(0.5)
-.4669(-3.7)
—-.0861(-0.4)
Ln(1+Market Return) —-.0202(-0.3)
-.1430(-1.4)
—.0480(0.4)
.0165(0.1)
—-.7310(-4.1)
-.6234(-1.7)
R2 .0581 .0559 .0650 .1147 .1140 .1147 .2196 .2250 .2252
Sample Size 270 270 270 339 339 339 399 399 399
C. S&P 500 UTILITIES
Ln(1+Return).0771(2.2)
.0667(2.2)
.0773(2.2)
.1016(2.3)
.0967(2.3)
.1012(2.3)
.4305(5.8)
.4238(5.8)
.4292(5.7)
Ln(1+Industry Return)-.0056(-0.1)
—-.0481(-0.7)
-.0868(-0.8)
—-.0444(-0.3)
-.1115(-0.8)
—-.1826(-0.5)
Ln(1+Market Return) —.0130(0.3)
.0496(0.7)
—-.0790(-0.9)
-.0566(-0.5)
—-.0881(-0.7)
.0751(0.2)
R2 .0410 .0414 .0431 .0182 .0187 .0191 .1411 .1404 .1413
Sample Size 252 252 252 285 285 285 256 256 256
Note:t-statistics in parentheses. Regressions include (suppressed) intercepts. Sample is based on all CEOs included in theS&P 500. Data prior to 1992 extracted from Forbes Annual Compensation Surveys; data in 1992 and later fromCompustat’s ExecuComp database. Cash pay, in 1996-constant dollars, includes salaries, bonuses, and small amountsof other cash compensation. Industry return equals the value-weighted total shareholder return of all Compustatcompanies in the same two-digit industry; market return equals the value-weighted return of all Compustat companies

JUNE 1999 EXECUTIVE COMPENSATION PAGE 74
Table 9
Relative Performance Evaluation (RPE) in Annual Incentive Plansin 177 Large U. S. Corporations
Industrials(n=125)
Finance/Insurance(n=21)
Utilities(n=31)
Number of Firms Using RPE26
(21%)12
(57%)13
(42%)
How RPE is Used:a
Determining Threshold PerformanceDefining Performance
0%100%
0%100%
30%70%
How RPE is Measured:
Perform. Percentile or Rankingb
Perform. vs. Peer Group Mean/MedianSubjective Assessment of Perf. vs. Peers
Unknown/Other
42%19%15%23%
50%0%8%
42%
77%0%0%
23%
How Peer Groups are Defined:
Peer Group used in Proxy Statementc
Self-Selected Industry Peer GroupPublished Industry IndexBroad-Based Peer Group
20%58%8%
15%
25%75%0%0%
0%85%8%8%
Source: Data extracted from Towers Perrin’s Annual Incentive Plan Design Survey, 1997.aThreshold performance must be attained before any bonuses are paid. The threshold performance measure is often
different from the performance measure that determines the magnitude of bonuses. For example, bonuses equal to 2%of net income might be paid only if company return on equity exceeds the peer group return on equity: the performancemeasure is net income but the threshold major is relative return on equity.
bA typical formula might pay “75th percentile bonuses for 75th percentile performance.” cProxy statements include a chart showing the companies five-year stock-price performance measured relative to the
market and to an “industry peer group” which may be either self-selected or a published industry index.

JUNE 1999 EXECUTIVE COMPENSATION PAGE 75
Table 10
Linear Probability Models Predicting CEO Departures Using CEO Age≥64 ,Net-of-Industry Return, and Lagged Net-of-Industry Return
S&P 500 Industrials, 1970-1995 S&P Industrials, 1992-1995
Independent Variable AllYears
1970-1979
1980-1989
1990-1995
LargeS&P500
SmallS&P500
Mid-Cap400
Small-Cap600
(1) (2) (3) (4) (5) (6) (7) (8)
Intercept.0784(21.1)
.0700(11.6)
.0747(11.5)
.0898(13.1)
.0877(8.0)
.0976(18.4)
.0934(10.7)
.0948(12.7)
(Dummy) Age ≥ 64.2849(27.6)
.3118(18.1)
.2885(17.0)
.2435(12.3)
.3346(9.7)
.1769(5.6)
.0805(2.9)
.0584(2.3)
Net-of-Industry Return-.0188(-2.8)
-.0514(-2.6)
-.0769(-3.9)
-.0042(-0.5)
-.0022(-0.1)
.0017(0.2)
-.0043(-0.6)
-.0371(-4.7)
LaggedNet-of-Industry Return
-.00275(-0.4)
-.0308(-1.6)
-.0265(-1.4)
-.0047(-0.6)
.0022(0.1)
.0069(0.8)
.0013(0.4)
-.0001(-0.4)
R2.0885 .1103 .1042 .0578 .0909 .0346 .0066 .0149
Sample Size 7,922 2,733 2,701 2,488 957 911 1,365 1,832
Note:t-statistics in parentheses. The dependent variable is equal to 1 if the CEO is serving in his last full fiscal year and 0otherwise. Data prior to 1992 extracted from Forbes Annual Compensation Surveys; data in 1992 and later fromCompustat’s ExecuComp database. Net-of-industry return equals the total shareholder return less the value-weightedreturn of all Compustat companies in the same two-digit SIC industry. Young CEOs are defined as CEOs youngerthan 64 as of the fiscal year-end. Qualitative results unchanged using logistic methodologies.

JUNE 1999 EXECUTIVE COMPENSATION PAGE 76
Figure 1
Median Realized Cash and Total Compensation (including Option Gains) for S&P 500CEOs, 1970-1996, and Number of Academic Papers Published on CEO Pay
1970 1972 1974 1976 1978 1980 1982 1984 1986 1988 1990 1992 1994 1996$0
$500
$1,000
$1,500
$2,000
$2,500
0
10
20
30
40
50
60
Total Realized Pay
Salary & Bonus
CEO Pay Papers Published
Note: Sample is based on all CEOs included in the S&P 500. Compensation data, in 1996-constant dollars, areextracted from the Annual Compensation Surveys published by Forbes each May from 1971 through 1992; laterdata from Compustat’s ExecuComp Database. Cash pay includes salaries, bonuses, and small amounts of othercash compensation; total realized pay includes cash pay, restricted stock, payouts from long-term payprograms, and the amounts realized from exercising stock options during the year. (Total pay prior to 1978excludes option gains.) The number of academic papers on CEO pay was computed by Kevin Hallock andreported in Hallock and Murphy (1999).

JUNE 1999 EXECUTIVE COMPENSATION PAGE 77
Figure 2
Level and Composition of Total CEO Compensation, by Industry, 1992-1996
1992 1993 1994 1995 1996$0
$1,000
$2,000
$3,000
$4,000
38%
20%
27%
15%
36%
21%
26%
16%
31%
24%
28%
16%
28%
23%
32%
17%
27%
20%
36%
17%
Other
Options
Bonus
Salary
$1,993
$2,121
$2,641
$2,960$3,158
1992 1993 1994 1995 1996$0
$1,000
$2,000
$3,000
$4,000
35%
21%
26%
19%
29%
27%
25%
19%
26%
24%
31%
20%
28%
26%
26%
20%
21%
26%
33%
20%
Other
Options
Bonus
Salary
$2,948$3,093
$3,472$3,624
$4,582
Mining and Manufacturing Firms Financial Services
1992 1993 1994 1995 1996$0
$1,000
$2,000
$3,000
$4,000
56%
15%11%18%
56%
19%7%18%
55%
18%11%16%
48%
24%
10%19%
40%
20%
17%
23%
OtherOptions
Bonus
Salary
$1,133$1,076
$1,127 $1,220
$1,523
1992 1993 1994 1995 1996$0
$1,000
$2,000
$3,000
$4,000
41%
21%
22%
16%
42%
21%
23%
14%
39%
21%
25%
14%
33%
20%
29%
18%
28%
19%
36%
17%
Other
Options
Bonus
Salary
$2,204
$1,942
$2,226
$2,803
$3,624
Util i t ies Other Industries
Note: Sample includes all companies in the S&P 500, based on ExecuComp data. Pay component percentages arederived by computing the percentages for each CEO, and averaging across CEOs; the bar height depicts mediancompensation. Options are valued at grant date using ExecuComp’s modified Black-Scholes formula. Other payincludes restricted stock (valued at face value), payouts from long-term incentive plans, and miscellaneous othercompensation. Mining/manufacturing include firms with two-digit SIC codes 10-29; financial services 60-69,and utilities 49.

JUNE 1999 EXECUTIVE COMPENSATION PAGE 78
Figure 3
Level and Composition of Total CEO Compensation, by Company Size, 1992-1996
1992 1993 1994 1995 1996$0
$1,000
$2,000
$3,000
$4,000
36%
19%
29%
17%
36%
21%
26%
17%
30%
23%
29%
17%
26%
23%
33%
18%
24%
19%
39%
18%
Other
Options
Bonus
Salary
$2,762
$2,525
$3,097
$3,761
$4,539
1992 1993 1994 1995 1996$0
$1,000
$2,000
$3,000
$4,000
45%
21%
22%
12%
42%
20%
25%
13%
37%
23%
25%
15%
34%
21%
28%
17%
30%
20%
34%
15%
Other
Options
Bonus
Salary
$1,372$1,521
$1,804
$2,008
$2,371
S&P 500 Industrials: Above Median Sales S&P 500 Industrials: Below Median Sales
1992 1993 1994 1995 1996$0
$1,000
$2,000
$3,000
$4,000
46%
19%
25%
10%
45%
19%
25%
12%
42%
22%
27%
9%
40%
21%
29%
10%
37%
20%
32%
11%
OtherOptions
Bonus
Salary
$1,061 $1,126$1,303 $1,369
$1,580
1992 1993 1994 1995 1996$0
$1,000
$2,000
$3,000
$4,000
52%
19%20%9%
51%
21%21%8%
47%
19%
27%7%
47%
17%
26%
9%
42%
18%
31%
9%
OtherOptions
Bonus
Salary
$602 $639$792 $824
$942
S&P Mid-Cap Industrials S&P Small-Cap Industrials
Note: Sample, based on ExecuComp data, excludes financial service firms and utilities. Pay component percentagesare derived by computing the percentages for each CEO, and averaging across CEOs; the bar height depictsmedian compensation. Options are valued at grant date using ExecuComp’s modified Black-Scholes formula.Other pay includes restricted stock (valued at face value), payouts from long-term incentive plans, andmiscellaneous other compensation.

JUNE 1999 EXECUTIVE COMPENSATION PAGE 79
Figure 4
International Comparison of 1997 CEO Pay Levels and Structures
$0
$200
$400
$600
$800
$1,000Salary Bonus Options/LTIPs Other
Note: Data from Towers Perrin’s 1997 Worldwide Total Remuneration report, used with permission. Data reflectsTowers Perrin’s estimate of competitive CEO pay as of April 1997 for industrial companies with approximatelyUS $250 million in annual revenues. Local currency amounts are converted into US dollars using April 1997exchange rates. Salaries are defined as base salary plus other regular payments (such as vacation pay, 13th-month pay, and regular bonuses unrelated to performance); bonuses include target performance-based cashawards. Options/LTIPs includes the grant-date expected value of option grants and annualized targets fromLong-Term Incentive Plans. Other Compensation includes both voluntary and compulsory companycontributions and the value of perquisites.

JUNE 1999 EXECUTIVE COMPENSATION PAGE 80
Figure 5
Components of a "Typical" Annual Incentive Plan
050
PerformanceStandard
PerformanceThreshold
PerformanceMeasure
AnnualBonus
TargetBonus
Bonus"Cap"
Pay/PerformanceRelation
The "Incentive Zone"

JUNE 1999 EXECUTIVE COMPENSATION PAGE 81
Figure 6
Estimated Pay-Performance Relations for Cash Compensation, 1970-1996
1972 1974 1976 1978 1980 1982 1984 1986 1988 1990 1992 1994 1996$-0.02
$0.00
$0.02
$0.04
$0.06
$0.08
$0.10Pay-Performance Sensitivity:
Estimated Change in CEO Cash Compensationcorresponding to each $1,000 Change in Shareholder Wealth
26-Year Time Trend
A. Pay-Performance Sensitivities
1972 1974 1976 1978 1980 1982 1984 1986 1988 1990 1992 1994 19960
0.1
0.2
0.3
0.4
0.5
0.6
Pay-Performance Elasticity:Estimated % Change in CEO Cash Compensation
corresponding to each 1% Change in Shareholder Wealth
26-Year Time Trend
B. Pay-Performance Elasticities
Note:Sample is based on all CEOs included in the S&P 500. Data prior to 1992 extracted from Forbes AnnualCompensation Surveys; data in 1992 and later from Compustat’s ExecuComp database. Panel A is based onannual regressions of ∆(Cash Compensation) on ∆(Shareholder Wealth), where the latter is expressed in $1000sand where "cash compensation" includes salaries, bonuses, and small amounts of other cash compensation.Panel B is based on annual regressions of ∆ln(Cash Compensation) on ln(1+Shareholder Return).

JUNE 1999 EXECUTIVE COMPENSATION PAGE 82
Figure 7
Option Values and Pay-Performance Sensitivities
$0 $25 $50 $75 $100 $125 $150 $175 $200$0
$20
$40
$60
$80
$100
$120
Stock Price
slope = .42
slope = .60
slope = .67
Black-ScholesOption Value
"Intrinsic"Option Value
Note: Options values based on an option with an exercise price of $100, dividend yield of 3%, stock-price volatilityof 30%, and risk-free rate of 7%. The pay-performance sensitivity is defined as the change in option valueassociated with each $1 change in stock price, and is represented as the slope of the Black-Scholes valuation.

JUNE 1999 EXECUTIVE COMPENSATION PAGE 83
Figure 8
Median Pay-Performance Sensitivities for S&P 500 CEOs, by Industry, 1992-1996
1992 1993 1994 1995 1996$0
$1
$2
$3
$4
$5
$6
$7
17%
45%
38%
4%
57%
39%
5%
60%
36%
3%
64%
33%
5%
64%
31%
Stock
Options/Res Stk
Cash/LTIP
$3.72
$4.61
$5.22 $5.17
$5.90
1992 1993 1994 1995 1996$0
$1
$2
$3
$4
$5
$6
$7
8%
50%
42%
7%
50%
43%
6%
52%
42%
4%
55%
41%
5%
56%
39%
Stock
Options/Res Stk
Cash/LTIP
$3.54 $3.39
$4.64
$5.09
$5.34
Mining and Manufacturing Firms Financial Services
1992 1993 1994 1995 1996$0
$1
$2
$3
$4
$5
$6
$7
14%33%53%
18%34%
48%
22%35%
43%
20%
42%
38%
18%
49%
33%Stock
Options/Res Stk
Cash/LTIP
$0.45
$0.82 $0.78 $0.86
$1.22
1992 1993 1994 1995 1996$0
$1
$2
$3
$4
$5
$6
$7
18%
37%
45%
3%
45%
52%
4%
48%
48%
4%
57%
40%
3%
59%
38%
Stock
Options/Res Stk
Cash/LTIP
$5.47
$7.34$7.20 $7.05
$6.79
Util i t ies Other Industries
Note:Sample includes all companies in the S&P 500. Pay component percentages are derived by computing thepercentages for each CEO, and averaging across CEOs; the bar height depicts median pay-performancesensitivity. Manufacturing include firms with 2-digit SIC codes 10-29; financial services 60-69, and utilities 49.
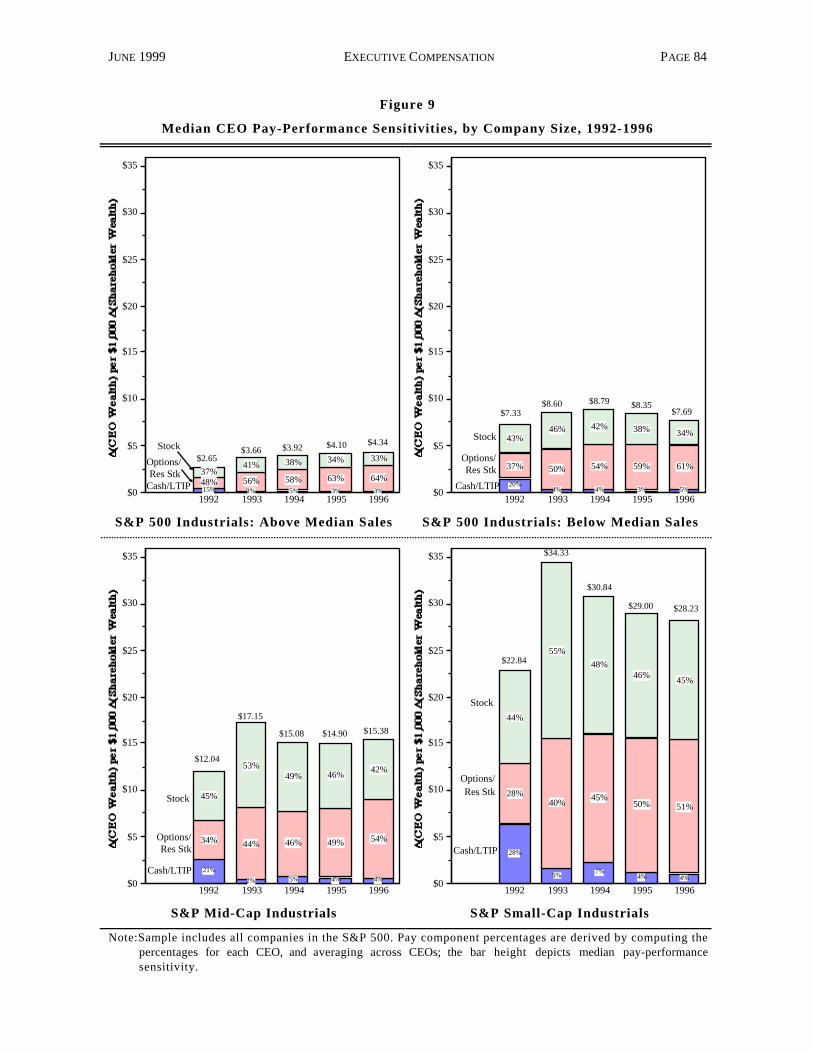
JUNE 1999 EXECUTIVE COMPENSATION PAGE 84
Figure 9
Median CEO Pay-Performance Sensitivities, by Company Size, 1992-1996
1992 1993 1994 1995 1996$0
$5
$10
$15
$20
$25
$30
$35
15%48%37%
3%56%
41%
5%
58%
38%
3%
63%
34%
3%
64%
33%$2.65$3.66 $3.92 $4.10 $4.34Stock
Options/Res Stk
Cash/LTIP1992 1993 1994 1995 1996
$0
$5
$10
$15
$20
$25
$30
$35
20%
37%
43%
4%
50%
46%
4%
54%
42%
3%
59%
38%
5%
61%
34%Stock
Options/Res Stk
Cash/LTIP
$7.33$8.60 $8.79 $8.35
$7.69
S&P 500 Industrials: Above Median Sales S&P 500 Industrials: Below Median Sales
1992 1993 1994 1995 1996$0
$5
$10
$15
$20
$25
$30
$35
21%
34%
45%
2%
44%
53%
5%
46%
49%
4%
49%
46%
4%
54%
42%
Stock
Options/Res Stk
Cash/LTIP
$12.04
$17.15
$15.08 $14.90 $15.38
1992 1993 1994 1995 1996$0
$5
$10
$15
$20
$25
$30
$35
28%
28%
44%
5%
40%
55%
7%
45%
48%
4%
50%
46%
4%
51%
45%
Stock
Options/Res Stk
Cash/LTIP
$22.84
$34.33
$30.84
$29.00 $28.23
S&P Mid-Cap Industrials S&P Small-Cap Industrials
Note:Sample includes all companies in the S&P 500. Pay component percentages are derived by computing thepercentages for each CEO, and averaging across CEOs; the bar height depicts median pay-performancesensitivity.

JUNE 1999 EXECUTIVE COMPENSATION PAGE 85
Figure 10
Trends in Stock Ownership for S&P 500 CEOs, by Industry, 1987-1996
87 88 89 90 91 92 93 94 95 96
0.00%
0.05%
0.10%
0.15%
0.20%
0.25%
0.30%
0.35%
$0
$2
$4
$6
$8
$10
Value of Stock Held
% of Stock Held
87 88 89 90 91 92 93 94 95 960.00%
0.05%
0.10%
0.15%
0.20%
0.25%
0.30%
0.35%
$0
$2
$4
$6
$8
$10
Value of Stock Held
% of Stock Held
Mining and Manufacturing Firms Financial Services
87 88 89 90 91 92 93 94 95 960.00%
0.05%
0.10%
0.15%
0.20%
0.25%
0.30%
0.35%
$0
$2
$4
$6
$8
$10
Value of Stock Held
% of Stock Held
87 88 89 90 91 92 93 94 95 960.00%
0.05%
0.10%
0.15%
0.20%
0.25%
0.30%
0.35%
$0
$2
$4
$6
$8
$10Value of Stock Held
% of Stock Held
Util i t ies Other Industries
Note: Sample includes all companies in the S&P 500. Stock ownership includes shares held directly and by familymembers, but excludes all stock options.

JUNE 1999 EXECUTIVE COMPENSATION PAGE 86
Figure 11
Departure Rates for CEOs S&P 500 CEOs, by Two-Year Net-of-IndustryStock Price Performance, 1970-1995
1970 1972 1974 1976 1978 1980 1982 1984 1986 1988 1990 1992 19940%
5%
10%
15%
20%
25%
Departure Rates for Bottom-QuartileNet-of-Industry Performance
Departure Rates for Top Three QuartilesNet-of-Industry Performance
Note:Departure rates reflect the percentage of CEOs in serving in their last full fiscal year. Sample is based on all CEOsincluded in the S&P 500. Data prior to 1992 extracted from Forbes Annual Compensation Surveys; data in 1992and later from Compustat’s ExecuComp database. Net-of-industry stock price performance defined as totalshareholder return minus the value-weighted return of all Compustat companies in the same two-digit industry.“Bottom Quartile Performance” based on the cumulative net-of-market return realized during the CEO’s last fullfiscal year, and in the preceding year.

JUNE 1999 EXECUTIVE COMPENSATION PAGE 87
Figure 12
Age at Departure for S&P 500 CEOs,by Two-Year Net-of-Industry Stock Price Performance, 1970-1996
40 44 48 52 56 60 64 68 72 76 80
0
10
20
30
40
50
Age at Departure
40 44 48 52 56 60 64 68 72 76 80
0
10
20
30
40
50
Age at Departure
1970s: Bottom Quartile Performance 1970s: Above Bottom Quartile Performance
40 44 48 52 56 60 64 68 72 76 80
0
10
20
30
40
50
Age at Departure40 44 48 52 56 60 64 68 72 76 80
0
10
20
30
40
50
Age at Departure
1980s: Bottom Quartile Performance 1980s: Above Bottom Quartile Performance
40 44 48 52 56 60 64 68 72 76 80
0
10
20
30
40
50
Age at Departure40 44 48 52 56 60 64 68 72 76 80
0
10
20
30
40
50
Age at Departure
1990-1996: Bottom Quartile Performance 1990-1996: > Bottom Quartile Performance
Note: Sample is based on all CEOs included in the S&P 500. Data prior to 1992 extracted from Forbes AnnualCompensation Surveys; data in 1992 and later from Compustat’s ExecuComp database. Data reflect CEO age asof the end of the CEO’s final full fiscal year. Net-of-industry stock price performance defined as totalshareholder return minus the value-weighted return of all Compustat companies in the same two-digit industry.“Bottom Quartile Performance” based on the cumulative net-of-market return realized during the CEO’s last fullfiscal year, and in the preceding year. The charts ignore one CEO departing below age 40, and six CEOsdeparting after age 80.

JUNE 1999 EXECUTIVE COMPENSATION PAGE 88
Figure 13
Tenure in Firm upon Appointment for S&P 500 CEOs,by Two-Year Net-of-Industry Stock Price Performance, 1970-1996
0 4 8 12 16 20 24 28 32 36 400
5
10
15
20
25
30
35
40
Company Tenure for Newly Appointed CEO0 4 8 12 16 20 24 28 32 36 40
0
5
10
15
20
25
30
35
40
Company Tenure for Newly Appointed CEO
1970s: Bottom Quartile Performance 1970s: Above Bottom Quartile Performance
0 4 8 12 16 20 24 28 32 36 400
5
10
15
20
25
30
35
40
Company Tenure for Newly Appointed CEO0 4 8 12 16 20 24 28 32 36 40
0
5
10
15
20
25
30
35
40
Company Tenure for Newly Appointed CEO
1980s: Bottom Quartile Performance 1980s: Above Bottom Quartile Performance
0 4 8 12 16 20 24 28 32 36 400
5
10
15
20
25
30
35
40
Company Tenure for Newly Appointed CEO0 4 8 12 16 20 24 28 32 36 40
0
5
10
15
20
25
30
35
40
Company Tenure for Newly Appointed CEO
1990-1996: Bottom Quartile Performance 1990-1996: > Bottom Quartile Performance
Note: Sample is based on all CEOs included in the S&P 500. Data prior to 1992 extracted from Forbes AnnualCompensation Surveys; data in 1992 and later from Compustat’s ExecuComp database. Data reflect yearsemployed by the firm prior to becoming CEO. Net-of-industry stock price performance defined as totalshareholder return minus the value-weighted return of all Compustat companies in the same two-digit industry.“Bottom Quartile Performance” based on the cumulative net-of-market return realized during the two fiscal yearsprior to the incoming CEO’s appointment.

JUNE 1999 EXECUTIVE COMPENSATION PAGE 89
Figure 14
Percentage of New S&P 500 CEO Appointments Coming From Outside the Firm,by Two-Year Net-of-Industry Stock Price Performance, 1971-1996
1971 1973 1975 1977 1979 1981 1983 1985 1987 1989 1991 1993 19950%
5%
10%
15%
20%
25%
30%
35%
40%
45%
50%
Outside CEO Hires FollowingBottom-Quartile Net-of-Industry Performance Outside CEO Hires Following Top
Three Quartile Net-of-Industry Performance
Note:Chart is based on S&P 500 CEOs serving in their first year as CEO, and depicts the percentage of these newlyappointed CEOs employed by their firm for less than one year prior to their appointment as CEO. Net-of-industrystock price performance defined as total shareholder return minus the value-weighted return of all Compustatcompanies in the same two-digit industry. “Bottom Quartile Performance” based on the cumulative net-of-marketreturn realized during the two fiscal year's preceding the new CEO’s appointment.

JUNE 1999 EXECUTIVE COMPENSATION PAGE 90
Figure 15
Ratio of Average CEO Pay to Average Pay for Production Workers, 1970-1996
1970 1972 1974 1976 1978 1980 1982 1984 1986 1988 1990 1992 1994 19960
25
50
75
100
125
150
175
200
225
Ratio of Average CEO Total Realized Pay toAverage Annual Earnings of Production Workers
Ratio of Average CEO Salary and Bonus toAverage Annual Earnings of Production Workers
Note: CEO sample is based on all CEOs included in the S&P 500, using data from Forbes and ExecuComp. CEO totalrealized pay includes cash pay, restricted stock, payouts from long-term pay programs, and the amounts realizedfrom exercising stock options during the year. (Total pay prior to 1978 excludes option gains.) Worker payrepresents 52 times the average weekly hours of production workers multiplied by the average hourly earnings,based on data from the Current Employment Statistics, Bureau of Labor Statistics.