Embed Size (px)
Citation preview
EXECUTIVE BUDGET Fiscal Years 2013 and 2014
State of Michigan Rick Snyder, Governor
John E. Nixon, CPA, State Budget Director
This publication was produced and printed by the Department of Technology, Management and Budget. The purpose of the publication is to inform state and local officials and citizens about Governor Snyder’s recommended budget for fiscal year 2012 and projections for fiscal year 2013. This document is required by law MCLA 18.1363 and by the Michigan Constitution, Article V, Section 18.
FISCAL YEARS 2013 AND 2014 EXECUTIVE BUDGET
TABLE OF CONTENTS
Page Budget Overview ....................................................................... A 1
Department Detail ...................................................................... B 1
Background Information ........................................................... C 1
Web site address for this document: http://www.michigan.gov/budget


Budget Overview

February 9, 2012
My Fellow Michigan Citizens: Successfully reinventing Michigan demands that we make thoughtful, strategic and long-term investments in our state that deliver real results for real people. The platform for doing so is the fiscal year 2013 budget, which I am proud to recommend for consideration. This proposal differs significantly from our current-year budget. Last year, our fiscal house was still in disarray. Michigan was burdened with a $1.5 billion deficit and little effort had been made to pay down its long-term obligations. We were faced with difficult – but necessary – decisions that centered on budget cuts and major policy reforms. Working in partnership with the Legislature, we enacted a fiscally and structurally sound budget that laid the foundation for economic growth and prosperity while protecting our state’s critical safety net. Our work is paying off. Michigan is emerging as a stronger, more vibrant state. This recommended budget builds on that foundation for economic growth and job creation. This proposed 2013 budget strategically invests in priorities such as education, our infrastructure, public safety, health and human services environment, and information technology while setting aside rainy day reserves and addressing legacy costs. Our focus is shifting from major policy reforms to one that is centered on good government and building for our future. This budget again presents a balanced two-year plan that continues responsible management of taxpayer dollars. As promised, state spending is tied to measured outcomes through the use of performance metrics. We will be monitoring the performance metrics routinely throughout the year. This budget is the right balance of funding for the priorities and needs of our great state while ensuring that we maintain fiscal responsibility and structural balance. I look forward to working in partnership with the members of the Michigan House and Senate to enact the fiscal year 2013 budget and continue our state’s drive to become a national model of success. Sincerely, Rick Snyder Governor

overview
Fiscal Years 2013 and 2014 Executive Budget Recommendation A-1
Reinventing Michigan -- investing in OuR FutuRe
Executive Budget Recommendation for Fiscal Years 2013 and 2014
Michigan’s reinvention began in earnest last year with Governor Rick Snyder’s first budget, which laid the foundation for a return to fiscal integrity and economic growth.
That momentum continues with the fiscal year 2013 and projected 2014 Executive Budget Recommendation. The fiscal discipline and policy reforms reflected in the current-year budget are fundamentally changing discussions regarding the 2013 plan. With the elimination of last year’s $1.5 billion deficit through difficult but necessary decisions, Michigan is now looking at revenue growth and greater opportunities to strategically invest in key priorities that deliver real results for real people. Michigan’s future depends on a prosperous economy and opportunities for current and future generations. The governor’s proposed 2013 budget continues on the path that creates an environment of economic success, protects our most vulnerable residents, enhances our quality of life, and promotes good government.
The two Executive Budget bills presented for legislative introduction are again “omnibus” in nature, with one bill including all departmental operations and the other focused on education. Just as last year, the budget provides a balanced, two-year spending plan with recommended fiscal year 2013 appropriations, as well as anticipated appropriations for fiscal year 2014. The two-year approach continues the commitment to focus on success over the long haul, achieving a strategic approach to budgeting with a vision toward the future.
Michigan’s Improving Economy
After a decade of job loss, high unemployment, and declining state
revenues, the dark cloud that had been hanging over Michigan has given way to rays of sunlight. In 2011, the state recorded a significant decline in the unemployment rate accompanied by a gain in payroll jobs. The annual average unemployment rate in 2011 fell by more than 2 full percentage points when compared to 2010, from 12.5 percent
“It’s a new day in Michigan. We’re leaving gridlock and negativity in the past. This fiscally disciplined, structurally balanced budget will let investors and job providers know that Michigan’s house is in order. Restoring this fiscal integrity creates an economic environment that leads to more jobs for Michigan workers.”
Governor Rick Snyder, May 19, 2011
overview
A-2 Reinventing Michigan ― Investing in our Future
to 10.4 percent. Michigan added nearly 80,000 private-sector jobs last year, jobs that are higher paying than the national average. Michigan is the number one state in the nation for research and development facility project announcements, beating out Ohio, Pennsylvania, Indiana, and North Carolina. Michigan’s strong base of engineering talent and the strength of its research universities are cited as the biggest reasons for the strong showing in research and development. Finally, the unaudited book closing for 2011 showed the state had a surplus. That surplus, along with the forecasted revenue growth in 2013 and 2014, paints a much brighter budget picture when compared to the past decade.
State’s Supporting Role in Success
Michigan’s turnaround isn’t an accident. Tough decisions were made in last year’s budget to get the state’s fiscal house in order, showing job creators around the world that we are
serious about our reinvention. Some of the key actions that have fueled the transformation that we are now witnessing include:
• Repealing the job-killing Michigan Business Tax and replacing it with a flat 6-percent corporate income tax that is simple, fair and efficient.
• Ending the unfair double tax on small business owners.
• Leveling the playing field for all job creators by eliminating tax loopholes.
• Adding rural development to the Department of Agriculture and Rural Development’s mission to help build the economy in rural areas.
• Refocusing the Michigan Economic Development Corporation to provide greater assistance to Michigan businesses.
• Supporting Michigan’s tourism industry by insuring stable funding for the successful Pure Michigan advertising campaign.
• Launching Pure Michigan Business Connect, resulting in $8 billion of investment and capital being made available to Michigan businesses.
• Establishing the Global Michigan Immigration Initiative and the Cultural Ambassador program to attract and welcome immigrants with advanced degrees to Michigan.
• Launching Talent Connect to help reduce unemployment by connecting talent to jobs.
“Governor Rick Snyder got Michigan back on the right track with a series of key reforms during his first year in office. There will be those who differ with parts of his agenda for this year — as was the case in 2011 — but he’s right to keep the pressure on for infrastructure improvements, better government efficiency at all levels and the use of technology to expand learning. As his online dashboards indicate, the unemployment rate is dropping, the state bond rating is rising and there’s less violent crime.”
The Detroit News, January 19, 2012
overview
Fiscal Years 2013 and 2014 Executive Budget Recommendation A-3
Budget Recommendation in Totality
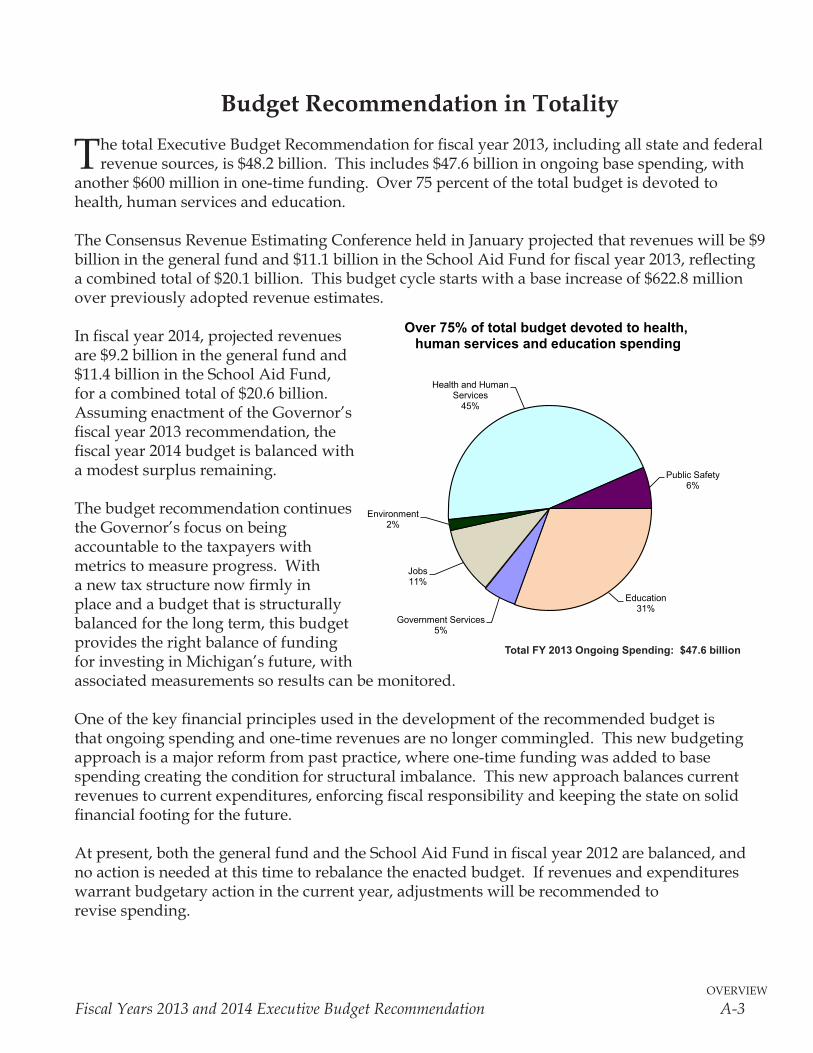
The total Executive Budget Recommendation for fiscal year 2013, including all state and federal revenue sources, is $48.2 billion. This includes $47.6 billion in ongoing base spending, with
another $600 million in one-time funding. Over 75 percent of the total budget is devoted to health, human services and education. The Consensus Revenue Estimating Conference held in January projected that revenues will be $9 billion in the general fund and $11.1 billion in the School Aid Fund for fiscal year 2013, reflecting a combined total of $20.1 billion. This budget cycle starts with a base increase of $622.8 million over previously adopted revenue estimates.
In fiscal year 2014, projected revenues are $9.2 billion in the general fund and $11.4 billion in the School Aid Fund, for a combined total of $20.6 billion. Assuming enactment of the Governor’s fiscal year 2013 recommendation, the fiscal year 2014 budget is balanced with a modest surplus remaining.
The budget recommendation continues the Governor’s focus on being accountable to the taxpayers with metrics to measure progress. With a new tax structure now firmly in place and a budget that is structurally balanced for the long term, this budget provides the right balance of funding for investing in Michigan’s future, with associated measurements so results can be monitored.
One of the key financial principles used in the development of the recommended budget is that ongoing spending and one-time revenues are no longer commingled. This new budgeting approach is a major reform from past practice, where one-time funding was added to base spending creating the condition for structural imbalance. This new approach balances current revenues to current expenditures, enforcing fiscal responsibility and keeping the state on solid financial footing for the future.
At present, both the general fund and the School Aid Fund in fiscal year 2012 are balanced, and no action is needed at this time to rebalance the enacted budget. If revenues and expenditures warrant budgetary action in the current year, adjustments will be recommended to revise spending.
Government Services5%
Jobs11%
Environment2%
Health and Human Services
45%
Public Safety6%
Education31%
Over 75% of total budget devoted to health,human services and education spending
Total FY 2013 Spending: $47.6 billionTotal FY 2013 Ongoing Spending: $47.6 billion
overview
A-4 Reinventing Michigan ― Investing in our Future
Jobs and the Economy
The recommended budget provides $195 million in funding for economic development to assist Michigan businesses, with a continued focus on an economic gardening strategy to help
local businesses grow.
Reinventing Michigan and investing in our future demands that we ensure career opportunities for future generations. Thinking strategically about the relationship between economic development and a highly skilled workforce, Governor Snyder’s special message on talent development provides the blueprint to reinvent the way in which we prepare the current and next generation for fulfilling careers. It redesigns the way in which employers obtain the skills they need. Pure Michigan Talent Connect, the new online tool at www.MiTalent.org, is a web-based marketplace aimed at ensuring Michigan’s economic development and talent enhancement are occurring in tandem.
The Governor recommends an additional $15 million in general fund to support economic development in Michigan’s distressed cities. The Talent Fund for Job Training and Skills Development will target communities with populations that have a history of chronic unemployment, investing in initiatives that assist citizens in accessing education, training, and employment opportunities.
Education: K-12 and Beyond
In his special message on education, Governor Snyder proposed reforms aimed at transforming
Michigan’s educational system from one still rooted in the days of a mostly farm-based society to one that prepares students for the technological age of today and jobs of tomorrow. His message outlined a dramatic shift from viewing different levels of education as separate stages to viewing them as part of an integrated system, beginning with early childhood education all the way through the completion of an advanced degree or career training.
In laying out his case for reform, the governor noted that Michigan ranks 21st in the country in total current per-pupil expenditures according to the most recent data from the National Center for Education Statistics, yet it ranks 39th in the nation when it comes to fourth grade math proficiency and 34th in reading proficiency. Fewer than 50 percent of students are proficient in writing, and ACT test scores need improvement.
The transformation has already started with the recognition that success in school starts well before a child’s first day of class. To make sure children are developmentally on track, the governor created a new Michigan Office of Great Start. The proposed budget includes funding for this office of $209.2 million, of which $41.2 million is general fund. This is augmented by another $115 million in School Aid funding for early childhood programs.
“Read through Snyder’s proposed education reforms, and it’s clear he understands how you go about producing an excellent product, which in the case of education, means kids who are ready to perform in the workforce.”
Dan Calabrese, The Michigan View,
April 29, 2011
overview
Fiscal Years 2013 and 2014 Executive Budget Recommendation A-5
The recommended budget supports the $10.8 billion in available School Aid Fund revenues with an additional $200 million in general fund for best practices, and protects the per-pupil foundation allowances. Due to the pressure placed on school district budgets related to employee pension and health care costs, a total of $179 million in ongoing funding is provided to help local schools defray those costs.
Enhanced Best Practices for Education
A total of $200 million is designated for districts engaged in best practices and meeting required
performance metrics. This represents an increase of $46 million from fiscal year 2012.
Of this total, $120 million is recommended for districts that meet five of six best practices, which are: the district publishes a citizen’s dashboard; the district serves as the policy holder for health care benefits; participation in schools of choice; the district monitors student growth in each subject area at least twice a year; the district offers dual enrollment, Advanced Placement courses, participates in a middle college, or offers other post-secondary learning opportunities; or the district offers online or blended learning.
A total of $70 million is recommended for performance funding focused on student academic growth. Performance funding is allocated based on student growth in mathematics for grades 3-8, student growth in reading for grades 3-8, and growth over a four year period in all tested subject areas for high school students.
The recommendation also includes $10 million in one-time funds for competitive innovation grants to help defray transition costs associated with consolidation of shared services efforts. Both local and intermediate school districts will be eligible to compete for these funds.
The recommended budget for community colleges includes a new performance formula based on degree completions to distribute an additional $8.5 million to community colleges. This 3 percent increase is to be distributed based on associate degree and certificate completions in critical skill areas.
The Governor’s recommendation for higher education establishes total funding of $1.4 billion, of which $1.1 billion is general fund. Investing an additional $36.2 million in state universities, this 3 percent funding increase is distributed using a new performance formula based on four metrics: the growth in the number of undergraduate degree completions, the number of undergraduate completions in critical skill areas, the number of undergraduate Pell Grant recipients, and compliance with tuition restraint. Universities doing a better job of holding tuition costs down will receive greater funding. Funding for all student grants and financial aid is $98.2 million.
“I believe the Governor’s plan goes a long way toward creating the system of standards, measurements and accountability that Michigan so desperately needs.”
Stephen Henderson, Detroit Free Press,
April 28, 2011
overview
A-6 Reinventing Michigan ― Investing in our Future
Protecting Michigan Residents
Residents and businesses demand that government provide for the safety of the public. A key role of government is to ensure that citizens are safe and protected. With four of the top 10
most violent cities in the nation, and with an overall crime rate that is too high, we must do better. In March, the Governor will present a special message on public safety, with key reforms to create a safer Michigan.
The proposed budget makes a strong investment in public safety by:
• Funding core programs for the Michigan State Police (MSP) including road patrol, motor carrier enforcement, investigative services, emergency management and homeland security, secondary road patrol grant funding, and funding for the Michigan Commission on Law Enforcement Standards. The recommendation adds a total of $47 million in general fund for MSP, an increase of 16 percent over the current year.
• Providing $3.1 million general fund for additional staffing within Forensic Sciences within MSP, reducing the number of days for processing forensic tests for criminal investigations.
• Implementing improved enforcement of tobacco tax laws with multi-agency support totaling $2.2 million for MSP, Treasury, and Attorney General.
• Reserving an additional $15 million general fund for law enforcement enhancements to be detailed in the Governor’s Special Message on Public Safety in March.
• Adding $4.8 million for critical maintenance needs at the 43 state armories throughout the state.
• An additional $15 million is proposed for the criminal justice system, including funding for anticipated costs related to the public safety emergency in Flint and other distressed cities. The proposal increases funding for mental health courts by $1 million.
• Funding the Department of Military and Veterans Affairs (DMVA) with $55.7 million for Military Preparedness, representing the Michigan National Guard’s traditional mission of state and national defense and homeland security.
Advancing Health and Human Services; Protecting the Safety Net
The Governor’s special message on health and wellness points out that good health is the foundation for our state’s economic transformation and overall quality of life. While our state
is home to some of the best health care providers and services in the world, many of our citizens still lack access, knowledge of and a commitment to a healthy lifestyle. Creating a healthy Michigan means giving people the tools they need to make informed decisions to access high- quality and affordable health care. The special message encouraged the expansion of the Healthy Kids Dental program as a priority item during the fiscal year 2013 budget cycle. The program has been highly successful in the areas in which it operates. Unfortunately, it is absent from some of our most populous counties where the greatest disparities in dental care exist. Expanding it to
overview
Fiscal Years 2013 and 2014 Executive Budget Recommendation A-7
all 83 counties would improve preventive care and decrease visits to emergency rooms for dental problems. A total of $25 million in both 2013 and 2014 is proposed for a phased-in expansion of the Healthy Kids Dental program so that coverage will be available for all children receiving Medicaid over the next few years.
Michigan must also join the majority of states in more aggressively dealing with the challenges posed by autism. Without treatment, the average lifetime cost to Michigan of a single person suffering from autism is $3.7 million. With early treatment, however, children can achieve better outcomes and many of these costs can be avoided. Michigan is recognized as one of the 10 worst states in which to raise a child with autism because evidence-based treatment is largely excluded from insurance coverage. To date, 27 other states have changed their laws to require insurers to cover evidence-based therapies for autism that will save taxpayers billions of dollars. While the Legislature continues its deliberations about autism coverage for children, the Governor’s budget recommends a total of $34.1 million to provide expanded autism coverage for children eligible for Medicaid and MIChild.
Each citizen can significantly improve personal health by practicing four key behaviors: maintaining a healthy diet, engaging in regular exercise, getting an annual physical examination, and avoiding all tobacco use. The four key health measures closely tied to the incidence of chronic disease are: body mass index (BMI), blood pressure, cholesterol levels, and blood sugar levels. When considered together, these four behaviors and four measures can be characterized as the “Michigan 4x4 Plan.” In addition, infant mortality is a critical indicator of the overall health of Michigan, as well as the quality and accessibility of prenatal care for women. Unfortunately, the infant mortality rate in Michigan has increased over the past three years. The proposed budget increases funding for infant mortality reduction and 4 x 4 Wellness, with $5 million in one-time funding, and $1 million in ongoing funding.
In support of seniors and people with disabilities, $14.1 million is recommended to reduce the waiting list for the MIChoice Home and Community Based Waiver Program. This increased support for home and community-based care allows the elderly to receive needed services while honoring their preference to remain in their homes or communities, and supports transitions from nursing homes to the waiver program.
This budget maintains Medicaid eligibility and uses federal funding to increase provider reimbursement rates for primary care providers. An appropriation of $282 million in federal funds supports the provider rate increase, improving access to care for Medicaid recipients.
The proposed budget invests over $942 million in Michigan’s child welfare system. The rate paid to foster care parents and adoptive parents is increased by $3 per day to help pay for basic living expenses and to encourage recruitment of foster and adoptive parents. Improvements to the child welfare system will maintain the focus on keeping children safe in their own homes, and when necessary, will support alternative living arrangements including foster care and adoption.
The recommendation invests $255 million in federal and state restricted funds to support heating assistance programs, including $195 million in federal funds for the home heating credit, energy-related crisis payments and weatherization for low-income home owners. The new Home
overview
A-8 Reinventing Michigan ― Investing in our Future
Heating Assistance for the Vulnerable Fund is supported with $60 million in state restricted funds. Funded through utility rates and distributed to local agencies, these new funds will provide heating assistance to low-income families and individuals.
Veterans, their families, and Michigan communities are served in this budget through outreach programs with $16.2 million in funding. As part of that funding, Veterans Service Organizations will receive $2.9 million in state-funded grants to counsel veterans and assist them in receiving benefits and services for which they are eligible. In addition, $65.6 million is provided to support the Grand Rapids and D. J. Jacobetti Veterans’ Homes, which provide direct nursing care for 731 resident veterans.
Investing in our Infrastructure
Governor Snyder said it in his special message on infrastructure: better roads drive better jobs. Investments in the state’s infrastructure are essential to the economy and to the future
growth of our state. The Governor’s message focused on a modern transportation system that moves people and goods efficiently, reliably and safely, as well as water and sewer systems that support and protect Michigan’s rich environment.
The proposed transportation budget totals $3.3 billion in both 2013 and 2014, including $119 million in one-time general fund appropriations in fiscal year 2013 to allow the legislature time to develop a long-term road funding solution. The $119 million investment of general fund revenues will ensure that Michigan matches all federal highway and transit aid in fiscal year 2013. Ignoring the state’s deteriorating infrastructure is not an option, nor is allowing unmatched federal money to flow to other states. An extensive package of bills recently introduced in the Legislature provides for other necessary reforms mentioned in the special message on infrastructure, including the need for additional revenues.
The proposed budget recommends an additional $10 million of restricted refined petroleum fund for environmental cleanup work at leaking underground storage tank sites. An additional $5 million is recommended for use as state match to obtain federal grant dollars for the drinking water revolving fund program. The added funding will provide infrastructure loans to public water suppliers, enabling an increased percentage of communities to be in compliance with federal health-based standards. The recommendation also includes $1 million to reach the goal of 5,000 MAEAP (Michigan Agriculture Environmental Assurance Program) farm verifications by 2015, which will result in more sustainable systems and increased production for the agriculture industry.
Resources have been included to stimulate investments in large sewer system improvement projects, with debt service funding to accommodate anticipated bond issuances of $125 million in fiscal years 2013 and 2014.
“Governor Snyder is smart to be taking a comprehensive approach toward fixing the roads, bridges, sewers and water lines that are crumbling beneath our feet and wheels.”
The Detroit News, October 27, 2011
overview
Fiscal Years 2013 and 2014 Executive Budget Recommendation A-9
Revenue Sharing
Constitutional revenue sharing payments for cities, villages, and townships are increased by $13.6 million (2 percent), to $711.1 million, based on estimated sales tax collections. The
budget continues and strengthens the Economic Vitality Incentive Program (EVIP) for local units of government, with $210 million in funding for fiscal year 2013. Aimed at encouraging best practices for cities, villages, and townships, EVIP funding will again require that local units of government meet certain criteria that include accountability and transparency requirements, consolidation of services, and employee compensation reforms.
A new incentive-based program for counties is recommended to replace statutory revenue sharing beginning in fiscal year 2013, funded with $125.6 million in sales tax revenue. Sixty-one counties are estimated to exhaust their revenue sharing reserve funds prior to, or during, fiscal year 2013. These counties will qualify for financial incentive payments provided they meet specific standards and adopt best practices, consistent with requirements under EVIP for cities, villages, and townships.
In addition, a competitive grant assistance program is funded in fiscal year 2013 with $25 million in sales tax revenue, using $5 million in ongoing funding plus a one-time augmentation of $20 million. Cities, villages, townships, or counties that elect to combine government operations may apply for reimbursement of costs for approved projects. Fiscal year 2013 funding represents a four-fold increase from fiscal year 2012 funding of $5 million. The proposed one-time increase addresses significant interest expressed by local units seeking help with transition costs associated with mergers, inter-local agreements, and other cooperative efforts.
Good Government and Measuring for Success
Governor Snyder’s first budget required tough decisions to achieve balance for the long term. Because that has been accomplished, a renewed focus on good government is now in motion,
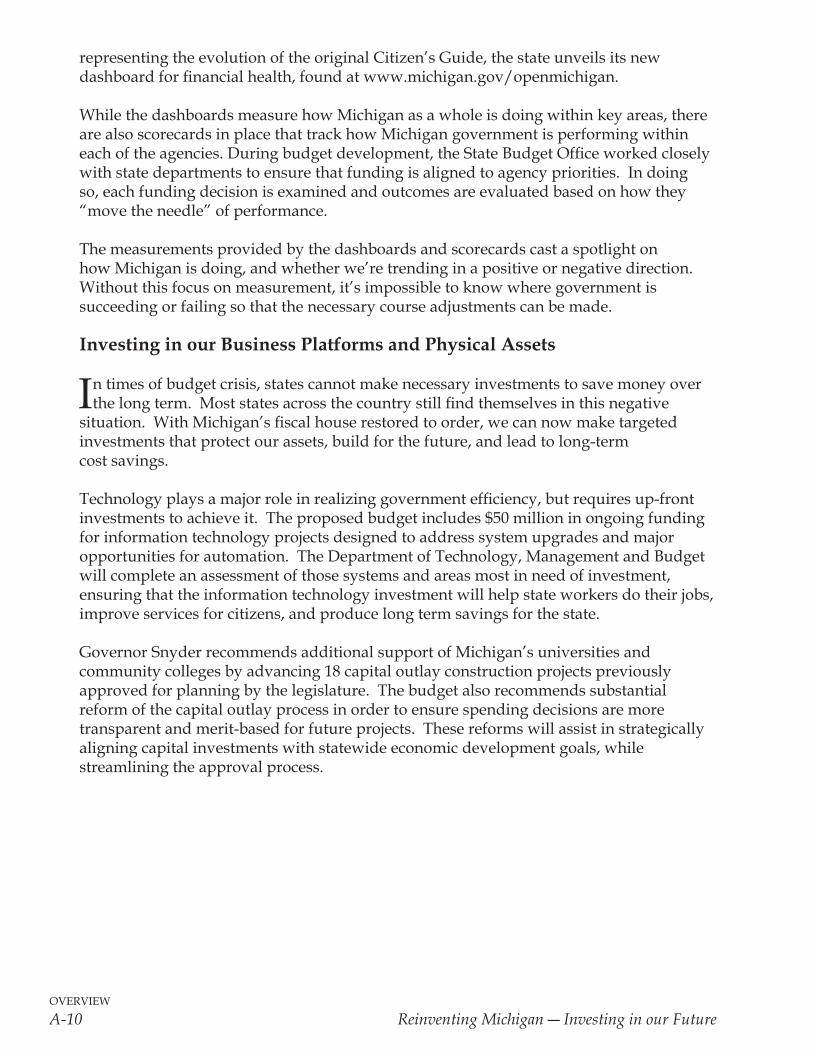
utilizing metrics and measurements to monitor progress and help make informed decisions. The commitment to government transparency and accountability is strong, and the government culture is fully ingrained in the movement to measure. Last year, the Citizens Guide to State Government provided the first step in making it easier for Michigan citizens to understand how and where their money is spent and whether it is effective. The Governor continued the progress in transparency and accountability with the Michigan Dashboard, providing a quick assessment of the state’s performance in key areas including: economic strength; health and education; value for money government; quality of life; and public safety. Separate dashboards were created for measuring education, health and wellness, infrastructure, and talent. And now, with the release of this budget and
“Snyder is hoping to end once and for all the status quo thinking that has continued long after local units of government could afford to pay for it … More cooperation and outright consolidation make sense.”
The Flint Journal, August 4, 2011
overview
A-10 Reinventing Michigan ― Investing in our Future
representing the evolution of the original Citizen’s Guide, the state unveils its new dashboard for financial health, found at www.michigan.gov/openmichigan.
While the dashboards measure how Michigan as a whole is doing within key areas, there are also scorecards in place that track how Michigan government is performing within each of the agencies. During budget development, the State Budget Office worked closely with state departments to ensure that funding is aligned to agency priorities. In doing so, each funding decision is examined and outcomes are evaluated based on how they “move the needle” of performance.
The measurements provided by the dashboards and scorecards cast a spotlight on how Michigan is doing, and whether we’re trending in a positive or negative direction. Without this focus on measurement, it’s impossible to know where government is succeeding or failing so that the necessary course adjustments can be made. Investing in our Business Platforms and Physical Assets
In times of budget crisis, states cannot make necessary investments to save money over the long term. Most states across the country still find themselves in this negative
situation. With Michigan’s fiscal house restored to order, we can now make targeted investments that protect our assets, build for the future, and lead to long-term cost savings.
Technology plays a major role in realizing government efficiency, but requires up-front investments to achieve it. The proposed budget includes $50 million in ongoing funding for information technology projects designed to address system upgrades and major opportunities for automation. The Department of Technology, Management and Budget will complete an assessment of those systems and areas most in need of investment, ensuring that the information technology investment will help state workers do their jobs, improve services for citizens, and produce long term savings for the state.
Governor Snyder recommends additional support of Michigan’s universities and community colleges by advancing 18 capital outlay construction projects previously approved for planning by the legislature. The budget also recommends substantial reform of the capital outlay process in order to ensure spending decisions are more transparent and merit-based for future projects. These reforms will assist in strategically aligning capital investments with statewide economic development goals, while streamlining the approval process.
overview
Fiscal Years 2013 and 2014 Executive Budget Recommendation A-11
Fiscal Order Restored
Just one year ago, Michigan faced a $1.5 billion deficit with unresolved liabilities that had lingered for years. It was an unhealthy budget situation for both taxpayers and businesses.
Tough decisions were necessary to get Michigan government back into long-term structural balance so residents and businesses could see that state government had its fiscal house in order. Through a strong partnership with the legislature, the deficit is gone and the budget is in structural balance. For the first time in almost a decade, state government is balanced for the future, with ongoing expenditures now matching ongoing revenues. Reinventing Michigan demanded a new approach to budgeting.
Legacy Costs No Longer Ignored
Not only has the budget been put into balance for the long
term, Governor Snyder’s 2012 budget also took major strides in addressing the state’s long-term liabilities, including post-retiree health care costs. The state paid off its $3.2 billion loan to the federal government for unemployment benefits in order to refinance the liability at a better rate. Successful negotiations with unions representing state employees produced solutions to better manage rocketing state employee health care costs. In short, after too many years of pushing the problem down the road, the state got serious about its legacy costs.
One of the most significant and monumental accomplishments came with the signing of Public Acts 264 and 265 in December 2011 (commonly referred to as the OPEB legislation, where OPEB refers to “other post-employment benefits”). The new laws reduce the state’s long-term retiree health care liability, ensuring that the post-retirement promises made to employees can be kept.
Michigan has restructured state employee retiree benefits, saving the state $5.6 billion in long-term liabilities. Funding has been included in the base budget to fully fund the anticipated actuarially required contribution (ARC) for state employee pensions and health care. Fully funding the ARC is significant, especially in light of the OPEB legislation, because it’s another step in paying down the liability and making good on the promise to state employees.
Last year also brought important and significant reforms to health care costs for existing state employees. After a successful bargaining process between the state and union leaders representing state employees, the Michigan Civil Service Commission took action in approving the contracts overwhelmingly ratified by the unions. As in the case of the OPEB legislation, the agreement provided wins for both the state and state employees. The new contracts provide a 1 percent pay raise to state employees in October, 2012. In addition, lump-sum payments will
“Working together, Michigan showed great commitment to do not just what is easy but what is right. Not what is political but what is practical. Not what is partisan but what is principled. While not everyone agreed on every approach, we worked hard to make sure our decisions were rooted in common sense. We refused to engage in the kind of finger-pointing that stymies government from meeting its obligations to citizens.”
Governor Rick Snyder, State of the State Address,
January 18, 2012
overview
A-12 Reinventing Michigan ― Investing in our Future
be made in 2012 and 2013 that equal 1 percent increases, but will not be added to ongoing base pay. In turn, union leaders worked in partnership with the state to resolve the financial stress placed on the state related to funding health care for employees. As a result of the agreement, all employees will begin paying 20 percent of their health plan premiums beginning in October 2012, bringing the state in line with the private sector. Those hired on or after April 1, 2010 already pay 20 percent.
Deferred Maintenance
Another component of infrastructure that too often goes unnoticed is maintenance of state buildings. The budget recommendation includes $15 million in ongoing funding for
state buildings plus $10 million in one-time funding to be administered by the Department of Technology, Management and Budget (DTMB). The past practice of bonding for routine building maintenance defers payment of current costs to the future. The new funding will eliminate that practice and fund current needs with current resources. DTMB will develop a space consolidation plan that will make better use of existing state office space, putting necessary investments into the renovation and upkeep of existing state owned buildings, eliminating the need for some of the existing leased space paid for by the state. The proposed budget also includes funding for armory maintenance with $2.4 million in ongoing funding, plus an additional $2.4 million in one-time funding.
Maintaining Structural Balance; Reserves for a Rainy Day
While this budget places new investments in our future,
the importance of maintaining structural balance has not been and cannot be lost. Funding for programs is recommended based on the state’s ability to pay, making sure that revenues match expenditures to keep the state in balance for the long term.
This budget recommendation makes another deposit in the Budget Stabilization Fund. Commonly referred to as the Rainy Day Fund, a deposit of $130 million is recommended to continue to build the necessary reserves in the event of an emergency. This deposit, coupled with the action taken last year to invest $255 million into the fund, places the state’s rainy day reserves at $385 million - a far cry from just two short years ago when the fund had bottomed out and there were essentially no emergency reserves.
“Last January, Michigan ranked at or near the bottom of most measures of economic activity and attractiveness. Today, its recovery is leading the nation, and the people who make decisions about where to invest are viewing the state in a far more favorable light...Using today’s surpluses to further reduce Michigan’s future obligations is a good investment.”
The Detroit News, December 27, 2011
overview
Fiscal Years 2013 and 2014 Executive Budget Recommendation A-13
External Validation
Working in “dog years” coupled with “relentless positive action” have been popular themes in all
areas of the Snyder administration, and those concepts have certainly been applied to the budget development process. Hard work and a positive attitude toward structural balance have led the budget process, and others outside of Michigan have taken note. In July 2011, Fitch Ratings announced that it had revised the State of Michigan’s Rating Outlook for all bonds to Positive from Stable. According to Fitch, continued evidence of a return to structural balance in the budget, continued progress toward re-building reserve funds, and continued employment recovery could trigger a future upgrade in Michigan’s rating.
Fitch Ratings are not the only ones who have noticed the positive steps in Michigan. Bloomberg has long been a respected leader when it comes to delivering business and financial information, news and insight around the world. In November 2011, Bloomberg’s Economic Evaluation of States ranked Michigan second in economic health out of all 50 states, sending a strong message that Michigan’s economy is headed in the right direction. The Bloomberg analysis took into account important economic factors such as personal income, tax revenue, employment, home prices and other key indicators, placing Michigan at the upper echelon of the ranking. The Bloomberg evaluation provides evidence that Michigan is ripe for positive growth in our economy that will make a positive difference for Michiganders. Strong corporate performance, coupled with the fact that Michigan’s state budget is now balanced for the long term, has put Michigan in a solid economic position.
Conclusion
This budget invests in our future and funds the key priorities to continue Michigan’s recovery and its path to further growth and success. In stark contrast to last year’s budget where cuts
and strong reforms were necessary for long-term structural balance, this budget is focused on building on that foundation – a budget made possible due to the tough but necessary decisions made in the 2012 budget. This two-year budget presented by Governor Snyder continues the plan that will lead to job creation and a brighter future for Michigan’s residents. It is a budget built with metrics and measurements so our progress and results can be monitored, found at www.michigan.gov/openmichigan. The Snyder administration stands ready to work in partnership with the members of the Michigan House of Representatives and Senate to enact a fiscal year 2013 budget that will lead to an even stronger, more prosperous state.
“The Positive Outlook reflects prudent budgeting and efforts to grow reserve levels in the context of an economy beginning to slowly rebound.”
Fitch Ratings, July 2011

overview
A-14 Reinventing Michigan ― Investing in our Future
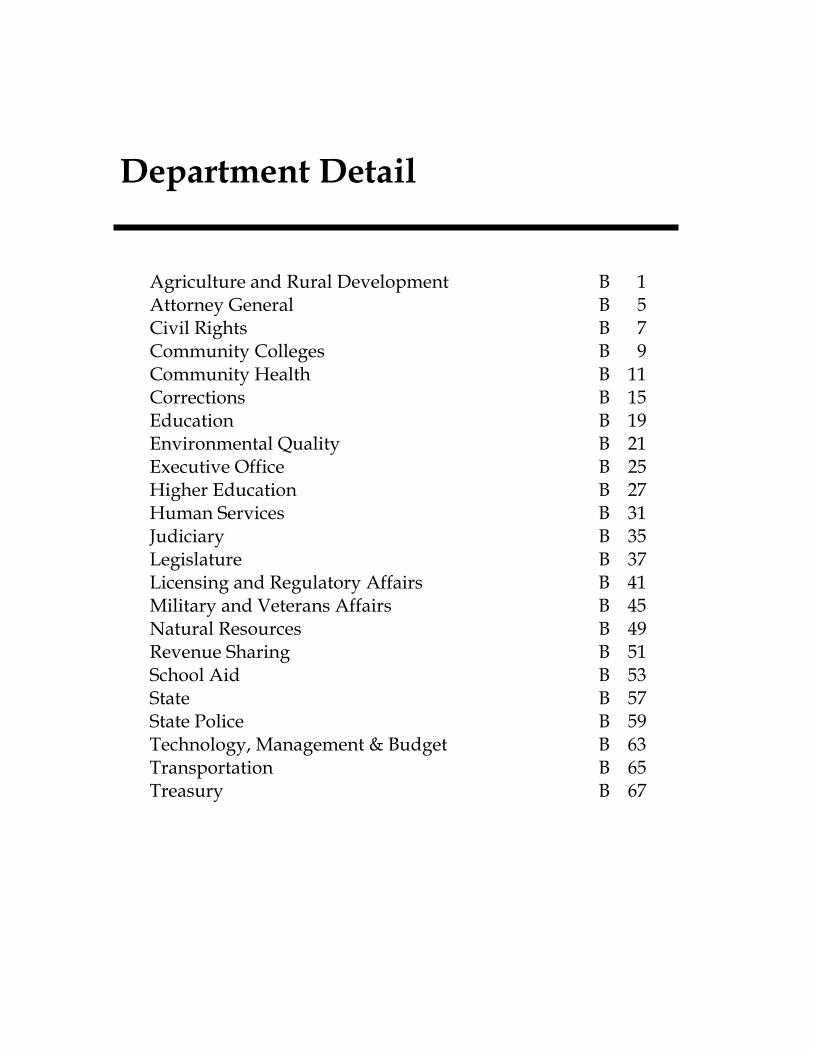
Department Detail Agriculture and Rural Development B 1 Attorney General B 5 Civil Rights B 7 Community Colleges B 9 Community Health B 11 Corrections B 15 Education B 19 Environmental Quality B 21 Executive Office B 25 Higher Education B 27 Human Services B 31 Judiciary B 35 Legislature B 37 Licensing and Regulatory Affairs B 41 Military and Veterans Affairs B 45 Natural Resources B 49 Revenue Sharing B 51 School Aid B 53 State B 57 State Police B 59 Technology, Management & Budget B 63 Transportation B 65 Treasury B 67

agriculture and rural development
Fiscal Years 2013 and 2014 Executive Budget Recommendation B-1
Department of Agriculture and Rural Development
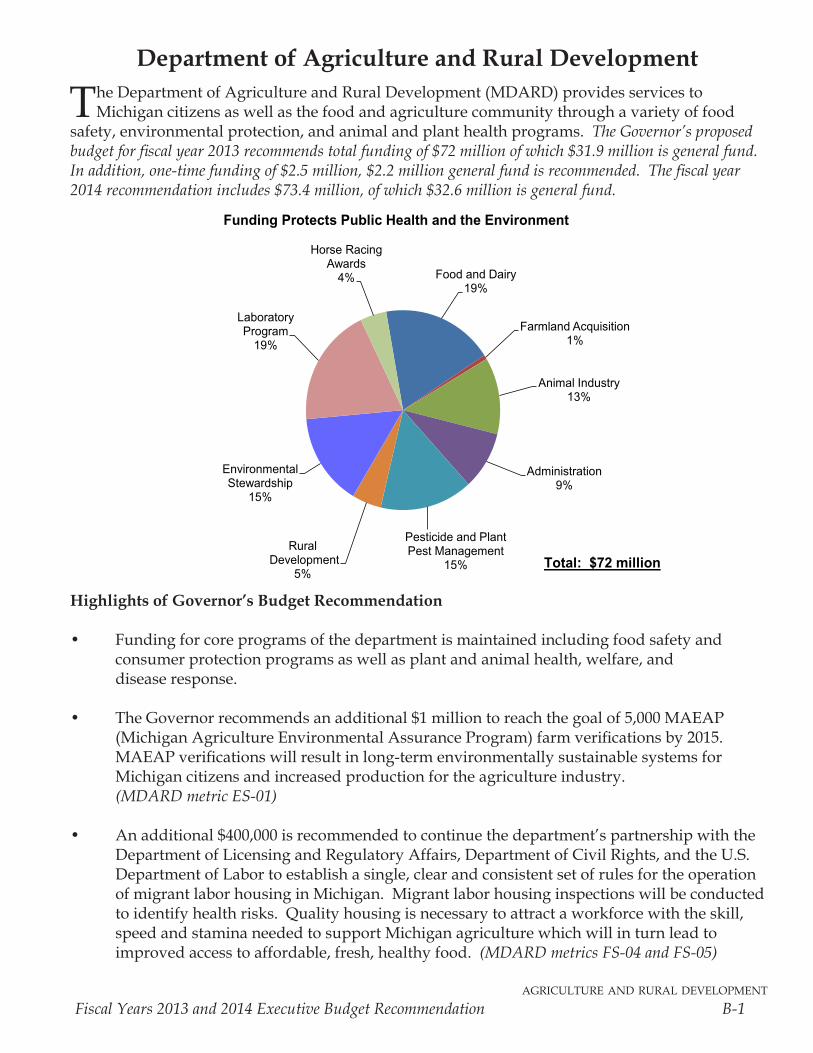
The Department of Agriculture and Rural Development (MDARD) provides services to Michigan citizens as well as the food and agriculture community through a variety of food
safety, environmental protection, and animal and plant health programs. The Governor’s proposed budget for fiscal year 2013 recommends total funding of $72 million of which $31.9 million is general fund. In addition, one-time funding of $2.5 million, $2.2 million general fund is recommended. The fiscal year 2014 recommendation includes $73.4 million, of which $32.6 million is general fund.
Highlights of Governor’s Budget Recommendation • Funding for core programs of the department is maintained including food safety and
consumer protection programs as well as plant and animal health, welfare, and disease response.
• The Governor recommends an additional $1 million to reach the goal of 5,000 MAEAP (MichiganAgricultureEnvironmentalAssuranceProgram)farmverificationsby2015.MAEAPverificationswillresultinlong-termenvironmentallysustainablesystemsforMichigan citizens and increased production for the agriculture industry. (MDARD metric ES-01)
• An additional $400,000 is recommended to continue the department’s partnership with the Department of Licensing and Regulatory Affairs, Department of Civil Rights, and the U.S. DepartmentofLabortoestablishasingle,clearandconsistentsetofrulesfortheoperationofmigrantlaborhousinginMichigan.Migrantlaborhousinginspectionswillbeconductedto identify health risks. Quality housing is necessary to attract a workforce with the skill, speed and stamina needed to support Michigan agriculture which will in turn lead to improvedaccesstoaffordable,fresh,healthyfood.(MDARD metrics FS-04 and FS-05)
Food and Dairy19%
Farmland Acquisition 1%
Animal Industry13%
Administration9%
Pesticide and Plant Pest Management
15%
RuralDevelopment
5%
Environmental Stewardship
15%
Laboratory Program
19%
Horse Racing Awards
4%
Funding Protects Public Health and the Environment
Total: $72 million
agriculture and rural development
B-2 Reinventing Michigan ― Investing in our Future
• The Governor recommends an additional $600,000 for rural development activities. A networkofstate,local,andprivatepartnershipswillbeleveragedtoprovidetechnicalexpertise to food processors with water, energy, and infrastructure issues which will lead to an expansion of the food and agriculture industry. In addition, $1 million is recommended in the Department of Transportation to increase investment in rail to spur economic development for agriculture, mining and manufacturing in rural Michigan. (MDARD metrics RD-01, RD-02)
• One-timefundingof$1.5million is recommended to allow the department to leverage federal and industry support to provide grants to fiveregionalfoodhubsacrossthestateresultinginnewmarketopportunitiesforMichiganproducers and increased fresh and healthy food for Michigan residents. These resources will also assist in implementing new federal Food Safety Modernization Act requirements through producer training, inspections and testing. The department will assist owners of foodproducinganimalswiththeproperuseofantibioticstopreventanimaldiseasewhileminimizingantibioticsenteringthefoodsupplyandassureasafeandwholesomefoodsupplythroughlaboratorytestingvalidation. (MDARD metric RD-03)
• TheGovernorrecommends$500,000one-timefundingtore-establishlocalaccesstoprofessionalforestersacrossthestate.Fundingwillbeusedforgrantstoconservationdistricts to provide private landowners with assistance in managing their forestland in ordertoincreasethenumberofacresunderasustainableforestrymanagementplan.(MDARD metrics RD-04, RD-05)
“In Michigan, railroads are critical to the success of agricultural production, whether they’re hauling inbound fertilizer or outbound grain. Freight rail is not a luxury for the agriculture and agri-business industries – it is a necessity.” Special Message from Governor Snyder, Reinventing Michigan’s Infrastructure, October 26, 2011
agriculture and rural development
Fiscal Years 2013 and 2014 Executive Budget Recommendation B-3
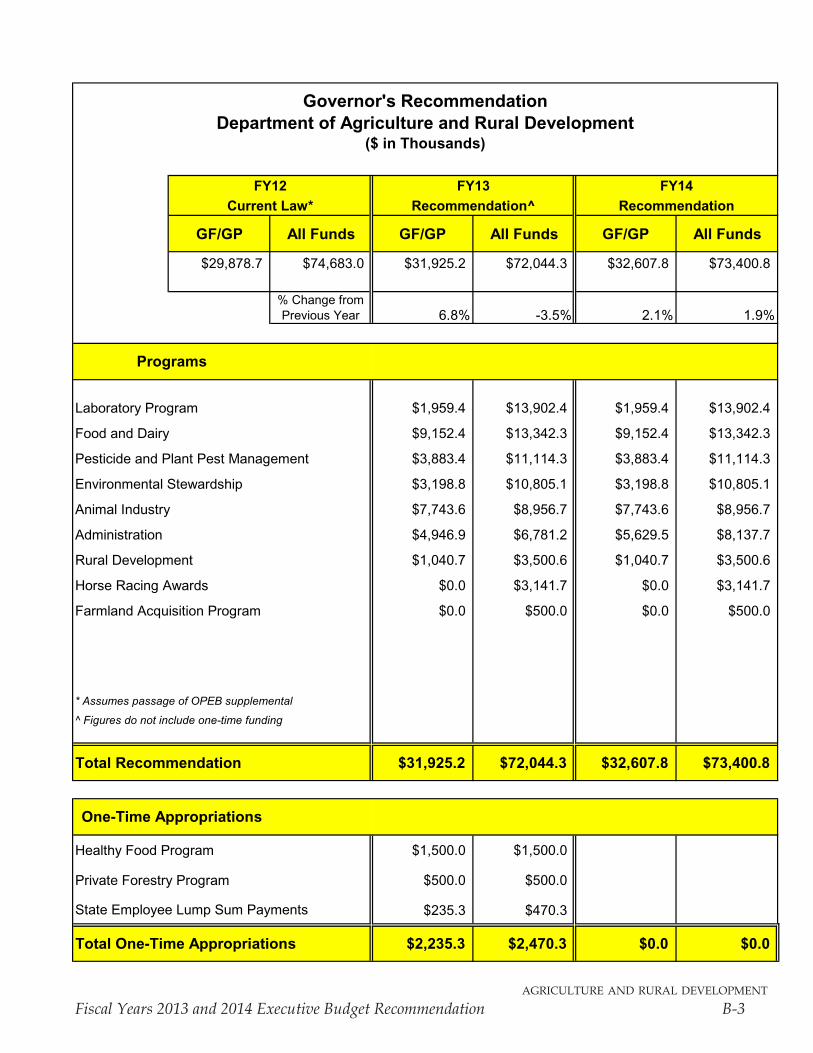
FY12 FY13 FY14Current Law* Recommendation^ Recommendation
GF/GP All Funds GF/GP All Funds GF/GP All Funds
$29,878.7 $74,683.0 $31,925.2 $72,044.3 $32,607.8 $73,400.8
% Change from Previous Year 6.8% -3.5% 2.1% 1.9%
Laboratory Program $1,959.4 $13,902.4 $1,959.4 $13,902.4
Food and Dairy $9,152.4 $13,342.3 $9,152.4 $13,342.3
Pesticide and Plant Pest Management $3,883.4 $11,114.3 $3,883.4 $11,114.3
Environmental Stewardship $3,198.8 $10,805.1 $3,198.8 $10,805.1
Animal Industry $7,743.6 $8,956.7 $7,743.6 $8,956.7
Administration $4,946.9 $6,781.2 $5,629.5 $8,137.7
Rural Development $1,040.7 $3,500.6 $1,040.7 $3,500.6
Horse Racing Awards $0.0 $3,141.7 $0.0 $3,141.7
Farmland Acquisition Program $0.0 $500.0 $0.0 $500.0
* Assumes passage of OPEB supplemental
^ Figures do not include one-time funding
Total Recommendation $31,925.2 $72,044.3 $32,607.8 $73,400.8
Healthy Food Program $1,500.0 $1,500.0
Private Forestry Program $500.0 $500.0
$235.3 $470.3
Total One-Time Appropriations $2,235.3 $2,470.3 $0.0 $0.0
Governor's RecommendationDepartment of Agriculture and Rural Development
($ in Thousands)
Programs
One-Time Appropriations
State Employee Lump Sum Payments

agriculture and rural development
B-4 Reinventing Michigan ― Investing in our Future
attorney general
Fiscal Years 2013 and 2014 Executive Budget Recommendation B-5
Attorney General
The Attorney General serves as the State of Michigan’s chief law enforcement officer and upholds and preserves the state’s legal interests. The Attorney General provides legal advice
and representation to state officials and agencies and, when warranted, initiates legal action on behalf of the residents of Michigan. The Attorney General also receives and investigates consumer complaints and enforces child support orders. The Governor’s proposed budget for fiscal year 2013 recommends total funding of $83.9 million, of which $33.3 million is general fund. A one-time appropriation of $1 million, $393,300 general fund, is recommended in fiscal year 2013 to fund state employee lump sum payments. Anticipated funding for fiscal year 2014 is recommended at $85.9 million, of which $34 million is general fund.
Highlights of Governor’s Budget Recommendation
• The Executive Recommendation provides almost $82 million for Attorney General Operations, which funds 250 attorneys who provide a wide array of legal services including representation of state officials and agencies, child abuse and neglect, health care fraud, consumer protection, and litigation on behalf of the state.
• Over $2 million is recommended for the Prosecuting Attorneys Coordinating Council, an autonomous agency that provides training, automation support, and legal research for local prosecutors throughout the state.
• In order to reduce backlogs for outstanding warrants in high crime areas of the state and increase prosecutions and incarceration of offenders, $900,000 is added to the Attorney General budget to fund additional prosecutorial services. This funding is one component of the Governor’s public safety initiative, which is intended to reduce crime in high-risk urban areas. As part of this initiative, additional funding is also recommended for the departments of Corrections and State Police.
• A multi-agency approach involving the departments of State Police, Treasury, and the Attorney General will be implemented to improve enforcement of tobacco tax laws and enforcement of the multi-state tobacco settlement agreement. The Governor recommends $500,000 for the department of Attorney General to support these efforts, which will yield increased investigations and prosecutions, with a subsequent growth in civil assessments and tobacco tax revenues.
attorney general
B-6 Reinventing Michigan ― Investing in our Future
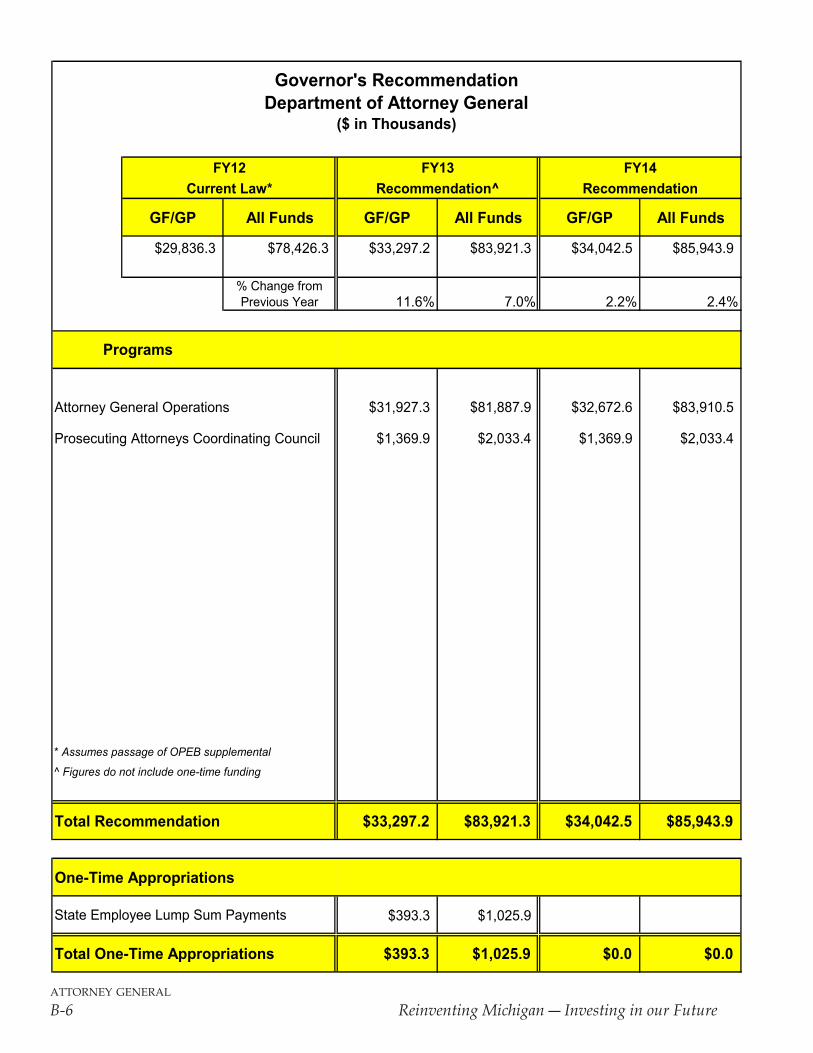
FY12 FY13 FY14Current Law* Recommendation^ Recommendation
GF/GP All Funds GF/GP All Funds GF/GP All Funds
$29,836.3 $78,426.3 $33,297.2 $83,921.3 $34,042.5 $85,943.9
% Change from Previous Year 11.6% 7.0% 2.2% 2.4%
Attorney General Operations $31,927.3 $81,887.9 $32,672.6 $83,910.5
Prosecuting Attorneys Coordinating Council $1,369.9 $2,033.4 $1,369.9 $2,033.4
* Assumes passage of OPEB supplemental
^ Figures do not include one-time funding
Total Recommendation $33,297.2 $83,921.3 $34,042.5 $85,943.9
One-Time Appropriations
$393.3 $1,025.9
Total One-Time Appropriations $393.3 $1,025.9 $0.0 $0.0
Governor's RecommendationDepartment of Attorney General
($ in Thousands)
Programs
State Employee Lump Sum Payments
civil rights
Fiscal Years 2013 and 2014 Executive Budget Recommendation B-7
Department of Civil Rights
The Department of Civil Rights (MDCR) resolves and investigates discrimination complaints and works to prevent discrimination through educational programs that promote voluntary
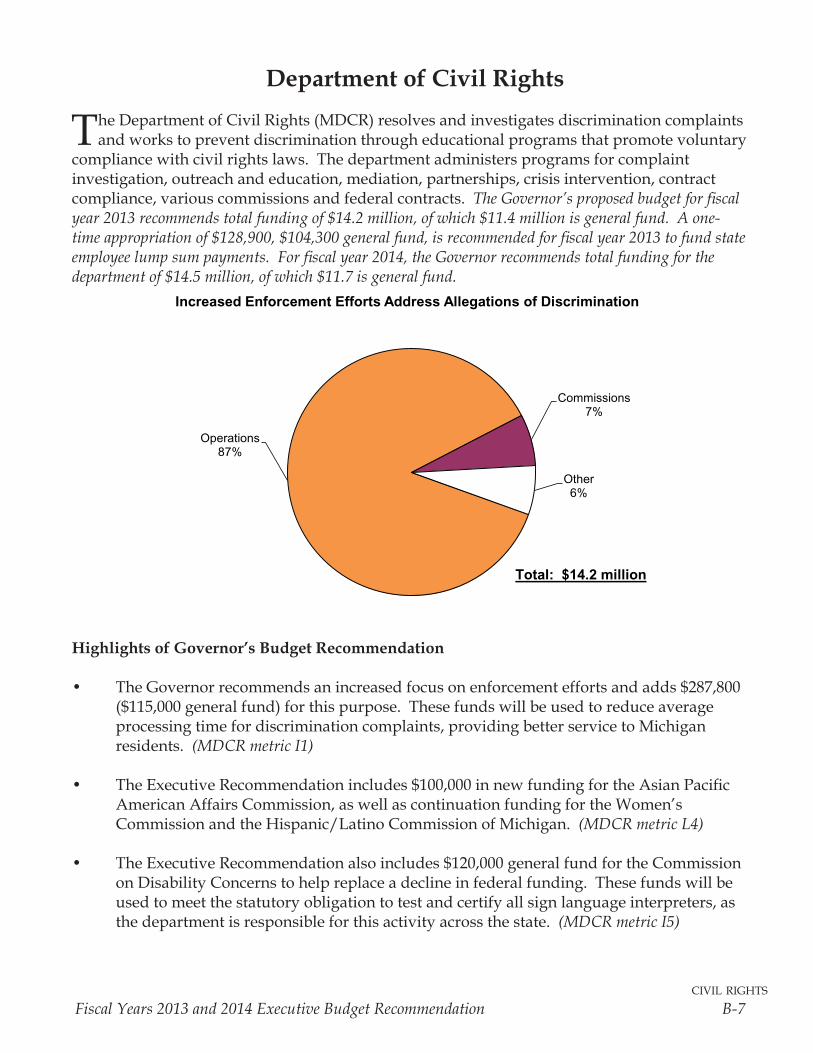
compliance with civil rights laws. The department administers programs for complaint investigation, outreach and education, mediation, partnerships, crisis intervention, contract compliance, various commissions and federal contracts. The Governor’s proposed budget for fiscal year 2013 recommends total funding of $14.2 million, of which $11.4 million is general fund. A one-time appropriation of $128,900, $104,300 general fund, is recommended for fiscal year 2013 to fund state employee lump sum payments. For fiscal year 2014, the Governor recommends total funding for the department of $14.5 million, of which $11.7 is general fund.
Highlights of Governor’s Budget Recommendation
• TheGovernorrecommendsanincreasedfocusonenforcementeffortsandadds$287,800($115,000generalfund)forthispurpose.Thesefundswillbeusedtoreduceaverageprocessingtimefordiscriminationcomplaints,providingbetterservicetoMichiganresidents. (MDCR metric I1)
• TheExecutiveRecommendationincludes$100,000innewfundingfortheAsianPacificAmericanAffairsCommission,aswellascontinuationfundingfortheWomen’sCommission and the Hispanic/Latino Commission of Michigan. (MDCR metric L4)
• TheExecutiveRecommendationalsoincludes$120,000generalfundfortheCommissiononDisabilityConcernstohelpreplaceadeclineinfederalfunding.Thesefundswillbeusedtomeetthestatutoryobligationtotestandcertifyallsignlanguageinterpreters,asthedepartmentisresponsibleforthisactivityacrossthestate.(MDCR metric I5)
Operations 87%
Commissions7%
Other6%
Increased Enforcement Efforts Address Allegations of Discrimination
Total: $14.2 million
civil rights
B-8 Reinventing Michigan ― Investing in our Future
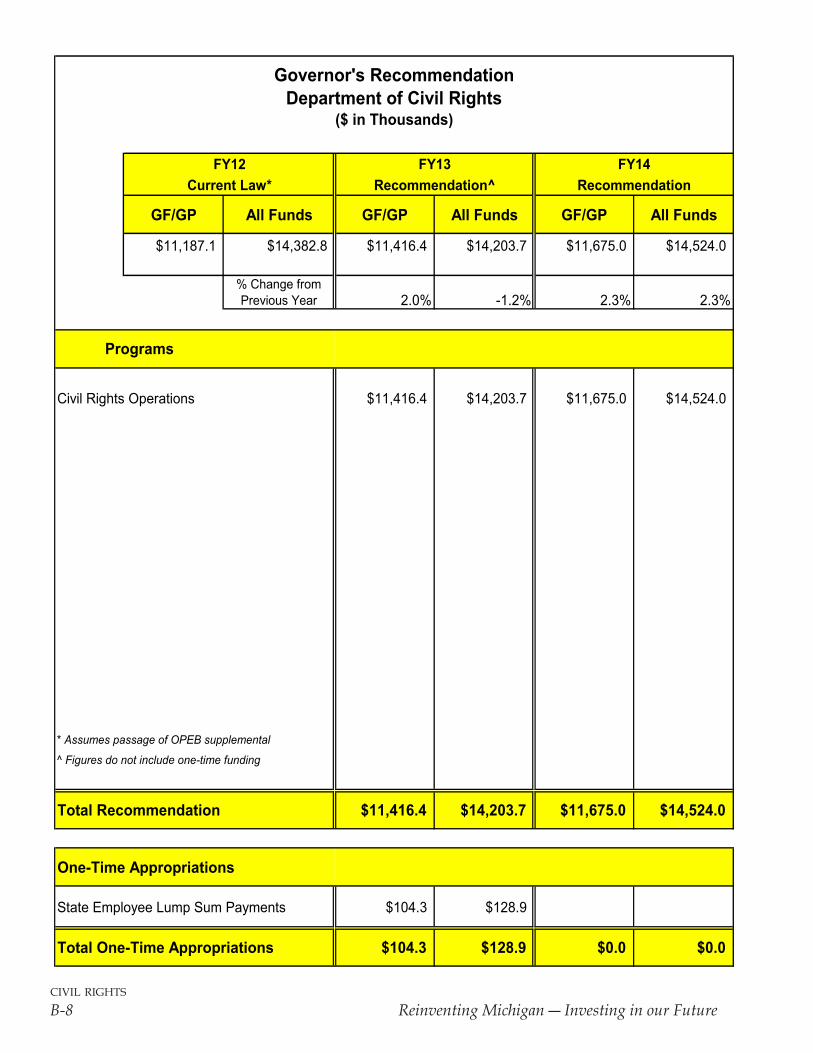
FY12 FY13 FY14Current Law* Recommendation^ Recommendation
GF/GP All Funds GF/GP All Funds GF/GP All Funds
$11,187.1 $14,382.8 $11,416.4 $14,203.7 $11,675.0 $14,524.0
% Change from Previous Year 2.0% -1.2% 2.3% 2.3%
Civil Rights Operations $11,416.4 $14,203.7 $11,675.0 $14,524.0
* Assumes passage of OPEB supplemental
^ Figures do not include one-time funding
Total Recommendation $11,416.4 $14,203.7 $11,675.0 $14,524.0
One-Time Appropriations
State Employee Lump Sum Payments $104.3 $128.9
Total One-Time Appropriations $104.3 $128.9 $0.0 $0.0
Governor's RecommendationDepartment of Civil Rights
($ in Thousands)
Programs
community colleges
Fiscal Years 2013 and 2014 Executive Budget Recommendation B-9
Community Colleges
Akey component of Michigan’s education system, the state’s 28 community colleges provide over 485,000 residents per year with affordable access to postsecondary
education opportunities. The average annual college tuition for a full-time in-district student is approximately $2,600. These institutions are integral to attaining the Governor’s goal of ensuring that at least 60 percent of Michigan residents have a high-quality degree or credential by 2025. The Governor’s proposed budget for fiscal years 2013 and 2014 recommends total funding of $294.1 million, of which $96.5 million is general fund.
Highlights of Governor’s Budget Recommendation
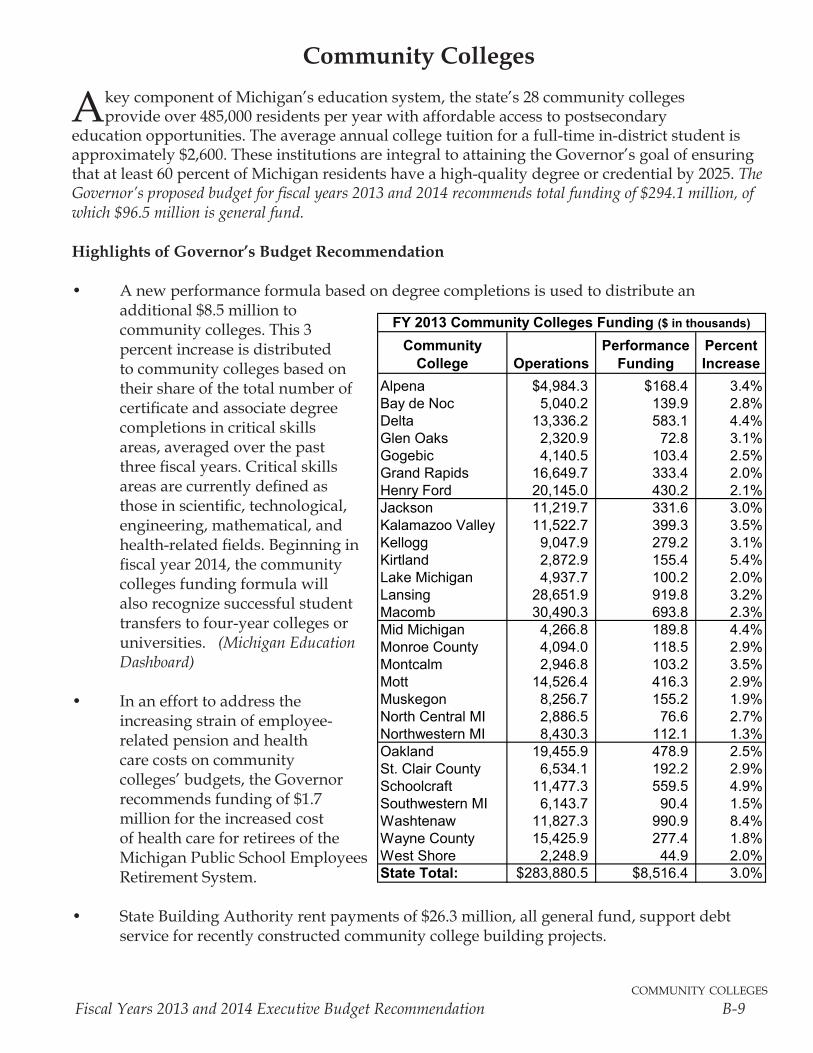
• Anewperformanceformulabasedondegreecompletionsisusedtodistributeanadditional $8.5 million to community colleges. This 3 percent increase is distributed to community colleges based on their share of the total number of certificateandassociatedegreecompletions in critical skills areas, averaged over the past threefiscalyears.Criticalskillsareasarecurrentlydefinedasthoseinscientific,technological,engineering, mathematical, and health-relatedfields.Beginninginfiscalyear2014,thecommunitycolleges funding formula will also recognize successful student transfers to four-year colleges or universities. (Michigan Education Dashboard)
• Inanefforttoaddresstheincreasing strain of employee-related pension and health care costs on community colleges’ budgets, the Governor recommendsfundingof$1.7million for the increased cost of health care for retirees of the Michigan Public School Employees Retirement System.
• StateBuildingAuthorityrentpaymentsof$26.3million,allgeneralfund,supportdebtservice for recently constructed community college building projects.
Community College Operations
Performance Funding
Percent Increase
Alpena $4,984.3 $168.4 3.4%Bay de Noc 5,040.2 139.9 2.8%Delta 13,336.2 583.1 4.4%Glen Oaks 2,320.9 72.8 3.1%Gogebic 4,140.5 103.4 2.5%Grand Rapids 16,649.7 333.4 2.0%Henry Ford 20,145.0 430.2 2.1%Jackson 11,219.7 331.6 3.0%Kalamazoo Valley 11,522.7 399.3 3.5%Kellogg 9,047.9 279.2 3.1%Kirtland 2,872.9 155.4 5.4%Lake Michigan 4,937.7 100.2 2.0%Lansing 28,651.9 919.8 3.2%Macomb 30,490.3 693.8 2.3%Mid Michigan 4,266.8 189.8 4.4%Monroe County 4,094.0 118.5 2.9%Montcalm 2,946.8 103.2 3.5%Mott 14,526.4 416.3 2.9%Muskegon 8,256.7 155.2 1.9%North Central MI 2,886.5 76.6 2.7%Northwestern MI 8,430.3 112.1 1.3%Oakland 19,455.9 478.9 2.5%St. Clair County 6,534.1 192.2 2.9%Schoolcraft 11,477.3 559.5 4.9%Southwestern MI 6,143.7 90.4 1.5%Washtenaw 11,827.3 990.9 8.4%Wayne County 15,425.9 277.4 1.8%West Shore 2,248.9 44.9 2.0%State Total: $283,880.5 $8,516.4 3.0%
1/29/12 10:50 AM
FY 2013 Community Colleges Funding ($ in thousands)
community colleges
B-10 Reinventing Michigan ― Investing in our Future
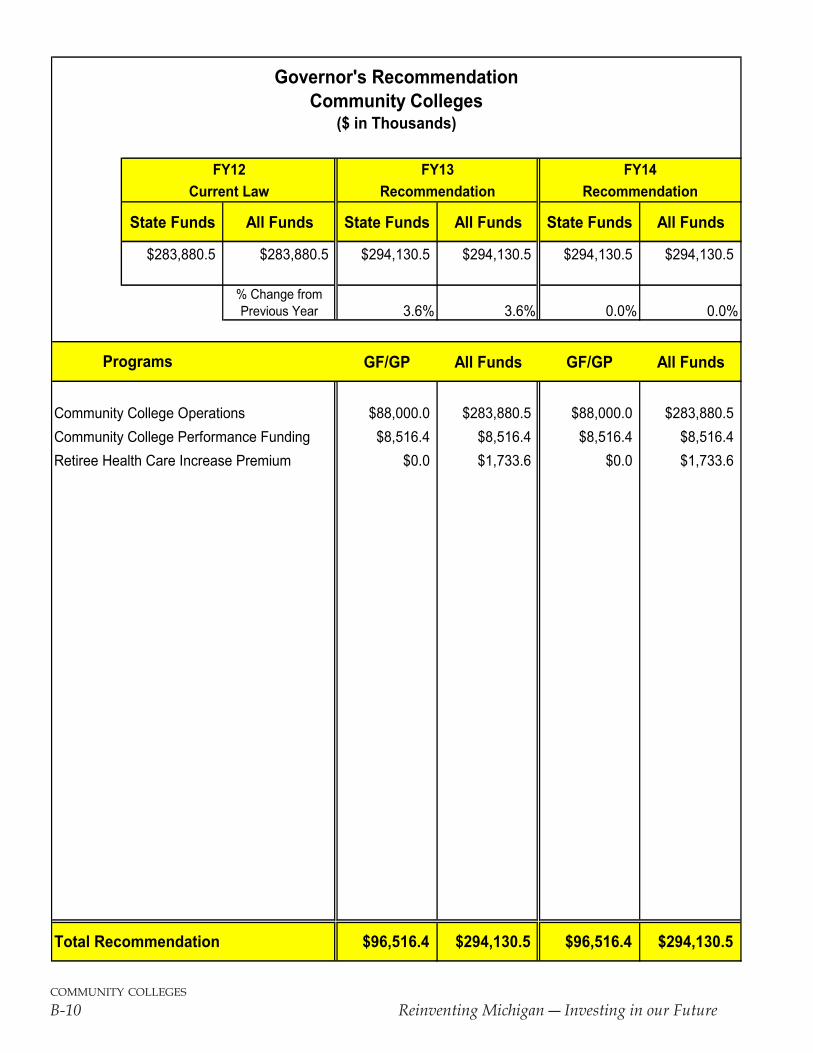
FY12 FY13 FY14Current Law Recommendation Recommendation
State Funds All Funds State Funds All Funds State Funds All Funds
$283,880.5 $283,880.5 $294,130.5 $294,130.5 $294,130.5 $294,130.5
% Change from Previous Year 3.6% 3.6% 0.0% 0.0%
GF/GP All Funds GF/GP All Funds
Community College Operations $88,000.0 $283,880.5 $88,000.0 $283,880.5Community College Performance Funding $8,516.4 $8,516.4 $8,516.4 $8,516.4Retiree Health Care Increase Premium $0.0 $1,733.6 $0.0 $1,733.6
Total Recommendation $96,516.4 $294,130.5 $96,516.4 $294,130.5
Governor's RecommendationCommunity Colleges
($ in Thousands)
Programs
community health
Fiscal Years 2013 and 2014 Executive Budget Recommendation B-11
Department of Community Health
The Department of Community Health (DCH) is responsible for health policy and management of the state’s publicly funded health care systems. These programs include Medicaid health
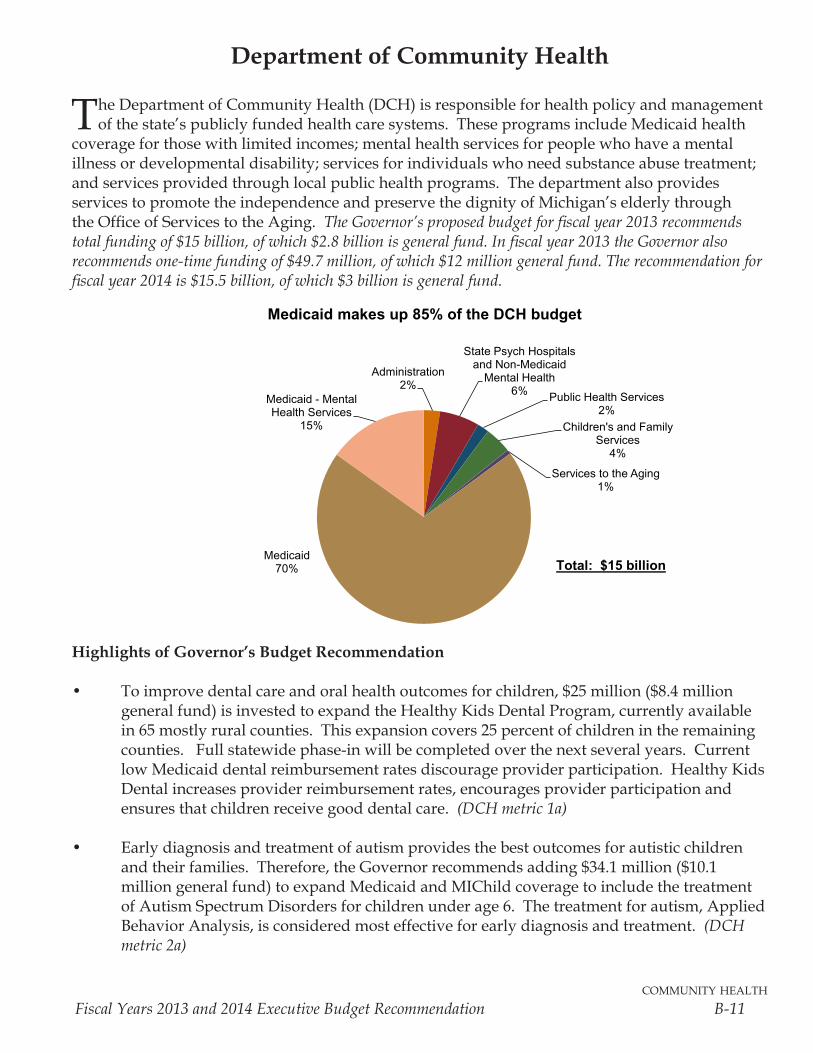
coverage for those with limited incomes; mental health services for people who have a mental illness or developmental disability; services for individuals who need substance abuse treatment; and services provided through local public health programs. The department also provides services to promote the independence and preserve the dignity of Michigan’s elderly through the Office of Services to the Aging. The Governor’s proposed budget for fiscal year 2013 recommends total funding of $15 billion, of which $2.8 billion is general fund. In fiscal year 2013 the Governor also recommends one-time funding of $49.7 million, of which $12 million general fund. The recommendation for fiscal year 2014 is $15.5 billion, of which $3 billion is general fund.
Highlights of Governor’s Budget Recommendation
• To improve dental care and oral health outcomes for children, $25 million ($8.4 million general fund) is invested to expand the Healthy Kids Dental Program, currently available in 65 mostly rural counties. This expansion covers 25 percent of children in the remaining counties. Full statewide phase-in will be completed over the next several years. Current low Medicaid dental reimbursement rates discourage provider participation. Healthy Kids Dental increases provider reimbursement rates, encourages provider participation and ensures that children receive good dental care. (DCH metric 1a)
• Early diagnosis and treatment of autism provides the best outcomes for autistic children and their families. Therefore, the Governor recommends adding $34.1 million ($10.1 million general fund) to expand Medicaid and MIChild coverage to include the treatment of Autism Spectrum Disorders for children under age 6. The treatment for autism, Applied Behavior Analysis, is considered most effective for early diagnosis and treatment. (DCH metric 2a)
Medicaid Makes up 90% of DCH Budget
Mental Health - Medicaid
20%
Mental Health - Non Medicaid
3%
Public Health4%
Medicaid70%
Other2%
Administration1%
Total: $13.0 billion
Administration2%
State Psych Hospitals and Non-Medicaid
Mental Health6% Public Health Services
2%Children's and Family
Services4%
Services to the Aging1%
Medicaid 70%
Medicaid - Mental Health Services
15%
Medicaid makes up 85% of the DCH budget
Total: $15 billion
community health
B-12 Reinventing Michigan ― Investing in our Future
• A new investment of $6 million general fund ($5 million in one-time funds and $1 million in ongoing funds) is made in Health and Wellness Initiatives that were included in the Governor’s September 2011 Special Health Message. These funds support programs that promote healthy behaviors and wellness, reduce infant mortality and reduce obesity. Achieving positive health outcomes improves lives and saves money for all Michigan residents. (Health and Wellness Dashboard)
• Michigan continues its long-standing support for serving the elderly and disabled in community settings. While nursing homes provide a valuable and necessary service for those with high care needs, home care can provide alternatives that meet client needs in a less costly community setting. (DCH metrics 4a and 4b)
- To reduce the waiting list for the MIChoice Home and Community Based Waiver Program, $11 million ($3.7 million general fund) is added to the department’s budget. This increased support allows the elderly to receive needed services while remaining in their own homes or communities.
- Transitions from nursing homes to the MIChoice Home and Community Based Waiver are supported with $3.1 million ($1 million general fund). These transitions allow the elderly to return home with the provision of community care.
- Funded with $1.6 million ($500,000 general fund) in nursing home savings, the Program of All-Inclusive Care for the Elderly (PACE) is expanded to Berrien County. PACE is a capitated program that provides acute care and long-term care in a community setting. Existing program sites are Calhoun, Kent, Muskegon and Wayne counties.
Medical Services
• Michigan’s health care safety net is protected in the Governor’s Executive Recommendation. Medicaid eligibility is maintained and provider reimbursement rates are increased for primary care providers. The DCH budget recommends $8.5 billion ($1 billion general fund) for medical services and $2.3 billion ($424.1 million general fund) for the long term care portion of the Medicaid program. This represents a 4.3 percent increase over fiscal year 2012 due to caseload increases, utilization and inflation, special provider payments and funding for actuarial soundness. Medicaid provides health care services for one out of every five Michigan residents.
• Federal law requires states to increase Medicaid primary care provider rates to 100 percent of Medicare rates. An appropriation of $282 million in federal funds supports this provider rate increase for primary care/family physicians and pediatricians. These rate increases will improve access to primary care and health outcomes for Medicaid recipients. (DCH metric 5a)
community health
Fiscal Years 2013 and 2014 Executive Budget Recommendation B-13
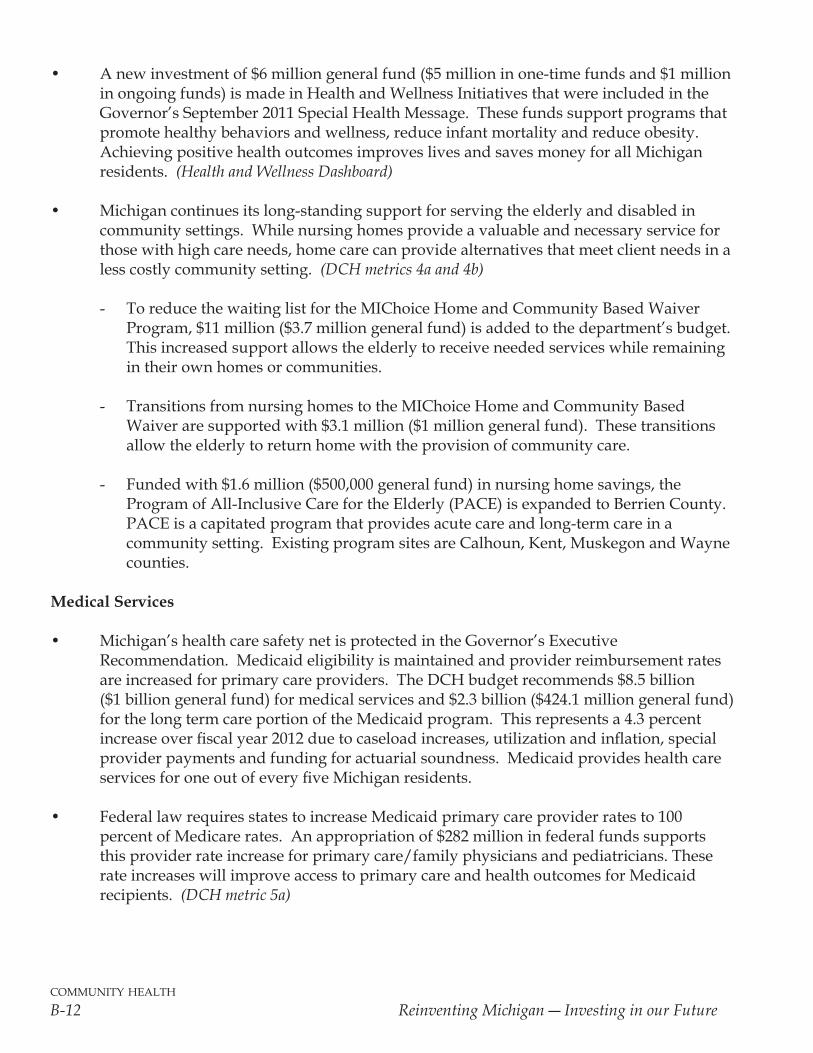
26%
41%
28%
5%
0% 5% 10% 15% 20% 25% 30% 35% 40% 45%
Aged and Disabled
Low Income Children and Families
Healthy Kids and Pregnant Women
19 & 20 year olds
Children and parents make up 69% of the 1.9 million people receiving Medicaid
Mental Health Services
• Mental health services are funded at over $3 billion consisting of $2.9 billion ($1.2 billion general fund) to provide community mental health services, and $278.7 million ($64 million general fund) to fund state-operated psychiatric hospitals and centers.
Other Budget Initiatives
• Department initiatives to reduce Medicaid fraud, increase program efficiencies and improve Medicaid service delivery achieve $13.2 million in general fund savings.
(DCH metrics 6a and 6b)
community health
B-14 Reinventing Michigan ― Investing in our Future
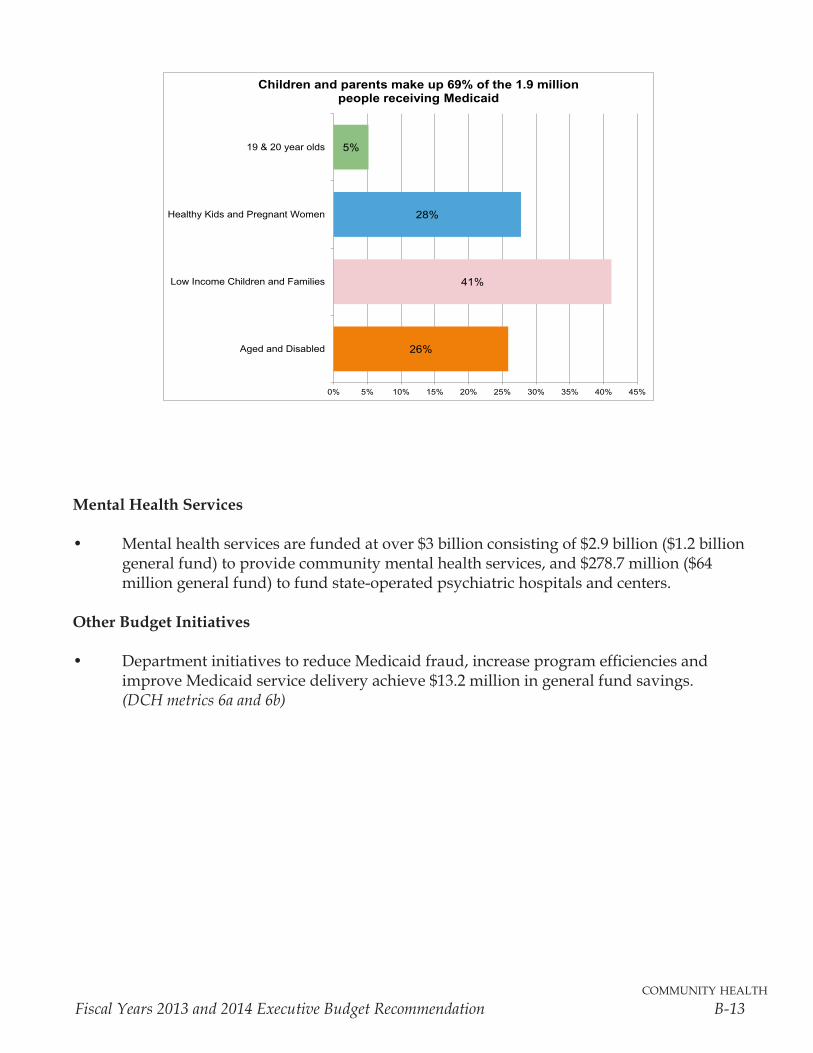
FY12 FY13 FY14Current Law*^ Recommendation^ Recommendation
GF/GP All Funds GF/GP All Funds GF/GP All Funds$2,953,127.4 $14,589,624.5 $2,835,843.2 $15,045,744.8 $2,994,360.7 $15,461,169.2
% Change from Previous Year -4.0% 3.1% 5.6% 2.8%
Medical Services $1,306,663.7 $10,532,763.5 $1,432,512.6 $10,862,841.7
Behavioral Health Services $1,178,481.4 $2,897,954.1 $1,198,958.7 $2,958,880.3
Children's and Family Services $133,560.8 $613,904.2 $139,056.2 $627,324.1
State Psychiatric Hospitals and Forensic
Mental Health Services $63,956.5 $278,689.5 $63,956.5 $278,689.5
Public Health Services $51,332.0 $265,572.7 $51,332.0 $265,572.7
Medical Services Administration $24,353.1 $215,319.3 $24,353.1 $215,319.3
Central Administration $48,918.9 $149,388.8 $55,614.8 $160,388.9
Office of Services to the Aging $28,576.8 $92,152.7 $28,576.8 $92,152.7
* Assumes passage of OPEB supplemental
^ Figures do not include one-time funding
Total Recommendation $2,835,843.2 $15,045,744.8 $2,994,360.7 $15,461,169.2
One-Time Appropriations
CHAMPS ICD-10 Diagnostic Coding Project $4,000.0 $40,000.0
Health and Wellness Initiatives $5,000.0 $5,000.0
State Laboratory Equipment and Supplies $200.0 $200.0
Elder Abuse Training and Prevention Initiatives $250.0 $250.0
$2,571.5 $4,285.3
Total One-Time Appropriations $12,021.5 $49,735.3 $0.0 $0.0
Governor's RecommendationDepartment of Community Health
($ in Thousands)
State Employee Lump Sum Payments
Programs
corrections
Fiscal Years 2013 and 2014 Executive Budget Recommendation B-15
Department of Corrections
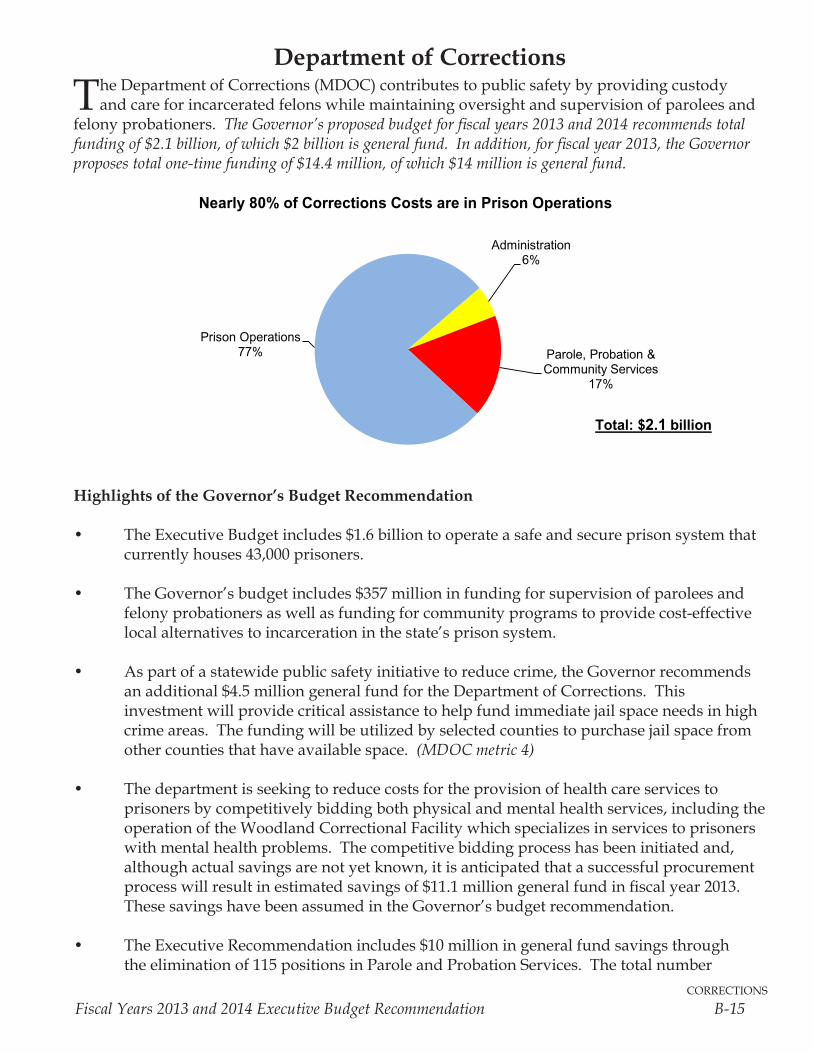
The Department of Corrections (MDOC) contributes to public safety by providing custody and care for incarcerated felons while maintaining oversight and supervision of parolees and
felony probationers. The Governor’s proposed budget for fiscal years 2013 and 2014 recommends total funding of $2.1 billion, of which $2 billion is general fund. In addition, for fiscal year 2013, the Governor proposes total one-time funding of $14.4 million, of which $14 million is general fund.
Highlights of the Governor’s Budget Recommendation
• TheExecutiveBudgetincludes$1.6billiontooperateasafeandsecureprisonsystemthatcurrently houses 43,000 prisoners.
• TheGovernor’sbudgetincludes$357millioninfundingforsupervisionofparoleesandfelony probationers as well as funding for community programs to provide cost-effective localalternativestoincarcerationinthestate’sprisonsystem.
• Aspartofastatewidepublicsafetyinitiativetoreducecrime,theGovernorrecommendsanadditional$4.5milliongeneralfundfortheDepartmentofCorrections.Thisinvestment will provide critical assistance to help fund immediate jail space needs in high crime areas. The funding will be utilized by selected counties to purchase jail space from other counties that have available space. (MDOC metric 4)
• Thedepartmentisseekingtoreducecostsfortheprovisionofhealthcareservicestoprisoners by competitively bidding both physical and mental health services, including the operation of the Woodland Correctional Facility which specializes in services to prisoners with mental health problems. The competitive bidding process has been initiated and, althoughactualsavingsarenotyetknown,itisanticipatedthatasuccessfulprocurementprocesswillresultinestimatedsavingsof$11.1milliongeneralfundinfiscalyear2013.ThesesavingshavebeenassumedintheGovernor’sbudgetrecommendation.
• TheExecutiveRecommendationincludes$10millioningeneralfundsavingsthroughtheeliminationof115positionsinParoleandProbationServices.Thetotalnumber
Administration6%
Parole, Probation & Community Services
17%
Prison Operations77%
Nearly 80% of Corrections Costs are in Prison Operations
Total: $2.1 billion
corrections B-16 Reinventing Michigan ― Investing in our Future
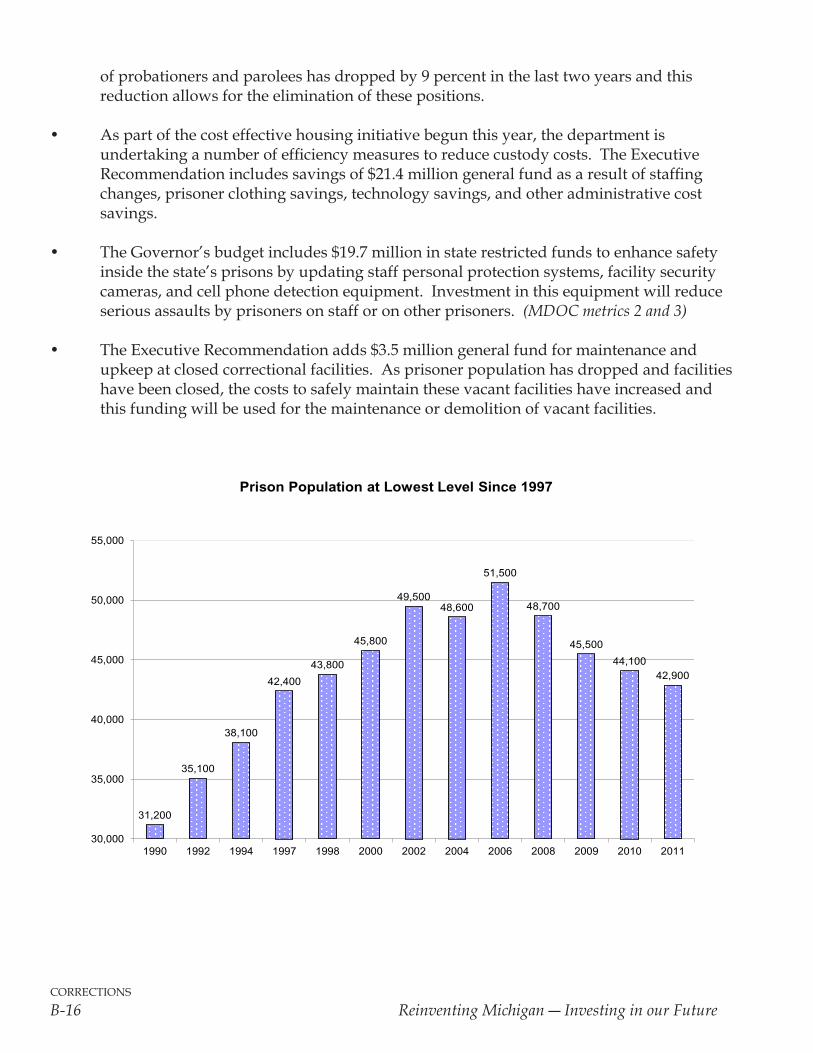
31,200
35,100
38,100
42,400
43,800
45,800
49,50048,600
51,500
48,700
45,500
44,10042,900
30,000
35,000
40,000
45,000
50,000
55,000
1990 1992 1994 1997 1998 2000 2002 2004 2006 2008 2009 2010 2011
Prison Population at Lowest Level Since 1997
of probationers and parolees has dropped by 9 percent in the last two years and this reduction allows for the elimination of these positions.
• Aspartofthecosteffectivehousinginitiativebegunthisyear,thedepartmentisundertakinganumberofefficiencymeasurestoreducecustodycosts.TheExecutiveRecommendationincludessavingsof$21.4milliongeneralfundasaresultofstaffingchanges, prisoner clothing savings, technology savings, and other administrative cost savings.
• TheGovernor’sbudgetincludes$19.7millioninstaterestrictedfundstoenhancesafetyinsidethestate’sprisonsbyupdatingstaffpersonalprotectionsystems,facilitysecuritycameras, and cell phone detection equipment. Investment in this equipment will reduce serious assaults by prisoners on staff or on other prisoners. (MDOC metrics 2 and 3)
• TheExecutiveRecommendationadds$3.5milliongeneralfundformaintenanceandupkeepatclosedcorrectionalfacilities.Asprisonerpopulationhasdroppedandfacilitieshave been closed, the costs to safely maintain these vacant facilities have increased and this funding will be used for the maintenance or demolition of vacant facilities.
corrections
Fiscal Years 2013 and 2014 Executive Budget Recommendation B-17
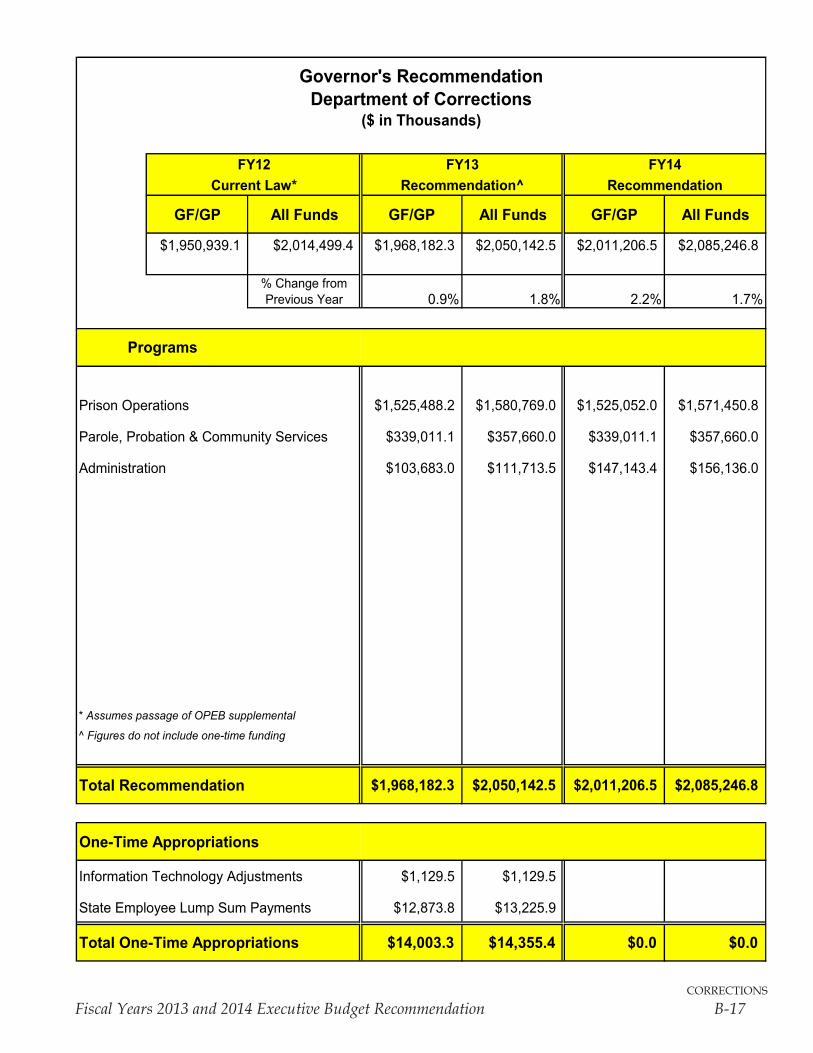
FY12 FY13 FY14Current Law* Recommendation^ Recommendation
GF/GP All Funds GF/GP All Funds GF/GP All Funds
$1,950,939.1 $2,014,499.4 $1,968,182.3 $2,050,142.5 $2,011,206.5 $2,085,246.8
% Change from Previous Year 0.9% 1.8% 2.2% 1.7%
Prison Operations $1,525,488.2 $1,580,769.0 $1,525,052.0 $1,571,450.8
Parole, Probation & Community Services $339,011.1 $357,660.0 $339,011.1 $357,660.0
Administration $103,683.0 $111,713.5 $147,143.4 $156,136.0
* Assumes passage of OPEB supplemental
^ Figures do not include one-time funding
Total Recommendation $1,968,182.3 $2,050,142.5 $2,011,206.5 $2,085,246.8
One-Time Appropriations
Information Technology Adjustments $1,129.5 $1,129.5
State Employee Lump Sum Payments $12,873.8 $13,225.9
Total One-Time Appropriations $14,003.3 $14,355.4 $0.0 $0.0
Governor's RecommendationDepartment of Corrections
($ in Thousands)
Programs

corrections B-18 Reinventing Michigan ― Investing in our Future
education
Fiscal Years 2013 and 2014 Executive Budget Recommendation B-19
Department of Education
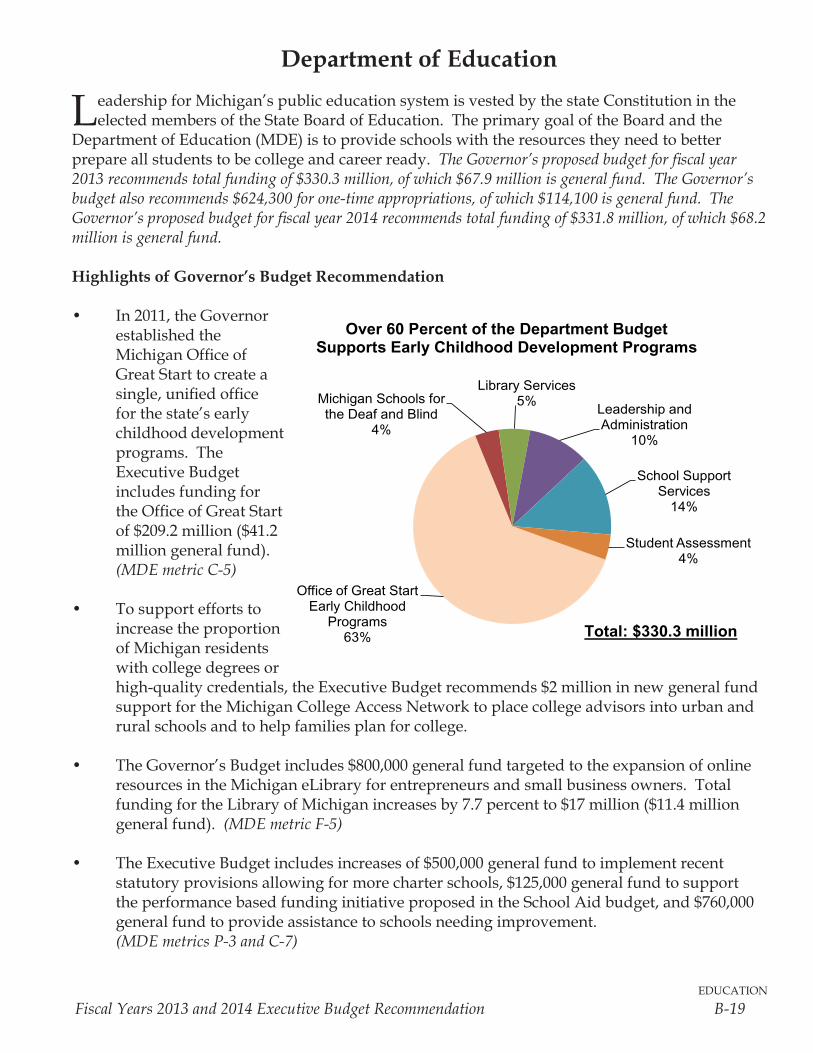
Leadership for Michigan’s public education system is vested by the state Constitution in the elected members of the State Board of Education. The primary goal of the Board and the
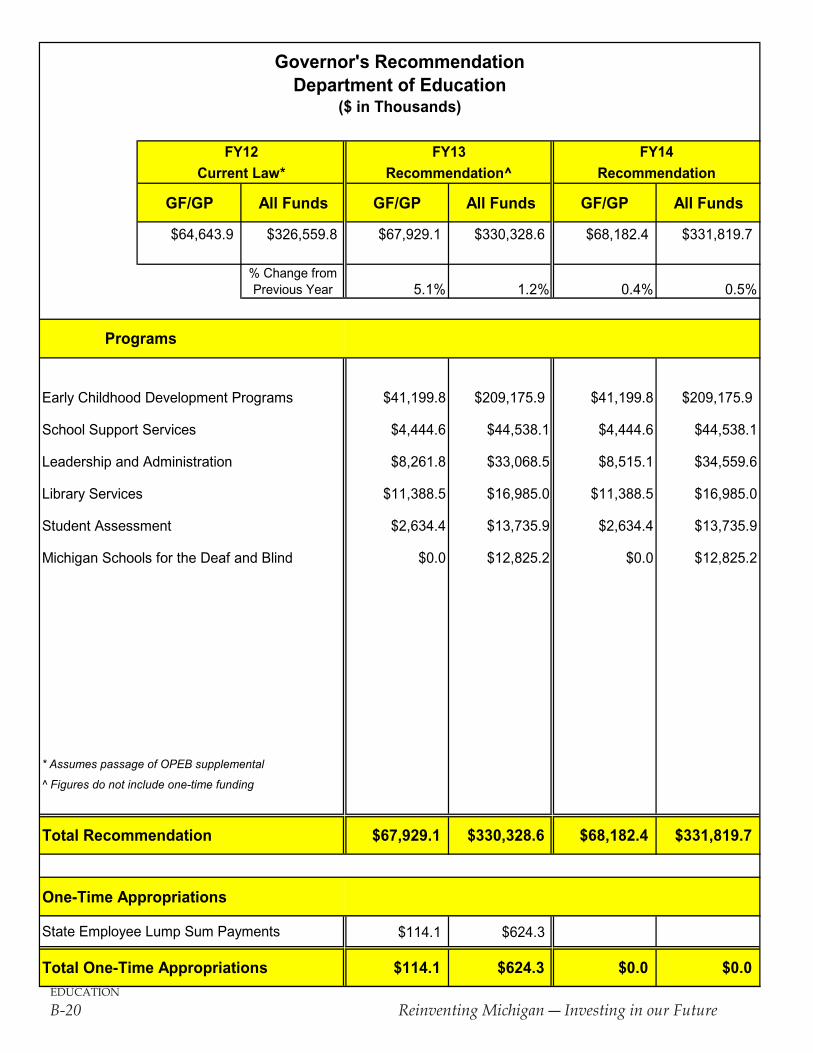
Department of Education (MDE) is to provide schools with the resources they need to better prepare all students to be college and career ready. The Governor’s proposed budget for fiscal year 2013 recommends total funding of $330.3 million, of which $67.9 million is general fund. The Governor’s budget also recommends $624,300 for one-time appropriations, of which $114,100 is general fund. The Governor’s proposed budget for fiscal year 2014 recommends total funding of $331.8 million, of which $68.2 million is general fund.
Highlights of Governor’s Budget Recommendation
• In2011,theGovernorestablished the MichiganOfficeofGreatStarttocreateasingle,unifiedofficefor the state’s early childhood development programs. The Executive Budget includes funding for theOfficeofGreatStartof$209.2million($41.2million general fund). (MDE metric C-5)
• Tosupporteffortstoincrease the proportion of Michigan residents with college degrees or high-qualitycredentials,theExecutiveBudgetrecommends$2millioninnewgeneralfundsupport for the Michigan College Access Network to place college advisors into urban and rural schools and to help families plan for college.
• TheGovernor’sBudgetincludes$800,000generalfundtargetedtotheexpansionofonlineresources in the Michigan eLibrary for entrepreneurs and small business owners. Total fundingfortheLibraryofMichiganincreasesby7.7percentto$17million($11.4milliongeneral fund). (MDE metric F-5)
• TheExecutiveBudgetincludesincreasesof$500,000generalfundtoimplementrecentstatutoryprovisionsallowingformorecharterschools,$125,000generalfundtosupporttheperformancebasedfundinginitiativeproposedintheSchoolAidbudget,and$760,000general fund to provide assistance to schools needing improvement. (MDE metrics P-3 and C-7)
Office of Great Start Early Childhood
Programs63%
Michigan Schools for the Deaf and Blind
4%
Library Services5%
Leadership and Administration
10%
School Support Services
14%
Student Assessment4%
Total: $330.3 million
Over 60 Percent of the Department Budget Supports Early Childhood Development Programs
education
B-20 Reinventing Michigan ― Investing in our Future
FY12 FY13 FY14Current Law* Recommendation^ Recommendation
GF/GP All Funds GF/GP All Funds GF/GP All Funds
$64,643.9 $326,559.8 $67,929.1 $330,328.6 $68,182.4 $331,819.7
% Change from Previous Year 5.1% 1.2% 0.4% 0.5%
Early Childhood Development Programs $41,199.8 $209,175.9 $41,199.8 $209,175.9
School Support Services $4,444.6 $44,538.1 $4,444.6 $44,538.1
Leadership and Administration $8,261.8 $33,068.5 $8,515.1 $34,559.6
Library Services $11,388.5 $16,985.0 $11,388.5 $16,985.0
Student Assessment $2,634.4 $13,735.9 $2,634.4 $13,735.9
Michigan Schools for the Deaf and Blind $0.0 $12,825.2 $0.0 $12,825.2
* Assumes passage of OPEB supplemental
^ Figures do not include one-time funding
Total Recommendation $67,929.1 $330,328.6 $68,182.4 $331,819.7
One-Time Appropriations
$114.1 $624.3
Total One-Time Appropriations $114.1 $624.3 $0.0 $0.0
Governor's RecommendationDepartment of Education
($ in Thousands)
Programs
State Employee Lump Sum Payments
environmental quality
Fiscal Years 2013 and 2014 Executive Budget Recommendation B-21
Department of Environmental Quality
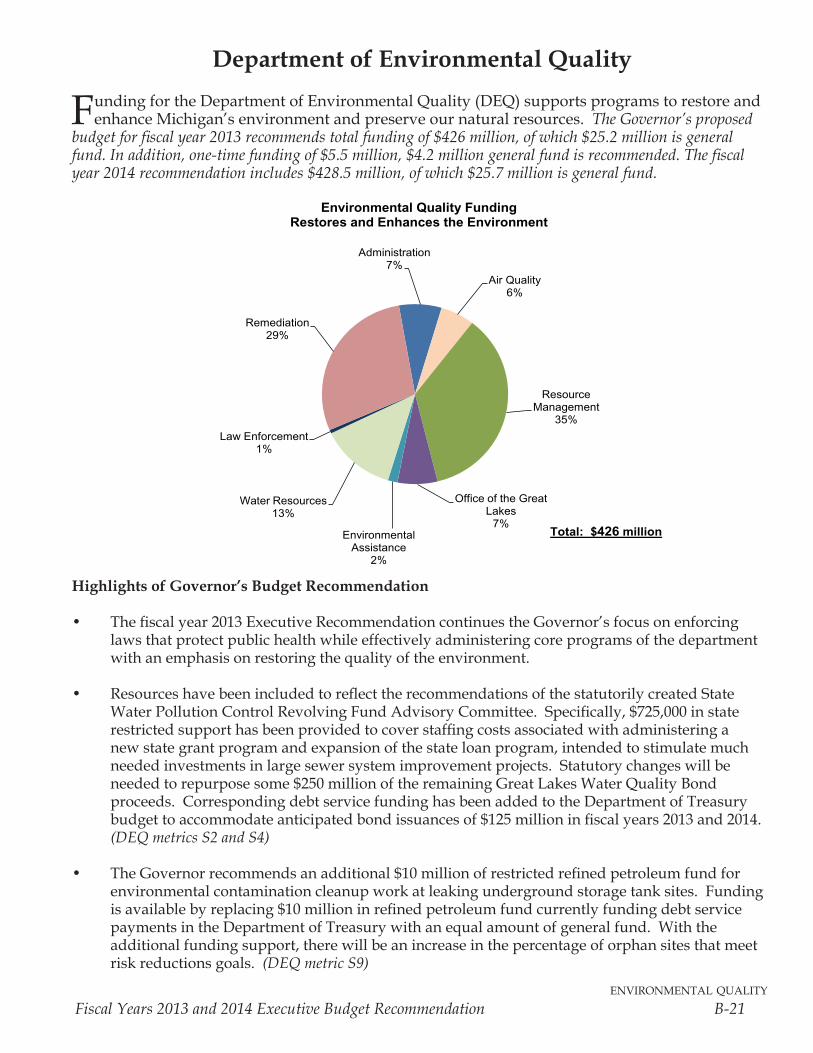
Funding for the Department of Environmental Quality (DEQ) supports programs to restore and enhance Michigan’s environment and preserve our natural resources. The Governor’s proposed
budget for fiscal year 2013 recommends total funding of $426 million, of which $25.2 million is general fund. In addition, one-time funding of $5.5 million, $4.2 million general fund is recommended. The fiscal year 2014 recommendation includes $428.5 million, of which $25.7 million is general fund.
Highlights of Governor’s Budget Recommendation
• Thefiscalyear2013ExecutiveRecommendationcontinuestheGovernor’sfocusonenforcinglaws that protect public health while effectively administering core programs of the department with an emphasis on restoring the quality of the environment.
• ResourceshavebeenincludedtoreflecttherecommendationsofthestatutorilycreatedStateWaterPollutionControlRevolvingFundAdvisoryCommittee.Specifically,$725,000instaterestrictedsupporthasbeenprovidedtocoverstaffingcostsassociatedwithadministeringanewstategrantprogramandexpansionofthestateloanprogram,intendedtostimulatemuchneededinvestmentsinlargesewersystemimprovementprojects.Statutorychangeswillbeneededtorepurposesome$250millionoftheremainingGreatLakesWaterQualityBondproceeds.CorrespondingdebtservicefundinghasbeenaddedtotheDepartmentofTreasurybudgettoaccommodateanticipatedbondissuancesof$125millioninfiscalyears2013and2014.
(DEQ metrics S2 and S4)
• TheGovernorrecommendsanadditional$10millionofrestrictedrefinedpetroleumfundforenvironmentalcontaminationcleanupworkatleakingundergroundstoragetanksites.Fundingisavailablebyreplacing$10millioninrefinedpetroleumfundcurrentlyfundingdebtservicepaymentsintheDepartmentofTreasurywithanequalamountofgeneralfund.Withtheadditionalfundingsupport,therewillbeanincreaseinthepercentageoforphansitesthatmeetriskreductionsgoals.(DEQ metric S9)
Administration7%
Air Quality6%
Resource Management
35%
Office of the Great Lakes
7%Environmental
Assistance2%
Water Resources13%
Law Enforcement1%
Remediation29%
Environmental Quality Funding Restores and Enhances the Environment
Total: $426 million
environmental quality
B-22 Reinventing Michigan ― Investing in our Future
• One-timerestrictedfundingof$2millionisrecommendedtoenhancetheNationalPollutant
DischargeEliminationManagementSystemandcombineitwiththeCoastalandInlandWatersPermitInformationSystemtoformanewconsolidatedMiWaters(MichiganWaters)system.Thesesystemsimprovementswilldecreasetheamountoftimerequiredtoprocesspermitapplications,therebyimprovingoverallcustomerservice. (DEQ metrics B4, S2 and S4)
• Anadditional$2.5milliongeneralfundisrecommendedforuseasstatematchtoobtainfederalgrantdollarsforthedrinkingwaterrevolvingfundprogram.Theadditionalfundingwill provide infrastructure loans to public water suppliers enabling an increased percentage ofcommunitiestobeincompliancewithhealth-basedstandardscontainedintheFederalSafeDrinkingWaterAct.Anadditional$2.5millioninone-timefundingforthesamepurposeisalsorecommended. (DEQ metrics S8 and F3)
• Thewaterwithdrawalprogramhasoperatedusingavailablefundbalanceresourceswhichwillnotbeavailableinfiscalyear2013.TheGovernorproposestoincreasetheannualwaterusereportingfeefrom$200to$250inordertoprotectandrestoretheaquaticecosystemandprovideforcleanandsafewaterresources.Thecurrentfeegeneratesapproximately$240,000andthenewstructurewillgenerateanestimated$648,200.Thefeewillapplytoanyonemakingoneormorewaterwithdrawalsofover100,000gallonsofwaterperdayina30-dayperiod.
(DEQ metric S10)
• One-timefundingof$1.5milliongeneralfundaswellas$500,000ofongoingfederalfundingisrecommended to offset restricted funds which are no longer available for the wetlands program. Staterestrictedfundswhichhavebeensupportingtheprogramforthepastthreeyearshavebeendepletedplacingatrisktheprocessingofconsolidatedlandandwaterinterfacepermitswithinstatutorydeadlines.TheWetlandsAdvisoryCouncil,establishedin2009,isexpectedtomakelongtermfundingrecommendationsinAugustof2012. (DEQ metric B1)

environmental quality
Fiscal Years 2013 and 2014 Executive Budget Recommendation B-23
FY12 FY13 FY14Current Law*^ Recommendation^ Recommendation
GF/GP All Funds GF/GP All Funds GF/GP All Funds
$22,378.3 $422,987.1 $25,244.9 $425,979.0 $25,735.3 $428,460.8
% Change from Previous Year 12.8% 0.7% 1.9% 0.6%
Resource Management $3,740.7 $151,674.5 $3,740.7 $151,674.5
Remediation Services $0.0 $122,475.5 $0.0 $122,475.5
Water Resources $11,869.4 $55,944.5 $11,869.4 $53,944.5
Administration $4,313.1 $31,488.1 $4,803.5 $35,969.9
Office of the Great Lakes $375.8 $29,556.6 $375.8 $29,556.6
Air Quality $4,404.8 $25,046.1 $4,404.8 $25,046.1
Office of Environmental Assistance $0.0 $7,082.6 $0.0 $7,082.6
Law Enforcement $541.1 $2,711.1 $541.1 $2,711.1
* Assumes passage of OPEB supplemental
^ Figures do not include one-time funding
Total Recommendation $25,244.9 $425,979.0 $25,735.3 $428,460.8
One-Time Appropriations
Drinking Water Revolving Fund State Match $2,500.0 $2,500.0
Wetlands Program $1,500.0 $1,500.0
$160.1 $1,549.2
Total One-Time Appropriations $4,160.1 $5,549.2 $0.0 $0.0
Governor's RecommendationDepartment of Environmental Quality
($ in Thousands)
Programs
State Employee Lump Sum Payments

environmental quality
B-24 Reinventing Michigan ― Investing in our Future
executive office Fiscal Years 2013 and 2014 Executive Budget Recommendation B-25
Executive Office
The Executive Office is the Office of the Governor. The budget provides funding for the Governor and his immediate staff, who assist him in executing his constitutional
responsibilities as chief executive of the State of Michigan. The Executive Office also includes funding for the Lieutenant Governor’s office. The Lieutenant Governor performs gubernatorial functions in the Governor’s absence, presides over the Senate, serves on the State Administrative Board and represents the Governor at selected local, state and national meetings. The Executive Office also contains the Constituent Services Division, which serves as a resource for the citizens of Michigan to communicate their concerns and opinions directly to the Governor. The Governor’s proposed budget for fiscal years 2013 and 2014 recommends total funding of $4.8 million.
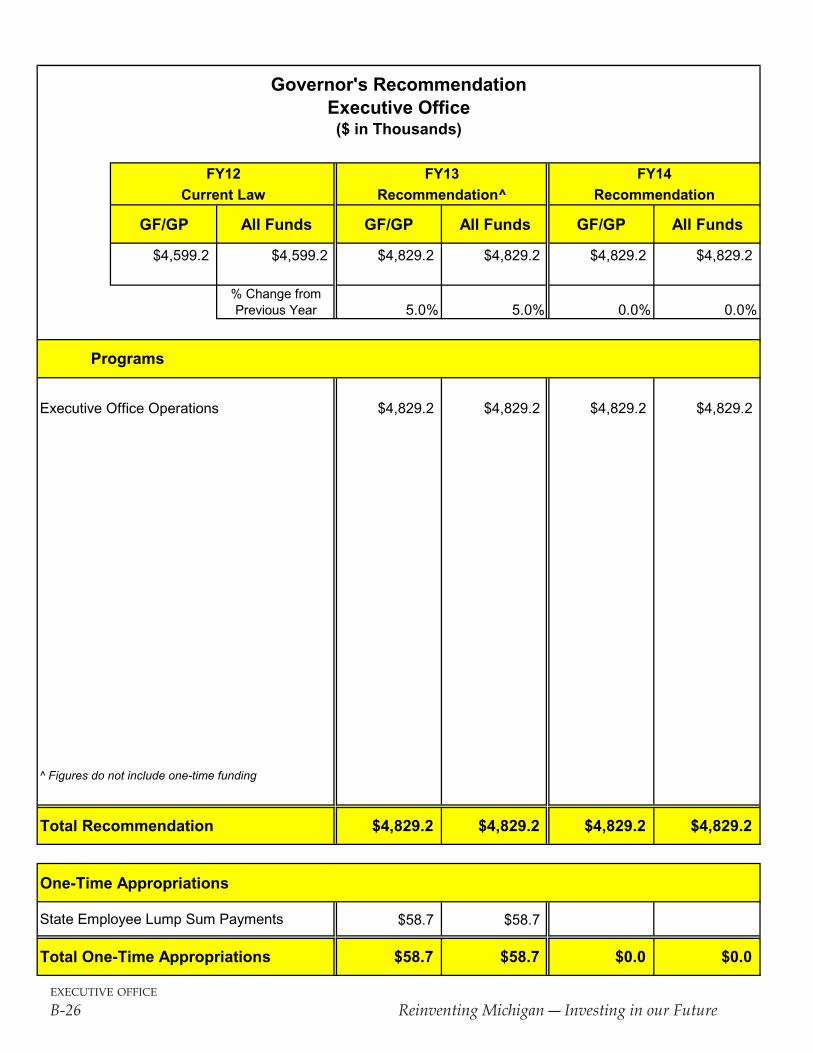
executive office
B-26 Reinventing Michigan ― Investing in our Future
FY12 FY13 FY14Current Law Recommendation^ Recommendation
GF/GP All Funds GF/GP All Funds GF/GP All Funds
$4,599.2 $4,599.2 $4,829.2 $4,829.2 $4,829.2 $4,829.2
% Change from Previous Year 5.0% 5.0% 0.0% 0.0%
Executive Office Operations $4,829.2 $4,829.2 $4,829.2 $4,829.2
^ Figures do not include one-time funding
Total Recommendation $4,829.2 $4,829.2 $4,829.2 $4,829.2
One-Time Appropriations
$58.7 $58.7
Total One-Time Appropriations $58.7 $58.7 $0.0 $0.0
Governor's RecommendationExecutive Office($ in Thousands)
Programs
State Employee Lump Sum Payments
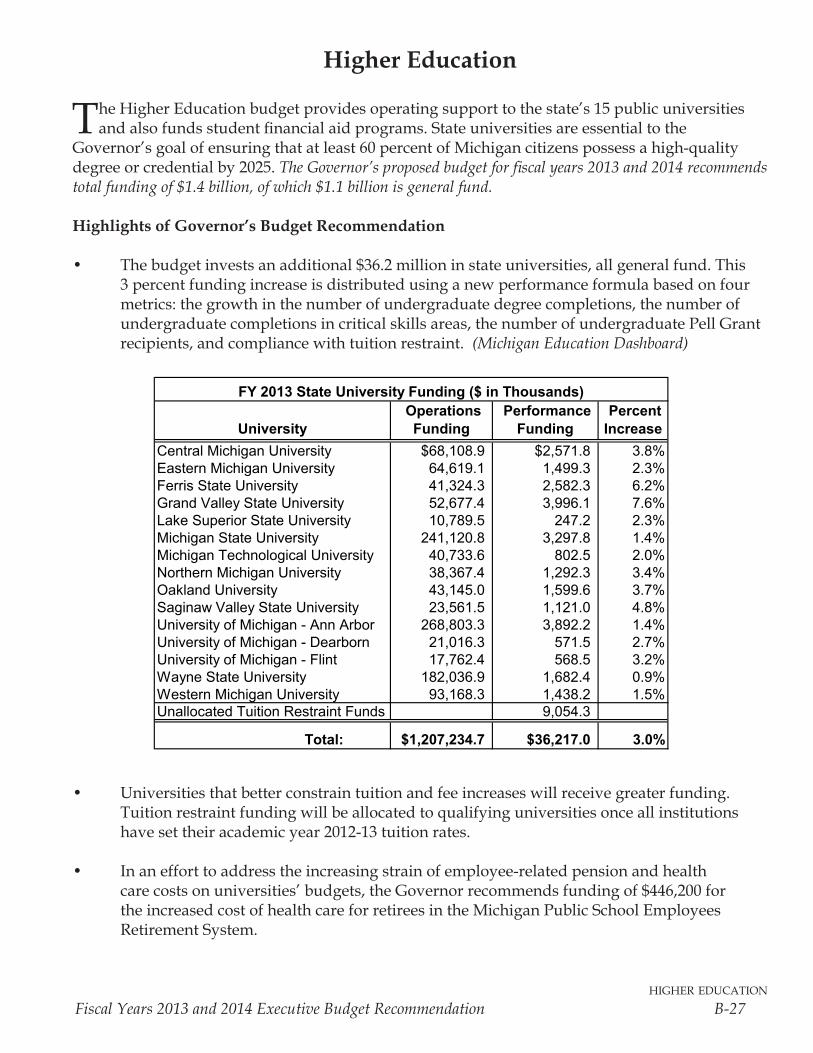
higher education
Fiscal Years 2013 and 2014 Executive Budget Recommendation B-27
Higher Education
The Higher Education budget provides operating support to the state’s 15 public universities and also funds student financial aid programs. State universities are essential to the
Governor’s goal of ensuring that at least 60 percent of Michigan citizens possess a high-quality degree or credential by 2025. The Governor’s proposed budget for fiscal years 2013 and 2014 recommends total funding of $1.4 billion, of which $1.1 billion is general fund.
Highlights of Governor’s Budget Recommendation
• The budget invests an additional $36.2 million in state universities, all general fund. This 3 percent funding increase is distributed using a new performance formula based on four metrics: the growth in the number of undergraduate degree completions, the number of undergraduate completions in critical skills areas, the number of undergraduate Pell Grant recipients, and compliance with tuition restraint. (Michigan Education Dashboard)
• Universities that better constrain tuition and fee increases will receive greater funding. Tuition restraint funding will be allocated to qualifying universities once all institutions have set their academic year 2012-13 tuition rates.
• In an effort to address the increasing strain of employee-related pension and health care costs on universities’ budgets, the Governor recommends funding of $446,200 for the increased cost of health care for retirees in the Michigan Public School Employees Retirement System.
University Operations
Funding Performance
Funding Percent Increase
Central Michigan University $68,108.9 $2,571.8 3.8%Eastern Michigan University 64,619.1 1,499.3 2.3%Ferris State University 41,324.3 2,582.3 6.2%Grand Valley State University 52,677.4 3,996.1 7.6%Lake Superior State University 10,789.5 247.2 2.3%Michigan State University 241,120.8 3,297.8 1.4%Michigan Technological University 40,733.6 802.5 2.0%Northern Michigan University 38,367.4 1,292.3 3.4%Oakland University 43,145.0 1,599.6 3.7%Saginaw Valley State University 23,561.5 1,121.0 4.8%University of Michigan - Ann Arbor 268,803.3 3,892.2 1.4%University of Michigan - Dearborn 21,016.3 571.5 2.7%University of Michigan - Flint 17,762.4 568.5 3.2%Wayne State University 182,036.9 1,682.4 0.9%Western Michigan University 93,168.3 1,438.2 1.5%Unallocated Tuition Restraint Funds 9,054.3
Total: $1,207,234.7 $36,217.0 3.0%
2/5/12 2:59 PM
FY 2013 State University Funding ($ in Thousands)
higher education
B-28 Reinventing Michigan ― Investing in our Future
• Funding for all student grant and financial aid programs is $98.2 million, $1.1 million of which is general fund.
• To ensure that limited student financial aid resources result in successful student outcomes, private institutions that receive Tuition Grant funding will be required to comply with certain performance reporting and data submission best practices.
• State Building Authority rent payments of $124 million, all general fund, support debt service for recently constructed university building projects. An additional $2.3 million general fund is appropriated for debt service for the Facility for Rare Isotope Beams at Michigan State University.
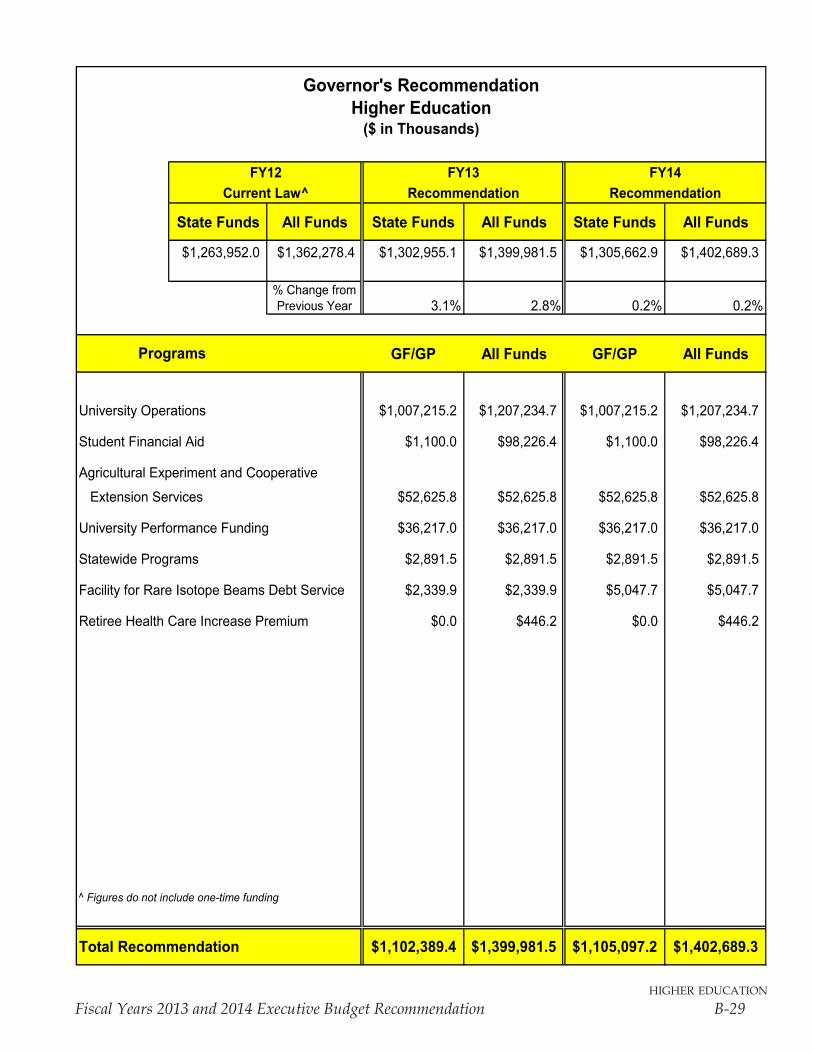
higher education
Fiscal Years 2013 and 2014 Executive Budget Recommendation B-29
FY12 FY13 FY14Current Law^ Recommendation Recommendation
State Funds All Funds State Funds All Funds State Funds All Funds
$1,263,952.0 $1,362,278.4 $1,302,955.1 $1,399,981.5 $1,305,662.9 $1,402,689.3
% Change from Previous Year 3.1% 2.8% 0.2% 0.2%
GF/GP All Funds GF/GP All Funds
University Operations $1,007,215.2 $1,207,234.7 $1,007,215.2 $1,207,234.7
Student Financial Aid $1,100.0 $98,226.4 $1,100.0 $98,226.4
Agricultural Experiment and Cooperative
Extension Services $52,625.8 $52,625.8 $52,625.8 $52,625.8
University Performance Funding $36,217.0 $36,217.0 $36,217.0 $36,217.0
Statewide Programs $2,891.5 $2,891.5 $2,891.5 $2,891.5
Facility for Rare Isotope Beams Debt Service $2,339.9 $2,339.9 $5,047.7 $5,047.7
Retiree Health Care Increase Premium $0.0 $446.2 $0.0 $446.2
^ Figures do not include one-time funding
Total Recommendation $1,102,389.4 $1,399,981.5 $1,105,097.2 $1,402,689.3
Governor's RecommendationHigher Education
($ in Thousands)
Programs
higher education
B-30 Reinventing Michigan ― Investing in our Future
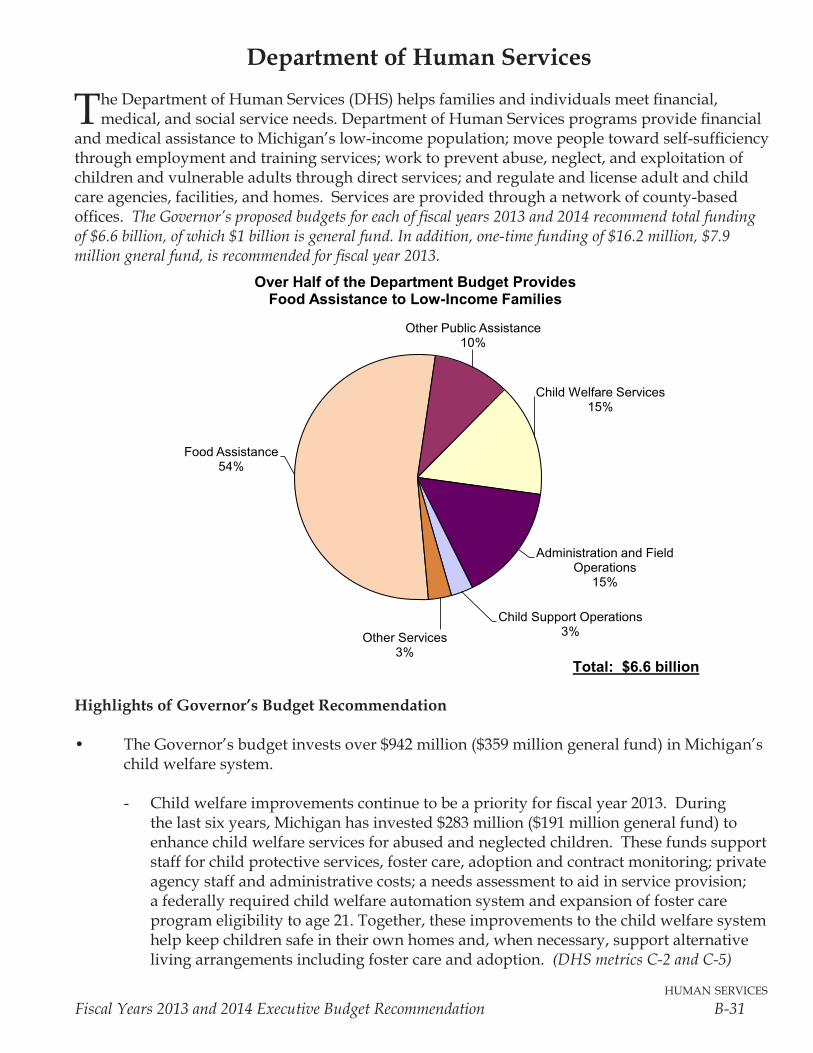
human services
Fiscal Years 2013 and 2014 Executive Budget Recommendation B-31
Department of Human Services
The Department of Human Services (DHS) helps families and individuals meet financial, medical, and social service needs. Department of Human Services programs provide financial
and medical assistance to Michigan’s low-income population; move people toward self-sufficiency through employment and training services; work to prevent abuse, neglect, and exploitation of children and vulnerable adults through direct services; and regulate and license adult and child care agencies, facilities, and homes. Services are provided through a network of county-based offices. The Governor’s proposed budgets for each of fiscal years 2013 and 2014 recommend total funding of $6.6 billion, of which $1 billion is general fund. In addition, one-time funding of $16.2 million, $7.9 million gneral fund, is recommended for fiscal year 2013.
Highlights of Governor’s Budget Recommendation
• The Governor’s budget invests over $942 million ($359 million general fund) in Michigan’s child welfare system.
- Child welfare improvements continue to be a priority for fiscal year 2013. During the last six years, Michigan has invested $283 million ($191 million general fund) to enhance child welfare services for abused and neglected children. These funds support staff for child protective services, foster care, adoption and contract monitoring; private agency staff and administrative costs; a needs assessment to aid in service provision; a federally required child welfare automation system and expansion of foster care program eligibility to age 21. Together, these improvements to the child welfare system help keep children safe in their own homes and, when necessary, support alternative living arrangements including foster care and adoption. (DHS metrics C-2 and C-5)
Food Assistance54%
Other Public Assistance10%
Child Welfare Services15%
Administration and Field Operations
15%
Child Support Operations3%Other Services
3%
Over Half of the Department Budget Provides Food Assistance to Low-Income Families
Total: $6.6 billion
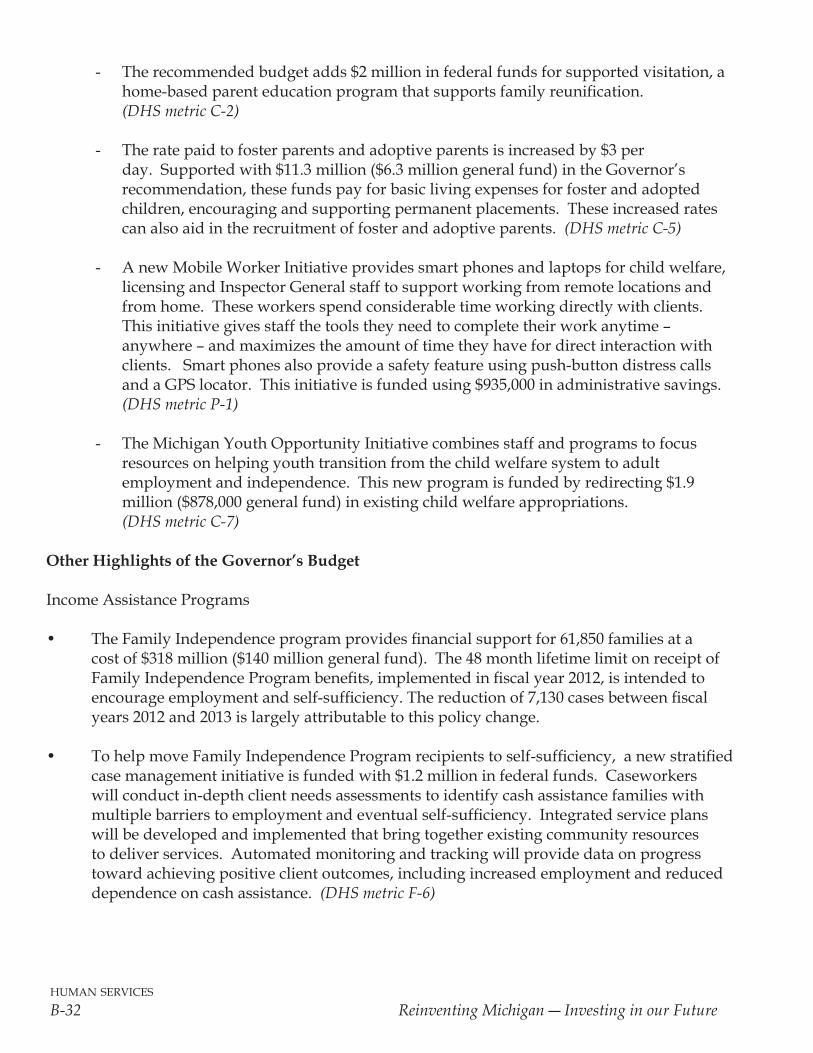
human services
B-32 Reinventing Michigan ― Investing in our Future
- The recommended budget adds $2 million in federal funds for supported visitation, a home-based parent education program that supports family reunification. (DHS metric C-2)
- The rate paid to foster parents and adoptive parents is increased by $3 per day. Supported with $11.3 million ($6.3 million general fund) in the Governor’s recommendation, these funds pay for basic living expenses for foster and adopted children, encouraging and supporting permanent placements. These increased rates can also aid in the recruitment of foster and adoptive parents. (DHS metric C-5)
- A new Mobile Worker Initiative provides smart phones and laptops for child welfare, licensing and Inspector General staff to support working from remote locations and from home. These workers spend considerable time working directly with clients. This initiative gives staff the tools they need to complete their work anytime – anywhere – and maximizes the amount of time they have for direct interaction with clients. Smart phones also provide a safety feature using push-button distress calls and a GPS locator. This initiative is funded using $935,000 in administrative savings. (DHS metric P-1)
- The Michigan Youth Opportunity Initiative combines staff and programs to focus resources on helping youth transition from the child welfare system to adult employment and independence. This new program is funded by redirecting $1.9 million ($878,000 general fund) in existing child welfare appropriations. (DHS metric C-7)
Other Highlights of the Governor’s Budget
Income Assistance Programs
• The Family Independence program provides financial support for 61,850 families at a cost of $318 million ($140 million general fund). The 48 month lifetime limit on receipt of Family Independence Program benefits, implemented in fiscal year 2012, is intended to encourage employment and self-sufficiency. The reduction of 7,130 cases between fiscal years 2012 and 2013 is largely attributable to this policy change.
• To help move Family Independence Program recipients to self-sufficiency, a new stratified case management initiative is funded with $1.2 million in federal funds. Caseworkers will conduct in-depth client needs assessments to identify cash assistance families with multiple barriers to employment and eventual self-sufficiency. Integrated service plans will be developed and implemented that bring together existing community resources to deliver services. Automated monitoring and tracking will provide data on progress toward achieving positive client outcomes, including increased employment and reduced dependence on cash assistance. (DHS metric F-6)
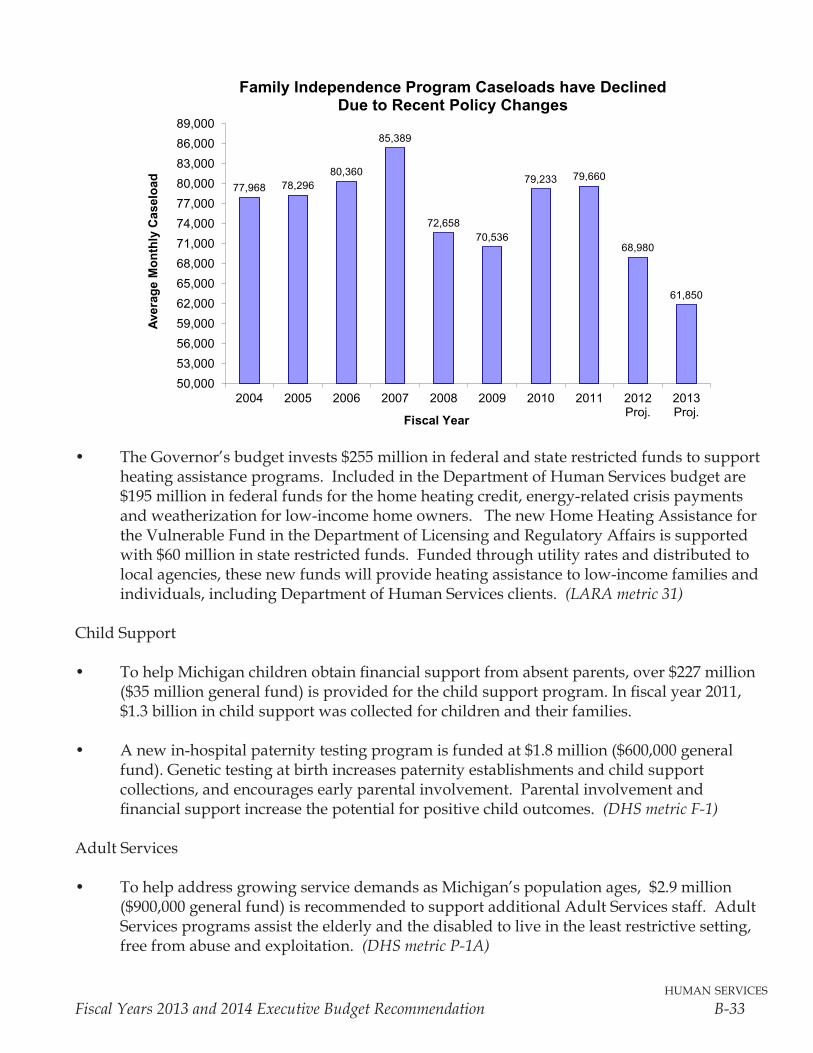
human services
Fiscal Years 2013 and 2014 Executive Budget Recommendation B-33
• The Governor’s budget invests $255 million in federal and state restricted funds to support heating assistance programs. Included in the Department of Human Services budget are $195 million in federal funds for the home heating credit, energy-related crisis payments and weatherization for low-income home owners. The new Home Heating Assistance for the Vulnerable Fund in the Department of Licensing and Regulatory Affairs is supported with $60 million in state restricted funds. Funded through utility rates and distributed to local agencies, these new funds will provide heating assistance to low-income families and individuals, including Department of Human Services clients. (LARA metric 31)
Child Support
• To help Michigan children obtain financial support from absent parents, over $227 million ($35 million general fund) is provided for the child support program. In fiscal year 2011, $1.3 billion in child support was collected for children and their families.
• A new in-hospital paternity testing program is funded at $1.8 million ($600,000 general fund). Genetic testing at birth increases paternity establishments and child support collections, and encourages early parental involvement. Parental involvement and financial support increase the potential for positive child outcomes. (DHS metric F-1)
Adult Services
• To help address growing service demands as Michigan’s population ages, $2.9 million ($900,000 general fund) is recommended to support additional Adult Services staff. Adult Services programs assist the elderly and the disabled to live in the least restrictive setting, free from abuse and exploitation. (DHS metric P-1A)
77,968 78,29680,360
85,389
72,65870,536
79,233 79,660
68,980
61,850
50,000
53,000
56,000
59,000
62,000
65,000
68,000
71,000
74,000
77,000
80,000
83,000
86,000
89,000
2004 2005 2006 2007 2008 2009 2010 2011 2012Proj.
2013Proj.
Ave
rag
e M
on
thly
Cas
elo
ad
Family Independence Program Caseloads have Declined Due to Recent Policy Changes
Fiscal Year
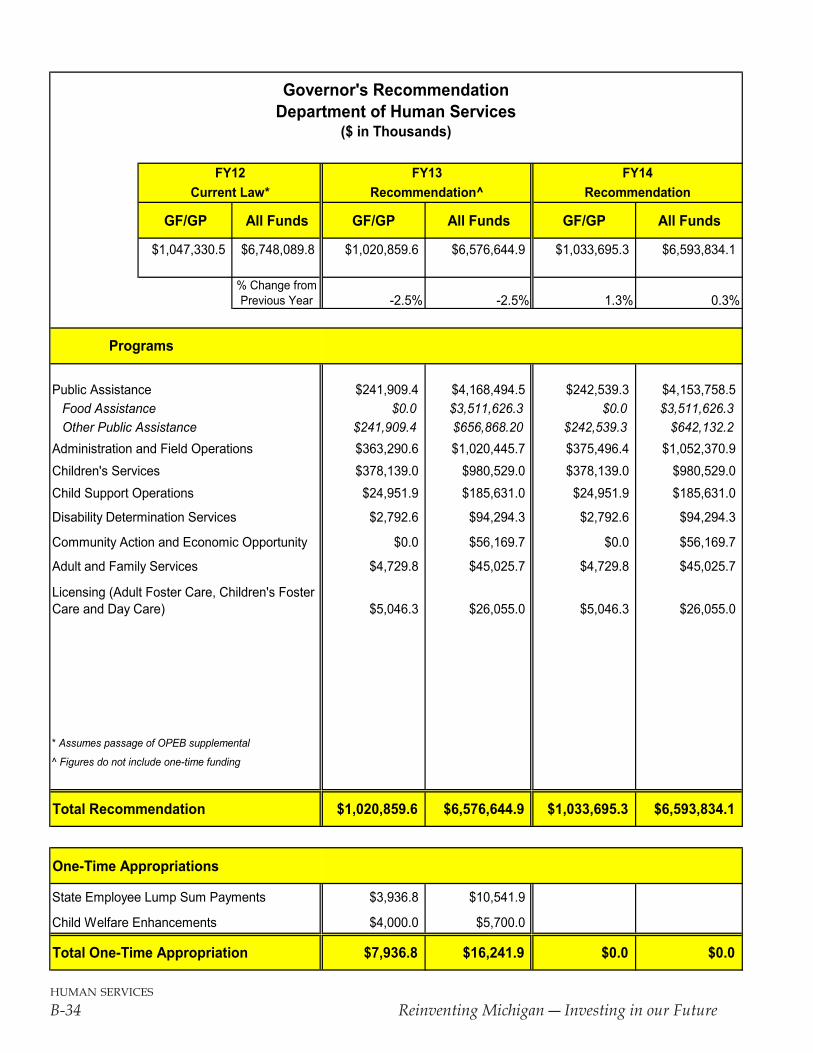
human services
B-34 Reinventing Michigan ― Investing in our Future
GF/GP All Funds GF/GP All Funds GF/GP All Funds
$1,047,330.5 $6,748,089.8 $1,020,859.6 $6,576,644.9 $1,033,695.3 $6,593,834.1
% Change from Previous Year -2.5% -2.5% 1.3% 0.3%
Public Assistance $241,909.4 $4,168,494.5 $242,539.3 $4,153,758.5Food Assistance $0.0 $3,511,626.3 $0.0 $3,511,626.3Other Public Assistance $241,909.4 $656,868.20 $242,539.3 $642,132.2
Administration and Field Operations $363,290.6 $1,020,445.7 $375,496.4 $1,052,370.9Children's Services $378,139.0 $980,529.0 $378,139.0 $980,529.0Child Support Operations $24,951.9 $185,631.0 $24,951.9 $185,631.0
Disability Determination Services $2,792.6 $94,294.3 $2,792.6 $94,294.3
Community Action and Economic Opportunity $0.0 $56,169.7 $0.0 $56,169.7
Adult and Family Services $4,729.8 $45,025.7 $4,729.8 $45,025.7
$5,046.3 $26,055.0 $5,046.3 $26,055.0
* Assumes passage of OPEB supplemental
^ Figures do not include one-time funding
Total Recommendation $1,020,859.6 $6,576,644.9 $1,033,695.3 $6,593,834.1
One-Time Appropriations
State Employee Lump Sum Payments $3,936.8 $10,541.9
Child Welfare Enhancements $4,000.0 $5,700.0
Total One-Time Appropriation $7,936.8 $16,241.9 $0.0 $0.0
Programs
Licensing (Adult Foster Care, Children's Foster Care and Day Care)
Governor's RecommendationDepartment of Human Services
($ in Thousands)
FY12 FY13 FY14Current Law* Recommendation^ Recommendation
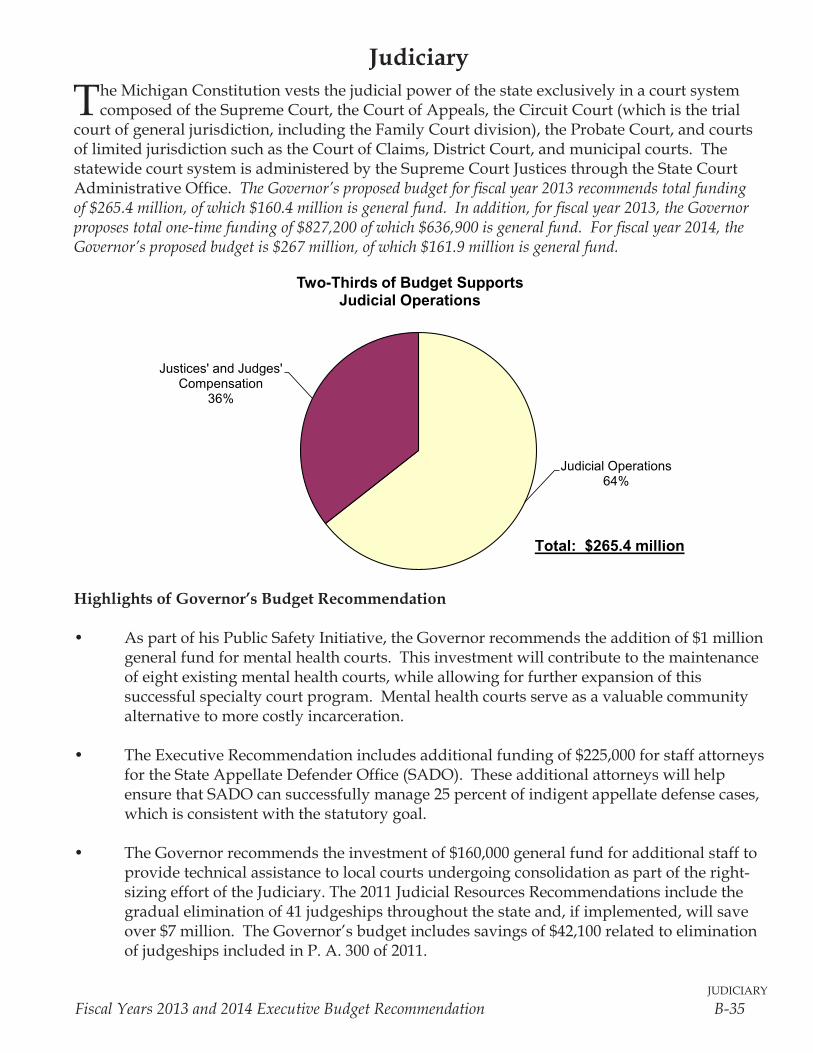
judiciary
Fiscal Years 2013 and 2014 Executive Budget Recommendation B-35
Judiciary
The Michigan Constitution vests the judicial power of the state exclusively in a court system composed of the Supreme Court, the Court of Appeals, the Circuit Court (which is the trial
court of general jurisdiction, including the Family Court division), the Probate Court, and courts of limited jurisdiction such as the Court of Claims, District Court, and municipal courts. The statewide court system is administered by the Supreme Court Justices through the State Court Administrative Office. The Governor’s proposed budget for fiscal year 2013 recommends total funding of $265.4 million, of which $160.4 million is general fund. In addition, for fiscal year 2013, the Governor proposes total one-time funding of $827,200 of which $636,900 is general fund. For fiscal year 2014, the Governor’s proposed budget is $267 million, of which $161.9 million is general fund.
Highlights of Governor’s Budget Recommendation
• As part of his Public Safety Initiative, the Governor recommends the addition of $1 million general fund for mental health courts. This investment will contribute to the maintenance of eight existing mental health courts, while allowing for further expansion of this successful specialty court program. Mental health courts serve as a valuable community alternative to more costly incarceration.
• The Executive Recommendation includes additional funding of $225,000 for staff attorneys for the State Appellate Defender Office (SADO). These additional attorneys will help ensure that SADO can successfully manage 25 percent of indigent appellate defense cases, which is consistent with the statutory goal.
• The Governor recommends the investment of $160,000 general fund for additional staff to provide technical assistance to local courts undergoing consolidation as part of the right-sizing effort of the Judiciary. The 2011 Judicial Resources Recommendations include the gradual elimination of 41 judgeships throughout the state and, if implemented, will save over $7 million. The Governor’s budget includes savings of $42,100 related to elimination of judgeships included in P. A. 300 of 2011.
Judicial Operations64%
Justices' and Judges' Compensation
36%
Two-Thirds of Budget Supports Judicial Operations
Total: $265.4 million
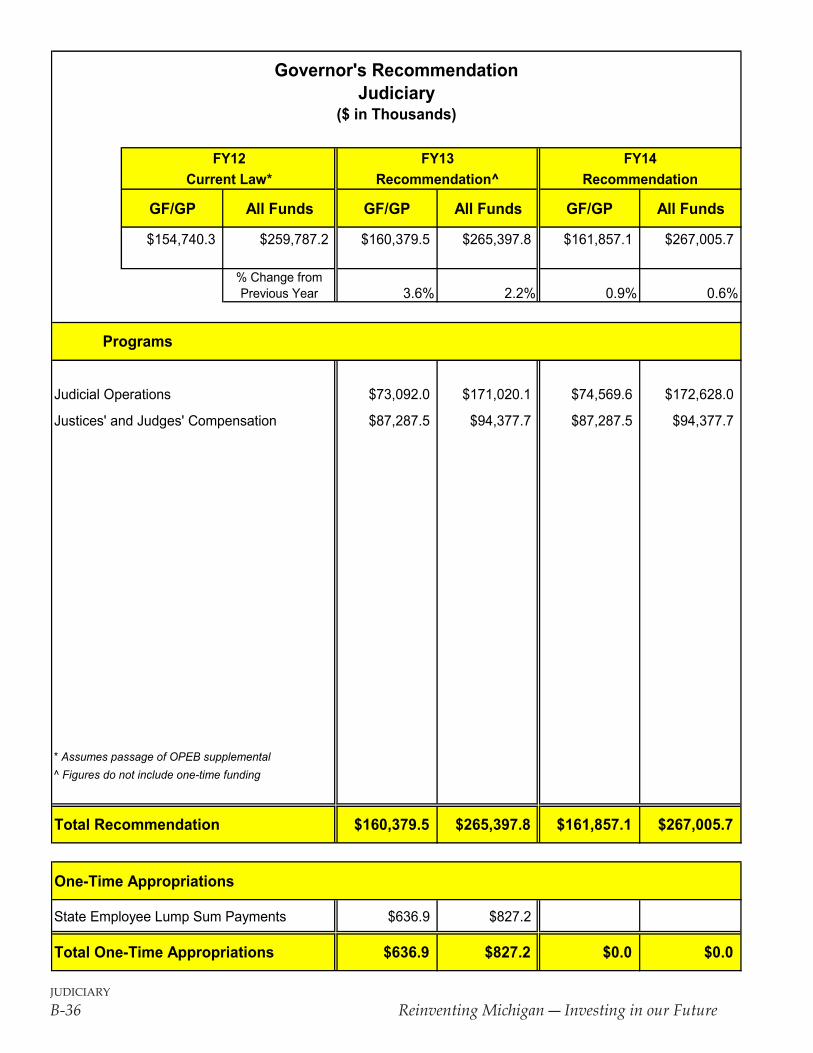
judiciary
B-36 Reinventing Michigan ― Investing in our Future
FY12 FY13 FY14Current Law* Recommendation^ Recommendation
GF/GP All Funds GF/GP All Funds GF/GP All Funds
$154,740.3 $259,787.2 $160,379.5 $265,397.8 $161,857.1 $267,005.7
% Change from Previous Year 3.6% 2.2% 0.9% 0.6%
Judicial Operations $73,092.0 $171,020.1 $74,569.6 $172,628.0
Justices' and Judges' Compensation $87,287.5 $94,377.7 $87,287.5 $94,377.7
* Assumes passage of OPEB supplemental^ Figures do not include one-time funding
Total Recommendation $160,379.5 $265,397.8 $161,857.1 $267,005.7
One-Time Appropriations
State Employee Lump Sum Payments $636.9 $827.2
Total One-Time Appropriations $636.9 $827.2 $0.0 $0.0
Governor's RecommendationJudiciary
($ in Thousands)
Programs
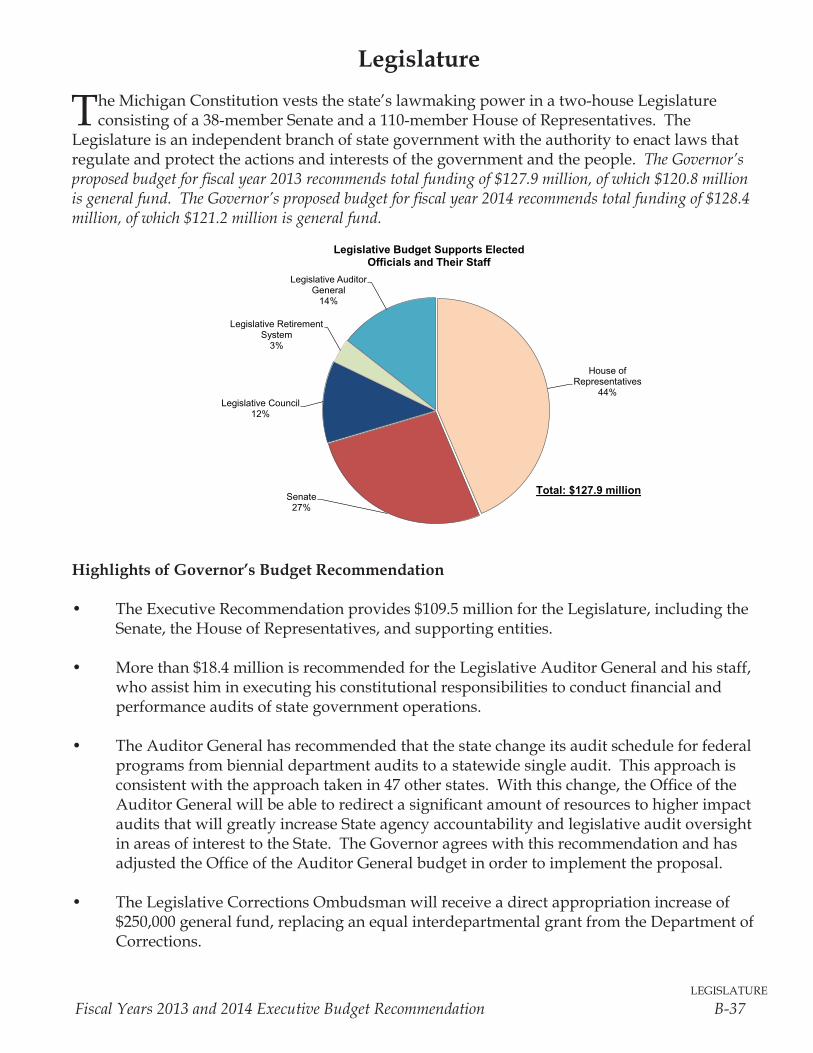
legislature
Fiscal Years 2013 and 2014 Executive Budget Recommendation B-37
Legislature
The Michigan Constitution vests the state’s lawmaking power in a two-house Legislature consisting of a 38-member Senate and a 110-member House of Representatives. The
Legislature is an independent branch of state government with the authority to enact laws that regulate and protect the actions and interests of the government and the people. The Governor’s proposed budget for fiscal year 2013 recommends total funding of $127.9 million, of which $120.8 million is general fund. The Governor’s proposed budget for fiscal year 2014 recommends total funding of $128.4 million, of which $121.2 million is general fund.
Highlights of Governor’s Budget Recommendation
• TheExecutiveRecommendationprovides$109.5millionfortheLegislature,includingtheSenate,theHouseofRepresentatives,andsupportingentities.
• Morethan$18.4millionisrecommendedfortheLegislativeAuditorGeneralandhisstaff,whoassisthiminexecutinghisconstitutionalresponsibilitiestoconductfinancialandperformance audits of state government operations.
• TheAuditorGeneralhasrecommendedthatthestatechangeitsauditscheduleforfederalprograms from biennial department audits to a statewide single audit. This approach is consistentwiththeapproachtakenin47otherstates.Withthischange,theOfficeoftheAuditorGeneralwillbeabletoredirectasignificantamountofresourcestohigherimpactaudits that will greatly increase State agency accountability and legislative audit oversight inareasofinteresttotheState.TheGovernoragreeswiththisrecommendationandhasadjustedtheOfficeoftheAuditorGeneralbudgetinordertoimplementtheproposal.
• TheLegislativeCorrectionsOmbudsmanwillreceiveadirectappropriationincreaseof$250,000generalfund,replacinganequalinterdepartmentalgrantfromtheDepartmentofCorrections.
House of Representatives
44%
Senate27%
Legislative Council12%
Legislative Retirement System
3%
Legislative Auditor General
14%
Legislative Budget Supports ElectedOfficials and Their Staff
Total: $127.9 million
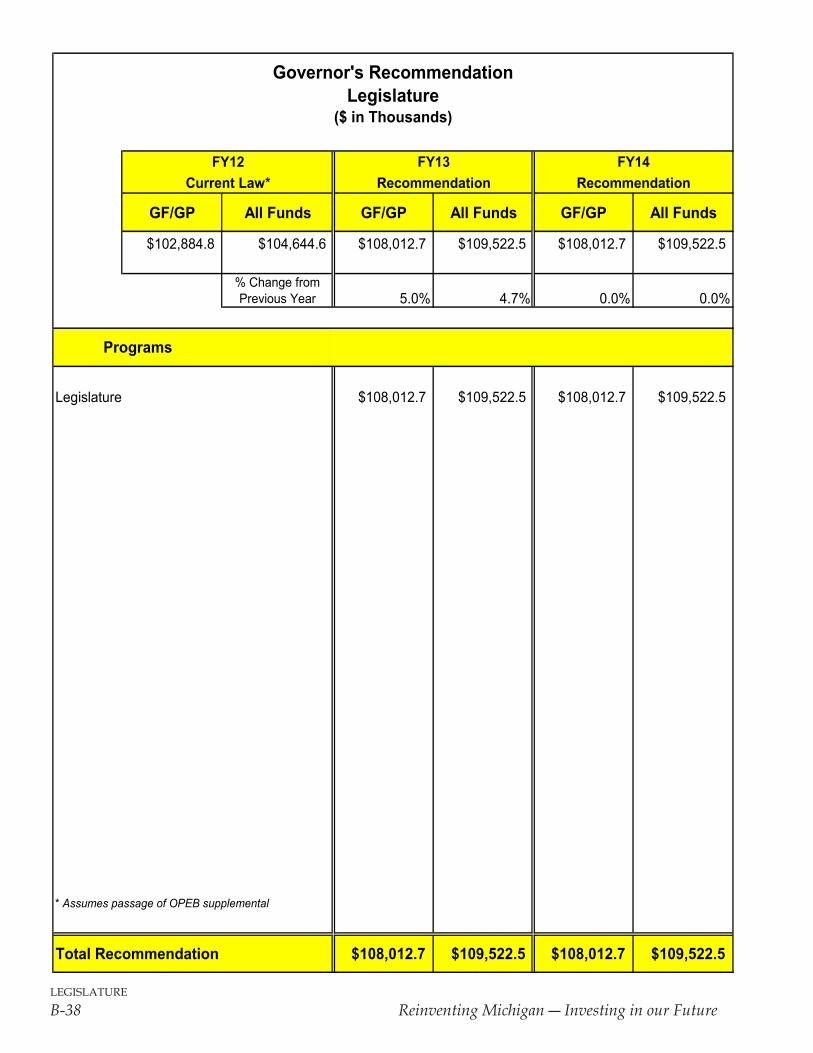
legislature
B-38 Reinventing Michigan ― Investing in our Future
FY12 FY13 FY14Current Law* Recommendation Recommendation
GF/GP All Funds GF/GP All Funds GF/GP All Funds
$102,884.8 $104,644.6 $108,012.7 $109,522.5 $108,012.7 $109,522.5
% Change from Previous Year 5.0% 4.7% 0.0% 0.0%
Legislature $108,012.7 $109,522.5 $108,012.7 $109,522.5
* Assumes passage of OPEB supplemental
Total Recommendation $108,012.7 $109,522.5 $108,012.7 $109,522.5
Governor's RecommendationLegislature
($ in Thousands)
Programs
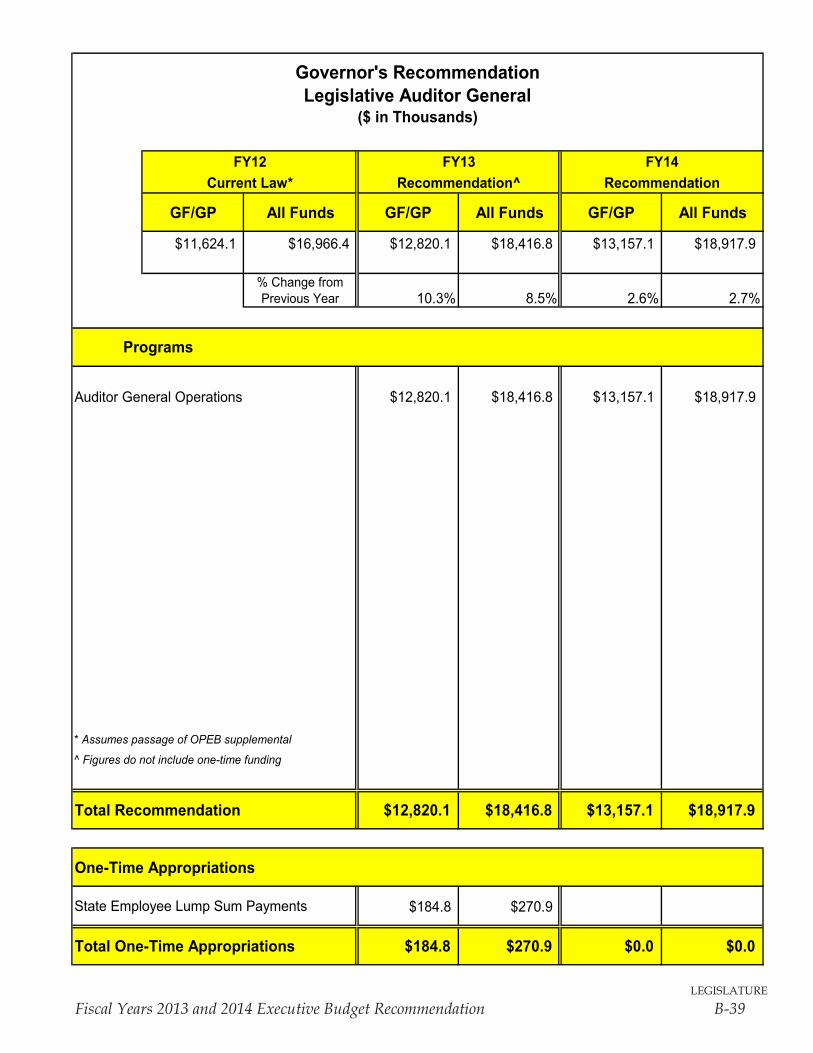
legislature
Fiscal Years 2013 and 2014 Executive Budget Recommendation B-39
FY12 FY13 FY14Current Law* Recommendation^ Recommendation
GF/GP All Funds GF/GP All Funds GF/GP All Funds
$11,624.1 $16,966.4 $12,820.1 $18,416.8 $13,157.1 $18,917.9
% Change from Previous Year 10.3% 8.5% 2.6% 2.7%
Auditor General Operations $12,820.1 $18,416.8 $13,157.1 $18,917.9
* Assumes passage of OPEB supplemental
^ Figures do not include one-time funding
Total Recommendation $12,820.1 $18,416.8 $13,157.1 $18,917.9
One-Time Appropriations
$184.8 $270.9
Total One-Time Appropriations $184.8 $270.9 $0.0 $0.0
Governor's RecommendationLegislative Auditor General
($ in Thousands)
Programs
State Employee Lump Sum Payments

legislature
B-40 Reinventing Michigan ― Investing in our Future
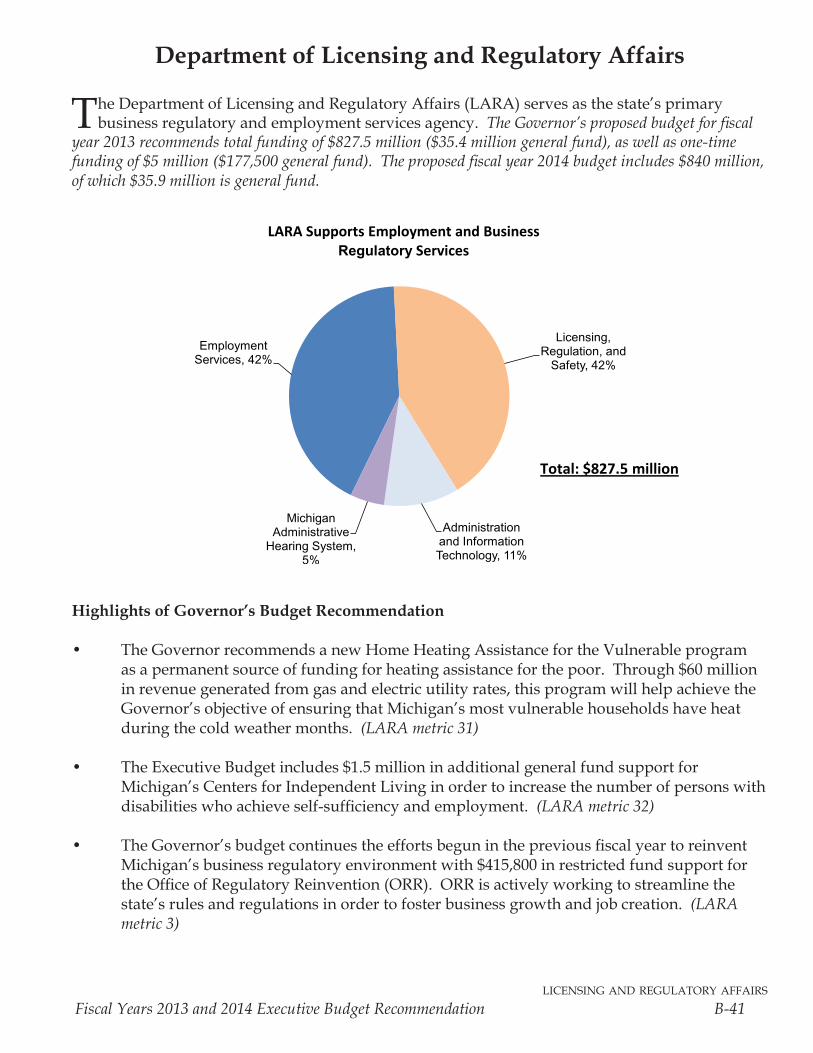
licensing and regulatory affairs
Fiscal Years 2013 and 2014 Executive Budget Recommendation B-41
Department of Licensing and Regulatory Affairs
T he Department of Licensing and Regulatory Affairs (LARA) serves as the state’s primary business regulatory and employment services agency. The Governor’s proposed budget for fiscal
year 2013 recommends total funding of $827.5 million ($35.4 million general fund), as well as one-time funding of $5 million ($177,500 general fund). The proposed fiscal year 2014 budget includes $840 million, of which $35.9 million is general fund.
Highlights of Governor’s Budget Recommendation
• TheGovernorrecommendsanewHomeHeatingAssistancefortheVulnerableprogramas a permanent source of funding for heating assistance for the poor. Through $60 million inrevenuegeneratedfromgasandelectricutilityrates,thisprogramwillhelpachievetheGovernor’sobjectiveofensuringthatMichigan’smostvulnerablehouseholdshaveheatduringthecoldweathermonths. (LARA metric 31)
• TheExecutiveBudgetincludes$1.5millioninadditionalgeneralfundsupportfor
Michigan’sCentersforIndependentLivinginordertoincreasethenumberofpersonswithdisabilitieswhoachieveself-sufficiencyandemployment.(LARA metric 32)
• TheGovernor’sbudgetcontinuestheeffortsbeguninthepreviousfiscalyeartoreinventMichigan’sbusinessregulatoryenvironmentwith$415,800inrestrictedfundsupportfortheOfficeofRegulatoryReinvention(ORR).ORRisactivelyworkingtostreamlinethestate’srulesandregulationsinordertofosterbusinessgrowthandjobcreation.(LARA metric 3)
Employment Services, 42%
Licensing, Regulation, and
Safety, 42%
Administration and Information Technology, 11%
Michigan Administrative
Hearing System, 5%
LARA Supports Employment and Business Regulatory Services
Total: $827.5 million
licensing and regulatory affairs
B-42 Reinventing Michigan ― Investing in our Future
Unemployment Insurance System
• InDecember2011,theMichiganFinanceAuthorityissued$3.3billioninbondsto stabilize the state’s unemployment insurance program and repay federal loans borrowedtosatisfyunemploymentinsurancebenefitsduringtheeconomicdownturn.Thisactionrestoreslong-termsolvencytothestate’sunemploymentinsurancesystemandsavesemployersanestimated$264millionbyavoidingincreasedfederalunemploymentinsurancetaxobligations.
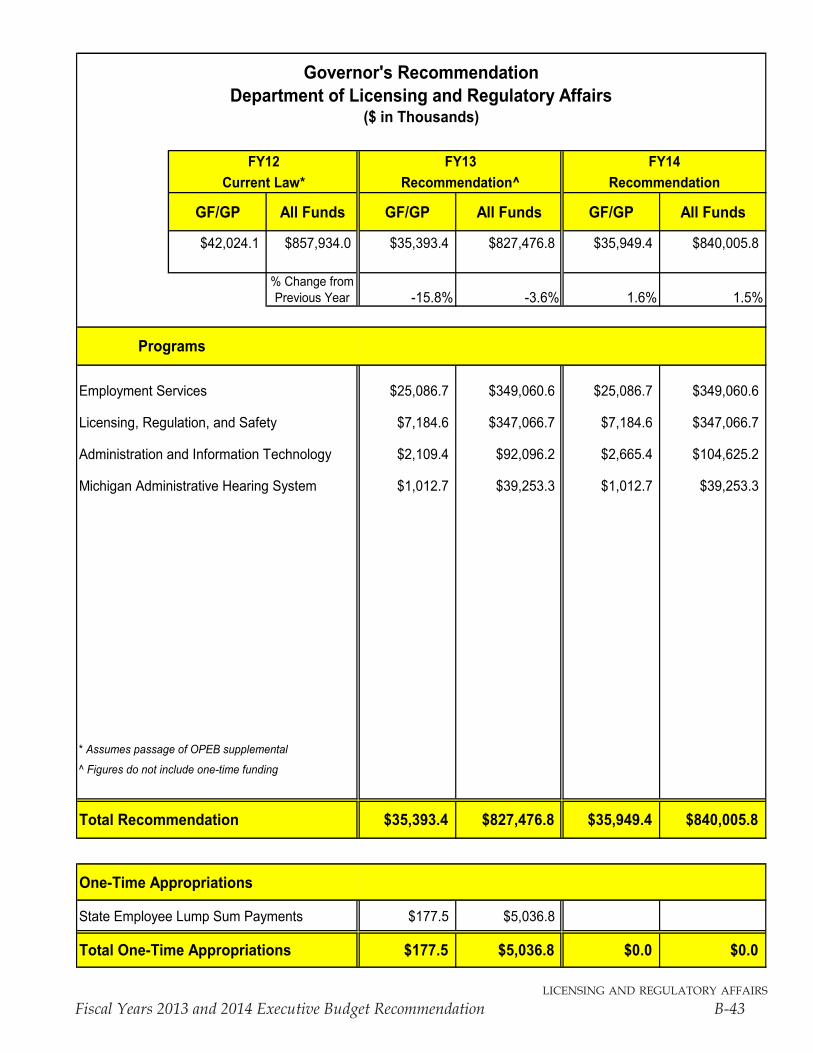
licensing and regulatory affairs
Fiscal Years 2013 and 2014 Executive Budget Recommendation B-43
FY12 FY13 FY14Current Law* Recommendation^ Recommendation
GF/GP All Funds GF/GP All Funds GF/GP All Funds
$42,024.1 $857,934.0 $35,393.4 $827,476.8 $35,949.4 $840,005.8
% Change from Previous Year -15.8% -3.6% 1.6% 1.5%
Employment Services $25,086.7 $349,060.6 $25,086.7 $349,060.6
Licensing, Regulation, and Safety $7,184.6 $347,066.7 $7,184.6 $347,066.7
$2,109.4 $92,096.2 $2,665.4 $104,625.2
Michigan Administrative Hearing System $1,012.7 $39,253.3 $1,012.7 $39,253.3
* Assumes passage of OPEB supplemental
^ Figures do not include one-time funding
Total Recommendation $35,393.4 $827,476.8 $35,949.4 $840,005.8
One-Time Appropriations
State Employee Lump Sum Payments $177.5 $5,036.8
Total One-Time Appropriations $177.5 $5,036.8 $0.0 $0.0
Governor's RecommendationDepartment of Licensing and Regulatory Affairs
($ in Thousands)
Programs
Administration and Information Technology

licensing and regulatory affairs
B-44 Reinventing Michigan ― Investing in our Future
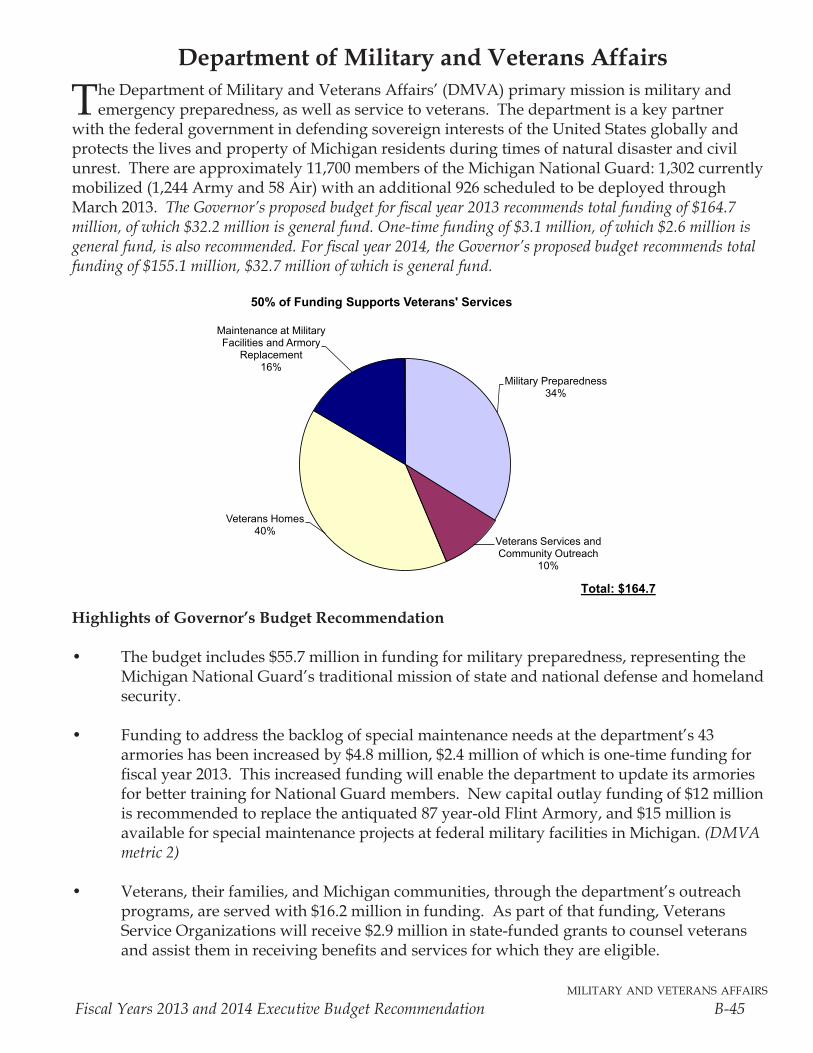
military and veterans affairs
Fiscal Years 2013 and 2014 Executive Budget Recommendation B-45
Department of Military and Veterans Affairs
The Department of Military and Veterans Affairs’ (DMVA) primary mission is military and emergency preparedness, as well as service to veterans. The department is a key partner
with the federal government in defending sovereign interests of the United States globally and protects the lives and property of Michigan residents during times of natural disaster and civil unrest. There are approximately 11,700 members of the Michigan National Guard: 1,302 currently mobilized (1,244 Army and 58 Air) with an additional 926 scheduled to be deployed through March 2013. The Governor’s proposed budget for fiscal year 2013 recommends total funding of $164.7 million, of which $32.2 million is general fund. One-time funding of $3.1 million, of which $2.6 million is general fund, is also recommended. For fiscal year 2014, the Governor’s proposed budget recommends total funding of $155.1 million, $32.7 million of which is general fund.
Highlights of Governor’s Budget Recommendation
• Thebudgetincludes$55.7millioninfundingformilitarypreparedness,representingtheMichigan National Guard’s traditional mission of state and national defense and homeland security.
• Fundingtoaddressthebacklogofspecialmaintenanceneedsatthedepartment’s43armorieshasbeenincreasedby$4.8million,$2.4millionofwhichisone-timefundingforfiscalyear2013.ThisincreasedfundingwillenablethedepartmenttoupdateitsarmoriesforbettertrainingforNationalGuardmembers.Newcapitaloutlayfundingof$12millionisrecommendedtoreplacetheantiquated87year-oldFlintArmory,and$15millionisavailable for special maintenance projects at federal military facilities in Michigan. (DMVA metric 2)
• Veterans,theirfamilies,andMichigancommunities,throughthedepartment’soutreachprograms,areservedwith$16.2millioninfunding.Aspartofthatfunding,VeteransServiceOrganizationswillreceive$2.9millioninstate-fundedgrantstocounselveteransandassisttheminreceivingbenefitsandservicesforwhichtheyareeligible.
Military Preparedness34%
Veterans Services and Community Outreach
10%
Veterans Homes40%
Maintenance at Military Facilities and Armory
Replacement16%
50% of Funding Supports Veterans' Services
Total: $164.7
military and veterans affairs
B-46 Reinventing Michigan ― Investing in our Future
• Thefiscalyear2013ExecutiveRecommendationprovides$65.6millioninfundingsupportfortheGrandRapidsandD.J.JacobettiVeterans’Homes,whichprovidedirectnursing care for 731 resident veterans.
• TheGovernorrecommendsthattheMilitaryRetirementprogram($3.9million)betransferred to the Department of Technology, Management and Budget (DTMB). The OfficeofRetirementServiceswithinDTMBhastheexpertisetoefficientlyoperatethisretirement program.
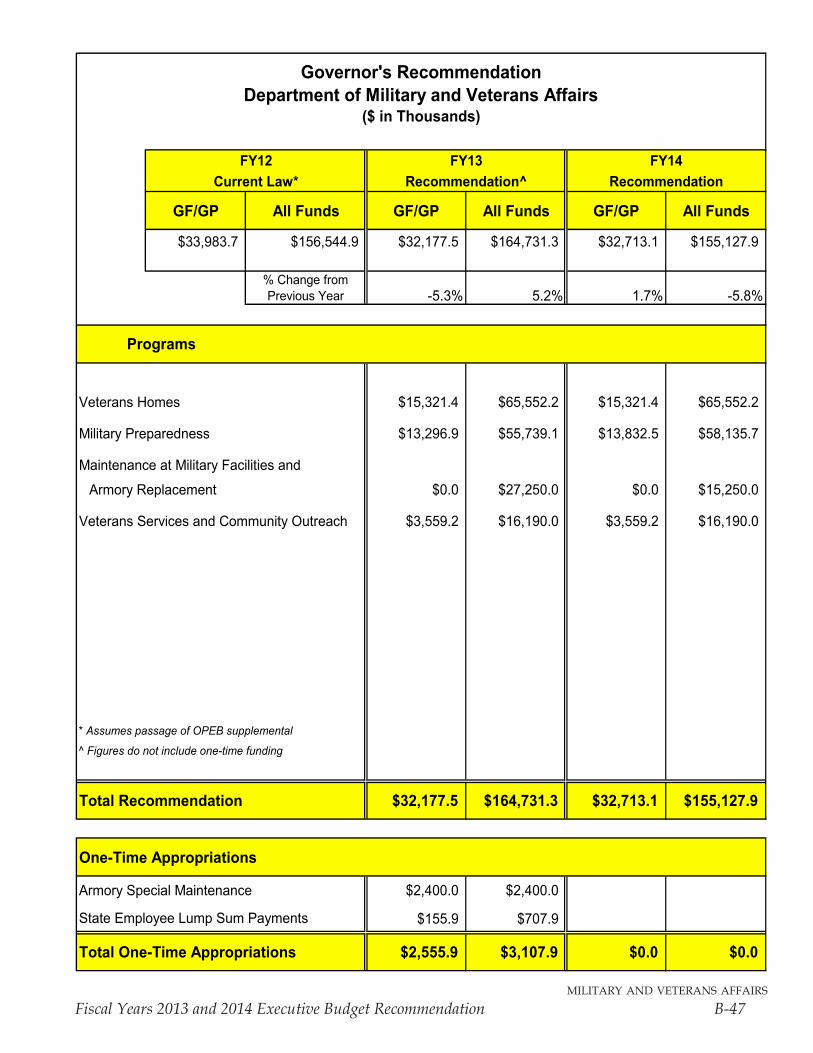
military and veterans affairs
Fiscal Years 2013 and 2014 Executive Budget Recommendation B-47
FY12 FY13 FY14Current Law* Recommendation^ Recommendation
GF/GP All Funds GF/GP All Funds GF/GP All Funds
$33,983.7 $156,544.9 $32,177.5 $164,731.3 $32,713.1 $155,127.9
% Change from Previous Year -5.3% 5.2% 1.7% -5.8%
Veterans Homes $15,321.4 $65,552.2 $15,321.4 $65,552.2
Military Preparedness $13,296.9 $55,739.1 $13,832.5 $58,135.7
Maintenance at Military Facilities and
Armory Replacement $0.0 $27,250.0 $0.0 $15,250.0
Veterans Services and Community Outreach $3,559.2 $16,190.0 $3,559.2 $16,190.0
* Assumes passage of OPEB supplemental
^ Figures do not include one-time funding
Total Recommendation $32,177.5 $164,731.3 $32,713.1 $155,127.9
One-Time Appropriations
Armory Special Maintenance $2,400.0 $2,400.0
$155.9 $707.9
Total One-Time Appropriations $2,555.9 $3,107.9 $0.0 $0.0
Governor's RecommendationDepartment of Military and Veterans Affairs
($ in Thousands)
Programs
State Employee Lump Sum Payments

military and veterans affairs
B-48 Reinventing Michigan ― Investing in our Future
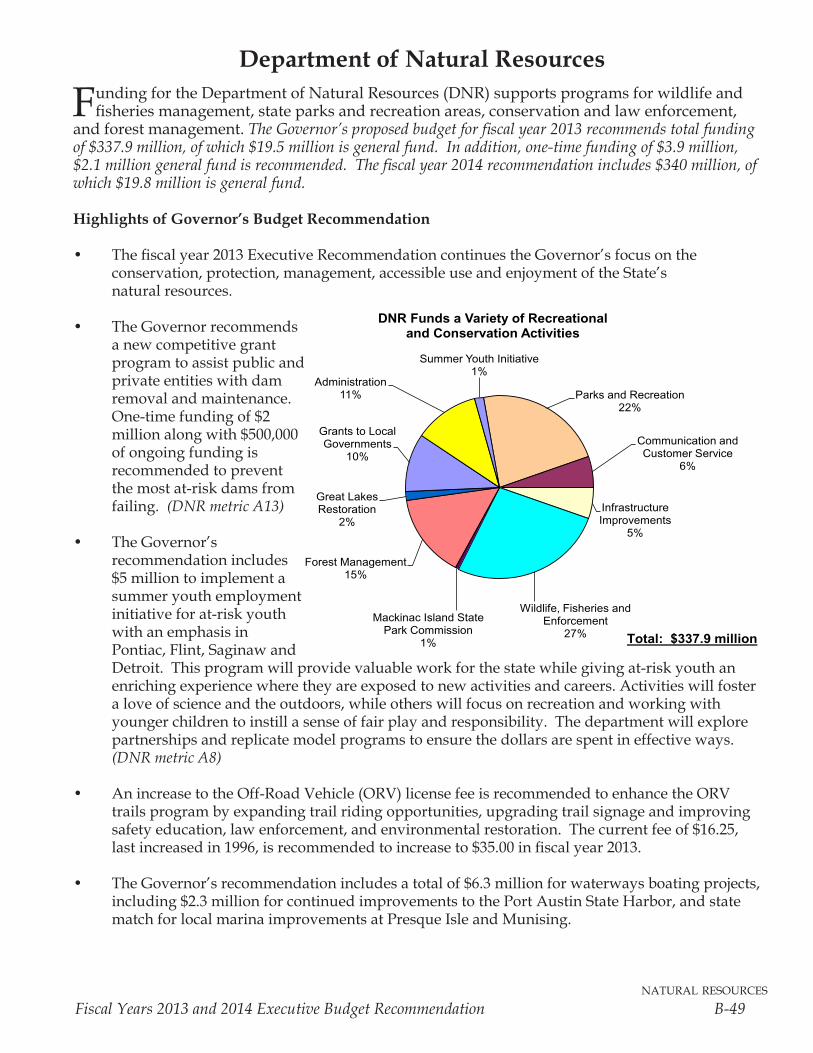
natural resources
Fiscal Years 2013 and 2014 Executive Budget Recommendation B-49
Department of Natural Resources
Funding for the Department of Natural Resources (DNR) supports programs for wildlife and fisheries management, state parks and recreation areas, conservation and law enforcement,
and forest management. The Governor’s proposed budget for fiscal year 2013 recommends total funding of $337.9 million, of which $19.5 million is general fund. In addition, one-time funding of $3.9 million, $2.1 million general fund is recommended. The fiscal year 2014 recommendation includes $340 million, of which $19.8 million is general fund.
Highlights of Governor’s Budget Recommendation
• The fiscal year 2013 Executive Recommendation continues the Governor’s focus on the conservation, protection, management, accessible use and enjoyment of the State’s natural resources.
• The Governor recommends a new competitive grant program to assist public and private entities with dam removal and maintenance. One-time funding of $2 million along with $500,000 of ongoing funding is recommended to prevent the most at-risk dams from failing. (DNR metric A13)
• The Governor’s recommendation includes $5 million to implement a summer youth employment initiative for at-risk youth with an emphasis in Pontiac, Flint, Saginaw and Detroit. This program will provide valuable work for the state while giving at-risk youth an enriching experience where they are exposed to new activities and careers. Activities will foster a love of science and the outdoors, while others will focus on recreation and working with younger children to instill a sense of fair play and responsibility. The department will explore partnerships and replicate model programs to ensure the dollars are spent in effective ways. (DNR metric A8)
• An increase to the Off-Road Vehicle (ORV) license fee is recommended to enhance the ORV trails program by expanding trail riding opportunities, upgrading trail signage and improving safety education, law enforcement, and environmental restoration. The current fee of $16.25, last increased in 1996, is recommended to increase to $35.00 in fiscal year 2013.
• The Governor’s recommendation includes a total of $6.3 million for waterways boating projects, including $2.3 million for continued improvements to the Port Austin State Harbor, and state match for local marina improvements at Presque Isle and Munising.
Parks and Recreation22%
Communication and Customer Service
6%
Infrastructure Improvements
5%
Wildlife, Fisheries and Enforcement
27%Mackinac Island State
Park Commission1%
Forest Management15%
Great Lakes Restoration
2%
Grants to Local Governments
10%
Administration11%
Summer Youth Initiative1%
DNR Funds a Variety of Recreational and Conservation Activities
Total: $337.9 million
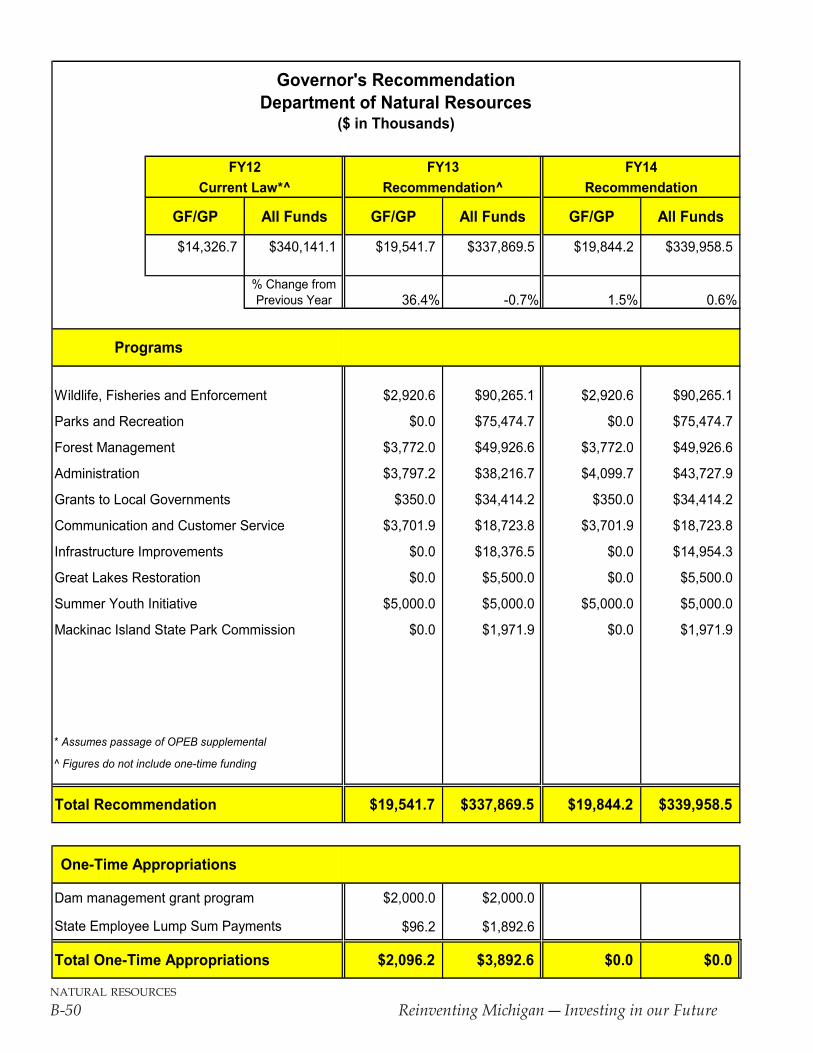
natural resources
B-50 Reinventing Michigan ― Investing in our Future
FY12 FY13 FY14Current Law*^ Recommendation^ Recommendation
GF/GP All Funds GF/GP All Funds GF/GP All Funds
$14,326.7 $340,141.1 $19,541.7 $337,869.5 $19,844.2 $339,958.5
% Change from Previous Year 36.4% -0.7% 1.5% 0.6%
Wildlife, Fisheries and Enforcement $2,920.6 $90,265.1 $2,920.6 $90,265.1
Parks and Recreation $0.0 $75,474.7 $0.0 $75,474.7
Forest Management $3,772.0 $49,926.6 $3,772.0 $49,926.6
Administration $3,797.2 $38,216.7 $4,099.7 $43,727.9
Grants to Local Governments $350.0 $34,414.2 $350.0 $34,414.2
Communication and Customer Service $3,701.9 $18,723.8 $3,701.9 $18,723.8
Infrastructure Improvements $0.0 $18,376.5 $0.0 $14,954.3
Great Lakes Restoration $0.0 $5,500.0 $0.0 $5,500.0
Summer Youth Initiative $5,000.0 $5,000.0 $5,000.0 $5,000.0
Mackinac Island State Park Commission $0.0 $1,971.9 $0.0 $1,971.9
* Assumes passage of OPEB supplemental
^ Figures do not include one-time funding
Total Recommendation $19,541.7 $337,869.5 $19,844.2 $339,958.5
Dam management grant program $2,000.0 $2,000.0
$96.2 $1,892.6
Total One-Time Appropriations $2,096.2 $3,892.6 $0.0 $0.0
Governor's RecommendationDepartment of Natural Resources
($ in Thousands)
Programs
State Employee Lump Sum Payments
One-Time Appropriations
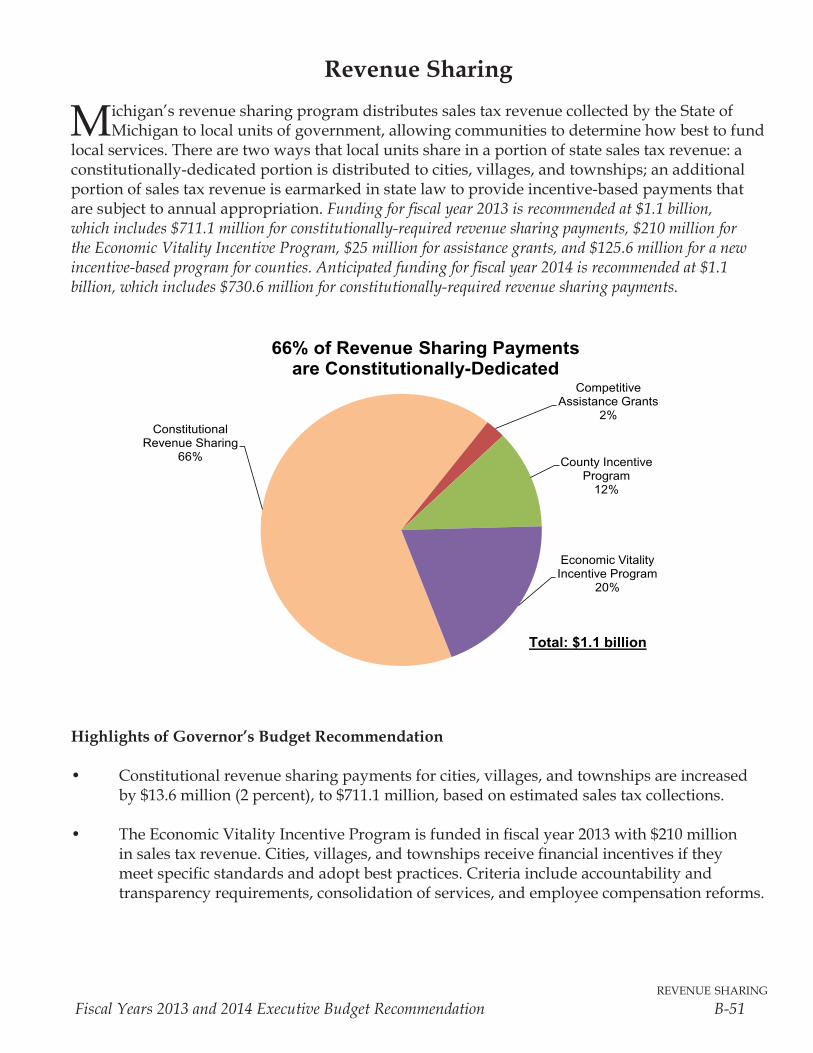
revenue sharing
Fiscal Years 2013 and 2014 Executive Budget Recommendation B-51
Revenue Sharing
Michigan’s revenue sharing program distributes sales tax revenue collected by the State of Michigan to local units of government, allowing communities to determine how best to fund
local services. There are two ways that local units share in a portion of state sales tax revenue: a constitutionally-dedicated portion is distributed to cities, villages, and townships; an additional portion of sales tax revenue is earmarked in state law to provide incentive-based payments that are subject to annual appropriation. Funding for fiscal year 2013 is recommended at $1.1 billion, which includes $711.1 million for constitutionally-required revenue sharing payments, $210 million for the Economic Vitality Incentive Program, $25 million for assistance grants, and $125.6 million for a new incentive-based program for counties. Anticipated funding for fiscal year 2014 is recommended at $1.1 billion, which includes $730.6 million for constitutionally-required revenue sharing payments.
Highlights of Governor’s Budget Recommendation
• Constitutionalrevenuesharingpaymentsforcities,villages,andtownshipsareincreasedby $13.6 million (2 percent), to $711.1 million, based on estimated sales tax collections.
• TheEconomicVitalityIncentiveProgramisfundedinfiscalyear2013with$210millioninsalestaxrevenue.Cities,villages,andtownshipsreceivefinancialincentivesiftheymeetspecificstandardsandadoptbestpractices.Criteriaincludeaccountabilityandtransparency requirements, consolidation of services, and employee compensation reforms.
Constitutional Revenue Sharing
66%
Competitive Assistance Grants
2%
County Incentive Program
12%
Economic Vitality Incentive Program
20%
66% of Revenue Sharing Paymentsare Constitutionally-Dedicated
Total: $1.1 billion
revenue sharing
B-52 Reinventing Michigan ― Investing in our Future
• Beginninginfiscalyear2013,anewincentive-basedprogramforcountiesisrecommendedto replace statutory revenue sharing, funded with $125.6 million in sales tax revenue. Sixty-one (61) counties are estimated to exhaust their revenue sharing reserve funds priorto,orduring,fiscalyear2013.Thesecountieswillqualifyforfinancialincentivepaymentsprovidedtheymeetspecificstandardsandadoptbestpractices,consistentwithrequirementsundertheEconomicVitalityIncentiveProgramforcities,villages,andtownships.
• Acompetitivegrantassistanceprogramisfundedinfiscalyear2013with$25millioninsales tax revenue, utilizing $5 million in ongoing funding plus a one-time augmentation of$20million.Cities,villages,townships,orcountiesthatelecttocombinegovernmentoperationsmayapplyforreimbursementofcostsforapprovedprojects.Fiscalyear2013fundingrepresentsafour-foldincreasefromfiscalyear2012fundingof$5million.Theproposedone-timeincreaseaddressessignificantinterestexpressedbylocalunitsseekinghelp with transition costs associated with mergers, inter-local agreements, and other cooperative efforts.
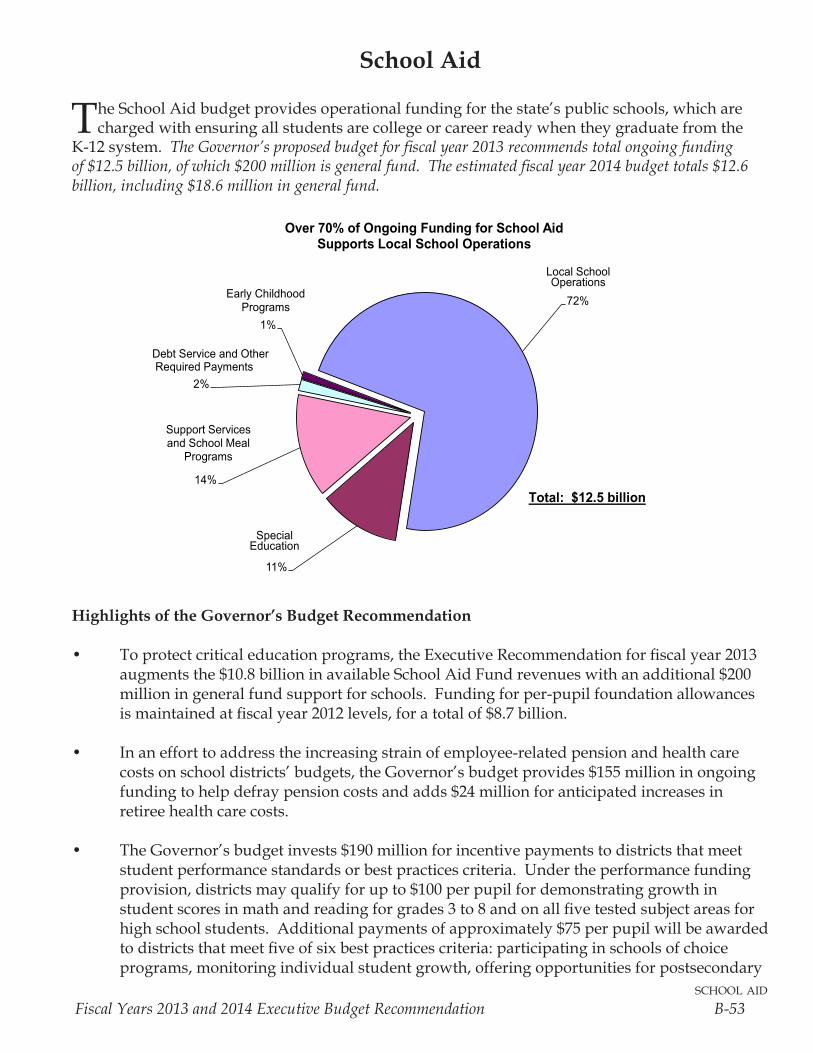
school aid
Fiscal Years 2013 and 2014 Executive Budget Recommendation B-53
School Aid
The School Aid budget provides operational funding for the state’s public schools, which are charged with ensuring all students are college or career ready when they graduate from the
K-12 system. The Governor’s proposed budget for fiscal year 2013 recommends total ongoing funding of $12.5 billion, of which $200 million is general fund. The estimated fiscal year 2014 budget totals $12.6 billion, including $18.6 million in general fund.
Highlights of the Governor’s Budget Recommendation
• Toprotectcriticaleducationprograms,theExecutiveRecommendationforfiscalyear2013augmentsthe$10.8billioninavailableSchoolAidFundrevenueswithanadditional$200millioningeneralfundsupportforschools.Fundingforper-pupilfoundationallowancesismaintainedatfiscalyear2012levels,foratotalof$8.7billion.
• Inanefforttoaddresstheincreasingstrainofemployee-relatedpensionandhealthcarecosts on school districts’ budgets, the Governor’s budget provides $155 million in ongoing funding to help defray pension costs and adds $24 million for anticipated increases in retiree health care costs.
• TheGovernor’sbudgetinvests$190millionforincentivepaymentstodistrictsthatmeetstudent performance standards or best practices criteria. Under the performance funding provision,districtsmayqualifyforupto$100perpupilfordemonstratinggrowthinstudentscoresinmathandreadingforgrades3to8andonallfivetestedsubjectareasforhighschoolstudents.Additionalpaymentsofapproximately$75perpupilwillbeawardedtodistrictsthatmeetfiveofsixbestpracticescriteria:participatinginschoolsofchoiceprograms, monitoring individual student growth, offering opportunities for postsecondary
72%
11%
14%
2%
1%
Over 70% of Ongoing Funding for School AidSupports Local School Operations
Local SchoolOperations
Total: $12.5 billion
SpecialEducation
Early ChildhoodPrograms
Support Services and School Meal
Programs
Debt Service and OtherRequired Payments

school aid
B-54 Reinventing Michigan ― Investing in our Future
coursework, offering online learning, publishing a citizen’s dashboard and serving as the policy-holderforhealthcarebenefits.(Michigan Education Dashboard)
• TheExecutiveRecommendationalsoincludes$10millioninone-timefundsforcompetitive innovation grants to help defray transition costs associated with consolidation or shared services efforts. Both local and intermediate school districts will be eligible to compete for these funds.
• Whileintermediateschooldistricts’(ISDs)operationsfundingismaintainedat$62.1million, the Governor continues his focus on best practices by setting aside 5 percent ofthatamounttobeallocatedtoISDsthatmeetfouroffivebestpractices:developingserviceconsolidationplans;workinginconsortiumwithotherISDstodevelopdetaileddatasystemspecificationsforusebydistricts;developingclassroomdigitaltechnologyplans; obtaining competitive bids for noninstructional services; and creating a citizen’s dashboard.
• Educationdollarshavetraditionallybeendistributedbasedonthetimestudentsspendin a classroom. As the use of technology has transformed the education delivery model in recent years, the role of the Michigan Virtual University is redesigned to serve as the statewideleaderinonlinelearning.Infiscalyear2013,theMichiganVirtualUniversitywill conduct a pilot program for online learning where funding is based on student performance rather than instructional seat time.
• Inresponsetorecentlyenactedteacherevaluationrequirements,additionalfundingof$1.8millionisincludedintheGovernor’sbudgettosupportprofessionaldevelopmentforschool principals related to methods of conducting fair and consistent teacher evaluations.
• Thefiscalyear2013SchoolAidbudgetmaintainscurrentyearfundingofover$115millionforearlychildhoodprograms.Anadditional$209.2million($41.2milliongeneralfund)isincludedintheDepartmentofEducationbudgetforearlylearningandchildcareprograms.
• Thefiscalyear2013budgetincludesover$1.4billioninfundingforprogramsthatassistover67,000specialeducationstudentsinthestate.
• TheGovernoralsomaintainsspendingof$1.2billionforcorestudentsupplementalprogramssuchasservicesforacademicallyat-riskpupils($309million),adulteducation($22million),vocationaleducation($35.6million)andaddedcostsforeducatingcourtwards($8million).
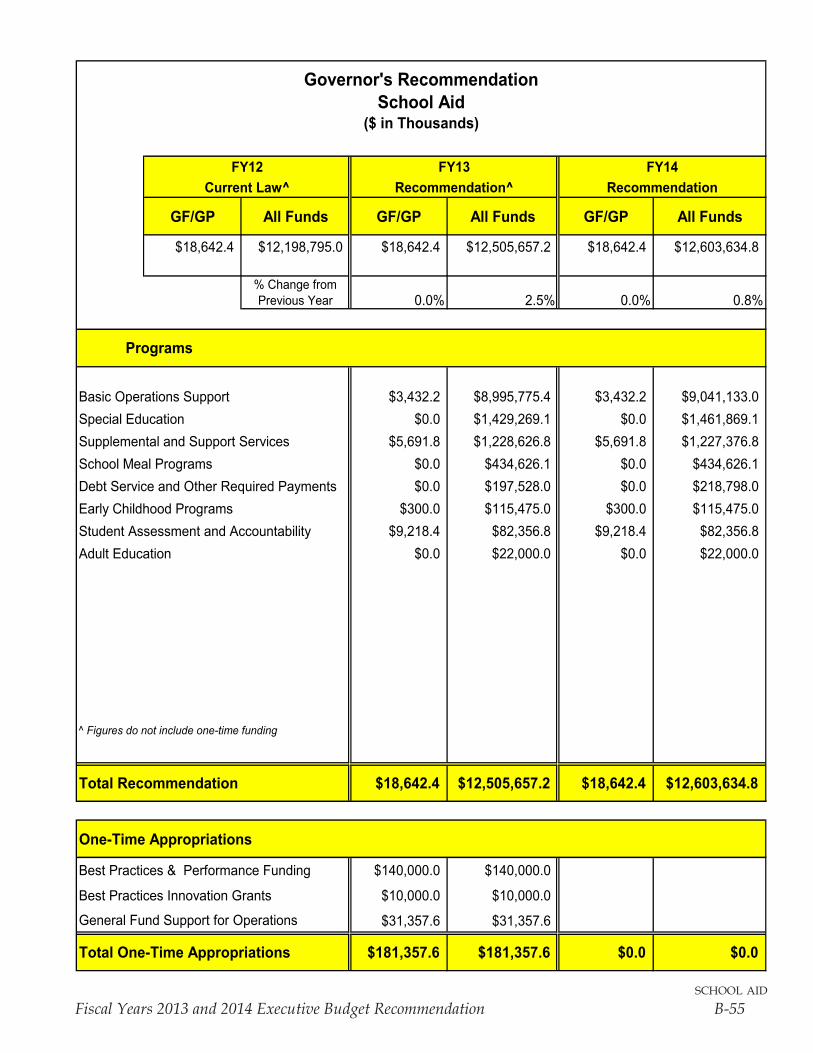
school aid
Fiscal Years 2013 and 2014 Executive Budget Recommendation B-55
FY12 FY13 FY14Current Law^ Recommendation^ Recommendation
GF/GP All Funds GF/GP All Funds GF/GP All Funds
$18,642.4 $12,198,795.0 $18,642.4 $12,505,657.2 $18,642.4 $12,603,634.8
% Change from Previous Year 0.0% 2.5% 0.0% 0.8%
Basic Operations Support $3,432.2 $8,995,775.4 $3,432.2 $9,041,133.0Special Education $0.0 $1,429,269.1 $0.0 $1,461,869.1Supplemental and Support Services $5,691.8 $1,228,626.8 $5,691.8 $1,227,376.8School Meal Programs $0.0 $434,626.1 $0.0 $434,626.1Debt Service and Other Required Payments $0.0 $197,528.0 $0.0 $218,798.0Early Childhood Programs $300.0 $115,475.0 $300.0 $115,475.0Student Assessment and Accountability $9,218.4 $82,356.8 $9,218.4 $82,356.8Adult Education $0.0 $22,000.0 $0.0 $22,000.0
^ Figures do not include one-time funding
Total Recommendation $18,642.4 $12,505,657.2 $18,642.4 $12,603,634.8
One-Time Appropriations
Best Practices & Performance Funding $140,000.0 $140,000.0
Best Practices Innovation Grants $10,000.0 $10,000.0
$31,357.6 $31,357.6
Total One-Time Appropriations $181,357.6 $181,357.6 $0.0 $0.0
Governor's RecommendationSchool Aid
($ in Thousands)
Programs
General Fund Support for Operations

school aid
B-56 Reinventing Michigan ― Investing in our Future
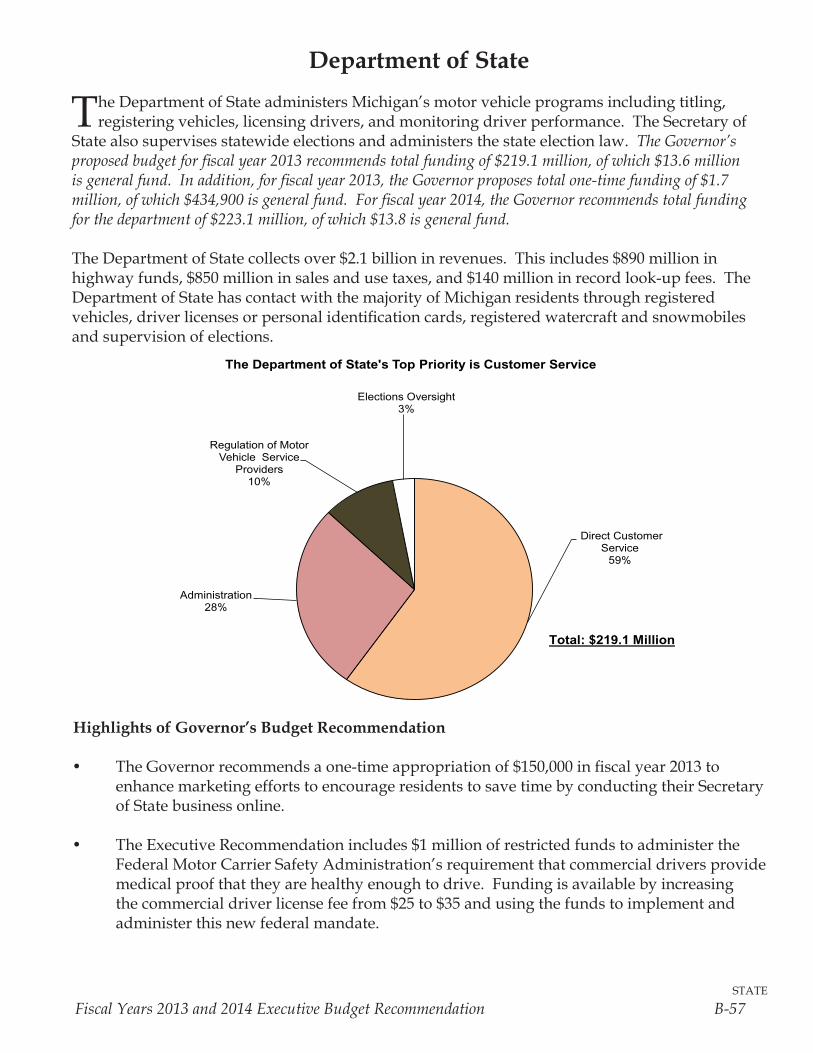
state
Fiscal Years 2013 and 2014 Executive Budget Recommendation B-57
Department of State
The Department of State administers Michigan’s motor vehicle programs including titling, registering vehicles, licensing drivers, and monitoring driver performance. The Secretary of
State also supervises statewide elections and administers the state election law. The Governor’s proposed budget for fiscal year 2013 recommends total funding of $219.1 million, of which $13.6 million is general fund. In addition, for fiscal year 2013, the Governor proposes total one-time funding of $1.7 million, of which $434,900 is general fund. For fiscal year 2014, the Governor recommends total funding for the department of $223.1 million, of which $13.8 is general fund.
The Department of State collects over $2.1 billion in revenues. This includes $890 million in highway funds, $850 million in sales and use taxes, and $140 million in record look-up fees. The Department of State has contact with the majority of Michigan residents through registered vehicles, driver licenses or personal identification cards, registered watercraft and snowmobiles and supervision of elections.
Highlights of Governor’s Budget Recommendation
• The Governor recommends a one-time appropriation of $150,000 in fiscal year 2013 to enhance marketing efforts to encourage residents to save time by conducting their Secretary of State business online.
• The Executive Recommendation includes $1 million of restricted funds to administer the Federal Motor Carrier Safety Administration’s requirement that commercial drivers provide medical proof that they are healthy enough to drive. Funding is available by increasing the commercial driver license fee from $25 to $35 and using the funds to implement and administer this new federal mandate.
Direct Customer Service
59%
Administration28%
Regulation of Motor Vehicle Service
Providers10%
Elections Oversight3%
The Department of State's Top Priority is Customer Service
Total: $219.1 Million
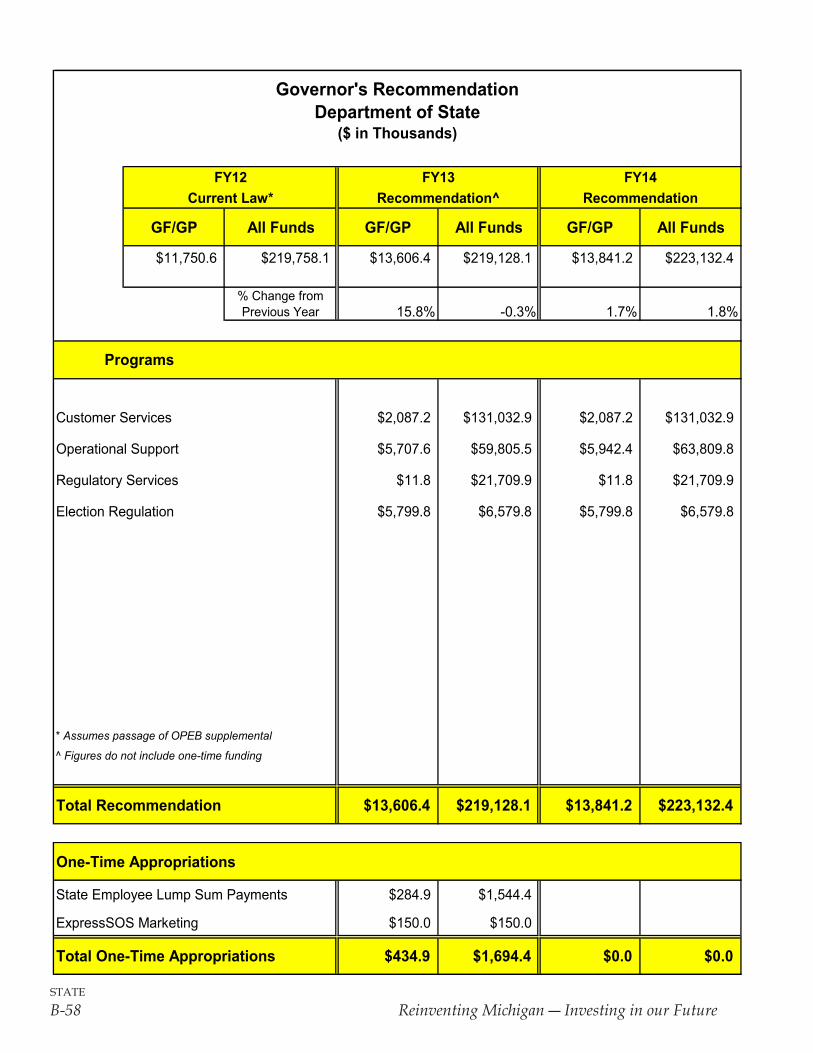
state
B-58 Reinventing Michigan ― Investing in our Future
FY12 FY13 FY14Current Law* Recommendation^ Recommendation
GF/GP All Funds GF/GP All Funds GF/GP All Funds
$11,750.6 $219,758.1 $13,606.4 $219,128.1 $13,841.2 $223,132.4
% Change from Previous Year 15.8% -0.3% 1.7% 1.8%
Customer Services $2,087.2 $131,032.9 $2,087.2 $131,032.9
Operational Support $5,707.6 $59,805.5 $5,942.4 $63,809.8
Regulatory Services $11.8 $21,709.9 $11.8 $21,709.9
Election Regulation $5,799.8 $6,579.8 $5,799.8 $6,579.8
* Assumes passage of OPEB supplemental
^ Figures do not include one-time funding
Total Recommendation $13,606.4 $219,128.1 $13,841.2 $223,132.4
One-Time Appropriations
State Employee Lump Sum Payments $284.9 $1,544.4
ExpressSOS Marketing $150.0 $150.0
Total One-Time Appropriations $434.9 $1,694.4 $0.0 $0.0
Governor's RecommendationDepartment of State
($ in Thousands)
Programs
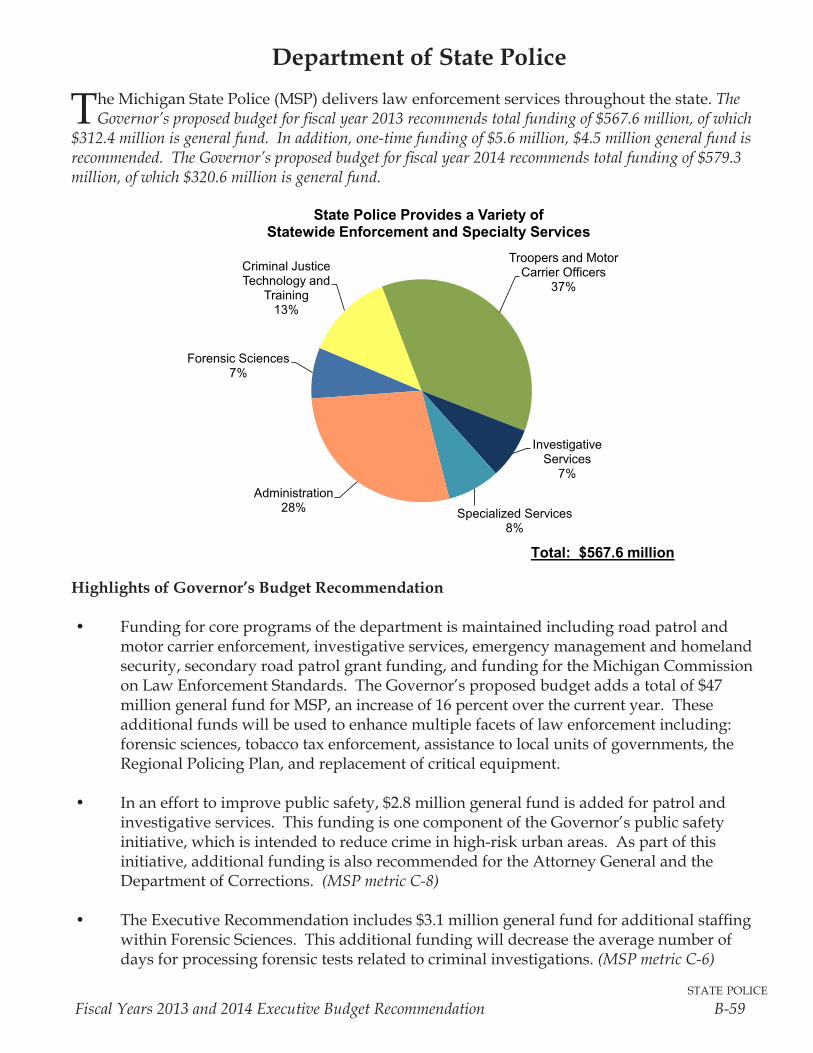
state police
Fiscal Years 2013 and 2014 Executive Budget Recommendation B-59
Department of State Police
The Michigan State Police (MSP) delivers law enforcement services throughout the state. The Governor’s proposed budget for fiscal year 2013 recommends total funding of $567.6 million, of which
$312.4 million is general fund. In addition, one-time funding of $5.6 million, $4.5 million general fund is recommended. The Governor’s proposed budget for fiscal year 2014 recommends total funding of $579.3 million, of which $320.6 million is general fund.
Highlights of Governor’s Budget Recommendation
• Fundingforcoreprogramsofthedepartmentismaintainedincludingroadpatrolandmotor carrier enforcement, investigative services, emergency management and homeland security,secondaryroadpatrolgrantfunding,andfundingfortheMichiganCommissiononLawEnforcementStandards.TheGovernor’sproposedbudgetaddsatotalof$47milliongeneralfundforMSP,anincreaseof16percentoverthecurrentyear.Theseadditionalfundswillbeusedtoenhancemultiplefacetsoflawenforcementincluding:forensicsciences,tobaccotaxenforcement,assistancetolocalunitsofgovernments,theRegionalPolicingPlan,andreplacementofcriticalequipment.
• Inanefforttoimprovepublicsafety,$2.8milliongeneralfundisaddedforpatrolandinvestigativeservices.ThisfundingisonecomponentoftheGovernor’spublicsafetyinitiative,whichisintendedtoreducecrimeinhigh-riskurbanareas.Aspartofthisinitiative,additionalfundingisalsorecommendedfortheAttorneyGeneralandtheDepartmentofCorrections.(MSP metric C-8)
• TheExecutiveRecommendationincludes$3.1milliongeneralfundforadditionalstaffingwithinForensicSciences.Thisadditionalfundingwilldecreasetheaveragenumberofdaysforprocessingforensictestsrelatedtocriminalinvestigations.(MSP metric C-6)
Forensic Sciences7%
Criminal Justice Technology and
Training13%
Troopers and Motor Carrier Officers
37%
Investigative Services
7%
Specialized Services8%
Administration28%
State Police Provides a Variety of Statewide Enforcement and Specialty Services
Total: $567.6 million
state police
B-60 Reinventing Michigan ― Investing in our Future
• Anadditional$4.0milliongeneralfundisincludedtofullyfundthedepartment’sRegionalPolicingPlanwhichwasimplementedinthecurrentyear.Specifically,thisfundingwillsupportcommunicationandinformationtechnologycostsassociatedwithshiftingtomobileofficesaswellasadditionalfleetcostsforstaffassignedtoroadpatrol.Also,theExecutiveRecommendationincludes$1.1milliongeneralfundtoreplacemobileradiosanddatacomputersandestablishlifecyclereplacementprogramsforboth.
(MSP metric O-1)
• Amulti-agencyapproachinvolvingthedepartmentsofStatePolice,Treasury,andtheAttorneyGeneralwillbeimplementedtoimproveenforcementoftobaccotaxlawsandenforcementofthemulti-statetobaccosettlementagreement.TheGovernorrecommends$200,000forthedepartmentofStatePolicetosupporttheseefforts,whichwillyieldincreasedinvestigationsandprosecutions,withasubsequentgrowthincivilassessmentsandtobaccotaxrevenues.(MSP metric P-6)
• TheGovernor’sRecommendationincludes$9milliongeneralfundtoreplacestaterestrictedandfederalfundingthatisnolongeravailableforforensicservicesandtheoperationsoftheMichiganIntelligenceOperationsCenterandtheMichiganPublicSafetyCommunicationsSystem.
• Anadditional$15milliongeneralfundisincludedforalawenforcementenhancementwhichwillbefurtherdetailedintheGovernor’supcomingMarch2012SpecialMessageonPublicSafety.
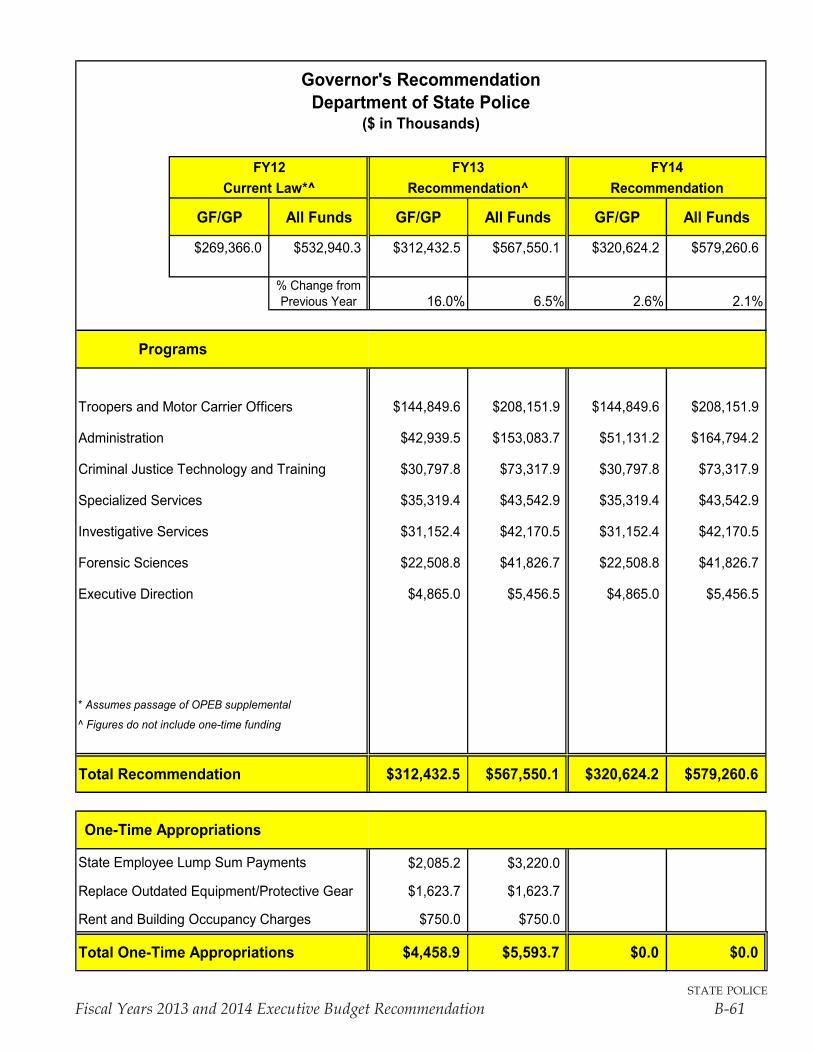
state police
Fiscal Years 2013 and 2014 Executive Budget Recommendation B-61
FY12 FY13 FY14Current Law*^ Recommendation^ Recommendation
GF/GP All Funds GF/GP All Funds GF/GP All Funds
$269,366.0 $532,940.3 $312,432.5 $567,550.1 $320,624.2 $579,260.6
% Change from Previous Year 16.0% 6.5% 2.6% 2.1%
Troopers and Motor Carrier Officers $144,849.6 $208,151.9 $144,849.6 $208,151.9
Administration $42,939.5 $153,083.7 $51,131.2 $164,794.2
Criminal Justice Technology and Training $30,797.8 $73,317.9 $30,797.8 $73,317.9
Specialized Services $35,319.4 $43,542.9 $35,319.4 $43,542.9
Investigative Services $31,152.4 $42,170.5 $31,152.4 $42,170.5
Forensic Sciences $22,508.8 $41,826.7 $22,508.8 $41,826.7
Executive Direction $4,865.0 $5,456.5 $4,865.0 $5,456.5
* Assumes passage of OPEB supplemental
^ Figures do not include one-time funding
Total Recommendation $312,432.5 $567,550.1 $320,624.2 $579,260.6
$2,085.2 $3,220.0
Replace Outdated Equipment/Protective Gear $1,623.7 $1,623.7
Rent and Building Occupancy Charges $750.0 $750.0
Total One-Time Appropriations $4,458.9 $5,593.7 $0.0 $0.0
Governor's RecommendationDepartment of State Police
($ in Thousands)
Programs
One-Time Appropriations
State Employee Lump Sum Payments

state police
B-62 Reinventing Michigan ― Investing in our Future
technology, management and budget
Fiscal Years 2013 and 2014 Executive Budget Recommendation B-63
Department of Technology, Management and Budget
T he Department of Technology, Management and Budget (DTMB) supports the business operations of state agencies through a variety of services. These services include building
management and maintenance, technology services, centralized contracting, purchasing, space planning and leasing, construction management, motor vehicle fleet management, and the state retirement system. The Governor’s proposed budget for fiscal year 2013 recommends total funding of $1.1 billion, of which $384.1 million is general fund. In addition, for fiscal year 2013, the budget includes total one-time funding of $21.7 million, of which $17.8 million is general fund. For fiscal year 2014, the Governor’s proposed budget is $1.1 billion, of which $387.5 million is general fund.
Highlights of Governor’s Budget Recommendation
• The Executive Recommendation includes $466.2 million for information technology support for all state departments, primarily funded with user fees from client agencies. In order to begin to address the risks associated with obsolete, outdated and vulnerable information systems, the Governor recommends investment of $50 million general fund for targeted technology upgrades and automation opportunities. The department is currently conducting an inventory of risks in the current statewide technology infrastructure. Once the study is complete, the most significant risk areas will be addressed first in order to protect the state’s information systems, safeguard citizen information and help state agencies achieve their customer service goals. (DTMB metric C-5)
• The Executive Budget advances to construction 18 university and community college projects authorized for planning in the prior legislative session. The total cost of these projects is $613.1 million, including $304.5 million in state share to be financed through the State Building Authority.
• The Governor recommends reforms to the capital outlay process for future projects that will streamline approval, provide for transparent, merit-based evaluation of requests, and modernize statutory requirements.
• In order to address deterioration and maintenance issues in state buildings, the Governor recommends an investment of $25 million ($15 million in ongoing funding and $10 million in one-time funding). Delayed maintenance to state buildings has resulted in costly capital needs; a significant investment is needed to address health and safety issues, as well as rehabilitation of valuable state assets. (DTMB metric C-6)
• In order to achieve work efficiencies and cost savings, the Governor recommends a one-time investment of $7 million to consolidate the state’s office space. The state will use private industry standards to optimize floor space in as few buildings as possible. Some private leases that are not cost effective will be eliminated. It is anticipated that this one-time investment will pay for itself within four years. (DTMB metric C-4)
• The Governor recommends that the Military Retirement program, currently managed by the Department of Military and Veterans Affairs, be transferred to the Department of Technology, Management and Budget. The Office of Retirement Services within DTMB has the expertise to efficiently operate this retirement program.
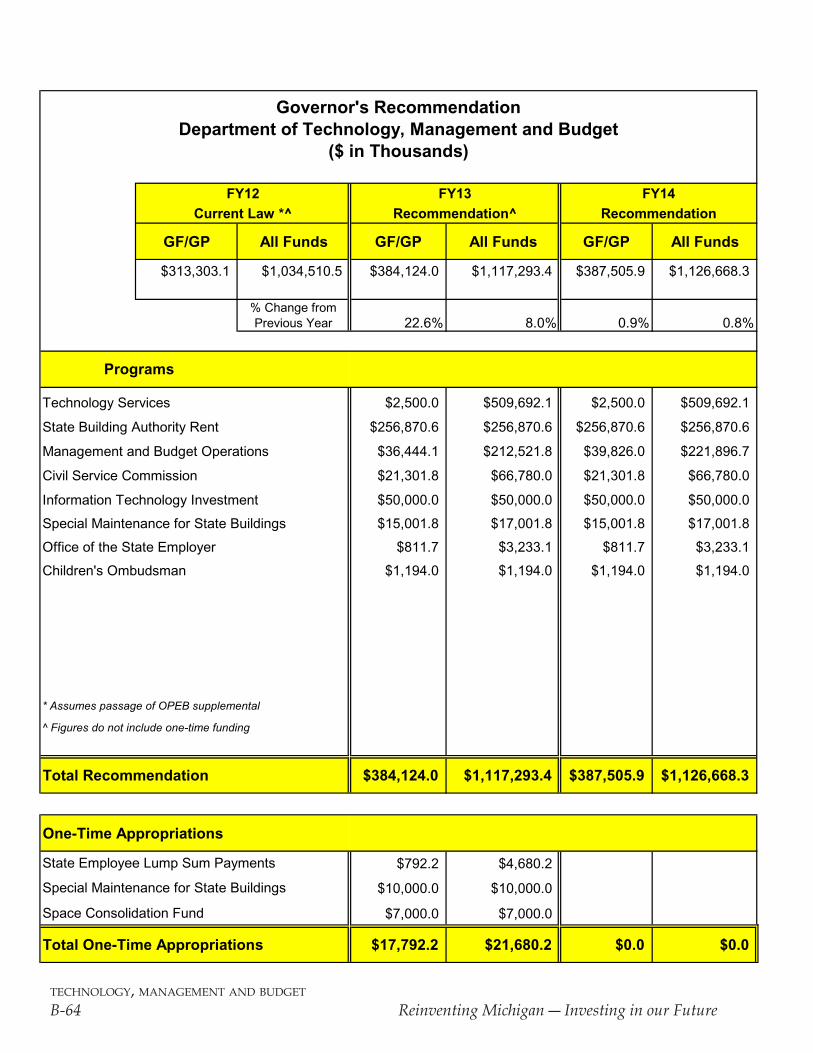
technology, management and budget
B-64 Reinventing Michigan ― Investing in our Future
FY12 FY13 FY14Current Law *^ Recommendation^ Recommendation
GF/GP All Funds GF/GP All Funds GF/GP All Funds
$313,303.1 $1,034,510.5 $384,124.0 $1,117,293.4 $387,505.9 $1,126,668.3
% Change from Previous Year 22.6% 8.0% 0.9% 0.8%
$2,500.0 $509,692.1 $2,500.0 $509,692.1
State Building Authority Rent $256,870.6 $256,870.6 $256,870.6 $256,870.6
Management and Budget Operations $36,444.1 $212,521.8 $39,826.0 $221,896.7
Civil Service Commission $21,301.8 $66,780.0 $21,301.8 $66,780.0
Information Technology Investment $50,000.0 $50,000.0 $50,000.0 $50,000.0
$15,001.8 $17,001.8 $15,001.8 $17,001.8
Office of the State Employer $811.7 $3,233.1 $811.7 $3,233.1
Children's Ombudsman $1,194.0 $1,194.0 $1,194.0 $1,194.0
* Assumes passage of OPEB supplemental
^ Figures do not include one-time funding
Total Recommendation $384,124.0 $1,117,293.4 $387,505.9 $1,126,668.3
One-Time Appropriations
$792.2 $4,680.2
$10,000.0 $10,000.0
$7,000.0 $7,000.0
Total One-Time Appropriations $17,792.2 $21,680.2 $0.0 $0.0
.
Space Consolidation Fund
Governor's RecommendationDepartment of Technology, Management and Budget
($ in Thousands)
Programs
State Employee Lump Sum Payments
Special Maintenance for State Buildings
Special Maintenance for State Buildings
Technology Services
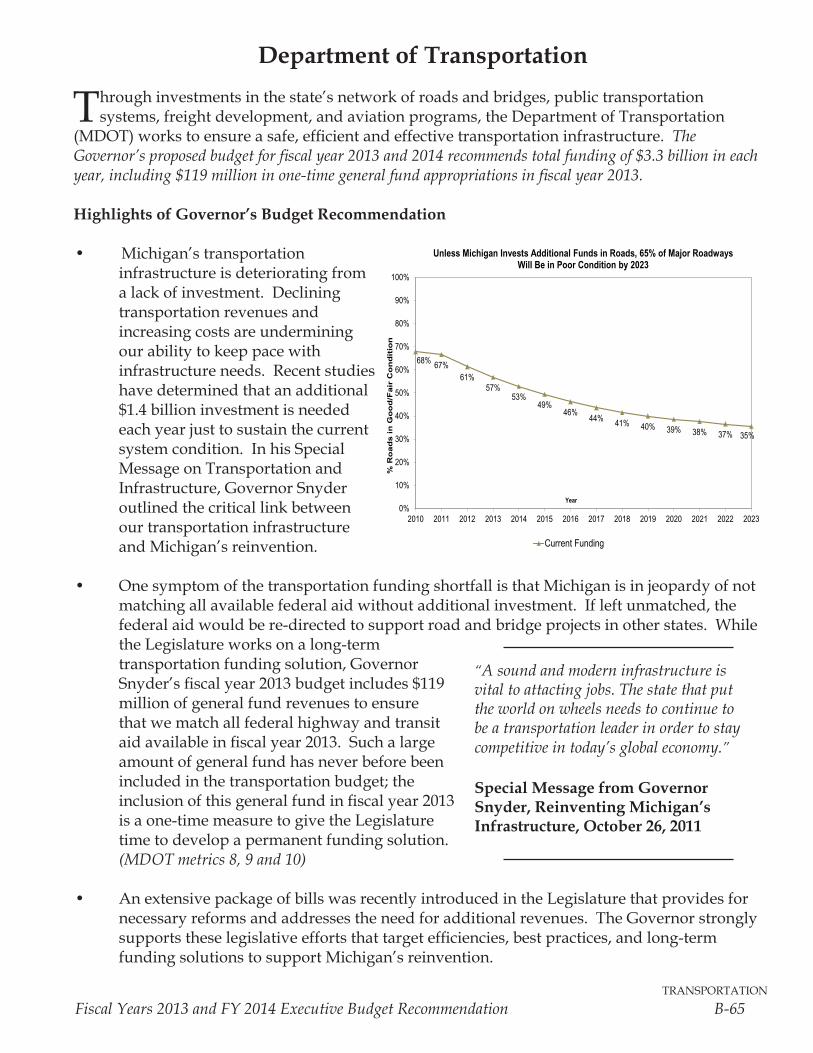
transportation
Fiscal Years 2013 and FY 2014 Executive Budget Recommendation B-65
Department of Transportation
Through investments in the state’s network of roads and bridges, public transportation systems, freight development, and aviation programs, the Department of Transportation
(MDOT) works to ensure a safe, efficient and effective transportation infrastructure. The Governor’s proposed budget for fiscal year 2013 and 2014 recommends total funding of $3.3 billion in each year, including $119 million in one-time general fund appropriations in fiscal year 2013.
Highlights of Governor’s Budget Recommendation
• Michigan’s transportation infrastructure is deteriorating from a lack of investment. Declining transportation revenues and increasing costs are undermining our ability to keep pace with infrastructure needs. Recent studies have determined that an additional $1.4 billion investment is needed each year just to sustain the current system condition. In his Special Message on Transportation and Infrastructure, Governor Snyder outlined the critical link between
our transportation infrastructure and Michigan’s reinvention.
• One symptom of the transportation funding shortfall is that Michigan is in jeopardy of not matching all available federal aid without additional investment. If left unmatched, the federal aid would be re-directed to support road and bridge projects in other states. While the Legislature works on a long-term
transportation funding solution, Governor Snyder’s fiscal year 2013 budget includes $119 million of general fund revenues to ensure that we match all federal highway and transit aid available in fiscal year 2013. Such a large amount of general fund has never before been included in the transportation budget; the inclusion of this general fund in fiscal year 2013 is a one-time measure to give the Legislature time to develop a permanent funding solution.
(MDOT metrics 8, 9 and 10) • An extensive package of bills was recently introduced in the Legislature that provides for necessary reforms and addresses the need for additional revenues. The Governor strongly
supports these legislative efforts that target efficiencies, best practices, and long-term funding solutions to support Michigan’s reinvention.
68% 67%61%
57%53%
49%46%
44% 41% 40% 39% 38% 37% 35%
0%
10%
20%
30%
40%
50%
60%
70%
80%
90%
100%
2010 2011 2012 2013 2014 2015 2016 2017 2018 2019 2020 2021 2022 2023
% R
oad
s i
n G
oo
d/F
air
Co
nd
itio
n
Year
Unless Michigan Invests Additional Funds in Roads, 65% of Major Roadways Will Be in Poor Condition by 2023
Current Funding
“A sound and modern infrastructure is vital to attacting jobs. The state that put the world on wheels needs to continue to be a transportation leader in order to stay competitive in today’s global economy.” Special Message from Governor Snyder, Reinventing Michigan’s Infrastructure, October 26, 2011
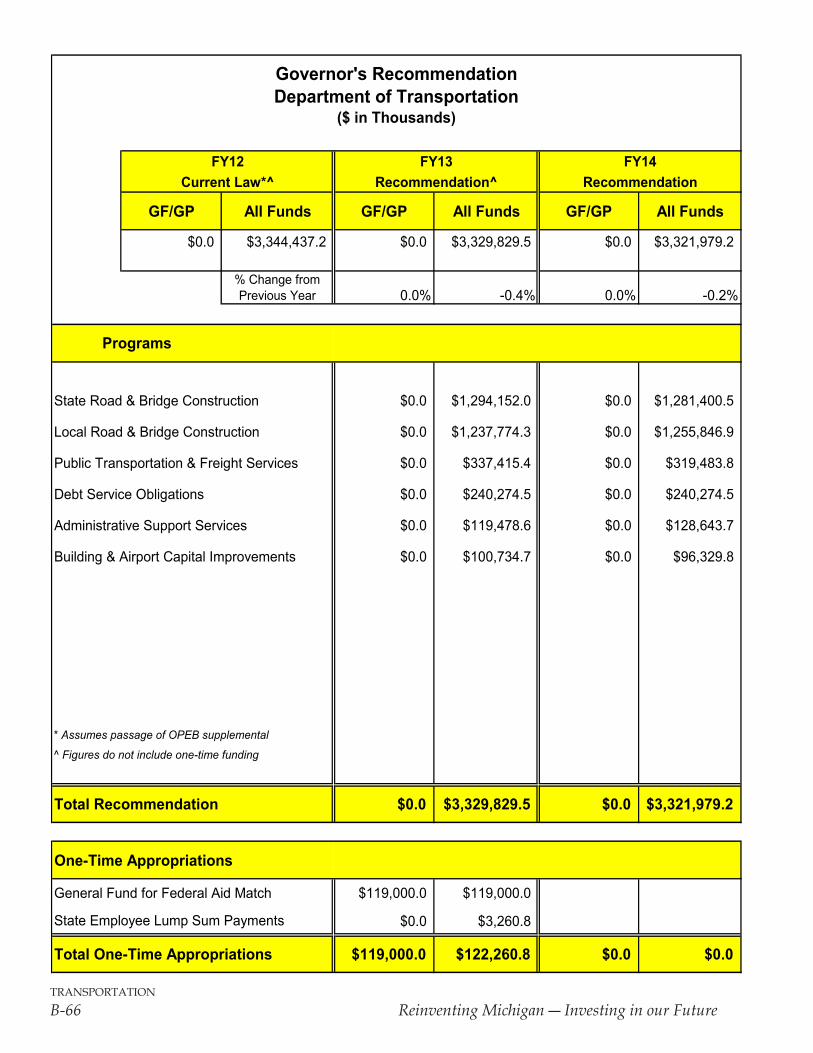
transportation
B-66 Reinventing Michigan ― Investing in our Future
FY12 FY13 FY14Current Law*^ Recommendation^ Recommendation
GF/GP All Funds GF/GP All Funds GF/GP All Funds
$0.0 $3,344,437.2 $0.0 $3,329,829.5 $0.0 $3,321,979.2
% Change from Previous Year 0.0% -0.4% 0.0% -0.2%
State Road & Bridge Construction $0.0 $1,294,152.0 $0.0 $1,281,400.5
Local Road & Bridge Construction $0.0 $1,237,774.3 $0.0 $1,255,846.9
Public Transportation & Freight Services $0.0 $337,415.4 $0.0 $319,483.8
Debt Service Obligations $0.0 $240,274.5 $0.0 $240,274.5
Administrative Support Services $0.0 $119,478.6 $0.0 $128,643.7
Building & Airport Capital Improvements $0.0 $100,734.7 $0.0 $96,329.8
* Assumes passage of OPEB supplemental
^ Figures do not include one-time funding
Total Recommendation $0.0 $3,329,829.5 $0.0 $3,321,979.2
One-Time Appropriations
General Fund for Federal Aid Match $119,000.0 $119,000.0
$0.0 $3,260.8
Total One-Time Appropriations $119,000.0 $122,260.8 $0.0 $0.0
Governor's RecommendationDepartment of Transportation
($ in Thousands)
Programs
State Employee Lump Sum Payments
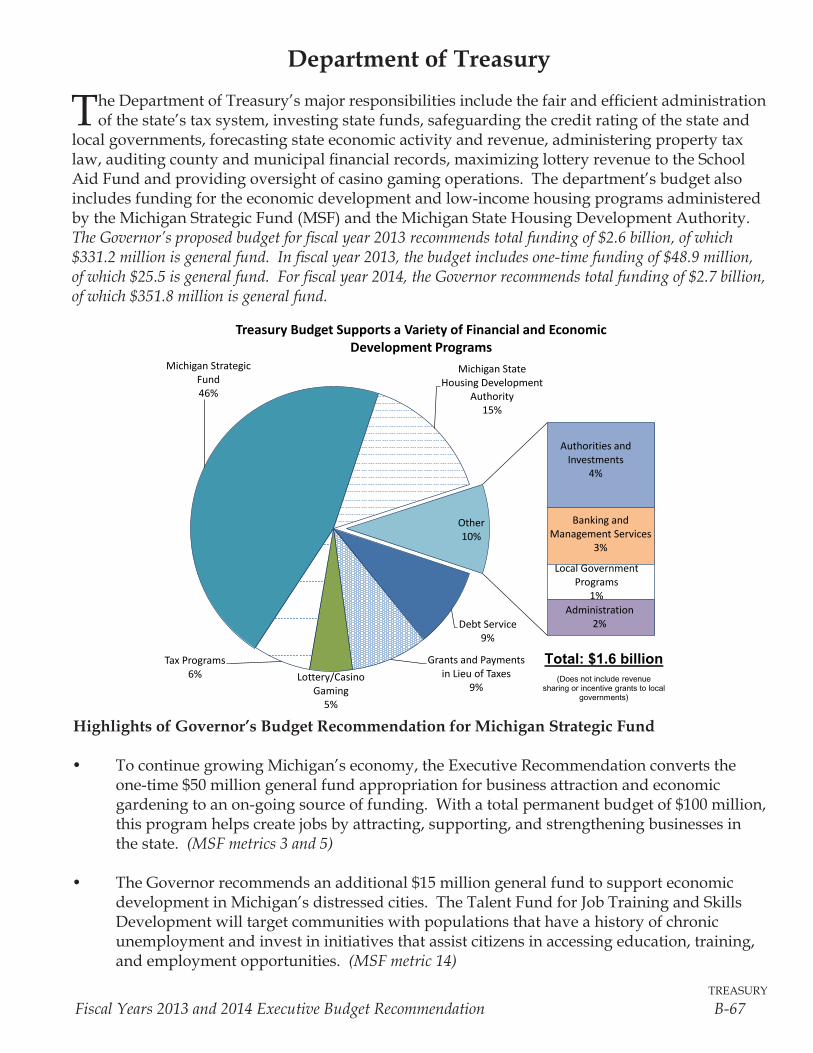
treasury
Fiscal Years 2013 and 2014 Executive Budget Recommendation B-67
Department of Treasury
The Department of Treasury’s major responsibilities include the fair and efficient administration of the state’s tax system, investing state funds, safeguarding the credit rating of the state and
local governments, forecasting state economic activity and revenue, administering property tax law, auditing county and municipal financial records, maximizing lottery revenue to the School Aid Fund and providing oversight of casino gaming operations. The department’s budget also includes funding for the economic development and low-income housing programs administered by the Michigan Strategic Fund (MSF) and the Michigan State Housing Development Authority. The Governor’s proposed budget for fiscal year 2013 recommends total funding of $2.6 billion, of which $331.2 million is general fund. In fiscal year 2013, the budget includes one-time funding of $48.9 million, of which $25.5 is general fund. For fiscal year 2014, the Governor recommends total funding of $2.7 billion, of which $351.8 million is general fund.
Highlights of Governor’s Budget Recommendation for Michigan Strategic Fund
• To continue growing Michigan’s economy, the Executive Recommendation converts the one-time $50 million general fund appropriation for business attraction and economic gardening to an on-going source of funding. With a total permanent budget of $100 million, this program helps create jobs by attracting, supporting, and strengthening businesses in the state. (MSF metrics 3 and 5)
• The Governor recommends an additional $15 million general fund to support economic development in Michigan’s distressed cities. The Talent Fund for Job Training and Skills Development will target communities with populations that have a history of chronic unemployment and invest in initiatives that assist citizens in accessing education, training, and employment opportunities. (MSF metric 14)
Debt Service9%
Grants and Payments in Lieu of Taxes
9%Lottery/Casino
Gaming5%
Tax Programs6%
Michigan Strategic Fund46%
Michigan State Housing Development
Authority15%
Authorities and Investments
4%
Banking and Management Services
3%
Local Government Programs
1%Administration
2%
Other10%
Treasury Budget Supports a Variety of Financial and Economic Development Programs
Total: $1.6 billion (Does not include revenue
sharing or incentive grants to local governments)
treasury
B-68 Reinventing Michigan ― Investing in our Future
• The Executive Recommendation increases general fund support for arts and cultural grants from $1.4 million to $5 million. This increased funding will help enhance the “Quality of Place” for local communities in Michigan through increased investments in arts and cultural programs. (MSF metric 12)
Highlights of Governor’s Budget Recommendation for Treasury Operations
• The proposed budget includes $4.5 million general fund for a new Office of Fiscal Responsibility which will provide technical assistance, guidance, and support to at-risk local units of government in an effort to avoid insolvency. (Treasury metric C7)
• The Governor recommends $140.6 million for debt service payments. This includes replacing $10 million in refined petroleum funds with an equal amount of general fund, which will increase the funding available for environmental clean-up efforts within the Department of Environmental Quality. (DEQ metric S9)
• A multi-agency approach involving the departments of Attorney General, State Police and Treasury will be implemented to improve enforcement of tobacco tax laws and enforcement of the multi-state tobacco settlement agreement. The Governor recommends $1.5 million for the Department of Treasury to support these efforts, which will increase tobacco tax revenues. (Treasury metric P5)
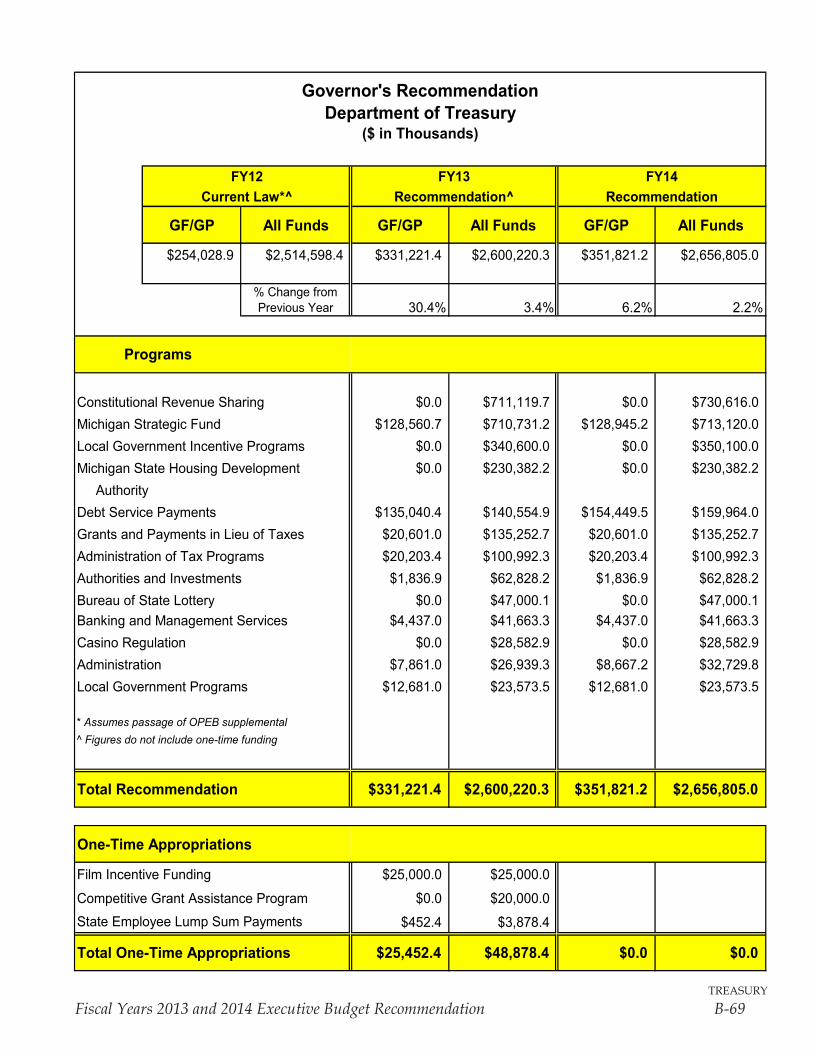
treasury
Fiscal Years 2013 and 2014 Executive Budget Recommendation B-69
FY12 FY13 FY14Current Law*^ Recommendation^ Recommendation
GF/GP All Funds GF/GP All Funds GF/GP All Funds
$254,028.9 $2,514,598.4 $331,221.4 $2,600,220.3 $351,821.2 $2,656,805.0
% Change from Previous Year 30.4% 3.4% 6.2% 2.2%
Constitutional Revenue Sharing $0.0 $711,119.7 $0.0 $730,616.0Michigan Strategic Fund $128,560.7 $710,731.2 $128,945.2 $713,120.0Local Government Incentive Programs $0.0 $340,600.0 $0.0 $350,100.0
$0.0 $230,382.2 $0.0 $230,382.2 AuthorityDebt Service Payments $135,040.4 $140,554.9 $154,449.5 $159,964.0Grants and Payments in Lieu of Taxes $20,601.0 $135,252.7 $20,601.0 $135,252.7Administration of Tax Programs $20,203.4 $100,992.3 $20,203.4 $100,992.3Authorities and Investments $1,836.9 $62,828.2 $1,836.9 $62,828.2Bureau of State Lottery $0.0 $47,000.1 $0.0 $47,000.1Banking and Management Services $4,437.0 $41,663.3 $4,437.0 $41,663.3Casino Regulation $0.0 $28,582.9 $0.0 $28,582.9Administration $7,861.0 $26,939.3 $8,667.2 $32,729.8Local Government Programs $12,681.0 $23,573.5 $12,681.0 $23,573.5
* Assumes passage of OPEB supplemental^ Figures do not include one-time funding
Total Recommendation $331,221.4 $2,600,220.3 $351,821.2 $2,656,805.0
One-Time Appropriations
Film Incentive Funding $25,000.0 $25,000.0
Competitive Grant Assistance Program $0.0 $20,000.0
$452.4 $3,878.4
Total One-Time Appropriations $25,452.4 $48,878.4 $0.0 $0.0
Governor's RecommendationDepartment of Treasury
($ in Thousands)
Programs
State Employee Lump Sum Payments
Michigan State Housing Development

treasury
B-70 Reinventing Michigan ― Investing in our Future
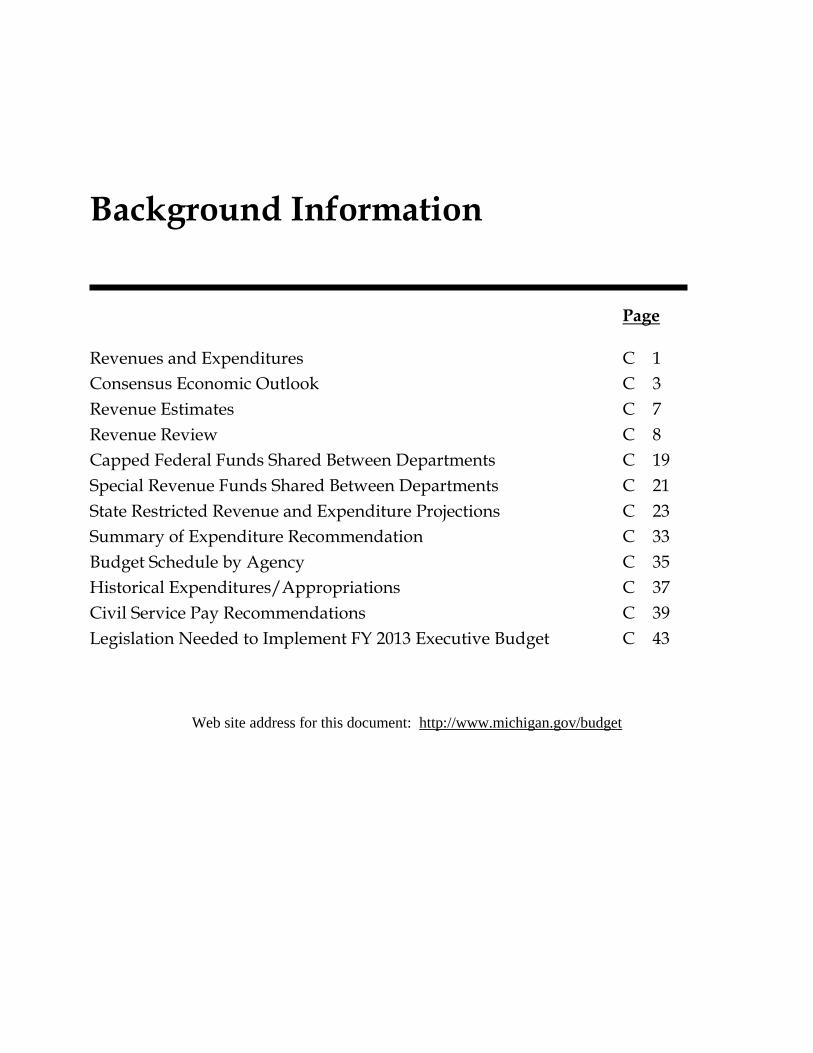
Background Information
Page Revenues and Expenditures C 1
Consensus Economic Outlook C 3
Revenue Estimates C 7
Revenue Review C 8
Capped Federal Funds Shared Between Departments C 19
Special Revenue Funds Shared Between Departments C 21
State Restricted Revenue and Expenditure Projections C 23
Summary of Expenditure Recommendation C 33
Budget Schedule by Agency C 35
Historical Expenditures/Appropriations C 37
Civil Service Pay Recommendations C 39
Legislation Needed to Implement FY 2013 Executive Budget C 43
Web site address for this document: http://www.michigan.gov/budget

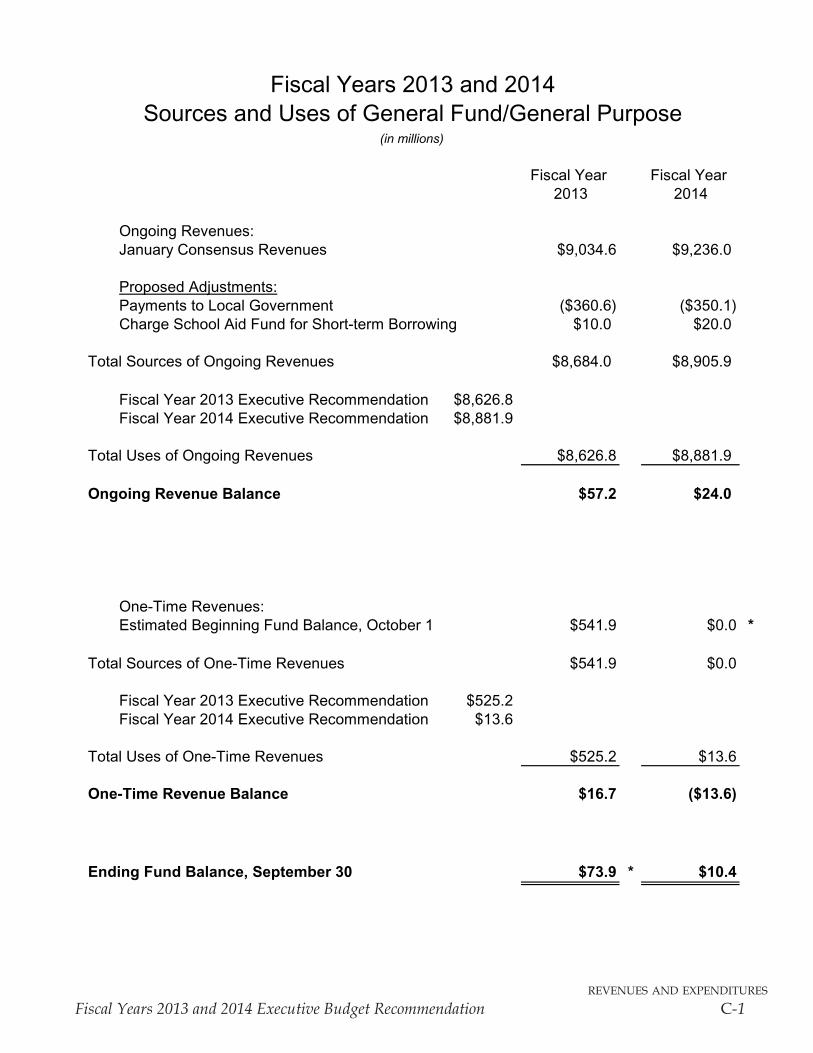
revenues and expenditures
Fiscal Years 2013 and 2014 Executive Budget Recommendation C-1
Fiscal Years 2013 and 2014Sources and Uses of General Fund/General Purpose
(in millions)
Fiscal Year Fiscal Year 2013 2014
Ongoing Revenues:January Consensus Revenues $9,034.6 $9,236.0
Proposed Adjustments:Payments to Local Government ($360.6) ($350.1)Charge School Aid Fund for Short-term Borrowing $10.0 $20.0
Total Sources of Ongoing Revenues $8,684.0 $8,905.9
Fiscal Year 2013 Executive Recommendation $8,626.8Fiscal Year 2014 Executive Recommendation $8,881.9
Total Uses of Ongoing Revenues $8,626.8 $8,881.9
Ongoing Revenue Balance $57.2 $24.0
One-Time Revenues:Estimated Beginning Fund Balance, October 1 $541.9 $0.0 *
Total Sources of One-Time Revenues $541.9 $0.0
Fiscal Year 2013 Executive Recommendation $525.2Fiscal Year 2014 Executive Recommendation $13.6
Total Uses of One-Time Revenues $525.2 $13.6
One-Time Revenue Balance $16.7 ($13.6)
Ending Fund Balance, September 30 $73.9 * $10.4
* Reserved for additional initiatives, including special messages.
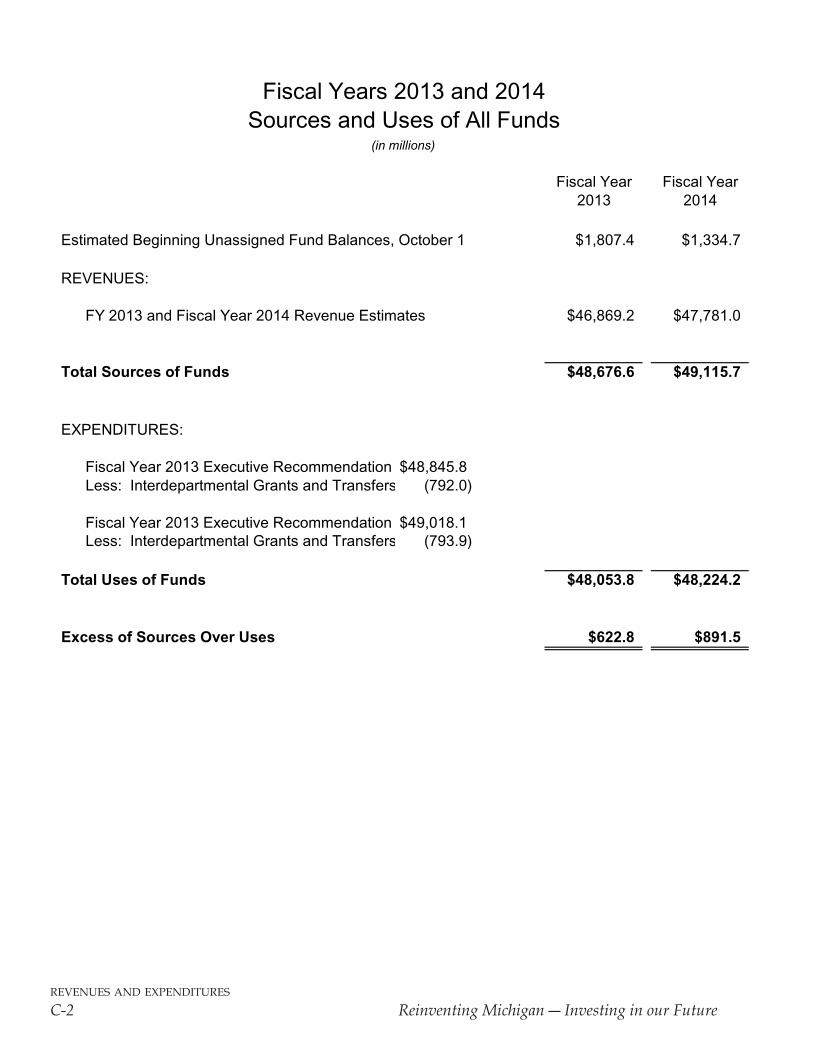
revenues and expenditures
C-2 ReinventingMichigan―InvestinginourFuture
Fiscal Year Fiscal Year2013 2014
Estimated Beginning Unassigned Fund Balances, October 1 $1,807.4 $1,334.7
REVENUES:
FY 2013 and Fiscal Year 2014 Revenue Estimates $46,869.2 $47,781.0
Total Sources of Funds $48,676.6 $49,115.7
EXPENDITURES:
Fiscal Year 2013 Executive Recommendation $48,845.8Less: Interdepartmental Grants and Transfers (792.0)
Fiscal Year 2013 Executive Recommendation $49,018.1Less: Interdepartmental Grants and Transfers (793.9)
Total Uses of Funds $48,053.8 $48,224.2
Excess of Sources Over Uses $622.8 $891.5
Fiscal Years 2013 and 2014Sources and Uses of All Funds
(in millions)
consensus economic outlook
Fiscal Years 2013 and 2014 Executive Budget Recommendation C-3
Consensus Economic Outlook
The economic outlooks for 2012, 2013, and 2014 were agreed to at the January 13, 2012,Consensus Revenue Estimating Conference by the Administration, House Fiscal Agency, and Senate Fiscal Agency.
2011 U.S. Economic Review
U.S. real gross domestic product (GDP) increased 1.7% in calendar year 2011, which was much slower than the 3.0 percent rate of growth experienced in 2010. During the first quarter of 2011, real GDP growth was very weak, but the rate of growth accelerated during each of the remaining three quarters.
The labor market finally began to improve in 2011. In 2010, U.S. wage and salary employment dropped for the third straight year -- the first time in over 60 years that U.S. employment fell forthree consecutive years. In 2011, U.S. wage and salary employment rose an estimated 1.0 percent and the increase in December 2011 marked the 15th straight monthly employment gain.
After the U.S. unemployment rate rose to 9.6 percent in 2010 (the highest annual rate since 1982), the rate dropped to an estimated 9.0 percent in 2011. In addition, the December 2011 unemployment rate of 8.5 percent marked the lowest monthly rate in nearly three years.
The housing market remained weak in 2011. While housing starts increased slightly in 2011 to 606,900 starts from the 2010 figure of 586,900 starts, they were the third lowest annual level everrecorded and marked the fourth consecutive year they remained below one million units. New home sales totaled 302,000 units in 2011, down 6 percent from 2010.
Light vehicle sales increased from 11.6 million units in 2010 to 12.8 million units in 2011, an increase of 10.3 percent. The pace of light vehicle sales increased throughout the year, selling at a 12.6 million annual average sales rate in January 2011 and finishing at a 13.5 million annual average sales rate in December 2011.
Financial markets continued to slowly recover in 2011. In July 2011, the Federal Open Market Committee stated it would leave interest rates low through mid-2013. Later in the year, the Federal Reserve announced it would purchase $400 billion longer-term Treasuries and sell $400 million in shorter-term Treasuries through June 2012 in order to continue to reduce longer-term interest rates,in an attempt to help boost economic activity.
In August 2011, the U.S. Federal government avoided default on its debt by agreeing to raise the debt ceiling; however, the failure of Congress to reach an agreement until the government was on the brink of default, caused instability in the financial markets. Shortly after the agreement, Standard and Poor’s downgraded the U.S. Federal government’s bond rating for the first time in history, as the rating agency was pessimistic that the U.S. government would be successful in implementing the plan to reduce its debt.
consensus economic outlook
C-4 ReinventingMichigan―InvestinginourFuture
Europe’s debt problems continued to disrupt world financial markets in 2011. The threat of Greece defaulting on its debt was a prominent risk throughout the year. The situation grew more severe as other larger European countries’ sovereign debt situations deteriorated.
Oil prices remained relatively high in 2011. In January 2011, oil prices averaged $89 a barrel and by April were up to $110 a barrel. By December, oil prices were back under $100 a barrel averaging $99 per barrel.
2011 Michigan Economic Review
In 2011, Michigan wage and salary employment increased an estimated 1.7 percent, which was the first annual growth in employment in a decade. Despite this increase, Michigan employment was still more than 15 percent below than the State’s previous peak level recorded in 2000. Similarly, while Michigan employment gained a net 66,000 jobs between the end of 2010 and 2011,December 2011 employment was more than 750,000 jobs below the State’s peak monthly employment level recorded in April 2000. The increase in jobs helped reduce Michigan’s unemployment rate to an estimated 10.7 percent in 2011 from 12.5 percent in 2010.
Michigan motor vehicle production increased by 22 percent in 2011 compared to 2010. Approximately 1,925,000 vehicles were produced in 2011 compared to the 1,577,000 vehicles produced in 2010. Michigan’s 2011 vehicle production was 68 percent above the historically low 1,146,000 units produced in 2009.
As a result of strong growth in the motor vehicle sector, Michigan manufacturing employment rose 5.5 percent between December 2010 and December 2011 – marking the second straight year of year-over-year manufacturing employment growth. Nevertheless, manufacturing employment remains well below peak levels seen in 2000.
In 2011, wage and salary payments to Michigan workers rose an estimated 5.4 percent – much stronger than the 1.7 percent growth in 2010. Overall personal income grew an estimated 5.5percent in 2011, up from the 3.3 percent rate of growth in 2010. With 3.4 percent inflation, real (inflation adjusted) personal income rose an estimated 2.0 percent in 2011.
U.S. Consensus Economic Outlook: 2012 - 2014
Real GDP is forecast to rise 2.0 percent in 2012, 2.2 percent in 2013, and 2.7 percent in 2014 (SeeTable 1). Light vehicle sales are forecast to increase to 13.7 million units in 2012, 14.5 million units in 2013, and in 2014, light vehicle sales are forecast to increase to 15.1 million units.
The 2012 U.S. unemployment rate is projected to increase slightly to 9.1 percent from 9.0 percent in 2011. In 2013, the unemployment rate is forecast to edge down to 8.9 percent. By 2014, the unemployment rate is projected to decrease further to 8.4 percent.
Consumer prices, as measured by the U.S. Consumer Price Index (CPI), are expected to rise 2.2percent in 2012 and increase 1.9 percent in both 2013 and 2014.
consensus economic outlook
Fiscal Years 2013 and 2014 Executive Budget Recommendation C-5
Michigan Consensus Economic Outlook: 2012 - 2014
In 2012, Michigan wage and salary employment is expected to increase by 0.7 percent followed by a 0.8 percent rise in 2013 and 1.2 percent in 2014. Michigan’s unemployment rate is expected to fall from 10.7 percent in 2011 to 10.4 percent in 2012. The jobless rate is forecast to decline in 2013 to 10.2 percent and then fall to 9.8 percent in 2014.
Michigan personal income is expected to rise 3.0 percent in 2012, 2.8 percent in 2013, and 4.6percent in 2014. Inflation is forecast to increase 2.3 percent in 2012, and 1.8 percent in both 2013and 2014. As a result, real Michigan personal income is expected to rise 0.7 percent in 2012, 1.0percent in 2013 and 2.7 percent in 2014.
Forecast Risks
Europe’s growing financial crises may become more severe than expected and this could significantly weaken the continent’s economic activity and create serious repercussions on the U.S. financial sector and overall economy.
Higher than forecast oil prices leading to higher gasoline costs would lower consumers’ discretionary income, increase many businesses costs and depress economic activity. Unrest and political instability in the Middle East may cause supply concerns. On the other hand, a slowdown in economic activity in Europe and other parts of the world could slow the demand for oil and keep prices lower than expected, which could benefit the U.S. economy.
Lack of cohesive governmental policies and continued fighting over budget matters in the United States could further damage consumer confidence and lead to further instability for financial markets.
Continued job growth remains central to sustaining recent gains across the economy and to combating dampening factors such as weak consumer confidence.
Continued growth in light vehicle sales is central for stabilizing and increasing manufacturing employment in Michigan.
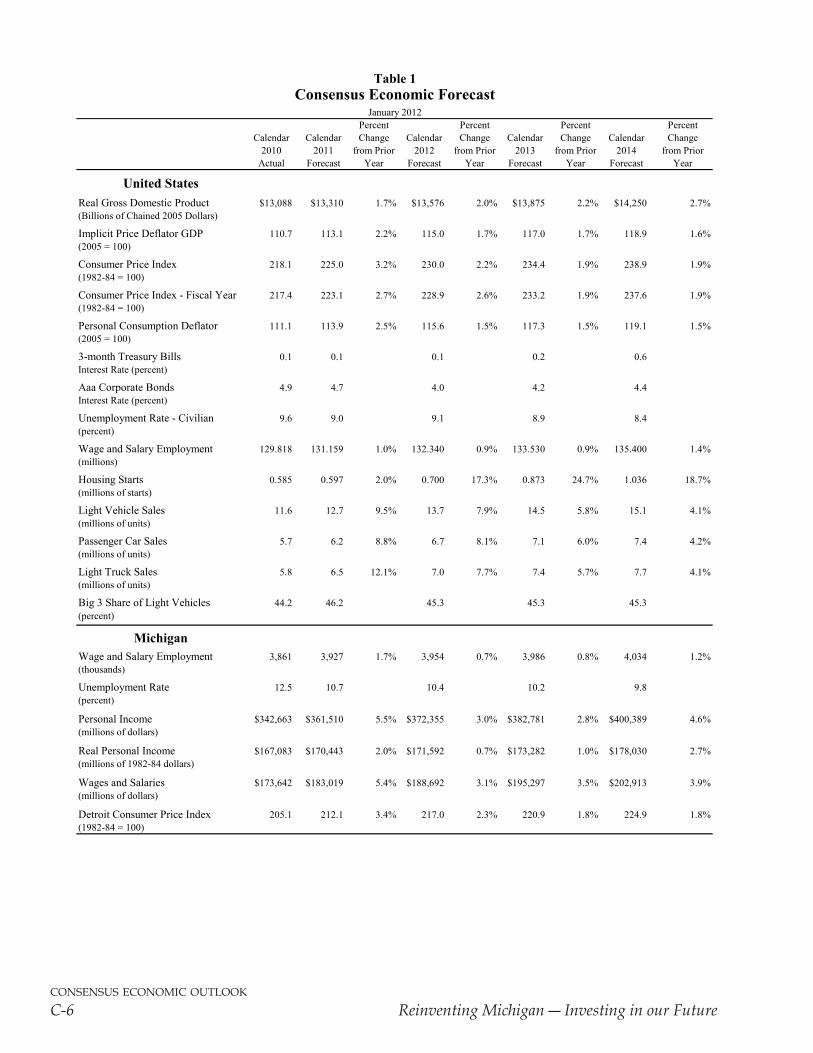
consensus economic outlook
C-6 ReinventingMichigan―InvestinginourFuture
Table 1Consensus Economic Forecast
January 2012Percent Percent Percent Percent
Calendar Calendar Change Calendar Change Calendar Change Calendar Change2010 2011 from Prior 2012 from Prior 2013 from Prior 2014 from Prior
Actual Forecast Year Forecast Year Forecast Year Forecast Year
United StatesReal Gross Domestic Product $13,088 $13,310 1.7% $13,576 2.0% $13,875 2.2% $14,250 2.7%(Billions of Chained 2005 Dollars)
Implicit Price Deflator GDP 110.7 113.1 2.2% 115.0 1.7% 117.0 1.7% 118.9 1.6%(2005 = 100)
Consumer Price Index 218.1 225.0 3.2% 230.0 2.2% 234.4 1.9% 238.9 1.9%(1982-84 = 100)
Consumer Price Index - Fiscal Year 217.4 223.1 2.7% 228.9 2.6% 233.2 1.9% 237.6 1.9%(1982-84 = 100)
Personal Consumption Deflator 111.1 113.9 2.5% 115.6 1.5% 117.3 1.5% 119.1 1.5%(2005 = 100)
3-month Treasury Bills 0.1 0.1 0.1 0.2 0.6Interest Rate (percent)
Aaa Corporate Bonds 4.9 4.7 4.0 4.2 4.4Interest Rate (percent)
Unemployment Rate - Civilian 9.6 9.0 9.1 8.9 8.4(percent)
Wage and Salary Employment 129.818 131.159 1.0% 132.340 0.9% 133.530 0.9% 135.400 1.4%(millions)
Housing Starts 0.585 0.597 2.0% 0.700 17.3% 0.873 24.7% 1.036 18.7%(millions of starts)
Light Vehicle Sales 11.6 12.7 9.5% 13.7 7.9% 14.5 5.8% 15.1 4.1%(millions of units)
Passenger Car Sales 5.7 6.2 8.8% 6.7 8.1% 7.1 6.0% 7.4 4.2%(millions of units)
Light Truck Sales 5.8 6.5 12.1% 7.0 7.7% 7.4 5.7% 7.7 4.1%(millions of units)
Big 3 Share of Light Vehicles 44.2 46.2 45.3 45.3 45.3(percent)
MichiganWage and Salary Employment 3,861 3,927 1.7% 3,954 0.7% 3,986 0.8% 4,034 1.2%(thousands)
Unemployment Rate 12.5 10.7 10.4 10.2 9.8(percent)
Personal Income $342,663 $361,510 5.5% $372,355 3.0% $382,781 2.8% $400,389 4.6%(millions of dollars)
Real Personal Income $167,083 $170,443 2.0% $171,592 0.7% $173,282 1.0% $178,030 2.7%(millions of 1982-84 dollars)
Wages and Salaries $173,642 $183,019 5.4% $188,692 3.1% $195,297 3.5% $202,913 3.9%(millions of dollars)
Detroit Consumer Price Index 205.1 212.1 3.4% 217.0 2.3% 220.9 1.8% 224.9 1.8%(1982-84 = 100)
revenue estimates
Fiscal Years 2013 and 2014 Executive Budget Recommendation C-7
Revenue Estimates
Fiscal Year 2011 Revenue Michigan experienced an increase in employment in 2011 for the first time since 2000 and this increase in economic activity helped boost tax collections and other revenue. On a consensus basis, FY 2011 General Fund/General Purpose (GF/GP) revenue totaled $8,813.0 million, which was up 14.8 percent from FY 2010. Including transfers and other one-time revenue not included in the consensus base, GF/GP revenue totaled $9,210.4 million. School Aid Fund (SAF) revenue increased 4.0 percent in FY 2011 to $11,248.2 million on a consensus basis. Including federal aid and other budget measures, SAF revenue totaled $13,784.1 million. Revenue Estimates: Fiscal Year 2012, Fiscal Year 2013, and Fiscal Year 2014 On January 13, 2012, the Administration and the House and Senate Fiscal Agencies reached a consensus on projected revenues for FY 2012, FY 2013, and FY 2014, and these estimates are used for the Governor’s FY 2013-FY 2014 Executive Budget. As reflected in these estimates, the Michigan economy is expected to continue to improve in 2012 through 2014, which will help boost tax and other revenue collections; however, some of this increase will be offset by the impact of the significant tax reform that was enacted in 2011 and became effective January 1, 2012. In FY 2012, GF/GP revenue on a consensus basis will increase an estimated 2.5 percent to $9,030.5 million and after factoring in transfers and other budget items, GF/GP revenue will total an estimated $8,910.1 million. On a consensus basis, SAF revenue will decline an estimated 4.3 percent to $10,763.6 million. This decline reflects the repeal of the MBT earmark to the SAF. Including federal aid and other budget measures, SAF revenue will total an estimated $12,540.3 million. In FY 2013, consensus based GF/GP revenue will total an estimated $9,034.6 million, which is essentially unchanged from FY 2012. Including transfers and other budget items, GF/GP revenue will total an estimated $8,684.0 million. Consensus based SAF revenue will increase 2.7 percent to $11,055.0 million in FY 2013; however, after factoring in federal aid and other budget measures, SAF revenue is expected to total $12,956.0 million. In FY 2014, GF/GP revenue is projected to increase 2.2 percent to $9,236.0 million on a consensus basis and will total an estimated $8,905.9 million including transfers and other budget items. School Aid Fund will increase an estimated 2.8 percent to $11,359.5 million on a consensus basis and including federal aid and other budget items will total an estimated $13,079.2 million. Overall Revenue: FY 2012, FY 2013, and FY 2014 Total net revenue for all funds is estimated to be $48,556.8 million in FY 2012, $48,676.6 million in FY 2013, and $49,131.0 million in FY 2014. A summary of revenues by fund is presented on page C-8. The Detailed Statement of General and Special Revenue Funds on pages C-9 to C-17 presents information for FY 2010 through FY 2014.
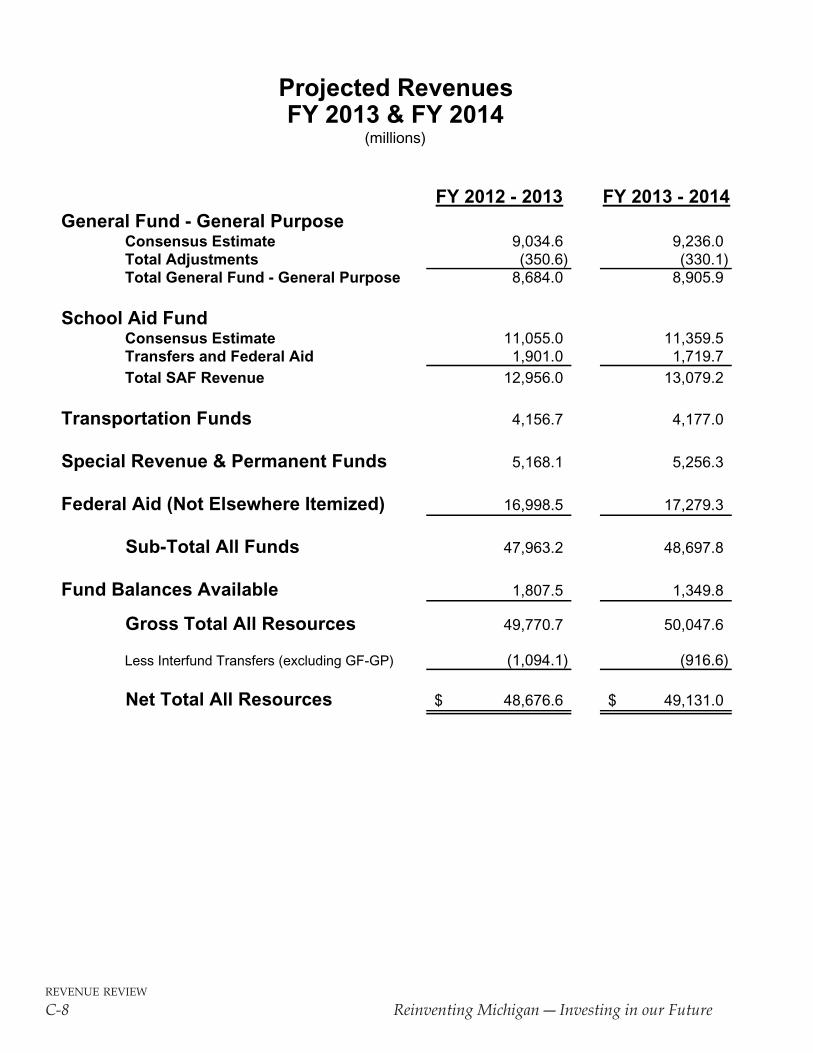
revenue review
C-8 ReinventingMichigan―InvestinginourFuture
Projected RevenuesFY 2013 & FY 2014
(millions)
FY 2012 - 2013 FY 2013 - 2014General Fund - General Purpose
Consensus Estimate 9,034.6 9,236.0Total Adjustments (350.6) (330.1)Total General Fund - General Purpose 8,684.0 8,905.9
School Aid FundConsensus Estimate 11,055.0 11,359.5Transfers and Federal Aid 1,901.0 1,719.7Total SAF Revenue 12,956.0 13,079.2
Transportation Funds 4,156.7 4,177.0
Special Revenue & Permanent Funds 5,168.1 5,256.3
Federal Aid (Not Elsewhere Itemized) 16,998.5 17,279.3
Sub-Total All Funds 47,963.2 48,697.8
Fund Balances Available 1,807.5 1,349.8
Gross Total All Resources 49,770.7 50,047.6
Less Interfund Transfers (excluding GF-GP) (1,094.1) (916.6)
Net Total All Resources 48,676.6$ 49,131.0$
Amounts may not tie to totals due to rounding.
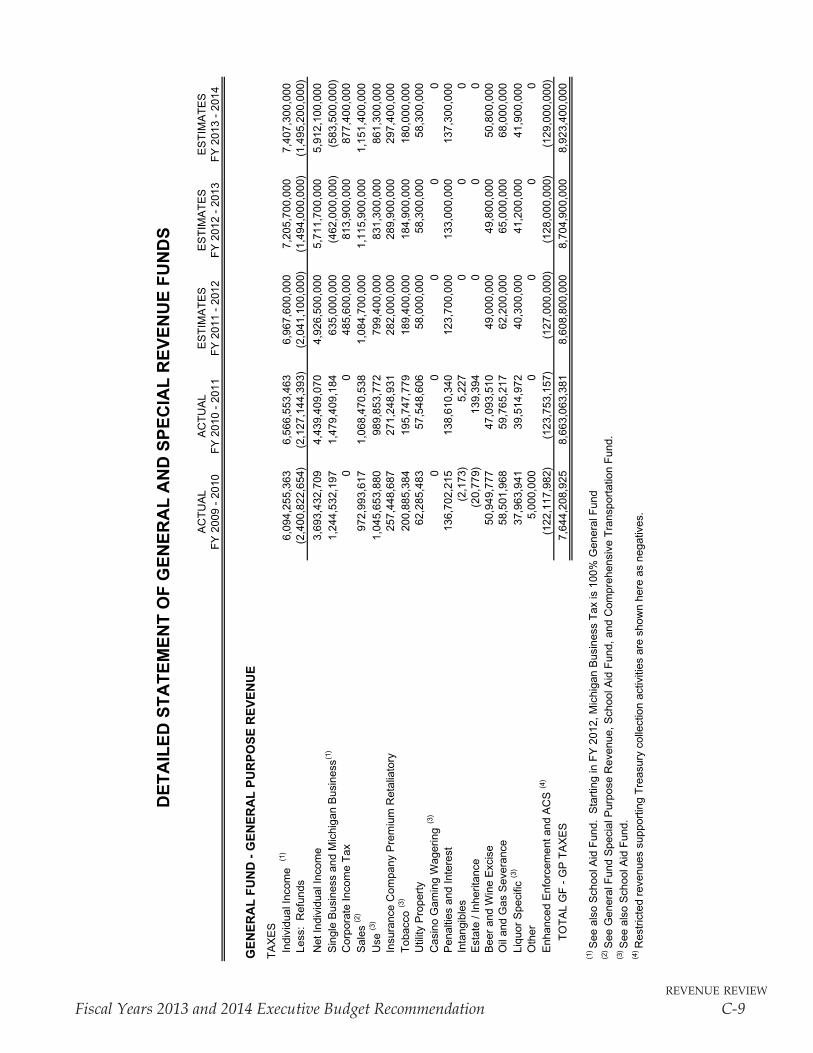
revenue review
Fiscal Years 2013 and 2014 Executive Budget Recommendation C-9
DE
TA
ILE
D S
TA
TE
ME
NT
OF
GE
NE
RA
L A
ND
SP
EC
IAL
RE
VE
NU
E F
UN
DS
AC
TU
AL
AC
TU
AL
ES
TIM
AT
ES
ES
TIM
AT
ES
ES
TIM
AT
ES
FY
200
9 -
2010
FY
201
0 -
2011
FY
201
1 -
2012
FY
201
2 -
2013
FY
201
3 -
2014
GE
NE
RA
L F
UN
D -
GE
NE
RA
L P
UR
PO
SE
RE
VE
NU
E
TA
XE
S I
ndiv
idua
l Inc
ome
(1)
6,09
4,25
5,36
36,
566,
553,
463
6,96
7,60
0,00
07,
205,
700,
000
7,40
7,30
0,00
0 L
ess:
Ref
unds
(2,4
00,8
22,6
54)
(2,1
27,1
44,3
93)
(2,0
41,1
00,0
00)
(1,4
94,0
00,0
00)
(1,4
95,2
00,0
00)
Net
Indi
vidu
al In
com
e
3,69
3,43
2,70
94,
439,
409,
070
4,92
6,50
0,00
05,
711,
700,
000
5,91
2,10
0,00
0 S
ingl
e B
usin
ess
and
Mic
higa
n B
usin
ess(1
)1,
244,
532,
197
1,47
9,40
9,18
463
5,00
0,00
0(4
62,0
00,0
00)
(583
,500
,000
) C
orpo
rate
Inco
me
Tax
00
485,
600,
000
813,
900,
000
877,
400,
000
Sal
es (2
)97
2,99
3,61
71,
068,
470,
538
1,08
4,70
0,00
01,
115,
900,
000
1,15
1,40
0,00
0 U
se (3
)1,
045,
653,
880
989,
853,
772
799,
400,
000
831,
300,
000
861,
300,
000
Ins
uran
ce C
ompa
ny P
rem
ium
Ret
alia
tory
257,
448,
687
271,
248,
931
282,
000,
000
289,
900,
000
297,
400,
000
Tob
acco
(3)
200,
885,
384
195,
747,
779
189,
400,
000
184,
900,
000
180,
000,
000
Util
ity P
rope
rty
62,2
85,4
8357
,548
,606
58,0
00,0
0058
,300
,000
58,3
00,0
00 C
asin
o G
amin
g W
ager
ing
(3)
00
00
0 P
enal
ties
and
Inte
rest
136,
702,
215
138,
610,
340
123,
700,
000
133,
000,
000
137,
300,
000
Int
angi
bles
(2,1
73)
5,22
70
00
Est
ate
/ Inh
erita
nce
(20,
779)
139,
394
00
0 B
eer
and
Win
e E
xcis
e50
,949
,777
47,0
93,5
1049
,000
,000
49,8
00,0
0050
,800
,000
Oil
and
Gas
Sev
eran
ce58
,501
,968
59,7
65,2
1762
,200
,000
65,0
00,0
0068
,000
,000
Liq
uor
Spe
cific
(3)
37,9
63,9
4139
,514
,972
40,3
00,0
0041
,200
,000
41,9
00,0
00 O
ther
5,00
0,00
00
00
0 E
nhan
ced
Enf
orce
men
t and
AC
S (4
)(1
22,1
17,9
82)
(123
,753
,157
)(1
27,0
00,0
00)
(128
,000
,000
)(1
29,0
00,0
00)
TO
TA
L G
F -
GP
TA
XE
S
7,64
4,20
8,92
58,
663,
063,
381
8,60
8,80
0,00
08,
704,
900,
000
8,92
3,40
0,00
0
(1)S
ee a
lso
Sch
ool A
id F
und.
Sta
rtin
g in
FY
201
2, M
ichi
gan
Bus
ines
s T
ax is
100
% G
ener
al F
und
(2)S
ee G
ener
al F
und
Spe
cial
Pur
pose
Rev
enue
, Sch
ool A
id F
und,
and
Com
preh
ensi
ve T
rans
port
atio
n F
und.
(3)S
ee a
lso
Sch
ool A
id F
und.
(4)R
estr
icte
d re
venu
es s
uppo
rtin
g T
reas
ury
colle
ctio
n ac
tiviti
es a
re s
how
n he
re a
s ne
gativ
es.
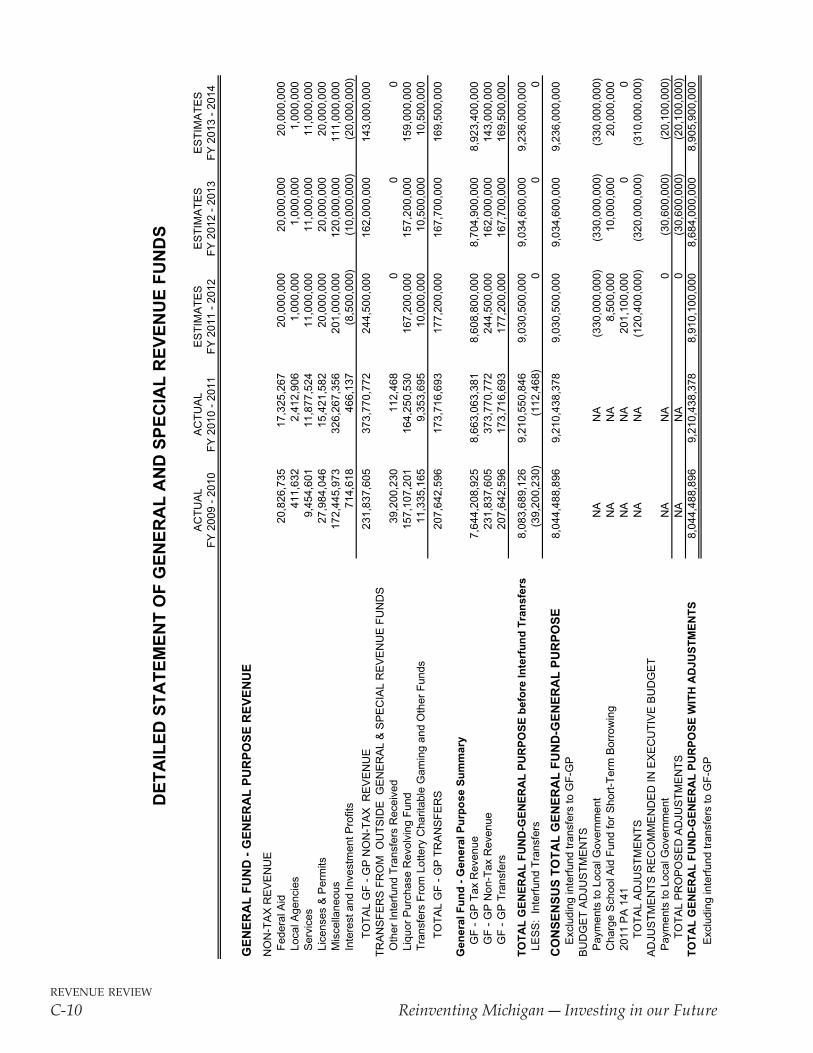
revenue review
C-10 ReinventingMichigan―InvestinginourFuture
DE
TA
ILE
D S
TA
TE
ME
NT
OF
GE
NE
RA
L A
ND
SP
EC
IAL
RE
VE
NU
E F
UN
DS
AC
TU
AL
AC
TU
AL
ES
TIM
AT
ES
ES
TIM
AT
ES
ES
TIM
AT
ES
FY
200
9 -
2010
FY
201
0 -
2011
FY
201
1 -
2012
FY
201
2 -
2013
FY
201
3 -
2014
GE
NE
RA
L F
UN
D -
GE
NE
RA
L P
UR
PO
SE
RE
VE
NU
E
NO
N-T
AX
RE
VE
NU
E F
eder
al A
id20
,826
,735
17,3
25,2
6720
,000
,000
20,0
00,0
0020
,000
,000
Loc
al A
genc
ies
411,
632
2,41
2,90
61,
000,
000
1,00
0,00
01,
000,
000
Ser
vice
s 9,
454,
601
11,8
77,5
2411
,000
,000
11,0
00,0
0011
,000
,000
Lic
ense
s &
Per
mits
27
,984
,046
15,4
21,5
8220
,000
,000
20,0
00,0
0020
,000
,000
Mis
cella
neou
s17
2,44
5,97
332
6,26
7,35
620
1,00
0,00
012
0,00
0,00
011
1,00
0,00
0 I
nter
est a
nd In
vest
men
t Pro
fits
714,
618
466,
137
(8,5
00,0
00)
(10,
000,
000)
(20,
000,
000)
TO
TA
L G
F -
GP
NO
N-T
AX
RE
VE
NU
E23
1,83
7,60
537
3,77
0,77
224
4,50
0,00
016
2,00
0,00
014
3,00
0,00
0T
RA
NS
FE
RS
FR
OM
OU
TS
IDE
GE
NE
RA
L &
SP
EC
IAL
RE
VE
NU
E F
UN
DS
Oth
er In
terf
und
Tra
nsfe
rs R
ecei
ved
39,2
00,2
3011
2,46
80
00
Liq
uor
Pur
chas
e R
evol
ving
Fun
d15
7,10
7,20
116
4,25
0,53
016
7,20
0,00
015
7,20
0,00
015
9,00
0,00
0 T
rans
fers
Fro
m L
otte
ry C
harit
able
Gam
ing
and
Oth
er F
unds
11,3
35,1
659,
353,
695
10,0
00,0
0010
,500
,000
10,5
00,0
00
TO
TA
L G
F -
GP
TR
AN
SF
ER
S20
7,64
2,59
617
3,71
6,69
317
7,20
0,00
016
7,70
0,00
016
9,50
0,00
0
Gen
eral
Fu
nd
- G
ener
al P
urp
ose
Su
mm
ary
G
F -
GP
Tax
Rev
enue
7,64
4,20
8,92
58,
663,
063,
381
8,60
8,80
0,00
08,
704,
900,
000
8,92
3,40
0,00
0
GF
- G
P N
on-T
ax R
even
ue23
1,83
7,60
537
3,77
0,77
224
4,50
0,00
016
2,00
0,00
014
3,00
0,00
0
GF
- G
P T
rans
fers
207,
642,
596
173,
716,
693
177,
200,
000
167,
700,
000
169,
500,
000
TO
TA
L G
EN
ER
AL
FU
ND
-GE
NE
RA
L P
UR
PO
SE
bef
ore
Inte
rfu
nd
Tra
nsf
ers
8,08
3,68
9,12
69,
210,
550,
846
9,03
0,50
0,00
09,
034,
600,
000
9,23
6,00
0,00
0 L
ES
S:
Inte
rfun
d T
rans
fers
(39,
200,
230)
(112
,468
)0
00
CO
NS
EN
SU
S T
OT
AL
GE
NE
RA
L F
UN
D-G
EN
ER
AL
PU
RP
OS
E8,
044,
488,
896
9,21
0,43
8,37
89,
030,
500,
000
9,03
4,60
0,00
09,
236,
000,
000
E
xclu
ding
inte
rfun
d tr
ansf
ers
to G
F-G
PB
UD
GE
T A
DJU
ST
ME
NT
S P
aym
ents
to L
ocal
Gov
ernm
ent
NA
NA
(330
,000
,000
)(3
30,0
00,0
00)
(330
,000
,000
) C
harg
e S
choo
l Aid
Fun
d fo
r S
hort
-Ter
m B
orro
win
gN
AN
A8,
500,
000
10,0
00,0
0020
,000
,000
201
1 P
A 1
41N
AN
A20
1,10
0,00
00
0
T
OT
AL
AD
JUS
TM
EN
TS
NA
NA
(120
,400
,000
)(3
20,0
00,0
00)
(310
,000
,000
)A
DJU
ST
ME
NT
S R
EC
OM
ME
ND
ED
IN E
XE
CU
TIV
E B
UD
GE
T P
aym
ents
to L
ocal
Gov
ernm
ent
NA
NA
0(3
0,60
0,00
0)(2
0,10
0,00
0)
T
OT
AL
PR
OP
OS
ED
AD
JUS
TM
EN
TS
NA
NA
0(3
0,60
0,00
0)(2
0,10
0,00
0)T
OT
AL
GE
NE
RA
L F
UN
D-G
EN
ER
AL
PU
RP
OS
E W
ITH
AD
JUS
TM
EN
TS
8,
044,
488,
896
9,21
0,43
8,37
88,
910,
100,
000
8,68
4,00
0,00
08,
905,
900,
000
E
xclu
ding
inte
rfun
d tr
ansf
ers
to G
F-G
P
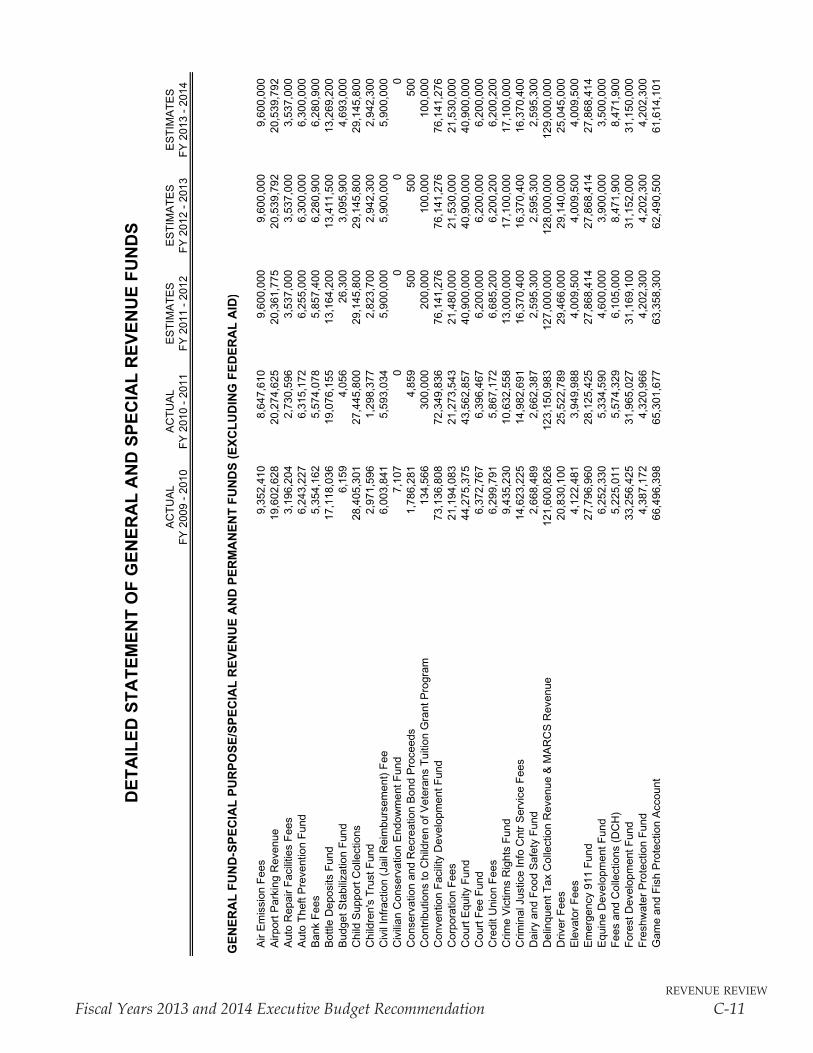
revenue review
Fiscal Years 2013 and 2014 Executive Budget Recommendation C-11
DE
TA
ILE
D S
TA
TE
ME
NT
OF
GE
NE
RA
L A
ND
SP
EC
IAL
RE
VE
NU
E F
UN
DS
AC
TU
AL
AC
TU
AL
ES
TIM
AT
ES
ES
TIM
AT
ES
ES
TIM
AT
ES
FY
200
9 -
2010
FY
201
0 -
2011
FY
201
1 -
2012
FY
201
2 -
2013
FY
201
3 -
2014
GE
NE
RA
L F
UN
D-S
PE
CIA
L P
UR
PO
SE
/SP
EC
IAL
RE
VE
NU
E A
ND
PE
RM
AN
EN
T F
UN
DS
(E
XC
LU
DIN
G F
ED
ER
AL
AID
)
Air
Em
issi
on F
ees
9,35
2,41
08,
647,
610
9,60
0,00
09,
600,
000
9,60
0,00
0 A
irpor
t Par
king
Rev
enue
19,6
02,6
2820
,274
,625
20,3
61,7
7520
,539
,792
20,5
39,7
92 A
uto
Rep
air
Fac
ilitie
s F
ees
3,19
6,20
42,
730,
596
3,53
7,00
03,
537,
000
3,53
7,00
0 A
uto
The
ft P
reve
ntio
n F
und
6,24
3,22
76,
315,
172
6,25
5,00
06,
300,
000
6,30
0,00
0 B
ank
Fee
s5,
354,
162
5,57
4,07
85,
857,
400
6,28
0,90
06,
280,
900
Bot
tle D
epos
its F
und
17,1
18,0
3619
,076
,155
13,1
64,2
0013
,411
,500
13,2
69,2
00 B
udge
t Sta
biliz
atio
n F
und
6,15
94,
056
26,3
003,
095,
900
4,69
3,00
0 C
hild
Sup
port
Col
lect
ions
28,4
05,3
0127
,445
,800
29,1
45,8
0029
,145
,800
29,1
45,8
00 C
hild
ren'
s T
rust
Fun
d2,
971,
596
1,29
8,37
72,
823,
700
2,94
2,30
02,
942,
300
Civ
il In
frac
tion
(Jai
l Rei
mbu
rsem
ent)
Fee
6,00
3,84
15,
593,
034
5,90
0,00
05,
900,
000
5,90
0,00
0 C
ivili
an C
onse
rvat
ion
End
owm
ent F
und
7,10
70
00
0 C
onse
rvat
ion
and
Rec
reat
ion
Bon
d P
roce
eds
1,78
6,28
14,
859
500
500
500
Con
trib
utio
ns to
Chi
ldre
n of
Vet
eran
s T
uitio
n G
rant
Pro
gram
134,
566
300,
000
200,
000
100,
000
100,
000
Con
vent
ion
Fac
ility
Dev
elop
men
t Fun
d73
,136
,808
72,3
49,8
3676
,141
,276
76,1
41,2
7676
,141
,276
Cor
pora
tion
Fee
s21
,194
,083
21,2
73,5
4321
,480
,000
21,5
30,0
0021
,530
,000
Cou
rt E
quity
Fun
d44
,275
,375
43,5
62,8
5740
,900
,000
40,9
00,0
0040
,900
,000
Cou
rt F
ee F
und
6,37
2,76
76,
396,
467
6,20
0,00
06,
200,
000
6,20
0,00
0 C
redi
t Uni
on F
ees
6,29
9,79
15,
867,
172
6,68
5,20
06,
200,
200
6,20
0,20
0 C
rime
Vic
tims
Rig
hts
Fun
d9,
435,
230
10,6
32,5
5813
,000
,000
17,1
00,0
0017
,100
,000
Crim
inal
Jus
tice
Info
Cnt
r S
ervi
ce F
ees
14,6
23,2
2514
,982
,691
16,3
70,4
0016
,370
,400
16,3
70,4
00 D
airy
and
Foo
d S
afet
y F
und
2,66
8,48
92,
662,
387
2,59
5,30
02,
595,
300
2,59
5,30
0 D
elin
quen
t Tax
Col
lect
ion
Rev
enue
& M
AR
CS
Rev
enue
121,
600,
826
123,
150,
983
127,
000,
000
128,
000,
000
129,
000,
000
Driv
er F
ees
20,8
30,1
0025
,522
,789
29,4
66,0
0029
,140
,000
25,0
45,0
00 E
leva
tor
Fee
s4,
122,
481
3,94
9,98
84,
009,
500
4,00
9,50
04,
009,
500
Em
erge
ncy
911
Fun
d27
,796
,960
28,1
25,4
2527
,868
,414
27,8
68,4
1427
,868
,414
Equ
ine
Dev
elop
men
t Fun
d6,
252,
330
5,33
4,59
04,
600,
000
3,90
0,00
03,
500,
000
Fee
s an
d C
olle
ctio
ns (
DC
H)
5,22
5,01
15,
574,
329
6,10
5,00
08,
471,
900
8,47
1,90
0 F
ores
t Dev
elop
men
t Fun
d33
,256
,425
31,9
65,0
2731
,169
,100
31,1
52,0
0031
,150
,000
Fre
shw
ater
Pro
tect
ion
Fun
d4,
387,
172
4,32
0,96
64,
202,
300
4,20
2,30
04,
202,
300
Gam
e an
d F
ish
Pro
tect
ion
Acc
ount
66,4
96,3
9865
,301
,677
63,3
58,3
0062
,490
,500
61,6
14,1
01
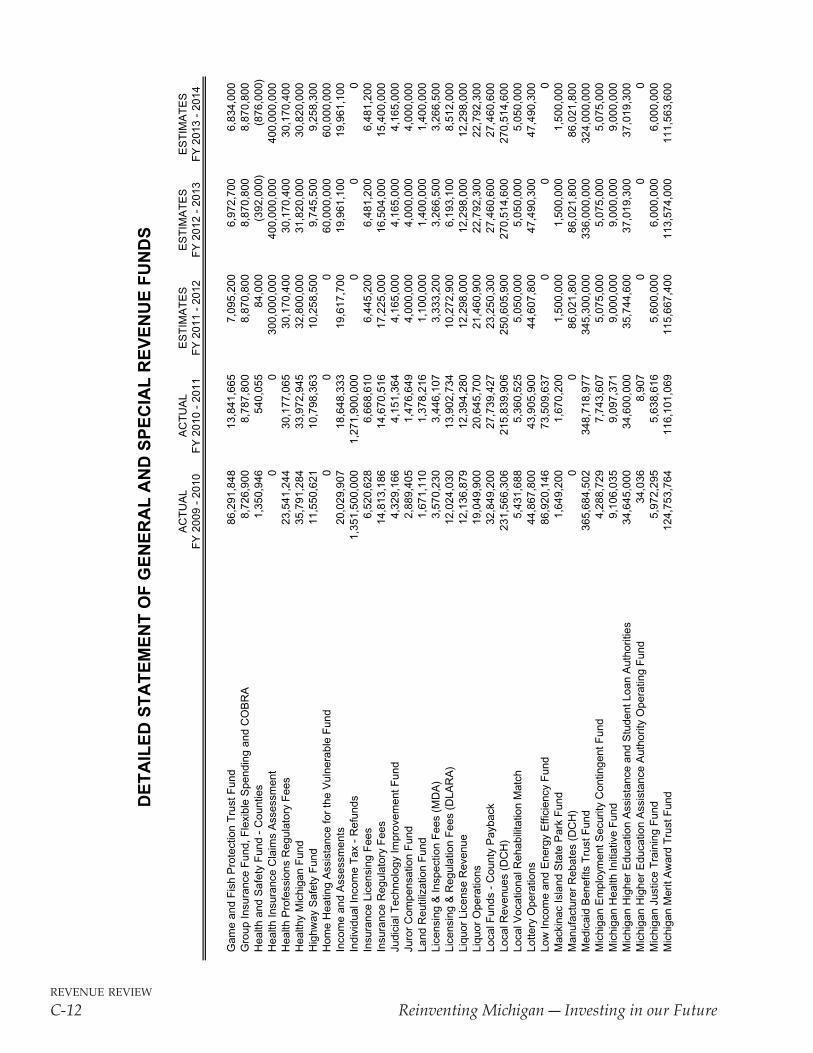
revenue review
C-12 ReinventingMichigan―InvestinginourFuture
DE
TA
ILE
D S
TA
TE
ME
NT
OF
GE
NE
RA
L A
ND
SP
EC
IAL
RE
VE
NU
E F
UN
DS
AC
TU
AL
AC
TU
AL
ES
TIM
AT
ES
ES
TIM
AT
ES
ES
TIM
AT
ES
FY
200
9 -
2010
FY
201
0 -
2011
FY
201
1 -
2012
FY
201
2 -
2013
FY
201
3 -
2014
Gam
e an
d F
ish
Pro
tect
ion
Tru
st F
und
86,2
91,8
4813
,841
,665
7,09
5,20
06,
972,
700
6,83
4,00
0 G
roup
Insu
ranc
e F
und,
Fle
xibl
e S
pend
ing
and
CO
BR
A8,
726,
900
8,78
7,80
08,
870,
800
8,87
0,80
08,
870,
800
Hea
lth a
nd S
afet
y F
und
- C
ount
ies
1,35
0,94
654
0,05
584
,000
(392
,000
)(8
76,0
00)
Hea
lth In
sura
nce
Cla
ims
Ass
essm
ent
00
300,
000,
000
400,
000,
000
400,
000,
000
Hea
lth P
rofe
ssio
ns R
egul
ator
y F
ees
23,5
41,2
4430
,177
,065
30,1
70,4
0030
,170
,400
30,1
70,4
00 H
ealth
y M
ichi
gan
Fun
d35
,791
,284
33,9
72,9
4532
,800
,000
31,8
20,0
0030
,820
,000
Hig
hway
Saf
ety
Fun
d11
,550
,621
10,7
98,3
6310
,258
,500
9,74
5,50
09,
258,
300
Hom
e H
eatin
g A
ssis
tanc
e fo
r th
e V
ulne
rabl
e F
und
00
060
,000
,000
60,0
00,0
00 I
ncom
e an
d A
sses
smen
ts20
,029
,907
18,6
48,3
3319
,617
,700
19,9
61,1
0019
,961
,100
Ind
ivid
ual I
ncom
e T
ax -
Ref
unds
1,35
1,50
0,00
01,
271,
900,
000
00
0 I
nsur
ance
Lic
ensi
ng F
ees
6,52
0,62
86,
668,
610
6,44
5,20
06,
481,
200
6,48
1,20
0 I
nsur
ance
Reg
ulat
ory
Fee
s14
,813
,186
14,6
70,5
1617
,225
,000
16,5
04,0
0015
,400
,000
Jud
icia
l Tec
hnol
ogy
Impr
ovem
ent F
und
4,32
9,16
64,
151,
364
4,16
5,00
04,
165,
000
4,16
5,00
0 J
uror
Com
pens
atio
n F
und
2,88
9,40
51,
476,
649
4,00
0,00
04,
000,
000
4,00
0,00
0 L
and
Reu
tiliz
atio
n F
und
1,67
1,11
01,
378,
216
1,10
0,00
01,
400,
000
1,40
0,00
0 L
icen
sing
& In
spec
tion
Fee
s (M
DA
)3,
570,
230
3,44
6,10
73,
333,
200
3,26
6,50
03,
266,
500
Lic
ensi
ng &
Reg
ulat
ion
Fee
s (D
LAR
A)
12,0
24,0
3013
,902
,734
10,2
72,9
006,
193,
100
8,51
2,00
0 L
iquo
r Li
cens
e R
even
ue12
,136
,879
12,3
94,2
8012
,298
,000
12,2
98,0
0012
,298
,000
Liq
uor
Ope
ratio
ns
19,0
49,9
0020
,645
,700
21,4
60,9
0022
,792
,300
22,7
92,3
00 L
ocal
Fun
ds -
Cou
nty
Pay
back
32,8
49,2
0027
,739
,427
23,2
50,3
0027
,460
,600
27,4
60,6
00 L
ocal
Rev
enue
s (D
CH
)23
1,56
6,30
621
5,83
9,90
625
0,60
5,90
027
0,51
4,60
027
0,51
4,60
0 L
ocal
Voc
atio
nal R
ehab
ilita
tion
Mat
ch5,
431,
688
5,36
0,52
55,
050,
000
5,05
0,00
05,
050,
000
Lot
tery
Ope
ratio
ns
44,8
67,8
0043
,905
,900
44,6
07,8
0047
,490
,300
47,4
90,3
00 L
ow In
com
e an
d E
nerg
y E
ffici
ency
Fun
d86
,920
,146
73,5
09,6
370
00
Mac
kina
c Is
land
Sta
te P
ark
Fun
d1,
649,
200
1,67
0,20
01,
500,
000
1,50
0,00
01,
500,
000
Man
ufac
ture
r R
ebat
es (
DC
H)
00
86,0
21,8
0086
,021
,800
86,0
21,8
00 M
edic
aid
Ben
efits
Tru
st F
und
365,
684,
502
348,
718,
977
345,
300,
000
336,
000,
000
324,
000,
000
Mic
higa
n E
mpl
oym
ent S
ecur
ity C
ontin
gent
Fun
d4,
288,
729
7,74
3,60
75,
075,
000
5,07
5,00
05,
075,
000
Mic
higa
n H
ealth
Initi
ativ
e F
und
9,10
6,03
59,
097,
371
9,00
0,00
09,
000,
000
9,00
0,00
0 M
ichi
gan
Hig
her
Edu
catio
n A
ssis
tanc
e an
d S
tude
nt L
oan
Aut
horit
ies
34,6
45,0
0034
,600
,000
35,7
44,6
0037
,019
,300
37,0
19,3
00 M
ichi
gan
Hig
her
Edu
catio
n A
ssis
tanc
e A
utho
rity
Ope
ratin
g F
und
34,0
368,
907
00
0 M
ichi
gan
Just
ice
Tra
inin
g F
und
5,97
2,29
55,
638,
616
5,60
0,00
06,
000,
000
6,00
0,00
0 M
ichi
gan
Mer
it A
war
d T
rust
Fun
d12
4,75
3,76
411
6,10
1,06
911
5,66
7,40
011
3,57
4,00
011
1,56
3,60
0
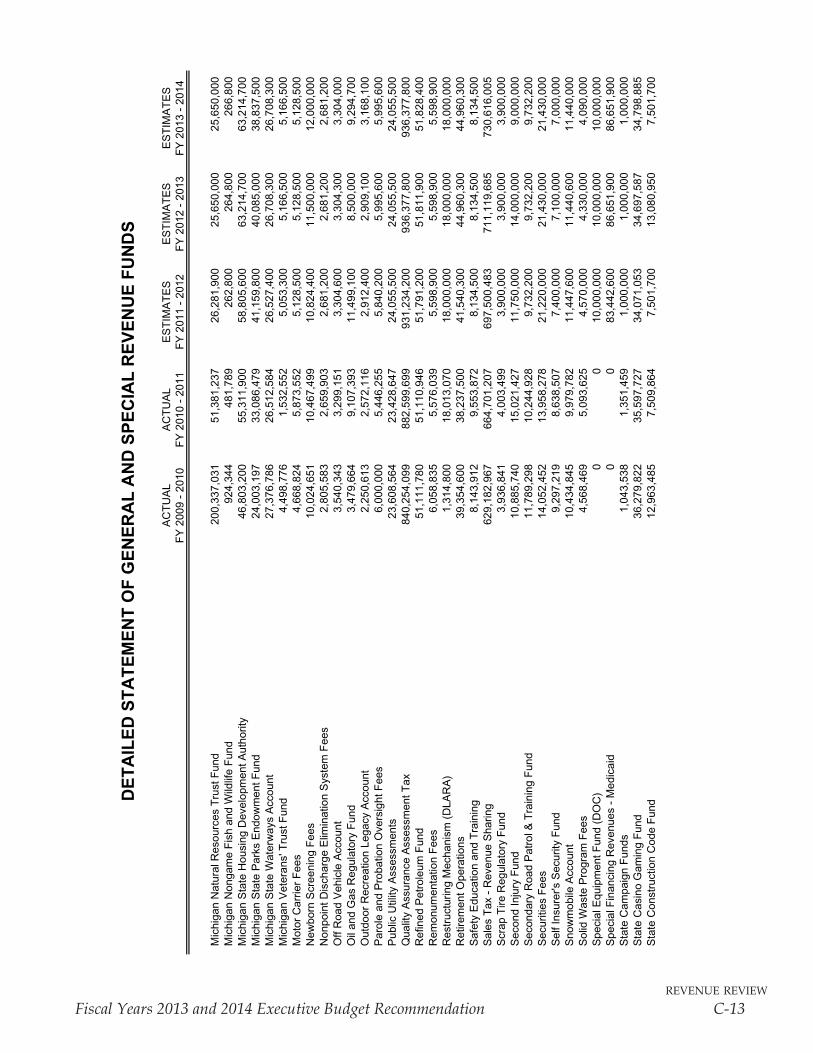
revenue review
Fiscal Years 2013 and 2014 Executive Budget Recommendation C-13
DE
TA
ILE
D S
TA
TE
ME
NT
OF
GE
NE
RA
L A
ND
SP
EC
IAL
RE
VE
NU
E F
UN
DS
AC
TU
AL
AC
TU
AL
ES
TIM
AT
ES
ES
TIM
AT
ES
ES
TIM
AT
ES
FY
200
9 -
2010
FY
201
0 -
2011
FY
201
1 -
2012
FY
201
2 -
2013
FY
201
3 -
2014
Mic
higa
n N
atur
al R
esou
rces
Tru
st F
und
200,
337,
031
51,3
81,2
3726
,281
,900
25,6
50,0
0025
,650
,000
Mic
higa
n N
onga
me
Fis
h an
d W
ildlif
e F
und
924,
344
481,
789
262,
800
264,
800
266,
800
Mic
higa
n S
tate
Hou
sing
Dev
elop
men
t Aut
horit
y46
,803
,200
55,3
11,9
0058
,805
,600
63,2
14,7
0063
,214
,700
Mic
higa
n S
tate
Par
ks E
ndow
men
t Fun
d 24
,003
,197
33,0
86,4
7941
,159
,800
40,0
85,0
0038
,837
,500
Mic
higa
n S
tate
Wat
erw
ays
Acc
ount
27,3
76,7
8626
,512
,584
26,5
27,4
0026
,708
,300
26,7
08,3
00 M
ichi
gan
Vet
eran
s' T
rust
Fun
d4,
498,
776
1,53
2,55
25,
053,
300
5,16
6,50
05,
166,
500
Mot
or C
arrie
r F
ees
4,66
8,82
45,
873,
552
5,12
8,50
05,
128,
500
5,12
8,50
0 N
ewbo
rn S
cree
ning
Fee
s10
,024
,651
10,4
67,4
9910
,824
,400
11,5
00,0
0012
,000
,000
Non
poin
t Dis
char
ge E
limin
atio
n S
yste
m F
ees
2,80
5,58
32,
659,
903
2,68
1,20
02,
681,
200
2,68
1,20
0 O
ff R
oad
Veh
icle
Acc
ount
3,54
0,34
33,
299,
151
3,30
4,60
03,
304,
300
3,30
4,00
0 O
il an
d G
as R
egul
ator
y F
und
3,47
9,66
49,
107,
393
11,4
99,1
008,
500,
000
9,29
4,70
0 O
utdo
or R
ecre
atio
n Le
gacy
Acc
ount
2,25
0,61
32,
572,
116
2,91
2,40
02,
909,
100
3,16
8,10
0 P
arol
e an
d P
roba
tion
Ove
rsig
ht F
ees
6,00
0,00
05,
446,
255
5,84
0,20
05,
995,
600
5,99
5,60
0 P
ublic
Util
ity A
sses
smen
ts23
,608
,564
23,4
28,6
4724
,055
,500
24,0
55,5
0024
,055
,500
Qua
lity
Ass
uran
ce A
sses
smen
t Tax
840,
254,
099
882,
599,
699
931,
234,
200
936,
377,
800
936,
377,
800
Ref
ined
Pet
role
um F
und
51,1
11,7
8051
,110
,946
51,7
91,2
0051
,811
,900
51,8
28,4
00 R
emon
umen
tatio
n F
ees
6,05
8,83
55,
576,
039
5,59
8,90
05,
598,
900
5,59
8,90
0 R
estr
uctu
ring
Mec
hani
sm (
DLA
RA
)1,
314,
800
18,0
13,0
7018
,000
,000
18,0
00,0
0018
,000
,000
Ret
irem
ent O
pera
tions
39
,354
,600
38,2
37,5
0041
,540
,300
44,9
60,3
0044
,960
,300
Saf
ety
Edu
catio
n an
d T
rain
ing
8,14
3,91
29,
553,
872
8,13
4,50
08,
134,
500
8,13
4,50
0 S
ales
Tax
- R
even
ue S
harin
g62
9,18
2,96
766
4,70
1,20
769
7,50
0,48
371
1,11
9,68
573
0,61
6,00
5 S
crap
Tire
Reg
ulat
ory
Fun
d3,
936,
841
4,00
3,49
93,
900,
000
3,90
0,00
03,
900,
000
Sec
ond
Inju
ry F
und
10,8
85,7
4015
,021
,427
11,7
50,0
0014
,000
,000
9,00
0,00
0 S
econ
dary
Roa
d P
atro
l & T
rain
ing
Fun
d11
,789
,298
10,2
44,9
289,
732,
200
9,73
2,20
09,
732,
200
Sec
uriti
es F
ees
14,0
52,4
5213
,958
,278
21,2
20,0
0021
,430
,000
21,4
30,0
00 S
elf I
nsur
er's
Sec
urity
Fun
d9,
297,
219
8,63
8,50
77,
400,
000
7,10
0,00
07,
000,
000
Sno
wm
obile
Acc
ount
10,4
34,8
459,
979,
782
11,4
47,6
0011
,440
,600
11,4
40,0
00 S
olid
Was
te P
rogr
am F
ees
4,56
8,46
95,
093,
625
4,57
0,00
04,
330,
000
4,09
0,00
0 S
peci
al E
quip
men
t Fun
d (D
OC
)0
010
,000
,000
10,0
00,0
0010
,000
,000
Spe
cial
Fin
anci
ng R
even
ues
- M
edic
aid
00
83,4
42,6
0086
,651
,900
86,6
51,9
00 S
tate
Cam
paig
n F
unds
1,04
3,53
81,
351,
459
1,00
0,00
01,
000,
000
1,00
0,00
0 S
tate
Cas
ino
Gam
ing
Fun
d36
,279
,822
35,5
97,7
2734
,071
,053
34,6
97,5
8734
,798
,885
Sta
te C
onst
ruct
ion
Cod
e F
und
12,9
63,4
857,
509,
864
7,50
1,70
013
,080
,950
7,50
1,70
0
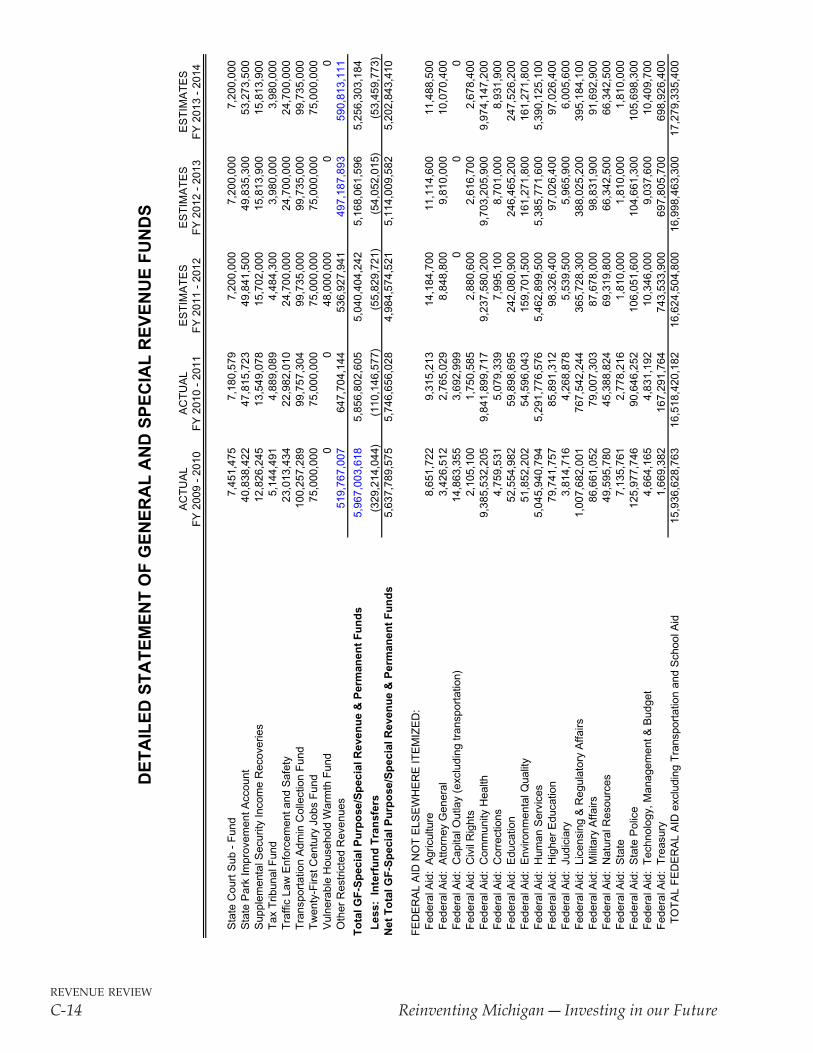
revenue review
C-14 ReinventingMichigan―InvestinginourFuture
DE
TA
ILE
D S
TA
TE
ME
NT
OF
GE
NE
RA
L A
ND
SP
EC
IAL
RE
VE
NU
E F
UN
DS
AC
TU
AL
AC
TU
AL
ES
TIM
AT
ES
ES
TIM
AT
ES
ES
TIM
AT
ES
FY
200
9 -
2010
FY
201
0 -
2011
FY
201
1 -
2012
FY
201
2 -
2013
FY
201
3 -
2014
Sta
te C
ourt
Sub
- F
und
7,45
1,47
57,
180,
579
7,20
0,00
07,
200,
000
7,20
0,00
0 S
tate
Par
k Im
prov
emen
t Acc
ount
40,8
38,4
2247
,815
,723
49,8
41,5
0049
,835
,300
53,2
73,5
00 S
uppl
emen
tal S
ecur
ity In
com
e R
ecov
erie
s12
,826
,245
13,5
49,0
7815
,702
,000
15,8
13,9
0015
,813
,900
Tax
Trib
unal
Fun
d5,
144,
491
4,88
9,08
94,
484,
300
3,98
0,00
03,
980,
000
Tra
ffic
Law
Enf
orce
men
t and
Saf
ety
23,0
13,4
3422
,982
,010
24,7
00,0
0024
,700
,000
24,7
00,0
00 T
rans
port
atio
n A
dmin
Col
lect
ion
Fun
d10
0,25
7,28
999
,757
,304
99,7
35,0
0099
,735
,000
99,7
35,0
00 T
wen
ty-F
irst C
entu
ry J
obs
Fun
d75
,000
,000
75,0
00,0
0075
,000
,000
75,0
00,0
0075
,000
,000
Vul
nera
ble
Hou
seho
ld W
arm
th F
und
00
48,0
00,0
000
0 O
ther
Res
tric
ted
Rev
enue
s51
9,76
7,00
764
7,70
4,14
453
6,92
7,94
149
7,18
7,89
359
0,81
3,11
1
To
tal G
F-S
pec
ial P
urp
ose
/Sp
ecia
l Rev
enu
e &
Per
man
ent
Fu
nd
s5,
967,
003,
618
5,85
6,80
2,60
55,
040,
404,
242
5,16
8,06
1,59
65,
256,
303,
184
Les
s: I
nte
rfu
nd
Tra
nsf
ers
(329
,214
,044
)(1
10,1
46,5
77)
(55,
829,
721)
(54,
052,
015)
(53,
459,
773)
Net
To
tal G
F-S
pec
ial P
urp
ose
/Sp
ecia
l Rev
enu
e &
Per
man
ent
Fu
nd
s5,
637,
789,
575
5,74
6,65
6,02
84,
984,
574,
521
5,11
4,00
9,58
25,
202,
843,
410
FE
DE
RA
L A
ID N
OT
ELS
EW
HE
RE
ITE
MIZ
ED
: F
eder
al A
id:
Agr
icul
ture
8,65
1,72
29,
315,
213
14,1
84,7
0011
,114
,600
11,4
88,5
00 F
eder
al A
id:
Atto
rney
Gen
eral
3,42
6,51
22,
765,
029
8,84
8,80
09,
810,
000
10,0
70,4
00 F
eder
al A
id:
Cap
ital O
utla
y (e
xclu
ding
tran
spor
tatio
n)14
,863
,355
3,69
2,99
90
00
Fed
eral
Aid
: C
ivil
Rig
hts
2,10
5,10
01,
750,
585
2,88
0,60
02,
616,
700
2,67
8,40
0 F
eder
al A
id:
Com
mun
ity H
ealth
9,38
5,53
2,20
59,
841,
899,
717
9,23
7,58
0,20
09,
703,
205,
900
9,97
4,14
7,20
0 F
eder
al A
id:
Cor
rect
ions
4,75
9,53
15,
079,
339
7,99
5,10
08,
701,
000
8,93
1,90
0 F
eder
al A
id:
Edu
catio
n52
,554
,982
59,8
98,6
9524
2,08
0,90
024
6,46
5,20
024
7,52
6,20
0 F
eder
al A
id:
Env
ironm
enta
l Qua
lity
51,8
52,2
0254
,596
,043
159,
701,
500
161,
271,
800
161,
271,
800
Fed
eral
Aid
: H
uman
Ser
vice
s5,
045,
940,
794
5,29
1,77
6,57
65,
462,
899,
500
5,38
5,77
1,60
05,
390,
125,
100
Fed
eral
Aid
: H
ighe
r E
duca
tion
79,7
41,7
5785
,891
,312
98,3
26,4
0097
,026
,400
97,0
26,4
00 F
eder
al A
id:
Judi
ciar
y3,
814,
716
4,26
8,87
85,
539,
500
5,96
5,90
06,
005,
600
Fed
eral
Aid
: Li
cens
ing
& R
egul
ator
y A
ffairs
1,00
7,68
2,00
176
7,54
2,24
436
5,72
8,30
038
8,02
5,20
039
5,18
4,10
0 F
eder
al A
id:
Mili
tary
Affa
irs86
,661
,052
79,0
07,3
0387
,678
,000
98,8
31,9
0091
,692
,900
Fed
eral
Aid
: N
atur
al R
esou
rces
49
,595
,780
45,3
88,8
2469
,319
,800
66,3
42,5
0066
,342
,500
Fed
eral
Aid
: S
tate
7,13
5,76
12,
778,
216
1,81
0,00
01,
810,
000
1,81
0,00
0 F
eder
al A
id:
Sta
te P
olic
e12
5,97
7,74
690
,646
,252
106,
051,
600
104,
661,
300
105,
698,
300
Fed
eral
Aid
: T
echn
olog
y, M
anag
emen
t & B
udge
t4,
664,
165
4,83
1,19
210
,346
,000
9,03
7,60
010
,409
,700
Fed
eral
Aid
: T
reas
ury
1,66
9,38
216
7,29
1,76
474
3,53
3,90
069
7,80
5,70
069
8,92
6,40
0
TO
TA
L F
ED
ER
AL
AID
exc
ludi
ng T
rans
port
atio
n an
d S
choo
l Aid
15,9
36,6
28,7
6316
,518
,420
,182
16,6
24,5
04,8
0016
,998
,463
,300
17,2
79,3
35,4
00
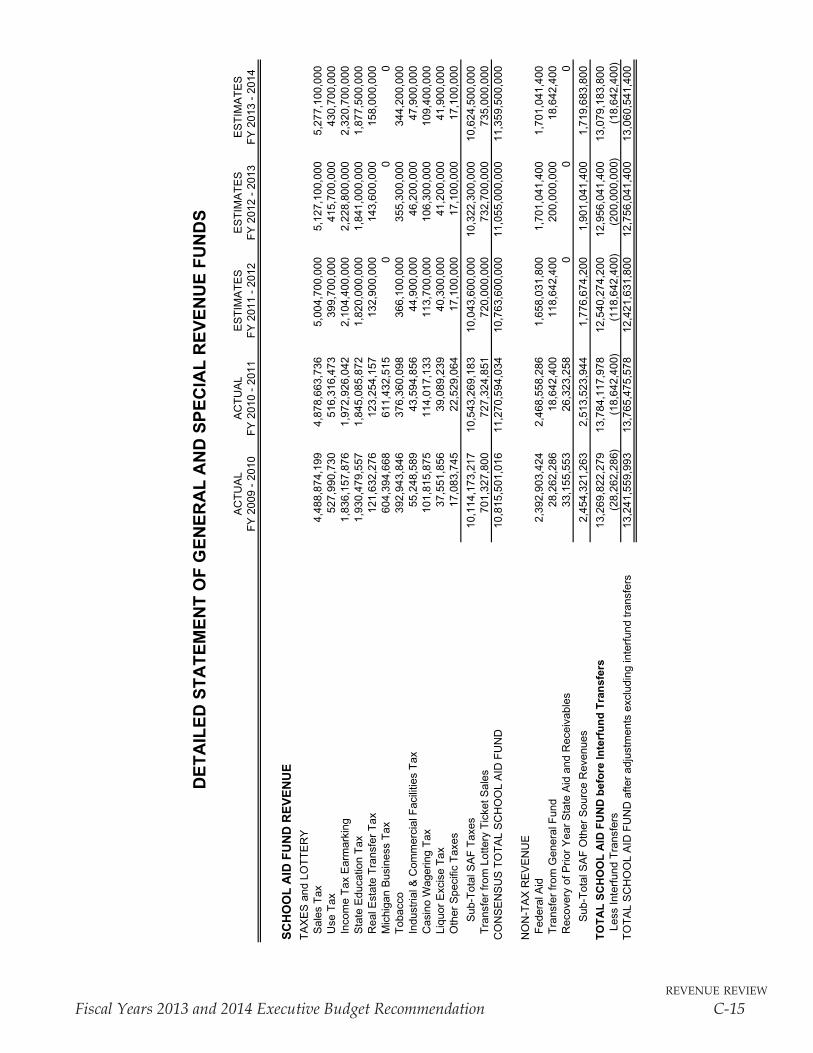
revenue review
Fiscal Years 2013 and 2014 Executive Budget Recommendation C-15
DE
TA
ILE
D S
TA
TE
ME
NT
OF
GE
NE
RA
L A
ND
SP
EC
IAL
RE
VE
NU
E F
UN
DS
AC
TU
AL
AC
TU
AL
ES
TIM
AT
ES
ES
TIM
AT
ES
ES
TIM
AT
ES
FY
200
9 -
2010
FY
201
0 -
2011
FY
201
1 -
2012
FY
201
2 -
2013
FY
201
3 -
2014
SC
HO
OL
AID
FU
ND
RE
VE
NU
ET
AX
ES
and
LO
TT
ER
Y S
ales
Tax
4,
488,
874,
199
4,87
8,66
3,73
65,
004,
700,
000
5,12
7,10
0,00
05,
277,
100,
000
Use
Tax
527,
990,
730
516,
316,
473
399,
700,
000
415,
700,
000
430,
700,
000
Inc
ome
Tax
Ear
mar
king
1,
836,
157,
876
1,97
2,92
6,04
22,
104,
400,
000
2,22
8,80
0,00
02,
320,
700,
000
Sta
te E
duca
tion
Tax
1,93
0,47
9,55
71,
845,
085,
872
1,82
0,00
0,00
01,
841,
000,
000
1,87
7,50
0,00
0 R
eal E
stat
e T
rans
fer
Tax
12
1,63
2,27
612
3,25
4,15
713
2,90
0,00
014
3,60
0,00
015
8,00
0,00
0 M
ichi
gan
Bus
ines
s T
ax60
4,39
4,66
861
1,43
2,51
50
00
Tob
acco
392,
943,
846
376,
360,
098
366,
100,
000
355,
300,
000
344,
200,
000
Ind
ustr
ial &
Com
mer
cial
Fac
ilitie
s T
ax55
,248
,589
43,5
94,8
5644
,900
,000
46,2
00,0
0047
,900
,000
Cas
ino
Wag
erin
g T
ax10
1,81
5,87
511
4,01
7,13
311
3,70
0,00
010
6,30
0,00
010
9,40
0,00
0 L
iquo
r E
xcis
e T
ax37
,551
,856
39,0
89,2
3940
,300
,000
41,2
00,0
0041
,900
,000
Oth
er S
peci
fic T
axes
17,0
83,7
4522
,529
,064
17,1
00,0
0017
,100
,000
17,1
00,0
00
Sub
-Tot
al S
AF
Tax
es
10,1
14,1
73,2
1710
,543
,269
,183
10,0
43,6
00,0
0010
,322
,300
,000
10,6
24,5
00,0
00 T
rans
fer
from
Lot
tery
Tic
ket S
ales
701,
327,
800
727,
324,
851
720,
000,
000
732,
700,
000
735,
000,
000
CO
NS
EN
SU
S T
OT
AL
SC
HO
OL
AID
FU
ND
10,8
15,5
01,0
1611
,270
,594
,034
10,7
63,6
00,0
0011
,055
,000
,000
11,3
59,5
00,0
00
NO
N-T
AX
RE
VE
NU
E F
eder
al A
id2,
392,
903,
424
2,46
8,55
8,28
61,
658,
031,
800
1,70
1,04
1,40
01,
701,
041,
400
Tra
nsfe
r fr
om G
ener
al F
und
28,2
62,2
8618
,642
,400
118,
642,
400
200,
000,
000
18,6
42,4
00 R
ecov
ery
of P
rior
Yea
r S
tate
Aid
and
Rec
eiva
bles
33,1
55,5
5326
,323
,258
00
0
Sub
-Tot
al S
AF
Oth
er S
ourc
e R
even
ues
2,45
4,32
1,26
32,
513,
523,
944
1,77
6,67
4,20
01,
901,
041,
400
1,71
9,68
3,80
0
TO
TA
L S
CH
OO
L A
ID F
UN
D b
efo
re In
terf
un
d T
ran
sfer
s13
,269
,822
,279
13,7
84,1
17,9
7812
,540
,274
,200
12,9
56,0
41,4
0013
,079
,183
,800
Le
ss In
terf
und
Tra
nsfe
rs(2
8,26
2,28
6)(1
8,64
2,40
0)(1
18,6
42,4
00)
(200
,000
,000
)(1
8,64
2,40
0)T
OT
AL
SC
HO
OL
AID
FU
ND
afte
r ad
just
men
ts e
xclu
ding
inte
rfun
d tr
ansf
ers
13,2
41,5
59,9
9313
,765
,475
,578
12,4
21,6
31,8
0012
,756
,041
,400
13,0
60,5
41,4
00
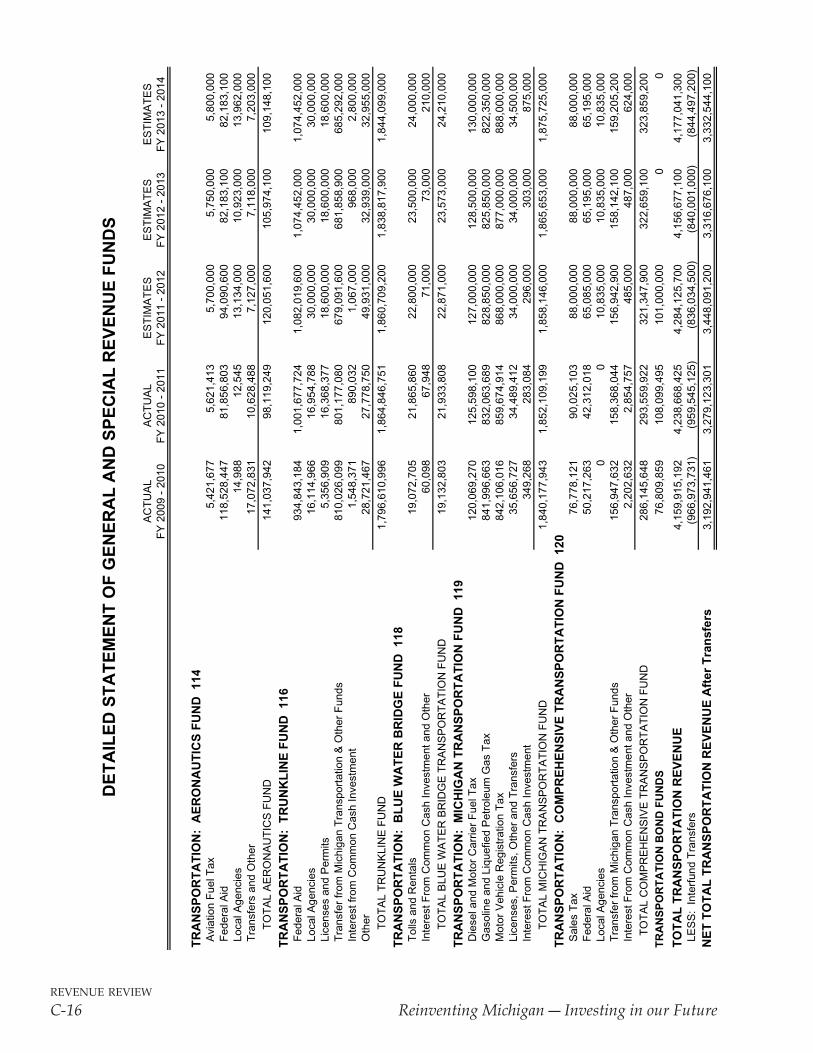
revenue review
C-16 ReinventingMichigan―InvestinginourFuture
DE
TA
ILE
D S
TA
TE
ME
NT
OF
GE
NE
RA
L A
ND
SP
EC
IAL
RE
VE
NU
E F
UN
DS
AC
TU
AL
AC
TU
AL
ES
TIM
AT
ES
ES
TIM
AT
ES
ES
TIM
AT
ES
FY
200
9 -
2010
FY
201
0 -
2011
FY
201
1 -
2012
FY
201
2 -
2013
FY
201
3 -
2014
TR
AN
SP
OR
TA
TIO
N:
AE
RO
NA
UT
ICS
FU
ND
114
Avi
atio
n F
uel T
ax5,
421,
677
5,62
1,41
35,
700,
000
5,75
0,00
05,
800,
000
Fed
eral
Aid
118,
528,
447
81,8
56,8
0394
,090
,600
82,1
83,1
0082
,183
,100
Loc
al A
genc
ies
14,9
8812
,545
13,1
34,0
0010
,923
,000
13,9
62,0
00 T
rans
fers
and
Oth
er17
,072
,831
10,6
28,4
887,
127,
000
7,11
8,00
07,
203,
000
TO
TA
L A
ER
ON
AU
TIC
S F
UN
D14
1,03
7,94
298
,119
,249
120,
051,
600
105,
974,
100
109,
148,
100
TR
AN
SP
OR
TA
TIO
N:
TR
UN
KL
INE
FU
ND
116
Fed
eral
Aid
934,
843,
184
1,00
1,67
7,72
41,
082,
019,
600
1,07
4,45
2,00
01,
074,
452,
000
Loc
al A
genc
ies
16,1
14,9
6616
,954
,788
30,0
00,0
0030
,000
,000
30,0
00,0
00 L
icen
ses
and
Per
mits
5,35
6,90
916
,368
,377
18,6
00,0
0018
,600
,000
18,6
00,0
00 T
rans
fer
from
Mic
higa
n T
rans
port
atio
n &
Oth
er F
unds
810,
026,
099
801,
177,
080
679,
091,
600
681,
858,
900
685,
292,
000
Int
eres
t fro
m C
omm
on C
ash
Inve
stm
ent
1,54
8,37
189
0,03
21,
067,
000
968,
000
2,80
0,00
0 O
ther
28,7
21,4
6727
,778
,750
49,9
31,0
0032
,939
,000
32,9
55,0
00
T
OT
AL
TR
UN
KLI
NE
FU
ND
1,79
6,61
0,99
61,
864,
846,
751
1,86
0,70
9,20
01,
838,
817,
900
1,84
4,09
9,00
0
TR
AN
SP
OR
TA
TIO
N:
BL
UE
WA
TE
R B
RID
GE
FU
ND
118
Tol
ls a
nd R
enta
ls19
,072
,705
21,8
65,8
6022
,800
,000
23,5
00,0
0024
,000
,000
Int
eres
t Fro
m C
omm
on C
ash
Inve
stm
ent a
nd O
ther
60,0
9867
,948
71,0
0073
,000
210,
000
TO
TA
L B
LUE
WA
TE
R B
RID
GE
TR
AN
SP
OR
TA
TIO
N F
UN
D
19,1
32,8
0321
,933
,808
22,8
71,0
0023
,573
,000
24,2
10,0
00
TR
AN
SP
OR
TA
TIO
N:
MIC
HIG
AN
TR
AN
SP
OR
TA
TIO
N F
UN
D 1
19 D
iese
l and
Mot
or C
arrie
r F
uel T
ax
120,
069,
270
125,
598,
100
127,
000,
000
128,
500,
000
130,
000,
000
Gas
olin
e an
d Li
quef
ied
Pet
role
um G
as T
ax84
1,99
6,66
383
2,06
3,68
982
8,85
0,00
082
5,85
0,00
082
2,35
0,00
0 M
otor
Veh
icle
Reg
istr
atio
n T
ax84
2,10
6,01
685
9,67
4,91
486
8,00
0,00
087
7,00
0,00
088
8,00
0,00
0 L
icen
ses,
Per
mits
, Oth
er a
nd T
rans
fers
35,6
56,7
2734
,489
,412
34,0
00,0
0034
,000
,000
34,5
00,0
00 I
nter
est F
rom
Com
mon
Cas
h In
vest
men
t34
9,26
828
3,08
429
6,00
030
3,00
087
5,00
0
T
OT
AL
MIC
HIG
AN
TR
AN
SP
OR
TA
TIO
N F
UN
D
1,84
0,17
7,94
31,
852,
109,
199
1,85
8,14
6,00
01,
865,
653,
000
1,87
5,72
5,00
0
TR
AN
SP
OR
TA
TIO
N:
CO
MP
RE
HE
NS
IVE
TR
AN
SP
OR
TA
TIO
N F
UN
D 1
20 S
ales
Tax
76
,778
,121
90,0
25,1
0388
,000
,000
88,0
00,0
0088
,000
,000
Fed
eral
Aid
50,2
17,2
6342
,312
,018
65,0
85,0
0065
,195
,000
65,1
95,0
00 L
ocal
Age
ncie
s0
010
,835
,000
10,8
35,0
0010
,835
,000
Tra
nsfe
r fr
om M
ichi
gan
Tra
nspo
rtat
ion
& O
ther
Fun
ds15
6,94
7,63
215
8,36
8,04
415
6,94
2,90
015
8,14
2,10
015
9,20
5,20
0 I
nter
est F
rom
Com
mon
Cas
h In
vest
men
t and
Oth
er2,
202,
632
2,85
4,75
748
5,00
048
7,00
062
4,00
0
TO
TA
L C
OM
PR
EH
EN
SIV
E T
RA
NS
PO
RT
AT
ION
FU
ND
286,
145,
648
293,
559,
922
321,
347,
900
322,
659,
100
323,
859,
200
TR
AN
SP
OR
TA
TIO
N B
ON
D F
UN
DS
76,8
09,8
5910
8,09
9,49
510
1,00
0,00
00
0
TO
TA
L T
RA
NS
PO
RT
AT
ION
RE
VE
NU
E4,
159,
915,
192
4,23
8,66
8,42
54,
284,
125,
700
4,15
6,67
7,10
04,
177,
041,
300
LE
SS
: In
terf
und
Tra
nsfe
rs(9
66,9
73,7
31)
(959
,545
,125
)(8
36,0
34,5
00)
(840
,001
,000
)(8
44,4
97,2
00)
NE
T T
OT
AL
TR
AN
SP
OR
TA
TIO
N R
EV
EN
UE
Aft
er T
ran
sfer
s3,
192,
941,
461
3,27
9,12
3,30
13,
448,
091,
200
3,31
6,67
6,10
03,
332,
544,
100
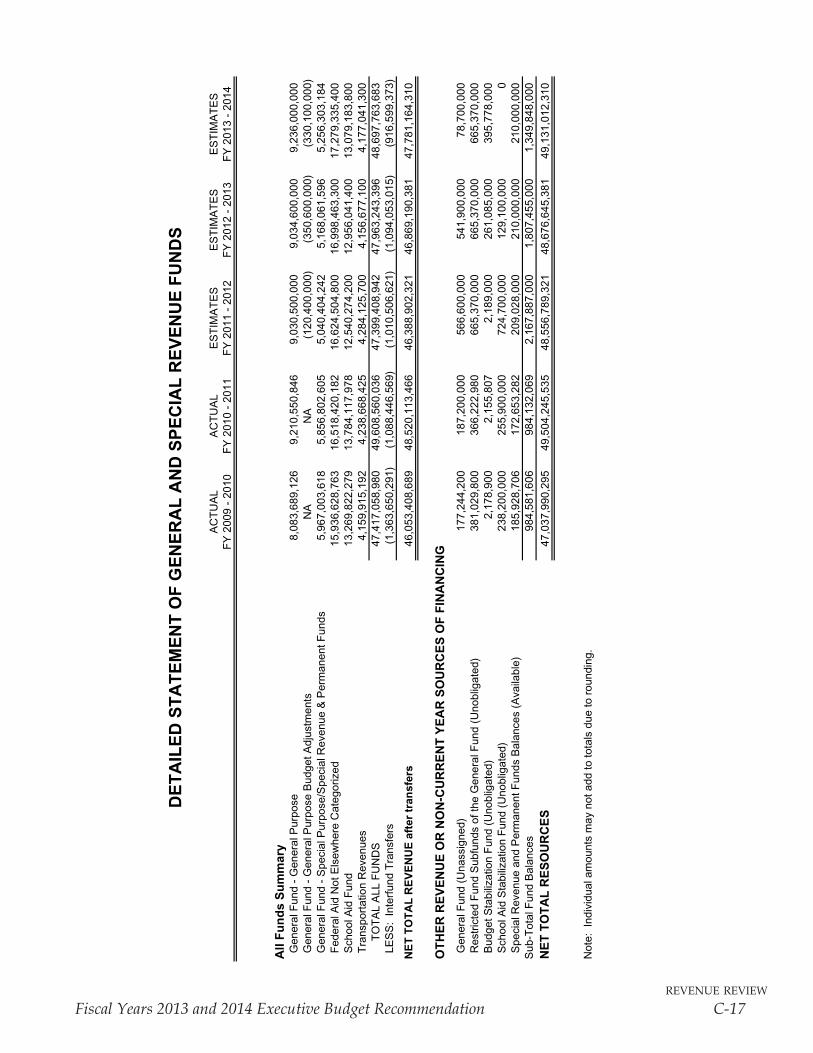
revenue review
Fiscal Years 2013 and 2014 Executive Budget Recommendation C-17
DE
TA
ILE
D S
TA
TE
ME
NT
OF
GE
NE
RA
L A
ND
SP
EC
IAL
RE
VE
NU
E F
UN
DS
AC
TU
AL
AC
TU
AL
ES
TIM
AT
ES
ES
TIM
AT
ES
ES
TIM
AT
ES
FY
200
9 -
2010
FY
201
0 -
2011
FY
201
1 -
2012
FY
201
2 -
2013
FY
201
3 -
2014
All
Fu
nd
s S
um
mar
y G
ener
al F
und
- G
ener
al P
urpo
se8,
083,
689,
126
9,21
0,55
0,84
69,
030,
500,
000
9,03
4,60
0,00
09,
236,
000,
000
Gen
eral
Fun
d -
Gen
eral
Pur
pose
Bud
get A
djus
tmen
tsN
AN
A(1
20,4
00,0
00)
(350
,600
,000
)(3
30,1
00,0
00)
Gen
eral
Fun
d -
Spe
cial
Pur
pose
/Spe
cial
Rev
enue
& P
erm
anen
t Fun
ds5,
967,
003,
618
5,85
6,80
2,60
55,
040,
404,
242
5,16
8,06
1,59
65,
256,
303,
184
Fed
eral
Aid
Not
Els
ewhe
re C
ateg
oriz
ed15
,936
,628
,763
16,5
18,4
20,1
8216
,624
,504
,800
16,9
98,4
63,3
0017
,279
,335
,400
Sch
ool A
id F
und
13,2
69,8
22,2
7913
,784
,117
,978
12,5
40,2
74,2
0012
,956
,041
,400
13,0
79,1
83,8
00 T
rans
port
atio
n R
even
ues
4,15
9,91
5,19
24,
238,
668,
425
4,28
4,12
5,70
04,
156,
677,
100
4,17
7,04
1,30
0
T
OT
AL
ALL
FU
ND
S47
,417
,058
,980
49,6
08,5
60,0
3647
,399
,408
,942
47,9
63,2
43,3
9648
,697
,763
,683
LE
SS
: In
terf
und
Tra
nsfe
rs(1
,363
,650
,291
)(1
,088
,446
,569
)(1
,010
,506
,621
)(1
,094
,053
,015
)(9
16,5
99,3
73)
NE
T T
OT
AL
RE
VE
NU
E a
fter
tra
nsf
ers
46,0
53,4
08,6
8948
,520
,113
,466
46,3
88,9
02,3
2146
,869
,190
,381
47,7
81,1
64,3
10
OT
HE
R R
EV
EN
UE
OR
NO
N-C
UR
RE
NT
YE
AR
SO
UR
CE
S O
F F
INA
NC
ING
Gen
eral
Fun
d (U
nass
igne
d)17
7,24
4,20
018
7,20
0,00
056
6,60
0,00
054
1,90
0,00
078
,700
,000
Res
tric
ted
Fun
d S
ubfu
nds
of th
e G
ener
al F
und
(Uno
blig
ated
)38
1,02
9,80
036
6,22
2,98
066
5,37
0,00
066
5,37
0,00
066
5,37
0,00
0 B
udge
t Sta
biliz
atio
n F
und
(Uno
blig
ated
)2,
178,
900
2,15
5,80
72,
189,
000
261,
085,
000
395,
778,
000
Sch
ool A
id S
tabi
lizat
ion
Fun
d (U
nobl
igat
ed)
238,
200,
000
255,
900,
000
724,
700,
000
129,
100,
000
0 S
peci
al R
even
ue a
nd P
erm
anen
t Fun
ds B
alan
ces
(Ava
ilabl
e)18
5,92
8,70
617
2,65
3,28
220
9,02
8,00
021
0,00
0,00
021
0,00
0,00
0S
ub-T
otal
Fun
d B
alan
ces
984,
581,
606
984,
132,
069
2,16
7,88
7,00
01,
807,
455,
000
1,34
9,84
8,00
0N
ET
TO
TA
L R
ES
OU
RC
ES
47,0
37,9
90,2
9549
,504
,245
,535
48,5
56,7
89,3
2148
,676
,645
,381
49,1
31,0
12,3
10
Not
e: I
ndiv
idua
l am
ount
s m
ay n
ot a
dd to
tota
ls d
ue to
rou
ndin
g.

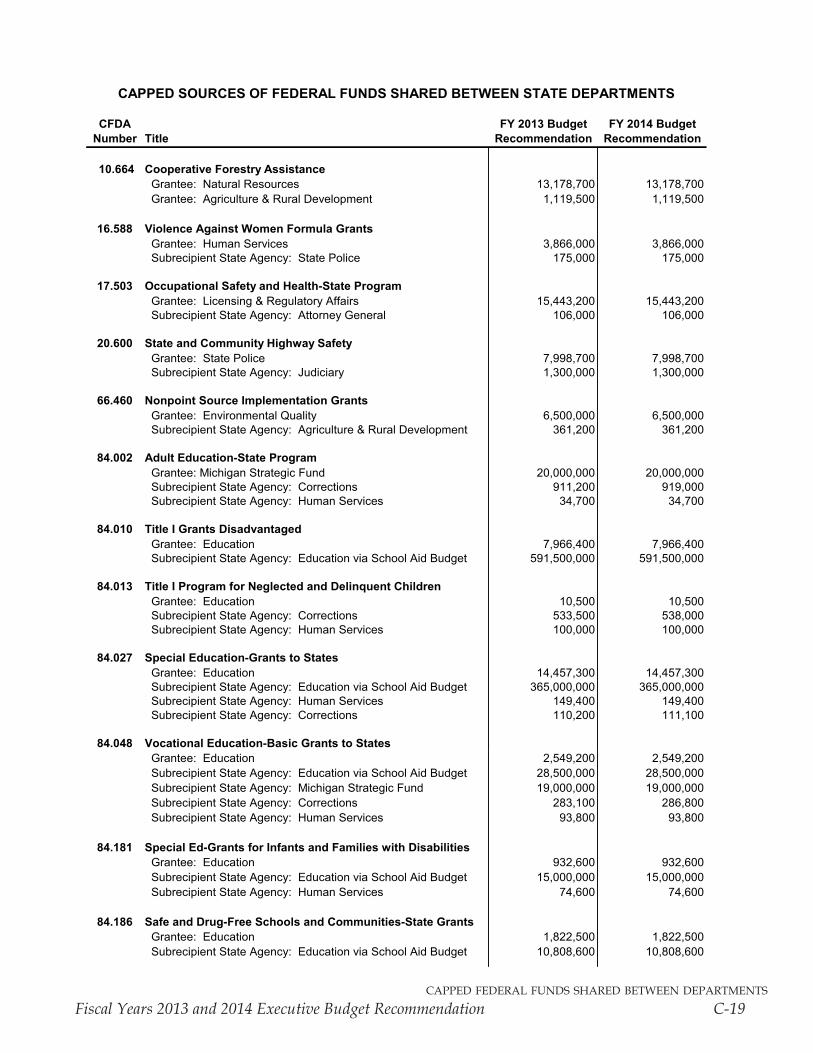
capped federal funds shared between departments
Fiscal Years 2013 and 2014 Executive Budget Recommendation C-19
CAPPED SOURCES OF FEDERAL FUNDS SHARED BETWEEN STATE DEPARTMENTS
CFDA FY 2013 Budget FY 2014 BudgetNumber Title Recommendation Recommendation
10.664 Cooperative Forestry Assistance Grantee: Natural Resources 13,178,700 13,178,700 Grantee: Agriculture & Rural Development 1,119,500 1,119,500
16.588 Violence Against Women Formula Grants Grantee: Human Services 3,866,000 3,866,000 Subrecipient State Agency: State Police 175,000 175,000
17.503 Occupational Safety and Health-State Program Grantee: Licensing & Regulatory Affairs 15,443,200 15,443,200 Subrecipient State Agency: Attorney General 106,000 106,000
20.600 State and Community Highway Safety
Grantee: State Police 7,998,700 7,998,700 Subrecipient State Agency: Judiciary 1,300,000 1,300,000
66.460 Nonpoint Source Implementation Grants
Grantee: Environmental Quality 6,500,000 6,500,000 Subrecipient State Agency: Agriculture & Rural Development 361,200 361,200
84.002 Adult Education-State Program
Grantee: Michigan Strategic Fund 20,000,000 20,000,000 Subrecipient State Agency: Corrections 911,200 919,000 Subrecipient State Agency: Human Services 34,700 34,700
84.010 Title I Grants Disadvantaged
Grantee: Education 7,966,400 7,966,400 Subrecipient State Agency: Education via School Aid Budget 591,500,000 591,500,000
84.013 Title I Program for Neglected and Delinquent Children Grantee: Education 10,500 10,500 Subrecipient State Agency: Corrections 533,500 538,000 Subrecipient State Agency: Human Services 100,000 100,000
84.027 Special Education-Grants to States Grantee: Education 14,457,300 14,457,300 Subrecipient State Agency: Education via School Aid Budget 365,000,000 365,000,000 Subrecipient State Agency: Human Services 149,400 149,400 Subrecipient State Agency: Corrections 110,200 111,100
84.048 Vocational Education-Basic Grants to States
Grantee: Education 2,549,200 2,549,200 Subrecipient State Agency: Education via School Aid Budget 28,500,000 28,500,000 Subrecipient State Agency: Michigan Strategic Fund 19,000,000 19,000,000 Subrecipient State Agency: Corrections 283,100 286,800 Subrecipient State Agency: Human Services 93,800 93,800
84.181 Special Ed-Grants for Infants and Families with Disabilities Grantee: Education 932,600 932,600 Subrecipient State Agency: Education via School Aid Budget 15,000,000 15,000,000 Subrecipient State Agency: Human Services 74,600 74,600
84.186 Safe and Drug-Free Schools and Communities-State Grants Grantee: Education 1,822,500 1,822,500 Subrecipient State Agency: Education via School Aid Budget 10,808,600 10,808,600
Printed: 2/5/2012 6:47 PM
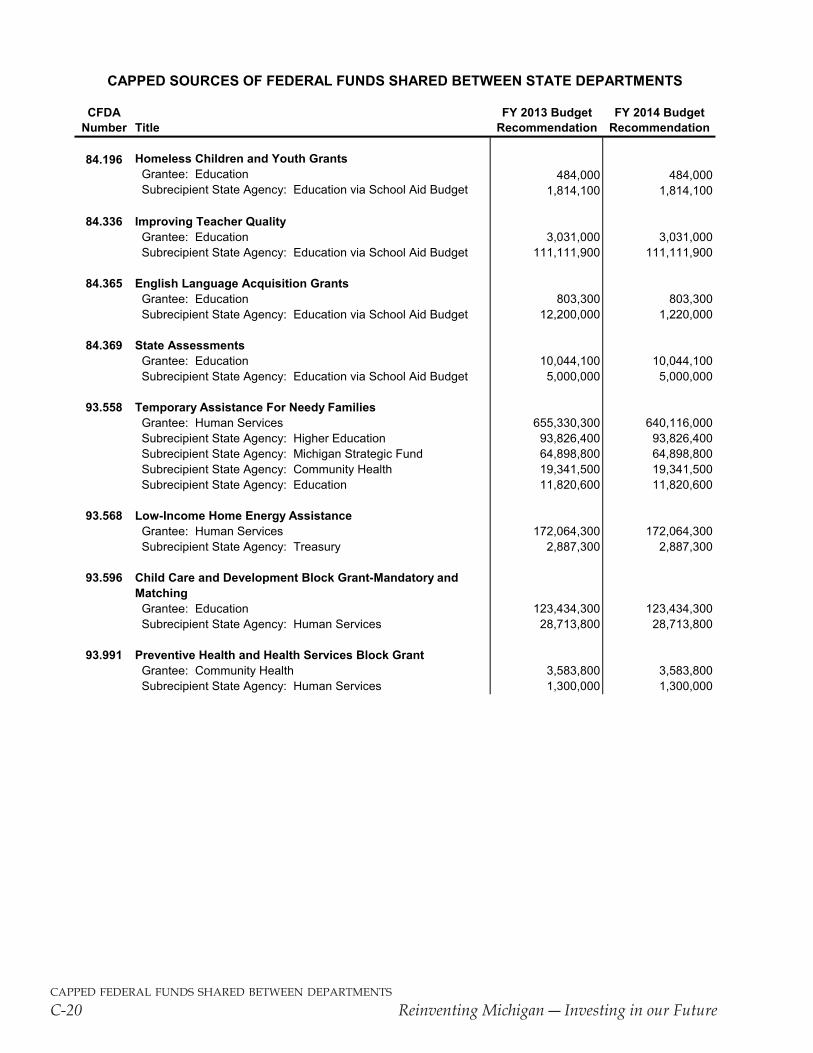
capped federal funds shared between departments
C-20 ReinventingMichigan―InvestinginourFuture
CAPPED SOURCES OF FEDERAL FUNDS SHARED BETWEEN STATE DEPARTMENTS
CFDA FY 2013 Budget FY 2014 BudgetNumber Title Recommendation Recommendation
84.196 Homeless Children and Youth Grants Grantee: Education 484,000 484,000 Subrecipient State Agency: Education via School Aid Budget 1,814,100 1,814,100
84.336 Improving Teacher Quality Grantee: Education 3,031,000 3,031,000 Subrecipient State Agency: Education via School Aid Budget 111,111,900 111,111,900
84.365 English Language Acquisition Grants Grantee: Education 803,300 803,300
Subrecipient State Agency: Education via School Aid Budget 12,200,000 1,220,000
84.369 State Assessments Grantee: Education 10,044,100 10,044,100 Subrecipient State Agency: Education via School Aid Budget 5,000,000 5,000,000
93.558 Temporary Assistance For Needy Families Grantee: Human Services 655,330,300 640,116,000 Subrecipient State Agency: Higher Education 93,826,400 93,826,400 Subrecipient State Agency: Michigan Strategic Fund 64,898,800 64,898,800 Subrecipient State Agency: Community Health 19,341,500 19,341,500 Subrecipient State Agency: Education 11,820,600 11,820,600
93.568 Low-Income Home Energy Assistance Grantee: Human Services 172,064,300 172,064,300 Subrecipient State Agency: Treasury 2,887,300 2,887,300
93.596 Child Care and Development Block Grant-Mandatory andMatching Grantee: Education 123,434,300 123,434,300 Subrecipient State Agency: Human Services 28,713,800 28,713,800
93.991 Preventive Health and Health Services Block Grant Grantee: Community Health 3,583,800 3,583,800 Subrecipient State Agency: Human Services 1,300,000 1,300,000
Printed: 2/5/2012 6:48 PM
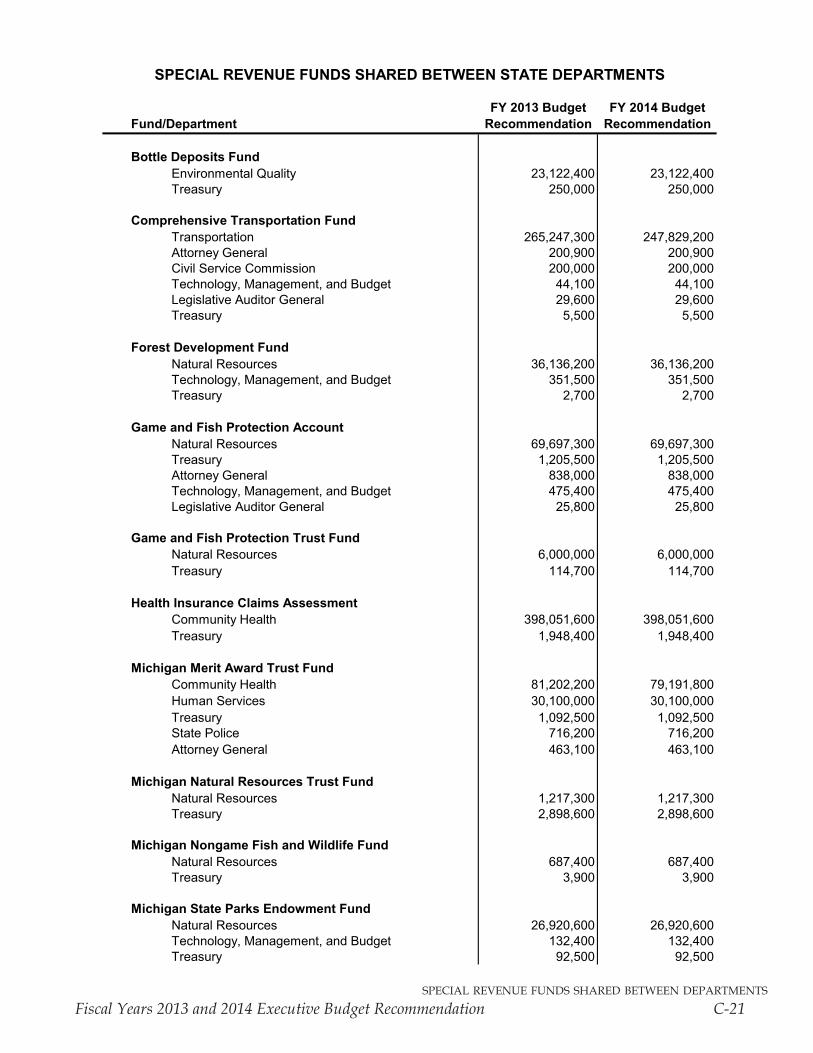
special revenue funds shared between departments
Fiscal Years 2013 and 2014 Executive Budget Recommendation C-21
SPECIAL REVENUE FUNDS SHARED BETWEEN STATE DEPARTMENTS
FY 2013 Budget FY 2014 Budget
Fund/Department Recommendation Recommendation
Bottle Deposits Fund Environmental Quality 23,122,400 23,122,400Treasury 250,000 250,000
Comprehensive Transportation Fund Transportation 265,247,300 247,829,200Attorney General 200,900 200,900Civil Service Commission 200,000 200,000Technology, Management, and Budget 44,100 44,100Legislative Auditor General 29,600 29,600Treasury 5,500 5,500
Forest Development Fund
Natural Resources 36,136,200 36,136,200Technology, Management, and Budget 351,500 351,500Treasury 2,700 2,700
Game and Fish Protection Account
Natural Resources 69,697,300 69,697,300Treasury 1,205,500 1,205,500Attorney General 838,000 838,000Technology, Management, and Budget 475,400 475,400Legislative Auditor General 25,800 25,800
Game and Fish Protection Trust Fund
Natural Resources 6,000,000 6,000,000Treasury 114,700 114,700
Health Insurance Claims Assessment Community Health 398,051,600 398,051,600Treasury 1,948,400 1,948,400
Michigan Merit Award Trust Fund Community Health 81,202,200 79,191,800Human Services 30,100,000 30,100,000Treasury 1,092,500 1,092,500State Police 716,200 716,200Attorney General 463,100 463,100
Michigan Natural Resources Trust Fund Natural Resources 1,217,300 1,217,300Treasury 2,898,600 2,898,600
Michigan Nongame Fish and Wildlife Fund
Natural Resources 687,400 687,400Treasury 3,900 3,900
Michigan State Parks Endowment Fund
Natural Resources 26,920,600 26,920,600Technology, Management, and Budget 132,400 132,400Treasury 92,500 92,500
Printed: 2/5/2012 6:51 PM
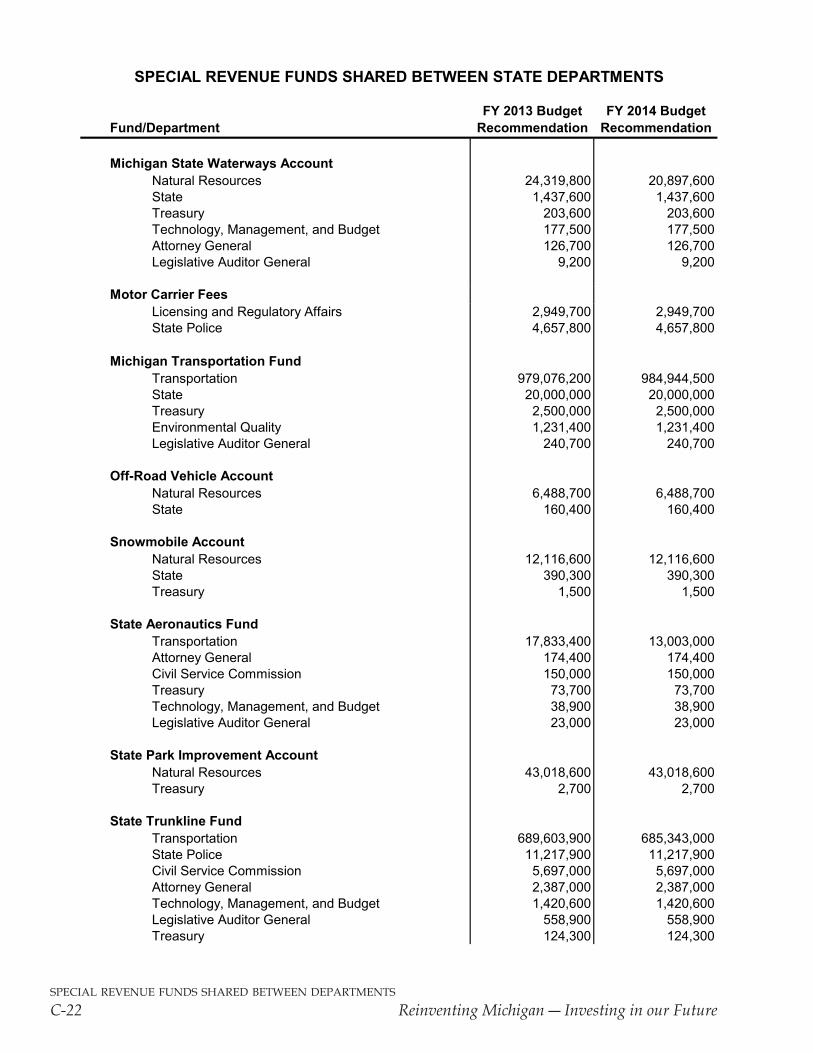
special revenue funds shared between departments
C-22 ReinventingMichigan―InvestinginourFuture
SPECIAL REVENUE FUNDS SHARED BETWEEN STATE DEPARTMENTS
FY 2013 Budget FY 2014 Budget
Fund/Department Recommendation Recommendation
Michigan State Waterways Account Natural Resources 24,319,800 20,897,600State 1,437,600 1,437,600Treasury 203,600 203,600Technology, Management, and Budget 177,500 177,500Attorney General 126,700 126,700Legislative Auditor General 9,200 9,200
Motor Carrier FeesLicensing and Regulatory Affairs 2,949,700 2,949,700State Police 4,657,800 4,657,800
Michigan Transportation Fund
Transportation 979,076,200 984,944,500State 20,000,000 20,000,000Treasury 2,500,000 2,500,000Environmental Quality 1,231,400 1,231,400Legislative Auditor General 240,700 240,700
Off-Road Vehicle AccountNatural Resources 6,488,700 6,488,700State 160,400 160,400
Snowmobile AccountNatural Resources 12,116,600 12,116,600State 390,300 390,300Treasury 1,500 1,500
State Aeronautics Fund Transportation 17,833,400 13,003,000Attorney General 174,400 174,400Civil Service Commission 150,000 150,000Treasury 73,700 73,700Technology, Management, and Budget 38,900 38,900Legislative Auditor General 23,000 23,000
State Park Improvement AccountNatural Resources 43,018,600 43,018,600Treasury 2,700 2,700
State Trunkline Fund Transportation 689,603,900 685,343,000State Police 11,217,900 11,217,900Civil Service Commission 5,697,000 5,697,000Attorney General 2,387,000 2,387,000Technology, Management, and Budget 1,420,600 1,420,600Legislative Auditor General 558,900 558,900Treasury 124,300 124,300
Printed: 2/5/2012 6:51 PM
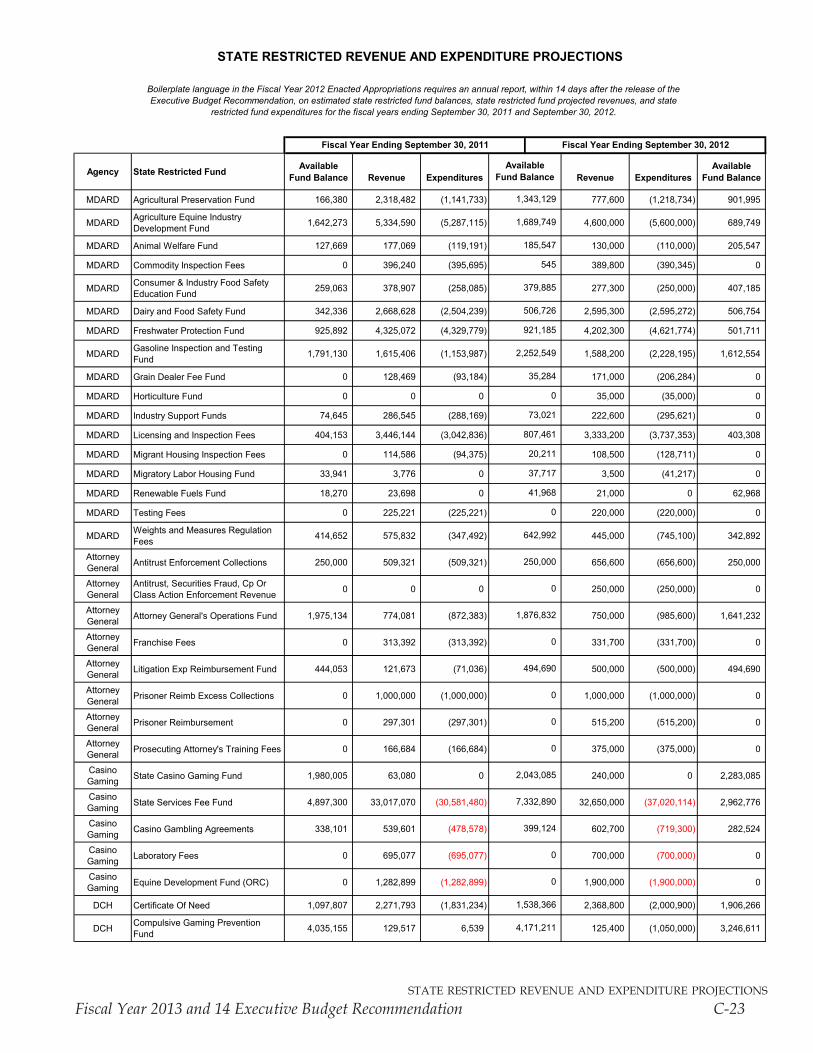
state restricted revenue and expenditure projections
Fiscal Year 2013 and 14 Executive Budget Recommendation C-23
Agency State Restricted Fund AvailableFund Balance Revenue Expenditures Revenue Expenditures
AvailableFund Balance
MDARD Agricultural Preservation Fund 166,380 2,318,482 (1,141,733) 777,600 (1,218,734) 901,995
MDARD Agriculture Equine Industry Development Fund 1,642,273 5,334,590 (5,287,115) 4,600,000 (5,600,000) 689,749
MDARD Animal Welfare Fund 127,669 177,069 (119,191) 130,000 (110,000) 205,547
MDARD Commodity Inspection Fees 0 396,240 (395,695) 389,800 (390,345) 0
MDARD Consumer & Industry Food Safety Education Fund 259,063 378,907 (258,085) 277,300 (250,000) 407,185
MDARD Dairy and Food Safety Fund 342,336 2,668,628 (2,504,239) 2,595,300 (2,595,272) 506,754
MDARD Freshwater Protection Fund 925,892 4,325,072 (4,329,779) 4,202,300 (4,621,774) 501,711
MDARD Gasoline Inspection and Testing Fund 1,791,130 1,615,406 (1,153,987) 1,588,200 (2,228,195) 1,612,554
MDARD Grain Dealer Fee Fund 0 128,469 (93,184) 171,000 (206,284) 0
MDARD Horticulture Fund 0 0 0 35,000 (35,000) 0
MDARD Industry Support Funds 74,645 286,545 (288,169) 222,600 (295,621) 0
MDARD Licensing and Inspection Fees 404,153 3,446,144 (3,042,836) 3,333,200 (3,737,353) 403,308
MDARD Migrant Housing Inspection Fees 0 114,586 (94,375) 108,500 (128,711) 0
MDARD Migratory Labor Housing Fund 33,941 3,776 0 3,500 (41,217) 0
MDARD Renewable Fuels Fund 18,270 23,698 0 21,000 0 62,968
MDARD Testing Fees 0 225,221 (225,221) 220,000 (220,000) 0
MDARD Weights and Measures Regulation Fees 414,652 575,832 (347,492) 445,000 (745,100) 342,892
Attorney General Antitrust Enforcement Collections 250,000 509,321 (509,321) 656,600 (656,600) 250,000
Attorney General
Antitrust, Securities Fraud, Cp Or Class Action Enforcement Revenue 0 0 0 250,000 (250,000) 0
Attorney General Attorney General's Operations Fund 1,975,134 774,081 (872,383) 750,000 (985,600) 1,641,232
Attorney General Franchise Fees 0 313,392 (313,392) 331,700 (331,700) 0
Attorney General Litigation Exp Reimbursement Fund 444,053 121,673 (71,036) 500,000 (500,000) 494,690
Attorney General Prisoner Reimb Excess Collections 0 1,000,000 (1,000,000) 1,000,000 (1,000,000) 0
Attorney General Prisoner Reimbursement 0 297,301 (297,301) 515,200 (515,200) 0
Attorney General Prosecuting Attorney's Training Fees 0 166,684 (166,684) 375,000 (375,000) 0
Casino Gaming State Casino Gaming Fund 1,980,005 63,080 0 240,000 0 2,283,085
Casino Gaming State Services Fee Fund 4,897,300 33,017,070 (30,581,480) 32,650,000 (37,020,114) 2,962,776
Casino Gaming Casino Gambling Agreements 338,101 539,601 (478,578) 602,700 (719,300) 282,524
Casino Gaming Laboratory Fees 0 695,077 (695,077) 700,000 (700,000) 0
Casino Gaming Equine Development Fund (ORC) 0 1,282,899 (1,282,899) 1,900,000 (1,900,000) 0
DCH Certificate Of Need 1,097,807 2,271,793 (1,831,234) 2,368,800 (2,000,900) 1,906,266
DCH Compulsive Gaming Prevention Fund 4,035,155 129,517 6,539 125,400 (1,050,000) 3,246,611
Boilerplate language in the Fiscal Year 2012 Enacted Appropriations requires an annual report, within 14 days after the release of the Executive Budget Recommendation, on estimated state restricted fund balances, state restricted fund projected revenues, and state
restricted fund expenditures for the fiscal years ending September 30, 2011 and September 30, 2012.
4,171,211
0
0
0
0
642,992
250,000
0
1,876,832
1,538,366
2,043,085
7,332,890
399,124
0
0
1,689,749
185,547
Fiscal Year Ending September 30, 2011
545
379,885
STATE RESTRICTED REVENUE AND EXPENDITURE PROJECTIONS
Fiscal Year Ending September 30, 2012
AvailableFund Balance
1,343,129
73,021
807,461
20,211
37,717
41,968
506,726
921,185
2,252,549
35,284
0
0
494,690
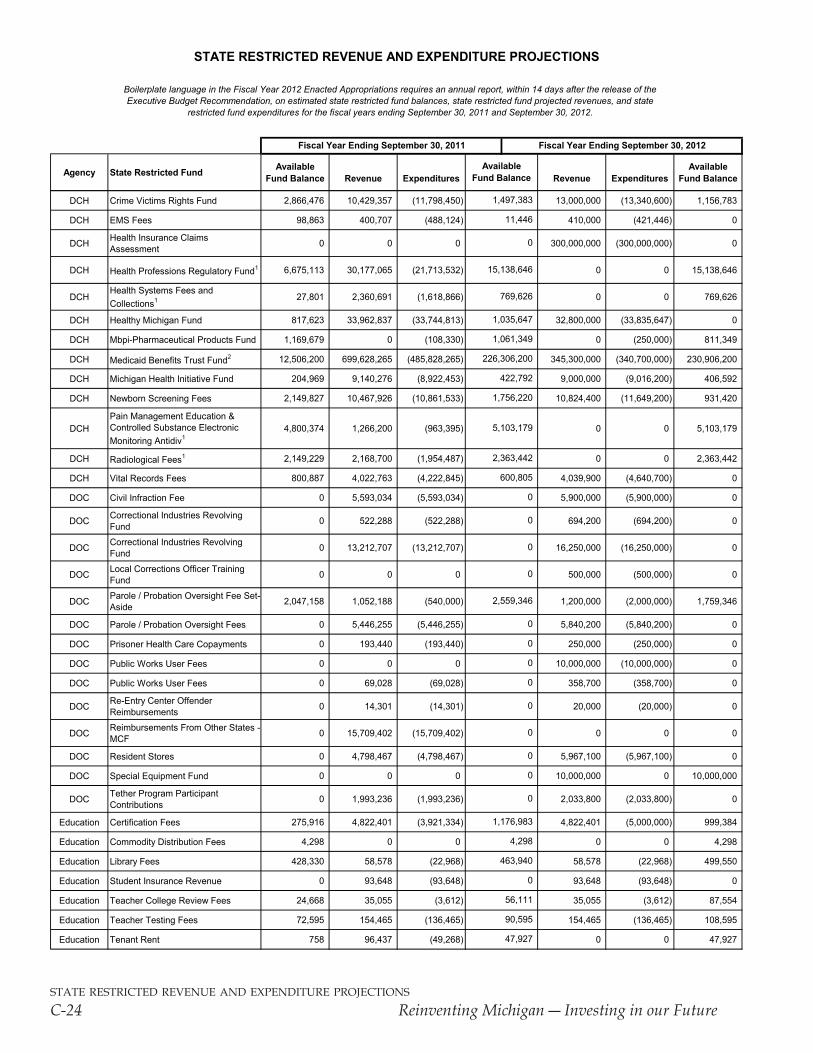
state restricted revenue and expenditure projections
C-24 ReinventingMichigan―InvestinginourFuture
Agency State Restricted Fund AvailableFund Balance Revenue Expenditures Revenue Expenditures
AvailableFund Balance
Boilerplate language in the Fiscal Year 2012 Enacted Appropriations requires an annual report, within 14 days after the release of the Executive Budget Recommendation, on estimated state restricted fund balances, state restricted fund projected revenues, and state
restricted fund expenditures for the fiscal years ending September 30, 2011 and September 30, 2012.
Fiscal Year Ending September 30, 2011
STATE RESTRICTED REVENUE AND EXPENDITURE PROJECTIONS
Fiscal Year Ending September 30, 2012
AvailableFund Balance
DCH Crime Victims Rights Fund 2,866,476 10,429,357 (11,798,450) 13,000,000 (13,340,600) 1,156,783
DCH EMS Fees 98,863 400,707 (488,124) 410,000 (421,446) 0
DCH Health Insurance Claims Assessment 0 0 0 300,000,000 (300,000,000) 0
DCH Health Professions Regulatory Fund1 6,675,113 30,177,065 (21,713,532) 0 0 15,138,646
DCHHealth Systems Fees and Collections1 27,801 2,360,691 (1,618,866) 0 0 769,626
DCH Healthy Michigan Fund 817,623 33,962,837 (33,744,813) 32,800,000 (33,835,647) 0
DCH Mbpi-Pharmaceutical Products Fund 1,169,679 0 (108,330) 0 (250,000) 811,349
DCH Medicaid Benefits Trust Fund2 12,506,200 699,628,265 (485,828,265) 345,300,000 (340,700,000) 230,906,200
DCH Michigan Health Initiative Fund 204,969 9,140,276 (8,922,453) 9,000,000 (9,016,200) 406,592
DCH Newborn Screening Fees 2,149,827 10,467,926 (10,861,533) 10,824,400 (11,649,200) 931,420
DCHPain Management Education & Controlled Substance Electronic Monitoring Antidiv1
4,800,374 1,266,200 (963,395) 0 0 5,103,179
DCH Radiological Fees1 2,149,229 2,168,700 (1,954,487) 0 0 2,363,442
DCH Vital Records Fees 800,887 4,022,763 (4,222,845) 4,039,900 (4,640,700) 0
DOC Civil Infraction Fee 0 5,593,034 (5,593,034) 5,900,000 (5,900,000) 0
DOC Correctional Industries Revolving Fund 0 522,288 (522,288) 694,200 (694,200) 0
DOC Correctional Industries Revolving Fund 0 13,212,707 (13,212,707) 16,250,000 (16,250,000) 0
DOC Local Corrections Officer Training Fund 0 0 0 500,000 (500,000) 0
DOC Parole / Probation Oversight Fee Set-Aside 2,047,158 1,052,188 (540,000) 1,200,000 (2,000,000) 1,759,346
DOC Parole / Probation Oversight Fees 0 5,446,255 (5,446,255) 5,840,200 (5,840,200) 0
DOC Prisoner Health Care Copayments 0 193,440 (193,440) 250,000 (250,000) 0
DOC Public Works User Fees 0 0 0 10,000,000 (10,000,000) 0
DOC Public Works User Fees 0 69,028 (69,028) 358,700 (358,700) 0
DOC Re-Entry Center Offender Reimbursements 0 14,301 (14,301) 20,000 (20,000) 0
DOC Reimbursements From Other States - MCF 0 15,709,402 (15,709,402) 0 0 0
DOC Resident Stores 0 4,798,467 (4,798,467) 5,967,100 (5,967,100) 0
DOC Special Equipment Fund 0 0 0 10,000,000 0 10,000,000
DOC Tether Program Participant Contributions 0 1,993,236 (1,993,236) 2,033,800 (2,033,800) 0
Education Certification Fees 275,916 4,822,401 (3,921,334) 4,822,401 (5,000,000) 999,384
Education Commodity Distribution Fees 4,298 0 0 0 0 4,298
Education Library Fees 428,330 58,578 (22,968) 58,578 (22,968) 499,550
Education Student Insurance Revenue 0 93,648 (93,648) 93,648 (93,648) 0
Education Teacher College Review Fees 24,668 35,055 (3,612) 35,055 (3,612) 87,554
Education Teacher Testing Fees 72,595 154,465 (136,465) 154,465 (136,465) 108,595
Education Tenant Rent 758 96,437 (49,268) 0 0 47,927
0
0
1,176,983
4,298
463,940
0
0
2,559,346
0
0
0
56,111
90,595
47,927
1,497,383
11,446
0
15,138,646
769,626
5,103,179
2,363,442
600,805
0
0
1,035,647
1,061,349
226,306,200
422,792
1,756,220
0
0
0
0
0
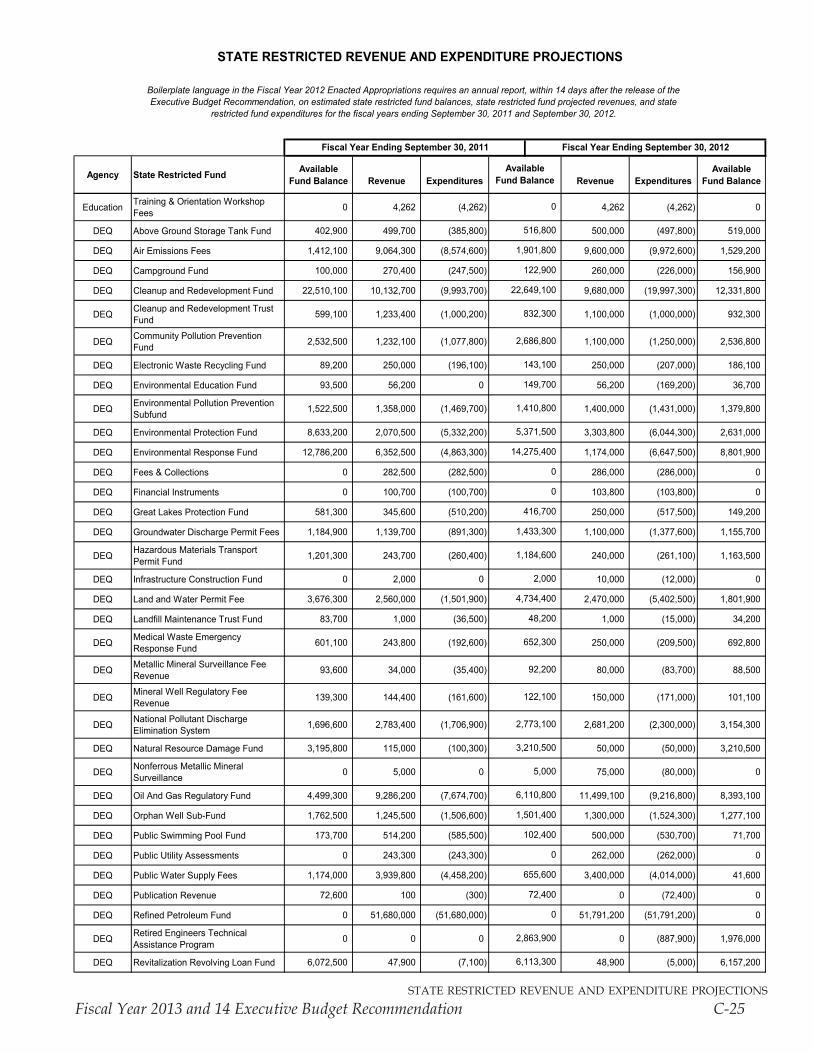
state restricted revenue and expenditure projections
Fiscal Year 2013 and 14 Executive Budget Recommendation C-25
Agency State Restricted Fund AvailableFund Balance Revenue Expenditures Revenue Expenditures
AvailableFund Balance
Boilerplate language in the Fiscal Year 2012 Enacted Appropriations requires an annual report, within 14 days after the release of the Executive Budget Recommendation, on estimated state restricted fund balances, state restricted fund projected revenues, and state
restricted fund expenditures for the fiscal years ending September 30, 2011 and September 30, 2012.
Fiscal Year Ending September 30, 2011
STATE RESTRICTED REVENUE AND EXPENDITURE PROJECTIONS
Fiscal Year Ending September 30, 2012
AvailableFund Balance
Education Training & Orientation Workshop Fees 0 4,262 (4,262) 4,262 (4,262) 0
DEQ Above Ground Storage Tank Fund 402,900 499,700 (385,800) 500,000 (497,800) 519,000
DEQ Air Emissions Fees 1,412,100 9,064,300 (8,574,600) 9,600,000 (9,972,600) 1,529,200
DEQ Campground Fund 100,000 270,400 (247,500) 260,000 (226,000) 156,900
DEQ Cleanup and Redevelopment Fund 22,510,100 10,132,700 (9,993,700) 9,680,000 (19,997,300) 12,331,800
DEQ Cleanup and Redevelopment Trust Fund 599,100 1,233,400 (1,000,200) 1,100,000 (1,000,000) 932,300
DEQ Community Pollution Prevention Fund 2,532,500 1,232,100 (1,077,800) 1,100,000 (1,250,000) 2,536,800
DEQ Electronic Waste Recycling Fund 89,200 250,000 (196,100) 250,000 (207,000) 186,100
DEQ Environmental Education Fund 93,500 56,200 0 56,200 (169,200) 36,700
DEQ Environmental Pollution Prevention Subfund 1,522,500 1,358,000 (1,469,700) 1,400,000 (1,431,000) 1,379,800
DEQ Environmental Protection Fund 8,633,200 2,070,500 (5,332,200) 3,303,800 (6,044,300) 2,631,000
DEQ Environmental Response Fund 12,786,200 6,352,500 (4,863,300) 1,174,000 (6,647,500) 8,801,900
DEQ Fees & Collections 0 282,500 (282,500) 286,000 (286,000) 0
DEQ Financial Instruments 0 100,700 (100,700) 103,800 (103,800) 0
DEQ Great Lakes Protection Fund 581,300 345,600 (510,200) 250,000 (517,500) 149,200
DEQ Groundwater Discharge Permit Fees 1,184,900 1,139,700 (891,300) 1,100,000 (1,377,600) 1,155,700
DEQ Hazardous Materials Transport Permit Fund 1,201,300 243,700 (260,400) 240,000 (261,100) 1,163,500
DEQ Infrastructure Construction Fund 0 2,000 0 10,000 (12,000) 0
DEQ Land and Water Permit Fee 3,676,300 2,560,000 (1,501,900) 2,470,000 (5,402,500) 1,801,900
DEQ Landfill Maintenance Trust Fund 83,700 1,000 (36,500) 1,000 (15,000) 34,200
DEQ Medical Waste Emergency Response Fund 601,100 243,800 (192,600) 250,000 (209,500) 692,800
DEQ Metallic Mineral Surveillance Fee Revenue 93,600 34,000 (35,400) 80,000 (83,700) 88,500
DEQ Mineral Well Regulatory Fee Revenue 139,300 144,400 (161,600) 150,000 (171,000) 101,100
DEQ National Pollutant Discharge Elimination System 1,696,600 2,783,400 (1,706,900) 2,681,200 (2,300,000) 3,154,300
DEQ Natural Resource Damage Fund 3,195,800 115,000 (100,300) 50,000 (50,000) 3,210,500
DEQ Nonferrous Metallic Mineral Surveillance 0 5,000 0 75,000 (80,000) 0
DEQ Oil And Gas Regulatory Fund 4,499,300 9,286,200 (7,674,700) 11,499,100 (9,216,800) 8,393,100
DEQ Orphan Well Sub-Fund 1,762,500 1,245,500 (1,506,600) 1,300,000 (1,524,300) 1,277,100
DEQ Public Swimming Pool Fund 173,700 514,200 (585,500) 500,000 (530,700) 71,700
DEQ Public Utility Assessments 0 243,300 (243,300) 262,000 (262,000) 0
DEQ Public Water Supply Fees 1,174,000 3,939,800 (4,458,200) 3,400,000 (4,014,000) 41,600
DEQ Publication Revenue 72,600 100 (300) 0 (72,400) 0
DEQ Refined Petroleum Fund 0 51,680,000 (51,680,000) 51,791,200 (51,791,200) 0
DEQ Retired Engineers Technical Assistance Program 0 0 0 0 (887,900) 1,976,000
DEQ Revitalization Revolving Loan Fund 6,072,500 47,900 (7,100) 48,900 (5,000) 6,157,200
72,400
0
2,863,900
6,113,300
1,501,400
102,400
0
655,600
92,200
122,100
2,773,100
3,210,500
5,000
4,734,400
48,200
652,300
14,275,400
0
0
416,700
1,433,300
6,110,800
1,410,800
5,371,500
516,800
1,901,800
122,900
22,649,100
832,300
1,184,600
2,000
0
2,686,800
143,100
149,700
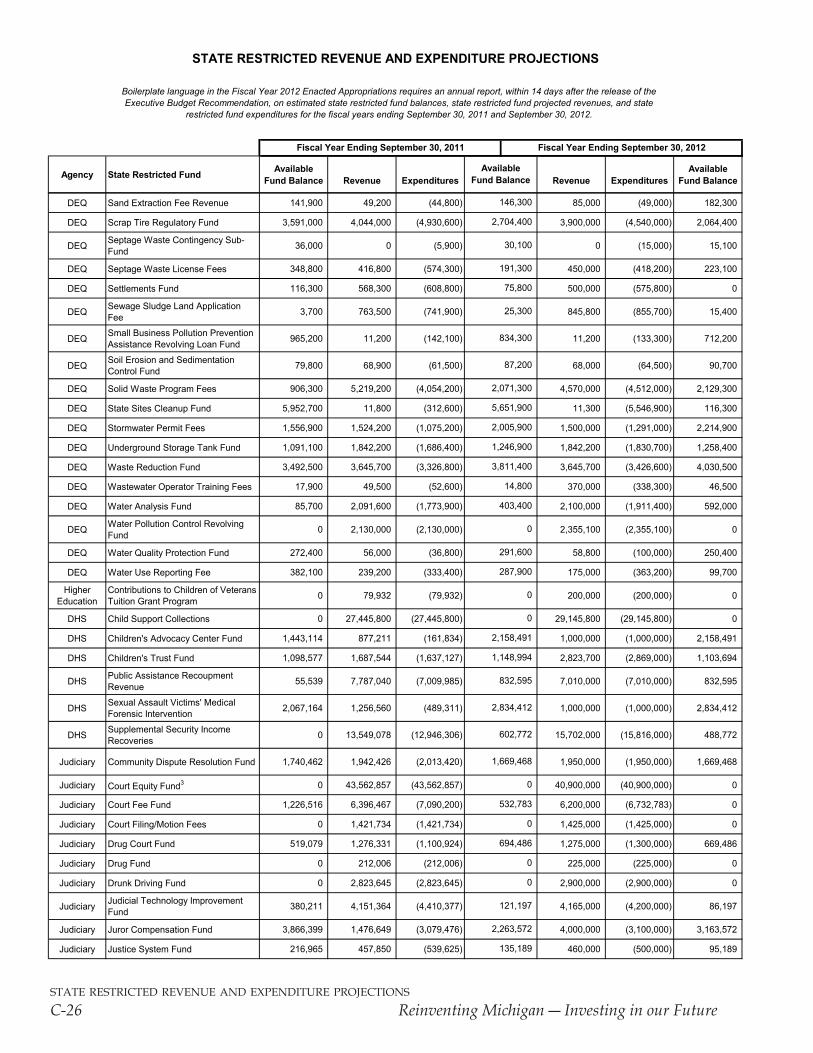
state restricted revenue and expenditure projections
C-26 ReinventingMichigan―InvestinginourFuture
Agency State Restricted Fund AvailableFund Balance Revenue Expenditures Revenue Expenditures
AvailableFund Balance
Boilerplate language in the Fiscal Year 2012 Enacted Appropriations requires an annual report, within 14 days after the release of the Executive Budget Recommendation, on estimated state restricted fund balances, state restricted fund projected revenues, and state
restricted fund expenditures for the fiscal years ending September 30, 2011 and September 30, 2012.
Fiscal Year Ending September 30, 2011
STATE RESTRICTED REVENUE AND EXPENDITURE PROJECTIONS
Fiscal Year Ending September 30, 2012
AvailableFund Balance
DEQ Sand Extraction Fee Revenue 141,900 49,200 (44,800) 85,000 (49,000) 182,300
DEQ Scrap Tire Regulatory Fund 3,591,000 4,044,000 (4,930,600) 3,900,000 (4,540,000) 2,064,400
DEQ Septage Waste Contingency Sub-Fund 36,000 0 (5,900) 0 (15,000) 15,100
DEQ Septage Waste License Fees 348,800 416,800 (574,300) 450,000 (418,200) 223,100
DEQ Settlements Fund 116,300 568,300 (608,800) 500,000 (575,800) 0
DEQ Sewage Sludge Land Application Fee 3,700 763,500 (741,900) 845,800 (855,700) 15,400
DEQ Small Business Pollution Prevention Assistance Revolving Loan Fund 965,200 11,200 (142,100) 11,200 (133,300) 712,200
DEQ Soil Erosion and Sedimentation Control Fund 79,800 68,900 (61,500) 68,000 (64,500) 90,700
DEQ Solid Waste Program Fees 906,300 5,219,200 (4,054,200) 4,570,000 (4,512,000) 2,129,300
DEQ State Sites Cleanup Fund 5,952,700 11,800 (312,600) 11,300 (5,546,900) 116,300
DEQ Stormwater Permit Fees 1,556,900 1,524,200 (1,075,200) 1,500,000 (1,291,000) 2,214,900
DEQ Underground Storage Tank Fund 1,091,100 1,842,200 (1,686,400) 1,842,200 (1,830,700) 1,258,400
DEQ Waste Reduction Fund 3,492,500 3,645,700 (3,326,800) 3,645,700 (3,426,600) 4,030,500
DEQ Wastewater Operator Training Fees 17,900 49,500 (52,600) 370,000 (338,300) 46,500
DEQ Water Analysis Fund 85,700 2,091,600 (1,773,900) 2,100,000 (1,911,400) 592,000
DEQ Water Pollution Control Revolving Fund 0 2,130,000 (2,130,000) 2,355,100 (2,355,100) 0
DEQ Water Quality Protection Fund 272,400 56,000 (36,800) 58,800 (100,000) 250,400
DEQ Water Use Reporting Fee 382,100 239,200 (333,400) 175,000 (363,200) 99,700
Higher Education
Contributions to Children of Veterans Tuition Grant Program 0 79,932 (79,932) 200,000 (200,000) 0
DHS Child Support Collections 0 27,445,800 (27,445,800) 29,145,800 (29,145,800) 0
DHS Children's Advocacy Center Fund 1,443,114 877,211 (161,834) 1,000,000 (1,000,000) 2,158,491
DHS Children's Trust Fund 1,098,577 1,687,544 (1,637,127) 2,823,700 (2,869,000) 1,103,694
DHS Public Assistance Recoupment Revenue 55,539 7,787,040 (7,009,985) 7,010,000 (7,010,000) 832,595
DHS Sexual Assault Victims' Medical Forensic Intervention 2,067,164 1,256,560 (489,311) 1,000,000 (1,000,000) 2,834,412
DHS Supplemental Security Income Recoveries 0 13,549,078 (12,946,306) 15,702,000 (15,816,000) 488,772
Judiciary Community Dispute Resolution Fund 1,740,462 1,942,426 (2,013,420) 1,950,000 (1,950,000) 1,669,468
Judiciary Court Equity Fund3 0 43,562,857 (43,562,857) 40,900,000 (40,900,000) 0
Judiciary Court Fee Fund 1,226,516 6,396,467 (7,090,200) 6,200,000 (6,732,783) 0
Judiciary Court Filing/Motion Fees 0 1,421,734 (1,421,734) 1,425,000 (1,425,000) 0
Judiciary Drug Court Fund 519,079 1,276,331 (1,100,924) 1,275,000 (1,300,000) 669,486
Judiciary Drug Fund 0 212,006 (212,006) 225,000 (225,000) 0
Judiciary Drunk Driving Fund 0 2,823,645 (2,823,645) 2,900,000 (2,900,000) 0
Judiciary Judicial Technology Improvement Fund 380,211 4,151,364 (4,410,377) 4,165,000 (4,200,000) 86,197
Judiciary Juror Compensation Fund 3,866,399 1,476,649 (3,079,476) 4,000,000 (3,100,000) 3,163,572
Judiciary Justice System Fund 216,965 457,850 (539,625) 460,000 (500,000) 95,189
121,197
2,263,572
135,189
532,783
0
694,486
0
0
832,595
2,834,412
602,772
1,669,468
0
291,600
287,900
0
2,158,491
1,148,994
1,246,900
3,811,400
14,800
403,400
0
834,300
87,200
2,071,300
5,651,900
2,005,900
2,704,400
30,100
191,300
75,800
25,300
146,300
0
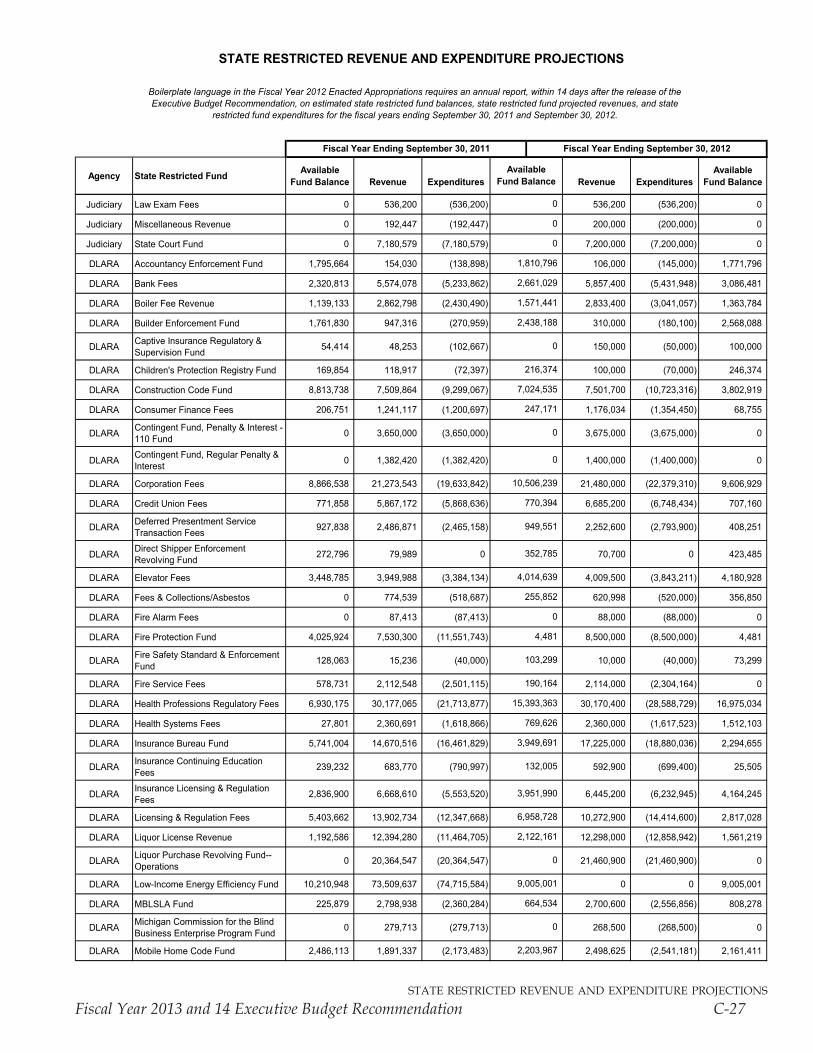
state restricted revenue and expenditure projections
Fiscal Year 2013 and 14 Executive Budget Recommendation C-27
Agency State Restricted Fund AvailableFund Balance Revenue Expenditures Revenue Expenditures
AvailableFund Balance
Boilerplate language in the Fiscal Year 2012 Enacted Appropriations requires an annual report, within 14 days after the release of the Executive Budget Recommendation, on estimated state restricted fund balances, state restricted fund projected revenues, and state
restricted fund expenditures for the fiscal years ending September 30, 2011 and September 30, 2012.
Fiscal Year Ending September 30, 2011
STATE RESTRICTED REVENUE AND EXPENDITURE PROJECTIONS
Fiscal Year Ending September 30, 2012
AvailableFund Balance
Judiciary Law Exam Fees 0 536,200 (536,200) 536,200 (536,200) 0
Judiciary Miscellaneous Revenue 0 192,447 (192,447) 200,000 (200,000) 0
Judiciary State Court Fund 0 7,180,579 (7,180,579) 7,200,000 (7,200,000) 0
DLARA Accountancy Enforcement Fund 1,795,664 154,030 (138,898) 106,000 (145,000) 1,771,796
DLARA Bank Fees 2,320,813 5,574,078 (5,233,862) 5,857,400 (5,431,948) 3,086,481
DLARA Boiler Fee Revenue 1,139,133 2,862,798 (2,430,490) 2,833,400 (3,041,057) 1,363,784
DLARA Builder Enforcement Fund 1,761,830 947,316 (270,959) 310,000 (180,100) 2,568,088
DLARA Captive Insurance Regulatory & Supervision Fund 54,414 48,253 (102,667) 150,000 (50,000) 100,000
DLARA Children's Protection Registry Fund 169,854 118,917 (72,397) 100,000 (70,000) 246,374
DLARA Construction Code Fund 8,813,738 7,509,864 (9,299,067) 7,501,700 (10,723,316) 3,802,919
DLARA Consumer Finance Fees 206,751 1,241,117 (1,200,697) 1,176,034 (1,354,450) 68,755
DLARA Contingent Fund, Penalty & Interest - 110 Fund 0 3,650,000 (3,650,000) 3,675,000 (3,675,000) 0
DLARA Contingent Fund, Regular Penalty & Interest 0 1,382,420 (1,382,420) 1,400,000 (1,400,000) 0
DLARA Corporation Fees 8,866,538 21,273,543 (19,633,842) 21,480,000 (22,379,310) 9,606,929
DLARA Credit Union Fees 771,858 5,867,172 (5,868,636) 6,685,200 (6,748,434) 707,160
DLARA Deferred Presentment Service Transaction Fees 927,838 2,486,871 (2,465,158) 2,252,600 (2,793,900) 408,251
DLARA Direct Shipper Enforcement Revolving Fund 272,796 79,989 0 70,700 0 423,485
DLARA Elevator Fees 3,448,785 3,949,988 (3,384,134) 4,009,500 (3,843,211) 4,180,928
DLARA Fees & Collections/Asbestos 0 774,539 (518,687) 620,998 (520,000) 356,850
DLARA Fire Alarm Fees 0 87,413 (87,413) 88,000 (88,000) 0
DLARA Fire Protection Fund 4,025,924 7,530,300 (11,551,743) 8,500,000 (8,500,000) 4,481
DLARA Fire Safety Standard & Enforcement Fund 128,063 15,236 (40,000) 10,000 (40,000) 73,299
DLARA Fire Service Fees 578,731 2,112,548 (2,501,115) 2,114,000 (2,304,164) 0
DLARA Health Professions Regulatory Fees 6,930,175 30,177,065 (21,713,877) 30,170,400 (28,588,729) 16,975,034
DLARA Health Systems Fees 27,801 2,360,691 (1,618,866) 2,360,000 (1,617,523) 1,512,103
DLARA Insurance Bureau Fund 5,741,004 14,670,516 (16,461,829) 17,225,000 (18,880,036) 2,294,655
DLARA Insurance Continuing Education Fees 239,232 683,770 (790,997) 592,900 (699,400) 25,505
DLARA Insurance Licensing & Regulation Fees 2,836,900 6,668,610 (5,553,520) 6,445,200 (6,232,945) 4,164,245
DLARA Licensing & Regulation Fees 5,403,662 13,902,734 (12,347,668) 10,272,900 (14,414,600) 2,817,028
DLARA Liquor License Revenue 1,192,586 12,394,280 (11,464,705) 12,298,000 (12,858,942) 1,561,219
DLARA Liquor Purchase Revolving Fund--Operations 0 20,364,547 (20,364,547) 21,460,900 (21,460,900) 0
DLARA Low-Income Energy Efficiency Fund 10,210,948 73,509,637 (74,715,584) 0 0 9,005,001
DLARA MBLSLA Fund 225,879 2,798,938 (2,360,284) 2,700,600 (2,556,856) 808,278
DLARA Michigan Commission for the Blind Business Enterprise Program Fund 0 279,713 (279,713) 268,500 (268,500) 0
DLARA Mobile Home Code Fund 2,486,113 1,891,337 (2,173,483) 2,498,625 (2,541,181) 2,161,411
664,534
0
3,951,990
6,958,728
2,122,161
0
9,005,001
190,164
15,393,363
769,626
3,949,691
132,005
4,014,639
255,852
0
4,481
103,299
0
10,506,239
770,394
949,551
352,785
0
216,374
7,024,535
247,171
0
0
1,810,796
2,661,029
1,571,441
2,438,188
0
0
2,203,967
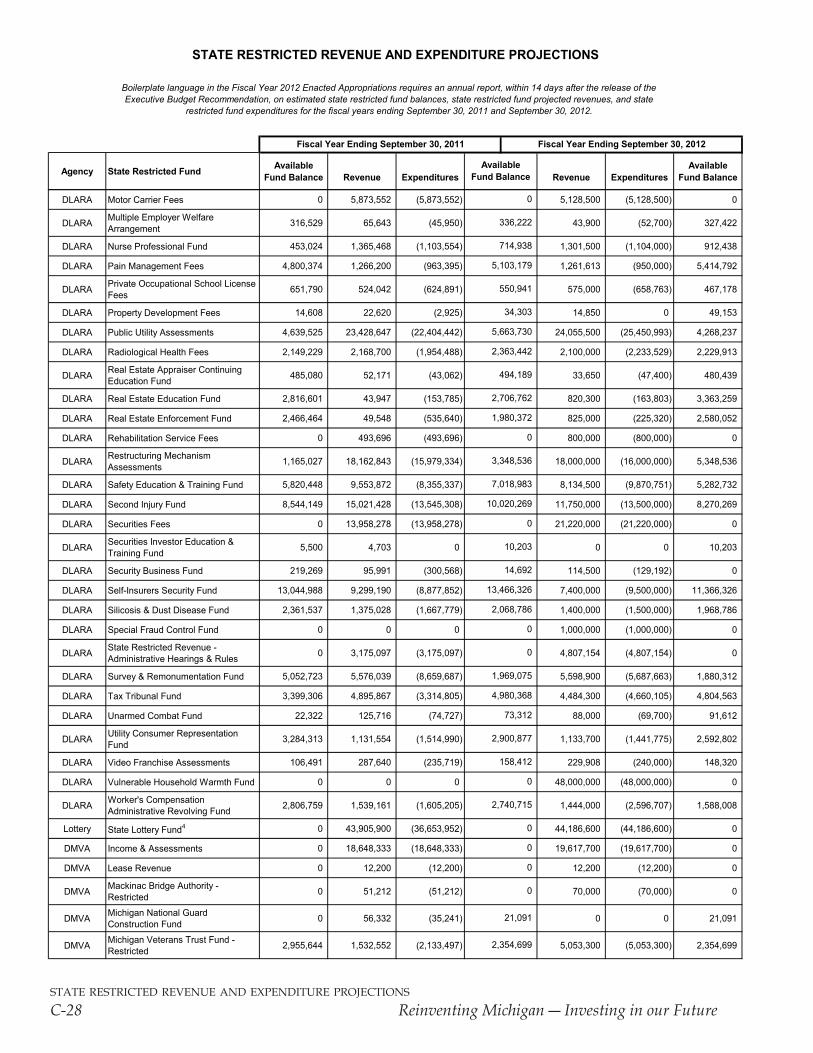
state restricted revenue and expenditure projections
C-28 ReinventingMichigan―InvestinginourFuture
Agency State Restricted Fund AvailableFund Balance Revenue Expenditures Revenue Expenditures
AvailableFund Balance
Boilerplate language in the Fiscal Year 2012 Enacted Appropriations requires an annual report, within 14 days after the release of the Executive Budget Recommendation, on estimated state restricted fund balances, state restricted fund projected revenues, and state
restricted fund expenditures for the fiscal years ending September 30, 2011 and September 30, 2012.
Fiscal Year Ending September 30, 2011
STATE RESTRICTED REVENUE AND EXPENDITURE PROJECTIONS
Fiscal Year Ending September 30, 2012
AvailableFund Balance
DLARA Motor Carrier Fees 0 5,873,552 (5,873,552) 5,128,500 (5,128,500) 0
DLARA Multiple Employer Welfare Arrangement 316,529 65,643 (45,950) 43,900 (52,700) 327,422
DLARA Nurse Professional Fund 453,024 1,365,468 (1,103,554) 1,301,500 (1,104,000) 912,438
DLARA Pain Management Fees 4,800,374 1,266,200 (963,395) 1,261,613 (950,000) 5,414,792
DLARA Private Occupational School License Fees 651,790 524,042 (624,891) 575,000 (658,763) 467,178
DLARA Property Development Fees 14,608 22,620 (2,925) 14,850 0 49,153
DLARA Public Utility Assessments 4,639,525 23,428,647 (22,404,442) 24,055,500 (25,450,993) 4,268,237
DLARA Radiological Health Fees 2,149,229 2,168,700 (1,954,488) 2,100,000 (2,233,529) 2,229,913
DLARA Real Estate Appraiser Continuing Education Fund 485,080 52,171 (43,062) 33,650 (47,400) 480,439
DLARA Real Estate Education Fund 2,816,601 43,947 (153,785) 820,300 (163,803) 3,363,259
DLARA Real Estate Enforcement Fund 2,466,464 49,548 (535,640) 825,000 (225,320) 2,580,052
DLARA Rehabilitation Service Fees 0 493,696 (493,696) 800,000 (800,000) 0
DLARA Restructuring Mechanism Assessments 1,165,027 18,162,843 (15,979,334) 18,000,000 (16,000,000) 5,348,536
DLARA Safety Education & Training Fund 5,820,448 9,553,872 (8,355,337) 8,134,500 (9,870,751) 5,282,732
DLARA Second Injury Fund 8,544,149 15,021,428 (13,545,308) 11,750,000 (13,500,000) 8,270,269
DLARA Securities Fees 0 13,958,278 (13,958,278) 21,220,000 (21,220,000) 0
DLARA Securities Investor Education & Training Fund 5,500 4,703 0 0 0 10,203
DLARA Security Business Fund 219,269 95,991 (300,568) 114,500 (129,192) 0
DLARA Self-Insurers Security Fund 13,044,988 9,299,190 (8,877,852) 7,400,000 (9,500,000) 11,366,326
DLARA Silicosis & Dust Disease Fund 2,361,537 1,375,028 (1,667,779) 1,400,000 (1,500,000) 1,968,786
DLARA Special Fraud Control Fund 0 0 0 1,000,000 (1,000,000) 0
DLARA State Restricted Revenue - Administrative Hearings & Rules 0 3,175,097 (3,175,097) 4,807,154 (4,807,154) 0
DLARA Survey & Remonumentation Fund 5,052,723 5,576,039 (8,659,687) 5,598,900 (5,687,663) 1,880,312
DLARA Tax Tribunal Fund 3,399,306 4,895,867 (3,314,805) 4,484,300 (4,660,105) 4,804,563
DLARA Unarmed Combat Fund 22,322 125,716 (74,727) 88,000 (69,700) 91,612
DLARA Utility Consumer Representation Fund 3,284,313 1,131,554 (1,514,990) 1,133,700 (1,441,775) 2,592,802
DLARA Video Franchise Assessments 106,491 287,640 (235,719) 229,908 (240,000) 148,320
DLARA Vulnerable Household Warmth Fund 0 0 0 48,000,000 (48,000,000) 0
DLARA Worker's Compensation Administrative Revolving Fund 2,806,759 1,539,161 (1,605,205) 1,444,000 (2,596,707) 1,588,008
Lottery State Lottery Fund4 0 43,905,900 (36,653,952) 44,186,600 (44,186,600) 0
DMVA Income & Assessments 0 18,648,333 (18,648,333) 19,617,700 (19,617,700) 0
DMVA Lease Revenue 0 12,200 (12,200) 12,200 (12,200) 0
DMVA Mackinac Bridge Authority - Restricted 0 51,212 (51,212) 70,000 (70,000) 0
DMVA Michigan National Guard Construction Fund 0 56,332 (35,241) 0 0 21,091
DMVA Michigan Veterans Trust Fund - Restricted 2,955,644 1,532,552 (2,133,497) 5,053,300 (5,053,300) 2,354,699
10,203
14,692
13,466,326
2,068,786
0
0
3,348,536
7,018,983
10,020,269
0
0
336,222
714,938
5,103,179
550,941
34,303
5,663,730
2,363,442
494,189
2,706,762
1,980,372
0
0
21,091
2,354,699
0
1,969,075
4,980,368
73,312
2,900,877
158,412
0
2,740,715
0
0
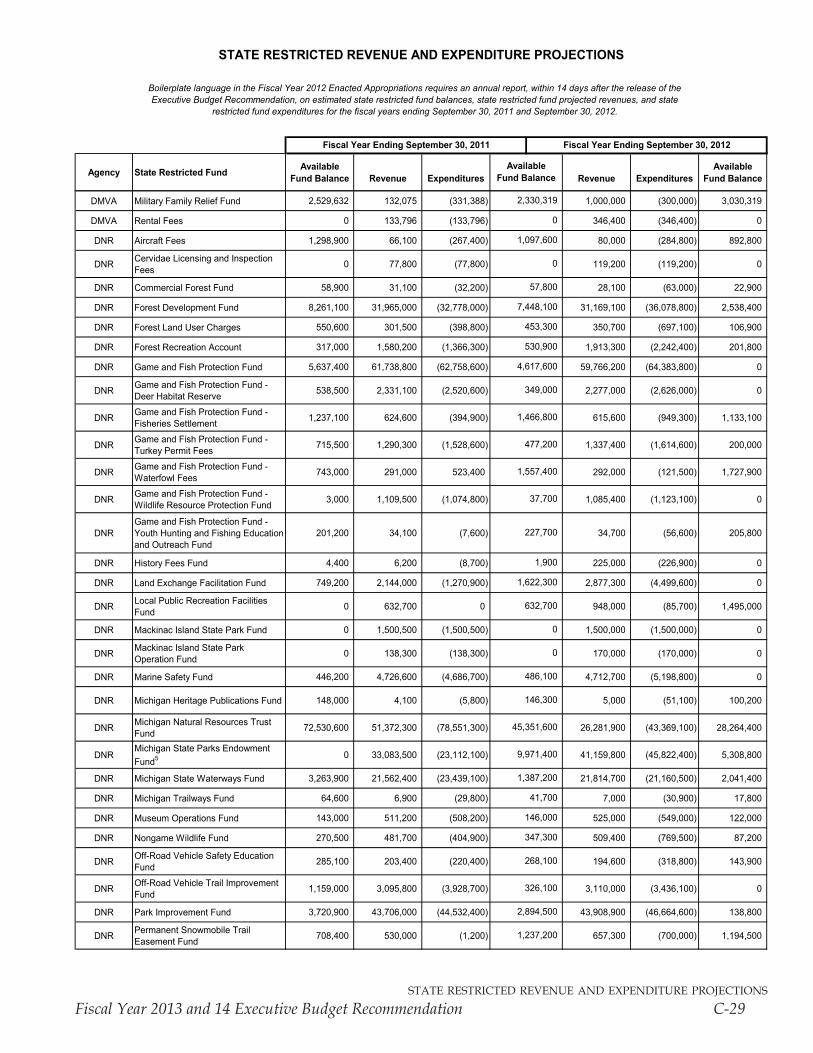
state restricted revenue and expenditure projections
Fiscal Year 2013 and 14 Executive Budget Recommendation C-29
Agency State Restricted Fund AvailableFund Balance Revenue Expenditures Revenue Expenditures
AvailableFund Balance
Boilerplate language in the Fiscal Year 2012 Enacted Appropriations requires an annual report, within 14 days after the release of the Executive Budget Recommendation, on estimated state restricted fund balances, state restricted fund projected revenues, and state
restricted fund expenditures for the fiscal years ending September 30, 2011 and September 30, 2012.
Fiscal Year Ending September 30, 2011
STATE RESTRICTED REVENUE AND EXPENDITURE PROJECTIONS
Fiscal Year Ending September 30, 2012
AvailableFund Balance
DMVA Military Family Relief Fund 2,529,632 132,075 (331,388) 1,000,000 (300,000) 3,030,319
DMVA Rental Fees 0 133,796 (133,796) 346,400 (346,400) 0
DNR Aircraft Fees 1,298,900 66,100 (267,400) 80,000 (284,800) 892,800
DNR Cervidae Licensing and Inspection Fees 0 77,800 (77,800) 119,200 (119,200) 0
DNR Commercial Forest Fund 58,900 31,100 (32,200) 28,100 (63,000) 22,900
DNR Forest Development Fund 8,261,100 31,965,000 (32,778,000) 31,169,100 (36,078,800) 2,538,400
DNR Forest Land User Charges 550,600 301,500 (398,800) 350,700 (697,100) 106,900
DNR Forest Recreation Account 317,000 1,580,200 (1,366,300) 1,913,300 (2,242,400) 201,800
DNR Game and Fish Protection Fund 5,637,400 61,738,800 (62,758,600) 59,766,200 (64,383,800) 0
DNR Game and Fish Protection Fund - Deer Habitat Reserve 538,500 2,331,100 (2,520,600) 2,277,000 (2,626,000) 0
DNR Game and Fish Protection Fund - Fisheries Settlement 1,237,100 624,600 (394,900) 615,600 (949,300) 1,133,100
DNR Game and Fish Protection Fund - Turkey Permit Fees 715,500 1,290,300 (1,528,600) 1,337,400 (1,614,600) 200,000
DNR Game and Fish Protection Fund - Waterfowl Fees 743,000 291,000 523,400 292,000 (121,500) 1,727,900
DNR Game and Fish Protection Fund - Wildlife Resource Protection Fund 3,000 1,109,500 (1,074,800) 1,085,400 (1,123,100) 0
DNRGame and Fish Protection Fund - Youth Hunting and Fishing Education and Outreach Fund
201,200 34,100 (7,600) 34,700 (56,600) 205,800
DNR History Fees Fund 4,400 6,200 (8,700) 225,000 (226,900) 0
DNR Land Exchange Facilitation Fund 749,200 2,144,000 (1,270,900) 2,877,300 (4,499,600) 0
DNR Local Public Recreation Facilities Fund 0 632,700 0 948,000 (85,700) 1,495,000
DNR Mackinac Island State Park Fund 0 1,500,500 (1,500,500) 1,500,000 (1,500,000) 0
DNR Mackinac Island State Park Operation Fund 0 138,300 (138,300) 170,000 (170,000) 0
DNR Marine Safety Fund 446,200 4,726,600 (4,686,700) 4,712,700 (5,198,800) 0
DNR Michigan Heritage Publications Fund 148,000 4,100 (5,800) 5,000 (51,100) 100,200
DNR Michigan Natural Resources Trust Fund 72,530,600 51,372,300 (78,551,300) 26,281,900 (43,369,100) 28,264,400
DNRMichigan State Parks Endowment Fund5 0 33,083,500 (23,112,100) 41,159,800 (45,822,400) 5,308,800
DNR Michigan State Waterways Fund 3,263,900 21,562,400 (23,439,100) 21,814,700 (21,160,500) 2,041,400
DNR Michigan Trailways Fund 64,600 6,900 (29,800) 7,000 (30,900) 17,800
DNR Museum Operations Fund 143,000 511,200 (508,200) 525,000 (549,000) 122,000
DNR Nongame Wildlife Fund 270,500 481,700 (404,900) 509,400 (769,500) 87,200
DNR Off-Road Vehicle Safety Education Fund 285,100 203,400 (220,400) 194,600 (318,800) 143,900
DNR Off-Road Vehicle Trail Improvement Fund 1,159,000 3,095,800 (3,928,700) 3,110,000 (3,436,100) 0
DNR Park Improvement Fund 3,720,900 43,706,000 (44,532,400) 43,908,900 (46,664,600) 138,800
DNR Permanent Snowmobile Trail Easement Fund 708,400 530,000 (1,200) 657,300 (700,000) 1,194,500
146,300
45,351,600
9,971,400
1,387,200
1,900
1,622,300
632,700
0
0
1,466,800
477,200
1,557,400
37,700
227,700
7,448,100
2,894,500
1,237,200
41,700
146,000
347,300
268,100
326,100
486,100
453,300
530,900
4,617,600
349,000
2,330,319
0
1,097,600
0
57,800
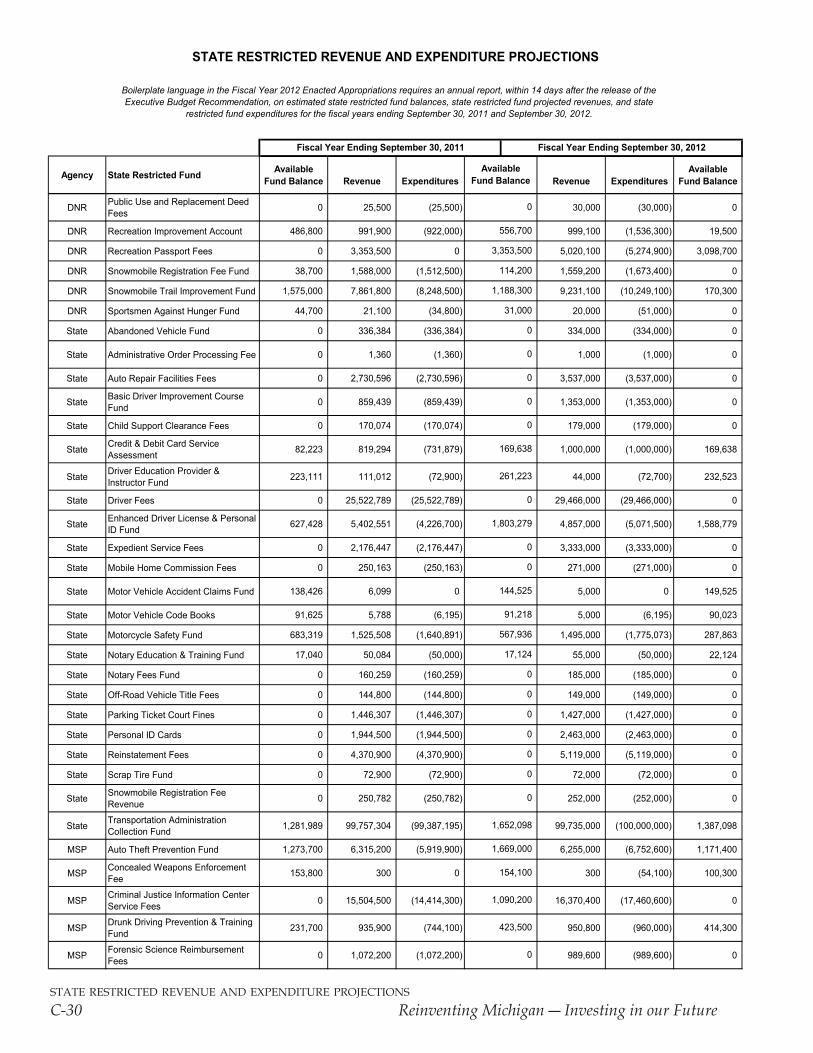
state restricted revenue and expenditure projections
C-30 ReinventingMichigan―InvestinginourFuture
Agency State Restricted Fund AvailableFund Balance Revenue Expenditures Revenue Expenditures
AvailableFund Balance
Boilerplate language in the Fiscal Year 2012 Enacted Appropriations requires an annual report, within 14 days after the release of the Executive Budget Recommendation, on estimated state restricted fund balances, state restricted fund projected revenues, and state
restricted fund expenditures for the fiscal years ending September 30, 2011 and September 30, 2012.
Fiscal Year Ending September 30, 2011
STATE RESTRICTED REVENUE AND EXPENDITURE PROJECTIONS
Fiscal Year Ending September 30, 2012
AvailableFund Balance
DNR Public Use and Replacement Deed Fees 0 25,500 (25,500) 30,000 (30,000) 0
DNR Recreation Improvement Account 486,800 991,900 (922,000) 999,100 (1,536,300) 19,500
DNR Recreation Passport Fees 0 3,353,500 0 5,020,100 (5,274,900) 3,098,700
DNR Snowmobile Registration Fee Fund 38,700 1,588,000 (1,512,500) 1,559,200 (1,673,400) 0
DNR Snowmobile Trail Improvement Fund 1,575,000 7,861,800 (8,248,500) 9,231,100 (10,249,100) 170,300
DNR Sportsmen Against Hunger Fund 44,700 21,100 (34,800) 20,000 (51,000) 0
State Abandoned Vehicle Fund 0 336,384 (336,384) 334,000 (334,000) 0
State Administrative Order Processing Fee 0 1,360 (1,360) 1,000 (1,000) 0
State Auto Repair Facilities Fees 0 2,730,596 (2,730,596) 3,537,000 (3,537,000) 0
State Basic Driver Improvement Course Fund 0 859,439 (859,439) 1,353,000 (1,353,000) 0
State Child Support Clearance Fees 0 170,074 (170,074) 179,000 (179,000) 0
State Credit & Debit Card Service Assessment 82,223 819,294 (731,879) 1,000,000 (1,000,000) 169,638
State Driver Education Provider & Instructor Fund 223,111 111,012 (72,900) 44,000 (72,700) 232,523
State Driver Fees 0 25,522,789 (25,522,789) 29,466,000 (29,466,000) 0
State Enhanced Driver License & Personal ID Fund 627,428 5,402,551 (4,226,700) 4,857,000 (5,071,500) 1,588,779
State Expedient Service Fees 0 2,176,447 (2,176,447) 3,333,000 (3,333,000) 0
State Mobile Home Commission Fees 0 250,163 (250,163) 271,000 (271,000) 0
State Motor Vehicle Accident Claims Fund 138,426 6,099 0 5,000 0 149,525
State Motor Vehicle Code Books 91,625 5,788 (6,195) 5,000 (6,195) 90,023
State Motorcycle Safety Fund 683,319 1,525,508 (1,640,891) 1,495,000 (1,775,073) 287,863
State Notary Education & Training Fund 17,040 50,084 (50,000) 55,000 (50,000) 22,124
State Notary Fees Fund 0 160,259 (160,259) 185,000 (185,000) 0
State Off-Road Vehicle Title Fees 0 144,800 (144,800) 149,000 (149,000) 0
State Parking Ticket Court Fines 0 1,446,307 (1,446,307) 1,427,000 (1,427,000) 0
State Personal ID Cards 0 1,944,500 (1,944,500) 2,463,000 (2,463,000) 0
State Reinstatement Fees 0 4,370,900 (4,370,900) 5,119,000 (5,119,000) 0
State Scrap Tire Fund 0 72,900 (72,900) 72,000 (72,000) 0
State Snowmobile Registration Fee Revenue 0 250,782 (250,782) 252,000 (252,000) 0
State Transportation Administration Collection Fund 1,281,989 99,757,304 (99,387,195) 99,735,000 (100,000,000) 1,387,098
MSP Auto Theft Prevention Fund 1,273,700 6,315,200 (5,919,900) 6,255,000 (6,752,600) 1,171,400
MSP Concealed Weapons Enforcement Fee 153,800 300 0 300 (54,100) 100,300
MSP Criminal Justice Information Center Service Fees 0 15,504,500 (14,414,300) 16,370,400 (17,460,600) 0
MSP Drunk Driving Prevention & Training Fund 231,700 935,900 (744,100) 950,800 (960,000) 414,300
MSP Forensic Science Reimbursement Fees 0 1,072,200 (1,072,200) 989,600 (989,600) 0
114,200
1,188,300
31,000
0
0
556,700
3,353,500
0
0
0
0
0
0
0
0
169,638
261,223
0
1,803,279
0
0
144,525
91,218
567,936
17,124
0
154,100
1,669,000
1,652,098
0
0
0
423,500
1,090,200
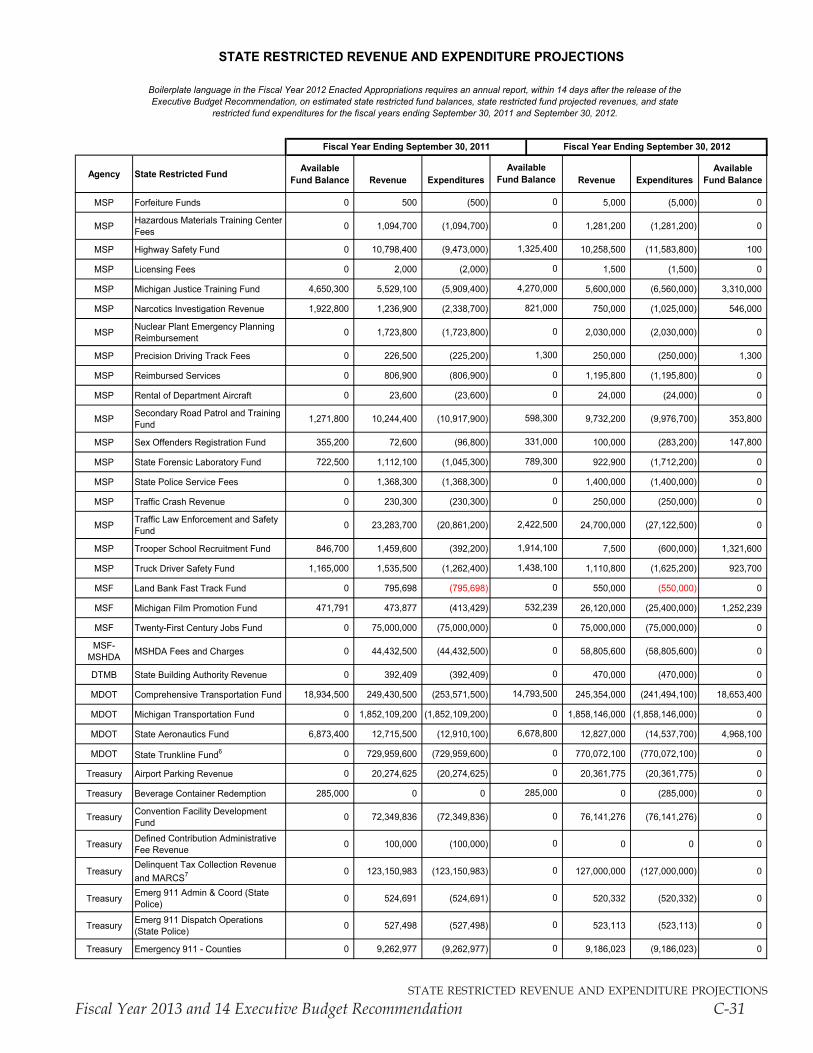
state restricted revenue and expenditure projections
Fiscal Year 2013 and 14 Executive Budget Recommendation C-31
Agency State Restricted Fund AvailableFund Balance Revenue Expenditures Revenue Expenditures
AvailableFund Balance
Boilerplate language in the Fiscal Year 2012 Enacted Appropriations requires an annual report, within 14 days after the release of the Executive Budget Recommendation, on estimated state restricted fund balances, state restricted fund projected revenues, and state
restricted fund expenditures for the fiscal years ending September 30, 2011 and September 30, 2012.
Fiscal Year Ending September 30, 2011
STATE RESTRICTED REVENUE AND EXPENDITURE PROJECTIONS
Fiscal Year Ending September 30, 2012
AvailableFund Balance
MSP Forfeiture Funds 0 500 (500) 5,000 (5,000) 0
MSP Hazardous Materials Training Center Fees 0 1,094,700 (1,094,700) 1,281,200 (1,281,200) 0
MSP Highway Safety Fund 0 10,798,400 (9,473,000) 10,258,500 (11,583,800) 100
MSP Licensing Fees 0 2,000 (2,000) 1,500 (1,500) 0
MSP Michigan Justice Training Fund 4,650,300 5,529,100 (5,909,400) 5,600,000 (6,560,000) 3,310,000
MSP Narcotics Investigation Revenue 1,922,800 1,236,900 (2,338,700) 750,000 (1,025,000) 546,000
MSP Nuclear Plant Emergency Planning Reimbursement 0 1,723,800 (1,723,800) 2,030,000 (2,030,000) 0
MSP Precision Driving Track Fees 0 226,500 (225,200) 250,000 (250,000) 1,300
MSP Reimbursed Services 0 806,900 (806,900) 1,195,800 (1,195,800) 0
MSP Rental of Department Aircraft 0 23,600 (23,600) 24,000 (24,000) 0
MSP Secondary Road Patrol and Training Fund 1,271,800 10,244,400 (10,917,900) 9,732,200 (9,976,700) 353,800
MSP Sex Offenders Registration Fund 355,200 72,600 (96,800) 100,000 (283,200) 147,800
MSP State Forensic Laboratory Fund 722,500 1,112,100 (1,045,300) 922,900 (1,712,200) 0
MSP State Police Service Fees 0 1,368,300 (1,368,300) 1,400,000 (1,400,000) 0
MSP Traffic Crash Revenue 0 230,300 (230,300) 250,000 (250,000) 0
MSP Traffic Law Enforcement and Safety Fund 0 23,283,700 (20,861,200) 24,700,000 (27,122,500) 0
MSP Trooper School Recruitment Fund 846,700 1,459,600 (392,200) 7,500 (600,000) 1,321,600
MSP Truck Driver Safety Fund 1,165,000 1,535,500 (1,262,400) 1,110,800 (1,625,200) 923,700
MSF Land Bank Fast Track Fund 0 795,698 (795,698) 550,000 (550,000) 0
MSF Michigan Film Promotion Fund 471,791 473,877 (413,429) 26,120,000 (25,400,000) 1,252,239
MSF Twenty-First Century Jobs Fund 0 75,000,000 (75,000,000) 75,000,000 (75,000,000) 0
MSF-MSHDA MSHDA Fees and Charges 0 44,432,500 (44,432,500) 58,805,600 (58,805,600) 0
DTMB State Building Authority Revenue 0 392,409 (392,409) 470,000 (470,000) 0
MDOT Comprehensive Transportation Fund 18,934,500 249,430,500 (253,571,500) 245,354,000 (241,494,100) 18,653,400
MDOT Michigan Transportation Fund 0 1,852,109,200 (1,852,109,200) 1,858,146,000 (1,858,146,000) 0
MDOT State Aeronautics Fund 6,873,400 12,715,500 (12,910,100) 12,827,000 (14,537,700) 4,968,100
MDOT State Trunkline Fund6 0 729,959,600 (729,959,600) 770,072,100 (770,072,100) 0
Treasury Airport Parking Revenue 0 20,274,625 (20,274,625) 20,361,775 (20,361,775) 0
Treasury Beverage Container Redemption 285,000 0 0 0 (285,000) 0
Treasury Convention Facility Development Fund 0 72,349,836 (72,349,836) 76,141,276 (76,141,276) 0
Treasury Defined Contribution Administrative Fee Revenue 0 100,000 (100,000) 0 0 0
TreasuryDelinquent Tax Collection Revenue and MARCS7 0 123,150,983 (123,150,983) 127,000,000 (127,000,000) 0
Treasury Emerg 911 Admin & Coord (State Police) 0 524,691 (524,691) 520,332 (520,332) 0
Treasury Emerg 911 Dispatch Operations (State Police) 0 527,498 (527,498) 523,113 (523,113) 0
Treasury Emergency 911 - Counties 0 9,262,977 (9,262,977) 9,186,023 (9,186,023) 0
1,300
0
0
0
6,678,800
0
14,793,500
0
0
0
532,239
1,438,100
1,914,100
2,422,500
0
0
789,300
0
821,000
4,270,000
0
1,325,400
331,000
598,300
0
0
285,000
0
0
0
0
0
0
0
0
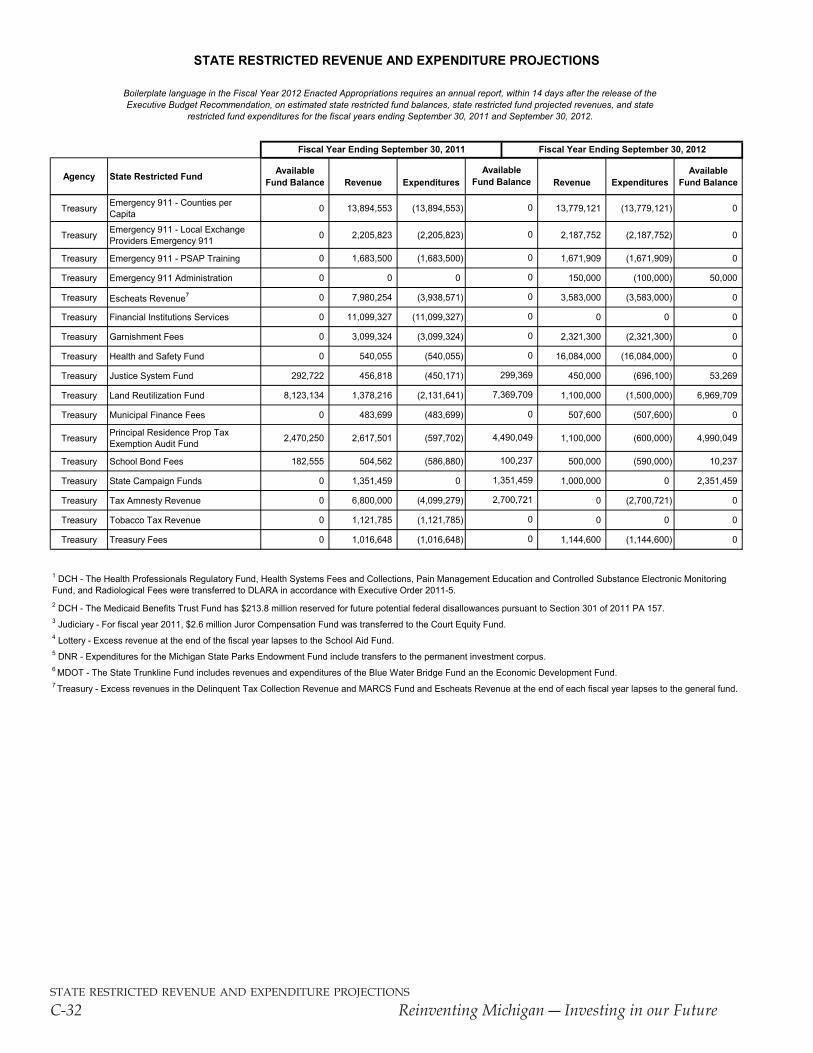
state restricted revenue and expenditure projections
C-32 ReinventingMichigan―InvestinginourFuture
Agency State Restricted Fund AvailableFund Balance Revenue Expenditures Revenue Expenditures
AvailableFund Balance
Boilerplate language in the Fiscal Year 2012 Enacted Appropriations requires an annual report, within 14 days after the release of the Executive Budget Recommendation, on estimated state restricted fund balances, state restricted fund projected revenues, and state
restricted fund expenditures for the fiscal years ending September 30, 2011 and September 30, 2012.
Fiscal Year Ending September 30, 2011
STATE RESTRICTED REVENUE AND EXPENDITURE PROJECTIONS
Fiscal Year Ending September 30, 2012
AvailableFund Balance
Treasury Emergency 911 - Counties per Capita 0 13,894,553 (13,894,553) 13,779,121 (13,779,121) 0
Treasury Emergency 911 - Local Exchange Providers Emergency 911 0 2,205,823 (2,205,823) 2,187,752 (2,187,752) 0
Treasury Emergency 911 - PSAP Training 0 1,683,500 (1,683,500) 1,671,909 (1,671,909) 0
Treasury Emergency 911 Administration 0 0 0 150,000 (100,000) 50,000
Treasury Escheats Revenue7 0 7,980,254 (3,938,571) 3,583,000 (3,583,000) 0
Treasury Financial Institutions Services 0 11,099,327 (11,099,327) 0 0 0
Treasury Garnishment Fees 0 3,099,324 (3,099,324) 2,321,300 (2,321,300) 0
Treasury Health and Safety Fund 0 540,055 (540,055) 16,084,000 (16,084,000) 0
Treasury Justice System Fund 292,722 456,818 (450,171) 450,000 (696,100) 53,269
Treasury Land Reutilization Fund 8,123,134 1,378,216 (2,131,641) 1,100,000 (1,500,000) 6,969,709
Treasury Municipal Finance Fees 0 483,699 (483,699) 507,600 (507,600) 0
Treasury Principal Residence Prop Tax Exemption Audit Fund 2,470,250 2,617,501 (597,702) 1,100,000 (600,000) 4,990,049
Treasury School Bond Fees 182,555 504,562 (586,880) 500,000 (590,000) 10,237
Treasury State Campaign Funds 0 1,351,459 0 1,000,000 0 2,351,459
Treasury Tax Amnesty Revenue 0 6,800,000 (4,099,279) 0 (2,700,721) 0
Treasury Tobacco Tax Revenue 0 1,121,785 (1,121,785) 0 0 0
Treasury Treasury Fees 0 1,016,648 (1,016,648) 1,144,600 (1,144,600) 0
2 DCH - The Medicaid Benefits Trust Fund has $213.8 million reserved for future potential federal disallowances pursuant to Section 301 of 2011 PA 157.3 Judiciary - For fiscal year 2011, $2.6 million Juror Compensation Fund was transferred to the Court Equity Fund.4 Lottery - Excess revenue at the end of the fiscal year lapses to the School Aid Fund.5 DNR - Expenditures for the Michigan State Parks Endowment Fund include transfers to the permanent investment corpus.6 MDOT - The State Trunkline Fund includes revenues and expenditures of the Blue Water Bridge Fund an the Economic Development Fund.7 Treasury - Excess revenues in the Delinquent Tax Collection Revenue and MARCS Fund and Escheats Revenue at the end of each fiscal year lapses to the general fund.
1 DCH - The Health Professionals Regulatory Fund, Health Systems Fees and Collections, Pain Management Education and Controlled Substance Electronic Monitoring Fund, and Radiological Fees were transferred to DLARA in accordance with Executive Order 2011-5.
0
0
0
4,490,049
100,237
1,351,459
2,700,721
0
0
0
0
0
0
0
299,369
7,369,709
0
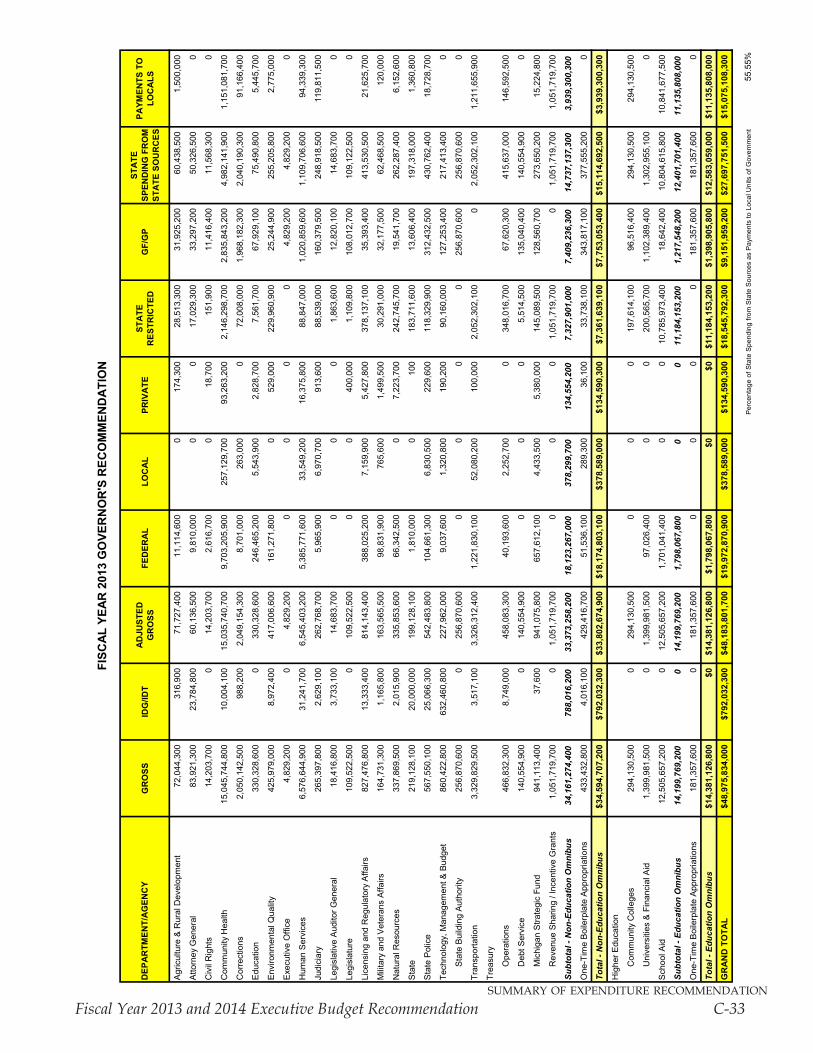
summary of expenditure recommendation
Fiscal Year 2013 and 2014 Executive Budget Recommendation C-33
DEP
AR
TMEN
T/A
GEN
CY
GR
OSS
IDG
/IDT
AD
JUST
ED
GR
OSS
FED
ERA
LLO
CA
LPR
IVA
TEST
ATE
R
ESTR
ICTE
DG
F/G
PST
ATE
SP
END
ING
FR
OM
ST
ATE
SO
UR
CES
PAYM
ENTS
TO
LO
CA
LS
Agr
icul
ture
& R
ural
Dev
elop
men
t72
,044
,300
316,
900
71,7
27,4
0011
,114
,600
017
4,30
028
,513
,300
31,9
25,2
0060
,438
,500
1,50
0,00
0
Atto
rney
Gen
eral
83,9
21,3
0023
,784
,800
60,1
36,5
009,
810,
000
00
17,0
29,3
0033
,297
,200
50,3
26,5
000
Civ
il R
ight
s14
,203
,700
014
,203
,700
2,61
6,70
00
18,7
0015
1,90
011
,416
,400
11,5
68,3
000
Com
mun
ity H
ealth
15,0
45,7
44,8
0010
,004
,100
15,0
35,7
40,7
009,
703,
205,
900
257,
129,
700
93,2
63,2
002,
146,
298,
700
2,83
5,84
3,20
04,
982,
141,
900
1,15
1,08
1,70
0
Cor
rect
ions
2,05
0,14
2,50
098
8,20
02,
049,
154,
300
8,70
1,00
026
3,00
00
72,0
08,0
001,
968,
182,
300
2,04
0,19
0,30
091
,166
,400
Edu
catio
n33
0,32
8,60
00
330,
328,
600
246,
465,
200
5,54
3,90
02,
828,
700
7,56
1,70
067
,929
,100
75,4
90,8
005,
445,
700
Env
ironm
enta
l Qua
lity
425,
979,
000
8,97
2,40
041
7,00
6,60
016
1,27
1,80
00
529,
000
229,
960,
900
25,2
44,9
0025
5,20
5,80
02,
775,
000
Exe
cutiv
e O
ffice
4,82
9,20
00
4,82
9,20
00
00
04,
829,
200
4,82
9,20
00
Hum
an S
ervi
ces
6,57
6,64
4,90
031
,241
,700
6,54
5,40
3,20
05,
385,
771,
600
33,5
49,2
0016
,375
,800
88,8
47,0
001,
020,
859,
600
1,10
9,70
6,60
094
,339
,300
Judi
ciar
y26
5,39
7,80
02,
629,
100
262,
768,
700
5,96
5,90
06,
970,
700
913,
600
88,5
39,0
0016
0,37
9,50
024
8,91
8,50
011
9,81
1,50
0
Legi
slat
ive
Aud
itor G
ener
al18
,416
,800
3,73
3,10
014
,683
,700
00
01,
863,
600
12,8
20,1
0014
,683
,700
0
Legi
slat
ure
109,
522,
500
010
9,52
2,50
00
040
0,00
01,
109,
800
108,
012,
700
109,
122,
500
0
Lice
nsin
g an
d R
egul
ator
y A
ffairs
827,
476,
800
13,3
33,4
0081
4,14
3,40
038
8,02
5,20
07,
159,
900
5,42
7,80
037
8,13
7,10
035
,393
,400
413,
530,
500
21,6
25,7
00
Mili
tary
and
Vet
eran
s A
ffairs
164,
731,
300
1,16
5,80
016
3,56
5,50
098
,831
,900
765,
600
1,49
9,50
030
,291
,000
32,1
77,5
0062
,468
,500
120,
000
Nat
ural
Res
ourc
es33
7,86
9,50
02,
015,
900
335,
853,
600
66,3
42,5
000
7,22
3,70
024
2,74
5,70
019
,541
,700
262,
287,
400
6,15
2,60
0
Sta
te21
9,12
8,10
020
,000
,000
199,
128,
100
1,81
0,00
00
100
183,
711,
600
13,6
06,4
0019
7,31
8,00
01,
360,
800
Sta
te P
olic
e56
7,55
0,10
025
,066
,300
542,
483,
800
104,
661,
300
6,83
0,50
022
9,60
011
8,32
9,90
031
2,43
2,50
043
0,76
2,40
018
,728
,700
Tech
nolo
gy, M
anag
emen
t & B
udge
t86
0,42
2,80
063
2,46
0,80
022
7,96
2,00
09,
037,
600
1,32
0,80
019
0,20
090
,160
,000
127,
253,
400
217,
413,
400
0
Sta
te B
uild
ing
Aut
horit
y25
6,87
0,60
00
256,
870,
600
00
00
256,
870,
600
256,
870,
600
0
Tran
spor
tatio
n3,
329,
829,
500
3,51
7,10
03,
326,
312,
400
1,22
1,83
0,10
052
,080
,200
100,
000
2,05
2,30
2,10
00
2,05
2,30
2,10
01,
211,
655,
900
Trea
sury
Ope
ratio
ns46
6,83
2,30
08,
749,
000
458,
083,
300
40,1
93,6
002,
252,
700
034
8,01
6,70
067
,620
,300
415,
637,
000
146,
592,
500
Deb
t Ser
vice
140,
554,
900
014
0,55
4,90
00
00
5,51
4,50
013
5,04
0,40
014
0,55
4,90
00
Mic
higa
n S
trate
gic
Fund
941,
113,
400
37,6
0094
1,07
5,80
065
7,61
2,10
04,
433,
500
5,38
0,00
014
5,08
9,50
012
8,56
0,70
027
3,65
0,20
015
,224
,800
Rev
enue
Sha
ring
/ Inc
entiv
e G
rant
s1,
051,
719,
700
01,
051,
719,
700
00
01,
051,
719,
700
01,
051,
719,
700
1,05
1,71
9,70
0
Subt
otal
- N
on-E
duca
tion
Om
nibu
s34
,161
,274
,400
788,
016,
200
33,3
73,2
58,2
0018
,123
,267
,000
378,
299,
700
134,
554,
200
7,32
7,90
1,00
07,
409,
236,
300
14,7
37,1
37,3
003,
939,
300,
300
One
-Tim
e B
oile
rpla
te A
ppro
pria
tions
433,
432,
800
4,01
6,10
042
9,41
6,70
051
,536
,100
289,
300
36,1
0033
,738
,100
343,
817,
100
377,
555,
200
0
Tota
l - N
on-E
duca
tion
Om
nibu
s$3
4,59
4,70
7,20
0$7
92,0
32,3
00$3
3,80
2,67
4,90
0$1
8,17
4,80
3,10
0$3
78,5
89,0
00$1
34,5
90,3
00$7
,361
,639
,100
$7,7
53,0
53,4
00$1
5,11
4,69
2,50
0$3
,939
,300
,300
Hig
her E
duca
tion
Com
mun
ity C
olle
ges
294,
130,
500
029
4,13
0,50
00
00
197,
614,
100
96,5
16,4
0029
4,13
0,50
029
4,13
0,50
0
Uni
vers
ities
& F
inan
cial
Aid
1,39
9,98
1,50
00
1,39
9,98
1,50
097
,026
,400
00
200,
565,
700
1,10
2,38
9,40
01,
302,
955,
100
0
Sch
ool A
id12
,505
,657
,200
012
,505
,657
,200
1,70
1,04
1,40
00
010
,785
,973
,400
18,6
42,4
0010
,804
,615
,800
10,8
41,6
77,5
00
Subt
otal
- Ed
ucat
ion
Om
nibu
s14
,199
,769
,200
014
,199
,769
,200
1,79
8,06
7,80
00
011
,184
,153
,200
1,21
7,54
8,20
012
,401
,701
,400
11,1
35,8
08,0
00
One
-Tim
e B
oile
rpla
te A
ppro
pria
tions
181,
357,
600
018
1,35
7,60
00
00
018
1,35
7,60
018
1,35
7,60
00
Tota
l - E
duca
tion
Om
nibu
s$1
4,38
1,12
6,80
0$0
$14,
381,
126,
800
$1,7
98,0
67,8
00$0
$0$1
1,18
4,15
3,20
0$1
,398
,905
,800
$12,
583,
059,
000
$11,
135,
808,
000
GR
AN
D T
OTA
L$4
8,97
5,83
4,00
0$7
92,0
32,3
00$4
8,18
3,80
1,70
0$1
9,97
2,87
0,90
0$3
78,5
89,0
00$1
34,5
90,3
00$1
8,54
5,79
2,30
0$9
,151
,959
,200
$27,
697,
751,
500
$15,
075,
108,
300
Per
cent
age
of S
tate
Spe
ndin
g fro
m S
tate
Sou
rces
as
Pay
men
ts to
Loc
al U
nits
of G
over
nmen
t55
.55%
FISC
AL
YEAR
201
3 G
OVE
RN
OR
'S R
ECO
MM
END
ATIO
N
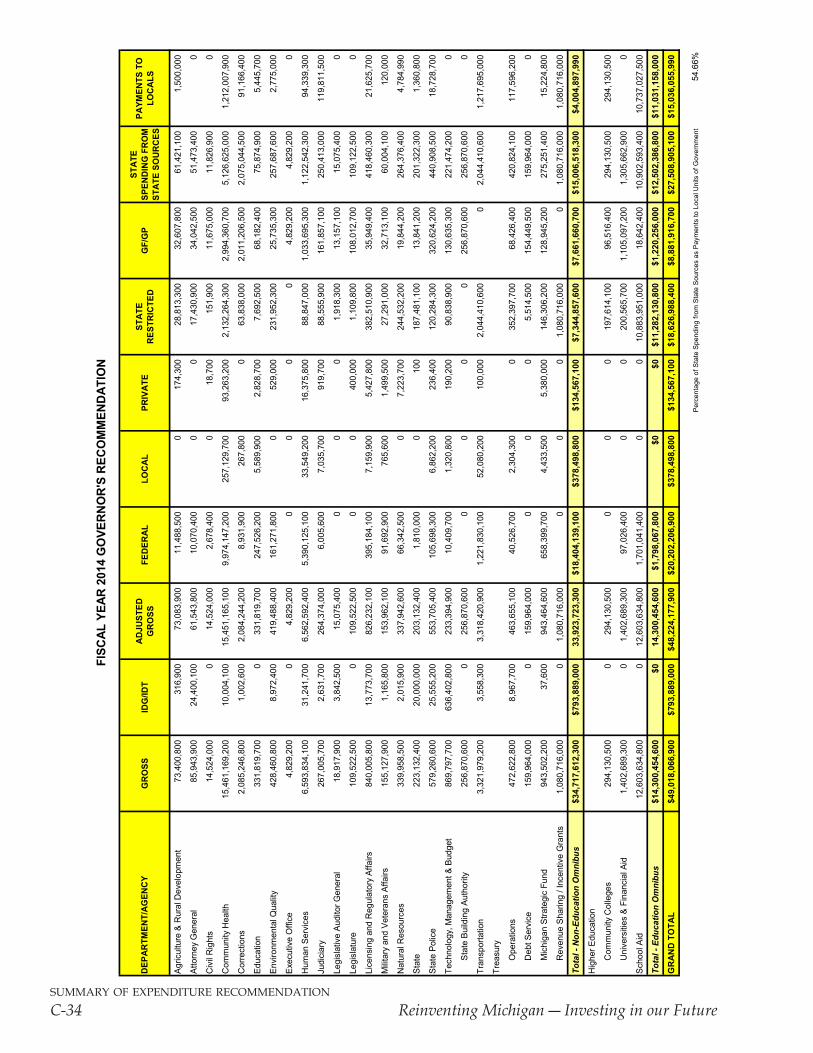
summary of expenditure recommendation
C-34 ReinventingMichigan―InvestinginourFuture
DEP
AR
TMEN
T/AG
ENC
YG
RO
SSID
G/ID
TA
DJU
STED
G
RO
SSFE
DER
AL
LOC
AL
PRIV
ATE
STA
TE
RES
TRIC
TED
GF/
GP
STA
TE
SPEN
DIN
G F
RO
M
STA
TE S
OU
RC
ES
PAYM
ENTS
TO
LO
CA
LS
Agric
ultu
re &
Rur
al D
evel
opm
ent
73,4
00,8
0031
6,90
073
,083
,900
11,4
88,5
000
174,
300
28,8
13,3
0032
,607
,800
61,4
21,1
001,
500,
000
Atto
rney
Gen
eral
85,9
43,9
0024
,400
,100
61,5
43,8
0010
,070
,400
00
17,4
30,9
0034
,042
,500
51,4
73,4
000
Civ
il R
ight
s14
,524
,000
014
,524
,000
2,67
8,40
00
18,7
0015
1,90
011
,675
,000
11,8
26,9
000
Com
mun
ity H
ealth
15,4
61,1
69,2
0010
,004
,100
15,4
51,1
65,1
009,
974,
147,
200
257,
129,
700
93,2
63,2
002,
132,
264,
300
2,99
4,36
0,70
05,
126,
625,
000
1,21
2,00
7,90
0
Cor
rect
ions
2,08
5,24
6,80
01,
002,
600
2,08
4,24
4,20
08,
931,
900
267,
800
063
,838
,000
2,01
1,20
6,50
02,
075,
044,
500
91,1
66,4
00
Educ
atio
n33
1,81
9,70
00
331,
819,
700
247,
526,
200
5,58
9,90
02,
828,
700
7,69
2,50
068
,182
,400
75,8
74,9
005,
445,
700
Envi
ronm
enta
l Qua
lity
428,
460,
800
8,97
2,40
041
9,48
8,40
016
1,27
1,80
00
529,
000
231,
952,
300
25,7
35,3
0025
7,68
7,60
02,
775,
000
Exec
utiv
e O
ffice
4,82
9,20
00
4,82
9,20
00
00
04,
829,
200
4,82
9,20
00
Hum
an S
ervi
ces
6,59
3,83
4,10
031
,241
,700
6,56
2,59
2,40
05,
390,
125,
100
33,5
49,2
0016
,375
,800
88,8
47,0
001,
033,
695,
300
1,12
2,54
2,30
094
,339
,300
Judi
ciar
y26
7,00
5,70
02,
631,
700
264,
374,
000
6,00
5,60
07,
035,
700
919,
700
88,5
55,9
0016
1,85
7,10
025
0,41
3,00
011
9,81
1,50
0
Legi
slat
ive
Audi
tor G
ener
al18
,917
,900
3,84
2,50
015
,075
,400
00
01,
918,
300
13,1
57,1
0015
,075
,400
0
Legi
slat
ure
109,
522,
500
010
9,52
2,50
00
040
0,00
01,
109,
800
108,
012,
700
109,
122,
500
0
Lice
nsin
g an
d R
egul
ator
y Af
fairs
840,
005,
800
13,7
73,7
0082
6,23
2,10
039
5,18
4,10
07,
159,
900
5,42
7,80
038
2,51
0,90
035
,949
,400
418,
460,
300
21,6
25,7
00
Milit
ary
and
Vete
rans
Affa
irs15
5,12
7,90
01,
165,
800
153,
962,
100
91,6
92,9
0076
5,60
01,
499,
500
27,2
91,0
0032
,713
,100
60,0
04,1
0012
0,00
0
Nat
ural
Res
ourc
es33
9,95
8,50
02,
015,
900
337,
942,
600
66,3
42,5
000
7,22
3,70
024
4,53
2,20
019
,844
,200
264,
376,
400
4,78
4,99
0
Stat
e22
3,13
2,40
020
,000
,000
203,
132,
400
1,81
0,00
00
100
187,
481,
100
13,8
41,2
0020
1,32
2,30
01,
360,
800
Stat
e Po
lice
579,
260,
600
25,5
55,2
0055
3,70
5,40
010
5,69
8,30
06,
862,
200
236,
400
120,
284,
300
320,
624,
200
440,
908,
500
18,7
28,7
00
Tech
nolo
gy, M
anag
emen
t & B
udge
t86
9,79
7,70
063
6,40
2,80
023
3,39
4,90
010
,409
,700
1,32
0,80
019
0,20
090
,838
,900
130,
635,
300
221,
474,
200
0
Stat
e Bu
ildin
g Au
thor
ity25
6,87
0,60
00
256,
870,
600
00
00
256,
870,
600
256,
870,
600
0
Tran
spor
tatio
n3,
321,
979,
200
3,55
8,30
03,
318,
420,
900
1,22
1,83
0,10
052
,080
,200
100,
000
2,04
4,41
0,60
00
2,04
4,41
0,60
01,
217,
695,
000
Trea
sury
Ope
ratio
ns47
2,62
2,80
08,
967,
700
463,
655,
100
40,5
26,7
002,
304,
300
035
2,39
7,70
068
,426
,400
420,
824,
100
117,
596,
200
Deb
t Ser
vice
159,
964,
000
015
9,96
4,00
00
00
5,51
4,50
015
4,44
9,50
015
9,96
4,00
00
Mic
higa
n St
rate
gic
Fund
943,
502,
200
37,6
0094
3,46
4,60
065
8,39
9,70
04,
433,
500
5,38
0,00
014
6,30
6,20
012
8,94
5,20
027
5,25
1,40
015
,224
,800
Rev
enue
Sha
ring
/ Inc
entiv
e G
rant
s1,
080,
716,
000
01,
080,
716,
000
00
01,
080,
716,
000
01,
080,
716,
000
1,08
0,71
6,00
0
Tota
l - N
on-E
duca
tion
Om
nibu
s$3
4,71
7,61
2,30
0$7
93,8
89,0
0033
,923
,723
,300
$18,
404,
139,
100
$378
,498
,800
$134
,567
,100
$7,3
44,8
57,6
00$7
,661
,660
,700
$15,
006,
518,
300
$4,0
04,8
97,9
90
Hig
her E
duca
tion
Com
mun
ity C
olle
ges
294,
130,
500
029
4,13
0,50
00
00
197,
614,
100
96,5
16,4
0029
4,13
0,50
029
4,13
0,50
0
Uni
vers
ities
& F
inan
cial
Aid
1,40
2,68
9,30
00
1,40
2,68
9,30
097
,026
,400
00
200,
565,
700
1,10
5,09
7,20
01,
305,
662,
900
0
Scho
ol A
id12
,603
,634
,800
012
,603
,634
,800
1,70
1,04
1,40
00
010
,883
,951
,000
18,6
42,4
0010
,902
,593
,400
10,7
37,0
27,5
00
Tota
l - E
duca
tion
Om
nibu
s$1
4,30
0,45
4,60
0$0
14,3
00,4
54,6
00$1
,798
,067
,800
$0$0
$11,
282,
130,
800
$1,2
20,2
56,0
00$1
2,50
2,38
6,80
0$1
1,03
1,15
8,00
0
GR
AN
D T
OTA
L$4
9,01
8,06
6,90
0$7
93,8
89,0
00$4
8,22
4,17
7,90
0$2
0,20
2,20
6,90
0$3
78,4
98,8
00$1
34,5
67,1
00$1
8,62
6,98
8,40
0$8
,881
,916
,700
$27,
508,
905,
100
$15,
036,
055,
990
Perc
enta
ge o
f Sta
te S
pend
ing
from
Sta
te S
ourc
es a
s Pa
ymen
ts to
Loc
al U
nits
of G
over
nmen
t54
.66%
FISC
AL Y
EAR
201
4 G
OVE
RN
OR
'S R
ECO
MM
END
ATIO
N
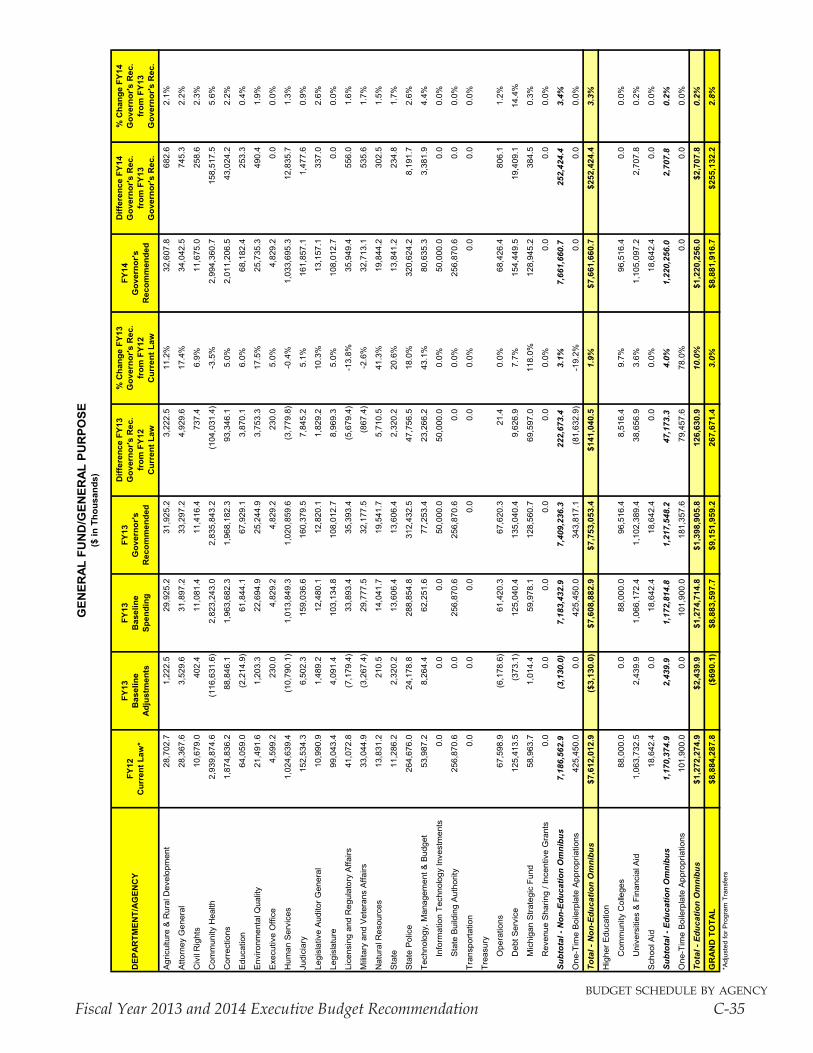
budget schedule by agency
Fiscal Year 2013 and 2014 Executive Budget Recommendation C-35
DEP
AR
TMEN
T/A
GEN
CY
FY12
Cur
rent
Law
*
FY13
Bas
elin
eA
djus
tmen
ts
FY13
Bas
elin
eSp
endi
ng
FY13
Gov
erno
r's
Rec
omm
ende
d
Diff
eren
ce F
Y13
G
over
nor's
Rec
.fr
om F
Y12
Cur
rent
Law
% C
hang
e FY
13
Gov
erno
r's R
ec.
from
FY
12C
urre
nt L
aw
FY14
Gov
erno
r's
Rec
omm
ende
d
Diff
eren
ce F
Y14
G
over
nor's
Rec
.fr
om F
Y13
Gov
erno
r's R
ec.
% C
hang
e FY
14
Gov
erno
r's R
ec.
from
FY
13G
over
nor's
Rec
.
Agr
icul
ture
& R
ural
Dev
elop
men
t28
,702
.71,
222.
529
,925
.231
,925
.23,
222.
511
.2%
32,6
07.8
682.
62.
1%
Atto
rney
Gen
eral
28,3
67.6
3,52
9.6
31,8
97.2
33,2
97.2
4,92
9.6
17.4
%34
,042
.574
5.3
2.2%
Civ
il R
ight
s10
,679
.040
2.4
11,0
81.4
11,4
16.4
737.
46.
9%11
,675
.025
8.6
2.3%
Com
mun
ity H
ealth
2,93
9,87
4.6
(116
,631
.6)
2,82
3,24
3.0
2,83
5,84
3.2
(104
,031
.4)
-3.5
%2,
994,
360.
715
8,51
7.5
5.6%
Cor
rect
ions
1,87
4,83
6.2
88,8
46.1
1,96
3,68
2.3
1,96
8,18
2.3
93,3
46.1
5.0%
2,01
1,20
6.5
43,0
24.2
2.2%
Edu
catio
n64
,059
.0(2
,214
.9)
61,8
44.1
67,9
29.1
3,87
0.1
6.0%
68,1
82.4
253.
30.
4%
Env
ironm
enta
l Qua
lity
21,4
91.6
1,20
3.3
22,6
94.9
25,2
44.9
3,75
3.3
17.5
%25
,735
.349
0.4
1.9%
Exe
cutiv
e O
ffice
4,59
9.2
230.
04,
829.
24,
829.
223
0.0
5.0%
4,82
9.2
0.0
0.0%
Hum
an S
ervi
ces
1,02
4,63
9.4
(10,
790.
1)1,
013,
849.
31,
020,
859.
6(3
,779
.8)
-0.4
%1,
033,
695.
312
,835
.71.
3%
Judi
ciar
y15
2,53
4.3
6,50
2.3
159,
036.
616
0,37
9.5
7,84
5.2
5.1%
161,
857.
11,
477.
60.
9%
Legi
slat
ive
Aud
itor G
ener
al10
,990
.91,
489.
212
,480
.112
,820
.11,
829.
210
.3%
13,1
57.1
337.
02.
6%
Legi
slat
ure
99,0
43.4
4,09
1.4
103,
134.
810
8,01
2.7
8,96
9.3
5.0%
108,
012.
70.
00.
0%
Lice
nsin
g an
d R
egul
ator
y A
ffairs
41,0
72.8
(7,1
79.4
)33
,893
.435
,393
.4(5
,679
.4)
-13.
8%35
,949
.455
6.0
1.6%
Mili
tary
and
Vet
eran
s A
ffairs
33,0
44.9
(3,2
67.4
)29
,777
.532
,177
.5(8
67.4
)-2
.6%
32,7
13.1
535.
61.
7%
Nat
ural
Res
ourc
es13
,831
.221
0.5
14,0
41.7
19,5
41.7
5,71
0.5
41.3
%19
,844
.230
2.5
1.5%
Sta
te11
,286
.22,
320.
213
,606
.413
,606
.42,
320.
220
.6%
13,8
41.2
234.
81.
7%
Sta
te P
olic
e26
4,67
6.0
24,1
78.8
288,
854.
831
2,43
2.5
47,7
56.5
18.0
%32
0,62
4.2
8,19
1.7
2.6%
Tech
nolo
gy, M
anag
emen
t & B
udge
t53
,987
.28,
264.
462
,251
.677
,253
.423
,266
.243
.1%
80,6
35.3
3,38
1.9
4.4%
Info
rmat
ion
Tech
nolo
gy In
vest
men
ts0.
00.
00.
050
,000
.050
,000
.00.
0%50
,000
.00.
00.
0%
Sta
te B
uild
ing
Aut
horit
y25
6,87
0.6
0.0
256,
870.
625
6,87
0.6
0.0
0.0%
256,
870.
60.
00.
0%
Tran
spor
tatio
n0.
00.
00.
00.
00.
00.
0%0.
00.
00.
0%
Trea
sury
Ope
ratio
ns67
,598
.9(6
,178
.6)
61,4
20.3
67,6
20.3
21.4
0.0%
68,4
26.4
806.
11.
2%
Deb
t Ser
vice
125,
413.
5(3
73.1
)12
5,04
0.4
135,
040.
49,
626.
97.
7%15
4,44
9.5
19,4
09.1
14.4
%
Mic
higa
n S
trate
gic
Fund
58,9
63.7
1,01
4.4
59,9
78.1
128,
560.
769
,597
.011
8.0%
128,
945.
238
4.5
0.3%
Rev
enue
Sha
ring
/ Inc
entiv
e G
rant
s0.
00.
00.
00.
00.
00.
0%0.
00.
00.
0%
Subt
otal
- N
on-E
duca
tion
Om
nibu
s7,
186,
562.
9(3
,130
.0)
7,18
3,43
2.9
7,40
9,23
6.3
222,
673.
43.
1%7,
661,
660.
725
2,42
4.4
3.4%
One
-Tim
e B
oile
rpla
te A
ppro
pria
tions
425,
450.
00.
042
5,45
0.0
343,
817.
1(8
1,63
2.9)
-19.
2%0.
00.
00.
0%
Tota
l - N
on-E
duca
tion
Om
nibu
s$7
,612
,012
.9($
3,13
0.0)
$7,6
08,8
82.9
$7,7
53,0
53.4
$141
,040
.51.
9%$7
,661
,660
.7$2
52,4
24.4
3.3%
Hig
her E
duca
tion
Com
mun
ity C
olle
ges
88,0
00.0
0.0
88,0
00.0
96,5
16.4
8,51
6.4
9.7%
96,5
16.4
0.0
0.0%
Uni
vers
ities
& F
inan
cial
Aid
1,06
3,73
2.5
2,43
9.9
1,06
6,17
2.4
1,10
2,38
9.4
38,6
56.9
3.6%
1,10
5,09
7.2
2,70
7.8
0.2%
Sch
ool A
id18
,642
.40.
018
,642
.418
,642
.40.
00.
0%18
,642
.40.
00.
0%
Subt
otal
- Ed
ucat
ion
Om
nibu
s1,
170,
374.
92,
439.
91,
172,
814.
81,
217,
548.
247
,173
.34.
0%1,
220,
256.
02,
707.
80.
2%
One
-Tim
e B
oile
rpla
te A
ppro
pria
tions
101,
900.
00.
010
1,90
0.0
181,
357.
679
,457
.678
.0%
0.0
0.0
0.0%
Tota
l - E
duca
tion
Om
nibu
s$1
,272
,274
.9$2
,439
.9$1
,274
,714
.8$1
,398
,905
.812
6,63
0.9
10.0
%$1
,220
,256
.0$2
,707
.80.
2%
GR
AN
D T
OTA
L$8
,884
,287
.8($
690.
1)$8
,883
,597
.7$9
,151
,959
.226
7,67
1.4
3.0%
$8,8
81,9
16.7
$255
,132
.22.
8%*A
djus
ted
for P
rogr
am T
rans
fers
GEN
ERA
L FU
ND
/GEN
ERA
L PU
RPO
SE($
in T
hous
ands
)
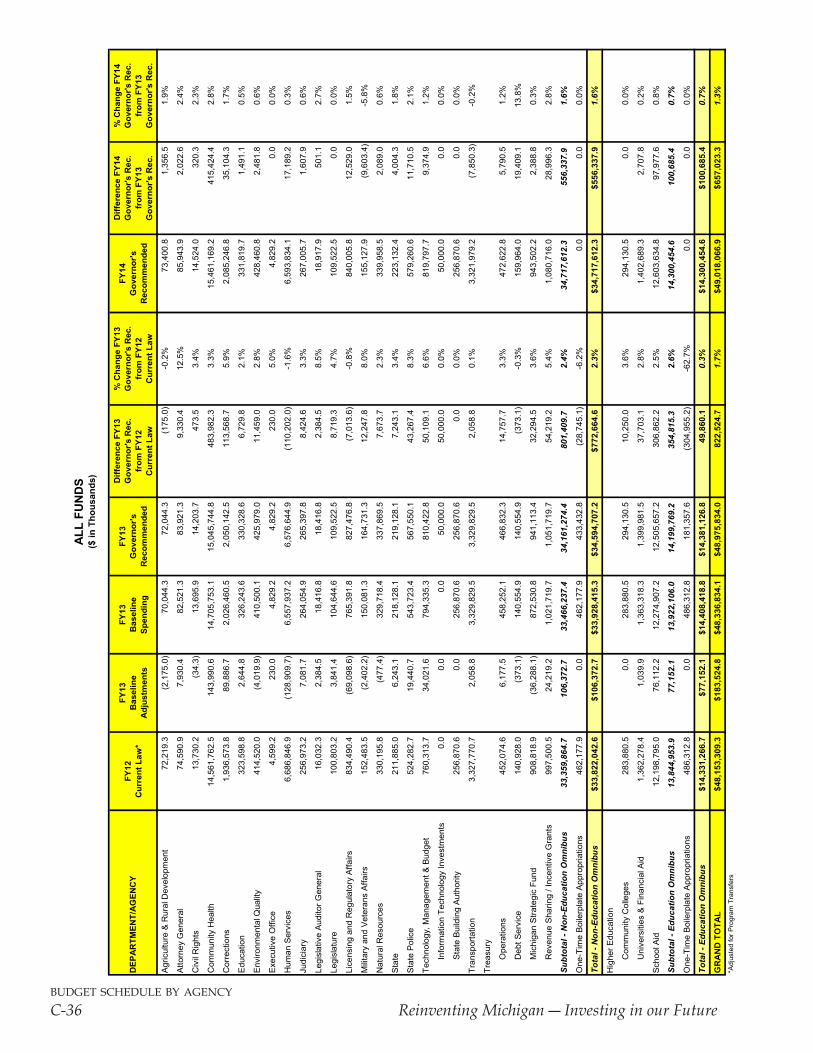
budget schedule by agency
C-36 ReinventingMichigan―InvestinginourFuture
DEP
AR
TMEN
T/A
GEN
CY
FY12
Cur
rent
Law
*
FY13
Bas
elin
eA
djus
tmen
ts
FY13
Bas
elin
eSp
endi
ng
FY13
Gov
erno
r's
Rec
omm
ende
d
Diff
eren
ce F
Y13
Gov
erno
r's R
ec.
from
FY1
2C
urre
nt L
aw
% C
hang
e FY
13
Gov
erno
r's R
ec.
from
FY1
2C
urre
nt L
aw
FY14
Gov
erno
r's
Rec
omm
ende
d
Diff
eren
ce F
Y14
Gov
erno
r's R
ec.
from
FY1
3G
over
nor's
Rec
.
% C
hang
e FY
14
Gov
erno
r's R
ec.
from
FY1
3G
over
nor's
Rec
.
Agr
icul
ture
& R
ural
Dev
elop
men
t72
,219
.3(2
,175
.0)
70,0
44.3
72,0
44.3
(175
.0)
-0.2
%73
,400
.81,
356.
51.
9%
Atto
rney
Gen
eral
74,5
90.9
7,93
0.4
82,5
21.3
83,9
21.3
9,33
0.4
12.5
%85
,943
.92,
022.
62.
4%
Civ
il R
ight
s13
,730
.2(3
4.3)
13,6
95.9
14,2
03.7
473.
53.
4%14
,524
.032
0.3
2.3%
Com
mun
ity H
ealth
14,5
61,7
62.5
143,
990.
614
,705
,753
.115
,045
,744
.848
3,98
2.3
3.3%
15,4
61,1
69.2
415,
424.
42.
8%
Cor
rect
ions
1,93
6,57
3.8
89,8
86.7
2,02
6,46
0.5
2,05
0,14
2.5
113,
568.
75.
9%2,
085,
246.
835
,104
.31.
7%
Edu
catio
n32
3,59
8.8
2,64
4.8
326,
243.
633
0,32
8.6
6,72
9.8
2.1%
331,
819.
71,
491.
10.
5%
Env
ironm
enta
l Qua
lity
414,
520.
0(4
,019
.9)
410,
500.
142
5,97
9.0
11,4
59.0
2.8%
428,
460.
82,
481.
80.
6%
Exe
cutiv
e O
ffice
4,59
9.2
230.
04,
829.
24,
829.
223
0.0
5.0%
4,82
9.2
0.0
0.0%
Hum
an S
ervi
ces
6,68
6,84
6.9
(128
,909
.7)
6,55
7,93
7.2
6,57
6,64
4.9
(110
,202
.0)
-1.6
%6,
593,
834.
117
,189
.20.
3%
Judi
ciar
y25
6,97
3.2
7,08
1.7
264,
054.
926
5,39
7.8
8,42
4.6
3.3%
267,
005.
71,
607.
90.
6%
Legi
slat
ive
Aud
itor G
ener
al16
,032
.32,
384.
518
,416
.818
,416
.82,
384.
58.
5%18
,917
.950
1.1
2.7%
Legi
slat
ure
100,
803.
23,
841.
410
4,64
4.6
109,
522.
58,
719.
34.
7%10
9,52
2.5
0.0
0.0%
Lice
nsin
g an
d R
egul
ator
y A
ffairs
834,
490.
4(6
9,09
8.6)
765,
391.
882
7,47
6.8
(7,0
13.6
)-0
.8%
840,
005.
812
,529
.01.
5%
Mili
tary
and
Vet
eran
s A
ffairs
152,
483.
5(2
,402
.2)
150,
081.
316
4,73
1.3
12,2
47.8
8.0%
155,
127.
9(9
,603
.4)
-5.8
%
Nat
ural
Res
ourc
es33
0,19
5.8
(477
.4)
329,
718.
433
7,86
9.5
7,67
3.7
2.3%
339,
958.
52,
089.
00.
6%
Sta
te21
1,88
5.0
6,24
3.1
218,
128.
121
9,12
8.1
7,24
3.1
3.4%
223,
132.
44,
004.
31.
8%
Sta
te P
olic
e52
4,28
2.7
19,4
40.7
543,
723.
456
7,55
0.1
43,2
67.4
8.3%
579,
260.
611
,710
.52.
1%
Tech
nolo
gy, M
anag
emen
t & B
udge
t76
0,31
3.7
34,0
21.6
794,
335.
381
0,42
2.8
50,1
09.1
6.6%
819,
797.
79,
374.
91.
2%
Info
rmat
ion
Tech
nolo
gy In
vest
men
ts0.
00.
00.
050
,000
.050
,000
.00.
0%50
,000
.00.
00.
0%
Sta
te B
uild
ing
Aut
horit
y25
6,87
0.6
0.0
256,
870.
625
6,87
0.6
0.0
0.0%
256,
870.
60.
00.
0%
Tran
spor
tatio
n3,
327,
770.
72,
058.
83,
329,
829.
53,
329,
829.
52,
058.
80.
1%3,
321,
979.
2(7
,850
.3)
-0.2
%
Trea
sury
Ope
ratio
ns45
2,07
4.6
6,17
7.5
458,
252.
146
6,83
2.3
14,7
57.7
3.3%
472,
622.
85,
790.
51.
2%
Deb
t Ser
vice
140,
928.
0(3
73.1
)14
0,55
4.9
140,
554.
9(3
73.1
)-0
.3%
159,
964.
019
,409
.113
.8%
Mic
higa
n S
trate
gic
Fund
908,
818.
9(3
6,28
8.1)
872,
530.
894
1,11
3.4
32,2
94.5
3.6%
943,
502.
22,
388.
80.
3%
Rev
enue
Sha
ring
/ Inc
entiv
e G
rant
s99
7,50
0.5
24,2
19.2
1,02
1,71
9.7
1,05
1,71
9.7
54,2
19.2
5.4%
1,08
0,71
6.0
28,9
96.3
2.8%
Subt
otal
- N
on-E
duca
tion
Om
nibu
s33
,359
,864
.710
6,37
2.7
33,4
66,2
37.4
34,1
61,2
74.4
801,
409.
72.
4%34
,717
,612
.355
6,33
7.9
1.6%
One
-Tim
e B
oile
rpla
te A
ppro
pria
tions
462,
177.
90.
046
2,17
7.9
433,
432.
8(2
8,74
5.1)
-6.2
%0.
00.
00.
0%
Tota
l - N
on-E
duca
tion
Om
nibu
s$3
3,82
2,04
2.6
$106
,372
.7$3
3,92
8,41
5.3
$34,
594,
707.
2$7
72,6
64.6
2.3%
$34,
717,
612.
3$5
56,3
37.9
1.6%
Hig
her E
duca
tion
Com
mun
ity C
olle
ges
283,
880.
50.
028
3,88
0.5
294,
130.
510
,250
.03.
6%29
4,13
0.5
0.0
0.0%
Uni
vers
ities
& F
inan
cial
Aid
1,36
2,27
8.4
1,03
9.9
1,36
3,31
8.3
1,39
9,98
1.5
37,7
03.1
2.8%
1,40
2,68
9.3
2,70
7.8
0.2%
Sch
ool A
id12
,198
,795
.076
,112
.212
,274
,907
.212
,505
,657
.230
6,86
2.2
2.5%
12,6
03,6
34.8
97,9
77.6
0.8%
Subt
otal
- Ed
ucat
ion
Om
nibu
s13
,844
,953
.977
,152
.113
,922
,106
.014
,199
,769
.235
4,81
5.3
2.6%
14,3
00,4
54.6
100,
685.
40.
7%
One
-Tim
e B
oile
rpla
te A
ppro
pria
tions
486,
312.
80.
048
6,31
2.8
181,
357.
6(3
04,9
55.2
)-6
2.7%
0.0
0.0
0.0%
Tota
l - E
duca
tion
Om
nibu
s$1
4,33
1,26
6.7
$77,
152.
1$1
4,40
8,41
8.8
$14,
381,
126.
849
,860
.10.
3%$1
4,30
0,45
4.6
$100
,685
.40.
7%
GR
AN
D T
OTA
L$4
8,15
3,30
9.3
$183
,524
.8$4
8,33
6,83
4.1
$48,
975,
834.
082
2,52
4.7
1.7%
$49,
018,
066.
9$6
57,0
23.3
1.3%
*Adj
uste
d fo
r Pro
gram
Tra
nsfe
rs
ALL
FUN
DS
($ in
Tho
usan
ds)
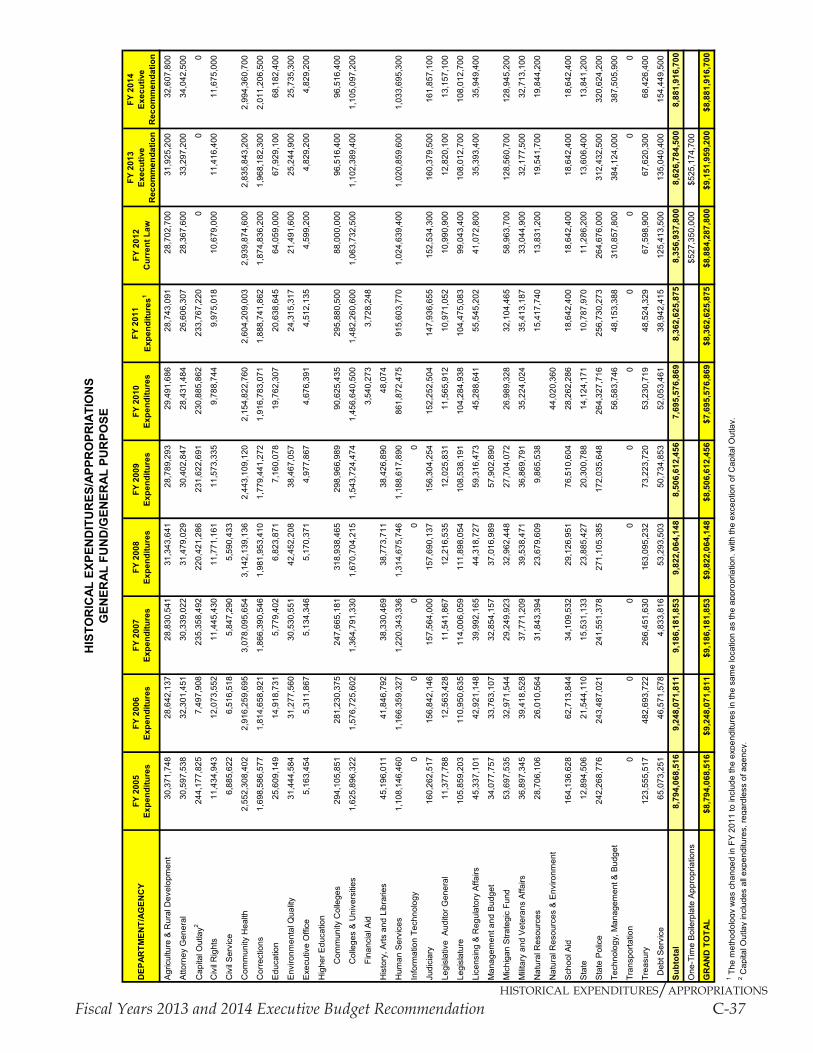
historical expenditures/appropriations
Fiscal Years 2013 and 2014 Executive Budget Recommendation C-37
DEP
ARTM
ENT/
AGEN
CY
FY 2
005
Expe
nditu
res
FY 2
006
Expe
nditu
res
FY 2
007
Expe
nditu
res
FY 2
008
Expe
nditu
res
FY 2
009
Expe
nditu
res
FY 2
010
Expe
nditu
res
FY 2
011
Expe
nditu
res1
FY 2
012
Cur
rent
Law
FY 2
013
Exec
utiv
e R
ecom
men
datio
n
FY 2
014
Exec
utiv
e R
ecom
men
datio
n
Agr
icul
ture
& R
ural
Dev
elop
men
t30
,371
,748
28,6
42,1
3728
,830
,541
31,3
43,6
4128
,789
,293
29,4
91,6
8628
,743
,091
28,7
02,7
0031
,925
,200
32,6
07,8
00
Atto
rney
Gen
eral
30,5
97,5
3832
,301
,451
30,3
39,0
2231
,479
,029
30,4
02,8
4728
,431
,484
26,6
06,3
0728
,367
,600
33,2
97,2
0034
,042
,500
Cap
ital O
utla
y224
4,17
7,82
57,
497,
908
235,
358,
492
220,
421,
286
231,
622,
691
230,
885,
862
233,
767,
220
00
0
Civ
il R
ight
s11
,434
,943
12,0
73,5
5211
,445
,430
11,7
71,1
6111
,573
,335
9,78
8,74
49,
975,
018
10,6
79,0
0011
,416
,400
11,6
75,0
00
Civ
il S
ervi
ce6,
885,
622
6,51
6,51
85,
847,
290
5,59
0,43
3
Com
mun
ity H
ealth
2,55
2,30
8,40
22,
916,
259,
695
3,07
8,09
5,65
43,
142,
139,
136
2,44
3,10
9,12
02,
154,
822,
760
2,60
4,20
9,00
32,
939,
874,
600
2,83
5,84
3,20
02,
994,
360,
700
Cor
rect
ions
1,69
8,58
6,57
71,
814,
658,
921
1,86
6,39
0,54
61,
981,
953,
410
1,77
9,44
1,27
21,
916,
783,
071
1,88
8,74
1,86
21,
874,
836,
200
1,96
8,18
2,30
02,
011,
206,
500
Edu
catio
n25
,609
,149
14,9
18,7
315,
779,
402
6,82
3,87
17,
160,
078
19,7
62,3
0720
,638
,645
64,0
59,0
0067
,929
,100
68,1
82,4
00
Env
ironm
enta
l Qua
lity
31,4
44,5
8431
,277
,560
30,5
30,5
5142
,452
,208
38,4
67,0
5724
,315
,317
21,4
91,6
0025
,244
,900
25,7
35,3
00
Exe
cutiv
e O
ffice
5,16
3,45
45,
311,
867
5,13
4,34
65,
170,
371
4,97
7,86
74,
676,
391
4,51
2,13
54,
599,
200
4,82
9,20
04,
829,
200
Hig
her E
duca
tion
Com
mun
ity C
olle
ges
294,
105,
851
281,
230,
375
247,
665,
181
318,
938,
465
298,
966,
989
90,6
25,4
3529
5,88
0,50
088
,000
,000
96,5
16,4
0096
,516
,400
Col
lege
s &
Uni
vers
ities
1,62
5,89
6,32
21,
576,
725,
602
1,36
4,79
1,33
01,
670,
704,
215
1,54
3,72
4,47
41,
456,
640,
500
1,48
2,26
0,60
01,
063,
732,
500
1,10
2,38
9,40
01,
105,
097,
200
Fina
ncia
l Aid
3,54
0,27
33,
728,
248
His
tory
, Arts
and
Lib
rarie
s45
,196
,011
41,8
46,7
9238
,330
,469
38,7
73,7
1138
,426
,890
48,0
74
Hum
an S
ervi
ces
1,10
8,14
6,46
01,
166,
359,
327
1,22
0,34
3,33
61,
314,
675,
746
1,18
8,61
7,89
086
1,87
2,47
591
5,60
3,77
01,
024,
639,
400
1,02
0,85
9,60
01,
033,
695,
300
Info
rmat
ion
Tech
nolo
gy0
00
00
Judi
ciar
y16
0,26
2,51
715
6,84
2,14
615
7,56
4,00
015
7,69
0,13
715
6,30
4,25
415
2,25
2,50
414
7,93
6,65
515
2,53
4,30
016
0,37
9,50
016
1,85
7,10
0
Legi
slat
ive
Aud
itor G
ener
al11
,377
,788
12,5
63,4
2811
,541
,867
12,2
16,5
3512
,025
,831
11,5
65,9
1210
,971
,052
10,9
90,9
0012
,820
,100
13,1
57,1
00
Legi
slat
ure
105,
859,
203
110,
950,
635
114,
006,
059
111,
898,
054
108,
538,
191
104,
284,
938
104,
475,
083
99,0
43,4
0010
8,01
2,70
010
8,01
2,70
0
Lice
nsin
g &
Reg
ulat
ory
Affa
irs45
,337
,101
42,9
21,1
4839
,992
,165
44,3
18,7
2759
,316
,473
45,2
88,6
4155
,545
,202
41,0
72,8
0035
,393
,400
35,9
49,4
00
Man
agem
ent a
nd B
udge
t34
,077
,757
33,7
63,1
0732
,854
,157
37,0
16,9
8957
,902
,890
Mic
higa
n S
trate
gic
Fund
53,6
97,5
3532
,971
,544
29,2
49,9
2332
,962
,448
27,7
04,0
7226
,989
,328
32,1
04,4
6558
,963
,700
128,
560,
700
128,
945,
200
Milit
ary
and
Vet
eran
s A
ffairs
36,8
97,3
4539
,418
,528
37,7
71,2
0939
,538
,471
36,8
69,7
9135
,224
,024
35,4
13,1
8733
,044
,900
32,1
77,5
0032
,713
,100
Nat
ural
Res
ourc
es28
,706
,106
26,0
10,5
6431
,843
,394
23,6
79,6
099,
865,
538
15,4
17,7
4013
,831
,200
19,5
41,7
0019
,844
,200
Nat
ural
Res
ourc
es &
Env
ironm
ent
44,0
20,3
60
Sch
ool A
id16
4,13
6,62
862
,713
,844
34,1
09,5
3229
,126
,951
76,5
10,6
0428
,262
,286
18,6
42,4
0018
,642
,400
18,6
42,4
0018
,642
,400
Sta
te12
,894
,506
21,5
44,1
1015
,531
,133
23,8
85,4
2720
,300
,788
14,1
24,1
7110
,787
,970
11,2
86,2
0013
,606
,400
13,8
41,2
00
Sta
te P
olic
e24
2,26
8,77
624
3,48
7,02
124
1,55
1,37
827
1,10
5,38
517
2,03
5,64
826
4,32
7,71
625
6,73
0,27
326
4,67
6,00
031
2,43
2,50
032
0,62
4,20
0
Tech
nolo
gy, M
anag
emen
t & B
udge
t56
,583
,746
48,1
53,3
8831
0,85
7,80
038
4,12
4,00
038
7,50
5,90
0
Tran
spor
tatio
n0
00
00
00
00
0
Trea
sury
123,
555,
517
482,
693,
722
266,
451,
630
163,
095,
232
73,2
23,7
2053
,230
,719
48,5
24,3
2967
,598
,900
67,6
20,3
0068
,426
,400
Deb
t Ser
vice
65,0
73,2
5146
,571
,578
4,83
3,81
653
,293
,503
50,7
34,8
5352
,053
,461
38,9
42,4
1512
5,41
3,50
013
5,04
0,40
015
4,44
9,50
0
Subt
otal
8,79
4,06
8,51
69,
248,
071,
811
9,18
6,18
1,85
39,
822,
064,
148
8,50
6,61
2,45
67,
695,
576,
869
8,36
2,62
5,87
58,
356,
937,
800
8,62
6,78
4,50
08,
881,
916,
700
One
-Tim
e B
oile
rpla
te A
ppro
pria
tions
$527
,350
,000
$525
,174
,700
GR
AND
TO
TAL
$8,7
94,0
68,5
16$9
,248
,071
,811
$9,1
86,1
81,8
53$9
,822
,064
,148
$8,5
06,6
12,4
56$7
,695
,576
,869
$8,3
62,6
25,8
75$8
,884
,287
,800
$9,1
51,9
59,2
00$8
,881
,916
,700
1 The
met
hodo
logy
was
cha
nged
in F
Y 20
11 to
incl
ude
the
expe
nditu
res
in th
e sa
me
loca
tion
as th
e ap
prop
riatio
n, w
ith th
e ex
cept
ion
of C
apita
l Out
lay.
2 Cap
ital O
utla
y in
clud
es a
ll ex
pend
iture
s, re
gard
less
of a
genc
y.
HIS
TOR
ICAL
EXP
END
ITU
RES
/APP
RO
PRIA
TIO
NS
GEN
ERAL
FU
ND
/GEN
ERAL
PU
RPO
SE
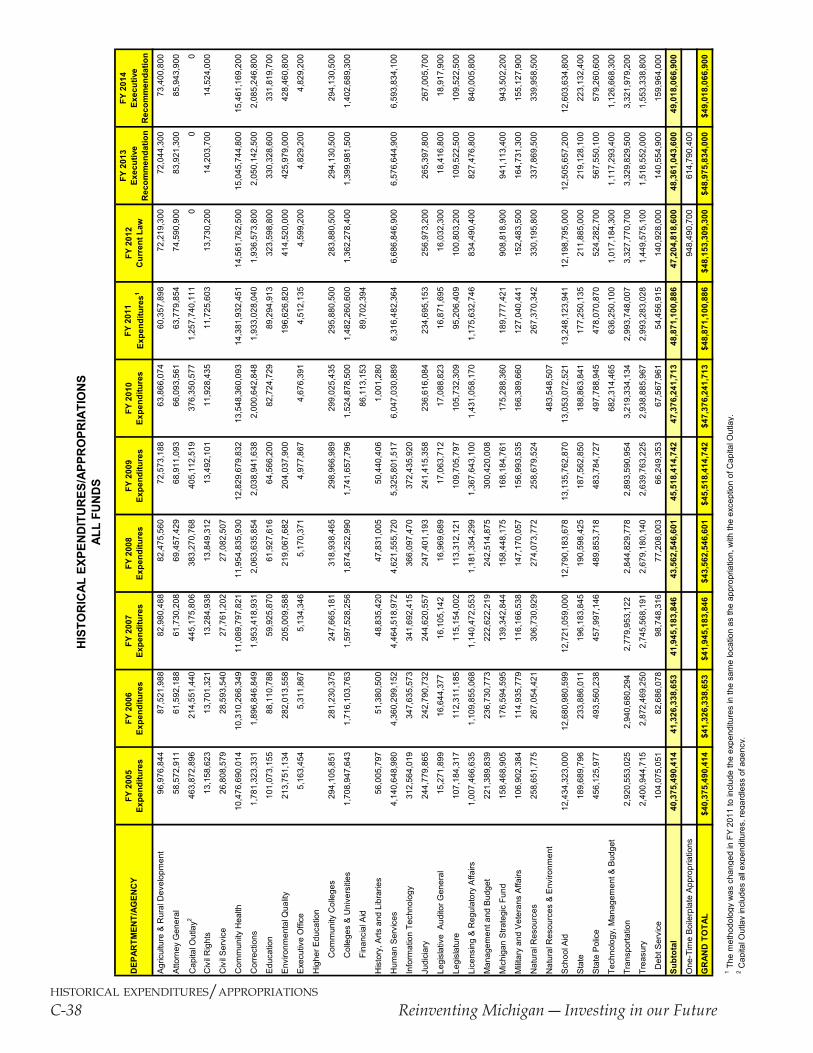
historical expenditures/appropriations
C-38 ReinventingMichigan―InvestinginourFuture
DEP
ARTM
ENT/
AGEN
CY
FY 2
005
Expe
nditu
res
FY 2
006
Expe
nditu
res
FY 2
007
Expe
nditu
res
FY 2
008
Expe
nditu
res
FY 2
009
Expe
nditu
res
FY 2
010
Expe
nditu
res
FY 2
011
Expe
nditu
res1
FY 2
012
Cur
rent
Law
FY 2
013
Exec
utiv
e R
ecom
men
datio
n
FY 2
014
Exec
utiv
e R
ecom
men
datio
n
Agr
icul
ture
& R
ural
Dev
elop
men
t96
,976
,844
87,5
21,9
8882
,980
,488
82,4
75,5
6072
,573
,188
63,8
66,0
7460
,357
,898
72,2
19,3
0072
,044
,300
73,4
00,8
00
Atto
rney
Gen
eral
58,5
72,9
1161
,592
,188
61,7
30,2
0869
,457
,429
68,9
11,0
9366
,093
,561
63,7
79,8
5474
,590
,900
83,9
21,3
0085
,943
,900
Cap
ital O
utla
y246
3,87
2,89
621
4,55
1,44
044
5,17
5,80
638
3,27
0,76
840
5,11
2,51
937
6,35
0,57
71,
257,
740,
111
00
0
Civ
il R
ight
s13
,158
,623
13,7
01,3
2113
,284
,938
13,8
49,3
1213
,492
,101
11,9
28,4
3511
,725
,603
13,7
30,2
0014
,203
,700
14,5
24,0
00
Civ
il S
ervi
ce26
,808
,579
28,5
93,5
4027
,761
,202
27,0
82,5
07
Com
mun
ity H
ealth
10,4
76,6
90,0
1410
,310
,266
,349
11,0
89,7
97,8
2111
,954
,835
,930
12,8
29,6
79,8
3213
,548
,360
,093
14,3
81,9
32,4
5114
,561
,762
,500
15,0
45,7
44,8
0015
,461
,169
,200
Cor
rect
ions
1,78
1,32
3,33
11,
896,
846,
849
1,95
3,41
8,93
12,
063,
635,
854
2,03
8,94
1,63
82,
000,
642,
848
1,93
3,02
8,04
01,
936,
573,
800
2,05
0,14
2,50
02,
085,
246,
800
Edu
catio
n10
1,07
3,15
588
,110
,788
59,9
25,8
7061
,927
,616
64,5
66,2
0082
,724
,729
89,2
94,9
1332
3,59
8,80
033
0,32
8,60
033
1,81
9,70
0
Env
ironm
enta
l Qua
lity
213,
751,
134
282,
013,
558
205,
009,
588
219,
067,
682
204,
037,
900
196,
626,
820
414,
520,
000
425,
979,
000
428,
460,
800
Exe
cutiv
e O
ffice
5,16
3,45
45,
311,
867
5,13
4,34
65,
170,
371
4,97
7,86
74,
676,
391
4,51
2,13
54,
599,
200
4,82
9,20
04,
829,
200
Hig
her E
duca
tion
Com
mun
ity C
olle
ges
294,
105,
851
281,
230,
375
247,
665,
181
318,
938,
465
298,
966,
989
299,
025,
435
295,
880,
500
283,
880,
500
294,
130,
500
294,
130,
500
Col
lege
s &
Uni
vers
ities
1,70
8,94
7,64
31,
716,
103,
763
1,59
7,52
8,25
61,
874,
252,
990
1,74
1,65
7,79
61,
524,
878,
500
1,48
2,26
0,60
01,
362,
278,
400
1,39
9,98
1,50
01,
402,
689,
300
Fina
ncia
l Aid
86,1
13,1
5389
,702
,394
His
tory
, Arts
and
Lib
rarie
s56
,005
,797
51,3
80,5
0048
,835
,420
47,8
31,0
0550
,440
,406
1,00
1,28
0
Hum
an S
ervi
ces
4,14
0,64
8,98
04,
360,
299,
152
4,46
4,51
8,97
24,
621,
555,
720
5,32
5,80
1,51
76,
047,
030,
889
6,31
6,48
2,36
46,
686,
846,
900
6,57
6,64
4,90
06,
593,
834,
100
Info
rmat
ion
Tech
nolo
gy31
2,56
4,01
934
7,63
5,57
334
1,69
2,41
536
6,09
7,47
037
2,43
5,92
0
Judi
ciar
y24
4,77
9,86
524
2,79
0,73
224
4,62
0,55
724
7,40
1,19
324
1,41
5,35
823
6,61
6,08
423
4,69
5,15
325
6,97
3,20
026
5,39
7,80
026
7,00
5,70
0
Legi
slat
ive
Aud
itor G
ener
al15
,271
,899
16,6
44,3
7716
,105
,142
16,9
69,6
8917
,063
,712
17,0
88,8
2316
,871
,695
16,0
32,3
0018
,416
,800
18,9
17,9
00
Legi
slat
ure
107,
184,
317
112,
311,
185
115,
154,
002
113,
312,
121
109,
705,
797
105,
732,
309
95,2
06,4
0910
0,80
3,20
010
9,52
2,50
010
9,52
2,50
0
Lice
nsin
g &
Reg
ulat
ory
Affa
irs1,
007,
466,
635
1,10
9,85
5,06
81,
140,
472,
553
1,18
1,35
4,29
91,
367,
643,
100
1,43
1,05
8,17
01,
175,
632,
746
834,
490,
400
827,
476,
800
840,
005,
800
Man
agem
ent a
nd B
udge
t22
1,38
9,83
923
6,73
0,77
322
2,62
2,21
924
2,51
4,87
530
0,42
0,00
8
Mic
higa
n S
trate
gic
Fund
158,
468,
905
176,
594,
595
139,
342,
844
158,
448,
175
168,
184,
761
175,
288,
360
189,
777,
421
908,
818,
900
941,
113,
400
943,
502,
200
Milit
ary
and
Vet
eran
s A
ffairs
106,
902,
384
114,
935,
779
116,
166,
538
147,
170,
057
156,
993,
535
166,
389,
660
127,
040,
441
152,
483,
500
164,
731,
300
155,
127,
900
Nat
ural
Res
ourc
es25
8,65
1,77
526
7,05
4,42
130
6,73
0,92
927
4,07
3,77
225
8,67
9,52
426
7,37
0,34
233
0,19
5,80
033
7,86
9,50
033
9,95
8,50
0
Nat
ural
Res
ourc
es &
Env
ironm
ent
483,
548,
507
Sch
ool A
id12
,434
,323
,000
12,6
80,9
80,5
9912
,721
,059
,000
12,7
90,1
83,6
7813
,135
,762
,870
13,0
53,0
72,5
2113
,248
,123
,941
12,1
98,7
95,0
0012
,505
,657
,200
12,6
03,6
34,8
00
Sta
te18
9,68
9,79
623
3,88
6,01
119
6,18
3,84
519
0,59
8,42
518
7,56
2,85
018
8,86
3,84
117
7,25
0,13
521
1,88
5,00
021
9,12
8,10
022
3,13
2,40
0
Sta
te P
olic
e45
6,12
5,97
749
3,56
0,23
845
7,99
7,14
648
9,85
3,71
848
3,78
4,72
749
7,78
8,94
547
8,07
0,87
052
4,28
2,70
056
7,55
0,10
057
9,26
0,60
0
Tech
nolo
gy, M
anag
emen
t & B
udge
t68
2,31
4,46
563
6,25
0,10
01,
017,
184,
300
1,11
7,29
3,40
01,
126,
668,
300
Tran
spor
tatio
n2,
920,
553,
025
2,94
0,68
0,29
42,
779,
953,
122
2,84
4,82
9,77
82,
893,
590,
954
3,21
9,33
4,13
42,
993,
748,
007
3,32
7,77
0,70
03,
329,
829,
500
3,32
1,97
9,20
0
Trea
sury
2,40
0,94
4,71
52,
872,
469,
250
2,74
5,56
8,19
12,
679,
180,
140
2,63
9,76
3,22
52,
938,
885,
967
2,99
3,28
3,02
81,
449,
575,
100
1,51
8,55
2,00
01,
553,
338,
800
Deb
t Ser
vice
104,
075,
051
82,6
86,0
7898
,748
,316
77,2
08,0
0366
,249
,353
67,5
67,9
6154
,456
,915
140,
928,
000
140,
554,
900
159,
964,
000
Subt
otal
40,3
75,4
90,4
1441
,326
,338
,653
41,9
45,1
83,8
4643
,562
,546
,601
45,5
18,4
14,7
4247
,376
,241
,713
48,8
71,1
00,8
8647
,204
,818
,600
48,3
61,0
43,6
0049
,018
,066
,900
One
-Tim
e B
oile
rpla
te A
ppro
pria
tions
948,
490,
700
614,
790,
400
GR
AND
TO
TAL
$40,
375,
490,
414
$41,
326,
338,
653
$41,
945,
183,
846
$43,
562,
546,
601
$45,
518,
414,
742
$47,
376,
241,
713
$48,
871,
100,
886
$48,
153,
309,
300
$48,
975,
834,
000
$49,
018,
066,
900
1 The
met
hodo
logy
was
cha
nged
in F
Y 20
11 to
incl
ude
the
expe
nditu
res
in th
e sa
me
loca
tion
as th
e ap
prop
riatio
n, w
ith th
e ex
cept
ion
of C
apita
l Out
lay.
2 Cap
ital O
utla
y in
clud
es a
ll ex
pend
iture
s, re
gard
less
of a
genc
y.
HIS
TOR
ICAL
EXP
END
ITU
RES
/APP
RO
PRIA
TIO
NS
ALL
FUN
DS
GEORGE W. ROMNEY BUILDING 111 SOUTH CAPITOL AVENUE LANSING, MICHIGAN 48909 .www.michigan.gov
February 9, 2012
Ladies and Gentlemen of the Legislature and Citizens of the State of Michigan: Article XI, Section 5, of the Michigan Constitution of 1963, requires the Civil Service Commission to provide notice to the Governor of increases in rates of compensation authorized by the Commission. The attached summary of costs associated with fiscal year 2013 compensation increases was prepared by the Office of the State Employer. The total additional cost is estimated to be approximately $124.4 million. Sincerely,
Rick Snyder Governor Attachment
STATE OF MICHIGAN
RICK SNYDER OFFICE OF THE GOVERNOR BRIAN CALLEY
GOVERNOR LANSING LT. GOVERNOR

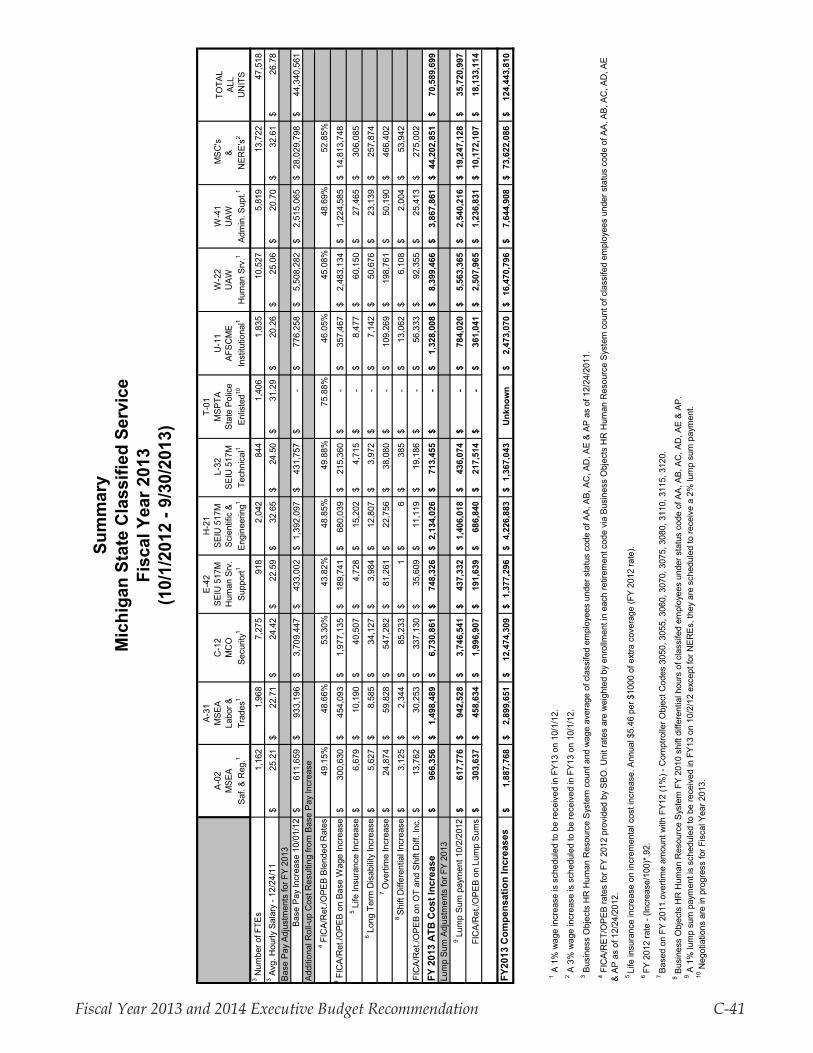
Fiscal Year 2013 and 2014 Executive Budget Recommendation C-41
Sum
mar
yM
ichi
gan
Stat
e C
lass
ified
Ser
vice
Fisc
al Y
ear 2
013
(10/
1/20
12 -
9/30
/201
3)
A-02
MSE
ASa
f. &
Reg
.1
A-31
MSE
ALa
bor &
Tr
ades
1
C-1
2M
CO
Secu
rity1
E-42
SEIU
517
MH
uman
Srv
.Su
ppor
t1
H-2
1SE
IU 5
17M
Scie
ntifi
c &
Engi
neer
ing1
L-32
SEIU
517
MTe
chni
cal1
T-01
MSP
TASt
ate
Polic
eEn
liste
d10
U-1
1AF
SCM
EIn
stitu
tiona
l1
W-2
2 U
AWH
uman
Srv
.1
W-4
1U
AWAd
min
. Sup
t.1
MSC
's&
NER
E's2
TOTA
LAL
LU
NIT
S3 N
umbe
r of F
TEs
1,16
2
1,
968
7,
275
918
2,
042
844
1,
406
1,
835
10
,527
5,81
9
13,7
22
47
,518
3 Avg
. Hou
rly S
alar
y - 1
2/24
/11
25.2
1$
22
.71
$
24
.42
$
22.5
9$
32
.65
$
24.5
0$
31
.29
$
20
.26
$
25
.06
$
20
.70
$
32
.61
$
26
.78
$
Base
Pay
Adj
ustm
ents
for F
Y 20
13Ba
se P
ay In
crea
se 1
0/01
/12
611,
659
$
93
3,19
6$
3,
709,
447
$
43
3,00
2$
1,39
2,09
7$
43
1,75
7$
-$
77
6,25
8$
5,
508,
282
$
2,
515,
065
$
28
,029
,798
$
44,3
40,5
61$
Addi
tiona
l Rol
l-up
Cos
t Res
ultin
g fro
m B
ase
Pay
Incr
ease
4 FIC
A/R
et./O
PEB
Blen
ded
Rat
es49
.15%
48.6
6%53
.30%
43.8
2%48
.85%
49.8
8%75
.88%
46.0
5%45
.08%
48.6
9%52
.85%
4 FIC
A/R
et./O
PEB
on B
ase
Wag
e In
crea
se30
0,63
0$
454,
093
$
1,97
7,13
5$
189,
741
$
68
0,03
9$
215,
360
$
-
$
357,
467
$
2,48
3,13
4$
1,22
4,58
5$
14,8
13,7
48$
5 L
ife In
sura
nce
Incr
ease
6,67
9$
10
,190
$
40,5
07$
4,72
8$
15
,202
$
4,71
5$
-
$
8,47
7$
60,1
50$
27
,465
$
306,
085
$
6 Lon
g Te
rm D
isab
ility
Incr
ease
5,62
7$
8,
585
$
34
,127
$
3,
984
$
12,8
07$
3,
972
$
-$
7,
142
$
50
,676
$
23,1
39$
25
7,87
4$
7 O
verti
me
Incr
ease
24,8
74$
59
,828
$
547,
282
$
81,2
61$
22
,756
$
38,0
80$
-
$
109,
269
$
198,
761
$
50,1
90$
46
6,40
2$
8
Shift
Diff
eren
tial I
ncre
ase
3,12
5$
2,
344
$
85
,233
$
1
$
6
$
38
5$
-$
13
,062
$
6,10
8$
2,00
4$
53,9
42$
FIC
A/R
et./O
PEB
on O
T an
d Sh
ift D
iff. I
nc.
13,7
62$
30
,253
$
337,
130
$
35,6
09$
11
,119
$
19,1
86$
-
$
56,3
33$
92
,355
$
25,4
13$
27
5,00
2$
FY 2
013
ATB
Cos
t Inc
reas
e96
6,35
6$
1,49
8,48
9$
6,73
0,86
1$
748,
326
$
2,
134,
026
$
713,
455
$
-
$
1,32
8,00
8$
8,39
9,46
6$
3,86
7,86
1$
44,2
02,8
51$
70
,589
,699
$
Lu
mp
Sum
Adj
ustm
ents
for F
Y 20
139 L
ump
Sum
pay
men
t 10/
2/20
1261
7,77
6$
942,
528
$
3,74
6,54
1$
437,
332
$
1,
406,
018
$
436,
074
$
-
$
784,
020
$
5,56
3,36
5$
2,54
0,21
6$
19,2
47,1
28$
35
,720
,997
$
FIC
A/R
et./O
PEB
on L
ump
Sum
s30
3,63
7$
458,
634
$
1,99
6,90
7$
191,
639
$
68
6,84
0$
217,
514
$
-
$
361,
041
$
2,50
7,96
5$
1,23
6,83
1$
10,1
72,1
07$
18
,133
,114
$
FY20
13 C
ompe
nsat
ion
Incr
ease
s1,
887,
768
$
2,89
9,65
1$
12,4
74,3
09$
1,37
7,29
6$
4,
226,
883
$
1,36
7,04
3$
U
nkno
wn
2,47
3,07
0$
16,4
70,7
96$
7,
644,
908
$
73
,622
,086
$
124,
443,
810
$
6 FY
201
2 ra
te -
(Incr
ease
/100
)*.9
2.
10 N
egot
iatio
ns a
re in
pro
gres
s fo
r Fis
cal Y
ear 2
013.
7 Ba
sed
on F
Y 20
11 o
verti
me
amou
nt w
ith F
Y12
(1%
) - C
ompt
rolle
r Obj
ect C
odes
305
0, 3
055,
306
0, 3
070,
307
5, 3
080,
311
0, 3
115,
312
0.
9 A
1%
lum
p su
m p
aym
ent i
s sc
hedu
led
to b
e re
ceiv
ed in
FY1
3 on
10/
2/12
exc
ept f
or N
EREs
, the
y ar
e sc
hedu
led
to re
ceiv
e a
2% lu
mp
sum
pay
men
t.
3 B
usin
ess
Obj
ects
HR
Hum
an R
esou
rce
Syst
em c
ount
and
wag
e av
erag
e of
cla
ssife
d em
ploy
ees
unde
r sta
tus
code
of A
A, A
B, A
C, A
D, A
E &
AP a
s of
12/
24/2
011.
8 B
usin
ess
Obj
ects
HR
Hum
an R
esou
rce
Syst
em F
Y 20
10 s
hift
diffe
rent
ial h
ours
of c
lass
ifed
empl
oyee
s un
der s
tatu
s co
de o
f AA,
AB,
AC
, AD
, AE
& AP
.
2 A
3%
wag
e in
crea
se is
sch
edul
ed to
be
rece
ived
in F
Y13
on 1
0/1/
12.
1 A
1%
wag
e in
crea
se is
sch
edul
ed to
be
rece
ived
in F
Y13
on 1
0/1/
12.
4 F
ICA/
RET
/OPE
B ra
tes
for F
Y 20
12 p
rovi
ded
by S
BO. U
nit r
ates
are
wei
ghte
d by
enr
ollm
ent i
n ea
ch re
tirem
ent c
ode
via
Busi
ness
Obj
ects
HR
Hum
an R
esou
rce
Syst
em c
ount
of c
lass
ifed
empl
oyee
s un
der s
tatu
s co
de o
f AA,
AB,
AC
, AD
, AE
& AP
as
of 1
2/24
/201
2. 5
Life
insu
ranc
e in
crea
se o
n in
crem
enta
l cos
t inc
reas
e. A
nnua
l $5.
46 p
er $
1000
of e
xtra
cov
erag
e (F
Y 20
12 ra
te).

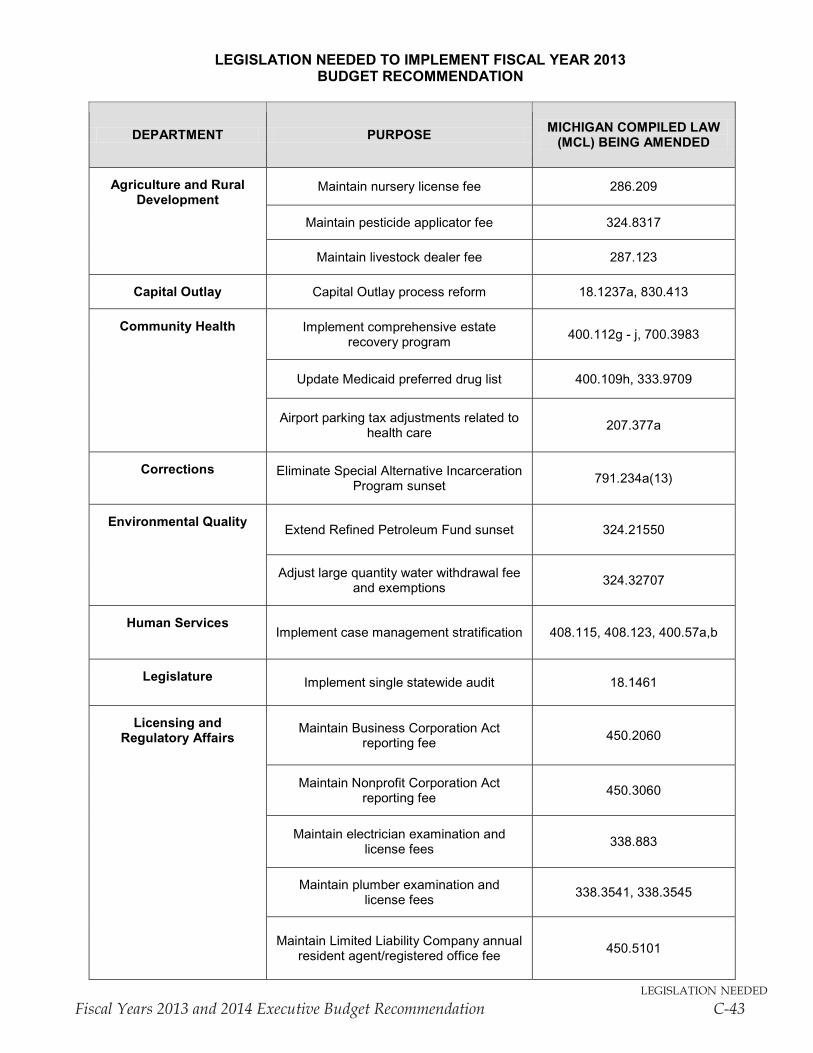
legislation needed
Fiscal Years 2013 and 2014 Executive Budget Recommendation C-43
LEGISLATION NEEDED TO IMPLEMENT FISCAL YEAR 2013BUDGET RECOMMENDATION
DEPARTMENT PURPOSE MICHIGAN COMPILED LAW (MCL) BEING AMENDED
Agriculture and Rural Development
Maintain nursery license fee 286.209
Maintain pesticide applicator fee 324.8317
Maintain livestock dealer fee 287.123
Capital Outlay Capital Outlay process reform 18.1237a, 830.413
Community Health Implement comprehensive estate recovery program 400.112g - j, 700.3983
Update Medicaid preferred drug list 400.109h, 333.9709
Airport parking tax adjustments related to health care 207.377a
Corrections Eliminate Special Alternative Incarceration Program sunset 791.234a(13)
Environmental QualityExtend Refined Petroleum Fund sunset 324.21550
Adjust large quantity water withdrawal feeand exemptions 324.32707
Human ServicesImplement case management stratification 408.115, 408.123, 400.57a,b
Legislature Implement single statewide audit 18.1461
Licensing and Regulatory Affairs
Maintain Business Corporation Act reporting fee 450.2060
Maintain Nonprofit Corporation Act reporting fee 450.3060
Maintain electrician examination and license fees 338.883
Maintain plumber examination and license fees 338.3541, 338.3545
Maintain Limited Liability Company annual resident agent/registered office fee 450.5101
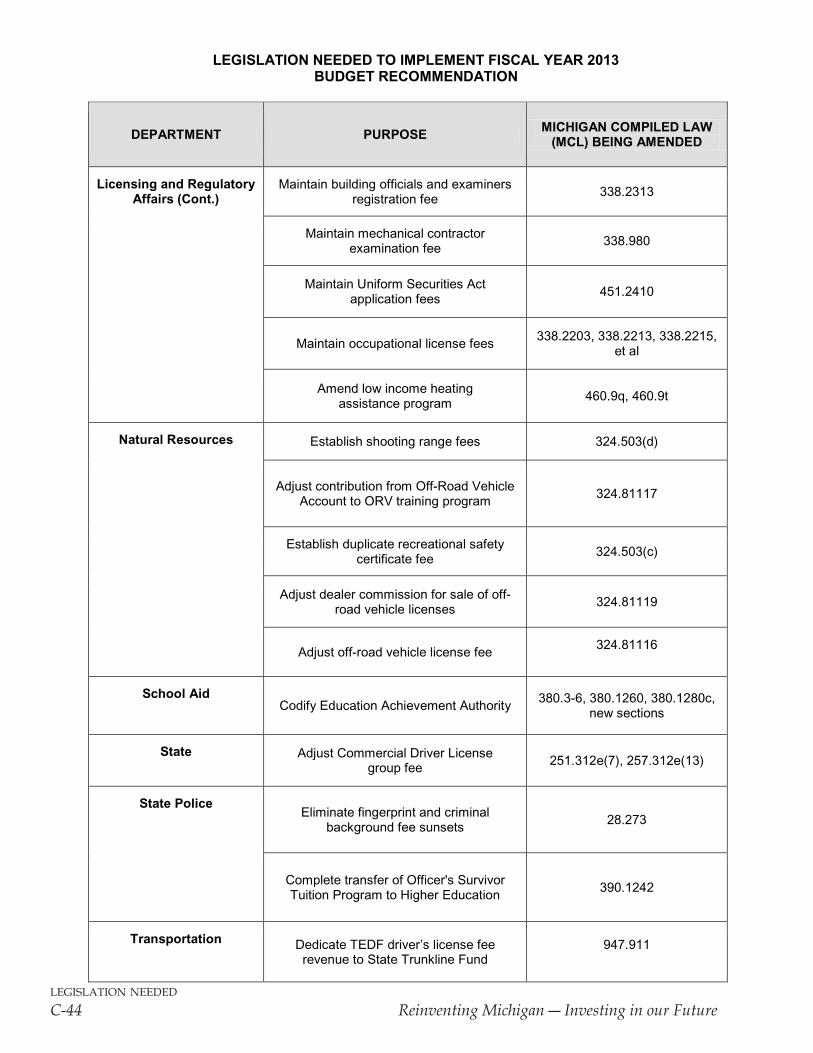
legislation needed
C-44 ReinventingMichigan―InvestinginourFuture
LEGISLATION NEEDED TO IMPLEMENT FISCAL YEAR 2013BUDGET RECOMMENDATION
DEPARTMENT PURPOSE MICHIGAN COMPILED LAW (MCL) BEING AMENDED
Licensing and Regulatory Affairs (Cont.)
Maintain building officials and examiners registration fee 338.2313
Maintain mechanical contractor examination fee 338.980
Maintain Uniform Securities Act application fees 451.2410
Maintain occupational license fees 338.2203, 338.2213, 338.2215, et al
Amend low income heating assistance program 460.9q, 460.9t
Natural Resources Establish shooting range fees 324.503(d)
Adjust contribution from Off-Road Vehicle Account to ORV training program 324.81117
Establish duplicate recreational safety certificate fee 324.503(c)
Adjust dealer commission for sale of off-road vehicle licenses 324.81119
Adjust off-road vehicle license fee 324.81116
School AidCodify Education Achievement Authority 380.3-6, 380.1260, 380.1280c,
new sections
State Adjust Commercial Driver License group fee 251.312e(7), 257.312e(13)
State PoliceEliminate fingerprint and criminal
background fee sunsets 28.273
Complete transfer of Officer's Survivor Tuition Program to Higher Education 390.1242
Transportation Dedicate TEDF driver’s license fee revenue to State Trunkline Fund
947.911