Embed Size (px)
Citation preview

NAVAL POSTGRADUATE
SCHOOL
MONTEREY, CALIFORNIA
DISSERTATION
Approved for public release. Distribution is unlimited.
EXECUTABLE BEHAVIORAL MODELING OF SYSTEM- AND SOFTWARE-ARCHITECTURE SPECIFICATIONS TO INFORM RESOURCING
DECISIONS
by
Monica F. Farah-Stapleton
September 2016
Dissertation Supervisor: Mikhail Auguston
THIS PAGE INTENTIONALLY LEFT BLANK
i
REPORT DOCUMENTATION PAGE Form Approved OMB No. 0704-0188
Public reporting burden for this collection of information is estimated to average 1 hour per response, including the time for reviewing instruction, searching existing data sources, gathering and maintaining the data needed, and completing and reviewing the collection of information. Send comments regarding this burden estimate or any other aspect of this collection of information, including suggestions for reducing this burden, to Washington headquarters Services, Directorate for Information Operations and Reports, 1215 Jefferson Davis Highway, Suite 1204, Arlington, VA 22202-4302, and to the Office of Management and Budget, Paperwork Reduction Project (0704-0188) Washington DC 20503. 1. AGENCY USE ONLY (Leave blank)
2. REPORT DATE September 2016
3. REPORT TYPE AND DATES COVERED Doctoral Dissertation
4. TITLE AND SUBTITLE EXECUTABLE BEHAVIORAL MODELING OF SYSTEM- AND SOFTWARE-ARCHITECTURE SPECIFICATIONS TO INFORM RESOURCING DECISIONS
5. FUNDING NUMBERS
6. AUTHOR(S) Monica F. Farah-Stapleton
7. PERFORMING ORGANIZATION NAME(S) AND ADDRESS(ES) Naval Postgraduate School Monterey, CA 93943-5000
8. PERFORMING ORGANIZATION REPORT NUMBER
9. SPONSORING /MONITORING AGENCY NAME(S) AND ADDRESS(ES)
N/A
10. SPONSORING / MONITORING AGENCY REPORT NUMBER
11. SUPPLEMENTARY NOTES The views expressed in this thesis are those of the author and do not reflect the official policy or position of the Department of Defense or the U.S. Government. IRB number ____N/A____.
12a. DISTRIBUTION / AVAILABILITY STATEMENT Approved for public release. Distribution is unlimited.
12b. DISTRIBUTION CODE
13. ABSTRACT (maximum 200 words)
The size, cost, and slow rate of change of Department of Defense (DOD) Information Technology (IT) systems make introducing new capabilities challenging. Without considering the whole system and its environment, design decisions may result in unintended operational and financial impacts, often not visible until later testing. These complex systems and their interactions are not cheap to maintain, impacting intellectual, programmatic, and organizational resources. Precise behavioral modeling offers a way to assess architectural design decisions prior to, during, and after implementation to mitigate the impacts of complexity, but this modeling cannot estimate those design decisions’ effort and cost. This research introduces a methodology to extract Unadjusted Function Point (UFP) counts from architectural behavioral models utilizing a framework called Monterey Phoenix (MP), lightweight formal methods, and high-level pseudocode for use in cost estimation models such as COCOMO II. Additionally, integration test estimates are informed by extracts of MP model event traces. These unambiguous, executable architecture models and their views can be inspected and revised in order to facilitate communication with stakeholders, reduce the potential for software failure, and lower implementation costs.
14. SUBJECT TERMS architecture, behavioral modeling, cost estimates, unadjusted function point, test cases, views
15. NUMBER OF PAGES
237 16. PRICE CODE
17. SECURITY CLASSIFICATION OF REPORT
Unclassified
18. SECURITY CLASSIFICATION OF THIS PAGE
Unclassified
19. SECURITY CLASSIFICATION OF ABSTRACT
Unclassified
20. LIMITATION OF ABSTRACT
UU NSN 7540-01-280-5500 Standard Form 298 (Rev. 2-89)
Prescribed by ANSI Std. 239-18

ii
THIS PAGE INTENTIONALLY LEFT BLANK
iii
Approved for public release. Distribution is unlimited.
EXECUTABLE BEHAVIORAL MODELING OF SYSTEM- AND SOFTWARE-ARCHITECTURE SPECIFICATIONS TO INFORM RESOURCING DECISIONS
Monica F. Farah-Stapleton
B.S.E.E., Rutgers University, 1985 ExMSE, University of Pennsylvania, 1996
Submitted in partial fulfillment of the
requirements for the degree of
DOCTOR OF PHILOSOPHY IN SOFTWARE ENGINEERING
from the
NAVAL POSTGRADUATE SCHOOL September 2016
Approved by: Mikhail Auguston
Associate Professor, Department of Computer Science, NPS Dissertation Supervisor and Committee Chair
Clifford Whitcomb Professor, Department of Systems Engineering, NPS Donald P. Brutzman Associate Professor, Department of Information Science, NPS
Kristin Giammarco Associate Professor, Department of Systems Engineering, NPS Raju Namburu Associate Director Computational and Information Sciences Directorate, U.S. Army Research Laboratory
Approved by: Peter Denning, Chair, Department of Computer Science Approved by: Douglas Moses, Vice Provost of Academic Affairs

iv
THIS PAGE INTENTIONALLY LEFT BLANK
v
ABSTRACT
The size, cost, and slow rate of change of Department of Defense (DOD)
Information Technology (IT) systems make introducing new capabilities challenging.
Without considering the whole system and its environment, design decisions may result in
unintended operational and financial impacts, often not visible until later testing. These
complex systems and their interactions are not cheap to maintain, impacting intellectual,
programmatic, and organizational resources. Precise behavioral modeling offers a way to
assess architectural design decisions prior to, during, and after implementation to mitigate
the impacts of complexity, but this modeling cannot estimate those design decisions’
effort and cost. This research introduces a methodology to extract Unadjusted Function
Point (UFP) counts from architectural behavioral models utilizing a framework called
Monterey Phoenix (MP), lightweight formal methods, and high-level pseudocode for use
in cost estimation models such as COCOMO II. Additionally, integration test estimates
are informed by extracts of MP model event traces. These unambiguous, executable
architecture models and their views can be inspected and revised in order to facilitate
communication with stakeholders, reduce the potential for software failure, and lower
implementation costs.

vi
THIS PAGE INTENTIONALLY LEFT BLANK
vii
TABLE OF CONTENTS
I. OVERVIEW ...........................................................................................................1 A. RESEARCH GOAL ..................................................................................2 B. SIGNIFICANCE OF THE PROBLEM AND ITS POTENTIAL
IMPACT .....................................................................................................3 C. SPECIFIC GOALS OF THIS RESEARCH............................................3 D. PROPOSED ADVANCES TO THE STATE OF THE ART .................6
II. RELATED WORK ................................................................................................7 A. SOFTWARE COST ESTIMATION ........................................................8 B. FUNCTION POINT COUNTING PROCESS ......................................14 C. ARCHITECTURE AND ARCHITECTURE MODELING ................22 D. THE ROLE OF FORMAL METHODS, SEMI-FORMAL
METHODS AND LIGHTWEIGHT FORMAL METHODS IN ARCHITECTURE MODELING ...........................................................31
E. MONTEREY PHOENIX (MP) ..............................................................34 F. ESTIMATES FOR INTEGRATION TESTING ..................................39
III. METHODOLOGY ..............................................................................................43
IV. IMPLEMENTATION OF METHODOLOGY (EXAMPLES) .......................67 A. SPELL CHECKER EXAMPLE .............................................................68 B. COURSE MARKS EXAMPLE ..............................................................82 C. IT’S TEE TIME EXAMPLE ..................................................................96
V. SUMMARY OF RESULTS AND FINDINGS ................................................135 A. RESULTS AND FINDINGS .................................................................135 B. CONCLUSIONS ....................................................................................137 C. FUTURE WORK ...................................................................................138
APPENDIX A. MP SCHEMA FOR SPELL CHECKER .........................................141
APPENDIX B. MP SCHEMA FOR COURSE MARKS ..........................................145
APPENDIX C. MP SCHEMA FOR IT’S TEE TIME COAS 1–4 ...........................149 A. MP SCHEMA FOR COURSE OF ACTION 1 ...................................149 B. MP SCHEMA FOR COURSE OF ACTION 2 ...................................155 C. MP SCHEMA FOR COURSE OF ACTION 3 ...................................161 D. MP SCHEMA FOR COURSE OF ACTION 4 ...................................184
LIST OF REFERENCES ..............................................................................................211
INITIAL DISTRIBUTION LIST .................................................................................219

viii
THIS PAGE INTENTIONALLY LEFT BLANK
ix
LIST OF FIGURES
Figure 1. Functionality as Viewed from the User’s Perspective. Adapted from [21]. ............................................................................................................17
Figure 2. The Anatomy of the Event Grammar Rule. Adapted from [48]. ...............36
Figure 3. The ThreeMetrics Methodology Overview ...............................................43
Figure 4. ThreeMetrics Box and Arrow Simplified View .........................................47
Figure 5. Tee Time Generic Box and Arrow View. Adapted from [56]. ..................48
Figure 6. Golf Courses List Screen. Adapted from [56]. ..........................................49
Figure 7. MP Schema Description for EQ State Drop Down Example ....................52
Figure 8. MP Schema For Data Function: SHARE ALL ..........................................53
Figure 9. MP Schema For Data Function: COORDINATE ......................................53
Figure 10. MP Event Trace .........................................................................................56
Figure 11. Nominal Effort Options Selected, Maintenance Off ..................................62
Figure 12. Nominal Options Selected, Maintenance Off, Results ..............................63
Figure 13. Event Trace View: Sequence Diagram ......................................................65
Figure 14. Integrated View of Manual and MP Schema UFP Count Calculation ......66
Figure 15. Spell Checker Example. Adapted from [69]. .............................................69
Figure 16. ThreeMetrics Box and Arrow View: Spell Checker ..................................70
Figure 17. Firebird Spell Checker Event Trace 1 of 3215 ..........................................73
Figure 18. Firebird Spell Checker Event Trace 1612 of 3215 ....................................74
Figure 19. Firebird Spell Checker Event Trace 2311 of 3215 ....................................75
Figure 20. Nominal Effort Options Selected, Maintenance Off ..................................80
Figure 21. Nominal Effort Options Selected, Maintenance Off, Results ....................81
Figure 22. ThreeMetrics Box and Arrow View: Course Marks ..................................84
x
Figure 23. Firebird Course Marks Event Trace 2 of 4 ................................................88
Figure 24. Firebird Course Marks Event Trace 3 of 4 ................................................89
Figure 25. Firebird Course Marks Event Trace 4 of 4 ................................................90
Figure 26. Nominal Effort Options Selected, Maintenance Off ..................................94
Figure 27. Nominal Effort Options Selected, Maintenance Off, Results ....................95
Figure 28. It’s Tee Time Screen. Adapted from [56]. .................................................98
Figure 29. Tee Time Main Menu Screen. Adapted from [56]. ...................................99
Figure 30. Golf Course List. Adapted from [56]. ......................................................100
Figure 31. Golf Course Detail. Adapted from [56]. ..................................................101
Figure 32. Tee Time Reservation Screen. Adapted from [56]. .................................102
Figure 33. Maintain Golf Courses Screen. Adapted from [56]. ................................103
Figure 34. Scoreboard Screen. Adapted from [56]. ..................................................104
Figure 35. Tee Time Shopping. Adapted from [56]. .................................................105
Figure 36. Tee Time Merchandise Example Screen: Mug. Adapted from [56]. .......106
Figure 37. Database Layout: Internal Logical Files. Adapted from [56]. .................107
Figure 38. Database Layout: External Internal Interface Files. Adapted from [56]. ..........................................................................................................107
Figure 39. ThreeMetrics Box and Arrow View: Tee Time .......................................108
Figure 40. Event Trace #1 of 864 ..............................................................................121
Figure 41. Event Trace #400 of 864 ..........................................................................122
Figure 42. Event Trace #864 of 864 ..........................................................................123
Figure 43. Nominal Effort Options Selected for COA 1, Maintenance Off .............131
Figure 44. Nominal Effort Options for COA 1, Maintenance Off, Results ..............132
xi
LIST OF TABLES
Table 1. Estimation Method Comparison. Adapted from [11, p. 226]. ...................11
Table 2. UFP to SLOC Conversion Ratios. Adapted from [12]. .............................13
Table 3. Functional Complexity and Size for EIs. Adapted from [9, Sec. 1, p. 19 Table 6 and 8]. ......................................................................................19
Table 4. Functional Complexity and Size for EQs. Adapted from [9, Sec.1, p. 19, Table 7 and Table 8]. ...........................................................................19
Table 5. Functional Complexity and Size for EOs. Adapted from [9, Sec.1, p. 19, Table 7 and Table 8]. ...........................................................................19
Table 6. Functional Complexity for ILF and EIF. Adapted from [9, Sec.1, p. 13 Table 1]. ................................................................................................20
Table 7. Functional Size for Data Functions. Adapted from [9, Sec. 1, p. 13, Table 2]. .....................................................................................................20
Table 8. Architecture: A Bridge between Requirements and High-Level Design. .......................................................................................................30
Table 9. Monterey Phoenix Event Patterns. Adapted from [48]. .............................36
Table 10. UFP Count for EQ State Drop Down ........................................................50
Table 11. Functional Size for Data Functions. Adapted from [9, Sec. 1, p. 13, Table 2]. .....................................................................................................57
Table 12. Functional Complexity For ILF and EIF. Adapted from [9, Sec. 1 p. 13 Table 1]. ................................................................................................58
Table 13. Functional Complexity and Size for EQs. Adapted from [9, Sec.1, p. 19, Table 7 and Table 8]. ...........................................................................59
Table 14. Nominal Option Estimates .........................................................................62
Table 15. Nominal Effort Estimates ..........................................................................80
Table 16. UFP Calculation. Adapted from Terms from Solutions and Function Point Complexity Weights [69, p. 547]. ....................................................83
Table 17. Nominal Effort Estimates ..........................................................................94
xii
Table 18. EQ COORDINATEs Extracted From MP Schema for COA 3 ...............127
Table 19. EI COORDINATEs Extracted From MP Schema for COA 3 .................127
Table 20. EO COORDINATEs Extracted From MP Schema for COA 3 ...............128
Table 21. Data Function UFP Using Nested COORDINATE .................................129
Table 22. Nominal Effort Estimates for COA 1 ......................................................130
Table 23. COCOMO II Output ................................................................................133
Table 24. UFP Summation for Examples in Chapter IV .........................................137
xiii
LIST OF ACRONYMS AND ABBREVIATIONS
COA Course of Action Analysis
COCOMO II COnstructive COst MOdel II
DET Data Element Type
DOD Department of Defense
DODAF DOD Architecture Framework
EI External Input
EIF External Interface File
EO External Output
EQ External Inquiry
FFBD Functional Flow Block Diagram
FP Function Point
FPA Function Point Analysis
FPC Function Point Counting
FTR File Type Referenced
IFPUG International Function Point User Group
ILF Internal Logical File
RET Record Element Type

xiv
THIS PAGE INTENTIONALLY LEFT BLANK
xv
ACKNOWLEDGMENTS
There are many people in my personal and professional life who have contributed,
both directly and indirectly, to the successful completion of this work. I would like to take
this opportunity to acknowledge their encouragement. I would like to thank my friends
and family for their constant love and support; my committee and advisor, who never let
me waver; and most especially my husband, without whom none of this could have
happened.

xvi
THIS PAGE INTENTIONALLY LEFT BLANK
1
I. OVERVIEW
The Department of Defense (DOD) is in the process of transforming its stove-
piped, software-intensive systems into integrated, adaptable, cyber-hardened systems that
leverage software, system, and system-of-systems (SoS) engineering techniques.
Historically, there have been significant but often disjointed efforts to develop
architectural descriptions that can allow consistent design and analysis of new and legacy
systems. Architectural design and analysis are part of a powerful mechanism that
captures design decisions early in the process, so they can be assessed and modified
without incurring the unnecessary costs of incorrect implementation.
Architectural design decisions are often captured through a system-by-system
analysis, using a spectrum of architecture description representations from natural
language to formal notations. For this reason, inconsistent architecture descriptions of the
system and the environment require analyzing decisions through manually intensive
methods, such as inspections and reviews, since the lack of consistent description
methods makes automated analysis almost impossible. System development and software
architecture development efforts are often implemented as if they were unrelated, with
incomplete or duplicative results, yielding technically and programmatically
unsustainable outcomes.
This is an unfortunate state of affairs because architecture matters. According to
Rozanski and Woods, “every system has an architecture, whether or not it is documented
and understood” [1, p. 20]. Architecture deserves the attention of technical and
programmatic decision-makers because it can capture design decisions that allows them
to verify socio-technical assertions. Without accurate and complete architectural
descriptions, the DOD cannot determine disposition strategies for legacy systems (e.g.,
migrate, sunset), system-development strategies (e.g., buy/adopt/build), interoperability
and integration strategies for incremental implementation that inform total cost of
ownership (TCO) and return on investment (ROI), and meaningful engineering metrics
2
that inform forecasting (e.g., estimates of new services or system elements) for future
increments of a system’s development.
Stakeholders should have complementary interests, but due to incomplete or
insufficient architecture representations, their interests often conflict. For example, a
software engineer may expect behaviors to be represented by UML sequence diagrams,
Agile user stories, high-level pseudocode, or implemented code. A SoS engineer, on the
other hand, may want to see functional flow block diagram FFBD boxes and arrows and
to search for the conditions that result in emergent behavior. Cost analysts review the
resourcing implications for each instance of system and environment architecture,
leveraging a spectrum of estimation strategies from Excel through parametric models.
Each user wants the system to work from his or her perspective, independent of the
healthy tensions between cost and design [2].
To meet these multi-stakeholder challenges, organizations expend significant
resources to develop architecture descriptions of an individual system, with only a
cursory view of the impact to and from the environment with which it interacts.
Architecture descriptions must assist in capturing design decisions, provide a framework
to reason about those decisions, and then facilitate analyses to verify assertions early
enough in the design process to prevent incurring the costs of incorrect implementation.
Cost must be considered a necessary attribute of an architecture element, and software
must not be considered an afterthought. These practical requirements can be satisfied by
early and consistent behavioral modeling and the extraction of statistics from executable
architecture models that inform cost.
A. RESEARCH GOAL
The goal of this research is to introduce a newly developed methodology, called
ThreeMetrics, which extracts unadjusted function point (UFP) counts from discrete
architecture behavioral models; these models were created from the Monterey Phoenix
(MP) modeling language and framework for use in cost estimation models such as
Constructive Cost Model II (COCOMO II), protected by copyright [3]–[5]. Additionally,
this research discusses the extraction of scenarios (use cases) from the MP model that can
3
inform distinct integration test cases and the presentation of multiple views for
communication with a spectrum of stakeholders. The name ThreeMetrics represents these
three metrics: UFP count, use cases to inform integration test estimates, and views of the
architecture.
The ThreeMetrics methodology contributes to technical and programmatic
decision making by providing the ability to refine and analyze executable architecture
models beginning at the earliest design stages.
B. SIGNIFICANCE OF THE PROBLEM AND ITS POTENTIAL IMPACT
Unlike private industry, DOD organizational strategies and resourcing are not
directly governed by market influences. A product’s time to market and internal
programmatic efficiencies do not determine whether a government organization survives
through the next quarter.
Senior DOD decision-makers may not understand the mechanics of architecture
modeling, but they do understand TCO, ROI, cost savings, cost avoidance, and
efficiencies. They understand the need for data that inform their decisions to invest in
specific implementations and to quickly and accurately assess whether the ROI is
warranted. Decision makers also understand the operational impact on service men and
women no matter whether they are still part of the DOD or have transitioned to veteran
status.
In the absence of strong influences forcing consistent cultural change across the
DOD, enforcement mechanisms, informed by data that are objective, repeatable, timely,
and understandable, offer valuable alternatives.
C. SPECIFIC GOALS OF THIS RESEARCH
The ThreeMetrics methodology employs architecture modeling of the behaviors
of a software-intensive system, the environment, and the system interacting with the
environment, in order to inform technical and investment decisions. This research
accomplishes the following:
4
• Presents a methodology to extract an UFP count from MP’s executable architecture models for use in software cost estimation
• Leverages precise behavioral modeling using MP to assess architecture design decisions and their impacts
• Relates architecture modeling to resourcing through analysis of behaviors and UFP counts, leveraging complexity and size metrics such as the data element type (DET)
• Extracts use cases to inform integration testing estimates
• Visualizes results in architecture views, which can be used to communicate with multiple stakeholders
As discussed by Auguston and Whitcomb “The MP behavior model is based on
the concept of an event as an abstraction of activity” [3]. MP is an executable architecture
model that can be executed on tools to generate examples of the behaviors in the form
event traces (use cases). An executable architecture model can be inspected and
debugged to test whether the architecture model accurately captures the behaviors of the
system.
MP’s foundation is in lightweight formal methods, which are essential to
behavioral modeling of complex systems because they remove ambiguity from the
architecture model. As with all assessments, visual representations and automated tools
assist architecture assessments based on lightweight formal methods. Such tools provide
immediate feedback, help identify errors once an early architecture draft is constructed,
and allow the user to reason about the model. There are many tools that support
lightweight formal methods-based analysis, including MP’s Analyzer on Firebird [6],
Eagle6 [7], and Alloy Analyzer [8]. Firebird and Eagle6 are implementations of the MP
framework. Eagle6 is a commercial tool, which has been graciously made available for
select research purposes. Firebird is a Naval Postgraduate School (NPS) implementation
that is publicly available and was ultimately selected for this research. A more detailed
discussion of MP and the tool MP Analyzer on Firebird, or simply Firebird, is included in
Chapter II Section E.
5
This research also leverages the International Function Point User Group
(IFPUG)’s counting method, which uses a function point (FP) as the unit of functional
size. IFPUG states, “A Function Point is a normalized metric used to evaluate software
deliverables and to measure size based on well-defined functional characteristics of the
software system” [9]. Function point analysis (FPA) provides a way for measuring
software development and maintenance, independent of the technology used for
implementation. FPA is viewed from the perspective of the functionality requested by
and provided to the user, either a human user or another system. FP descriptions can also
help visualize a system, its sub-components, and the environment to address the concerns
of specific stakeholders. As such, FPA is an initial step to describing the architecture
model of a system.
One of the earliest activities in the FPA counting process is identifying the
application boundary. FPA transactional functions can be viewed as markers of this
boundary. The ThreeMetrics methodology unambiguously defines the boundaries and
interactions of the system and the environment (i.e., everything but the system, including
the user) through descriptions in the MP’s model schema of the FPA transactional
functions. The interactions of the FPA data function types are also represented in the
MP’s model schema. Once the boundaries are identified and the interactions have been
described, the transactional and data function types are extracted from the MP model and
complexity value assigned to provide the overall UFP count.
The UFP count is then used as input into COCOMO II to calculate an effort
estimate. The MP model is a rich source of information. In addition to extracting a UFP
count, the number of use cases to inform integration test estimates and view of the
architecture are also extracted from the MP model.
Chapter II of this dissertation presents related work that influenced this research.
The ThreeMetrics methodology is then described in Chapter III. The methodology is
demonstrated through analyzing three examples in Chapter IV. Chapter V provides a
summary of results and findings.
6
D. PROPOSED ADVANCES TO THE STATE OF THE ART
The ThreeMetrics methodology relates well-established methodologies, such as
FP counting and COCOMO II cost modeling, to an executable behavioral modeling of
system- and software-architecture specifications.
ThreeMetrics improves on previous state-of-the-art, semi-formal representations
used by current function-point-counting methods. By using high-level pseudocode and
composition operations from the MP framework, the resulting behavioral architecture
model can be iteratively inspected and revised until it represents accurate behaviors.
The precise model of the system- and software-architecture specification includes
describing the boundary separating the application under analysis and the environment. If
architecture is considered a bridge between the requirements and high-level design, then
an architecture model helps to build the correct bridge. The MP model is executed using
Firebird, resulting in views of the architecture that are automatically generated. These
views establish a “common mental model,” a model that all users can interpret, used to
communicate with a spectrum of stakeholders.
The development of a precise architecture and commonly understood views early
in the product’s life cycle reduces the potential for software failure and lowers costs in
implementation. This improves on the state-of-the-art by providing a mechanism to
execute the representation of both the application and the environment using the same
modeling framework, and then automatically generating use cases and scenarios (i.e.
views of the architecture model) that serve as examples that humans can understand
better than generic descriptions.
The MP model can be inspected manually or by automated tools to extract the
number of composition operations that represent the transactional functions and data
functions and their associated complexity. Once the UFP count is calculated, it is then
inserted into the COCOMO II cost-estimation models to determine effort.
7
II. RELATED WORK
As discussed in Chapter I, the goal of this research is to develop a methodology to
extract UFP counts from executable architectural behavioral models for use in cost-
estimation models, such as COCOMO II, to inform effort estimates early in the life cycle
of the system. In order to achieve this research goal, the goal itself had to be decomposed
into a set of executable research tasks, exploring how mature methodologies and concepts
could be linked to create a new methodology. The related works chapter highlights the
concepts that established the foundation on which this research was built.
Developing the ThreeMetrics methodology required an understanding of what
products would result from applying the methodology to communicate effort estimates
early in the life cycle of the system. Sections A through F of Chapter II highlight the
following key points that are relevant to this research.
• The scope of effort estimates: For this research, effort estimates included person-month effort, schedule, cost, and integration testing. This led to assessing the COCOMO II model for person-month effort, schedule, and cost and considering inputs that could be used in COCOMO II, such as UFP counts. Section A of this chapter highlights key points about software cost estimation in general, COCOMO II specifically, and introduces the relationship between UFP counts and COCOMO II.
• Unadjusted function point counts: UFP counts are one of several inputs that can be used in the COCOMO II model. UFP counts were selected as the input to COCOMO II for this research. Section B of this chapter addresses FPA, specifically data and transactional functions, and the development of unadjusted FP counts.
• Architecture modeling: UFP counts are developed very early in the lifecycle of the application being counted. Transactional and data functions can be viewed as interactions internal and external to the application being counted. These interactions can be represented in models of the system’s architecture. Section C of this chapter addresses architecture modeling.
• Formal, semi-formal, and lightweight formal methods: One of the greatest challenges in system design and development is ensuring that the users’ requirements have been satisfied by the implemented application. User requirements are often communicated in natural language, which can be ambiguous. Specificity in the description of the requirements can be achieved using more precise formal descriptions, but the resources needed to create
8
them can be prohibitive. Section D of this chapter discusses the role of formal, semi-formal, and lightweight formal methods as they relate to this research.
• Monterey Phoenix: Describing the behaviors of an application and the environment with which it interacts can be improved by capturing the behaviors in an executable architecture model, using a modeling language to describe that information, and then using an automated tool to execute the model. The MP modeling language and framework and the MP Analyzer on Firebird were used to describe and execute MP architecture behavioral models. Section E of this chapter provides a description of MP and the aspects of the language and framework relevant to this research.
• Integration test estimates: Integration testing is estimated to represent 25 percent of the total effort associated with an application. The schedule results from the construction phase of the COCOMO II model and the number of event traces generated from the MP model running on Firebird are used to inform integration testing estimates. Section F discusses what integration testing is and the relevance of the scope used in MP Analyzer on Firebird for the generation of the event traces.
Although these topics may be familiar to some readers, they may not be as
familiar to others. The reader will be able to explore the references for a more complete
description of each term and the associated topic. The combination of these concepts was
instrumental in selecting what methodologies would be used in the development of
ThreeMetrics, which are discussed in Chapter III of this document.
A. SOFTWARE COST ESTIMATION
There is a range of estimation techniques and algorithmic cost modeling that
should be considered when estimating software costs and impacts to schedule. The main
cost contributors to a software development project include hardware, software evolution,
training, and the effort of software developers. Most practitioners believe that effort is the
greatest contributor to overall effort and cost. Quantifying effort is a necessary activity
when laying out the resources needed to successfully develop a new software system or
enhance an existing one. Two key categories of metrics associated with productivity
estimates are size-related metrics and function-related metrics. As noted by Sommerville,
Productivity estimates are usually based on measuring attributes of the software and dividing this by the total effort required for development. There are two types of metric that have been used:
9
1. Size-related metrics. These are related to the size of some output from an activity. The most commonly used size-related metric is lines of delivered source code. Other metrics that may be used are the number of delivered object code instructions or the number of pages of system documentation.
2. Function-related metrics. These are related to the overall functionality of the delivered software. Productivity is expressed in terms of the amount of useful functionality produced in some given time. Function points and object points are the best-known metrics of this type.
Lines of source code per programmer-month (LOC/pm) is widely used as software productivity metric. You can compute LOC/pm by counting the total number of lines of source code that are delivered, then divide the count by the total time in programmer-months required to complete the project. This time therefore includes the time required for all other activities (requirements, design, coding, testing and documentation) involved in software development. [10, pp. 615–616]
While LOC/pm is a valuable productivity metric, it can be misleading. If one
programmer writes a more concise code than another programmer, or uses a more
expressive coding language, the perception of productivity will be inconsistent with
reality. An attribute other than coding size needs to be considered. Sommerville, with the
contributions of Albrecht and Gaffney, discusses,
An alternative to using code size as the estimated product attribute is to use some measure of the functionality of the code. This avoids the above anomaly, as functionality is independent of implementation language. The best known function based measure is the function-point count. [10, pp. 615–616]
The activities of the international function point users group (IFPUG) continue to
standardize and refine the FP counting methodology initiated by Albrecht, and are
discussed in more detail in section B of this chapter. The use of UFP counts in
algorithmic cost models is of specific interest to this research. Sommerville explains,
Algorithmic cost modelling uses a mathematical formula to predict project costs based on estimates of the project size, the number of software engineers, and other process and product factors. An algorithmic cost model can be built by analysing the costs and attributes of completed projects and finding the closest fit formula to actual experience.
10
In its most general form, an algorithmic cost estimate for software cost can be expressed as:
Effort = A x SizeB x M
where A is a constant factor that depends on local organisational practices and the type of software that is developed. Size may be either an assessment of the code size of the software or a functionality estimate expressed in function or object points. The value of exponent B usually lies between 1 and 1.5. M is a multiplier made by combining process, product and development attributes, such as the dependability requirements for the software and the experience of the development team. Most algorithmic estimation models have an exponential component (B in the above equation) that is associated with the size estimate. This reflects the fact that costs do not normally increase linearly with project size. As the size of the software increases, extra costs are incurred because of the communication overhead of larger teams, more complex configuration management, more difficult system integration, and so on. Therefore, the larger the system, the larger the value of this exponent. Unfortunately, all algorithmic models suffer from the same fundamental difficulties:
1. It is often difficult to estimate Size at an early stage in a project when only a specification is available. Function-point and object-point estimates are easier to produce than estimates of code size but are often still inaccurate.
2. The estimates of the factors contributing to B and M are subjective. Estimates vary from one person to another, depending on their background and experience with the type of system that is being developed…
A number of algorithmic models have been proposed as the basis for estimating the effort, schedule and costs of a software project. The COCOMO model is an empirical model that was derived by collecting data from a large number of software projects. These data were analysed to discover formulae that were the best fit to the observations. These formulae link the size of the system and product, project and team factors to the effort to develop the system. [10, pp. 615–616]
11
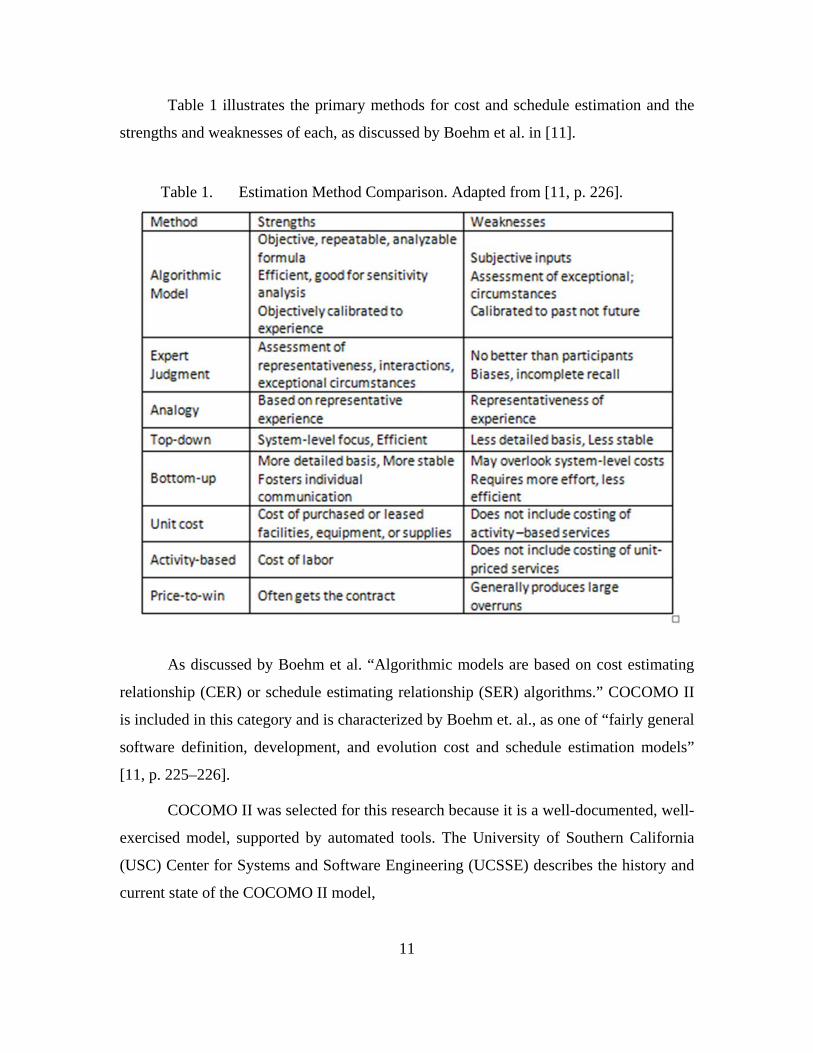
Table 1 illustrates the primary methods for cost and schedule estimation and the
strengths and weaknesses of each, as discussed by Boehm et al. in [11].
Table 1. Estimation Method Comparison. Adapted from [11, p. 226].
As discussed by Boehm et al. “Algorithmic models are based on cost estimating
relationship (CER) or schedule estimating relationship (SER) algorithms.” COCOMO II
is included in this category and is characterized by Boehm et. al., as one of “fairly general
software definition, development, and evolution cost and schedule estimation models”
[11, p. 225–226].
COCOMO II was selected for this research because it is a well-documented, well-
exercised model, supported by automated tools. The University of Southern California
(USC) Center for Systems and Software Engineering (UCSSE) describes the history and
current state of the COCOMO II model,
12
After several years and the combined efforts of USC-CSSE, ISR at UC Irvine, and the COCOMO II Project Affiliate Organizations, the result is COCOMO II, a revised cost estimation model reflecting the changes in professional software development practice that have come about since the 1970s. This new, improved COCOMO is now ready to assist professional software cost estimators for many years to come. [5]
COCOMO II consists of three sub models: the Applications Composition, Early
Design, and Post-architecture models. UFP counts are applicable to both the Early
Design and Post-architecture models, and both models are of interest to this research.
As described by USCCE,
COCOMO II provides the following three-stage series of models for estimation of Application Generator, System Integration, and Infrastructure software projects:
1. The earliest phases or spiral cycles will generally involve prototyping, using the Application Composition model capabilities. The COCOMO II Application Composition model supports these phases, and any other prototyping activities occurring later in the life cycle.
2. The next phases or spiral cycles will generally involve exploration of architectural alternatives or incremental development strategies. To support these activities, COCOMO II provides an early estimation model called the Early Design model. This level of detail in this model is consistent with the general level of information available and the general level of estimation accuracy needed at this stage.
3. Once the project is ready to develop and sustain a fielded system, it should have a life-cycle architecture, which provides more accurate information on cost driver inputs, and enables more accurate cost estimates. To support this stage, COCOMO II provides the Post-Architecture model. [4, p. 7]
The counting process for determining the UFP count used in COCOMO II for
both the Early Design and Post-Architecture models is consistent with the approach
supported by the IFPUG. A combination of UFP and source lines of code is used for the
Early Design and Post-Architecture models, leveraging counting rules from the IFPUG
for the UFP count. As discussed by UCSSE with contributions from Jones,
To determine the nominal person months for the Early Design model, the unadjusted function points have to be converted to source lines of
13
code in the implementation language (assembly, higher order language, fourth-generation language, etc.) in order to assess the relative conciseness of implementation per function point. COCOMO II does this for both the Early Design and Post-Architecture models by using tables such as those found in [Jones 1991] to translate Unadjusted Function Points into equivalent SLOC. [4, p. 20]
The COCOMO II tool [5] automatically converts UFP counts into source lines
of code for a specific implementation language that is an option that can be selected in
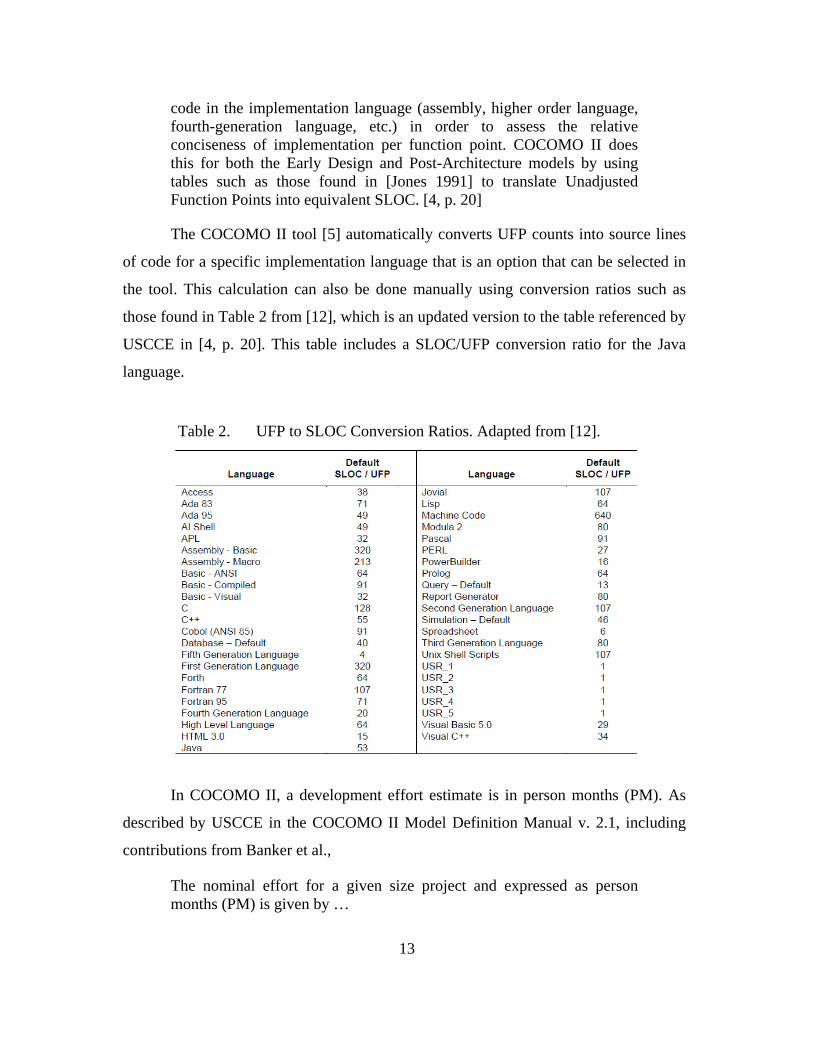
the tool. This calculation can also be done manually using conversion ratios such as
those found in Table 2 from [12], which is an updated version to the table referenced by
USCCE in [4, p. 20]. This table includes a SLOC/UFP conversion ratio for the Java
language.
Table 2. UFP to SLOC Conversion Ratios. Adapted from [12].
In COCOMO II, a development effort estimate is in person months (PM). As
described by USCCE in the COCOMO II Model Definition Manual v. 2.1, including
contributions from Banker et al.,
The nominal effort for a given size project and expressed as person months (PM) is given by …
14
PMnominal = A x (Size)B …
[This equation] is the base model for the Early Design and Post-Architecture cost estimation models. The inputs are the Size of software development, a constant, A, and a scale factor, B. The size is in units of thousands of source lines of code (KSLOC). This is derived from estimating the size of software modules that will constitute the application program. It can also be estimated from unadjusted function points (UFP), converted to SLOC then divided by one thousand. Procedures for counting SLOC or UFP are explained in the chapters on the Post-Architecture and Early Design models respectively. The scale (or exponential) factor, B, accounts for the relative economies or diseconomies of scale encountered for software projects of different sizes The constant, A, is used to capture the multiplicative effects on effort with projects of increasing size. [4, p. 7]
A more detailed discussion of the UFP count, its relationship to SLOC, and its
use in COCOMO II is found in Chapter III, Methodology, and Chapter IV,
Implementation.
B. FUNCTION POINT COUNTING PROCESS
In the late 1970s, Allan Albrecht from IBM was the first person to publicly
describe FPA as a method for functionally sizing software. The IFPUG was formed in
1986. While there are many companies that promote minor variations on the FP counting
process, IFPUG has been viewed as the authoritative source of information with respect
to this research. As described by the IFPUG [13] on its website,
The International Function Point Users’ Group (IFPUG) is a non-profit, member governed organization. The mission of IFPUG is to be a recognized leader in promoting and encouraging the effective management of application software development and maintenance activities through the use of Function Point Analysis (FPA) and other software measurement techniques.
The IFPUG website is a valuable resource for FPA information, professional
certifications, educational opportunities, conferences, committees, and working groups.
The IFPUG’s Function Point Counting Practices Manual contains the definitions and the
FP counting methodology used as the baseline for this research. The IFPUG information
was augmented, with contributions from FP counting practitioners, to understand how the
15
methodology is used in practice. Although there is variability in the opinions,
interpretations and refinements of the IFPUG FP counting methodology, the basic
concepts from that baseline are still consistently understood and implemented in tools and
practice. Additionally, there are descriptions, tutorials, and papers from practitioners,
each offering their own perspective on how to interpret the functional requirements and
apply the counting methodology [13]–[17].
The IFPUG provides the following definition, “Function Points are an
internationally standardized unit of measure used to represent software size. The IFPUG
functional size measurement method (referred to as IFPUG 4.3.1) quantifies software
functionality provided to the user based solely on its logical design and functional
requirements” [13].
For all the promoters and benefits associated with FPA, there are also detractors
and drawbacks. As derived from Kemerer [18] and Low and Jeffery [19] and stated by
Fraternali et al.,
It is well known that calculating the function points associated with a system is a labor intensive, time consuming and imprecise task. Organizations need experienced personnel dedicated to function point analysis, a substantial tuning period, and a large project base before reaching accurate predictions… In other words, much the same problems occurring in manual implementation of software affect also the manual computation of the software size. [20]
Yet, FP descriptions can be considered ways to view a system and its input and
output activities, with the primary focus on addressing concerns of stakeholders at the
outset.
Data function and transactional function types are foundational terms in the FPA
community as is the concept of the users’ perspectives. For the purposes of FPA, a user
can be a human or another machine interacting with the software. As discussed by the
IFPUG in [9], the well-documented process to perform a FP count includes the following
steps:
• Gather available source information
• Determine the counting scope and boundary
16
• Count data function and transactional function types
• Determine the unadjusted FP count
• Determine the value adjustment factor
• Calculate the final adjusted FP count
One of the earliest steps in the FPA counting process is identifying the counting
scope (e.g., new application, modification to an existing application), and the application
boundaries (e.g., what is the application of interest being considered for the count and
what is not). As discussed by IFPUG,
Function point counts can be identified, based on their purpose, as one of the following:
• Development project function point count
• Enhancement project function point count
• Application function point count [9, Sec.2-4]
IFPUG also clearly defines the boundary of the application being counted, to
distinguish it from the environment:
The boundary is a conceptual interface between the software under study and its users. The boundary (also referred to as application boundary):
• Defines what is external to the application.
• Indicates the border between the software being measured and the user.
• Acts as a ‘membrane’ through which data processed by transactions (EIs, EOs and EQs) pass into and out from the application.
• Encloses the logical data maintained by the application (ILFs).
• Assists in identifying the logical data referenced by but not maintained within this application (EIFs).
• Is dependent on the user’s external business view of the application. It is independent of technical and/or implementation considerations. [9, Sec. 5-4]
17
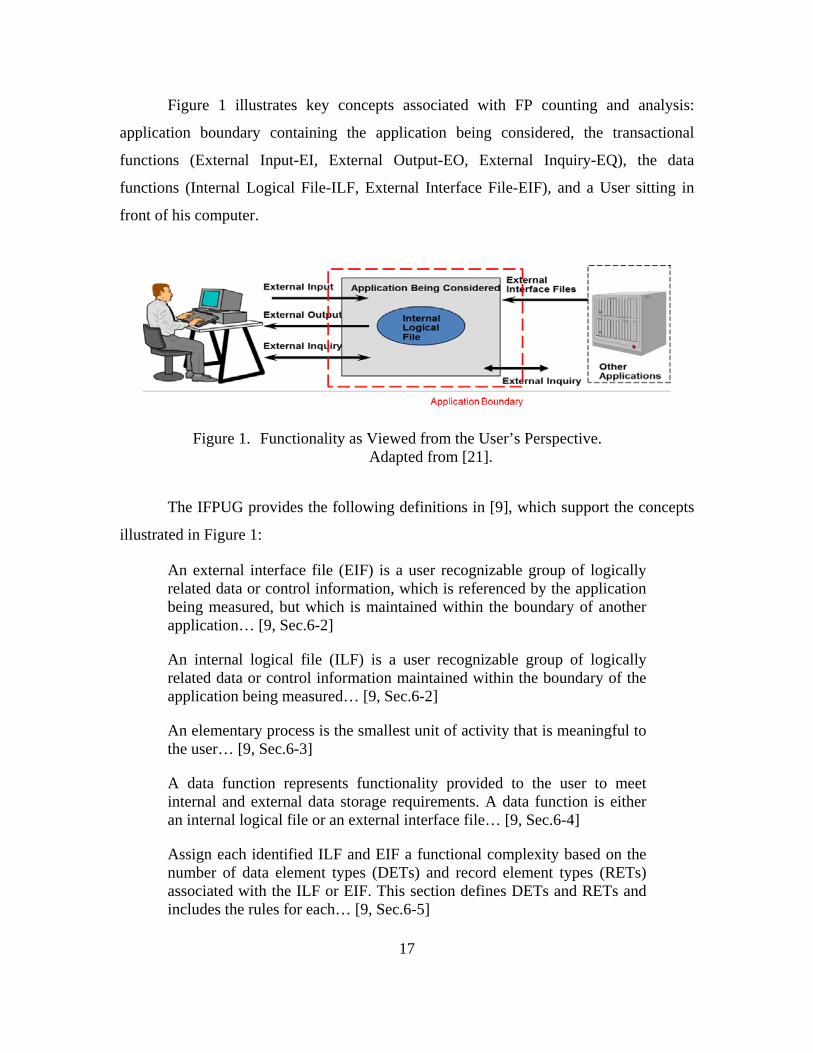
Figure 1 illustrates key concepts associated with FP counting and analysis:
application boundary containing the application being considered, the transactional
functions (External Input-EI, External Output-EO, External Inquiry-EQ), the data
functions (Internal Logical File-ILF, External Interface File-EIF), and a User sitting in
front of his computer.
Figure 1. Functionality as Viewed from the User’s Perspective. Adapted from [21].
The IFPUG provides the following definitions in [9], which support the concepts
illustrated in Figure 1:
An external interface file (EIF) is a user recognizable group of logically related data or control information, which is referenced by the application being measured, but which is maintained within the boundary of another application… [9, Sec.6-2]
An internal logical file (ILF) is a user recognizable group of logically related data or control information maintained within the boundary of the application being measured… [9, Sec.6-2]
An elementary process is the smallest unit of activity that is meaningful to the user… [9, Sec.6-3]
A data function represents functionality provided to the user to meet internal and external data storage requirements. A data function is either an internal logical file or an external interface file… [9, Sec.6-4]
Assign each identified ILF and EIF a functional complexity based on the number of data element types (DETs) and record element types (RETs) associated with the ILF or EIF. This section defines DETs and RETs and includes the rules for each… [9, Sec.6-5]
18
A data element type (DET) is a unique, user recognizable, non-repeated attribute… [9, Sec.6-5]
A record element type (RET) is a user recognizable sub-group of data element types within a data function… [9, Sec.6-7]
A transactional function is an elementary process that provides functionality to the user to process data. A transactional function is an external input, external output, or external inquiry… [9, Sec.7-1]
An external input (EI) is an elementary process that processes data or control information sent from outside the boundary… [9, Sec. 7-3]
An external output (EO) is an elementary process that sends data or control information outside the application’s boundary and includes additional processing beyond that of an external inquiry… [9, Sec.7-3]
An external inquiry (EQ) is an elementary process that sends data or control information outside the boundary… [9, Sec.7-3]
A file type referenced (FTR) is a data function read and/or maintained by a transactional function… [9, Sec.7-14]
Practitioners often expound upon the definitions of the original IFPUG terms.
Longstreet in [15] provides a practitioner’s view of transactional and data function types,
and describes key words in natural language that are associated with data functions and
transactional functions. FTRs, RETs, and DETs are important because their count
influences the functional complexity and, by extension, the functional size used to
calculate the unadjusted FP count for each transactional or data function. The summation
of the UFP count for each data function and each transaction function results in the
overall UFP point count. Functional complexity and size are identified for each ILF, EIF,
EI, EO, and EQ, in Tables 3, 4, 5, 6, and 7, based on values captured from the IFPUG [9].
These tables are used in the calculation of the UFP counts in Chapters III and IV of this
dissertation.
19
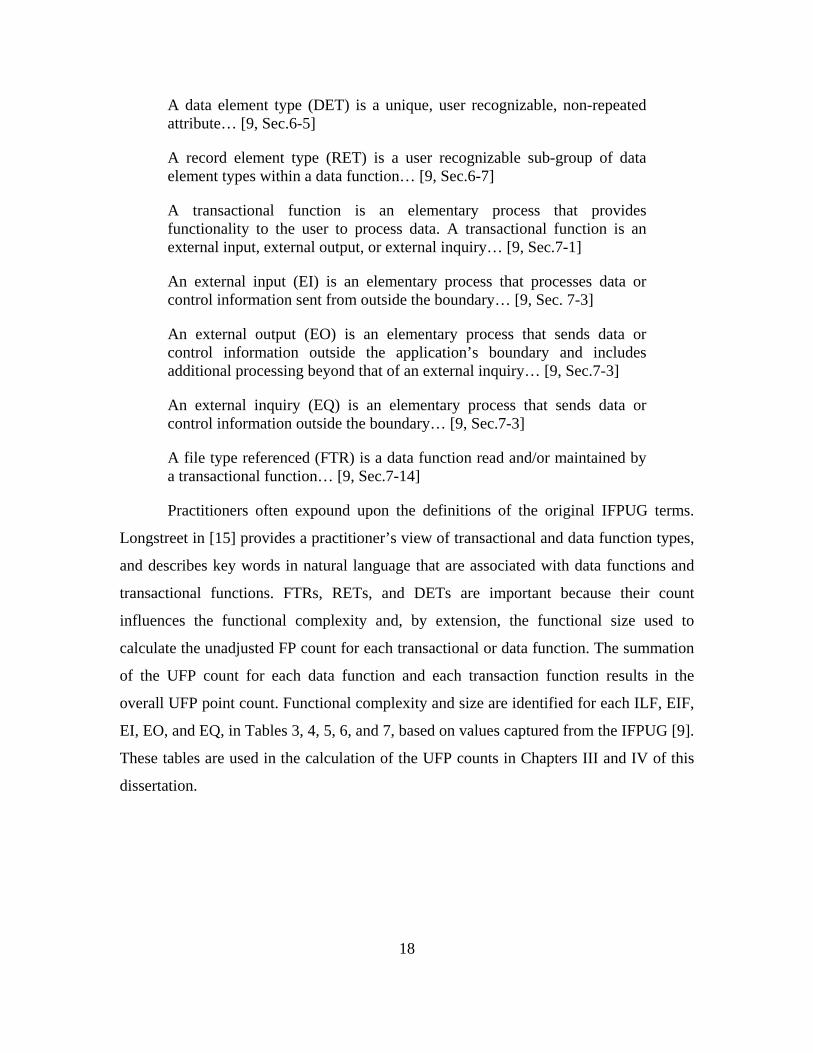
Table 3 contains the functional complexity and size values used to determine the
UFP count for an EI.
Table 3. Functional Complexity and Size for EIs. Adapted from [9, Sec. 1, p. 19 Table 6 and 8].
Table 4 contains the functional complexity and size values used to determine the
UFP count for an EQ.
Table 4. Functional Complexity and Size for EQs. Adapted from [9, Sec.1, p. 19, Table 7 and Table 8].
Table 5 contains the functional complexity and size values used to determine the
UFP count for an EO.
Table 5. Functional Complexity and Size for EOs. Adapted from [9, Sec.1, p. 19, Table 7 and Table 8].
20
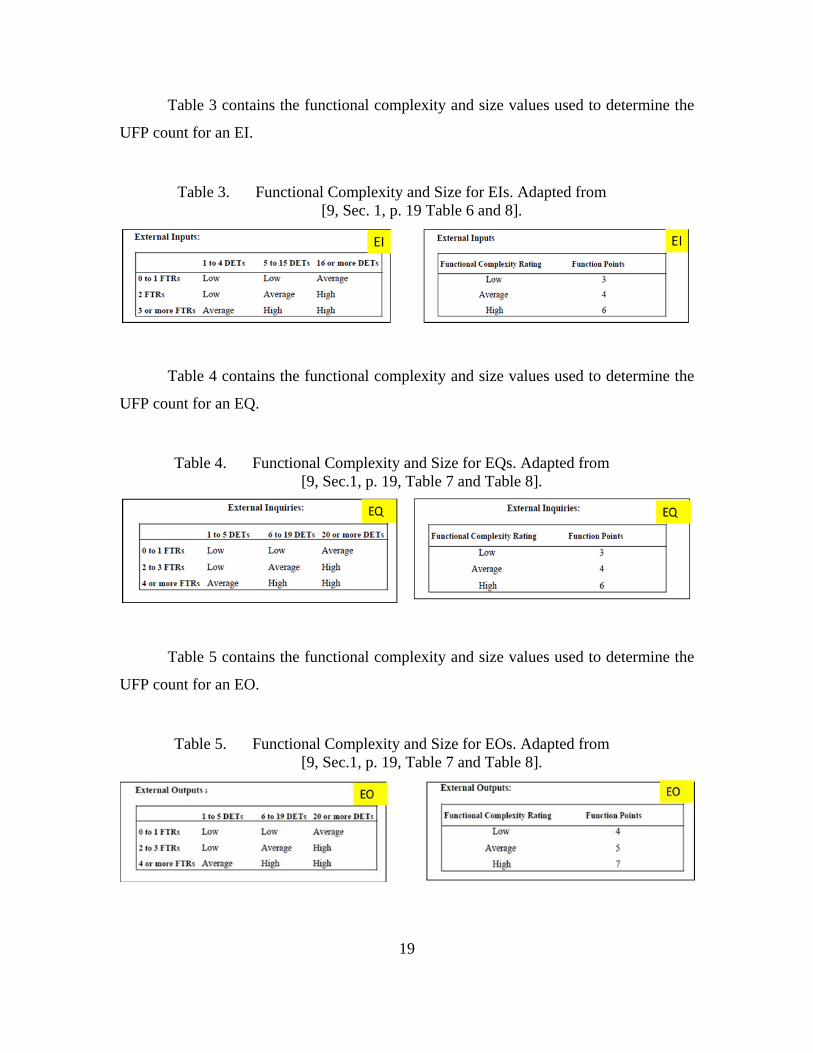
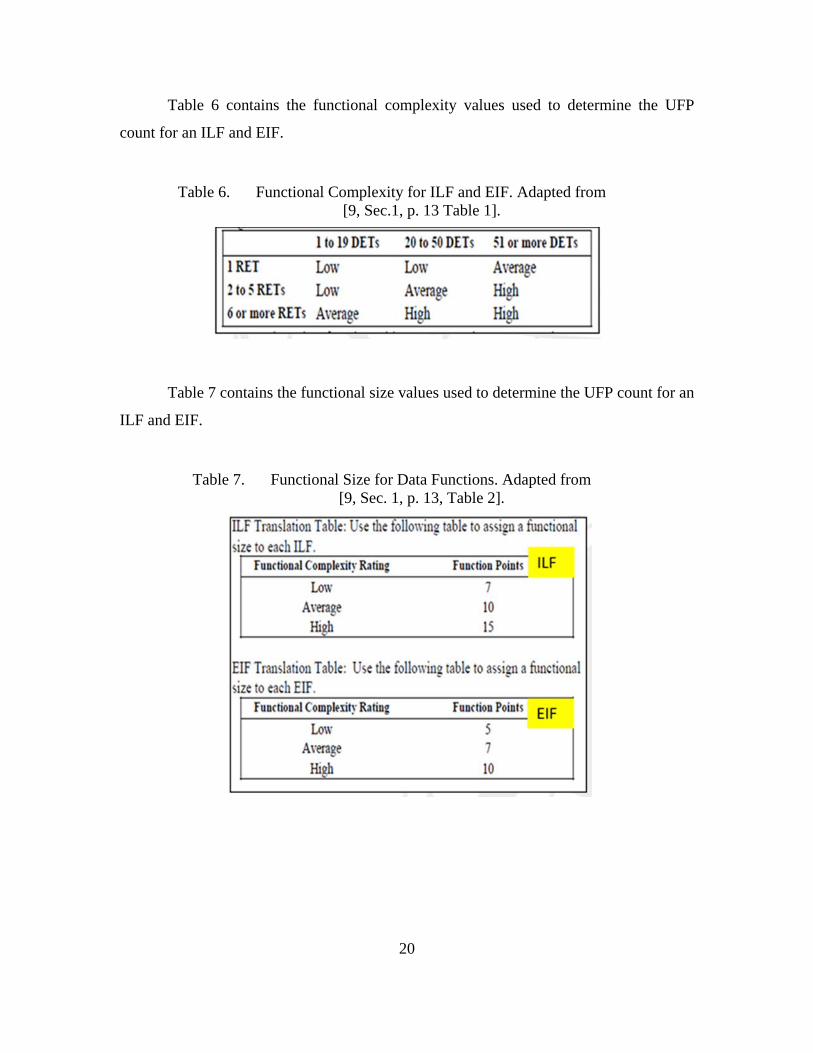
Table 6 contains the functional complexity values used to determine the UFP
count for an ILF and EIF.
Table 6. Functional Complexity for ILF and EIF. Adapted from [9, Sec.1, p. 13 Table 1].
Table 7 contains the functional size values used to determine the UFP count for an
ILF and EIF.
Table 7. Functional Size for Data Functions. Adapted from [9, Sec. 1, p. 13, Table 2].
21
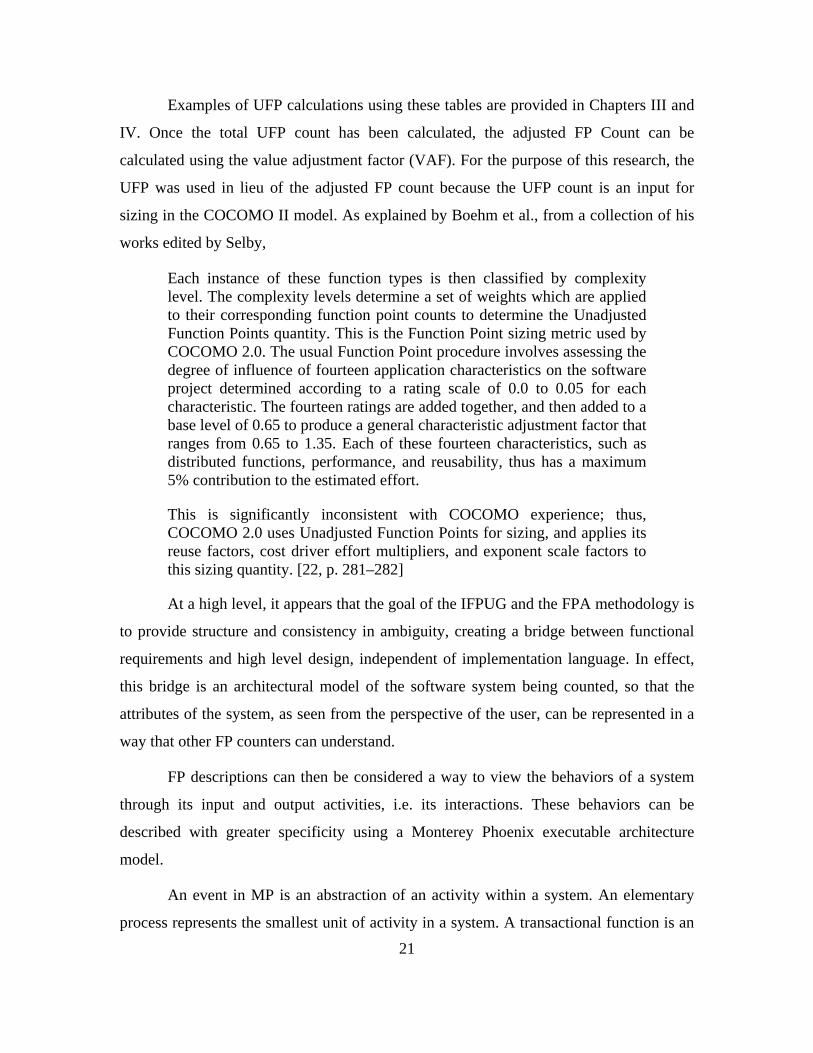
Examples of UFP calculations using these tables are provided in Chapters III and
IV. Once the total UFP count has been calculated, the adjusted FP Count can be
calculated using the value adjustment factor (VAF). For the purpose of this research, the
UFP was used in lieu of the adjusted FP count because the UFP count is an input for
sizing in the COCOMO II model. As explained by Boehm et al., from a collection of his
works edited by Selby,
Each instance of these function types is then classified by complexity level. The complexity levels determine a set of weights which are applied to their corresponding function point counts to determine the Unadjusted Function Points quantity. This is the Function Point sizing metric used by COCOMO 2.0. The usual Function Point procedure involves assessing the degree of influence of fourteen application characteristics on the software project determined according to a rating scale of 0.0 to 0.05 for each characteristic. The fourteen ratings are added together, and then added to a base level of 0.65 to produce a general characteristic adjustment factor that ranges from 0.65 to 1.35. Each of these fourteen characteristics, such as distributed functions, performance, and reusability, thus has a maximum 5% contribution to the estimated effort.
This is significantly inconsistent with COCOMO experience; thus, COCOMO 2.0 uses Unadjusted Function Points for sizing, and applies its reuse factors, cost driver effort multipliers, and exponent scale factors to this sizing quantity. [22, p. 281–282]
At a high level, it appears that the goal of the IFPUG and the FPA methodology is
to provide structure and consistency in ambiguity, creating a bridge between functional
requirements and high level design, independent of implementation language. In effect,
this bridge is an architectural model of the software system being counted, so that the
attributes of the system, as seen from the perspective of the user, can be represented in a
way that other FP counters can understand.
FP descriptions can then be considered a way to view the behaviors of a system
through its input and output activities, i.e. its interactions. These behaviors can be
described with greater specificity using a Monterey Phoenix executable architecture
model.
An event in MP is an abstraction of an activity within a system. An elementary
process represents the smallest unit of activity in a system. A transactional function is an
22
elementary process. The behavior of a transactional or data function can be described in
an MP architecture model as an abstraction of an interaction, by using high-level pseudo-
code. The functional aspects of requirements can then be represented in a way that is
amenable to incremental refinement.
The composition operations COORDINATE and SHARE ALL can be viewed as
markers of an interaction in the MP model. The structure and the complexity of
interactions in MP provide a source for assigning functional complexity and size values
to the UFP count. These values are consistent with the functional complexity and
functional size values associated with DETs, RETs, and FTRs in the function point
counting methodology.
Since an MP model is precise and formal, FP metrics can be extracted from the
model by using automated tools, to support cost estimates early in the life cycle of an
application. A more detailed discussion of software architectures and software
architecture modeling is in Chapter II Section C; a more detailed discussion of MP can be
found in Chapter II Section E; their relationship is described in the ThreeMetrics
methodology in Chapter III.
C. ARCHITECTURE AND ARCHITECTURE MODELING
The implementation of a software system is a socio-technical endeavor. As such,
the system’s purpose and relevance have to be communicated to multiple stakeholders in
a way that hides its complex detail but retains its key characteristics. This can be
achieved through the model of the architecture of a system and the environment with
which it interacts. An architecture model is an abstraction that is used to reason about
what the real system and environment will be. The model can be manipulated and
presented in such a way as to abstract away detail until needed, at which point
incremental refinement of the architecture shines a light on the approach to design and
implementation.
Yet, ‘architecture’ is one of the most overused, misused, and disrespected words
in the DOD vocabulary. Rather than viewing architectural analysis and architecture
modeling as powerful tools to establish a “common mental model” of a system across a
23
spectrum of stakeholders, models of architectures are viewed as check-the-block
requirements for acquisition milestones and DOD directives. The notations and tools are
considered, in many cases rightly so, oversold promises that, in actuality, require an
expensive shadow workforce for their creation and maintenance, with a fraction of return
on investment. This is an unfortunate situation that has evolved due to cottage-industry
mentality, and the demands of well-meaning bureaucratic processes.
The model of the architecture of a system and the environment with which it
interacts is the single most important artifact that an organization can have. The model
contributes to the following activities:
• Unifying an organization
• Eliciting and confirming what the user wants
• Assigning organizational responsibilities and informing resourcing decisions across organizations
• Exploring high level design decisions
• Positioning for development
• Executing developmental, integrated, and operational testing
• Supporting deployment into production
• Controlling software evolution in sustainment
Perhaps the sticking point is the multitude of definitions of the terms that are
directly and indirectly associated with the words ‘architecture’ and ‘architecture model’,
including ‘system’, ‘software system’, ‘application’, ‘software architecture’, ‘system
architecture’, ‘environment’, ‘system-of-systems’, ‘socio-technical systems’, ‘software
architecture models’, and ‘modeling notations.’ There are many definitions available
across multiple disciplines; only those that are relevant to and have influenced this
research follow.
In software engineering and architecture literature, the terms ‘application’ and
‘system’ are often assumed to be used interchangeably. Practitioners will argue that an
implemented system must not only include the application, but also its target computing
24
platform. The definition is often then expanded to include data, people, and processes,
depending on the reference point of the practitioner.
The IFPUG throughout [9] appears to use the terms ‘application’ and ‘system’
interchangeably.
Pfleeger and Atlee describe a system as “a collection of things: a set of entities, a
set of activities, a description of the relationships among entities and activities and a
definition of the boundary of the system” [23, p. 17].
Rozanski and Woods describe a computer system as “the software elements that
you need to specify and/or design in order to meet a particular set of requirements and the
hardware you need to run those software elements on” [1, p. 11].
Rechtin defines a system as “A set of different elements so connected or related as
to perform a unique function not performable by the elements alone” [24, p. 7]. For the
purposes of this research, the environment is everything but the system under analysis.
The environment can be another system or a system of systems. The user is considered
part of the environment with which an application interacts.
The Department of Defense Architecture Framework (DODAF) describes a
system as “a functionally, physically, and/or behaviorally related group of regularly
interacting or interdependent elements” [25].
Sommerville defines a system as “a purposeful collection of interrelated
components that work together to achieve some objective” [10, p. 21]. Sommerville
introduces technical computer-based systems and socio-technical systems, and describes
the key characteristics of a socio-technical system:
emergent properties that are properties of the system as a whole rather than associated with individual parts of the system. Emergent properties depend on both the system components and the relationships between them…
They are often nondeterministic. This means that when presented with specific input, they may not always produce the same output…
25
Furthermore, use of the system may create new relationships between the system components and hence change its emergent behavior. [10, p. 21–22]
As an addition to these definitions, Conway states “Any organization that designs
a system (defined more broadly here than just information systems) will inevitably
produce a design whose structure is a copy of the organization's communication
structure” [26].
Although there are no globally agreed to definitions of a system of systems,
Vaneman and Jaskot suggest that it is “a set or arrangement of systems that results when
independent and task-oriented systems are integrated into a larger systems construct, that
delivers unique capabilities and functions in support of missions that cannot be achieved
by individual systems alone” [27].
Sommerville’s definitions associated with a socio-technical system are most
relevant to a practitioner’s experience with software, particularly the inclusion of
interaction with a human user and the reality of emergent behavior. However, since using
the qualifier ‘socio-technical’ to describe a system is often not well received, ‘software
system’ is still the term of choice.
The relationship between a system, the architecture of a system, and an
architecture model of a system is confusing. Rozanski and Woods state “Every system
has an architecture, whether or not it is documented and understood” [1, p. 20].
The challenge practitioners often face is interpreting the architecture of an
existing system and environment, or the model of an architecture of a new system or
enhancement to an existing system. Often, the artifacts describing them have been
documented incorrectly, incompletely, or not documented at all. For an existing system,
the architecture may be recovered from implementation artifacts, but that is not a simple
task. Maier and Rechtin define an architecture as “The structure—in terms of
components, connections, and constraints—of a product, process, or element”
[28, p. 415].
26
Rozanski and Woods reiterate the ISO/IEC 42010 definition of architecture,
which is expanded to address the influences of environment: “The architecture of a
system is the set of fundamental concepts or properties of the system in its environment,
embodied in its elements, relationships, and the principles of its design and evolution”
[1, p. 12].
DODAF does not explicitly define the term ‘software system architecture’ or its
environment, but the framework and views can be used to describe the architecture of a
system that includes software and software services.
As suggested by Taylor et al. “A software system’s architecture is the set of
principal design decisions made about the system” [29, p. 58].
When considering the software architecture of a system and environment,
identifying what to abstract away or hide is as much an art as a science. Bass et al.
explain:
an architecture is first and foremost an abstraction of a system that suppresses details of elements that do not affect how they use, are used by, relate to, or interact with other elements. In nearly all modern systems, elements interact with each other by means of interfaces that partition details about an element into public and private parts. Architecture is concerned with the public side of this division; private details-those having to do solely with internal implementations—are not architectural. [30, p. 21]
This definition was very interesting, as it begs the question, what is private versus
what is public? How and where is the boundary drawn for the system under analysis,
when there is some confusion as to the definition of the system? Is it an arbitrary
boundary? In the absence of a definitive architecture, cyber artifacts that describe the
accreditation boundary of a system are useful tools, to support the steps needed to recover
the architecture of the internal components.
Once a software system is imagined, the next focus is to define it through a model
of its architecture. Taylor et al. describe an architectural model as
27
an artifact that captures some or all of the design decisions that comprise a system’s architecture. Architectural modeling is the reification and documentation of those design decisions…
A software systems architecture is captured in an architectural model using a particular modeling notation. An architectural modeling notation is a language or means of capturing design decisions. [29, p. 185]
In the current practice, a new system or capability may be introduced into an
existing environment, resulting in unexpected behaviors requiring corrective action that
has a resourcing impact. Software engineers and architects need to be able to analyze the
new system and existing environment in order to advise program managers about the
impacts to cost, schedule, and operations. Architectural modeling offers a way to assess
architectural design decisions and their impacts prior to, during, and after implementation
and deployment.
A model of an architecture should not be confused with the architecture itself. As
discussed by the Object Management Group:
A model is always a model of something. The thing being modeled can generically be considered a system within some domain of discourse. The model then makes some statements of interest about that system, abstracting all the details of the system that could possibly be described, from a certain point of view and for a certain purpose. [31]
Monterey Phoenix describes the architecture model of a system and the
environment with which it interacts in terms of behaviors: the behaviors of components
of the software system, the behaviors of the interactions between the components, the
behaviors of the environment with which it interacts, and the behavior of its interaction
with the environment [32]–[34].
Techniques used in software system design, such as abstraction and
encapsulation, are directly applicable to the architecture model of a system and its
environment. As discussed in Pfleeger and Atlee and derived from Berard:
However, encapsulation is not the same as information hiding… abstraction is a technique that helps us identify which specific information should be visible, and which information should be hidden. Encapsulation is then the technique for packaging the information in such a way as to

28
hide what should be hidden, and make visible what is intended to be visible [23, p. 290].
Seidewitz offers a perspective on model-driven development, discussing
definitions of models, metamodels, and model interpretation leveraging unified modeling
language (UML) terms to describe models of software, specifically the system under
study (SUS) [35].
Selic highlights the necessity of model execution, stating that “one important
advantage of executable models is that they provide early direct experience with the
system being designed” [36].
These become very useful techniques when establishing the boundary of an
application under analysis, and deciding what information to abstract and how to do so.
The development of an architecture model starts with understanding what the user
wants, i.e., his or her requirements, and then creating a representation of those
requirements in architecture models and extracting views that answer questions from
stakeholders, including the user. Pfleeger and Atlee state that “A requirement is an
expression of desired behavior” [23, p. 143]. A system’s required behaviors can be
modeled in MP to confirm that the requirements communicated by the stakeholders have
been satisfied.
Pfleeger and Atlee also highlight that “the architecture of a system is the interface
between required capabilities in a specification and the implemented system” [23, p.
229]. Stakeholders communicate their concerns through requirements, another word that
elicits strong reactions. ‘Requirements’ is an umbrella term that captures functional, non-
functional, derived, technical, as well as variations of the meaning of each one of these
terms. Once the term ‘requirement’ is sufficiently clear, then the process of iterating
between the users and the technical team can begin, followed by employing
methodologies to reason about the design and implementations options. Pfleeger and
Atlee state that
29
a functional requirement describes required behavior in terms of required activities such as reactions to inputs and state of each entity before and after an activity occurs…
The functional requirements define the boundaries of the solution space for our problem.
A quality requirement or non-functional requirement describes some quality characteristic the software solution must possess, such as fast response time, ease of use, high reliability, or low maintenance cost. [23, p. 148–149]
Once initial functional user requirements are captured, the process of specifying
what the software system will do in terms of tasks and services begins, resulting in an
architectural representation of the system. This iterative process is best served by
modeling the architecture.
A software engineer or developer will find behaviors as represented by
pseudocode, sequence diagrams or use cases necessary to translate the user requirements
into implemented code. Cost analysts will want to understand what each instance of the
architecture at a point in time would cost (from requirements elicitation through software
evolution) and document those resourcing implications in a life cycle cost estimate, or
year of execution spend plan. Testers can leverage architectures to identify what are
optimal instrumentation points and what test cases and strategies are necessary for
development, integration, and operational testing. The program manager must ensure that
both user and acquisition expectations are being met by applying cost and management
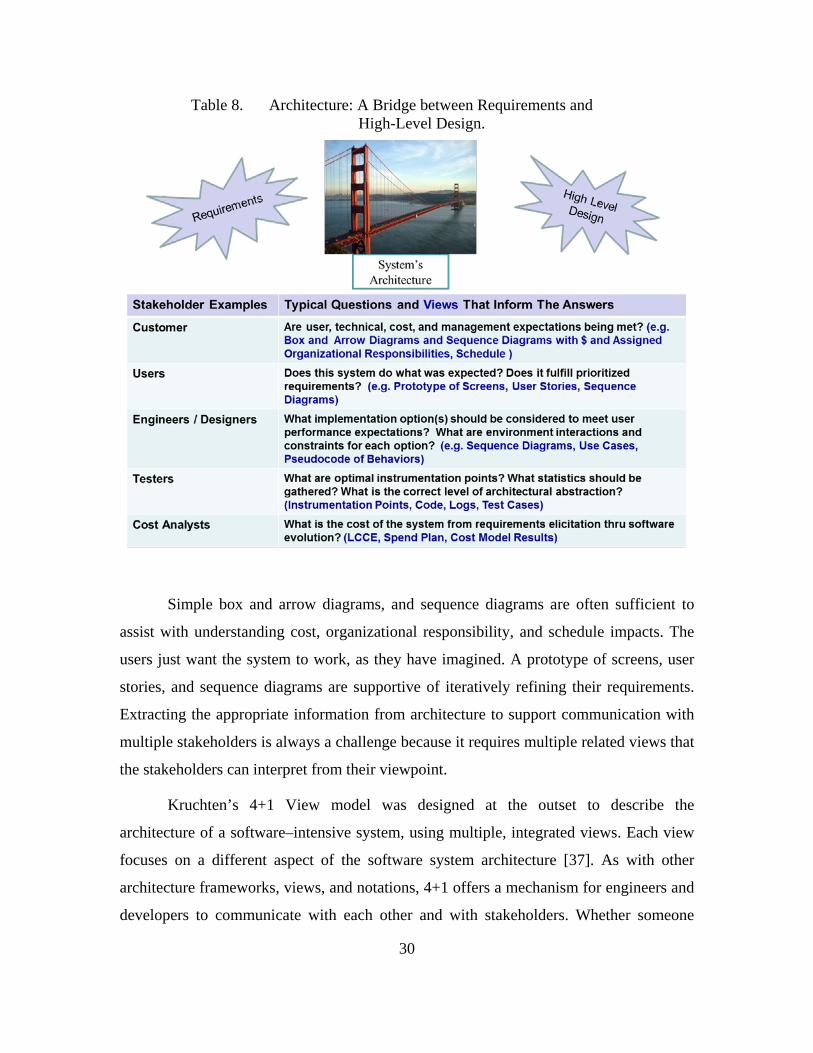
controls. As illustrated in Table 8, each stakeholder has his or her own interests and needs
views to assist in understanding the architecture.
30
Table 8. Architecture: A Bridge between Requirements and High-Level Design.
Simple box and arrow diagrams, and sequence diagrams are often sufficient to
assist with understanding cost, organizational responsibility, and schedule impacts. The
users just want the system to work, as they have imagined. A prototype of screens, user
stories, and sequence diagrams are supportive of iteratively refining their requirements.
Extracting the appropriate information from architecture to support communication with
multiple stakeholders is always a challenge because it requires multiple related views that
the stakeholders can interpret from their viewpoint.
Kruchten’s 4+1 View model was designed at the outset to describe the
architecture of a software–intensive system, using multiple, integrated views. Each view
focuses on a different aspect of the software system architecture [37]. As with other
architecture frameworks, views, and notations, 4+1 offers a mechanism for engineers and
developers to communicate with each other and with stakeholders. Whether someone
31
speaks the language of DODAF, 4+1, or utilizes any other framework, understanding
what are the key elements that comprise a software system and its environment, and
where that information is located are critical to dealing with the complexity of a system
within a system of systems. The greatest contribution of frameworks like DODAF and
4+1 is that they offer the opportunity to develop a ‘common mental model’ of the
architecture or a model of the architecture of a system.
Rozanski and Woods are optimistic that stakeholders will respond to an
architectural description (AD), which they define as “a set of products that documents an
architecture in a way its stakeholders can understand and demonstrates that the
architecture has met their concerns” [1, p. 25].
Each activity associated with a system’s lifecycle may require a different view of
the architecture or architecture model to communicate relevant information to different
stakeholders with different interests. The interrelated views of the system and
environment assist in making a complex, incomprehensible problem into something that
is more understandable to all stakeholders.
D. THE ROLE OF FORMAL METHODS, SEMI-FORMAL METHODS AND LIGHTWEIGHT FORMAL METHODS IN ARCHITECTURE MODELING
Architecture models play a significant role in the analysis of a software system,
and the degree of formality used to model architecture can range from semi-formal
formal, with lightweight formal methods being a practical compromise.
Taylor et al. classify architecture models as informal, semi-formal, and formal.
Informal models are typically captured in box-and-arrow diagrams, and can provide an
effective high-level view that is understood by many different stakeholders. However,
they are inherently ambiguous and often contain only minimal detail. Semi-formal
architecture models, such as UML, try to balance precision with enough detail to
facilitate communication and support both manual and automated analyses. Formal
models are appreciated by technically-oriented stakeholders, and their notations have
32
formally defined syntax and semantics. Most models used by practitioners are semi-
formal [29].
Formal methods introduce mathematical rigor into the design of a software
system. Tinelli explains that formal methods have their foundation in “mathematical
logic, a discipline that studies the precise formalization of knowledge and
reasoning” [38].
Collins describes the role of formal methods in software engineering and
computer science, for design and test:
formal methods are system design techniques that use rigorously specified mathematical models to build software and hardware systems. In contrast to other design systems, formal methods use mathematical proof as a complement to system testing in order to ensure correct behavior. [39]
Jackson discusses that the foundation of software is the abstractions associated
with them, where an abstraction is defined as a “structure, pure and simple—an idea
reduced to its essential form” [40]. The selection of the correct level of abstraction, in
order to address specific questions and concerns, is often easier said than done.
Languages such as Z and tools such as Alloy Analyzer assist in the application of formal
methods to the world of the practitioner.
There continues to be some debate regarding the practicality of applying formal
methods to mainstream software engineering activities. Hall presents a perspective that
“formal methods are available and readily useable by practitioners, but yet the theoretical
view offered by proponents of these techniques is somewhat overreaching” [41]. Sastry
appears to support Hall’s position and suggests that semi-formal techniques must
augment formal methods and tools, particularly when addressing system integration [42].
Wieringa describes semi-formal techniques as diagraming and other techniques
that use some form of structured natural language [43]. The manual counting technique of
FPA lends itself to semi-formal design methods. Collins suggests that because of the
rigor involved
33
formal methods are always going to be more expensive than traditional approaches to engineering. However, given that software cost estimation is more of an art than a science, it is debatable exactly how much more expensive formal verification is…
While an all-encompassing formal description is attractive from a theoretical perspective, it invariably involved developing an incredibly complex and nuanced description language, which returns to the difficulties of natural language. [39]
Hall also indicates that the term ‘formal methods’ covers “the use of mathematics
in software development” [41]. This includes writing and proving a formal specification,
constructing a program based on this specification, and then verifying the program. Hall
states that applying formal methods to develop a formal specification provides a “precise
definition of what the software is intended to do” [41]. This assists in identifying
mistakes prior to implementation in coding.
Wing states that “Formal methods are used to reveal ambiguity, incompleteness,
and inconsistency in a system, and expose design flaws early in the development process
of the system, before finding them in test” [44].
That having been said, utilizing formal methods in and of itself does not guarantee
that the software system will work as intended. Formal methods do assist with removing
the ambiguity of natural language associated with an informal specification, and formal
specifications do need to be translated back into natural language for discussions with
users. That requires a skilled workforce knowledgeable of the application of formal
methods, which is minimally available.
Knowing when and where to use lightweight formal methods is critical to
achieving return on investment of resources expended applying them. Easterbrook et al.,
state that “The lightweight approach to formal design recognizes that formal methods are
not a panacea: there are areas where formal methods are useful, and areas where a formal
specification will accomplish nothing” [45].
Complex, software-intensive system of systems benefit from the discipline and
precise descriptions of formal models of the systems, since natural language can be
ambiguous. Therefore, a practical alternative to formal design is relevant and needed for
34
practitioners. A lightweight approach in which formal methods are applied in a limited
way, offer the benefits of formal specification without many of the limitations associated
with cost and complexity.
As highlighted in Agerholm and Larsen, even with a pragmatic lightweight
approach, the “main obstacle is to teach the engineers how to choose which parts to
model and how to make appropriate abstractions of these parts” [46].
MP leverages lightweight formal methods and high-level pseudo code, and its
supporting information offers examples on how to abstract behaviors. This results in a
precise, flexible and practical framework to support behavioral modeling of architectures
[3], [32]. MP was selected over other architecture modeling languages for this research
based on its ease of use, availability of tools that allowed execution of the architecture
model, and views generated by those tools.
E. MONTEREY PHOENIX (MP)
The ThreeMetrics methodology implements Monterey Phoenix, created and
described by Auguston, as “a framework for software system architecture and business
process (workflow) specification based on behavior models” [33].
The challenge for practitioners is determining how to reduce, rather than
automate, complexity. Architectural modeling is a powerful tool, if supported by the
appropriate architectural modeling framework and language. Monterey Phoenix renders a
view of architectures as high level description of behaviors. This is accomplished at the
system and subsystem level and for the interactions between them [32], [33]–[34].
MP utilizes lightweight formal methods to unambiguously describe the behaviors
of a system and the environment with which it interacts. The models are written in high-
level pseudo code, which gives the model author the ability to be both precise and
practical. This research utilized MP architecture models to capture design decisions about
precedence, inclusion, and ordering, although the MP language and framework have
other capabilities that can be found in [3], [32]–[34], [47]–[51].
35
Building on the works of Jackson and the Open Management Group, Auguston
describes the basic concepts for Monterey Phoenix as follows:
A view of the architecture as a high level description of possible system behaviors, emphasizing the behavior of subsystems (components) and interactions between subsystems. MP introduces the concept of event as an abstraction of activity.
The separation of the interaction description from the components behavior is an essential MP feature. It provides for a high level of abstraction and supports the reuse of architectural models.
Interactions between activities are modeled using event coordination constructs. The environment’s behavior is an integral part of the system architecture model. MP provides a uniform method for modeling behaviors of the software, hardware, business processes, and other parts of the system.
The event grammar models the behavior as a set of events (event trace) with two basic relations, where the PRECEDES relation captures the dependency abstraction, and the IN relation represents the hierarchical relationship. Since the event trace is a set, additional constraints can be specified using set-theoretical operations and predicate logic.
The MP architecture description is amenable to deriving multiple views, and provides a uniform basis for specifying structural and behavioral aspects of a system.
MP supports automated and exhaustive (for a given scope) scenario generation for early system architecture verification. The Small Scope Hypothesis [Jackson 2006] states that most flaws in models could be demonstrated on relatively small counterexamples. [33]
Monterey Phoenix is an expressive language that offers a way to describe the
world in terms of interactions: interactions between people, interactions between
machines, and interactions between people and machines. The information provided in
this section is a basic introduction to the MP event grammar. A more complete
description of the language and examples of models can be found in [33] and [50].
Figure 2 is extracted from the MP wiki hosted by NPS and illustrates the structure
of an MP event grammar rule. Since MP leverages high-level pseudo code, the MP user
has tremendous flexibility in selecting the words to represent behaviors.
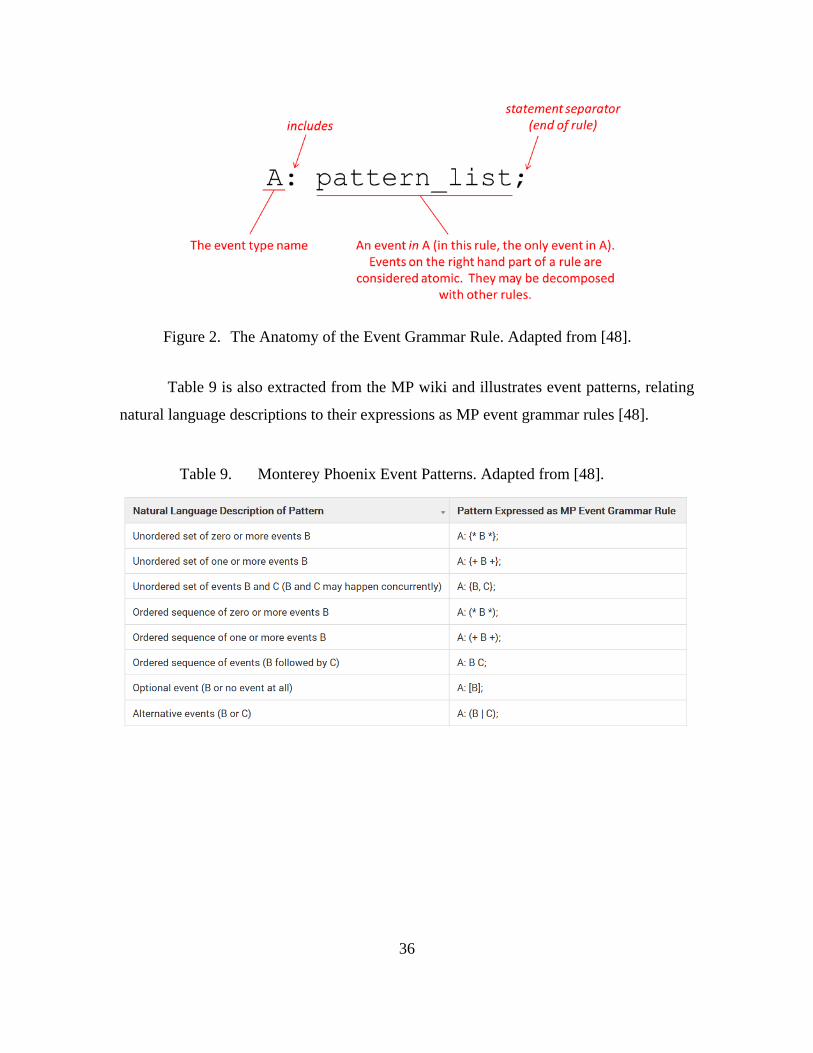
36
Figure 2. The Anatomy of the Event Grammar Rule. Adapted from [48].
Table 9 is also extracted from the MP wiki and illustrates event patterns, relating
natural language descriptions to their expressions as MP event grammar rules [48].
Table 9. Monterey Phoenix Event Patterns. Adapted from [48].
37
The MP analyzer on Firebird utilizes the small scope hypothesis introduced by
Jackson:
Most flaws in models can be illustrated by small instances, since they arise from some shape being handled incorrectly, and whether the shape belongs to a large or small instance makes no difference. So if the analysis considers all small instances, most flaws will be revealed… Key idea is specification of a scope, which bounds the sizes of the signatures, and exhaustive search for examples or counterexamples. [40, p. 15]
MP offers the opportunity to refine higher level system behavioral descriptions
into more detailed descriptions leading up to implementation in code, while maintaining
traceability across the models of the system and environment. This results in more
complete behavior descriptions of all relevant components and connectors. As explained
by Auguston and Whitcomb, “Event traces can be effectively generated from the event
grammar rules and then adjusted and filtered according to the composition operations
[COORDINATE and SHARE ALL] in the schema” [32].
MP does not replace system and software engineering enablers such as UML,
SySML, and DODAF, but complements them and emphasizes the value of using
automated tools for immediate model verification [32]–[34]. As discussed by Object
Management Group, the UML definition of a behavior is “a specification of events that
may occur dynamically over time” [31].
The representation of a behavior as an event in an executable MP model aligns
with the UML definition of a behavior. However, MP is used to not only model the
system under analysis, but also the behavior of elements in the environment, using the
same framework, which sets the conditions to re-use parts or all of the model. As
described by Auguston and Giammarco:
An event may be considered an abstraction of an activity, and may have duration greater than or equal to zero. System behavior is modeled as a set of events with two basic relations: precedence (PRECEDES) and inclusion (IN). PRECEDES and IN are partial ordering relations. Unordered events may occur concurrently. [48]
38
Fortunately, tools such Firebird and Eagle6 are available and allow the model
author to execute the model and inspect the results using architectural views that can be
extracted from the executed MP model. These views help to portray aspects or elements
of the architecture that are relevant to the concerns that the view intends to address, and
to the stakeholder interested in those concerns. Each view is an answer to a question (or a
group of questions), and provides the rationale for the development of tools, patterns,
templates, and conventions needed to create the level of abstraction that reduces
complexity while retaining meaningful content [3], [32]–[34].
One of the earliest steps in the FP counting process is identifying the application
boundary. The ThreeMetrics methodology employing MP assists in unambiguously
identifying the boundaries and interactions of the system, user, and environment.
Function Point transactional function types can be thought of as markers of the
external boundary. Once the boundary and interactions have been described, the FPA
practice can be used to determine the unadjusted FP count.
Use cases, FPA, and behavioral modeling frameworks such as MP can help
stakeholders understand the technical and programmatic characteristics of the system and
environment, by effectively creating views that contain the information they need. The
ThreeMetrics methodology employing MP extracts analysis enablers from the model,
such as use cases, and informs programmatic metrics of effort and size estimates.
This research utilizes a subset of the MP tool set focused on ROOTs,
COORDINATE, and SHARE ALL. Once MP has been used to unambiguously describe
the behaviors of the system under analysis and its interactions with the environment, the
resulting MP descriptions of boundaries and interactions (represented by COORDINATE
and SHARE ALL in the MP schema ) can be related to estimation and costing practices.
This will be discussed as part of the ThreeMetrics methodology in Chapter III of this
dissertation.
39
F. ESTIMATES FOR INTEGRATION TESTING
Software testing is a challenging and resource intensive activity. Nowhere is that
more visible than during integration testing, when organizations as well as systems have
to interact. Sommerville states “software testing involves running an implementation of
the software with test data. You examine the outputs of the software and its operational
behavior to check that it is performing as required. Testing is a dynamic technique of
verification and validation” [10, p. 517].
Verification and validation are not synonymous terms, but they are symbiotic and
can effectively communicate the status and relevance of a system through its architecture
model. Boehm very simply but powerfully synopsized the difference “Am I building the
product right? Validation: “Am I building the right product?” [52].
Once individual component testing is complete, the next step is to integrate the
components into a system, and then assess whether or not the system behaves as
expected. The value of integration testing is its focus on information flowing across
interfaces to modules. The challenge is writing integration test cases that can confirm that
the observed behavior is the expected behavior. Pfleeger and Atlee note “the integration
is planned and coordinated so that when a failure occurs, we have some idea of what
caused it. In addition, the order in which components are tested affects our choices of test
cases and tools” [23, p. 390].
Many practitioners experience the challenge of testing within the schedule and
resource constraints of their organization. Testing is often not allocated the appropriate
amount of time for thorough investigation. Brooks provides “the following rule of thumb
for scheduling a software task: 1/3 planning, 1/6 coding, 1/4 component test and early
system test, 1/4 system test, all components in hand” [53, p. 20].
MP models generate all event traces within the given limit, and the resulting event
traces can be inspected to help developers identify undesired behaviors, and as blueprints
to create test cases. TutorialsPoint synopsizes the definition of a software test case: “A
test case is a document, which has a set of test data, preconditions, expected results and
40
post conditions, developed for a particular test scenario in order to verify compliance
against a specific requirement” [54].
Additionally, a test case includes test steps, test data that supports what the test
case needs to achieve, expected results, and information about the environment. Once the
test case is executed, time is needed to analyze the results. An integration test case
addresses the interface and data flow between modules or systems, focusing on what
happens at the boundary.
The creation of integration test cases takes effort. The event traces generated from
an MP model provide solid detailed blueprints, which can be viewed as guidelines for the
creation of the integration test cases, and inform technical and programmatic decision
making.
The MP Analyzer on Firebird is an implementation of the MP event trace
generator, which utilizes the small scope hypothesis. The event traces are contained by
simulating a limited number of iterations, usually three or less [32].
Auguston and Whitcomb leveraging Jackson discuss MP as an executable
architecture model and state:
It is possible to obtain all valid event traces within a certain limit. Usually such a limit (scope) may be set by the maximum total number of events within the trace, or by the upper limit on the number of iterations in grammar rules (recursion in the grammar rules can be limited in similar ways). For many purposes a modest limit of a maximum 3 iterations will be sufficient. This process of generating and inspecting event traces for the schema is similar to the traditional software testing process. [32]
A generic description of all behaviors (the MP schema) is more difficult to
evaluate than an example of behavior (a particular event trace). Tools such as Firebird
assist in these evaluations by generating an exhaustive set event traces, usually for a
scope of one, that can then be inspected to and used to inform integration test cases.
In the COCOMO II output, integration and test costs are part of the phase effort
for construction. In this phase, breakdown of the total construction is 76% of the software
development effort. Using the waterfall lifecycle definitions for COCOMO II the
41
breakdown is as follows: Product Design 17%; Programming 58%; Integration and Test
25% [55]. Once the UFP count is input into COCOMO II, 25% of the resulting
Construction phase output for schedule is used in the for this calculation. The work week
is assumed to be five days per week and eight hours per day for each staff person.
Assuming that six test cases per day can be executed, the number of test cases can be
executed in the allocated time for test and integration, is calculated. This does provide
information for next steps to inform decision making, both technically and
programmatically. The first step is to revisit the model and ensure that the behaviors of
the application are accurately captured. If the model is correct, then the next step is to
determine if there is any flexibility in the schedule and resources to support additional
testing. If the number of test cases is unrealistic, it becomes clear that only a subset of
event traces can be selected for testing.

42
THIS PAGE INTENTIONALLY LEFT BLANK
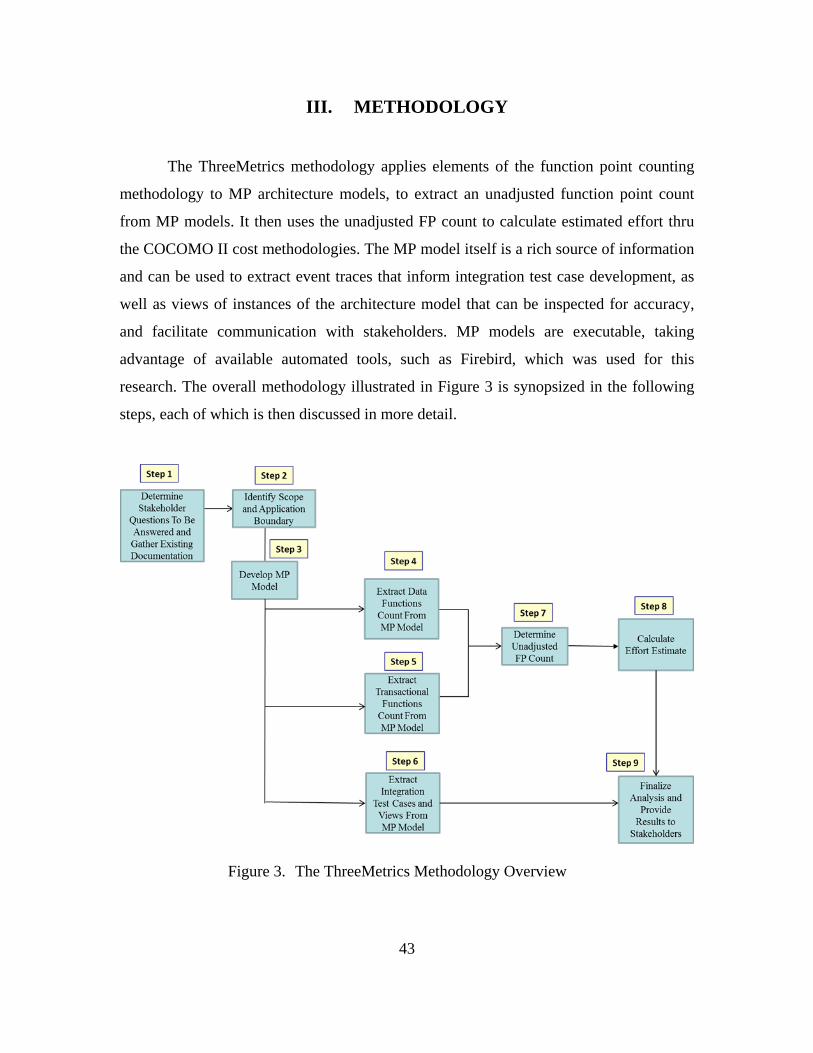
43
III. METHODOLOGY
The ThreeMetrics methodology applies elements of the function point counting
methodology to MP architecture models, to extract an unadjusted function point count
from MP models. It then uses the unadjusted FP count to calculate estimated effort thru
the COCOMO II cost methodologies. The MP model itself is a rich source of information
and can be used to extract event traces that inform integration test case development, as
well as views of instances of the architecture model that can be inspected for accuracy,
and facilitate communication with stakeholders. MP models are executable, taking
advantage of available automated tools, such as Firebird, which was used for this
research. The overall methodology illustrated in Figure 3 is synopsized in the following
steps, each of which is then discussed in more detail.
Figure 3. The ThreeMetrics Methodology Overview
44
Step 1: Determine stakeholder questions to be answered and gather existing
documentation
Step 2: Identify scope and application boundary
Step 3: Develop MP model
Step 4: Extract Data Functions count from MP model
Step 5: Extract Transactional Functions count from MP model
Step 6: Extract integration test cases and views from MP model
Step 7: Determine the Unadjusted Function Point (UFP) count
Step 8: Calculate effort estimate
Step 9: Finalize analysis and provide results to stakeholders
(1) Step 1: Determine stakeholder questions to be answered and gather existing documentation
The first step of this methodology is to understand why the model is being
developed and what existing documentation is available to assist in understanding the
software system and the environment (everything but the system) with which it interacts.
Questions or groups of questions related to a software system exist for a spectrum of
stakeholders, as discussed in Chapter II Section C of this document. In order to address
these questions, the first step is to gather all available source information supporting what
the user expects the system to do.
Practitioners of the FP counting methodology recommend using any
documentation or architectural artifacts that may be available when performing a
functional size measurement, such as requirements documents, entity relationship
diagrams, interface agreements with descriptions of interfaces to/from other applications,
or any other supporting documentation that provides insights into what the application is
intended to do [9], [14]–[16].
45
This approach is consistent with software and system engineering analyses. An
additional artifact that assists in defining the software system under assessment is the
information assurance documentation that defines the accreditation boundary of the
system, from which more detailed information of software components can be recovered.
One way to capture the expectations of the users is by examining and refining
functional requirements. Leveraging techniques from FP counting, functional
requirements are assessed in order to shape what the application is intended to do, from
the perspective of the user. The user of the application can be a human or another
machine. This translation of often ambiguous natural language requirements and
supporting artifacts into more precise FP counting representations is the most challenging
part of Step 1. Recall, the FP terms transactional functions, data functions, and functional
complexity determined by the number of DETs, FTRs, and RETs from Chapter II Section
B of this document. Using a combination of information from multiple FP counting
manuals, and leveraging the support documentation, the next sequence in Step 1 is to
begin to decompose ambiguous natural language of the functional requirements into
precise activities that can be related to FP transactional, data functions, and assist in
confirming the boundary of the application. This is the most challenging part of the
methodology.
(2) Step 2: Identify scope and application boundary
The information gathered in Step 1 assists with understanding what the
application is intended to do at a high level, from the perspective of the user. Step 2
utilizes this information to determine the scope of the count from the FP counting
methodology perspective, i.e. is it a Development Project FP count, an Enhancement
Project FP count, or an Application FP count. Most importantly, Step 2 utilizes this
information to identify the boundary of the application to be counted, a critical step in
any software or system engineering analysis when trying to distinguish the system under
analysis and the environment with which it interacts.
As discussed Chapter II Section B, understanding the type of project and FP count
from an FPA perspective assists in understanding which application is maintaining the
46
data and confirming the boundary of the software system or component of the system to
be counted.
The supporting documentation of different software systems has various artifacts
to describe the systems, but these artifacts are often not consistent and may be
incomplete. However, at a minimum, a simple box and arrow type of architectural
representation can usually be recovered. Since the natural language of the functional
requirements may still be ambiguous, a quick inspection of the box and arrow
representation can be performed to confirm that the boundary of the application to be
counted is correct and clearly visible, that all currently known data functions are present,
and all currently known transactional functions are present. It also supports the
decomposition of the application to be counted into the ILFs and an Internal Abstracted
Application (IAA), which represents everything except the ILFs. The use of an IAA was
to represent behaviors between the ILFs, EIFs and IAA in order to account for the UFP
count for data functions, and will be discussed in Step 3.
Figure 4 illustrates the ThreeMetrics box and arrow simplified view. The red
dotted line represents the boundary. While this is high level architecture view does not
adequately represent the software system behaviors needed to extract the UFP count, it is
a practitioner’s tool to set the conditions to develop an MP model that does represent the
behaviors of the data functions, the behavior of the internal abstracted application, and
the behavior of the user in more detail. This view resonates with non-technical
stakeholders, who provide the go/no-go to proceed with additional analyses.
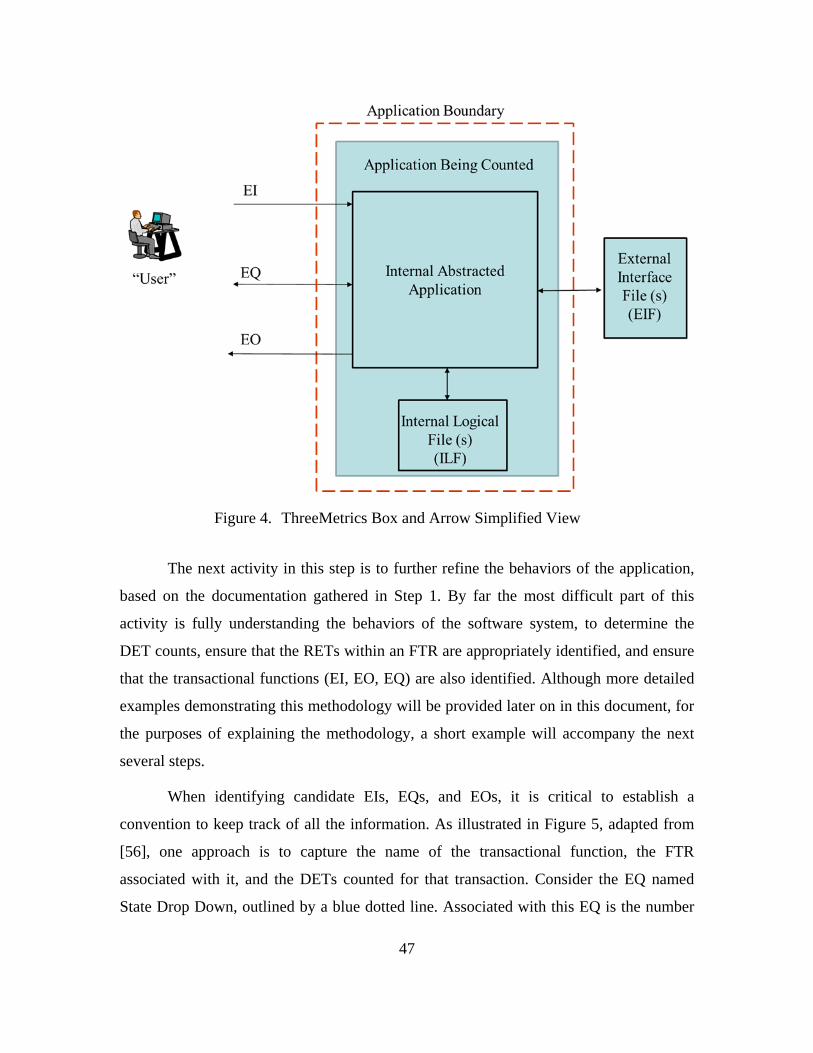
47
Figure 4. ThreeMetrics Box and Arrow Simplified View
The next activity in this step is to further refine the behaviors of the application,
based on the documentation gathered in Step 1. By far the most difficult part of this
activity is fully understanding the behaviors of the software system, to determine the
DET counts, ensure that the RETs within an FTR are appropriately identified, and ensure
that the transactional functions (EI, EO, EQ) are also identified. Although more detailed
examples demonstrating this methodology will be provided later on in this document, for
the purposes of explaining the methodology, a short example will accompany the next
several steps.
When identifying candidate EIs, EQs, and EOs, it is critical to establish a
convention to keep track of all the information. As illustrated in Figure 5, adapted from
[56], one approach is to capture the name of the transactional function, the FTR
associated with it, and the DETs counted for that transaction. Consider the EQ named
State Drop Down, outlined by a blue dotted line. Associated with this EQ is the number
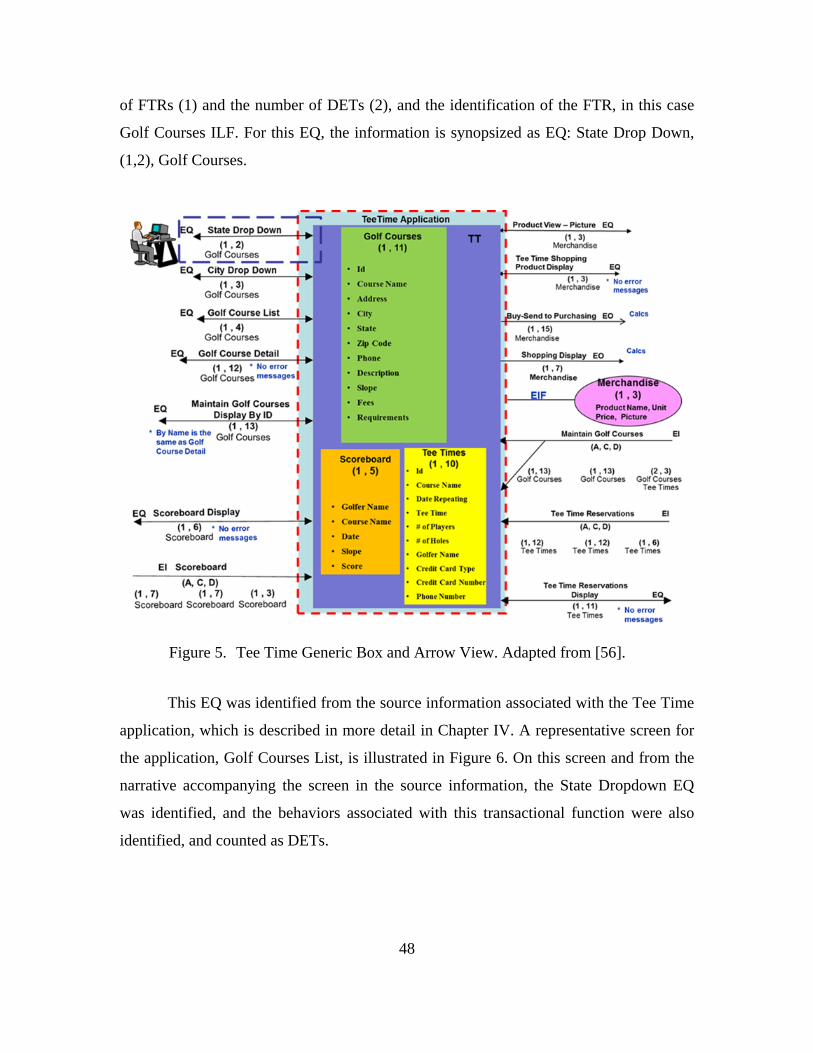
48
of FTRs (1) and the number of DETs (2), and the identification of the FTR, in this case
Golf Courses ILF. For this EQ, the information is synopsized as EQ: State Drop Down,
(1,2), Golf Courses.
Figure 5. Tee Time Generic Box and Arrow View. Adapted from [56].
This EQ was identified from the source information associated with the Tee Time
application, which is described in more detail in Chapter IV. A representative screen for
the application, Golf Courses List, is illustrated in Figure 6. On this screen and from the
narrative accompanying the screen in the source information, the State Dropdown EQ
was identified, and the behaviors associated with this transactional function were also
identified, and counted as DETs.
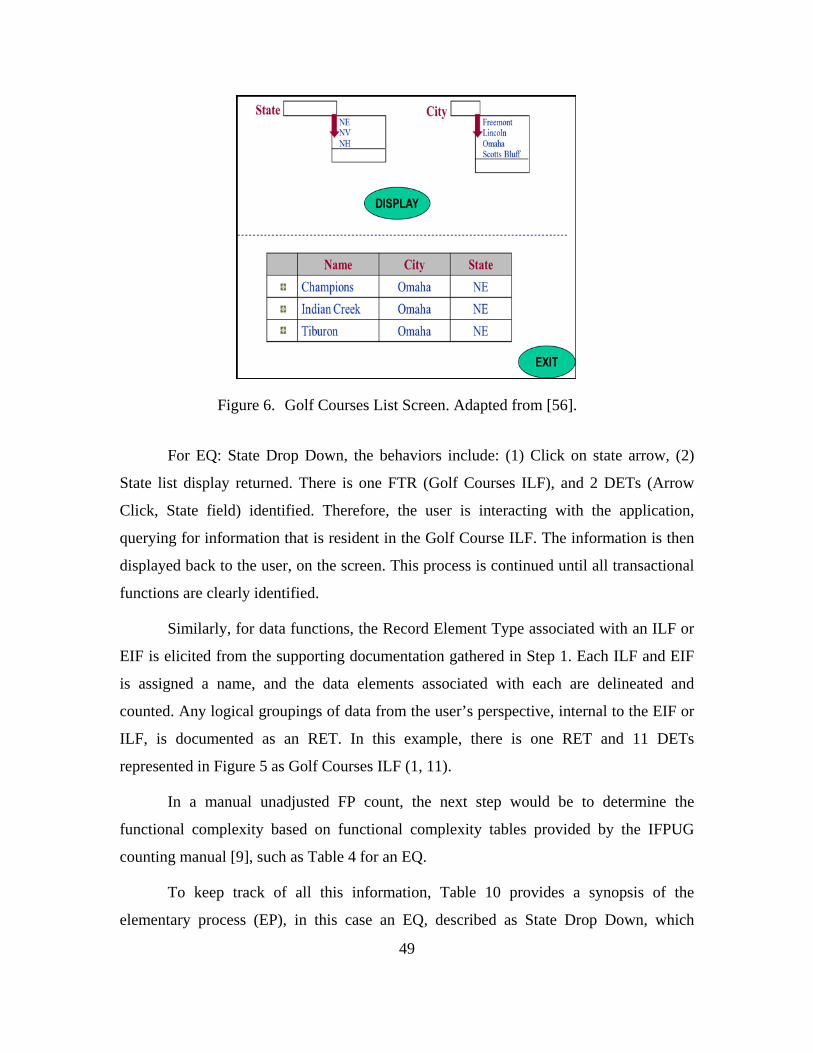
49
Figure 6. Golf Courses List Screen. Adapted from [56].
For EQ: State Drop Down, the behaviors include: (1) Click on state arrow, (2)
State list display returned. There is one FTR (Golf Courses ILF), and 2 DETs (Arrow
Click, State field) identified. Therefore, the user is interacting with the application,
querying for information that is resident in the Golf Course ILF. The information is then
displayed back to the user, on the screen. This process is continued until all transactional
functions are clearly identified.
Similarly, for data functions, the Record Element Type associated with an ILF or
EIF is elicited from the supporting documentation gathered in Step 1. Each ILF and EIF
is assigned a name, and the data elements associated with each are delineated and
counted. Any logical groupings of data from the user’s perspective, internal to the EIF or
ILF, is documented as an RET. In this example, there is one RET and 11 DETs
represented in Figure 5 as Golf Courses ILF (1, 11).
In a manual unadjusted FP count, the next step would be to determine the
functional complexity based on functional complexity tables provided by the IFPUG
counting manual [9], such as Table 4 for an EQ.
To keep track of all this information, Table 10 provides a synopsis of the
elementary process (EP), in this case an EQ, described as State Drop Down, which
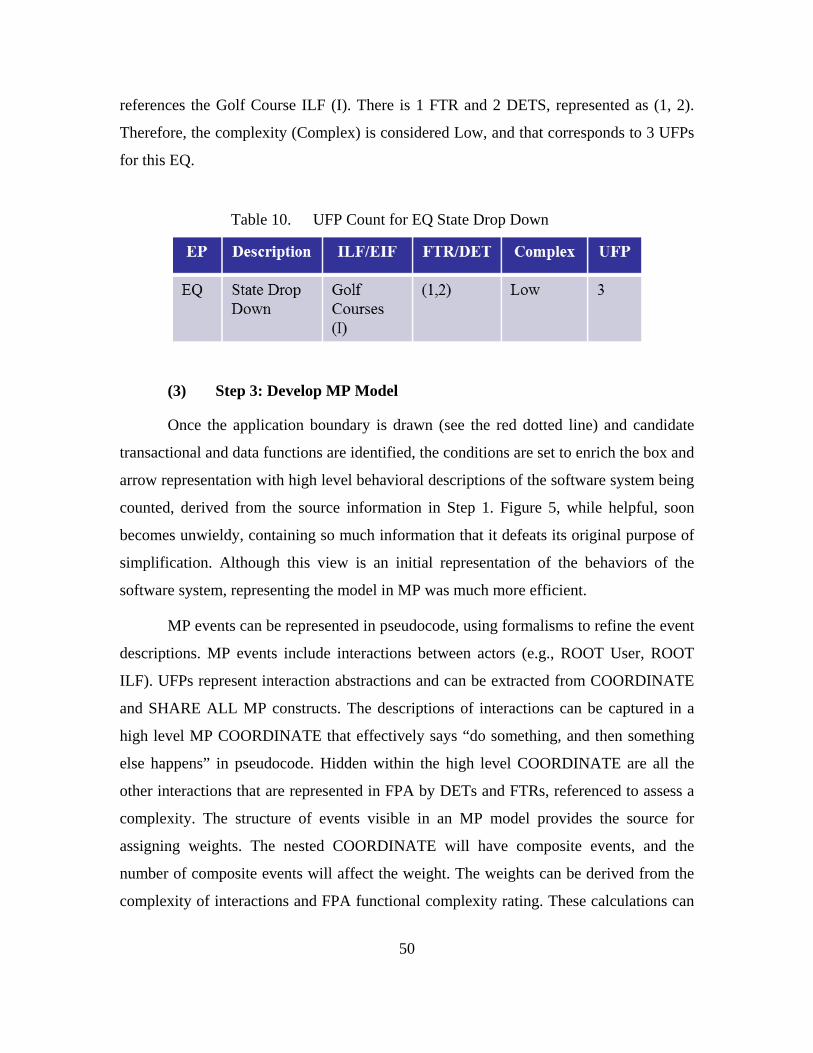
50
references the Golf Course ILF (I). There is 1 FTR and 2 DETS, represented as (1, 2).
Therefore, the complexity (Complex) is considered Low, and that corresponds to 3 UFPs
for this EQ.
Table 10. UFP Count for EQ State Drop Down
(3) Step 3: Develop MP Model
Once the application boundary is drawn (see the red dotted line) and candidate
transactional and data functions are identified, the conditions are set to enrich the box and
arrow representation with high level behavioral descriptions of the software system being
counted, derived from the source information in Step 1. Figure 5, while helpful, soon
becomes unwieldy, containing so much information that it defeats its original purpose of
simplification. Although this view is an initial representation of the behaviors of the
software system, representing the model in MP was much more efficient.
MP events can be represented in pseudocode, using formalisms to refine the event
descriptions. MP events include interactions between actors (e.g., ROOT User, ROOT
ILF). UFPs represent interaction abstractions and can be extracted from COORDINATE
and SHARE ALL MP constructs. The descriptions of interactions can be captured in a
high level MP COORDINATE that effectively says “do something, and then something
else happens” in pseudocode. Hidden within the high level COORDINATE are all the
other interactions that are represented in FPA by DETs and FTRs, referenced to assess a
complexity. The structure of events visible in an MP model provides the source for
assigning weights. The nested COORDINATE will have composite events, and the
number of composite events will affect the weight. The weights can be derived from the
complexity of interactions and FPA functional complexity rating. These calculations can
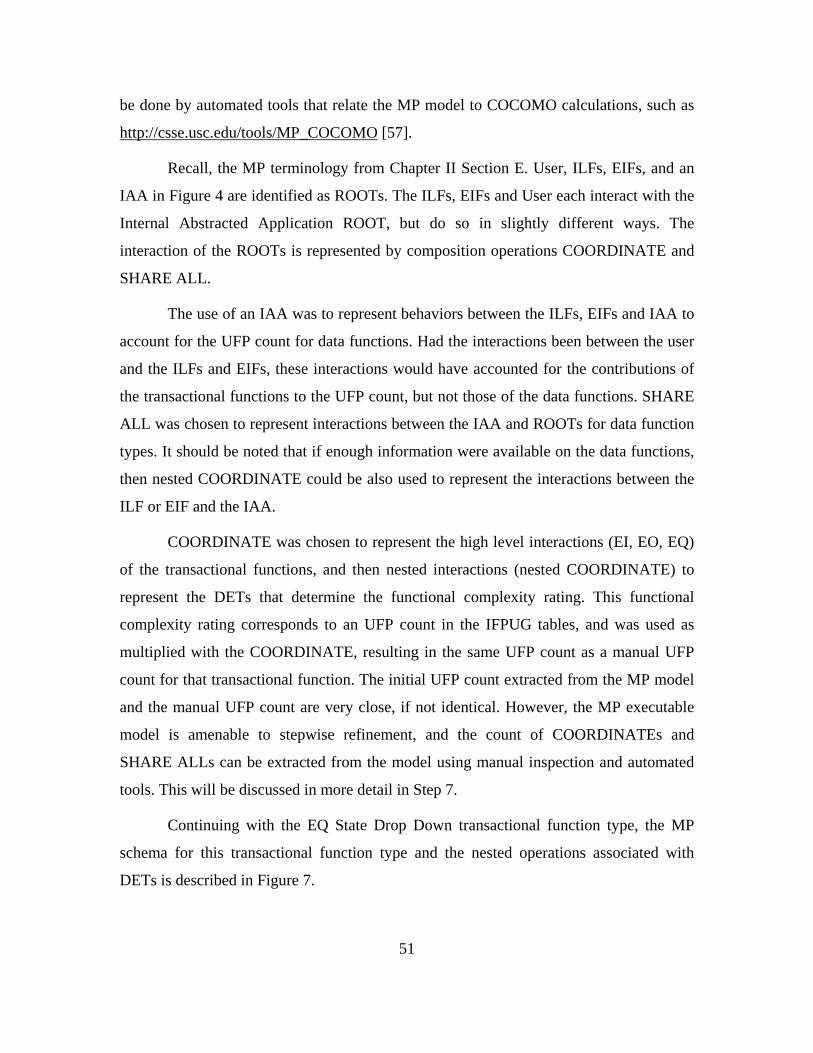
51
be done by automated tools that relate the MP model to COCOMO calculations, such as
http://csse.usc.edu/tools/MP_COCOMO [57].
Recall, the MP terminology from Chapter II Section E. User, ILFs, EIFs, and an
IAA in Figure 4 are identified as ROOTs. The ILFs, EIFs and User each interact with the
Internal Abstracted Application ROOT, but do so in slightly different ways. The
interaction of the ROOTs is represented by composition operations COORDINATE and
SHARE ALL.
The use of an IAA was to represent behaviors between the ILFs, EIFs and IAA to
account for the UFP count for data functions. Had the interactions been between the user
and the ILFs and EIFs, these interactions would have accounted for the contributions of
the transactional functions to the UFP count, but not those of the data functions. SHARE
ALL was chosen to represent interactions between the IAA and ROOTs for data function
types. It should be noted that if enough information were available on the data functions,
then nested COORDINATE could be also used to represent the interactions between the
ILF or EIF and the IAA.
COORDINATE was chosen to represent the high level interactions (EI, EO, EQ)
of the transactional functions, and then nested interactions (nested COORDINATE) to
represent the DETs that determine the functional complexity rating. This functional
complexity rating corresponds to an UFP count in the IFPUG tables, and was used as
multiplied with the COORDINATE, resulting in the same UFP count as a manual UFP
count for that transactional function. The initial UFP count extracted from the MP model
and the manual UFP count are very close, if not identical. However, the MP executable
model is amenable to stepwise refinement, and the count of COORDINATEs and
SHARE ALLs can be extracted from the model using manual inspection and automated
tools. This will be discussed in more detail in Step 7.
Continuing with the EQ State Drop Down transactional function type, the MP
schema for this transactional function type and the nested operations associated with
DETs is described in Figure 7.
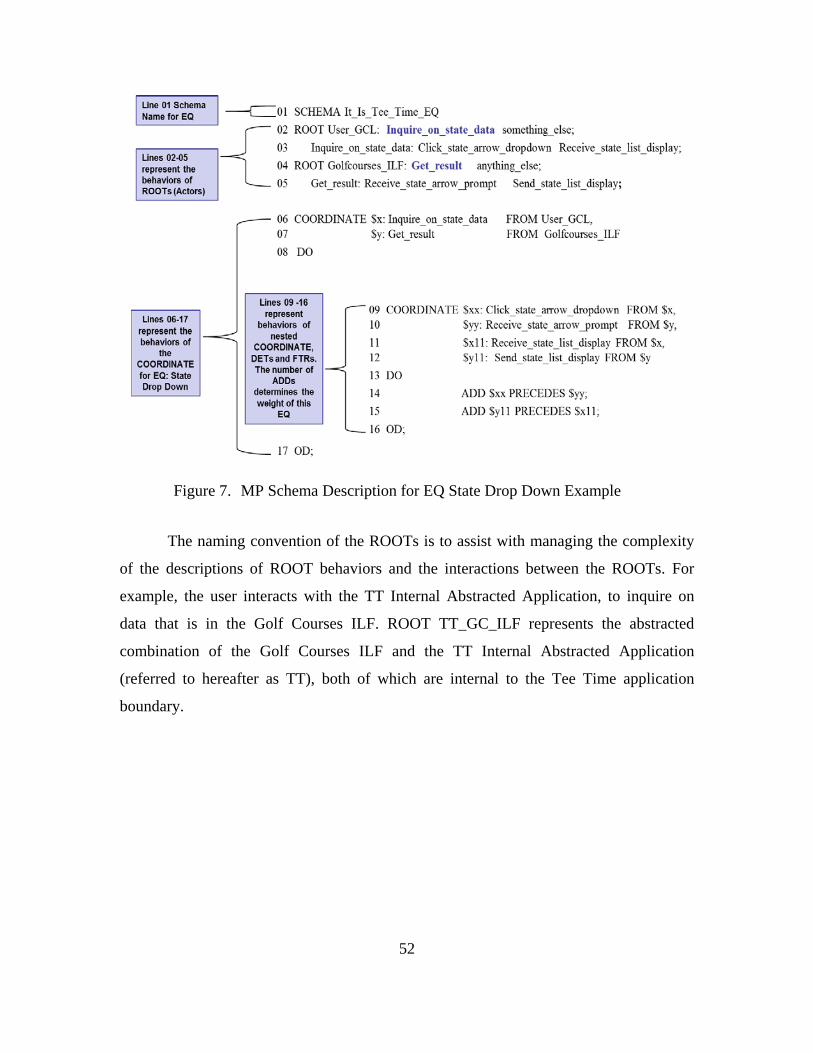
52
Figure 7. MP Schema Description for EQ State Drop Down Example
The naming convention of the ROOTs is to assist with managing the complexity
of the descriptions of ROOT behaviors and the interactions between the ROOTs. For
example, the user interacts with the TT Internal Abstracted Application, to inquire on
data that is in the Golf Courses ILF. ROOT TT_GC_ILF represents the abstracted
combination of the Golf Courses ILF and the TT Internal Abstracted Application
(referred to hereafter as TT), both of which are internal to the Tee Time application
boundary.
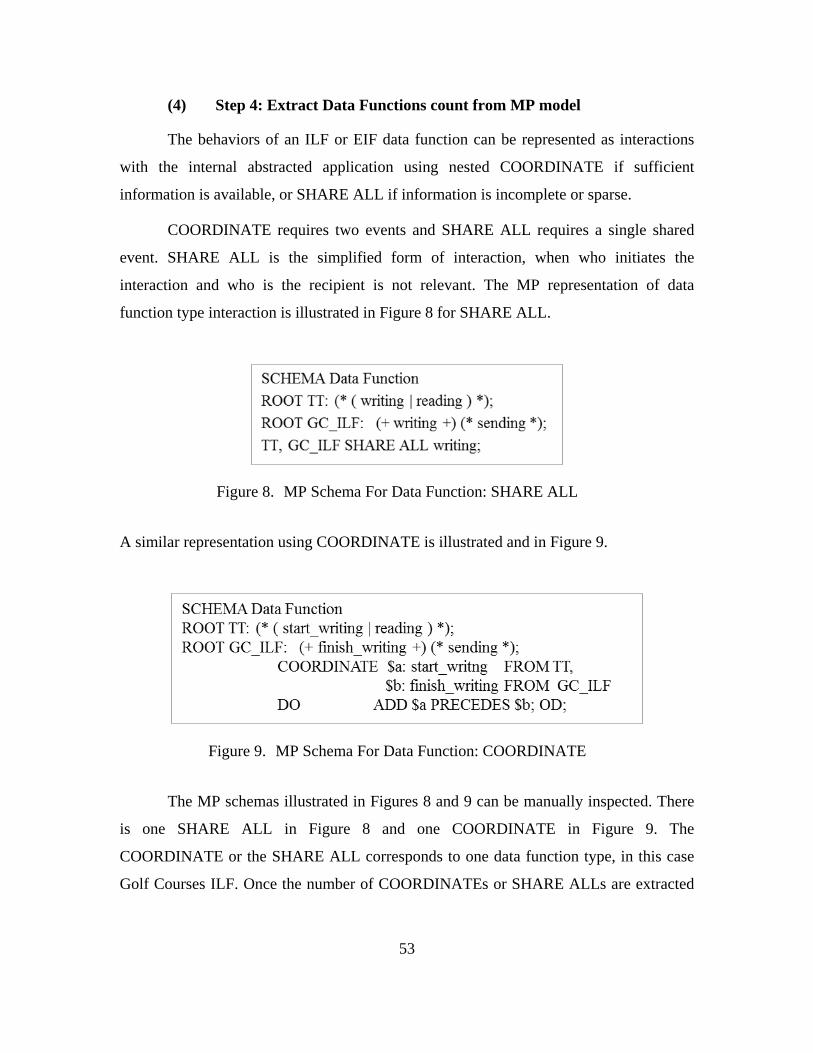
53
(4) Step 4: Extract Data Functions count from MP model
The behaviors of an ILF or EIF data function can be represented as interactions
with the internal abstracted application using nested COORDINATE if sufficient
information is available, or SHARE ALL if information is incomplete or sparse.
COORDINATE requires two events and SHARE ALL requires a single shared
event. SHARE ALL is the simplified form of interaction, when who initiates the
interaction and who is the recipient is not relevant. The MP representation of data
function type interaction is illustrated in Figure 8 for SHARE ALL.
Figure 8. MP Schema For Data Function: SHARE ALL
A similar representation using COORDINATE is illustrated and in Figure 9.
Figure 9. MP Schema For Data Function: COORDINATE
The MP schemas illustrated in Figures 8 and 9 can be manually inspected. There
is one SHARE ALL in Figure 8 and one COORDINATE in Figure 9. The
COORDINATE or the SHARE ALL corresponds to one data function type, in this case
Golf Courses ILF. Once the number of COORDINATEs or SHARE ALLs are extracted
54
from the schema, the IFPUG tables are used to determine the functional complexity
rating and corresponding UFP size.
(5) Step 5: Extract Transactional Function Count from MP model
Each EI, EQ, or EO transactional function is represented in the MP model by a
COORDINATE composition operation. The number of interactions nested within the
COORDINATE are directly related to the functional complexity and size values in the
IFPUG tables.
For example, if an EQ = 1 COORDINATE, then the next step is to inspect the
number of interactions within that COORDINATE. If the number of interactions between
one IAA (ILF/EIF) ROOT combination and the User is 15 or less, this corresponds to a
functional complexity of Low.
Multiplying the EQ by the functional size value (in this case 3 for Low) will equal
the number of UFPs for that EQ. This requires a specific understanding between the
parent COORDINATE and the nested interactions representing the DETs. Otherwise, a
generic approach is to arbitrarily assign a functional complexity value of average to the
transactional functions, until a more refined understanding of the behaviors can be made.
(6) Step 6: Extract Integration Test Cases and Views from MP Model
MP provides a rich source of information that informs effort. The UFP count
extracted from an MP model will be discussed in Step 7.
All executable architecture models, including MP, must be inspected, tested, and
debugged before users can extract information from them. Once the model is considered
correct, then there is a greater degree of confidence that all scenarios and use cases
generated by the model are also correct. Each scenario or use case can then inform a test
case, to support implementation.
MP can be used to automatically produce event traces, which represent examples
of behaviors (e.g., scenarios, use cases if the environment is included). Recall that an
event trace represents an example of a particular execution of the system extracted from
the architecture that is specified by an MP schema. In the case of executable MP models,
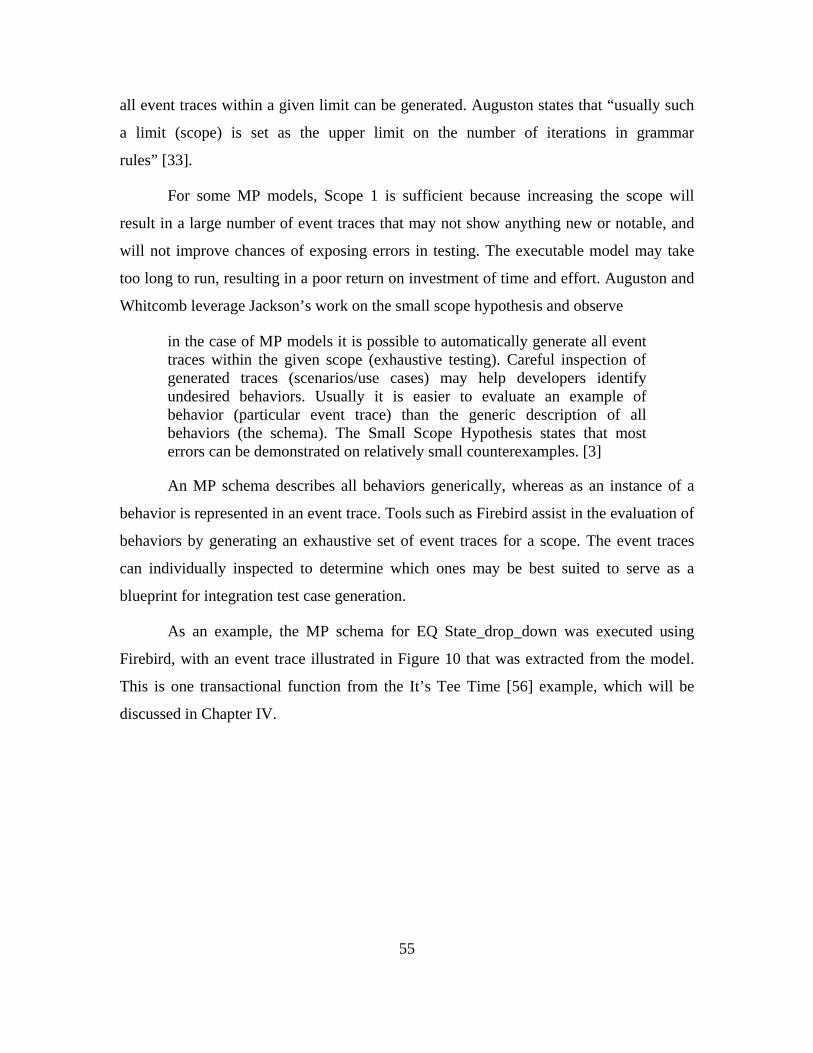
55
all event traces within a given limit can be generated. Auguston states that “usually such
a limit (scope) is set as the upper limit on the number of iterations in grammar
rules” [33].
For some MP models, Scope 1 is sufficient because increasing the scope will
result in a large number of event traces that may not show anything new or notable, and
will not improve chances of exposing errors in testing. The executable model may take
too long to run, resulting in a poor return on investment of time and effort. Auguston and
Whitcomb leverage Jackson’s work on the small scope hypothesis and observe
in the case of MP models it is possible to automatically generate all event traces within the given scope (exhaustive testing). Careful inspection of generated traces (scenarios/use cases) may help developers identify undesired behaviors. Usually it is easier to evaluate an example of behavior (particular event trace) than the generic description of all behaviors (the schema). The Small Scope Hypothesis states that most errors can be demonstrated on relatively small counterexamples. [3]
An MP schema describes all behaviors generically, whereas as an instance of a
behavior is represented in an event trace. Tools such as Firebird assist in the evaluation of
behaviors by generating an exhaustive set of event traces for a scope. The event traces
can individually inspected to determine which ones may be best suited to serve as a
blueprint for integration test case generation.
As an example, the MP schema for EQ State_drop_down was executed using
Firebird, with an event trace illustrated in Figure 10 that was extracted from the model.
This is one transactional function from the It’s Tee Time [56] example, which will be
discussed in Chapter IV.
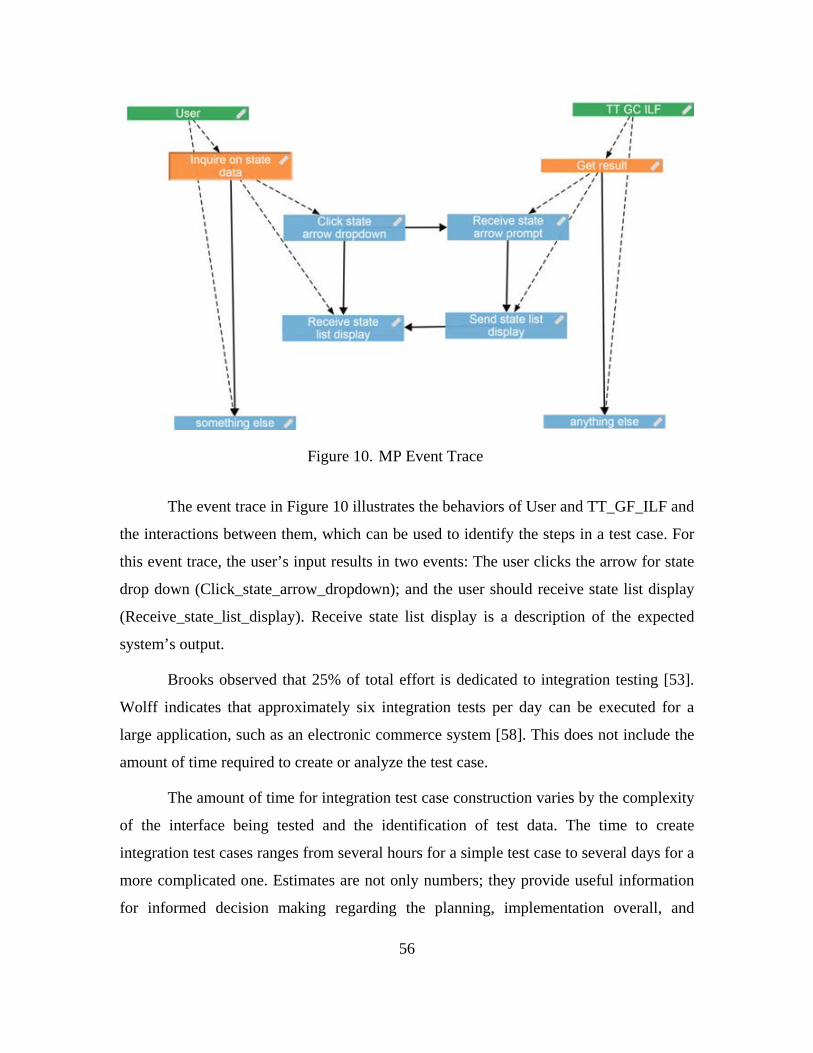
56
Figure 10. MP Event Trace
The event trace in Figure 10 illustrates the behaviors of User and TT_GF_ILF and
the interactions between them, which can be used to identify the steps in a test case. For
this event trace, the user’s input results in two events: The user clicks the arrow for state
drop down (Click_state_arrow_dropdown); and the user should receive state list display
(Receive_state_list_display). Receive state list display is a description of the expected
system’s output.
Brooks observed that 25% of total effort is dedicated to integration testing [53].
Wolff indicates that approximately six integration tests per day can be executed for a
large application, such as an electronic commerce system [58]. This does not include the
amount of time required to create or analyze the test case.
The amount of time for integration test case construction varies by the complexity
of the interface being tested and the identification of test data. The time to create
integration test cases ranges from several hours for a simple test case to several days for a
more complicated one. Estimates are not only numbers; they provide useful information
for informed decision making regarding the planning, implementation overall, and
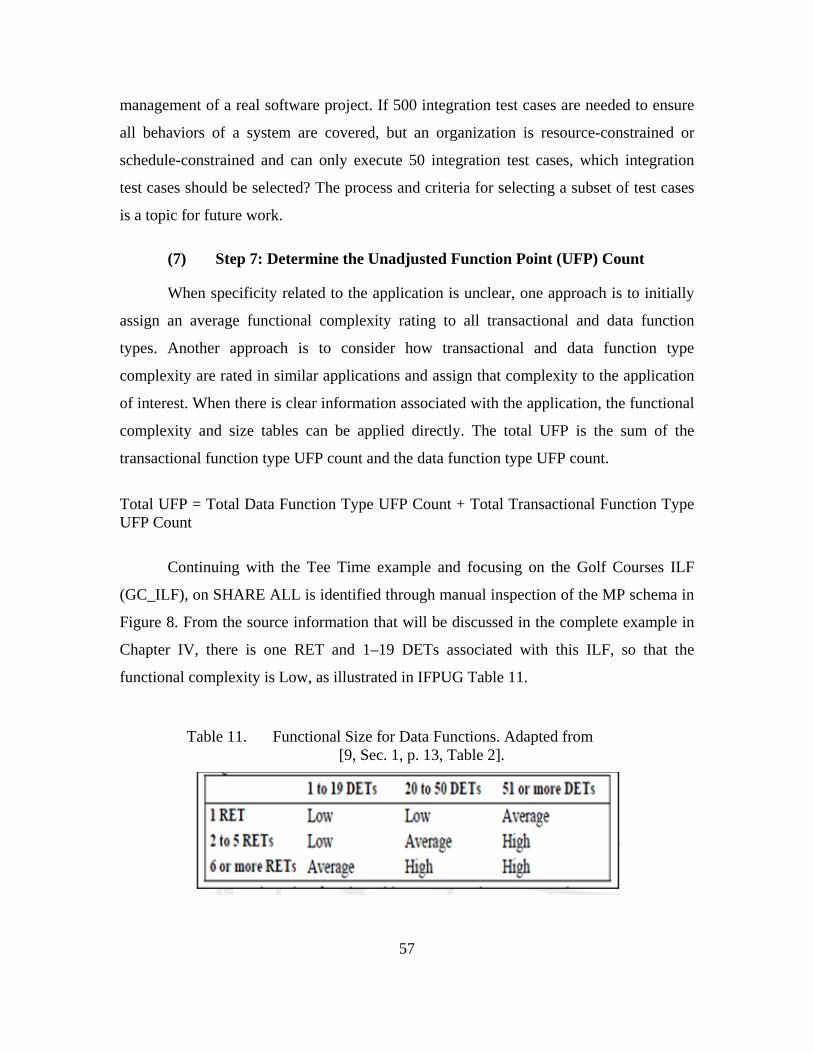
57
management of a real software project. If 500 integration test cases are needed to ensure
all behaviors of a system are covered, but an organization is resource-constrained or
schedule-constrained and can only execute 50 integration test cases, which integration
test cases should be selected? The process and criteria for selecting a subset of test cases
is a topic for future work.
(7) Step 7: Determine the Unadjusted Function Point (UFP) Count
When specificity related to the application is unclear, one approach is to initially
assign an average functional complexity rating to all transactional and data function
types. Another approach is to consider how transactional and data function type
complexity are rated in similar applications and assign that complexity to the application
of interest. When there is clear information associated with the application, the functional
complexity and size tables can be applied directly. The total UFP is the sum of the
transactional function type UFP count and the data function type UFP count.
Total UFP = Total Data Function Type UFP Count + Total Transactional Function Type UFP Count
Continuing with the Tee Time example and focusing on the Golf Courses ILF
(GC_ILF), on SHARE ALL is identified through manual inspection of the MP schema in
Figure 8. From the source information that will be discussed in the complete example in
Chapter IV, there is one RET and 1–19 DETs associated with this ILF, so that the
functional complexity is Low, as illustrated in IFPUG Table 11.
Table 11. Functional Size for Data Functions. Adapted from [9, Sec. 1, p. 13, Table 2].
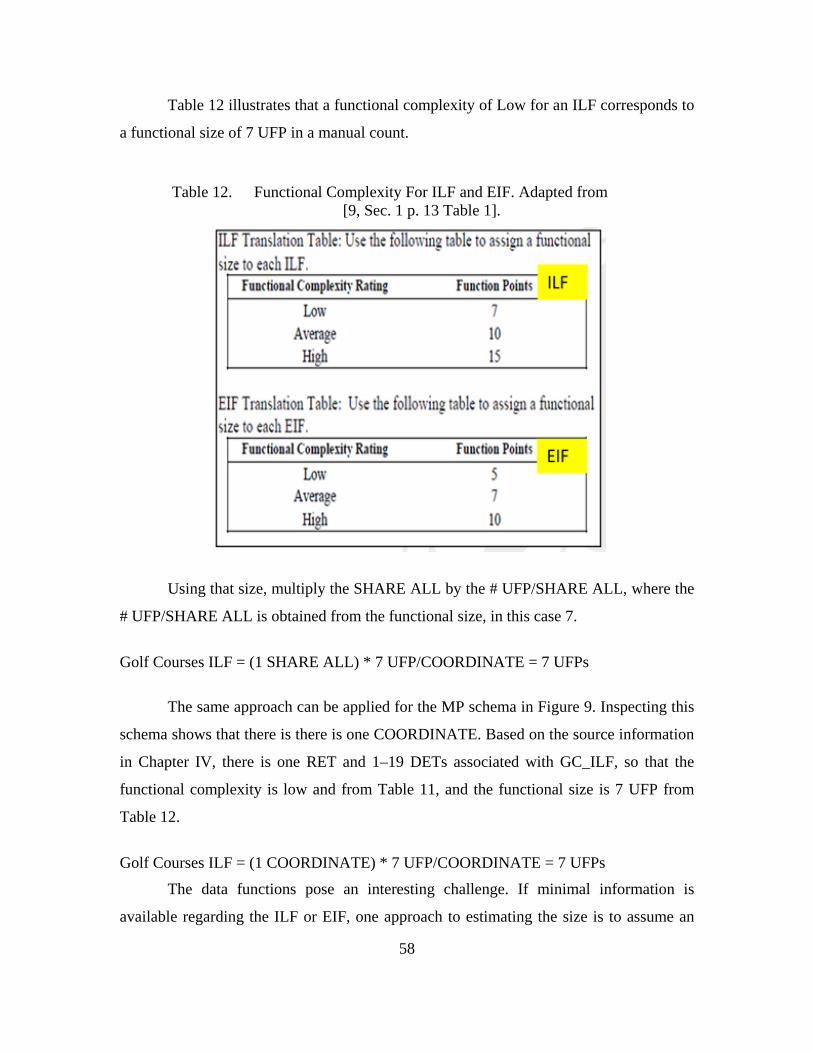
58
Table 12 illustrates that a functional complexity of Low for an ILF corresponds to
a functional size of 7 UFP in a manual count.
Table 12. Functional Complexity For ILF and EIF. Adapted from [9, Sec. 1 p. 13 Table 1].
Using that size, multiply the SHARE ALL by the # UFP/SHARE ALL, where the
# UFP/SHARE ALL is obtained from the functional size, in this case 7.
Golf Courses ILF = (1 SHARE ALL) * 7 UFP/COORDINATE = 7 UFPs
The same approach can be applied for the MP schema in Figure 9. Inspecting this
schema shows that there is there is one COORDINATE. Based on the source information
in Chapter IV, there is one RET and 1–19 DETs associated with GC_ILF, so that the
functional complexity is low and from Table 11, and the functional size is 7 UFP from
Table 12.
Golf Courses ILF = (1 COORDINATE) * 7 UFP/COORDINATE = 7 UFPs
The data functions pose an interesting challenge. If minimal information is
available regarding the ILF or EIF, one approach to estimating the size is to assume an
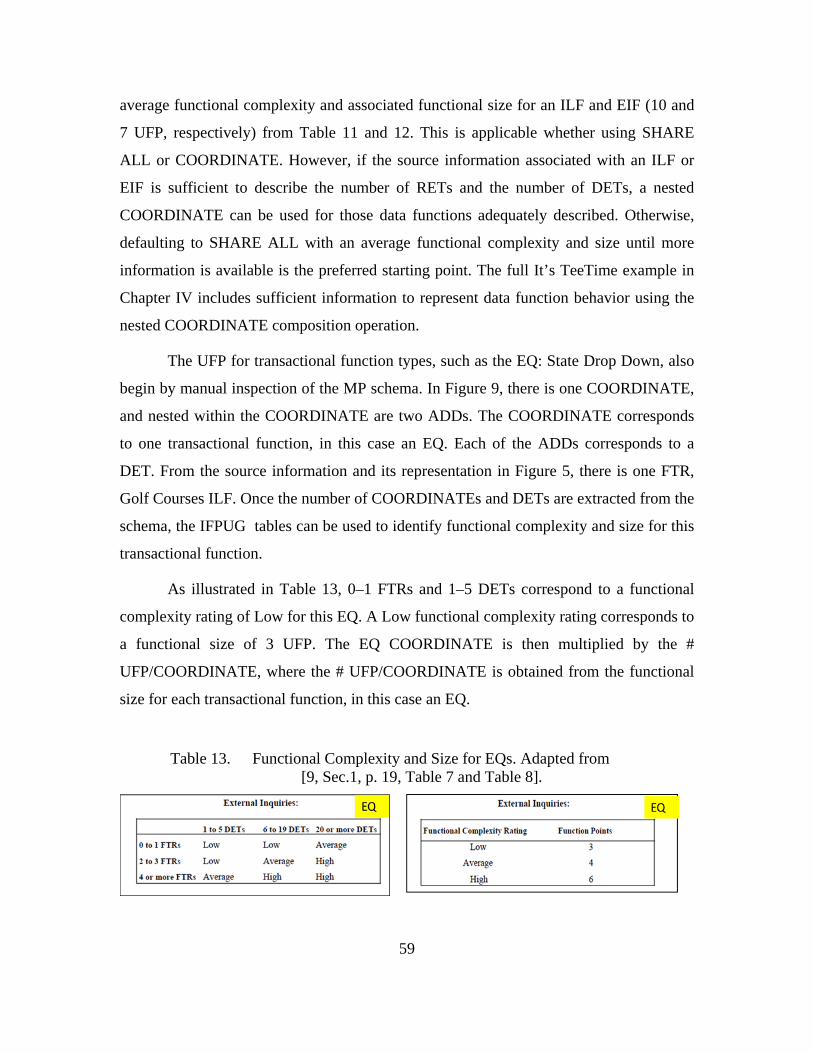
59
average functional complexity and associated functional size for an ILF and EIF (10 and
7 UFP, respectively) from Table 11 and 12. This is applicable whether using SHARE
ALL or COORDINATE. However, if the source information associated with an ILF or
EIF is sufficient to describe the number of RETs and the number of DETs, a nested
COORDINATE can be used for those data functions adequately described. Otherwise,
defaulting to SHARE ALL with an average functional complexity and size until more
information is available is the preferred starting point. The full It’s TeeTime example in
Chapter IV includes sufficient information to represent data function behavior using the
nested COORDINATE composition operation.
The UFP for transactional function types, such as the EQ: State Drop Down, also
begin by manual inspection of the MP schema. In Figure 9, there is one COORDINATE,
and nested within the COORDINATE are two ADDs. The COORDINATE corresponds
to one transactional function, in this case an EQ. Each of the ADDs corresponds to a
DET. From the source information and its representation in Figure 5, there is one FTR,
Golf Courses ILF. Once the number of COORDINATEs and DETs are extracted from the
schema, the IFPUG tables can be used to identify functional complexity and size for this
transactional function.
As illustrated in Table 13, 0–1 FTRs and 1–5 DETs correspond to a functional
complexity rating of Low for this EQ. A Low functional complexity rating corresponds to
a functional size of 3 UFP. The EQ COORDINATE is then multiplied by the #
UFP/COORDINATE, where the # UFP/COORDINATE is obtained from the functional
size for each transactional function, in this case an EQ.
Table 13. Functional Complexity and Size for EQs. Adapted from [9, Sec.1, p. 19, Table 7 and Table 8].
60
EQ State Drop Down = (1 COORDINATE) * 3 UFP/COORDINATE = 3 UFPs
For an EI, EQ, or EO represented by a COORDINATE, once the number of
interactions nested within the COORDINATE (one ADD for each DET) is determined, it
can be related to the functional size.
Recall, the IFPUG counting tables for functional complexity and functional size,
illustrated in Table 13.
One approach to relate the data functions to the MP architecture’s model language
would be to use SHARE ALL for interactions between the internal component of the
application being measured and the External Interface Files and the Internal Logical
Files.
As discussed earlier, when insufficient information is known about the application
to be measured, an initial UFP count can be obtained by assuming an ‘average’ functional
complexity for transactional and data functions. The functional complexity and functional
size values for average are not the same for EI, EO, EQ, ILF and EIF. If each is
represented by a COORDINATE or SHARE ALL, one approach would be to average the
EO, EI, and EQ complexity and sizing values from the IFPUG tables and use them for
each COORDINATE associated with an EI, EO, EQ, and for each SHARE ALL
associated with an ILF or EIF. For the functional size of a data function (i.e., ILF or EIF)
consider:
Average = 8.5 i.e., (10+7)/2
Use the average functional size value of 8.5 for any data function interaction
captured by SHARE ALL.
The same can be said for the transactional functions, where EI and EQ have the
same value and EO differs:
Average = 4.5 i.e., (4 +5+4)/3
Use the average functional size value of 4.5 for every transactional function
described by a COORDINATE.
61
(8) Step 8: Calculate Effort Estimate
As discussed in Chapter II Section A of this dissertation, COCOMO II can utilize
UFP counts or software lines of code as an input to estimate effort. UFP counts can be
transformed into lines of code based on the software implementation language used. This
can be done manually leveraging the equations in [4] and [5], or by using the COCOMO
II automated tool [57]. The implementation in [57] has been extended by Madachy and
Auguston to not only accept an UFP direct input, but also an MP file from which the UFP
count is extracted.
Figures 11 and 12 illustrate the options available for the MP-COCOMO II
extended implementation, where an UFP can be manually inserted into the model or a
MP .mp file can be uploaded. There are many options available as inputs to the
COCOMO II model. The options used for this research are discussed in this section. A
more complete description of the input options can be found in [4].
For Software Size Sizing Method, the FP selection represents leads to the
unadjusted function point input. Software sizing options include Sizing Method and Input
Method. The sizing method can be either FPs or SLOCs. Input Method can be Direct or
File Input.
If Input Method selected is Direct, then the number of UFPs are inserted in the
corresponding field. A language is then selected from options including Basic, C,
Database-default, JAVA, PERL, 3rd Generation Language. JAVA was selected for this
research.
If Input Method selected is File Input, then the option of Select Input File is
offered and an MP schema file with extension .mp can be uploaded.
Once the UFP are inserted and a language option is selected, then the other inputs
to the model can be selected. For this research Nominal was selected for all options,
Maintenance selected was off, and a software labor rate of $20,000 was used.
Consider the following example for a Direct input of 75 UFPs extracted from an
MP schema. Options selected are intended to result in a nominal level of effort.

62
Additionally, Maintenance is off, and software labor rate is assumed to be $20, 000. The
resulting estimate is illustrated in Table 14 Nominal Option Estimates.
Table 14. Nominal Option Estimates
Figure 11 illustrates all of the nominal options selected and Maintenance off, for a
direct input of 75 UFPs using the JAVA implementation language.
Figure 11. Nominal Effort Options Selected, Maintenance Off
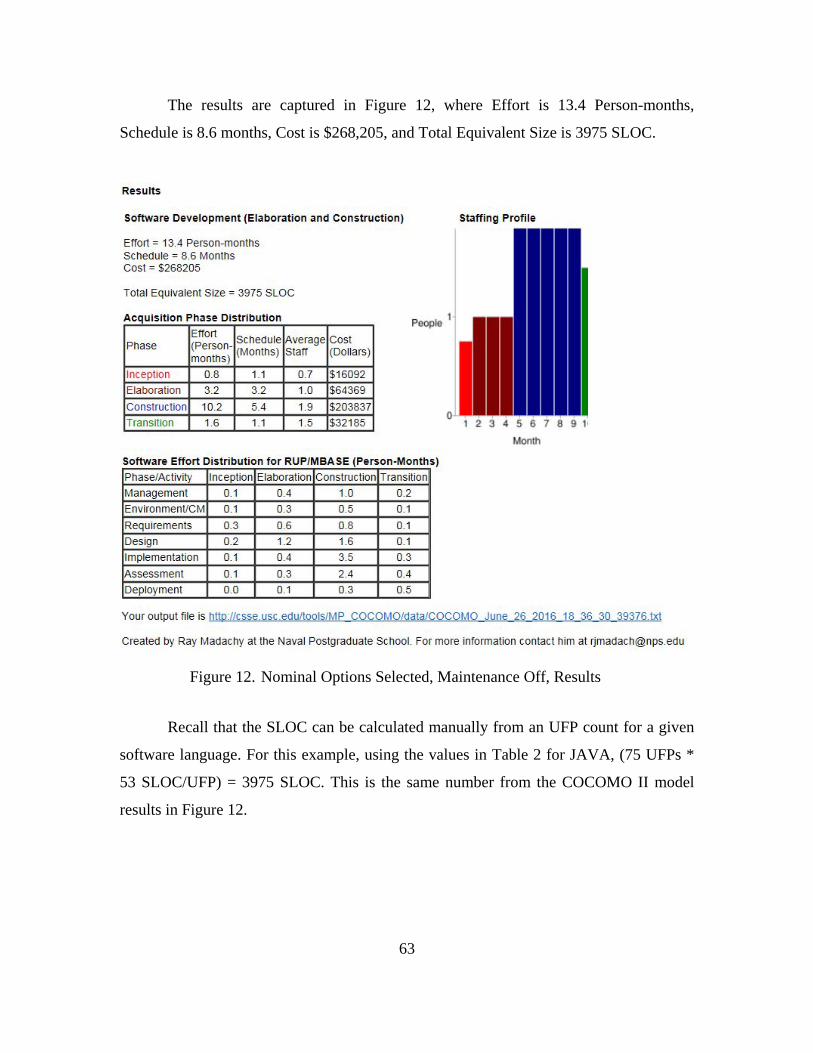
63
The results are captured in Figure 12, where Effort is 13.4 Person-months,
Schedule is 8.6 months, Cost is $268,205, and Total Equivalent Size is 3975 SLOC.
Figure 12. Nominal Options Selected, Maintenance Off, Results
Recall that the SLOC can be calculated manually from an UFP count for a given
software language. For this example, using the values in Table 2 for JAVA, (75 UFPs *
53 SLOC/UFP) = 3975 SLOC. This is the same number from the COCOMO II model
results in Figure 12.
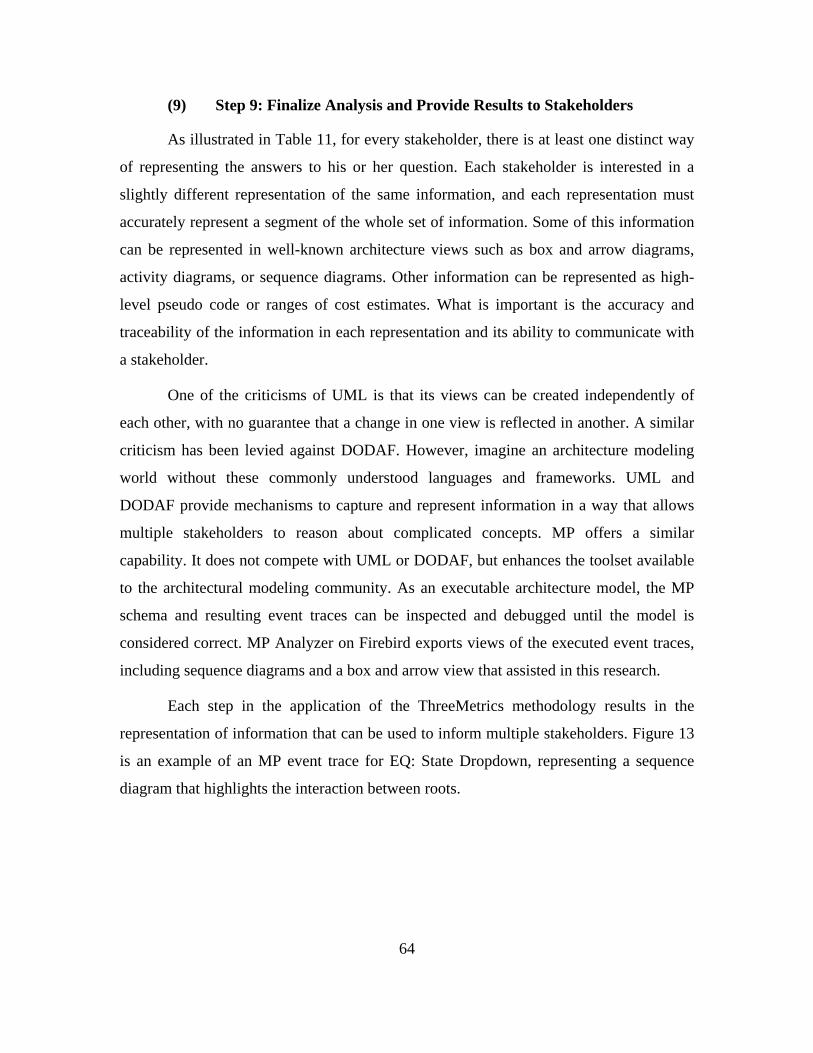
64
(9) Step 9: Finalize Analysis and Provide Results to Stakeholders
As illustrated in Table 11, for every stakeholder, there is at least one distinct way
of representing the answers to his or her question. Each stakeholder is interested in a
slightly different representation of the same information, and each representation must
accurately represent a segment of the whole set of information. Some of this information
can be represented in well-known architecture views such as box and arrow diagrams,
activity diagrams, or sequence diagrams. Other information can be represented as high-
level pseudo code or ranges of cost estimates. What is important is the accuracy and
traceability of the information in each representation and its ability to communicate with
a stakeholder.
One of the criticisms of UML is that its views can be created independently of
each other, with no guarantee that a change in one view is reflected in another. A similar
criticism has been levied against DODAF. However, imagine an architecture modeling
world without these commonly understood languages and frameworks. UML and
DODAF provide mechanisms to capture and represent information in a way that allows
multiple stakeholders to reason about complicated concepts. MP offers a similar
capability. It does not compete with UML or DODAF, but enhances the toolset available
to the architectural modeling community. As an executable architecture model, the MP
schema and resulting event traces can be inspected and debugged until the model is
considered correct. MP Analyzer on Firebird exports views of the executed event traces,
including sequence diagrams and a box and arrow view that assisted in this research.
Each step in the application of the ThreeMetrics methodology results in the
representation of information that can be used to inform multiple stakeholders. Figure 13
is an example of an MP event trace for EQ: State Dropdown, representing a sequence
diagram that highlights the interaction between roots.
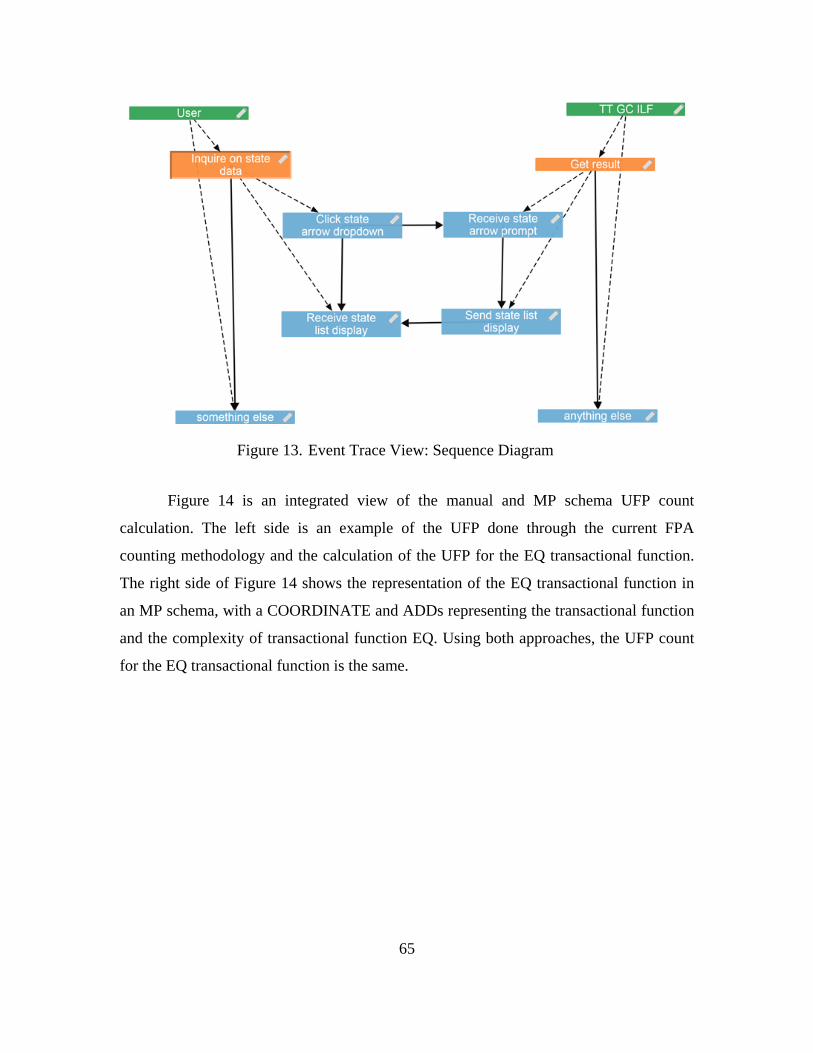
65
Figure 13. Event Trace View: Sequence Diagram
Figure 14 is an integrated view of the manual and MP schema UFP count
calculation. The left side is an example of the UFP done through the current FPA
counting methodology and the calculation of the UFP for the EQ transactional function.
The right side of Figure 14 shows the representation of the EQ transactional function in
an MP schema, with a COORDINATE and ADDs representing the transactional function
and the complexity of transactional function EQ. Using both approaches, the UFP count
for the EQ transactional function is the same.
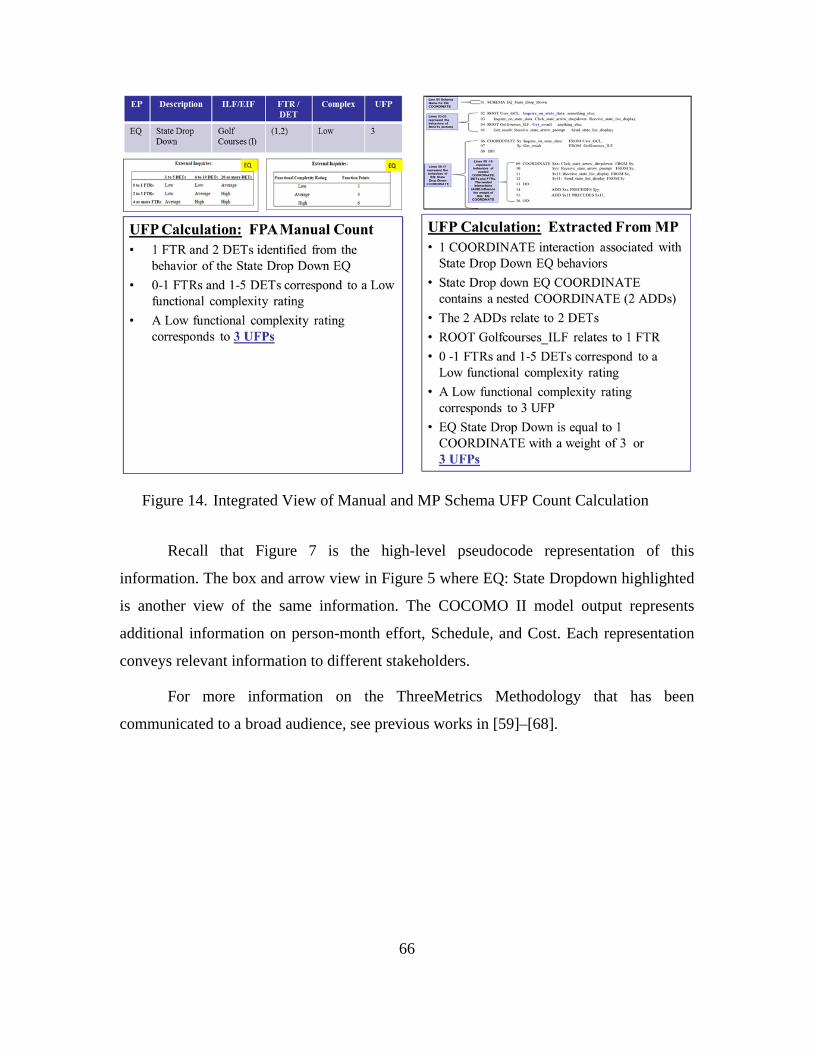
66
Figure 14. Integrated View of Manual and MP Schema UFP Count Calculation
Recall that Figure 7 is the high-level pseudocode representation of this
information. The box and arrow view in Figure 5 where EQ: State Dropdown highlighted
is another view of the same information. The COCOMO II model output represents
additional information on person-month effort, Schedule, and Cost. Each representation
conveys relevant information to different stakeholders.
For more information on the ThreeMetrics Methodology that has been
communicated to a broad audience, see previous works in [59]–[68].
67
IV. IMPLEMENTATION OF METHODOLOGY (EXAMPLES)
This chapter applies each step of the ThreeMetrics methodology described in
Chapter III to three examples. The Spell Checker and Course Marks examples are
derived from source information from Fenton and Bieman [69]. Variations of the It’s Tee
Time application, or simply Tee Time, are derived from source information from Q/P
Management group [56]. These examples were selected because they contain UFP
answer keys that can be compared to the UFP count extracted from the MP model to
validate the ThreeMetrics methodology.
The Spell Checker implementation shows that the ThreeMetrics methodology can
successfully extract an UFP from an MP model. The source information provided by this
example is minimal, but does include an UFP answer key that includes functional
complexity and size values for transactional and data function types.
The Course Marks implementation further demonstrates that the ThreeMetrics
methodology can extract an UFP count from an MP model. The source information
provided is minimal, and it does include an UFP answer key, functional complexity, and
size values for transactional and data function types.
The Tee Time implementation highlights the value of detailed source information,
which allows the exploration of four Courses of Action (COAs) to determine the UFP
count using the ThreeMetrics methodology. Each COA increasingly applies details from
the Tee Time source information to develop the MP model:
COA 1:
• Assumes limited source information and therefore average functional complexity and size values for each transactional and data function.
• Inspects model for COORDINATE and SHARE ALL.
COA 2:
• Applies additional detail from source information to develop the MP model.
• Assumes average functional complexity and size values for each transactional and data function.
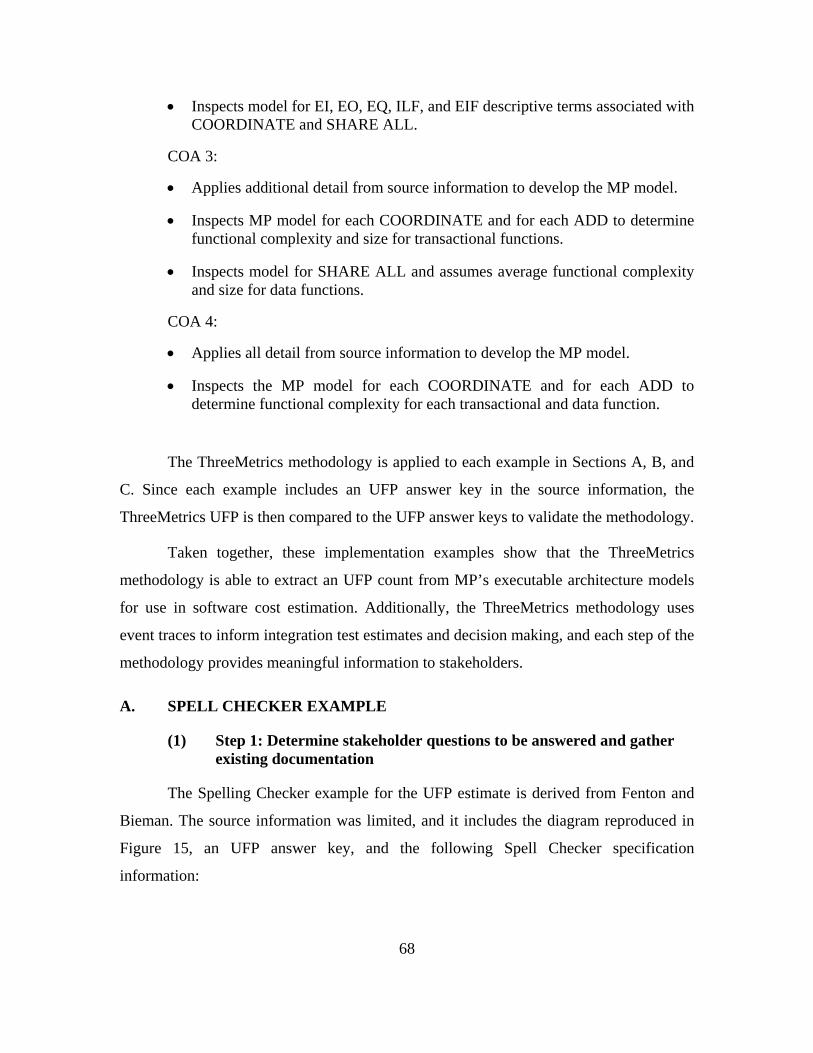
68
• Inspects model for EI, EO, EQ, ILF, and EIF descriptive terms associated with COORDINATE and SHARE ALL.
COA 3:
• Applies additional detail from source information to develop the MP model.
• Inspects MP model for each COORDINATE and for each ADD to determine functional complexity and size for transactional functions.
• Inspects model for SHARE ALL and assumes average functional complexity and size for data functions.
COA 4:
• Applies all detail from source information to develop the MP model.
• Inspects the MP model for each COORDINATE and for each ADD to determine functional complexity for each transactional and data function.
The ThreeMetrics methodology is applied to each example in Sections A, B, and
C. Since each example includes an UFP answer key in the source information, the
ThreeMetrics UFP is then compared to the UFP answer keys to validate the methodology.
Taken together, these implementation examples show that the ThreeMetrics
methodology is able to extract an UFP count from MP’s executable architecture models
for use in software cost estimation. Additionally, the ThreeMetrics methodology uses
event traces to inform integration test estimates and decision making, and each step of the
methodology provides meaningful information to stakeholders.
A. SPELL CHECKER EXAMPLE
(1) Step 1: Determine stakeholder questions to be answered and gather existing documentation
The Spelling Checker example for the UFP estimate is derived from Fenton and
Bieman. The source information was limited, and it includes the diagram reproduced in
Figure 15, an UFP answer key, and the following Spell Checker specification
information:
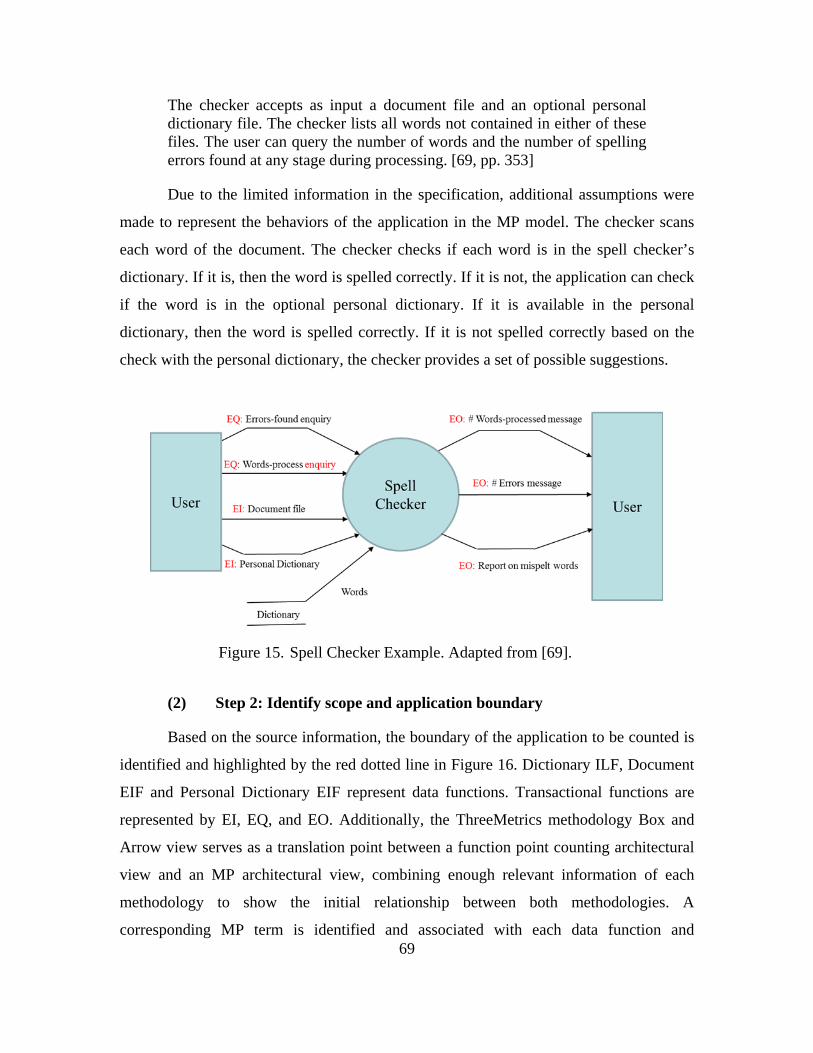
69
The checker accepts as input a document file and an optional personal dictionary file. The checker lists all words not contained in either of these files. The user can query the number of words and the number of spelling errors found at any stage during processing. [69, pp. 353]
Due to the limited information in the specification, additional assumptions were
made to represent the behaviors of the application in the MP model. The checker scans
each word of the document. The checker checks if each word is in the spell checker’s
dictionary. If it is, then the word is spelled correctly. If it is not, the application can check
if the word is in the optional personal dictionary. If it is available in the personal
dictionary, then the word is spelled correctly. If it is not spelled correctly based on the
check with the personal dictionary, the checker provides a set of possible suggestions.
Figure 15. Spell Checker Example. Adapted from [69].
(2) Step 2: Identify scope and application boundary
Based on the source information, the boundary of the application to be counted is
identified and highlighted by the red dotted line in Figure 16. Dictionary ILF, Document
EIF and Personal Dictionary EIF represent data functions. Transactional functions are
represented by EI, EQ, and EO. Additionally, the ThreeMetrics methodology Box and
Arrow view serves as a translation point between a function point counting architectural
view and an MP architectural view, combining enough relevant information of each
methodology to show the initial relationship between both methodologies. A
corresponding MP term is identified and associated with each data function and
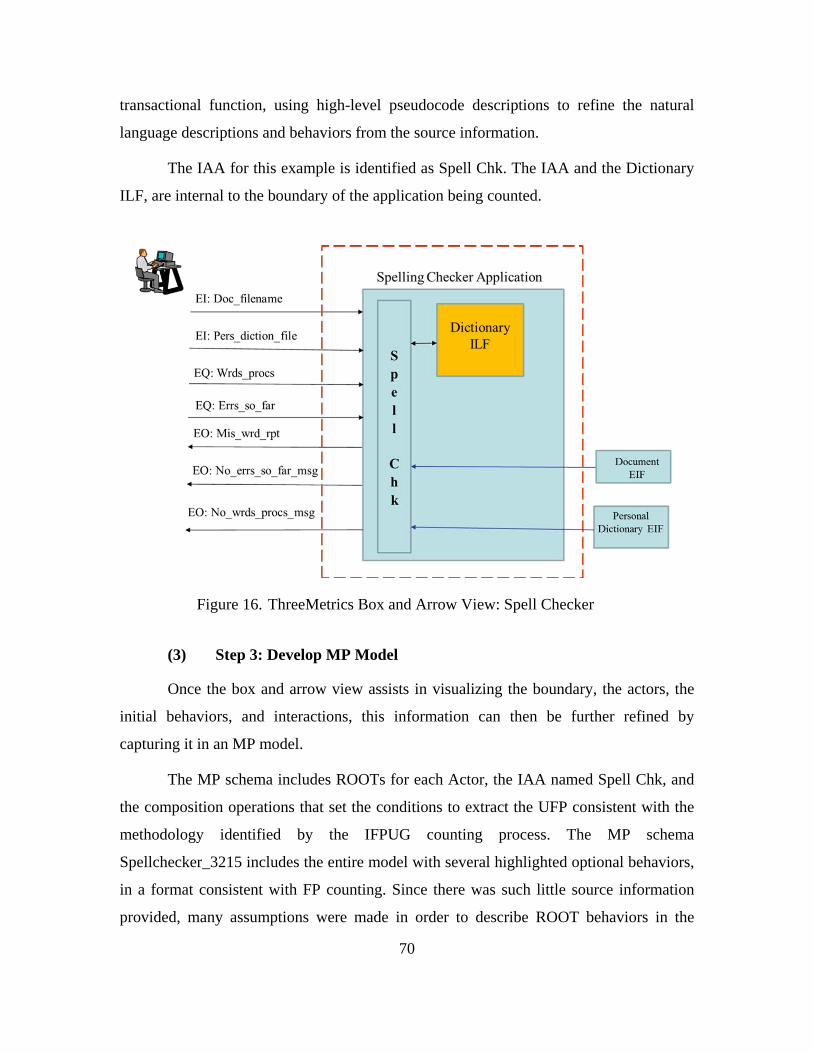
70
transactional function, using high-level pseudocode descriptions to refine the natural
language descriptions and behaviors from the source information.
The IAA for this example is identified as Spell Chk. The IAA and the Dictionary
ILF, are internal to the boundary of the application being counted.
Figure 16. ThreeMetrics Box and Arrow View: Spell Checker
(3) Step 3: Develop MP Model
Once the box and arrow view assists in visualizing the boundary, the actors, the
initial behaviors, and interactions, this information can then be further refined by
capturing it in an MP model.
The MP schema includes ROOTs for each Actor, the IAA named Spell Chk, and
the composition operations that set the conditions to extract the UFP consistent with the
methodology identified by the IFPUG counting process. The MP schema
Spellchecker_3215 includes the entire model with several highlighted optional behaviors,
in a format consistent with FP counting. Since there was such little source information
provided, many assumptions were made in order to describe ROOT behaviors in the
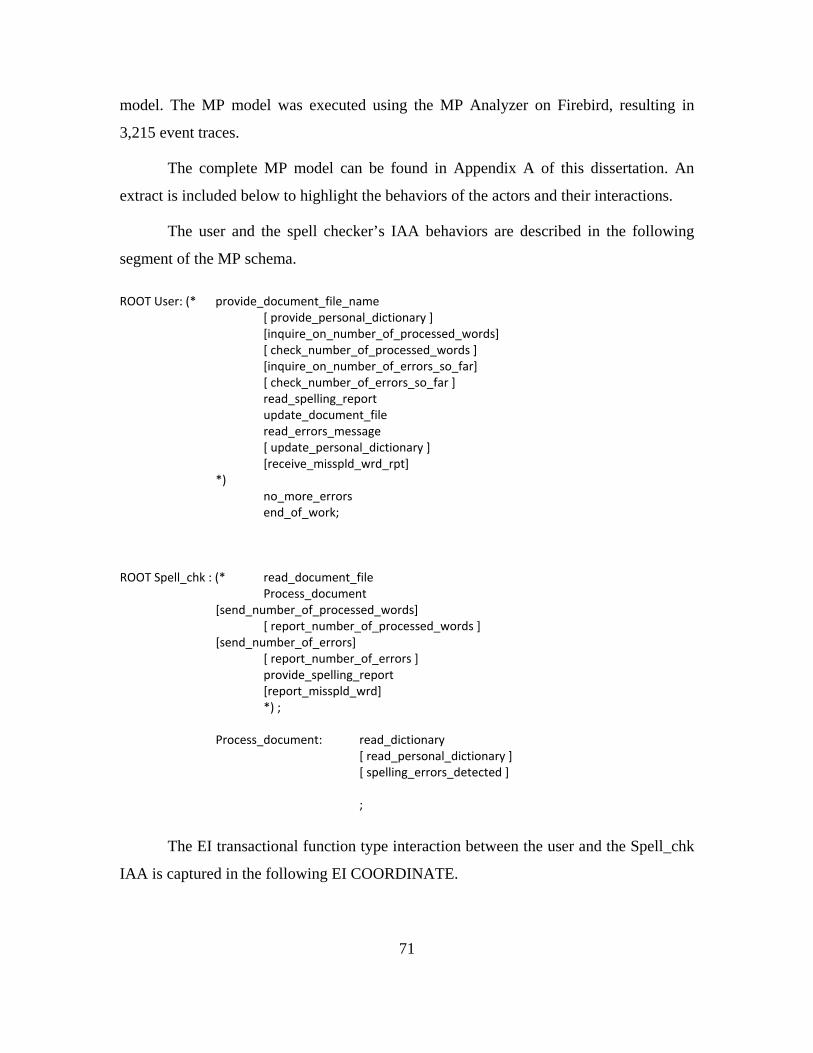
71
model. The MP model was executed using the MP Analyzer on Firebird, resulting in
3,215 event traces.
The complete MP model can be found in Appendix A of this dissertation. An
extract is included below to highlight the behaviors of the actors and their interactions.
The user and the spell checker’s IAA behaviors are described in the following
segment of the MP schema. ROOT User: (* provide_document_file_name [ provide_personal_dictionary ] [inquire_on_number_of_processed_words] [ check_number_of_processed_words ] [inquire_on_number_of_errors_so_far] [ check_number_of_errors_so_far ] read_spelling_report update_document_file read_errors_message [ update_personal_dictionary ] [receive_misspld_wrd_rpt] *) no_more_errors end_of_work; ROOT Spell_chk : (* read_document_file Process_document [send_number_of_processed_words] [ report_number_of_processed_words ] [send_number_of_errors] [ report_number_of_errors ] provide_spelling_report [report_misspld_wrd] *) ; Process_document: read_dictionary [ read_personal_dictionary ] [ spelling_errors_detected ] ;
The EI transactional function type interaction between the user and the Spell_chk
IAA is captured in the following EI COORDINATE.
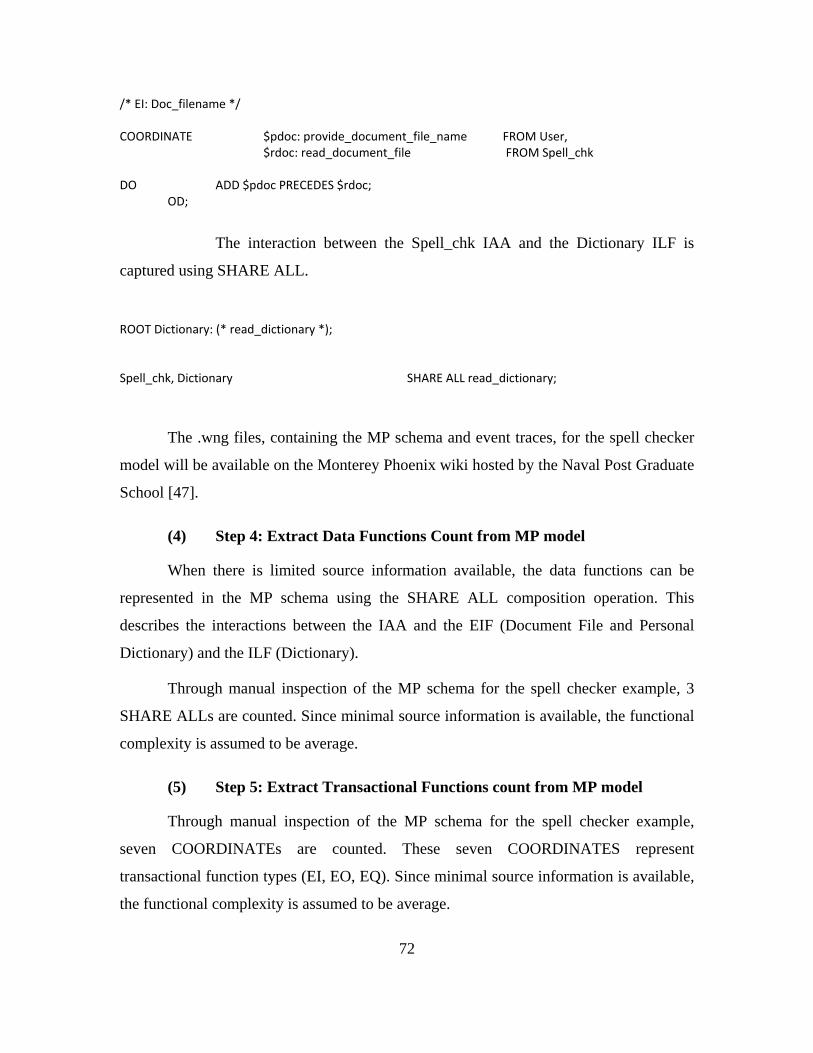
72
/* EI: Doc_filename */ COORDINATE $pdoc: provide_document_file_name FROM User, $rdoc: read_document_file FROM Spell_chk DO ADD $pdoc PRECEDES $rdoc;
OD;
The interaction between the Spell_chk IAA and the Dictionary ILF is
captured using SHARE ALL. ROOT Dictionary: (* read_dictionary *); Spell_chk, Dictionary SHARE ALL read_dictionary;
The .wng files, containing the MP schema and event traces, for the spell checker
model will be available on the Monterey Phoenix wiki hosted by the Naval Post Graduate
School [47].
(4) Step 4: Extract Data Functions Count from MP model
When there is limited source information available, the data functions can be
represented in the MP schema using the SHARE ALL composition operation. This
describes the interactions between the IAA and the EIF (Document File and Personal
Dictionary) and the ILF (Dictionary).
Through manual inspection of the MP schema for the spell checker example, 3
SHARE ALLs are counted. Since minimal source information is available, the functional
complexity is assumed to be average.
(5) Step 5: Extract Transactional Functions count from MP model
Through manual inspection of the MP schema for the spell checker example,
seven COORDINATEs are counted. These seven COORDINATES represent
transactional function types (EI, EO, EQ). Since minimal source information is available,
the functional complexity is assumed to be average.
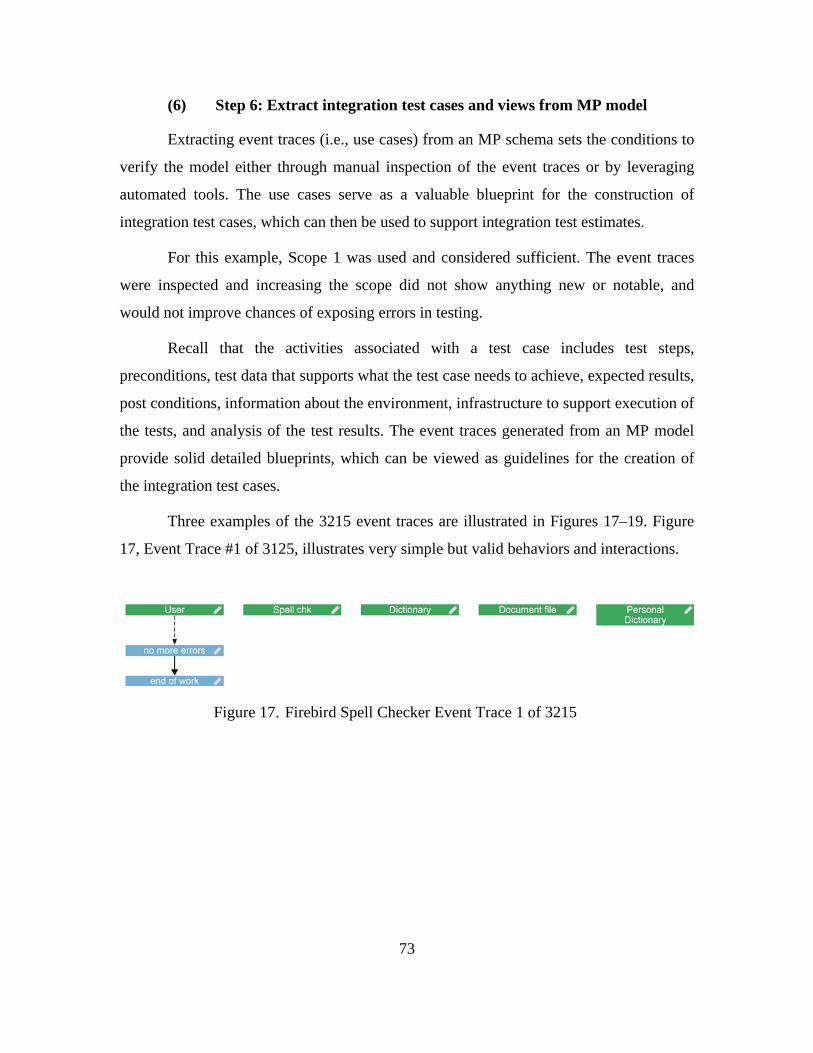
73
(6) Step 6: Extract integration test cases and views from MP model
Extracting event traces (i.e., use cases) from an MP schema sets the conditions to
verify the model either through manual inspection of the event traces or by leveraging
automated tools. The use cases serve as a valuable blueprint for the construction of
integration test cases, which can then be used to support integration test estimates.
For this example, Scope 1 was used and considered sufficient. The event traces
were inspected and increasing the scope did not show anything new or notable, and
would not improve chances of exposing errors in testing.
Recall that the activities associated with a test case includes test steps,
preconditions, test data that supports what the test case needs to achieve, expected results,
post conditions, information about the environment, infrastructure to support execution of
the tests, and analysis of the test results. The event traces generated from an MP model
provide solid detailed blueprints, which can be viewed as guidelines for the creation of
the integration test cases.
Three examples of the 3215 event traces are illustrated in Figures 17–19. Figure
17, Event Trace #1 of 3125, illustrates very simple but valid behaviors and interactions.
Figure 17. Firebird Spell Checker Event Trace 1 of 3215
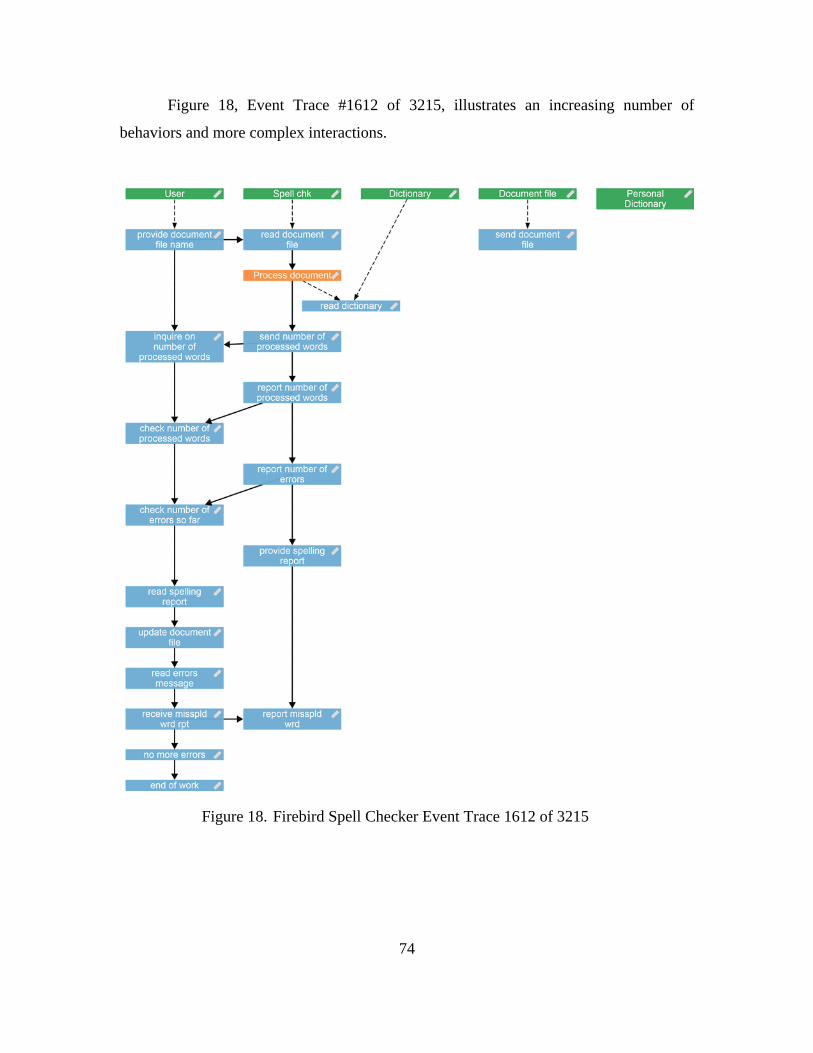
74
Figure 18, Event Trace #1612 of 3215, illustrates an increasing number of
behaviors and more complex interactions.
Figure 18. Firebird Spell Checker Event Trace 1612 of 3215
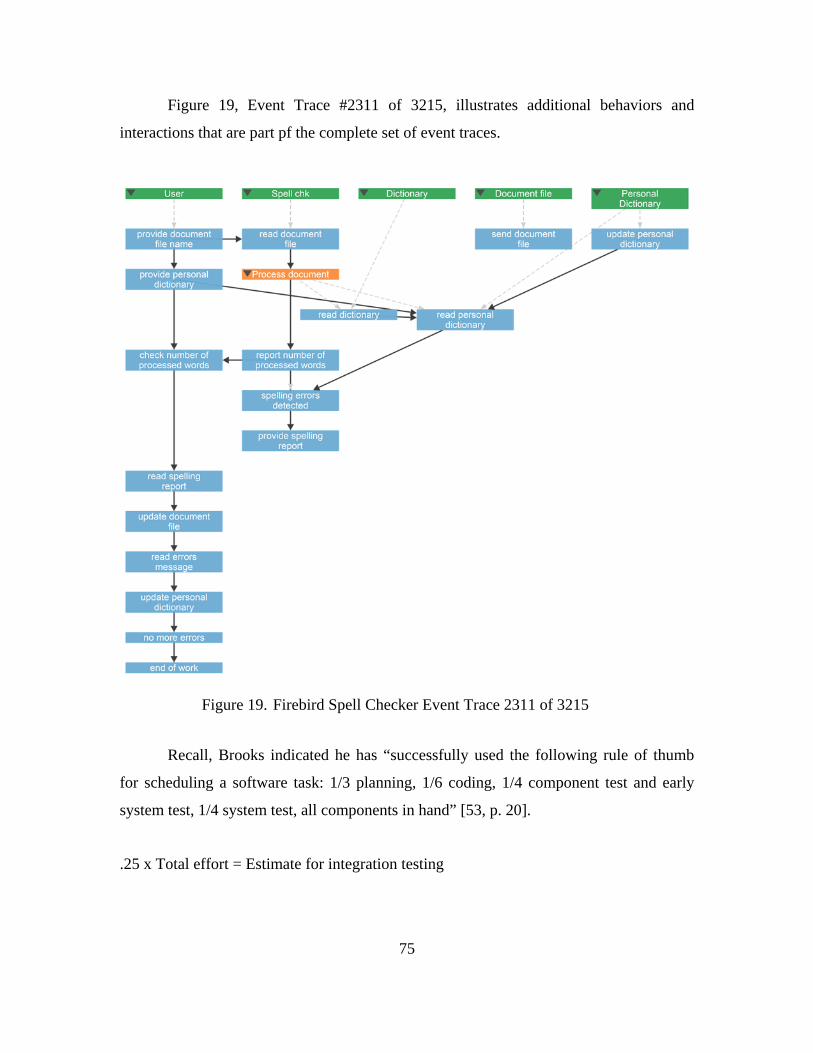
75
Figure 19, Event Trace #2311 of 3215, illustrates additional behaviors and
interactions that are part pf the complete set of event traces.
Figure 19. Firebird Spell Checker Event Trace 2311 of 3215
Recall, Brooks indicated he has “successfully used the following rule of thumb
for scheduling a software task: 1/3 planning, 1/6 coding, 1/4 component test and early
system test, 1/4 system test, all components in hand” [53, p. 20].
.25 x Total effort = Estimate for integration testing

76
As discussed by Wolff, approximately six integration tests per day can be
executed for a large application, such as an electronic commerce system [58, p. 16]. This
does not include the amount of time required to create the test case.
Integration test estimates must account for test preparation, including the creation
of the test cases and data sets or ensuring that the test environment is ready. The tests do
not account for the time required to analyze the results of running the test cases.
Additionally, the amount of time required to execute a test case is influenced by the
method of execution, i.e., automated using scripts or manually executed, or a
combination of both techniques. For several large DOD releases, typically between three
and fifteen integration tests per day have been executed, depending on the complexity of
the test and the amount of automation. For this research, the value of six test cases per
day is used.
In the COCOMO II results that will be discussed in Step 8, the Integration and
Test costs are extracted from the phase effort for Construction. In this phase breakdown
the total Construction is 76% of the software development effort. Using the waterfall
lifecycle definitions for COCOMO II the breakdown is as follows: Product Design 17%;
Programming 58%; Integration and Test 25% [55].
As is illustrated by Figure 21 in Step 8, the Construction phase is allocated 4.8
months of schedule. Twenty-five percent of that time is 1.2 months. Those 1.2 months
corresponds to 24 days (assuming 5 days per week and 8 hours per day for each staff
person). Assuming 6 test cases per day, then 144 test cases can be executed in the
allocated time for test and integration.
There are 3215 event traces generated in the MP model. Not including the time
required to create and analyze the test cases, this would require over 535 days to execute
testing. Upon inspection of the event traces, some are significantly less complicated than
others, so test case generation and execution based on each event trace will not require
the same amount of effort.
This does provide information for next steps to inform decision making, both
technically and programmatically. The first step is to revisit the model, and ensure that
77
the behaviors of the application are accurately captured. If the model is correct, then the
next step is to determine if there is any flexibility in the schedule and resources to support
additional testing. Since 535 days is not supportable given current schedule constraints,
only a subset of event traces can be selected for testing.
If schedule does not support more than 144 test cases, then the event traces will
need to be inspected and a subset selected for use in the creation of test cases. The criteria
to determine what subset of event traces to select is a topic for future work.
(7) Step 7: Determine the Unadjusted Function Point (UFP) count
In the case of the example in [69], limited source information is available; so, an
assumption is made that the functional complexity for both data and transactional
function types corresponds to “average.”
The ILF and EIFs identified for this example are:
• ILF: Dictionary
• EIF: Document_file
• EIF: Personal_Dictionary
Based on the tables from the IFPUG, an average functional complexity for an ILF
corresponds to 10 UFPs, and an average functional complexity for an EIF corresponds to
7 UFPs.
Note that in the UFP calculation contained in the answer key to the example in
[69], the UFP for data functions is shown to be
(2 EIF) x (10 UFP/EIF) + (1 ILF x 7 UFP/ILF) for a total of 27 UFP
According to the functional complexity and functional size values for averages
from the IFPUG tables, the UFP count should be:
(2 EIFs) x (7 UFP/EIF) + (1 ILF) x (10 UFP/ILF) = 24 UFP
This difference is noted to point out that the UFP count used for data functions in
this analysis will be 24 UFP.
78
For EI, EO, and EQ, each associated COORDINATE in the MP schema
represents a transactional function, resulting in seven transactional functions for this
example. For the transactional function UFP count, due to the limited source information
available for this example, once again an average functional complexity rating is
assumed. According to the IFPUG tables, the corresponding size for an average
functional complexity rating is 4 UFPs for an EI, 4 UFP for an EQ, and 5 UFPs for an
EO. The transactional functions are:
• EI: Doc_filename
• EI: Pers_diction_file
• EQ: Inquire_errors_so_far
• EO: No_ers_so_far_msg
• EQ: Inquire_words_processed
• EO: No_wrds_prosd_msg
• EO: Misspld_wrd_rpt
2 EI x 4 UFP/EI = 8 UFP
2 EQ x 4 UFP/EQ = 8 UFP
3 EO x 5 UFP/EO = 15 UFP
This results in a total of 31 UFPs for transactional functions. The total UFP count
for the Spell Checker example is 31 UFPs + 24 UFPs = 55 UFPs. Recall that for this
example, the decision was made to use 24 UFPs for the data functions, so the total UFP is
55 and not 58 as noted in [69].
One of the challenges of inspecting the MP schema is how to address the
difference in average functional complexity for an ILF and EIF, if the pseudocode
descriptions in the model do not include an ILF or EIF to distinguish between them. One
approach is to average the ILF and EIF functional size and suggest that the SHARE ALL
functional complexity and size for a data function corresponds to:
79
Low = (7+5)/2 = 6
Average = (10+7)/2 = 8.5
High = (10+15)/2 = 12.5
This would result in (3 SHARE ALLs) x (8.5 UFP/SHARE ALL) = 25.5 UFPs
The same approach used for data functions can be applied to transactional
functions, where EI and EQ have the same value and EO differs:
Low = (3+3+6)/3 = 3.5
Average = (4 +5+4)/3 = 4.5
High = (6+7+6)/3 = 6.5
This would result in (7 COORDINATEs) x (4.5 UFP/COORDINATE) = 31.5 UFPs.
Assuming an average complexity, the UFP counts for the data and transactional function
types are:
7 COORDINATEs x 4.5 = 31.5 UFP
3 SHARE Alls x 8.5 = 25.5 UFP
This results in a total count of 57 UFPs, which is slightly higher than the 55 UFPs used
for this analysis. The remaining challenge is how to assign the low, average, and high
functional complexity and size values to the number of COORDINATES, nested
COORDINATES and SHARE ALLs, when the requirements are still maturing and the
available information is insufficient to accurately describe the DETs, the number of
FTRs, and the number RETs.
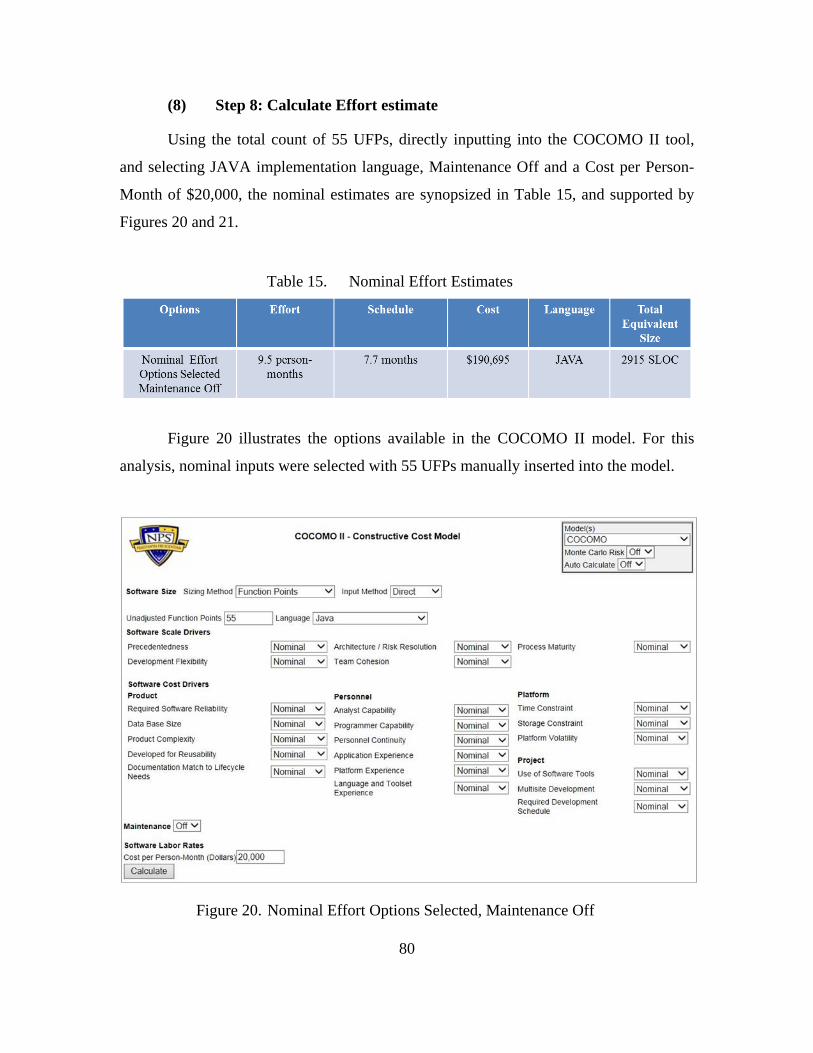
80
(8) Step 8: Calculate Effort estimate
Using the total count of 55 UFPs, directly inputting into the COCOMO II tool,
and selecting JAVA implementation language, Maintenance Off and a Cost per Person-
Month of $20,000, the nominal estimates are synopsized in Table 15, and supported by
Figures 20 and 21.
Table 15. Nominal Effort Estimates
Figure 20 illustrates the options available in the COCOMO II model. For this
analysis, nominal inputs were selected with 55 UFPs manually inserted into the model.
Figure 20. Nominal Effort Options Selected, Maintenance Off
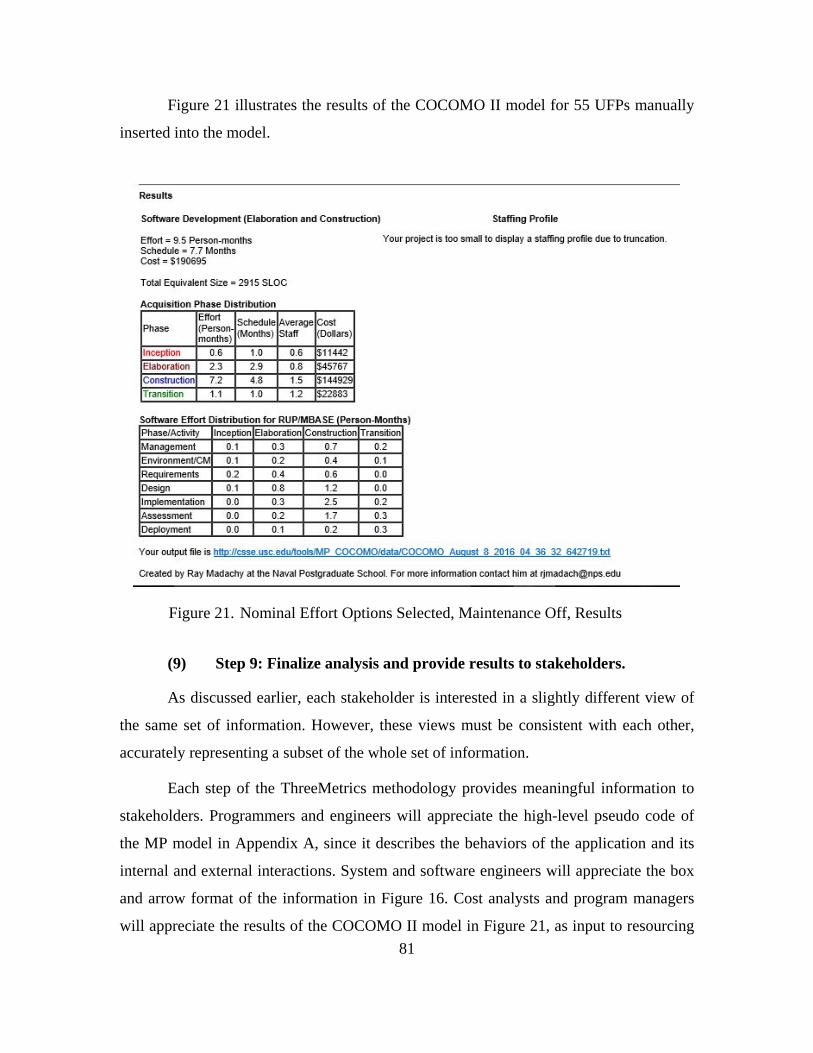
81
Figure 21 illustrates the results of the COCOMO II model for 55 UFPs manually
inserted into the model.
Figure 21. Nominal Effort Options Selected, Maintenance Off, Results
(9) Step 9: Finalize analysis and provide results to stakeholders.
As discussed earlier, each stakeholder is interested in a slightly different view of
the same set of information. However, these views must be consistent with each other,
accurately representing a subset of the whole set of information.
Each step of the ThreeMetrics methodology provides meaningful information to
stakeholders. Programmers and engineers will appreciate the high-level pseudo code of
the MP model in Appendix A, since it describes the behaviors of the application and its
internal and external interactions. System and software engineers will appreciate the box
and arrow format of the information in Figure 16. Cost analysts and program managers
will appreciate the results of the COCOMO II model in Figure 21, as input to resourcing
82
requirements presented with each instance of the architecture model. Testers will
appreciate the use cases (i.e. event traces), and sequence diagrams that inform integration
test case creation.
B. COURSE MARKS EXAMPLE
(1) Step 1: Determine stakeholder questions to be answered and gather existing documentation
The Course Marks System example for UFP estimate is derived from Fenton and
Bieman [69, pp. 367–368, 546–548]. The source table used terms such as ‘simple’ and
‘complex’ rather than ‘low’ and ‘high’. Based on the limited description associated with
the specification, the requirements are listed with the following associated assumptions
inserted next to the decompose requirement:
• “The Course Marks application enables a lecturer to enter student marks for a predefined set of courses and students taking those courses” [69]. (Assumption: Lecturer is the User).
• “Marks can be updated” [69]. (Assumption: This means Added. Changed or deleted are not explicitly called out in this example).
• “Lecturers cannot change the basic course information, as the course lists are the responsibility of the system administrator” [69]. (Assumption: This information is provided via drop down menus for courses and then students.
• The system is menu-driven.
• The lecturer (User) selects from a choice of courses (EI: Menu_selct_course_choice)
• The lecturer (User) then selects from a choice of operations (EI: Menu_selct_operation_choice), which are the following:
• Enter coursework marks (EI: Coursework_marks)
• Enter exam marks (EI: Exam_marks ).
• Compute averages (Inquire on average grade, and display to user, EQ: Average).
• Produce letter grades (Inquire on letter grades and display to user, EQ: Letter_grades).
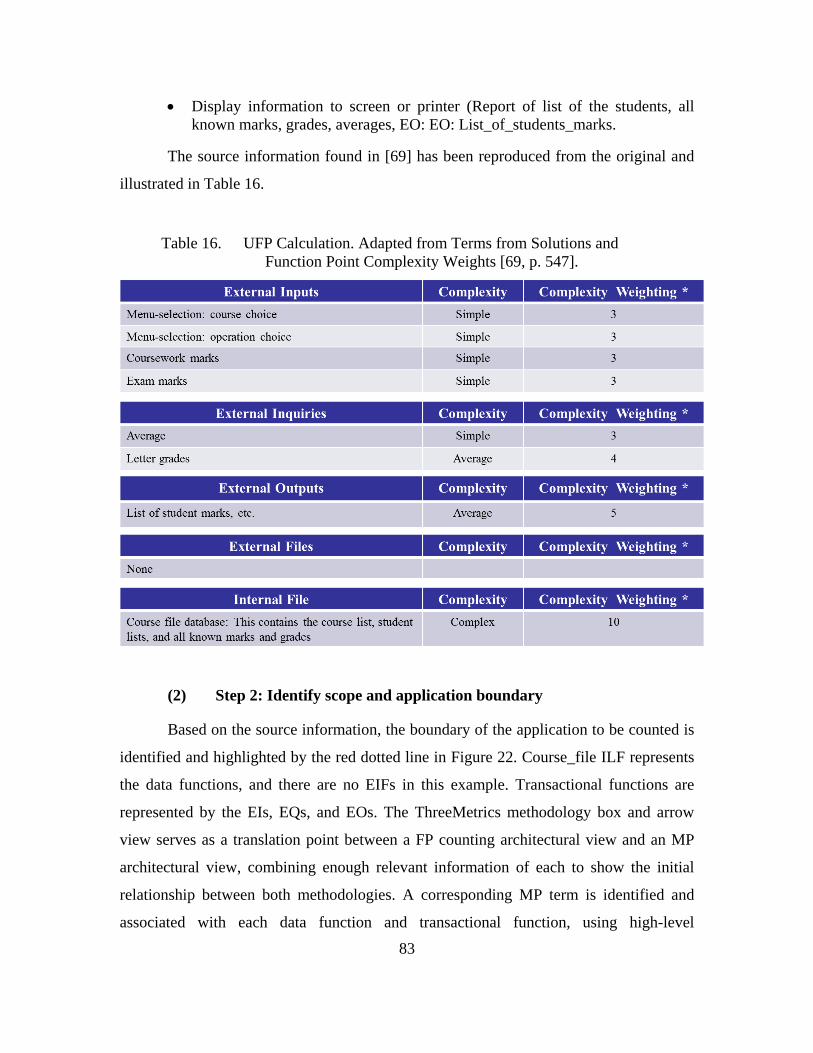
83
• Display information to screen or printer (Report of list of the students, all known marks, grades, averages, EO: EO: List_of_students_marks.
The source information found in [69] has been reproduced from the original and
illustrated in Table 16.
Table 16. UFP Calculation. Adapted from Terms from Solutions and Function Point Complexity Weights [69, p. 547].
(2) Step 2: Identify scope and application boundary
Based on the source information, the boundary of the application to be counted is
identified and highlighted by the red dotted line in Figure 22. Course_file ILF represents
the data functions, and there are no EIFs in this example. Transactional functions are
represented by the EIs, EQs, and EOs. The ThreeMetrics methodology box and arrow
view serves as a translation point between a FP counting architectural view and an MP
architectural view, combining enough relevant information of each to show the initial
relationship between both methodologies. A corresponding MP term is identified and
associated with each data function and transactional function, using high-level
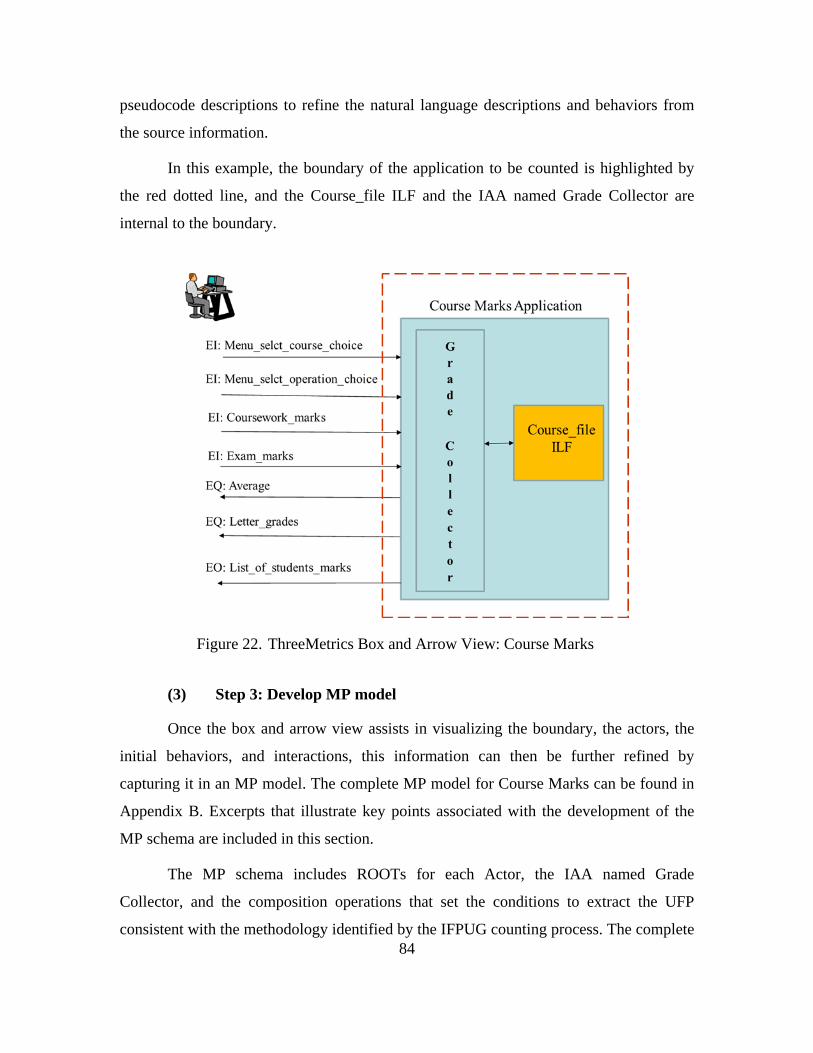
84
pseudocode descriptions to refine the natural language descriptions and behaviors from
the source information.
In this example, the boundary of the application to be counted is highlighted by
the red dotted line, and the Course_file ILF and the IAA named Grade Collector are
internal to the boundary.
Figure 22. ThreeMetrics Box and Arrow View: Course Marks
(3) Step 3: Develop MP model
Once the box and arrow view assists in visualizing the boundary, the actors, the
initial behaviors, and interactions, this information can then be further refined by
capturing it in an MP model. The complete MP model for Course Marks can be found in
Appendix B. Excerpts that illustrate key points associated with the development of the
MP schema are included in this section.
The MP schema includes ROOTs for each Actor, the IAA named Grade
Collector, and the composition operations that set the conditions to extract the UFP
consistent with the methodology identified by the IFPUG counting process. The complete
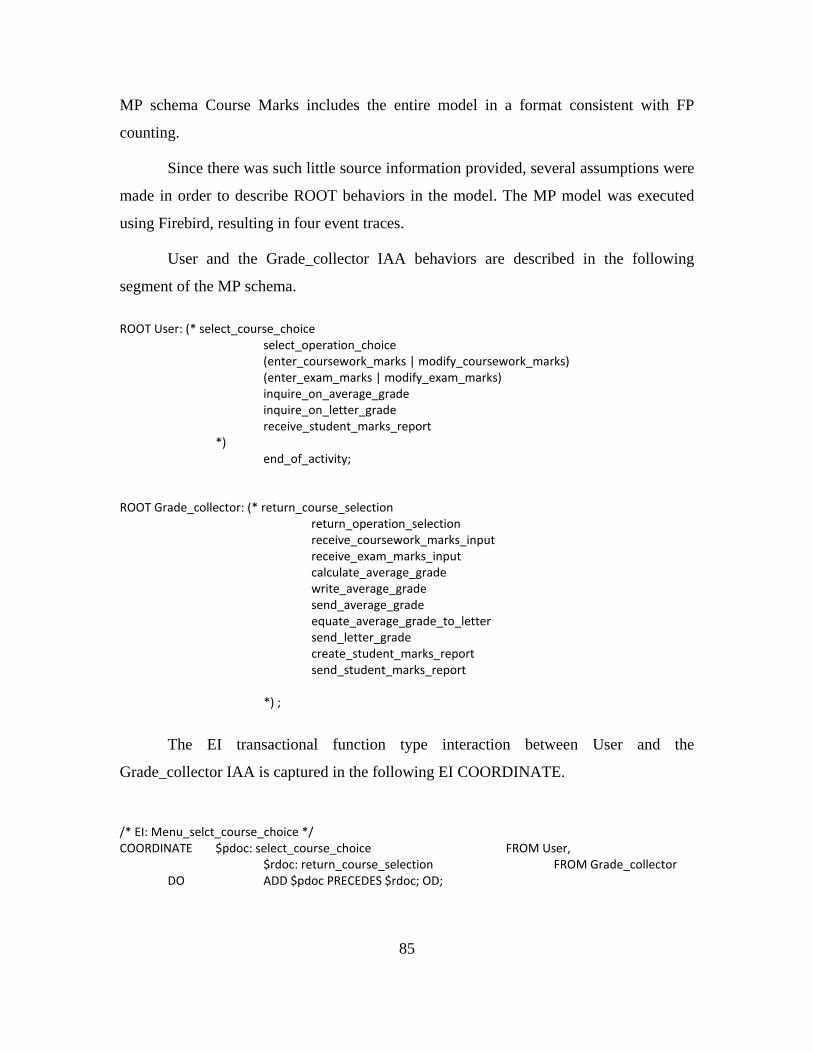
85
MP schema Course Marks includes the entire model in a format consistent with FP
counting.
Since there was such little source information provided, several assumptions were
made in order to describe ROOT behaviors in the model. The MP model was executed
using Firebird, resulting in four event traces.
User and the Grade_collector IAA behaviors are described in the following
segment of the MP schema. ROOT User: (* select_course_choice select_operation_choice (enter_coursework_marks | modify_coursework_marks) (enter_exam_marks | modify_exam_marks) inquire_on_average_grade inquire_on_letter_grade receive_student_marks_report *) end_of_activity; ROOT Grade_collector: (* return_course_selection return_operation_selection receive_coursework_marks_input receive_exam_marks_input calculate_average_grade write_average_grade send_average_grade equate_average_grade_to_letter send_letter_grade create_student_marks_report send_student_marks_report *) ;
The EI transactional function type interaction between User and the
Grade_collector IAA is captured in the following EI COORDINATE.
/* EI: Menu_selct_course_choice */ COORDINATE $pdoc: select_course_choice FROM User, $rdoc: return_course_selection FROM Grade_collector DO ADD $pdoc PRECEDES $rdoc; OD;
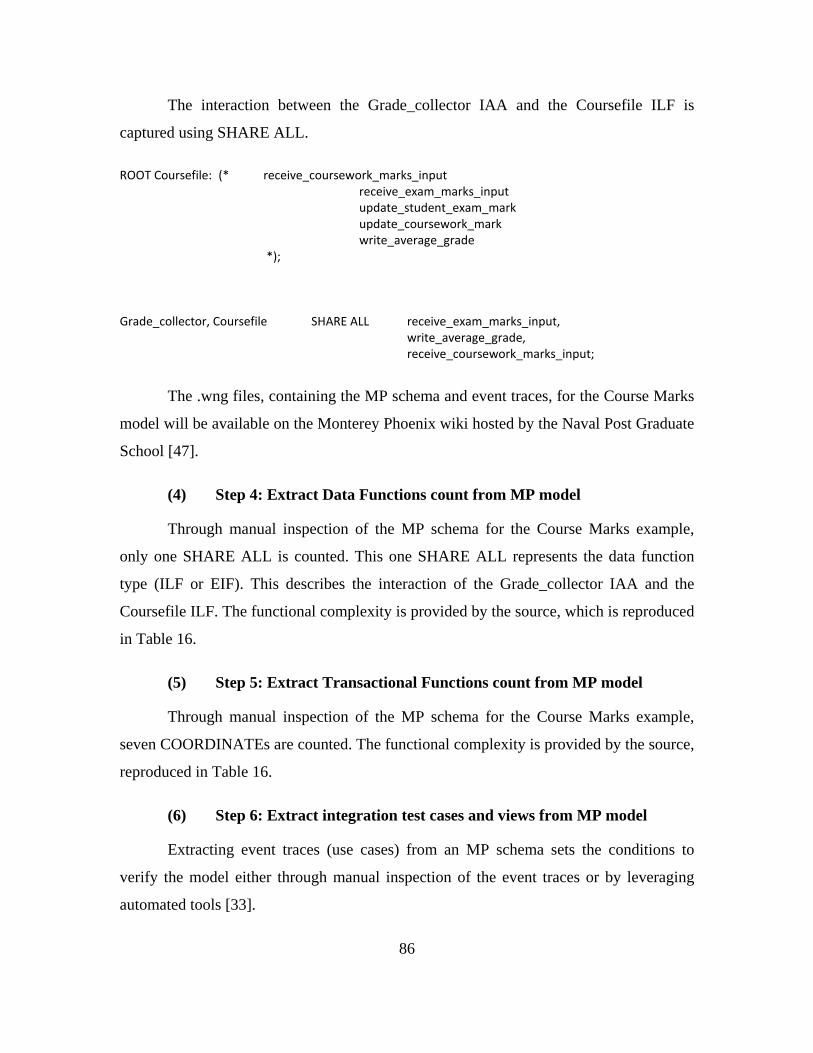
86
The interaction between the Grade_collector IAA and the Coursefile ILF is
captured using SHARE ALL. ROOT Coursefile: (* receive_coursework_marks_input receive_exam_marks_input update_student_exam_mark update_coursework_mark write_average_grade *); Grade_collector, Coursefile SHARE ALL receive_exam_marks_input, write_average_grade, receive_coursework_marks_input;
The .wng files, containing the MP schema and event traces, for the Course Marks
model will be available on the Monterey Phoenix wiki hosted by the Naval Post Graduate
School [47].
(4) Step 4: Extract Data Functions count from MP model
Through manual inspection of the MP schema for the Course Marks example,
only one SHARE ALL is counted. This one SHARE ALL represents the data function
type (ILF or EIF). This describes the interaction of the Grade_collector IAA and the
Coursefile ILF. The functional complexity is provided by the source, which is reproduced
in Table 16.
(5) Step 5: Extract Transactional Functions count from MP model
Through manual inspection of the MP schema for the Course Marks example,
seven COORDINATEs are counted. The functional complexity is provided by the source,
reproduced in Table 16.
(6) Step 6: Extract integration test cases and views from MP model
Extracting event traces (use cases) from an MP schema sets the conditions to
verify the model either through manual inspection of the event traces or by leveraging
automated tools [33].
87
Recall that a test case includes test steps, preconditions, and test data that supports
what the test case needs to achieve, and also its expected results, post conditions, and
information about the environment. The event traces generated from an MP model
provide solid detailed blueprints, which can be viewed as guidelines for the creation of
the integration test cases.
For this example, Scope 3 was used. Four event traces were generated. The event
traces generated for Scope 1 and 2 were inspected and increasing the scope did improve
chances of exposing errors in testing.
Figure 23, Event Trace #2 of 4, illustrates the behaviors for the Course Marks
application. Figure 24, Event Trace #3 of 4, illustrates the behaviors for the Course
Marks application with increasing detail.
Figure 25, Event Trace #4 of 4, illustrates the behaviors for the Course Marks
application with increasing detail, but slightly different behaviors represented in this
snapshot of a specific use case.
The use cases serve as a valuable blueprint for the construction of integration test
cases, which can then be used to support integration test estimates.
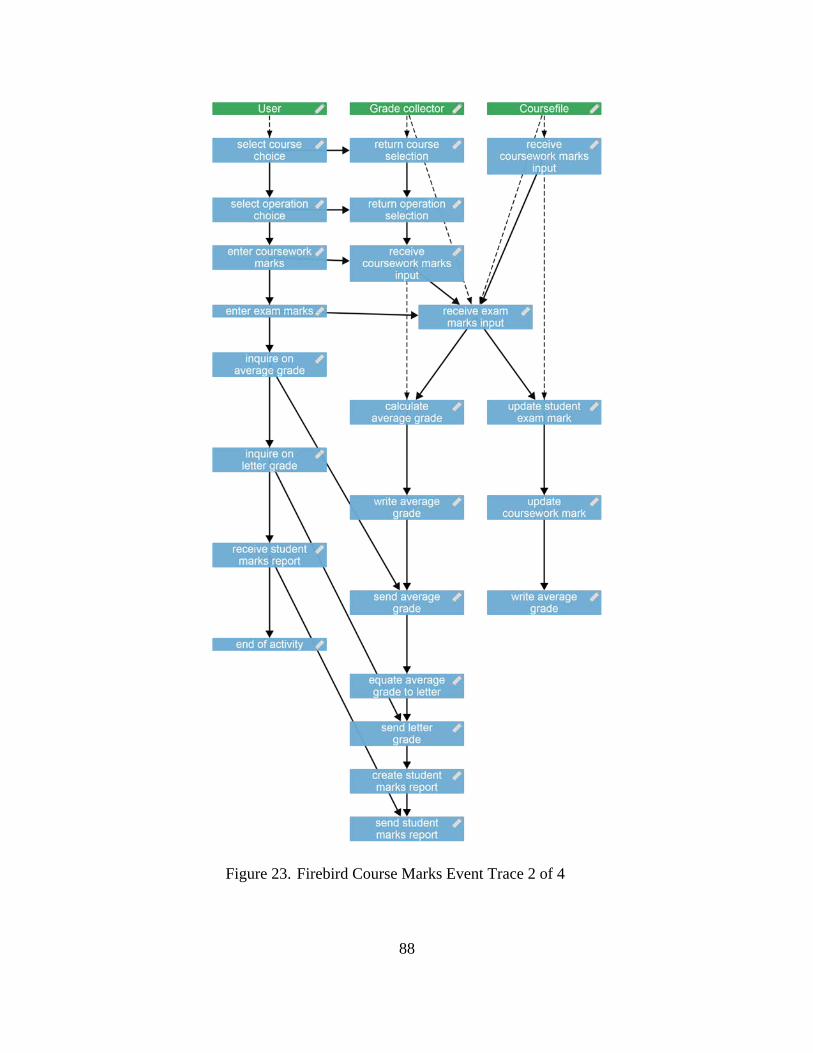
88
Figure 23. Firebird Course Marks Event Trace 2 of 4
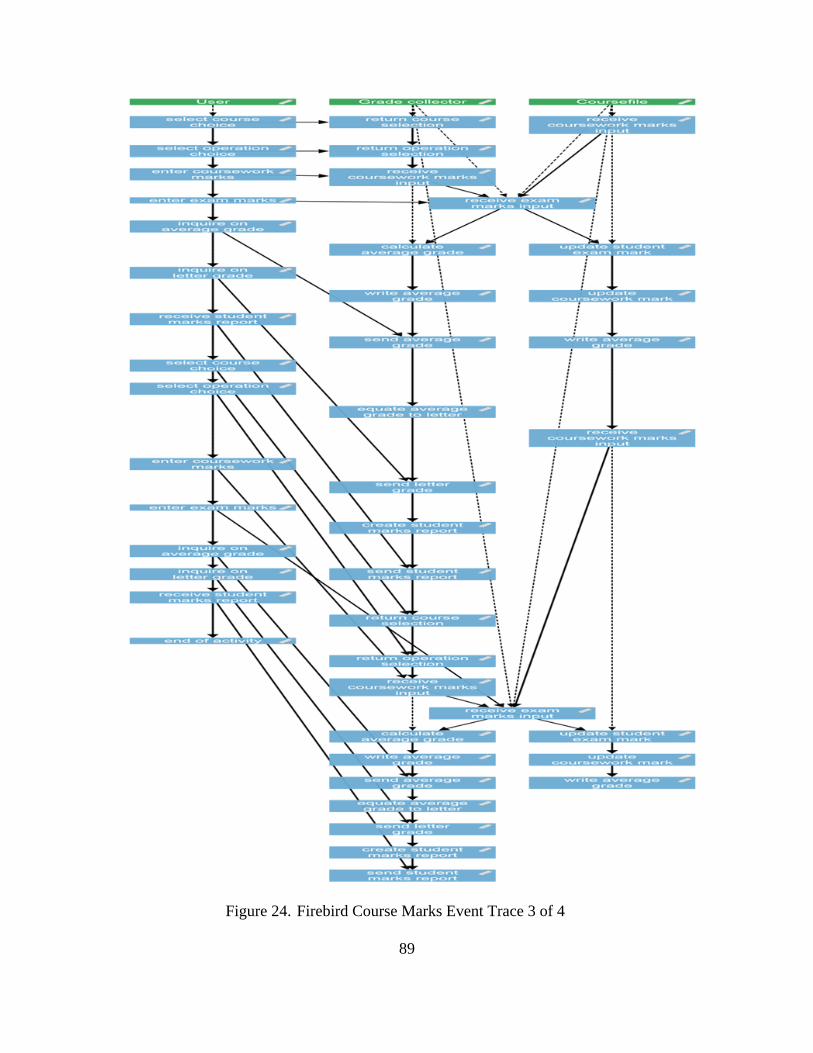
89
Figure 24. Firebird Course Marks Event Trace 3 of 4
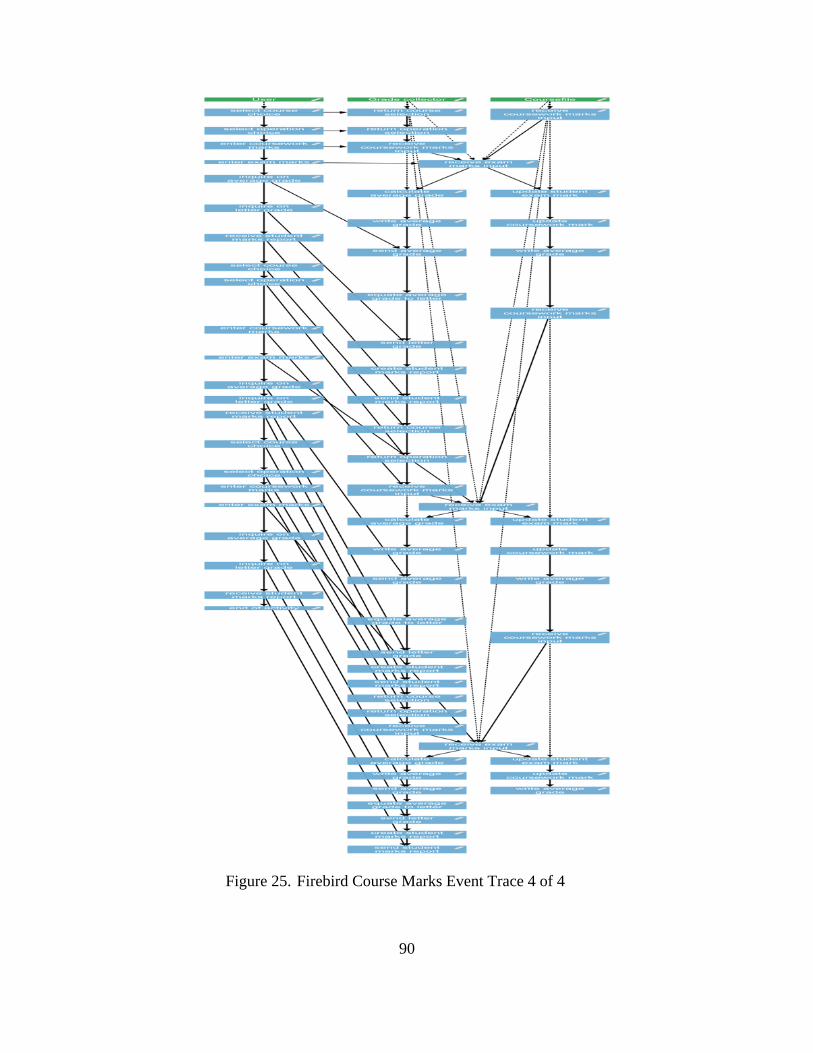
90
Figure 25. Firebird Course Marks Event Trace 4 of 4
91
Recall Brooks stated he has “successfully used the following rule of thumb for
scheduling a software task: 1/3 planning, 1/6 coding, 1/4 component test and early system
test, 1/4 system test, all components in hand” [53, p. 20].
.25 x Total effort = Estimate for integration testing
As discussed by Wolff, approximately six integration tests per day can be
executed for a large application, such as an electronic commerce system [58, p. 16]. This
does not include the amount of time required to create the test case.
In the COCOMO II results that will be discussed in Step 8, the Integration and
Test costs are part of the phase effort for Construction. In this phase breakdown, the total
Construction is 76% of the software development effort. Using the waterfall lifecycle
definitions for COCOMO II the breakdown is as follows: Product Design 17%;
Programming 58%; Integration and Test 25% [55].
As is illustrated in Figure 27, the Construction phase is allocated 4.3 months of
schedule. Twenty-five percent of that time is 1.075 months. The 1.075 months
corresponds to 21.5 days (assuming 5 days per week and 8 hours per day for each staff
person). Assuming that six test cases per day can be executed, then 129 test cases can be
executed in the allocated time for test and integration.
There are four event traces generated in the MP model. Not including the time
required to create the actual test cases, this would require less than one day to execute all
testing. This provides information for next steps to inform decision making, both
technically and programmatically. It seems unreasonable to complete testing in one day
on this application. The first step is to revisit the model, and ensure that the behaviors of
the application are accurately captured, and the model is not overly constrained. If this
model is truly representative of the application behaviors, then the next step is to
determine how this additional time in the schedule can be re-allocated.
Although Step 6 is focused on integration test case estimates, this step provides an
opportunity to confirm that the executable model is not overly constrained. The data and
92
transactional function types are represented accurately, and the UFP is extracted and
calculated correctly, but the event traces suggest the model may need to be revisited to
ensure it is constructed properly while maintaining the same relevant information.
(7) Step 7: Determine the Unadjusted Function Point (UFP) count
The source information from [69], illustrated in Table 16, indicates that the data
function for ILF Course_file has a functional complexity of “Complex”, which is
assumed to mean High. This would then correspond to a functional size of 15, from the
IFPUG tables. The UFP count for data functions is calculated as follows:
(1 ILF x 15 UFP/ILF) = 15 UFPs
Table 12 also indicates that the transactional functions have functional
complexities of simple (assumed to mean low) and average. Using the information from
[69] in Table 12 and the IFPUG counting tables, the UFP count for transactional
functions is calculated as follows:
(1EI x 3UFP/EI) + (1EI x 3UFP/EI) + (1EI x 3UFP/EI) + (1EI x 3UFP/EI) + (1EQ x
3UFP/EQ) + (1EQ x 4UFP/EQ) + (1EO x 5UFP/EO) = 24 UFPs
The total UFP count is 15 + 24 = 39 UFPs
As discussed earlier, one of the challenges of inspecting the MP schema is how to
address the difference in functional complexity for an ILF and EIF. One approach is to
average the ILF and EIF functional size and suggest that the SHARE ALL functional
complexity and size for a data function (i.e. ILF or EIF) corresponds to:
Low = 6 i.e., (7+5)/2
Average = 8.5 i.e., (10+7)/2
High = 12.5 i.e., (10+15)/2
This would result in (1 SHARE ALL) x (12.5 UFP/SHARE ALL) = 12.5 UFPs.
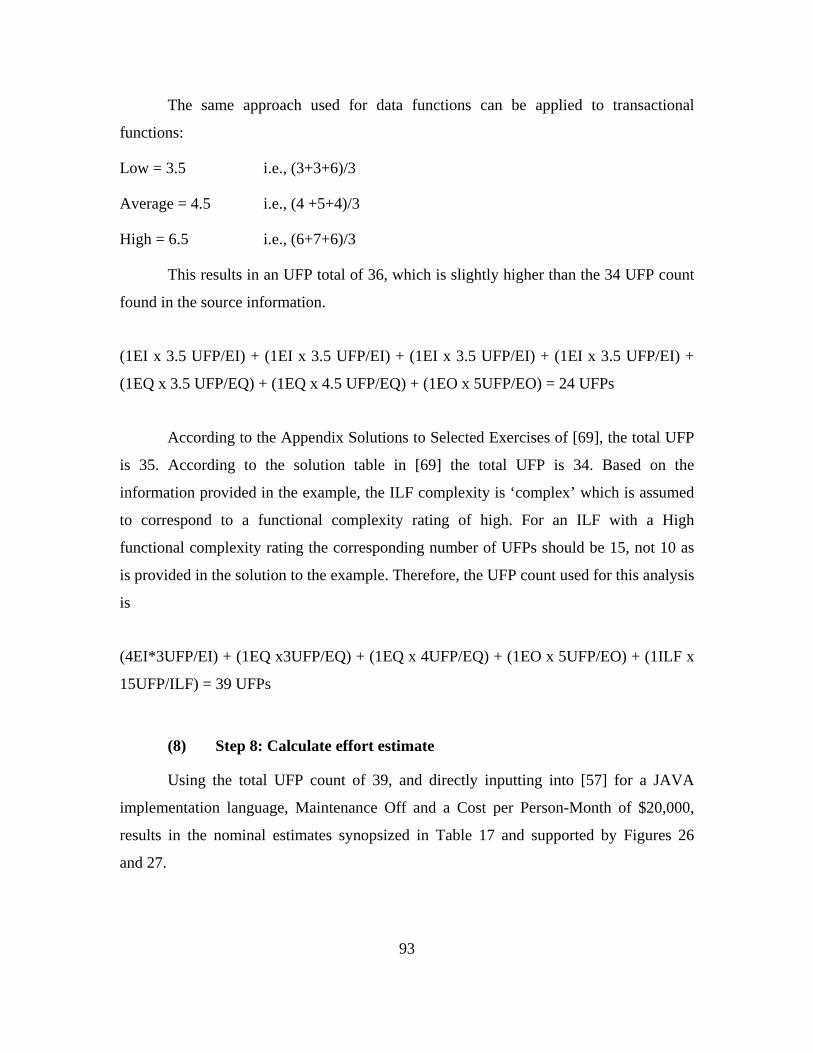
93
The same approach used for data functions can be applied to transactional
functions:
Low = 3.5 i.e., (3+3+6)/3
Average = 4.5 i.e., (4 +5+4)/3
High = 6.5 i.e., (6+7+6)/3
This results in an UFP total of 36, which is slightly higher than the 34 UFP count
found in the source information.
(1EI x 3.5 UFP/EI) + (1EI x 3.5 UFP/EI) + (1EI x 3.5 UFP/EI) + (1EI x 3.5 UFP/EI) +
(1EQ x 3.5 UFP/EQ) + (1EQ x 4.5 UFP/EQ) + (1EO x 5UFP/EO) = 24 UFPs
According to the Appendix Solutions to Selected Exercises of [69], the total UFP
is 35. According to the solution table in [69] the total UFP is 34. Based on the
information provided in the example, the ILF complexity is ‘complex’ which is assumed
to correspond to a functional complexity rating of high. For an ILF with a High
functional complexity rating the corresponding number of UFPs should be 15, not 10 as
is provided in the solution to the example. Therefore, the UFP count used for this analysis
is
(4EI*3UFP/EI) + (1EQ x3UFP/EQ) + (1EQ x 4UFP/EQ) + (1EO x 5UFP/EO) + (1ILF x
15UFP/ILF) = 39 UFPs
(8) Step 8: Calculate effort estimate
Using the total UFP count of 39, and directly inputting into [57] for a JAVA
implementation language, Maintenance Off and a Cost per Person-Month of $20,000,
results in the nominal estimates synopsized in Table 17 and supported by Figures 26
and 27.
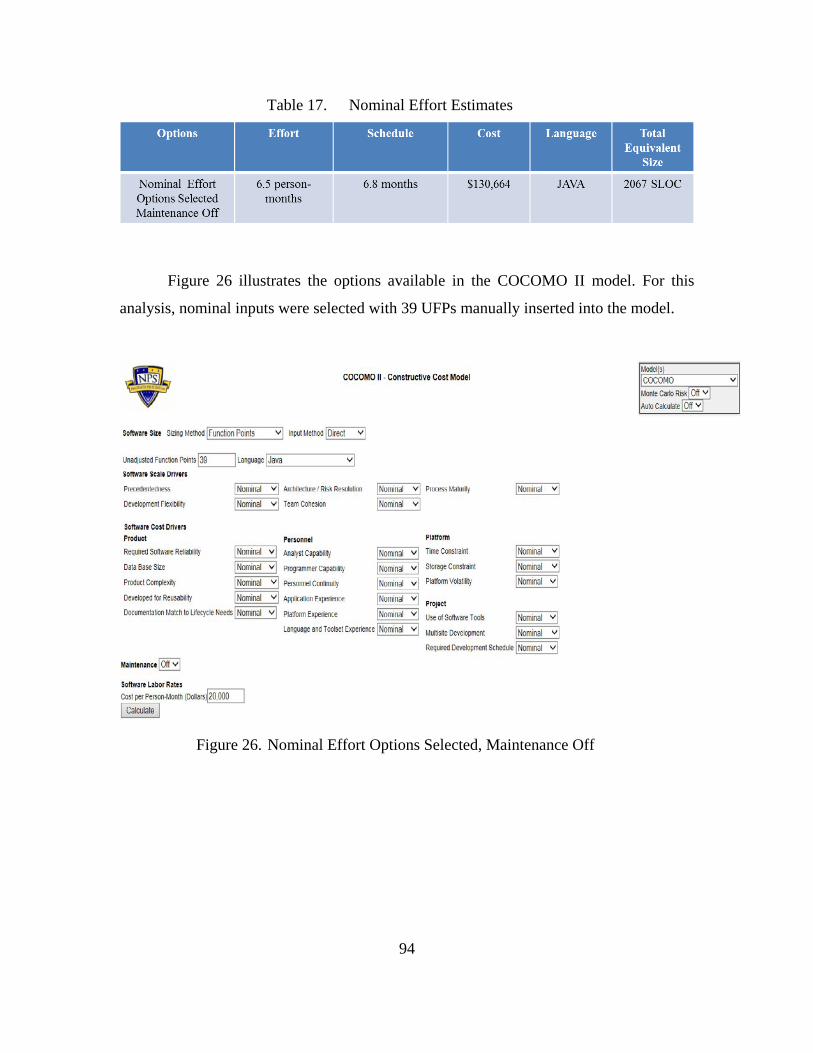
94
Table 17. Nominal Effort Estimates
Figure 26 illustrates the options available in the COCOMO II model. For this
analysis, nominal inputs were selected with 39 UFPs manually inserted into the model.
Figure 26. Nominal Effort Options Selected, Maintenance Off
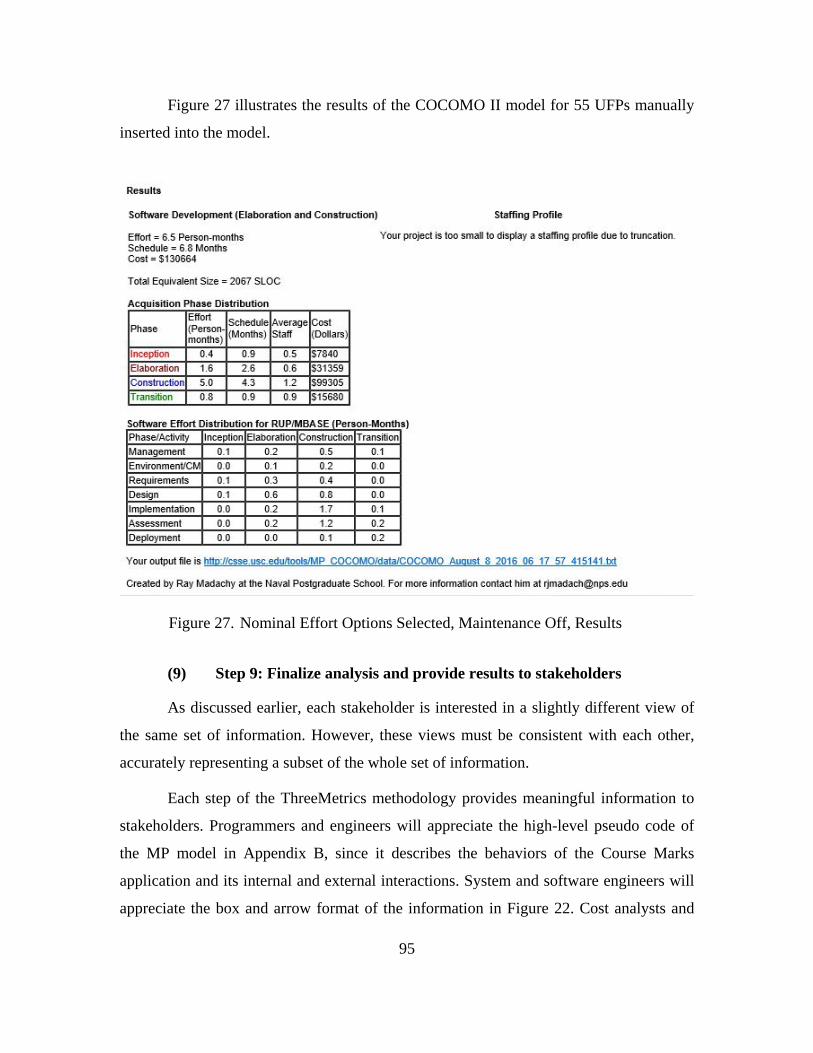
95
Figure 27 illustrates the results of the COCOMO II model for 55 UFPs manually
inserted into the model.
Figure 27. Nominal Effort Options Selected, Maintenance Off, Results
(9) Step 9: Finalize analysis and provide results to stakeholders
As discussed earlier, each stakeholder is interested in a slightly different view of
the same set of information. However, these views must be consistent with each other,
accurately representing a subset of the whole set of information.
Each step of the ThreeMetrics methodology provides meaningful information to
stakeholders. Programmers and engineers will appreciate the high-level pseudo code of
the MP model in Appendix B, since it describes the behaviors of the Course Marks
application and its internal and external interactions. System and software engineers will
appreciate the box and arrow format of the information in Figure 22. Cost analysts and
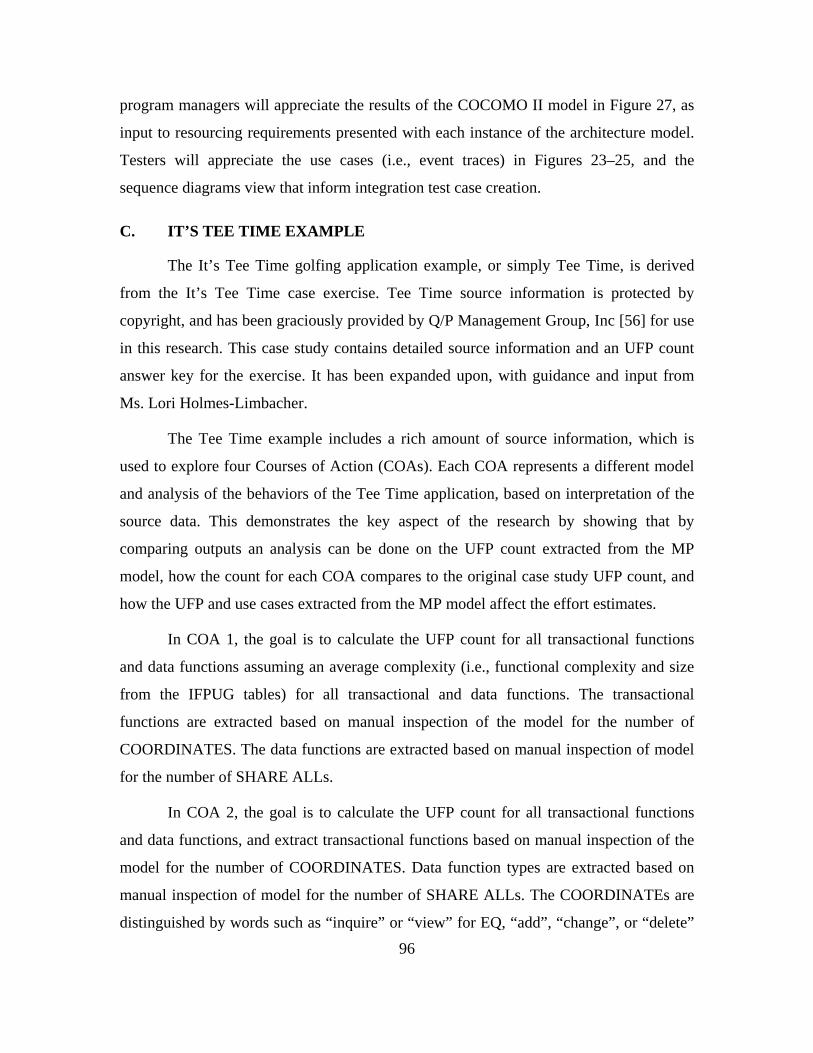
96
program managers will appreciate the results of the COCOMO II model in Figure 27, as
input to resourcing requirements presented with each instance of the architecture model.
Testers will appreciate the use cases (i.e., event traces) in Figures 23–25, and the
sequence diagrams view that inform integration test case creation.
C. IT’S TEE TIME EXAMPLE
The It’s Tee Time golfing application example, or simply Tee Time, is derived
from the It’s Tee Time case exercise. Tee Time source information is protected by
copyright, and has been graciously provided by Q/P Management Group, Inc [56] for use
in this research. This case study contains detailed source information and an UFP count
answer key for the exercise. It has been expanded upon, with guidance and input from
Ms. Lori Holmes-Limbacher.
The Tee Time example includes a rich amount of source information, which is
used to explore four Courses of Action (COAs). Each COA represents a different model
and analysis of the behaviors of the Tee Time application, based on interpretation of the
source data. This demonstrates the key aspect of the research by showing that by
comparing outputs an analysis can be done on the UFP count extracted from the MP
model, how the count for each COA compares to the original case study UFP count, and
how the UFP and use cases extracted from the MP model affect the effort estimates.
In COA 1, the goal is to calculate the UFP count for all transactional functions
and data functions assuming an average complexity (i.e., functional complexity and size
from the IFPUG tables) for all transactional and data functions. The transactional
functions are extracted based on manual inspection of the model for the number of
COORDINATES. The data functions are extracted based on manual inspection of model
for the number of SHARE ALLs.
In COA 2, the goal is to calculate the UFP count for all transactional functions
and data functions, and extract transactional functions based on manual inspection of the
model for the number of COORDINATES. Data function types are extracted based on
manual inspection of model for the number of SHARE ALLs. The COORDINATEs are
distinguished by words such as “inquire” or “view” for EQ, “add”, “change”, or “delete”
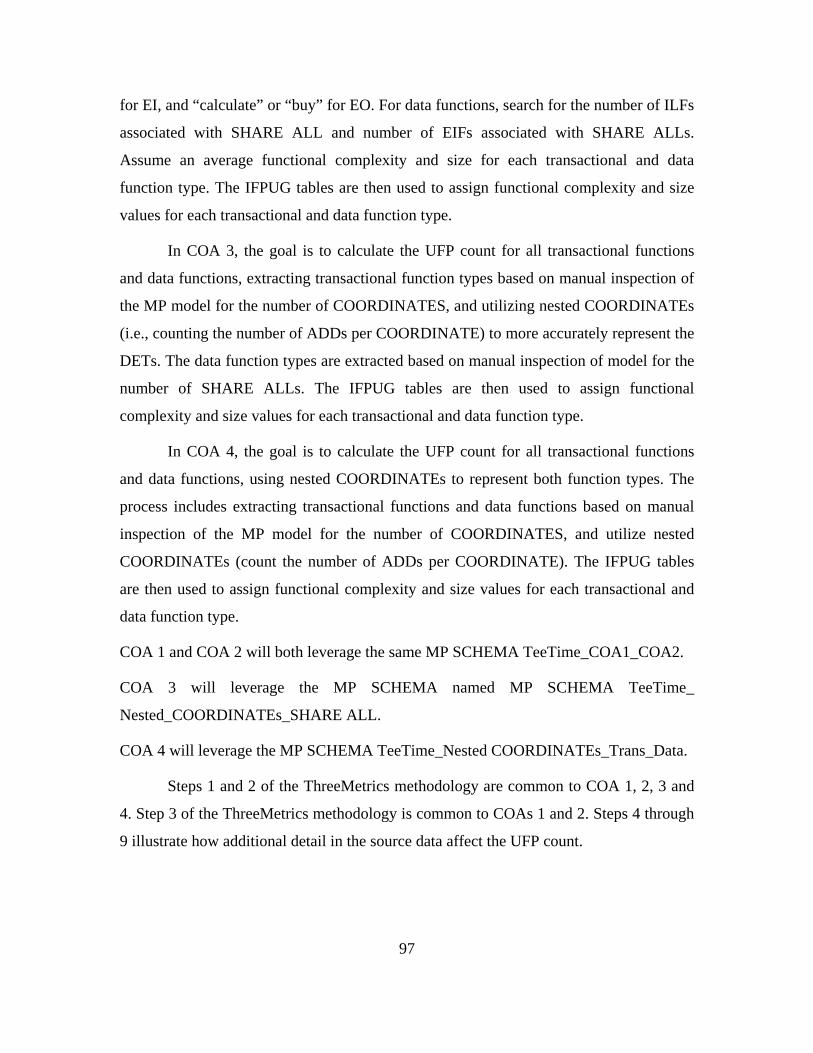
97
for EI, and “calculate” or “buy” for EO. For data functions, search for the number of ILFs
associated with SHARE ALL and number of EIFs associated with SHARE ALLs.
Assume an average functional complexity and size for each transactional and data
function type. The IFPUG tables are then used to assign functional complexity and size
values for each transactional and data function type.
In COA 3, the goal is to calculate the UFP count for all transactional functions
and data functions, extracting transactional function types based on manual inspection of
the MP model for the number of COORDINATES, and utilizing nested COORDINATEs
(i.e., counting the number of ADDs per COORDINATE) to more accurately represent the
DETs. The data function types are extracted based on manual inspection of model for the
number of SHARE ALLs. The IFPUG tables are then used to assign functional
complexity and size values for each transactional and data function type.
In COA 4, the goal is to calculate the UFP count for all transactional functions
and data functions, using nested COORDINATEs to represent both function types. The
process includes extracting transactional functions and data functions based on manual
inspection of the MP model for the number of COORDINATES, and utilize nested
COORDINATEs (count the number of ADDs per COORDINATE). The IFPUG tables
are then used to assign functional complexity and size values for each transactional and
data function type.
COA 1 and COA 2 will both leverage the same MP SCHEMA TeeTime_COA1_COA2.
COA 3 will leverage the MP SCHEMA named MP SCHEMA TeeTime_
Nested_COORDINATEs_SHARE ALL.
COA 4 will leverage the MP SCHEMA TeeTime_Nested COORDINATEs_Trans_Data.
Steps 1 and 2 of the ThreeMetrics methodology are common to COA 1, 2, 3 and
4. Step 3 of the ThreeMetrics methodology is common to COAs 1 and 2. Steps 4 through
9 illustrate how additional detail in the source data affect the UFP count.
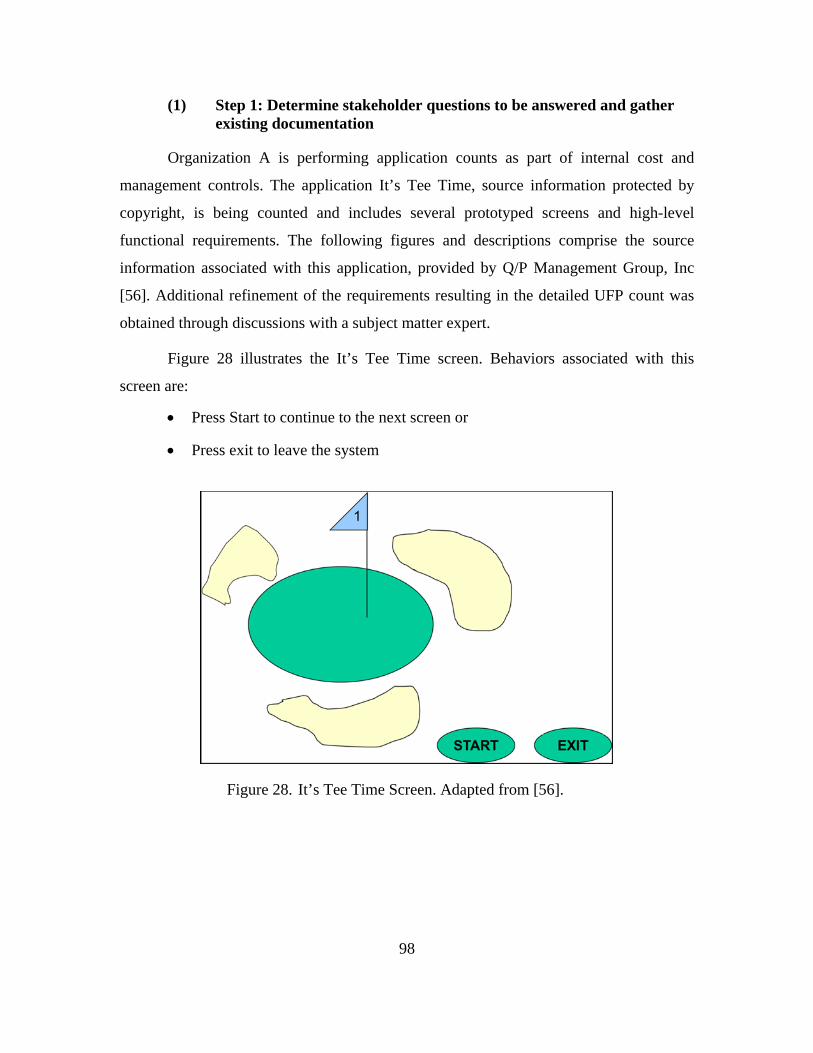
98
(1) Step 1: Determine stakeholder questions to be answered and gather existing documentation
Organization A is performing application counts as part of internal cost and
management controls. The application It’s Tee Time, source information protected by
copyright, is being counted and includes several prototyped screens and high-level
functional requirements. The following figures and descriptions comprise the source
information associated with this application, provided by Q/P Management Group, Inc
[56]. Additional refinement of the requirements resulting in the detailed UFP count was
obtained through discussions with a subject matter expert.
Figure 28 illustrates the It’s Tee Time screen. Behaviors associated with this
screen are:
• Press Start to continue to the next screen or
• Press exit to leave the system
Figure 28. It’s Tee Time Screen. Adapted from [56].
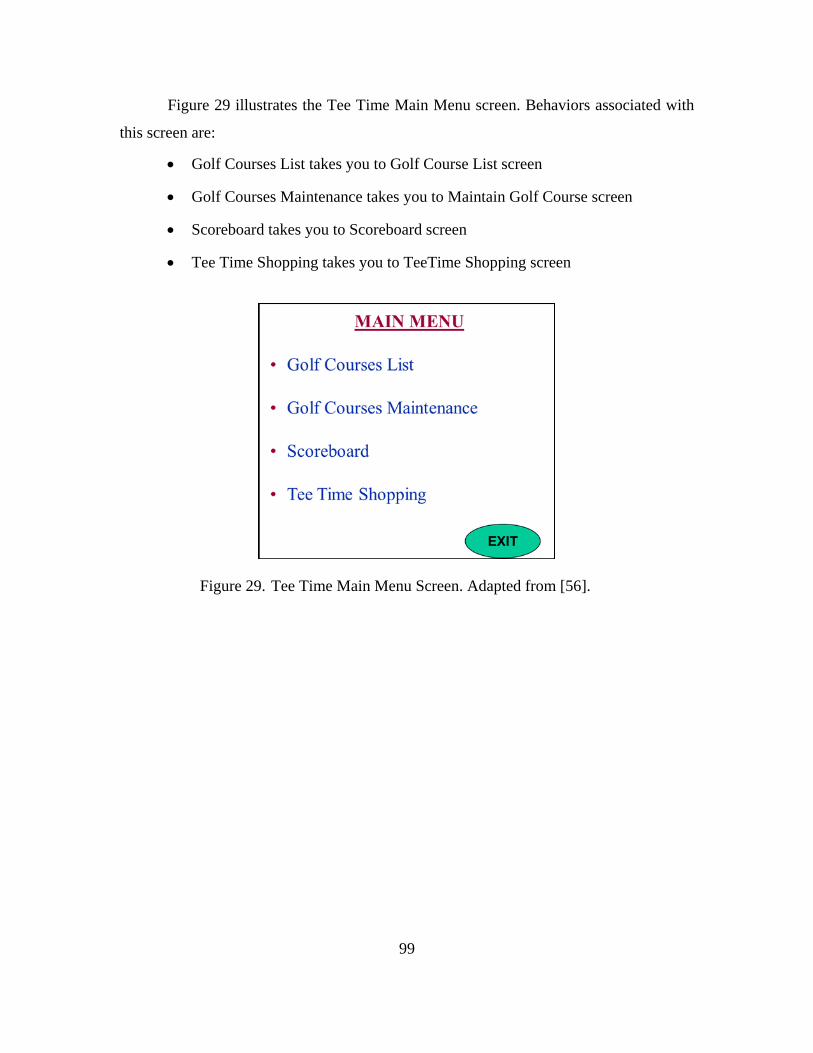
99
Figure 29 illustrates the Tee Time Main Menu screen. Behaviors associated with
this screen are:
• Golf Courses List takes you to Golf Course List screen
• Golf Courses Maintenance takes you to Maintain Golf Course screen
• Scoreboard takes you to Scoreboard screen
• Tee Time Shopping takes you to TeeTime Shopping screen
Figure 29. Tee Time Main Menu Screen. Adapted from [56].
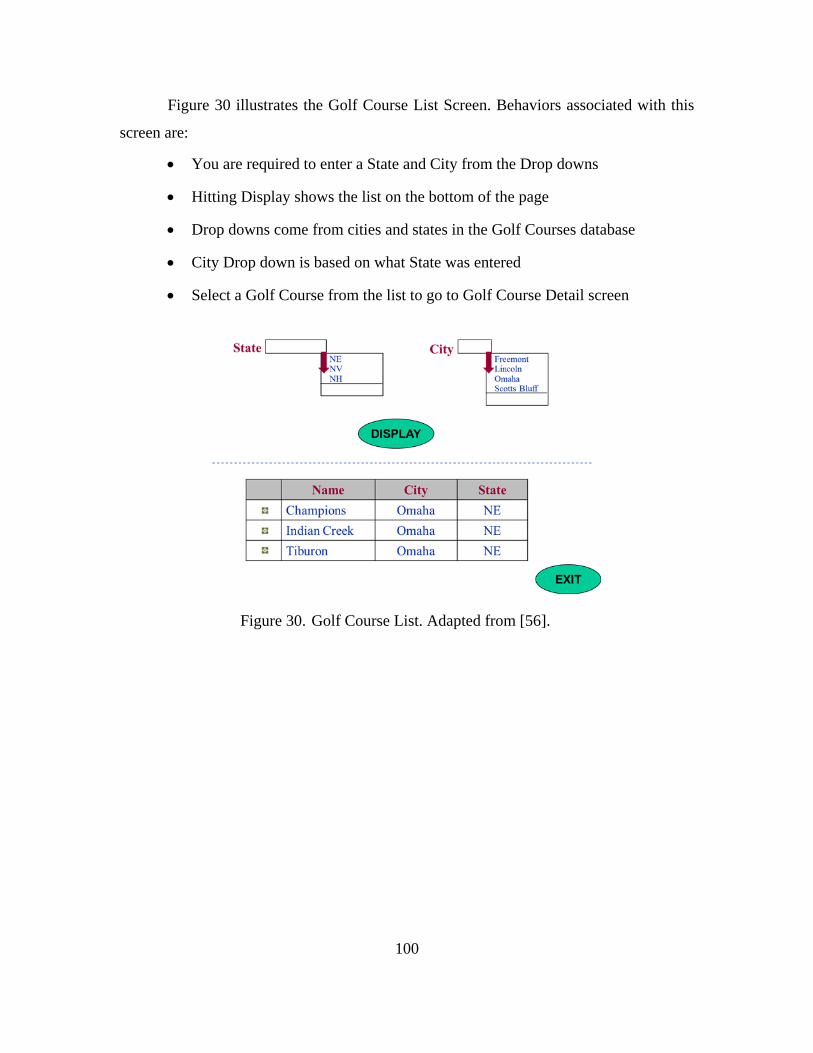
100
Figure 30 illustrates the Golf Course List Screen. Behaviors associated with this
screen are:
• You are required to enter a State and City from the Drop downs
• Hitting Display shows the list on the bottom of the page
• Drop downs come from cities and states in the Golf Courses database
• City Drop down is based on what State was entered
• Select a Golf Course from the list to go to Golf Course Detail screen
Figure 30. Golf Course List. Adapted from [56].
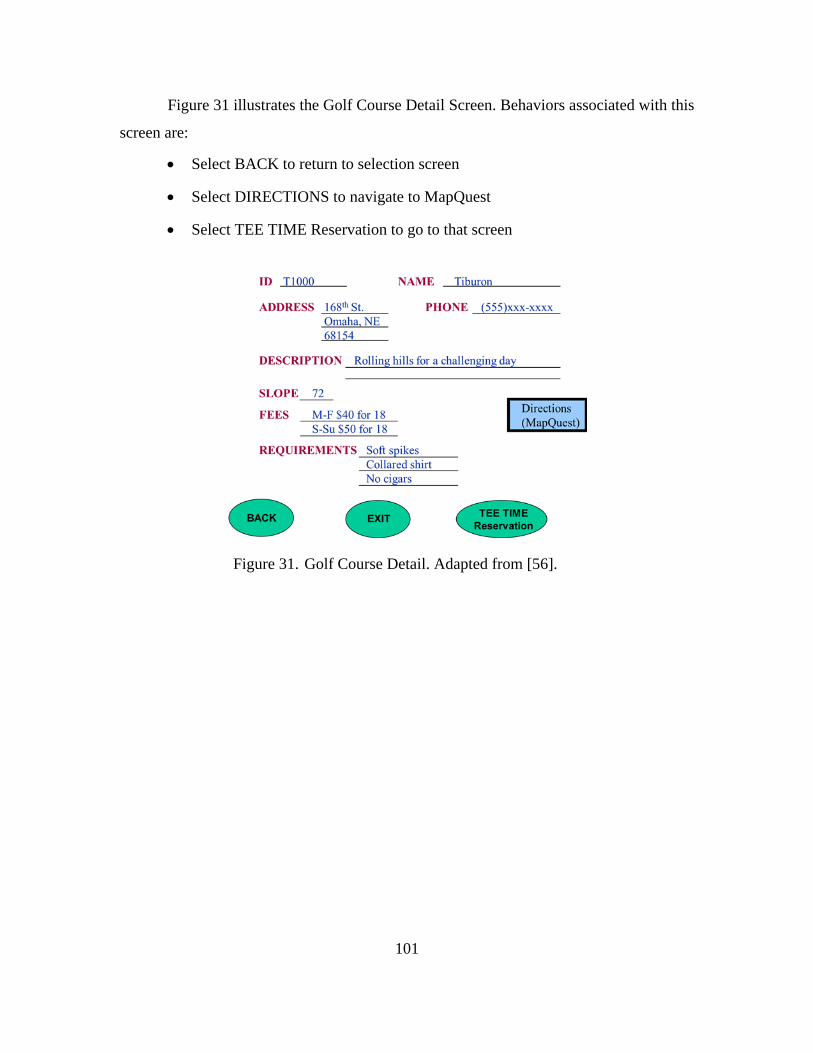
101
Figure 31 illustrates the Golf Course Detail Screen. Behaviors associated with this
screen are:
• Select BACK to return to selection screen
• Select DIRECTIONS to navigate to MapQuest
• Select TEE TIME Reservation to go to that screen
Figure 31. Golf Course Detail. Adapted from [56].
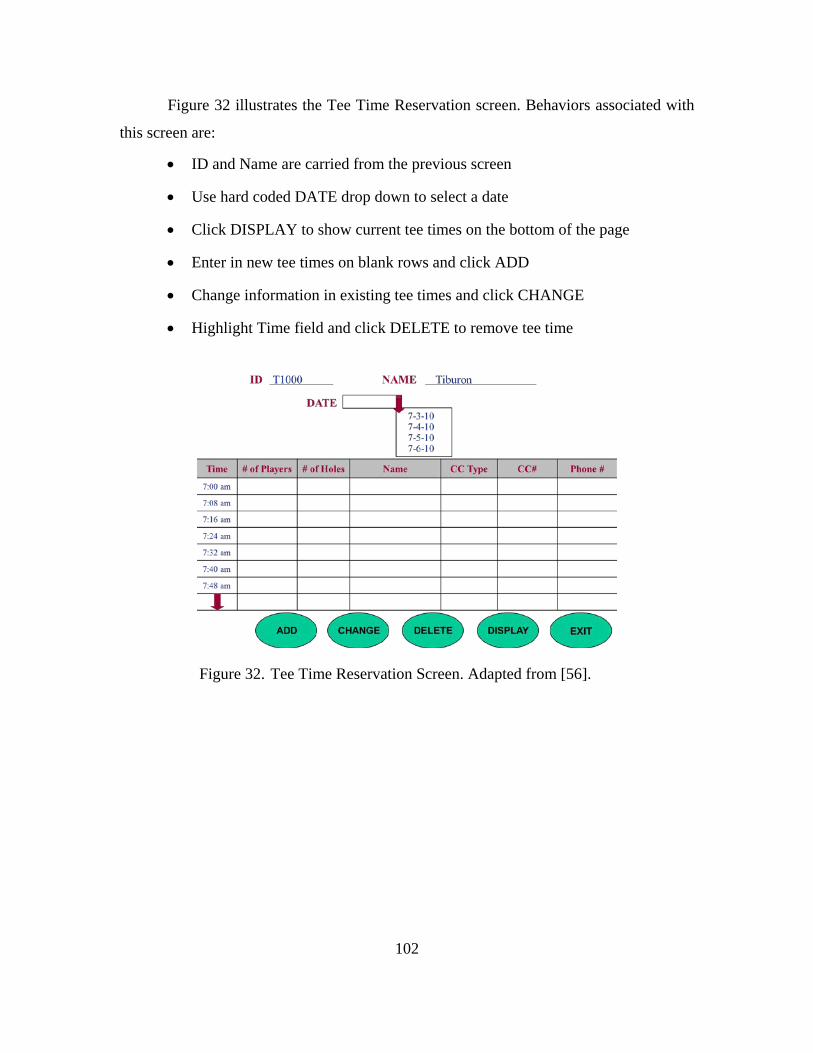
102
Figure 32 illustrates the Tee Time Reservation screen. Behaviors associated with
this screen are:
• ID and Name are carried from the previous screen
• Use hard coded DATE drop down to select a date
• Click DISPLAY to show current tee times on the bottom of the page
• Enter in new tee times on blank rows and click ADD
• Change information in existing tee times and click CHANGE
• Highlight Time field and click DELETE to remove tee time
Figure 32. Tee Time Reservation Screen. Adapted from [56].
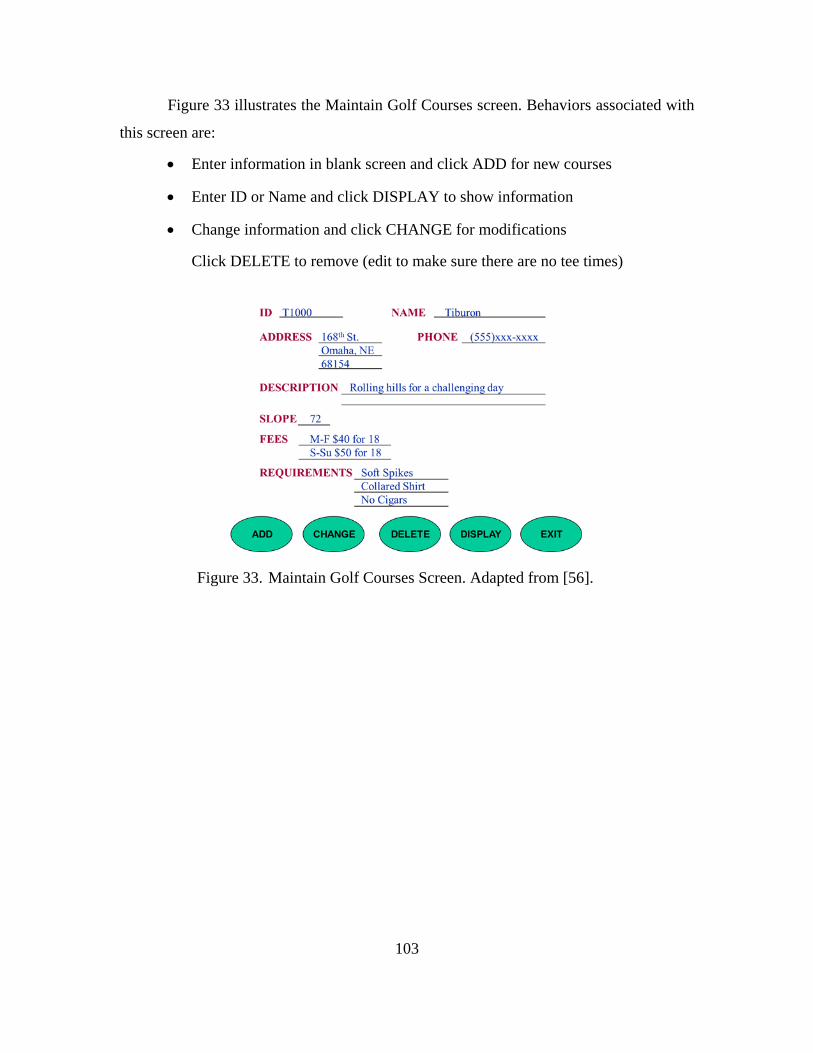
103
Figure 33 illustrates the Maintain Golf Courses screen. Behaviors associated with
this screen are:
• Enter information in blank screen and click ADD for new courses
• Enter ID or Name and click DISPLAY to show information
• Change information and click CHANGE for modifications
Click DELETE to remove (edit to make sure there are no tee times)
Figure 33. Maintain Golf Courses Screen. Adapted from [56].
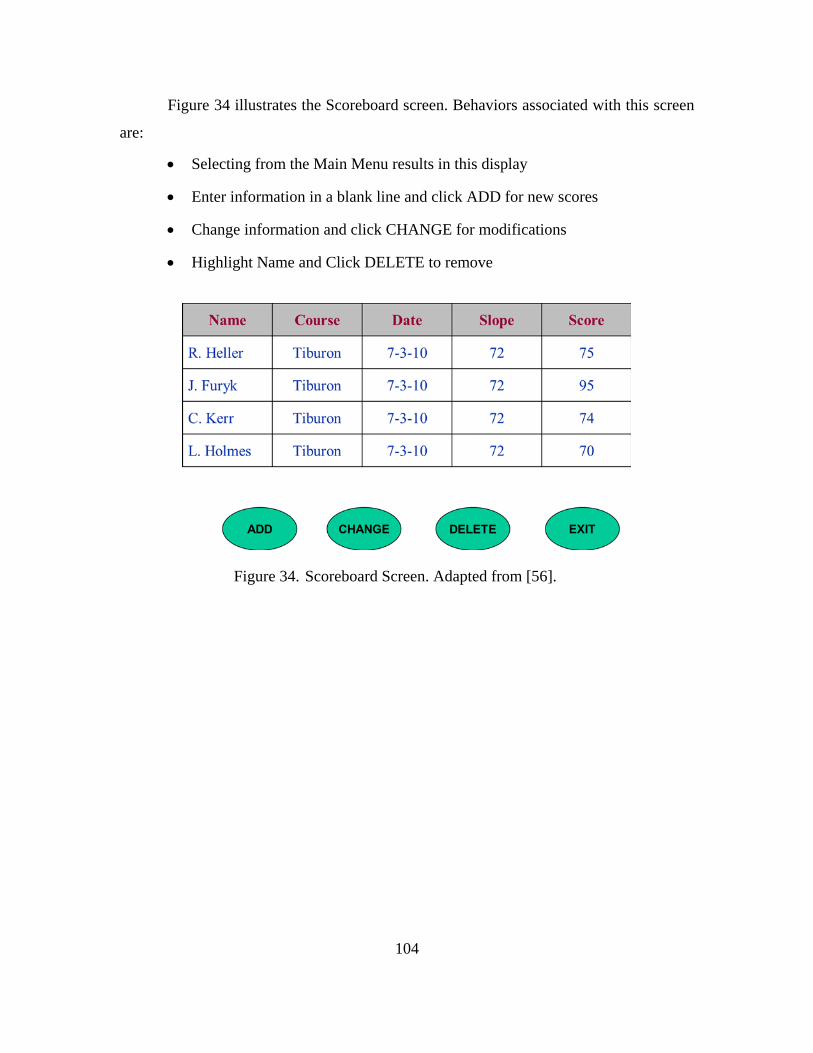
104
Figure 34 illustrates the Scoreboard screen. Behaviors associated with this screen
are:
• Selecting from the Main Menu results in this display
• Enter information in a blank line and click ADD for new scores
• Change information and click CHANGE for modifications
• Highlight Name and Click DELETE to remove
Figure 34. Scoreboard Screen. Adapted from [56].
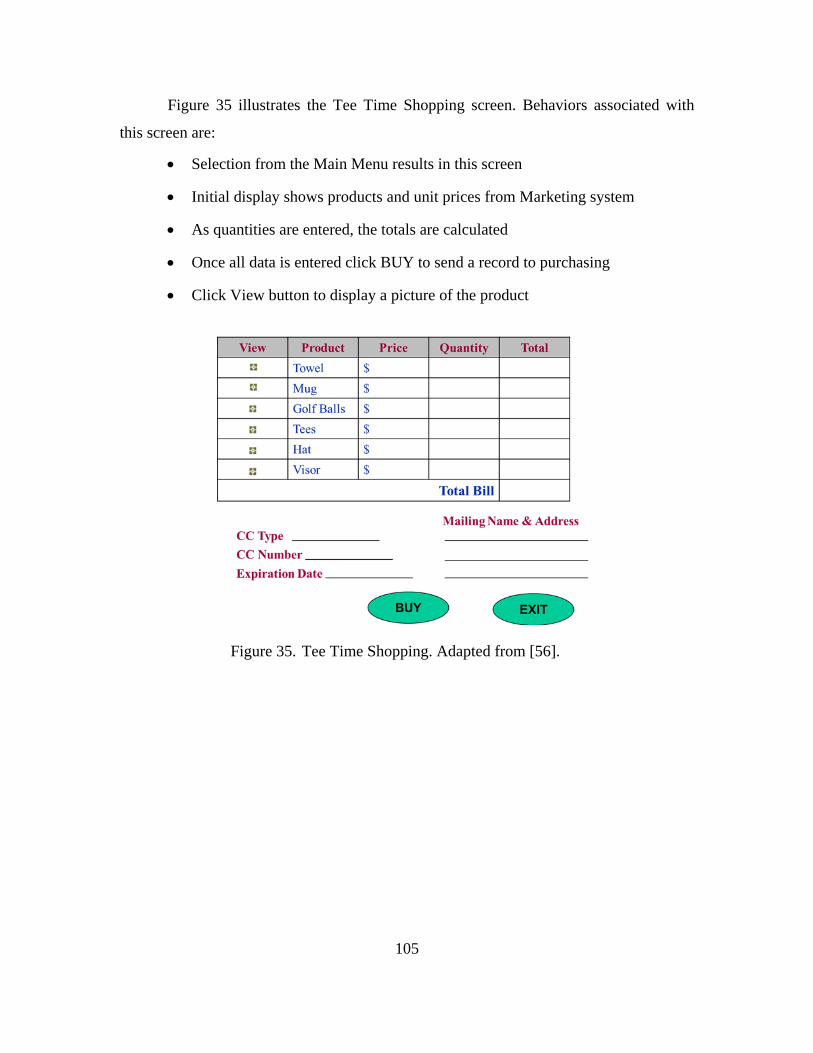
105
Figure 35 illustrates the Tee Time Shopping screen. Behaviors associated with
this screen are:
• Selection from the Main Menu results in this screen
• Initial display shows products and unit prices from Marketing system
• As quantities are entered, the totals are calculated
• Once all data is entered click BUY to send a record to purchasing
• Click View button to display a picture of the product
Figure 35. Tee Time Shopping. Adapted from [56].
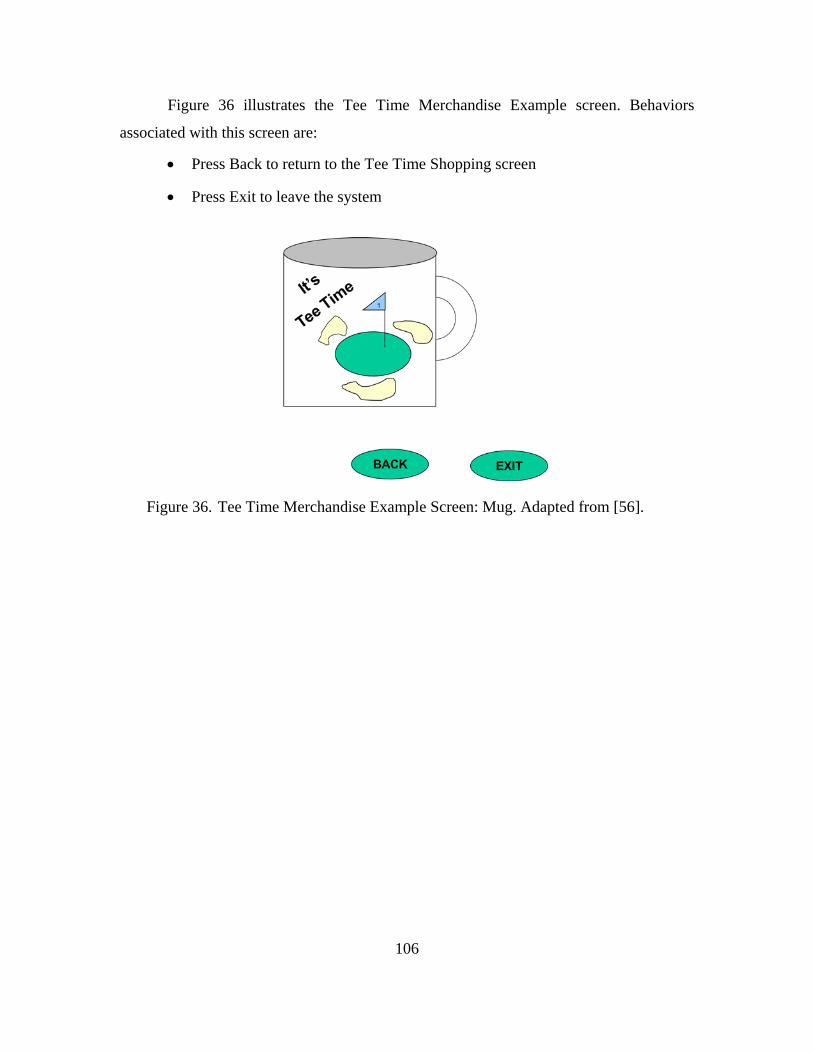
106
Figure 36 illustrates the Tee Time Merchandise Example screen. Behaviors
associated with this screen are:
• Press Back to return to the Tee Time Shopping screen
• Press Exit to leave the system
Figure 36. Tee Time Merchandise Example Screen: Mug. Adapted from [56].
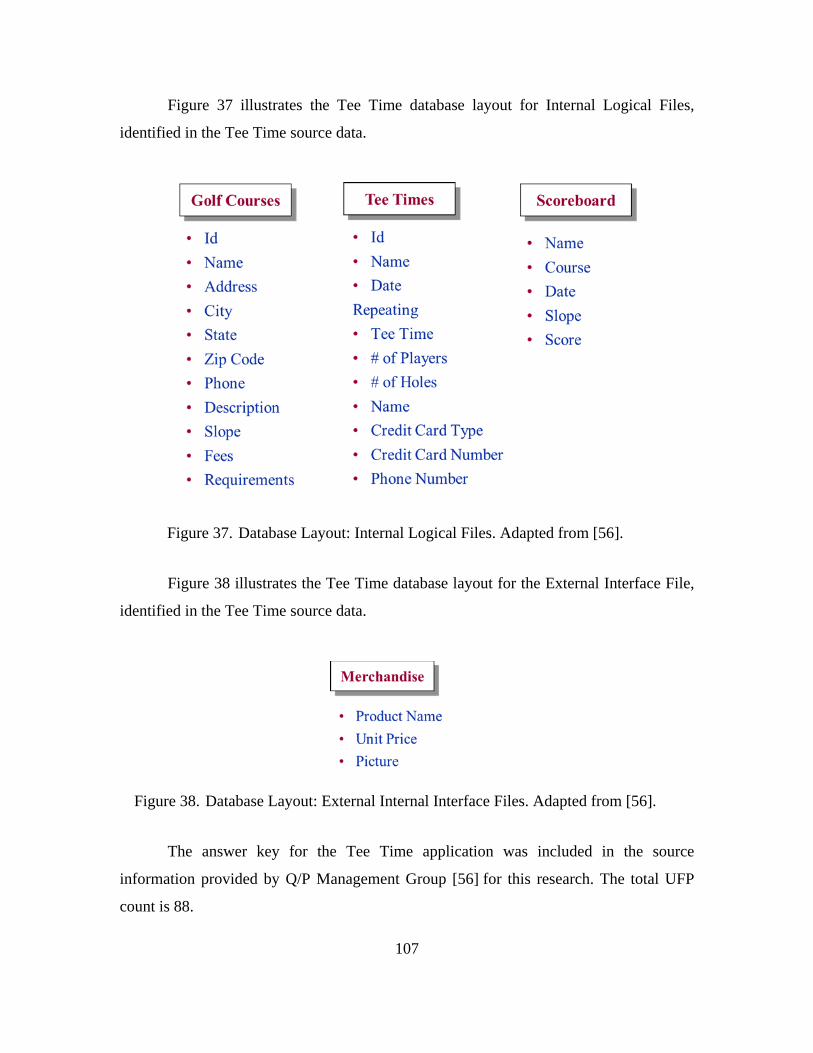
107
Figure 37 illustrates the Tee Time database layout for Internal Logical Files,
identified in the Tee Time source data.
Figure 37. Database Layout: Internal Logical Files. Adapted from [56].
Figure 38 illustrates the Tee Time database layout for the External Interface File,
identified in the Tee Time source data.
Figure 38. Database Layout: External Internal Interface Files. Adapted from [56].
The answer key for the Tee Time application was included in the source
information provided by Q/P Management Group [56] for this research. The total UFP
count is 88.
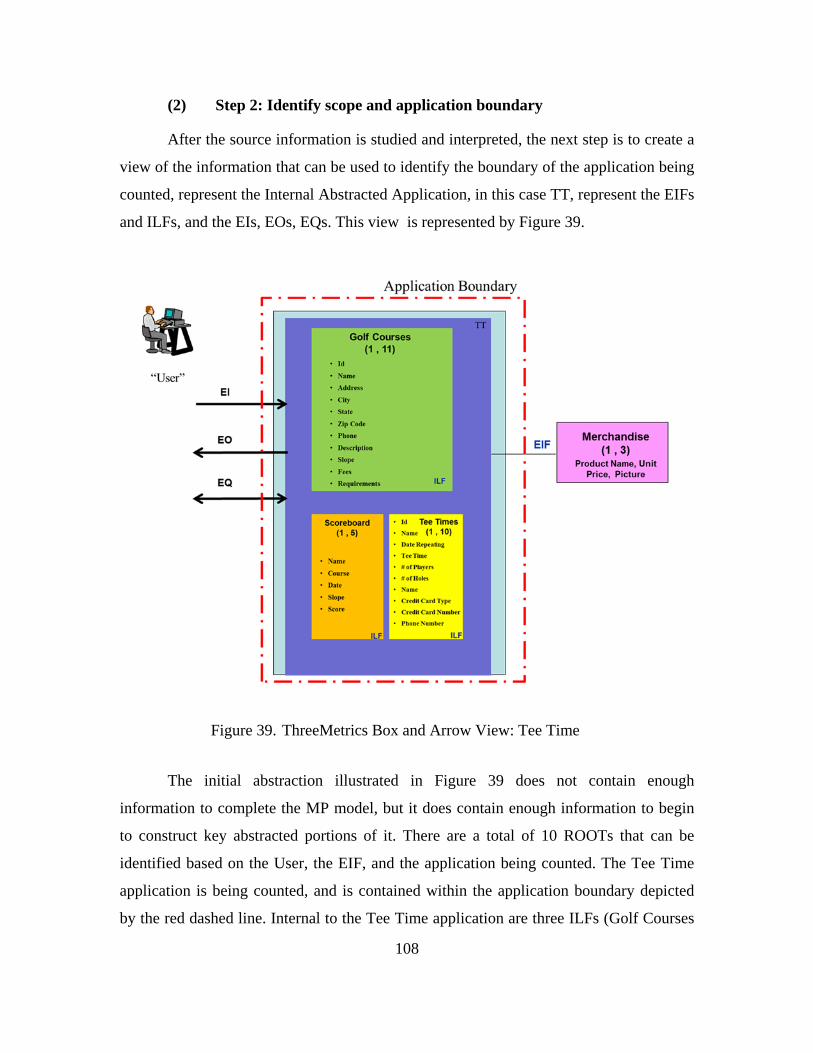
108
(2) Step 2: Identify scope and application boundary
After the source information is studied and interpreted, the next step is to create a
view of the information that can be used to identify the boundary of the application being
counted, represent the Internal Abstracted Application, in this case TT, represent the EIFs
and ILFs, and the EIs, EOs, EQs. This view is represented by Figure 39.
Figure 39. ThreeMetrics Box and Arrow View: Tee Time
The initial abstraction illustrated in Figure 39 does not contain enough
information to complete the MP model, but it does contain enough information to begin
to construct key abstracted portions of it. There are a total of 10 ROOTs that can be
identified based on the User, the EIF, and the application being counted. The Tee Time
application is being counted, and is contained within the application boundary depicted
by the red dashed line. Internal to the Tee Time application are three ILFs (Golf Courses
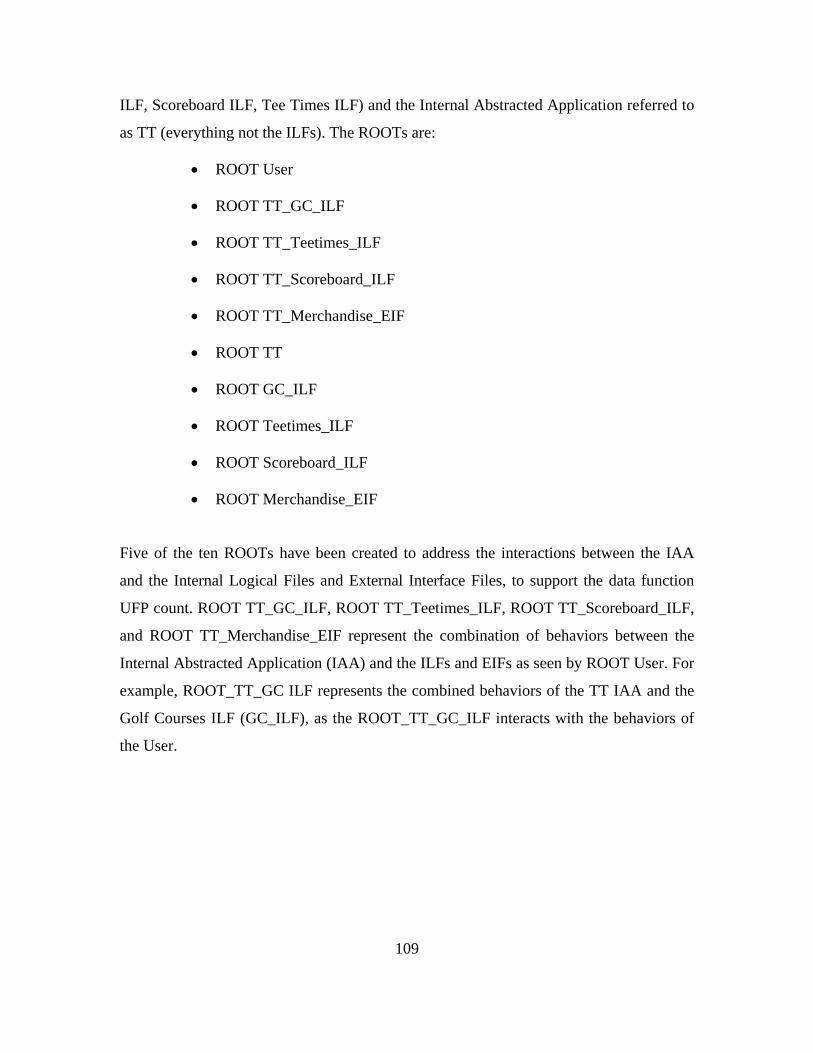
109
ILF, Scoreboard ILF, Tee Times ILF) and the Internal Abstracted Application referred to
as TT (everything not the ILFs). The ROOTs are:
• ROOT User
• ROOT TT_GC_ILF
• ROOT TT_Teetimes_ILF
• ROOT TT_Scoreboard_ILF
• ROOT TT_Merchandise_EIF
• ROOT TT
• ROOT GC_ILF
• ROOT Teetimes_ILF
• ROOT Scoreboard_ILF
• ROOT Merchandise_EIF
Five of the ten ROOTs have been created to address the interactions between the IAA
and the Internal Logical Files and External Interface Files, to support the data function
UFP count. ROOT TT_GC_ILF, ROOT TT_Teetimes_ILF, ROOT TT_Scoreboard_ILF,
and ROOT TT_Merchandise_EIF represent the combination of behaviors between the
Internal Abstracted Application (IAA) and the ILFs and EIFs as seen by ROOT User. For
example, ROOT_TT_GC ILF represents the combined behaviors of the TT IAA and the
Golf Courses ILF (GC_ILF), as the ROOT_TT_GC_ILF interacts with the behaviors of
the User.
110
(3) Step 3: Develop MP model
COA 1 and COA 2 share the same MP model named MP SCHEMA
TeeTime_COA1_COA2, but the MP model is inspected differently, resulting in different
UFP counts. COA 2 takes advantage of source information to create more precise
descriptions of behaviors, and then uses key words in the inspections process to assist in
determining the overall UFP count.
COA 3 uses MP SCHEMA TeeTime_ Nested_COORDINATEs_SHARE ALL
named introduces the use of nested COORDINATEs for transactional function types. The
data functions are still represented by SHARE ALL.
COA 4 leverages MP SCHEMA TeeTime_Nested COORDINATEs_Trans_Data.
The MP schema from COA 3 is re-used for transactional function types, but the
behaviors of the data function types are represented using nested COORDINATEs.
COA 1 and COA 2: For COA 1 and COA 2, the behaviors of each ROOT are
captured by specific activities associated with each ROOT, as described by the
requirements, supporting information, and the ThreeMetrics box and arrows
representation. The interactions between the User, the IAA, and the ILFs and EIF are
captured by utilizing the COORDINATE composition operation for the transactional
functions and SHARE ALL composition operation for the data functions. An average
functional complexity and size are assumed for the transactional and data function types.
The behaviors of the ROOTs are described using specific words associated with
transactional function types EI, EO, EQ.
• If the words inquire_on are used in the description of a behavior, then the behavior is associated with an EQ.
• If the words input_add, input_change, or input_delete are used in the description of a behavior, then the behavior is associated with an EI.
• If the word calculate is used in the description of a behaviors, then the behavior is associated with an EO.
The assignment of an EI, EO, or EQ to a COORDINATE is based on the high-
level pseudo code used to describe the behaviors. This becomes important when
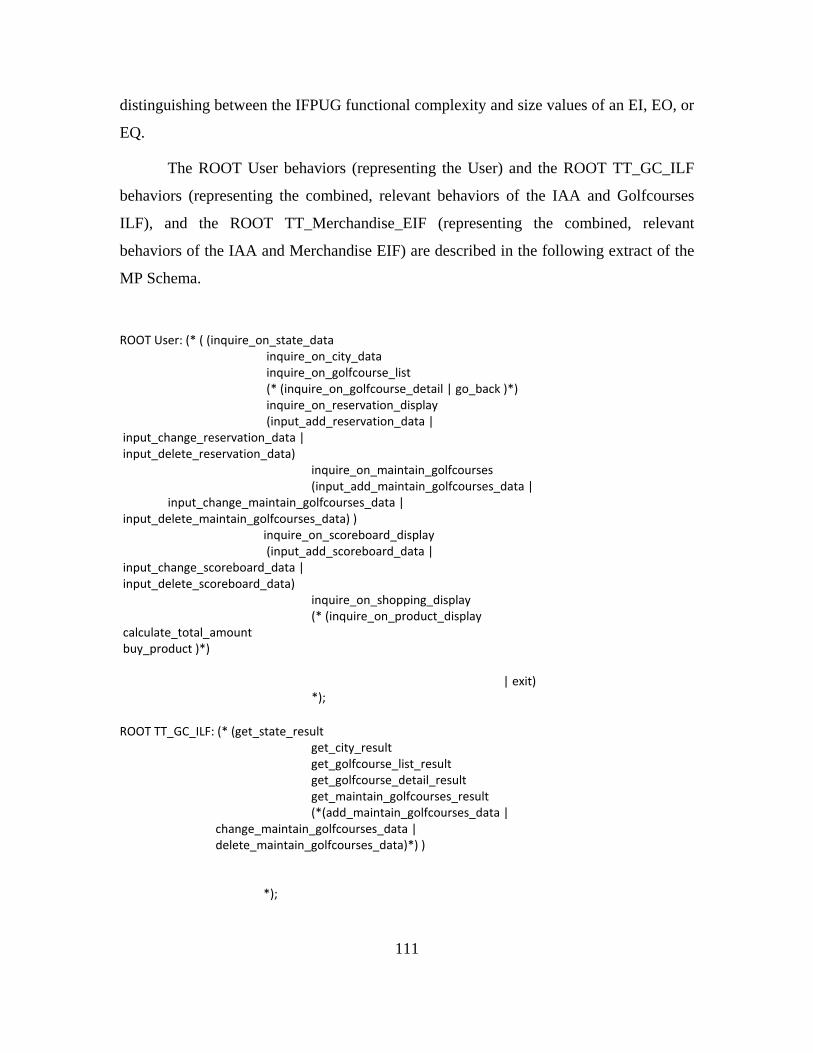
111
distinguishing between the IFPUG functional complexity and size values of an EI, EO, or
EQ.
The ROOT User behaviors (representing the User) and the ROOT TT_GC_ILF
behaviors (representing the combined, relevant behaviors of the IAA and Golfcourses
ILF), and the ROOT TT_Merchandise_EIF (representing the combined, relevant
behaviors of the IAA and Merchandise EIF) are described in the following extract of the
MP Schema.
ROOT User: (* ( (inquire_on_state_data inquire_on_city_data inquire_on_golfcourse_list (* (inquire_on_golfcourse_detail | go_back )*) inquire_on_reservation_display (input_add_reservation_data | input_change_reservation_data | input_delete_reservation_data) inquire_on_maintain_golfcourses (input_add_maintain_golfcourses_data | input_change_maintain_golfcourses_data | input_delete_maintain_golfcourses_data) ) inquire_on_scoreboard_display (input_add_scoreboard_data | input_change_scoreboard_data | input_delete_scoreboard_data) inquire_on_shopping_display (* (inquire_on_product_display calculate_total_amount buy_product )*) | exit) *); ROOT TT_GC_ILF: (* (get_state_result get_city_result get_golfcourse_list_result get_golfcourse_detail_result get_maintain_golfcourses_result (*(add_maintain_golfcourses_data | change_maintain_golfcourses_data | delete_maintain_golfcourses_data)*) ) *);
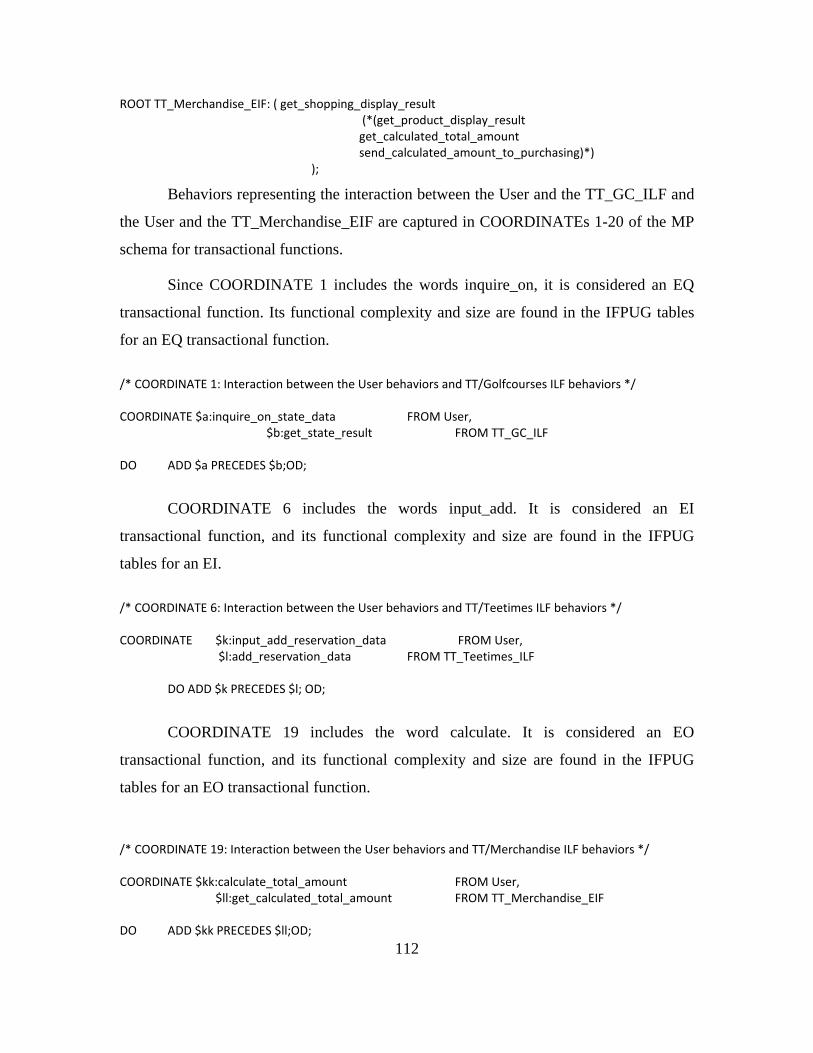
112
ROOT TT_Merchandise_EIF: ( get_shopping_display_result (*(get_product_display_result get_calculated_total_amount send_calculated_amount_to_purchasing)*) );
Behaviors representing the interaction between the User and the TT_GC_ILF and
the User and the TT_Merchandise_EIF are captured in COORDINATEs 1-20 of the MP
schema for transactional functions.
Since COORDINATE 1 includes the words inquire_on, it is considered an EQ
transactional function. Its functional complexity and size are found in the IFPUG tables
for an EQ transactional function.
/* COORDINATE 1: Interaction between the User behaviors and TT/Golfcourses ILF behaviors */ COORDINATE $a:inquire_on_state_data FROM User, $b:get_state_result FROM TT_GC_ILF DO ADD $a PRECEDES $b;OD;
COORDINATE 6 includes the words input_add. It is considered an EI
transactional function, and its functional complexity and size are found in the IFPUG
tables for an EI.
/* COORDINATE 6: Interaction between the User behaviors and TT/Teetimes ILF behaviors */ COORDINATE $k:input_add_reservation_data FROM User, $l:add_reservation_data FROM TT_Teetimes_ILF DO ADD $k PRECEDES $l; OD;
COORDINATE 19 includes the word calculate. It is considered an EO
transactional function, and its functional complexity and size are found in the IFPUG
tables for an EO transactional function.
/* COORDINATE 19: Interaction between the User behaviors and TT/Merchandise ILF behaviors */ COORDINATE $kk:calculate_total_amount FROM User, $ll:get_calculated_total_amount FROM TT_Merchandise_EIF DO ADD $kk PRECEDES $ll;OD;
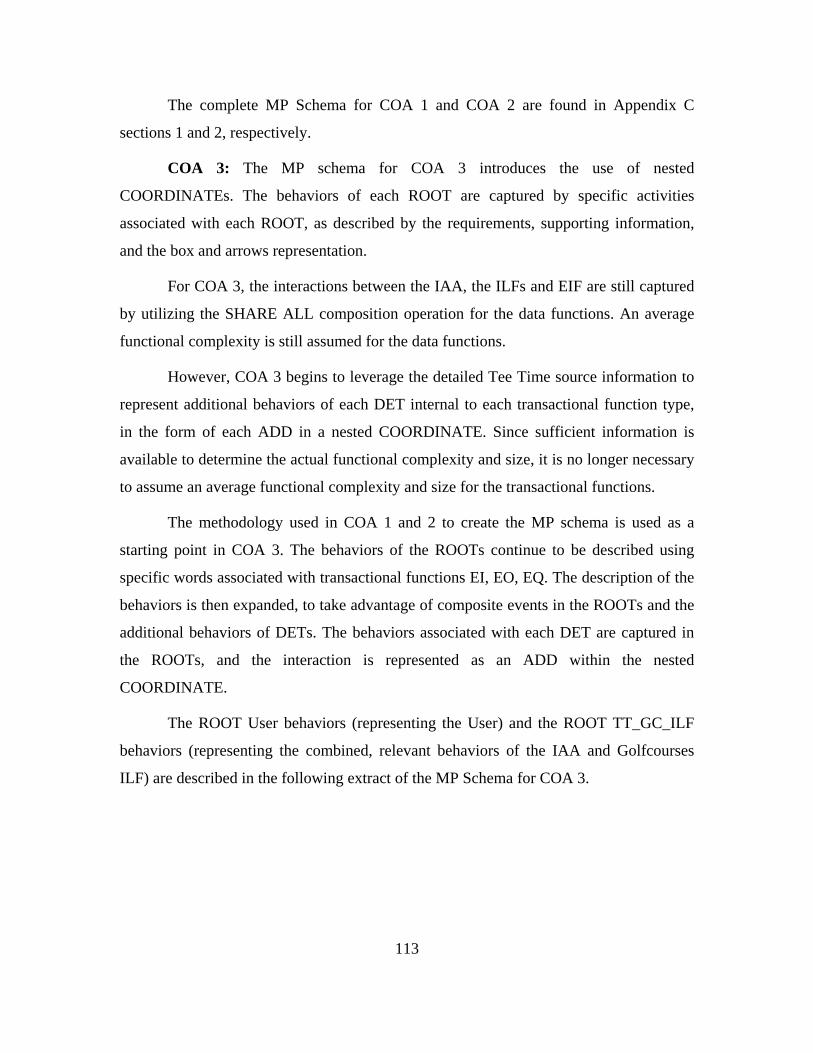
113
The complete MP Schema for COA 1 and COA 2 are found in Appendix C
sections 1 and 2, respectively.
COA 3: The MP schema for COA 3 introduces the use of nested
COORDINATEs. The behaviors of each ROOT are captured by specific activities
associated with each ROOT, as described by the requirements, supporting information,
and the box and arrows representation.
For COA 3, the interactions between the IAA, the ILFs and EIF are still captured
by utilizing the SHARE ALL composition operation for the data functions. An average
functional complexity is still assumed for the data functions.
However, COA 3 begins to leverage the detailed Tee Time source information to
represent additional behaviors of each DET internal to each transactional function type,
in the form of each ADD in a nested COORDINATE. Since sufficient information is
available to determine the actual functional complexity and size, it is no longer necessary
to assume an average functional complexity and size for the transactional functions.
The methodology used in COA 1 and 2 to create the MP schema is used as a
starting point in COA 3. The behaviors of the ROOTs continue to be described using
specific words associated with transactional functions EI, EO, EQ. The description of the
behaviors is then expanded, to take advantage of composite events in the ROOTs and the
additional behaviors of DETs. The behaviors associated with each DET are captured in
the ROOTs, and the interaction is represented as an ADD within the nested
COORDINATE.
The ROOT User behaviors (representing the User) and the ROOT TT_GC_ILF
behaviors (representing the combined, relevant behaviors of the IAA and Golfcourses
ILF) are described in the following extract of the MP Schema for COA 3.
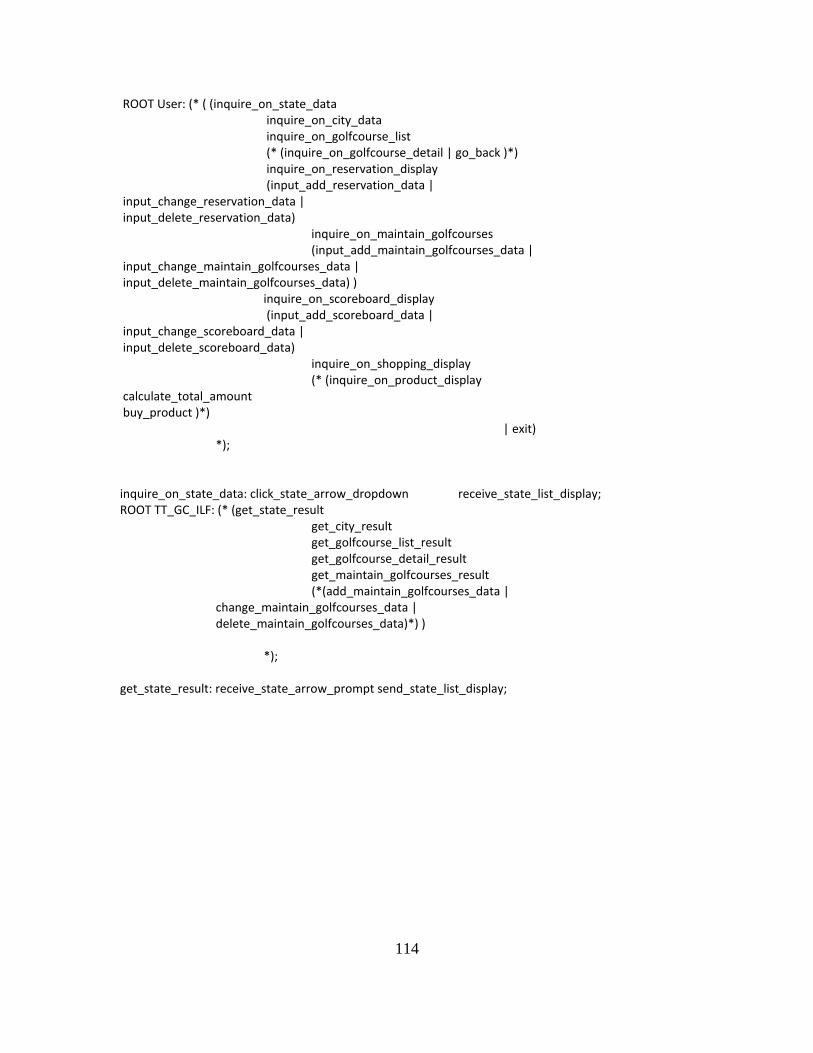
114
ROOT User: (* ( (inquire_on_state_data inquire_on_city_data inquire_on_golfcourse_list (* (inquire_on_golfcourse_detail | go_back )*) inquire_on_reservation_display (input_add_reservation_data | input_change_reservation_data | input_delete_reservation_data) inquire_on_maintain_golfcourses (input_add_maintain_golfcourses_data | input_change_maintain_golfcourses_data | input_delete_maintain_golfcourses_data) ) inquire_on_scoreboard_display (input_add_scoreboard_data | input_change_scoreboard_data | input_delete_scoreboard_data) inquire_on_shopping_display (* (inquire_on_product_display calculate_total_amount buy_product )*) | exit) *); inquire_on_state_data: click_state_arrow_dropdown receive_state_list_display; ROOT TT_GC_ILF: (* (get_state_result get_city_result get_golfcourse_list_result get_golfcourse_detail_result get_maintain_golfcourses_result (*(add_maintain_golfcourses_data | change_maintain_golfcourses_data | delete_maintain_golfcourses_data)*) ) *); get_state_result: receive_state_arrow_prompt send_state_list_display;
115
The composite events inquire_on_state_data from ROOT User and
get_state_result from ROOT TT_GC_ILF contain additional behaviors which are
captured in COORDINATE 1 of the MP SCHEMA for COA 3.
COA 3 COORDINATE 1 represents the interaction between the User composite
event behavior inquire_on_state_data and the TT_GC_ILF composite event behavior
get_state_result. The interactions of the behaviors of the composite events are represented
in the nested COORDINATE, with 2 ADDs representing 2 DETs. One FTR is assumed,
based on the source information. For the EI COORDINATE #12, two FTRs are
referenced, but since it would not affect the functional size or complexity, it was
represented in the model as 1 FTR.
/* COORDINATE 1: Interaction between the User behaviors and TT/Golfcourses ILF behaviors , and nested COORDINATE with 2 ADDs representing 2 DETs */ COORDINATE $a:inquire_on_state_data FROM User, $b:get_state_result FROM TT_GC_ILF DO COORDINATE $ax: click_state_arrow_dropdown FROM $a, $bx: receive_state_arrow_prompt FROM $b, $axx: receive_state_list_display FROM $a, $bxx: send_state_list_display FROM $b DO ADD $ax PRECEDES $bx; ADD $bxx PRECEDES $axx; OD; OD;
The two ADDs in COORDINATE 1 represent two DETs. The MP schema for
COA 3 contains 20 COORDINATEs each with a functional complexity and size
determined by the number of ADDs representing DETs. 1 FTR is used for the DETs
associated with each COORDINATE.
As in COAs 1 and 2, the data functions for COA 3 are represented by SHARE
ALL with an average functional complexity and size. The complete MP model for COA
3 is described in Appendix C Section 3.
116
The MP schema for COA 4 is named SCHEMA It Is Tee Time Nested
COORDINATEs For transactional and data Functions. COA 4 leverages all the detailed
source information from It’s Tee Time, to represent the additional behaviors internal to
each transactional function and data function, in the form of each DET in a nested
COORDINATE. Since sufficient information is available to determine the actual
functional complexity and size, it is not necessary to assume an average functional
complexity and size for transactional functions or data functions.
The methodology used in COA 1 and 2 and 3 to create the MP schema is used as
a starting point in COA 4. The behaviors of the ROOTs continue to be described using
specific words associated with transactional functions EI, EO, EQ. The descriptions take
advantage of composite events in the ROOTs and the additional behaviors of DETs. Each
DET is represented as an ADD within the nested COORDINATE of a transactional
function.
COA 4: For COA 4, the same approach used for transactional function types is
applied to the data function types, using additional descriptive terms to describe the data
function types. COA 4 contains COORDINATEs 21–24, representing the data functions.
For example, ROOT TT represents the relevant behaviors of the IAA, including
the composite event “request”. ROOT GC_ILF represents the relevant behaviors of the
Golfcourses ILF including the composite event “respond.”
COORDINATE 21 represents the interaction between the TT IAA and the
GC_ILF, and is a nested COORDINATE with 11 ADDs representing 11 DETs.
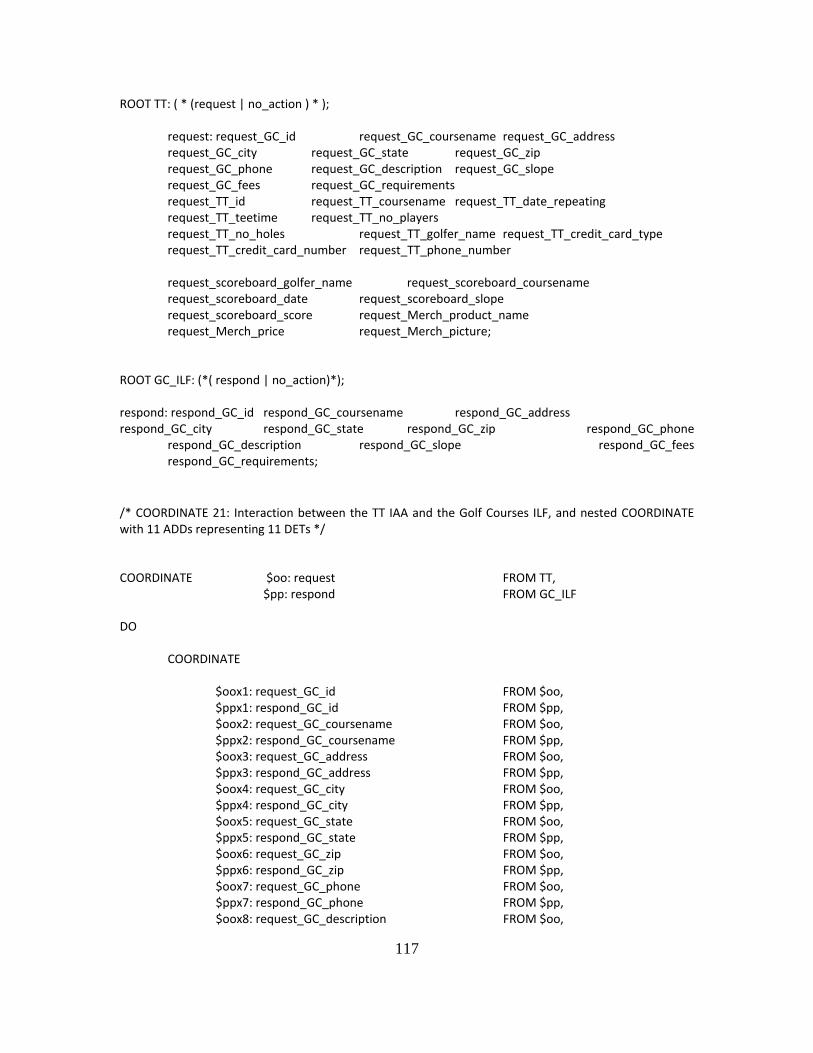
117
ROOT TT: ( * (request | no_action ) * );
request: request_GC_id request_GC_coursename request_GC_address request_GC_city request_GC_state request_GC_zip
request_GC_phone request_GC_description request_GC_slope request_GC_fees request_GC_requirements request_TT_id request_TT_coursename request_TT_date_repeating request_TT_teetime request_TT_no_players request_TT_no_holes request_TT_golfer_name request_TT_credit_card_type request_TT_credit_card_number request_TT_phone_number request_scoreboard_golfer_name request_scoreboard_coursename request_scoreboard_date request_scoreboard_slope request_scoreboard_score request_Merch_product_name request_Merch_price request_Merch_picture; ROOT GC_ILF: (*( respond | no_action)*); respond: respond_GC_id respond_GC_coursename respond_GC_address respond_GC_city respond_GC_state respond_GC_zip respond_GC_phone respond_GC_description respond_GC_slope respond_GC_fees respond_GC_requirements;
/* COORDINATE 21: Interaction between the TT IAA and the Golf Courses ILF, and nested COORDINATE with 11 ADDs representing 11 DETs */ COORDINATE $oo: request FROM TT, $pp: respond FROM GC_ILF DO COORDINATE $oox1: request_GC_id FROM $oo, $ppx1: respond_GC_id FROM $pp, $oox2: request_GC_coursename FROM $oo, $ppx2: respond_GC_coursename FROM $pp, $oox3: request_GC_address FROM $oo, $ppx3: respond_GC_address FROM $pp, $oox4: request_GC_city FROM $oo, $ppx4: respond_GC_city FROM $pp, $oox5: request_GC_state FROM $oo, $ppx5: respond_GC_state FROM $pp, $oox6: request_GC_zip FROM $oo, $ppx6: respond_GC_zip FROM $pp, $oox7: request_GC_phone FROM $oo, $ppx7: respond_GC_phone FROM $pp, $oox8: request_GC_description FROM $oo,
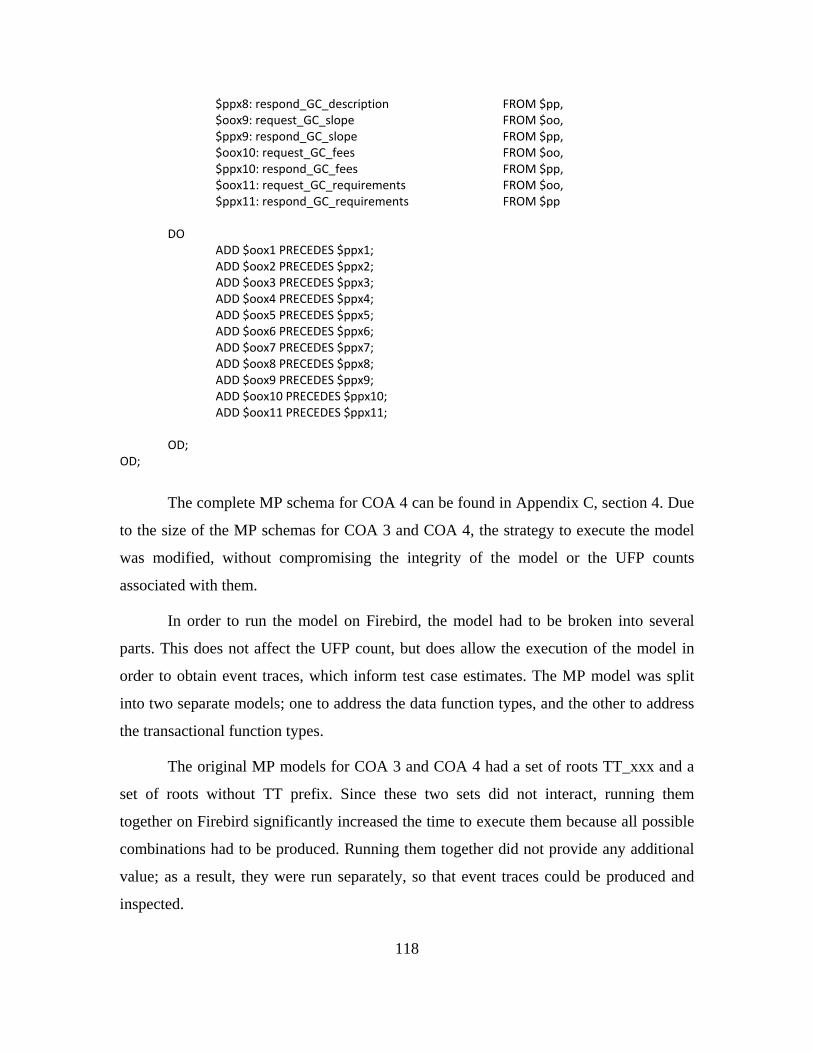
118
$ppx8: respond_GC_description FROM $pp, $oox9: request_GC_slope FROM $oo, $ppx9: respond_GC_slope FROM $pp, $oox10: request_GC_fees FROM $oo, $ppx10: respond_GC_fees FROM $pp, $oox11: request_GC_requirements FROM $oo, $ppx11: respond_GC_requirements FROM $pp DO ADD $oox1 PRECEDES $ppx1; ADD $oox2 PRECEDES $ppx2; ADD $oox3 PRECEDES $ppx3; ADD $oox4 PRECEDES $ppx4; ADD $oox5 PRECEDES $ppx5; ADD $oox6 PRECEDES $ppx6; ADD $oox7 PRECEDES $ppx7; ADD $oox8 PRECEDES $ppx8; ADD $oox9 PRECEDES $ppx9; ADD $oox10 PRECEDES $ppx10; ADD $oox11 PRECEDES $ppx11; OD; OD;
The complete MP schema for COA 4 can be found in Appendix C, section 4. Due
to the size of the MP schemas for COA 3 and COA 4, the strategy to execute the model
was modified, without compromising the integrity of the model or the UFP counts
associated with them.
In order to run the model on Firebird, the model had to be broken into several
parts. This does not affect the UFP count, but does allow the execution of the model in
order to obtain event traces, which inform test case estimates. The MP model was split
into two separate models; one to address the data function types, and the other to address
the transactional function types.
The original MP models for COA 3 and COA 4 had a set of roots TT_xxx and a
set of roots without TT prefix. Since these two sets did not interact, running them
together on Firebird significantly increased the time to execute them because all possible
combinations had to be produced. Running them together did not provide any additional
value; as a result, they were run separately, so that event traces could be produced and
inspected.
119
As mentioned earlier, this was done to execute the models on Firebird, however
the UFP captured in the model is unaffected.
The .wng files, containing the MP schema and event traces, for Tee Time will be
available on the Monterey Phoenix wiki hosted by the Naval Post Graduate School [47].
(4) Step 4: Extract Data Functions count from MP model
COA 1: By manually inspecting the MP schema in Appendix C Section 1, a total
of 4 SHARE ALLs can be extracted from the model.
COA 2: By manually inspecting the MP schema in Appendix C Section 2, a total
of 4 SHARE ALLs can be extracted from the model. By inspecting the model for ILFs
and EIFs associated with the SHARE ALLs, 3 ILFs and 1 EIF are extracted for data
functions.
COA 3: By manually inspecting the MP schema in Appendix C Section 3, a total
of 4 SHARE ALLs can be extracted from the model. By inspecting the model for ILFs
and EIFs associated with the SHARE ALLs, 3 ILFs and 1 EIF are extracted for data
functions.
COA 4: By manually inspecting the MP schema in Appendix C Section 4, a total
of 4 COORDINATEs can be extracted from the model for data function types. By
inspecting the model for ILFs and EIFs associated with the COORDINATEs, 3 ILFs and
1 EIF are extracted for data functions.
(5) Step 5: Extract Transactional Functions count from MP model
COA 1: By manually inspecting the MP schema in Appendix C Section 1, a total
of 20 COORDINATEs representing transactional functions can be extracted from the
model.
COA 2: By manually inspecting the MP schema in Appendix C Section 2, a total
of 20 COORDINATEs representing transactional functions can be extracted from the
model. The transactional functions can be distinguished by inspecting the model for
specific words used to describe the behaviors associated with each COORDINATE. For
120
example, words like “inquire” or “view” are associated with an for EQ; “add”, “change”,
or “delete” for an EI; and “calculate” or “buy” for an EO.
COA 3: By manually inspecting the MP schema in Appendix C Section 3, a total
of 20 COORDINATEs representing transactional functions can be extracted from the
model. The transactional functions can be distinguished by inspecting the model for
specific words used to describe the behaviors associated with each COORDINATE. For
example, words like “inquire” or “view” are associated with an for EQ; “add”, “change”,
or “delete” for an EI; and “calculate” or “buy” for an EO.
COA 4: By manually inspecting the MP schema in Appendix C Section 4, a total
of 20 COORDINATEs representing transactional functions can be extracted from the
model. The transactional functions can be distinguished by inspecting the model for
specific words used to describe the behaviors associated with each COORDINATE. For
example, words like “inquire” or “view” are associated with an for EQ; “add”, “change”,
or “delete” for an EI; and “calculate” or “buy” for an EO.
(6) Step 6: Extract integration test cases and views from MP model
Extracting event traces (i.e. use cases) from an MP schema sets the conditions to
verify the model either through manual inspection of the event traces or by leveraging
automated tools. The use cases serve as a valuable blueprint for the construction of
integration test cases, which can then be used to support integration test estimates.
For COA 1, Scope 1 was used and considered sufficient. The event traces were
inspected and increasing the scope did not show anything new or notable, and would not
improve chances of exposing errors in testing.
Utilizing the MP analyzer tool on Firebird and Scope 1, 864 Event Traces were
generated. Recall that a test case includes test steps, preconditions, test data that supports
what the test case needs to achieve, expected results, post conditions, and information
about the environment.
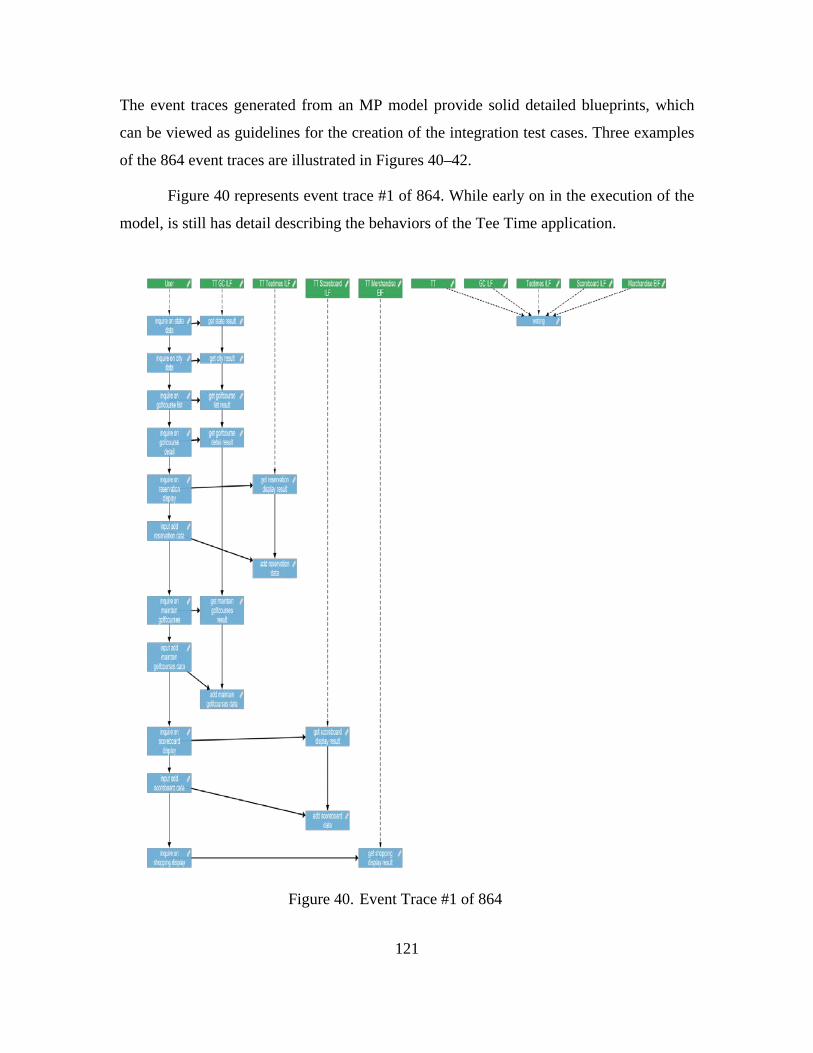
121
The event traces generated from an MP model provide solid detailed blueprints, which
can be viewed as guidelines for the creation of the integration test cases. Three examples
of the 864 event traces are illustrated in Figures 40–42.
Figure 40 represents event trace #1 of 864. While early on in the execution of the
model, is still has detail describing the behaviors of the Tee Time application.
Figure 40. Event Trace #1 of 864
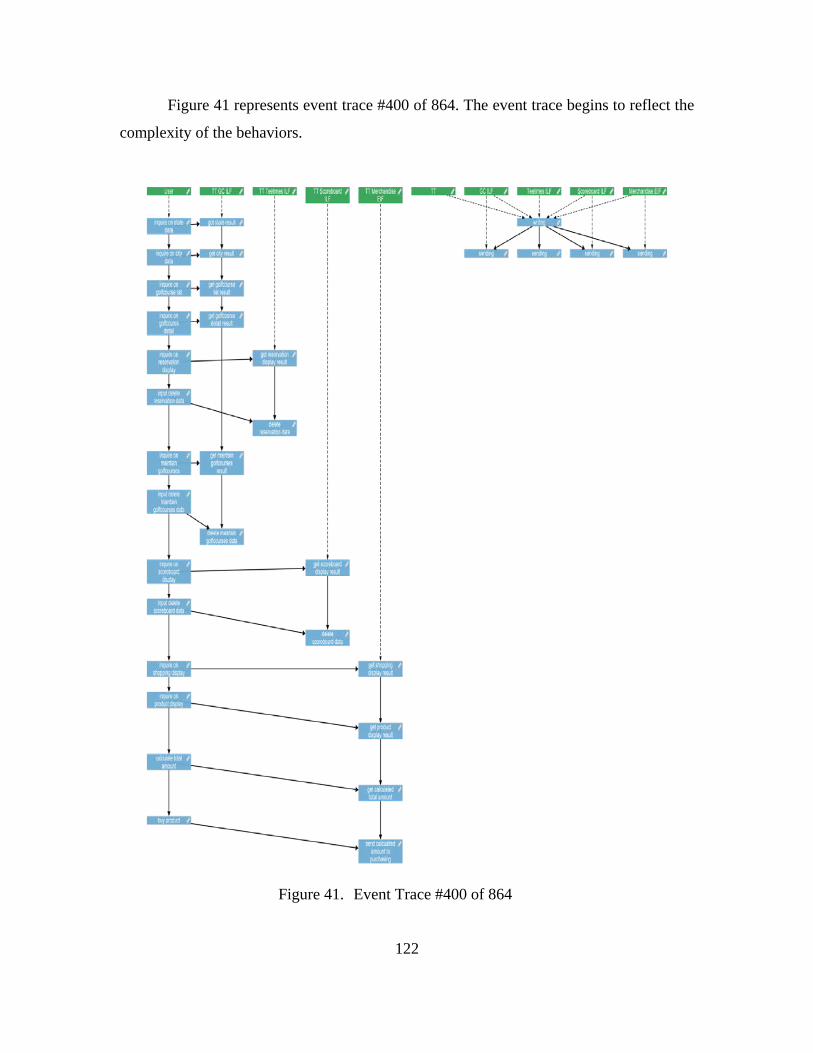
122
Figure 41 represents event trace #400 of 864. The event trace begins to reflect the
complexity of the behaviors.
Figure 41. Event Trace #400 of 864
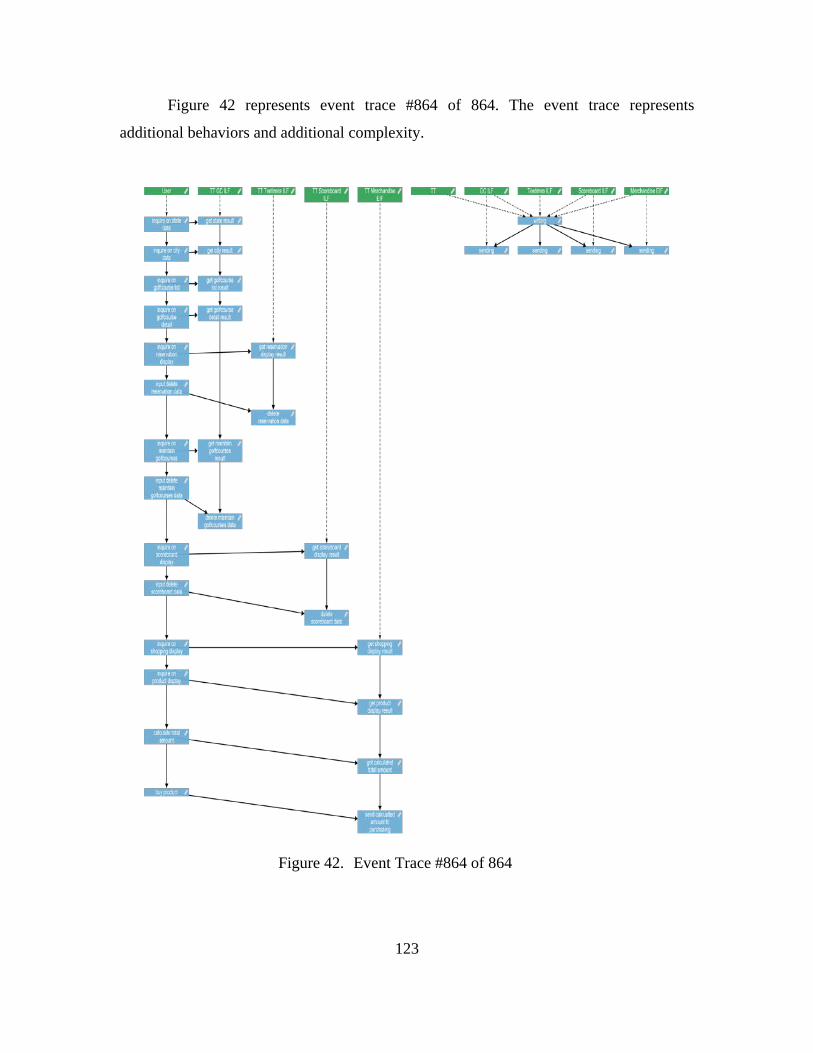
123
Figure 42 represents event trace #864 of 864. The event trace represents
additional behaviors and additional complexity.
Figure 42. Event Trace #864 of 864
124
Recall Brooks stated “successfully used the following rule of thumb for
scheduling a software task: 1/3 planning, 1/6 coding, 1/4 component test and early system
test, 1/4 system test, all components in hand” [53, p. 20].
.25 x Total effort = Estimate for integration testing
As discussed by Wolff, approximately six integration tests per day can be
executed for a large application, such as an electronic commerce system [58, p. 16]. This
does not include the amount of time required to create the test case.
In the COCOMO II results that will be discussed in Step 8, the Integration and
Test costs are part of the phase effort for Construction. In this phase breakdown the total
Construction is 76% of the software development effort. Using the waterfall lifecycle
definitions for COCOMO II the breakdown is: Product Design 17%; Programming 58%;
Integration and Test 25% [55].
As is illustrated in Figure 44 for COA 1, the Construction phase is allocated 6.4
months of schedule. Twenty-five percent of that time is 1.6 months, which
corresponds to 32 days (assuming five days per week and eight hours per day for each
staff person). Assuming that six test cases per day can be executed, then 192 test cases
can be executed in the allocated time for test and integration.
However, there are 864 event traces generated in the MP model for COA 1. Not
including the time required to create the actual test cases, this would require over 144
days to execute all testing. Upon inspection of the event traces, some are significantly
less complicated than others, so test case generation and execution based on each event
trace will not require the same amount of effort. But this does provide information for
next steps to inform decision making, both technically and programmatically. The first
step is to revisit the model, and ensure that the behaviors of the application are accurately
captured. If the model is correct, then the next step is to determine is there any flexibility
in the schedule and resources to support additional testing. Since 144 days is unrealistic,
it becomes clear that only a subset of event traces can be selected for testing.
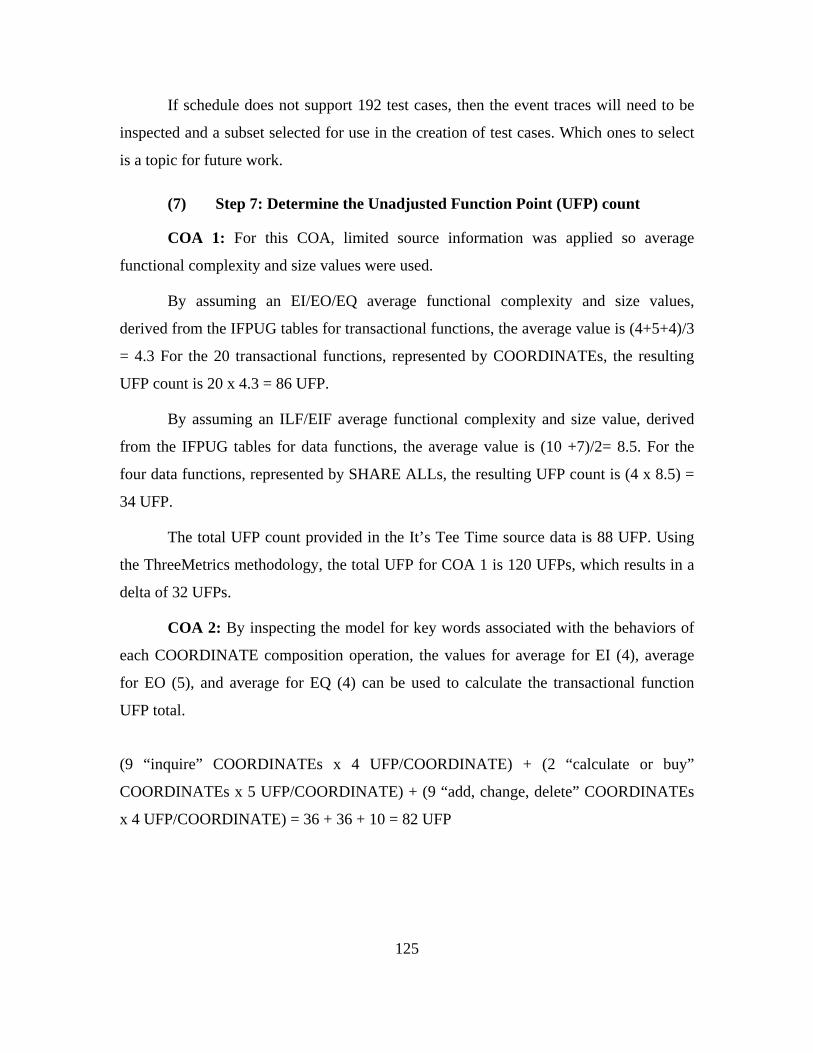
125
If schedule does not support 192 test cases, then the event traces will need to be
inspected and a subset selected for use in the creation of test cases. Which ones to select
is a topic for future work.
(7) Step 7: Determine the Unadjusted Function Point (UFP) count
COA 1: For this COA, limited source information was applied so average
functional complexity and size values were used.
By assuming an EI/EO/EQ average functional complexity and size values,
derived from the IFPUG tables for transactional functions, the average value is (4+5+4)/3
= 4.3 For the 20 transactional functions, represented by COORDINATEs, the resulting
UFP count is 20 x 4.3 = 86 UFP.
By assuming an ILF/EIF average functional complexity and size value, derived
from the IFPUG tables for data functions, the average value is (10 +7)/2= 8.5. For the
four data functions, represented by SHARE ALLs, the resulting UFP count is (4 x 8.5) =
34 UFP.
The total UFP count provided in the It’s Tee Time source data is 88 UFP. Using
the ThreeMetrics methodology, the total UFP for COA 1 is 120 UFPs, which results in a
delta of 32 UFPs.
COA 2: By inspecting the model for key words associated with the behaviors of
each COORDINATE composition operation, the values for average for EI (4), average
for EO (5), and average for EQ (4) can be used to calculate the transactional function
UFP total.
(9 “inquire” COORDINATEs x 4 UFP/COORDINATE) + (2 “calculate or buy”
COORDINATEs x 5 UFP/COORDINATE) + (9 “add, change, delete” COORDINATEs
x 4 UFP/COORDINATE) = 36 + 36 + 10 = 82 UFP
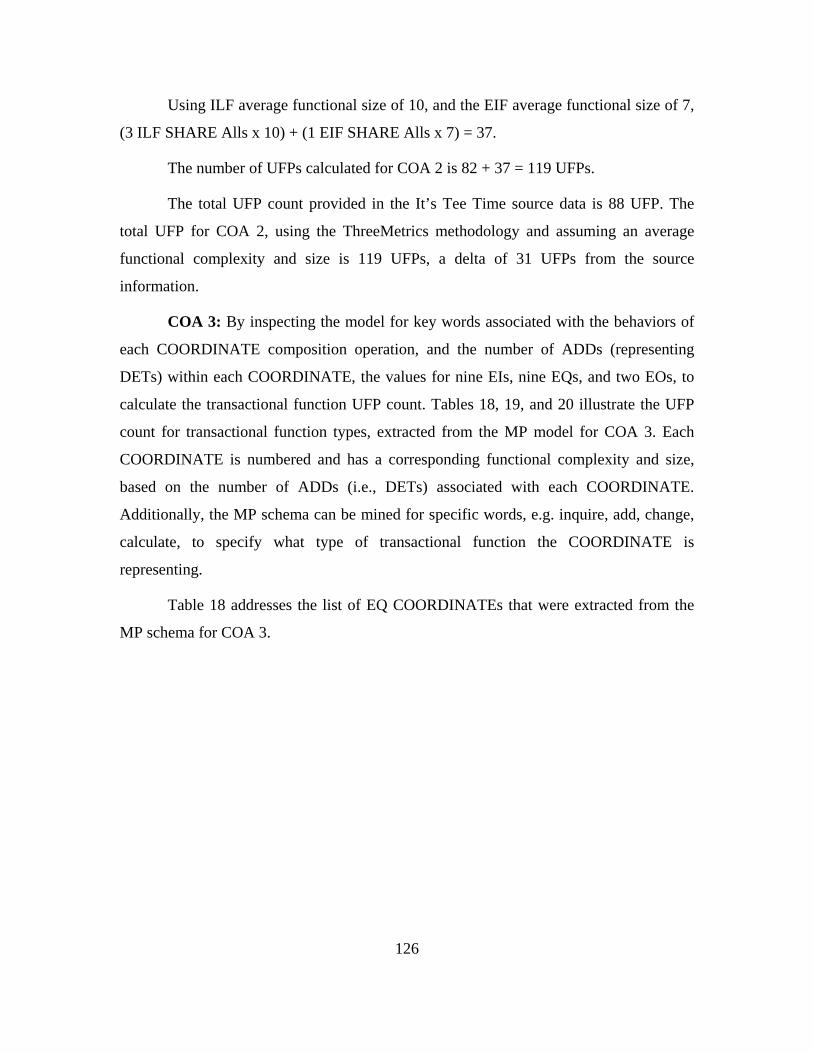
126
Using ILF average functional size of 10, and the EIF average functional size of 7,
(3 ILF SHARE Alls x 10) + (1 EIF SHARE Alls x 7) = 37.
The number of UFPs calculated for COA 2 is 82 + 37 = 119 UFPs.
The total UFP count provided in the It’s Tee Time source data is 88 UFP. The
total UFP for COA 2, using the ThreeMetrics methodology and assuming an average
functional complexity and size is 119 UFPs, a delta of 31 UFPs from the source
information.
COA 3: By inspecting the model for key words associated with the behaviors of
each COORDINATE composition operation, and the number of ADDs (representing
DETs) within each COORDINATE, the values for nine EIs, nine EQs, and two EOs, to
calculate the transactional function UFP count. Tables 18, 19, and 20 illustrate the UFP
count for transactional function types, extracted from the MP model for COA 3. Each
COORDINATE is numbered and has a corresponding functional complexity and size,
based on the number of ADDs (i.e., DETs) associated with each COORDINATE.
Additionally, the MP schema can be mined for specific words, e.g. inquire, add, change,
calculate, to specify what type of transactional function the COORDINATE is
representing.
Table 18 addresses the list of EQ COORDINATEs that were extracted from the
MP schema for COA 3.
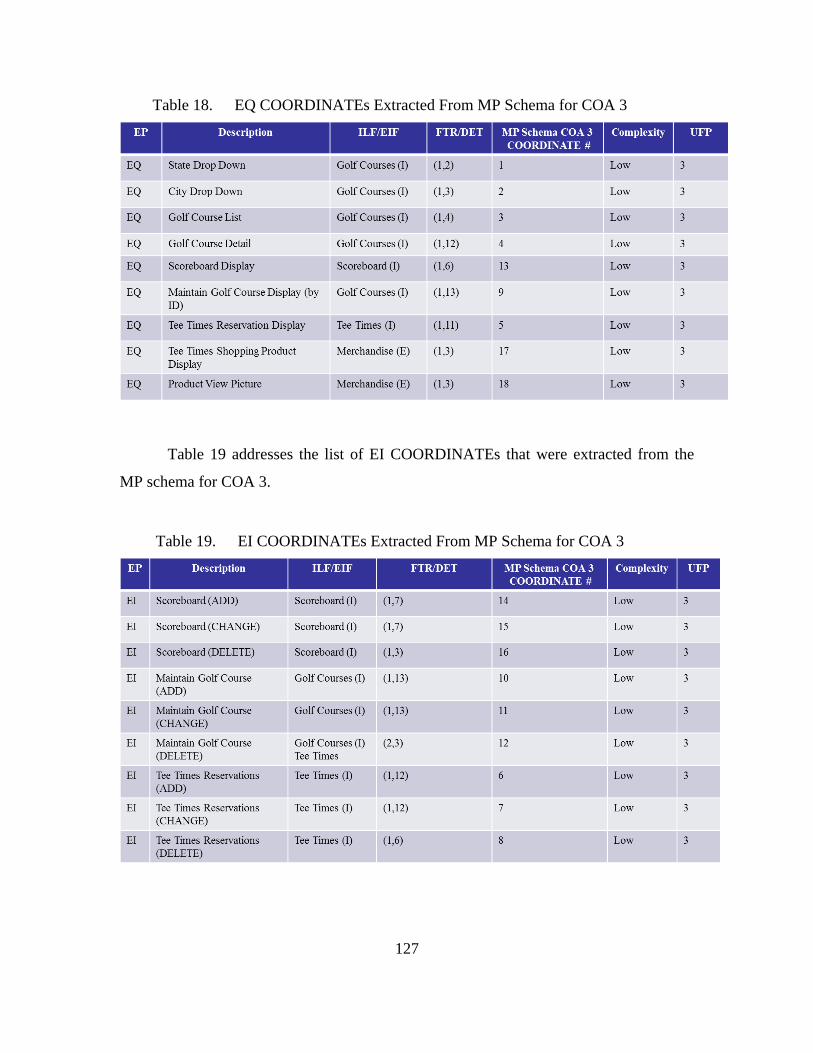
127
Table 18. EQ COORDINATEs Extracted From MP Schema for COA 3
Table 19 addresses the list of EI COORDINATEs that were extracted from the
MP schema for COA 3.
Table 19. EI COORDINATEs Extracted From MP Schema for COA 3
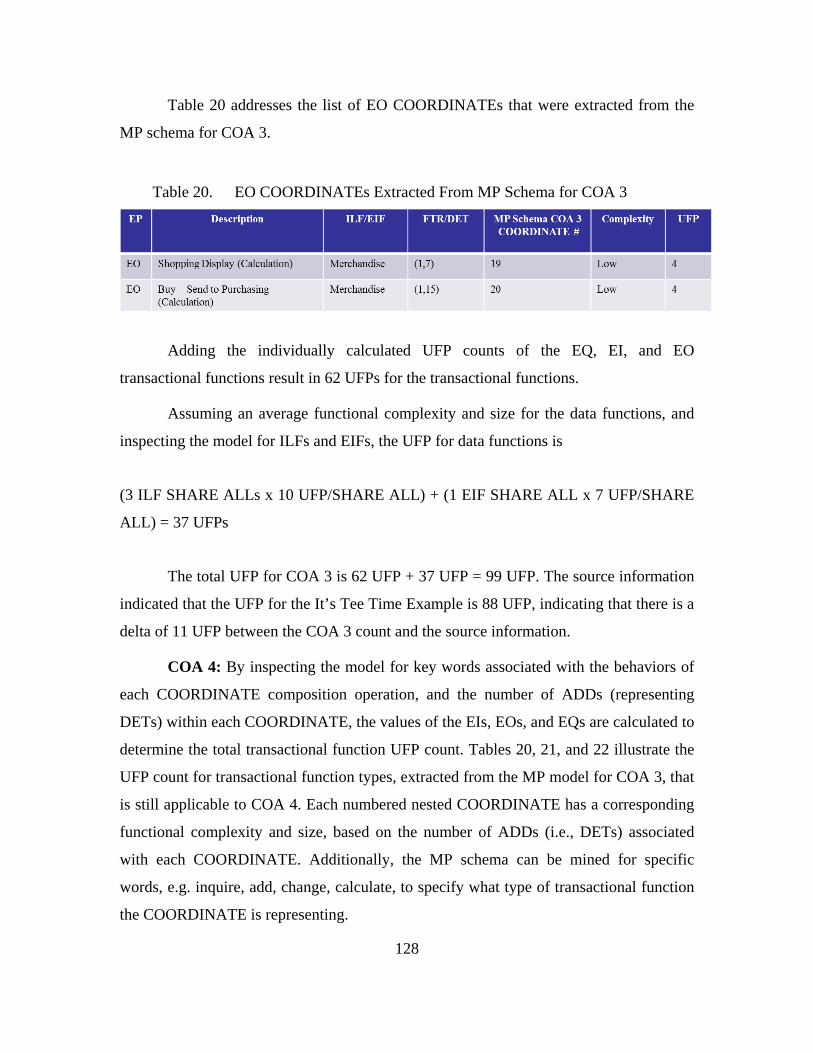
128
Table 20 addresses the list of EO COORDINATEs that were extracted from the
MP schema for COA 3.
Table 20. EO COORDINATEs Extracted From MP Schema for COA 3
Adding the individually calculated UFP counts of the EQ, EI, and EO
transactional functions result in 62 UFPs for the transactional functions.
Assuming an average functional complexity and size for the data functions, and
inspecting the model for ILFs and EIFs, the UFP for data functions is
(3 ILF SHARE ALLs x 10 UFP/SHARE ALL) + (1 EIF SHARE ALL x 7 UFP/SHARE
ALL) = 37 UFPs
The total UFP for COA 3 is 62 UFP + 37 UFP = 99 UFP. The source information
indicated that the UFP for the It’s Tee Time Example is 88 UFP, indicating that there is a
delta of 11 UFP between the COA 3 count and the source information.
COA 4: By inspecting the model for key words associated with the behaviors of
each COORDINATE composition operation, and the number of ADDs (representing
DETs) within each COORDINATE, the values of the EIs, EOs, and EQs are calculated to
determine the total transactional function UFP count. Tables 20, 21, and 22 illustrate the
UFP count for transactional function types, extracted from the MP model for COA 3, that
is still applicable to COA 4. Each numbered nested COORDINATE has a corresponding
functional complexity and size, based on the number of ADDs (i.e., DETs) associated
with each COORDINATE. Additionally, the MP schema can be mined for specific
words, e.g. inquire, add, change, calculate, to specify what type of transactional function
the COORDINATE is representing.
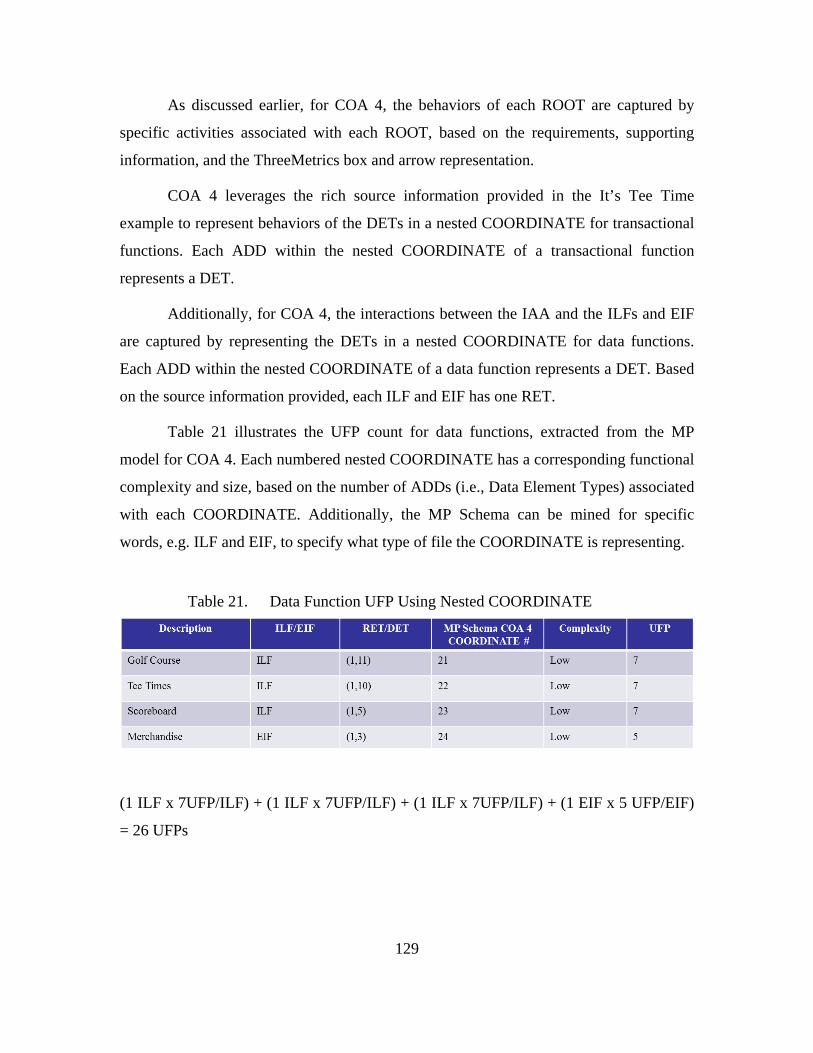
129
As discussed earlier, for COA 4, the behaviors of each ROOT are captured by
specific activities associated with each ROOT, based on the requirements, supporting
information, and the ThreeMetrics box and arrow representation.
COA 4 leverages the rich source information provided in the It’s Tee Time
example to represent behaviors of the DETs in a nested COORDINATE for transactional
functions. Each ADD within the nested COORDINATE of a transactional function
represents a DET.
Additionally, for COA 4, the interactions between the IAA and the ILFs and EIF
are captured by representing the DETs in a nested COORDINATE for data functions.
Each ADD within the nested COORDINATE of a data function represents a DET. Based
on the source information provided, each ILF and EIF has one RET.
Table 21 illustrates the UFP count for data functions, extracted from the MP
model for COA 4. Each numbered nested COORDINATE has a corresponding functional
complexity and size, based on the number of ADDs (i.e., Data Element Types) associated
with each COORDINATE. Additionally, the MP Schema can be mined for specific
words, e.g. ILF and EIF, to specify what type of file the COORDINATE is representing.
Table 21. Data Function UFP Using Nested COORDINATE
(1 ILF x 7UFP/ILF) + (1 ILF x 7UFP/ILF) + (1 ILF x 7UFP/ILF) + (1 EIF x 5 UFP/EIF)
= 26 UFPs
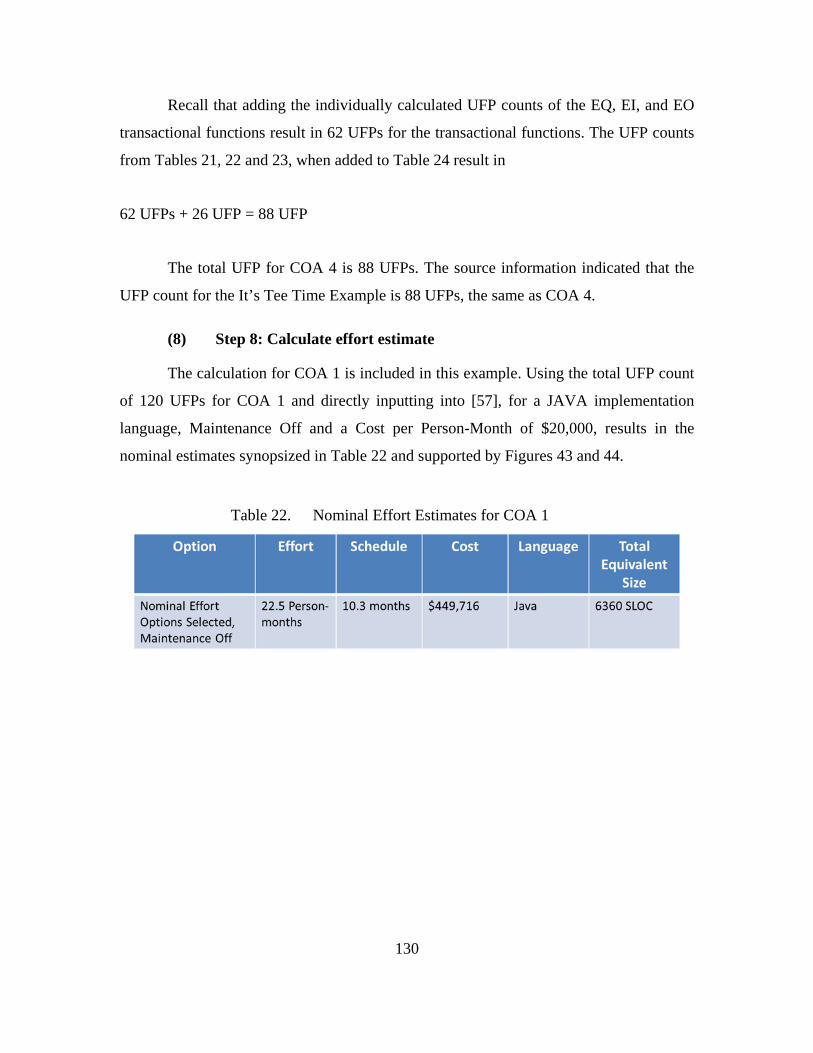
130
Recall that adding the individually calculated UFP counts of the EQ, EI, and EO
transactional functions result in 62 UFPs for the transactional functions. The UFP counts
from Tables 21, 22 and 23, when added to Table 24 result in
62 UFPs + 26 UFP = 88 UFP
The total UFP for COA 4 is 88 UFPs. The source information indicated that the
UFP count for the It’s Tee Time Example is 88 UFPs, the same as COA 4.
(8) Step 8: Calculate effort estimate
The calculation for COA 1 is included in this example. Using the total UFP count
of 120 UFPs for COA 1 and directly inputting into [57], for a JAVA implementation
language, Maintenance Off and a Cost per Person-Month of $20,000, results in the
nominal estimates synopsized in Table 22 and supported by Figures 43 and 44.
Table 22. Nominal Effort Estimates for COA 1
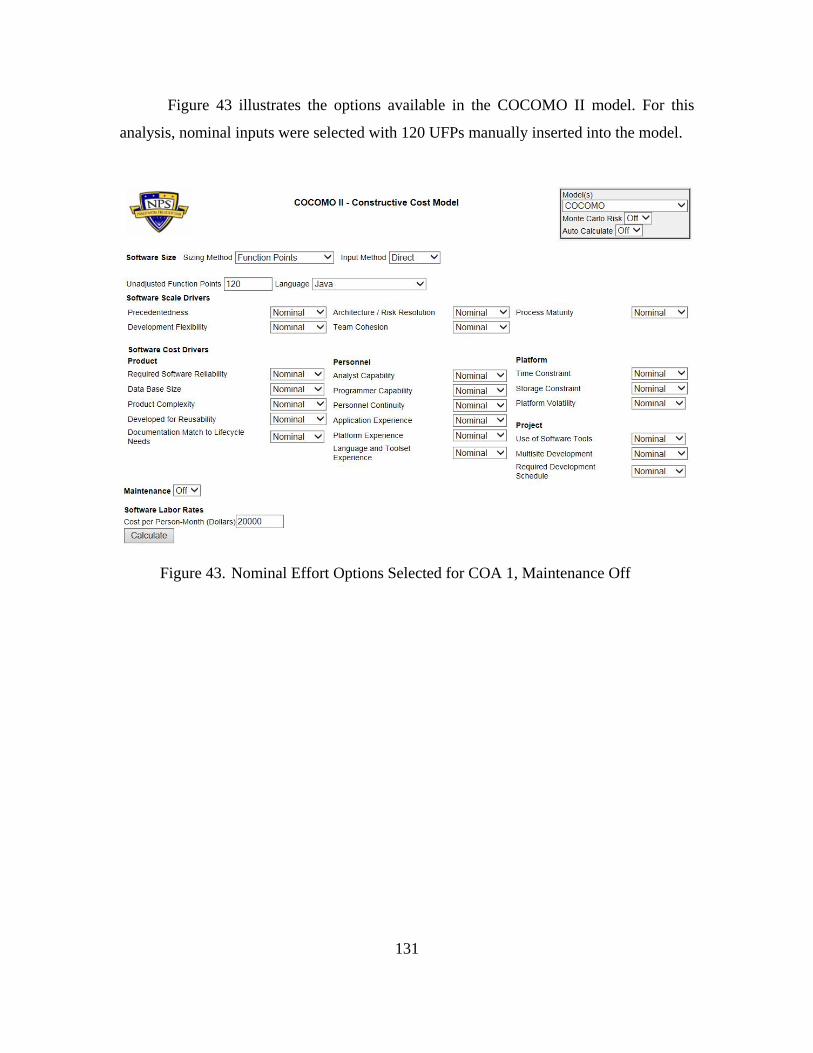
131
Figure 43 illustrates the options available in the COCOMO II model. For this
analysis, nominal inputs were selected with 120 UFPs manually inserted into the model.
Figure 43. Nominal Effort Options Selected for COA 1, Maintenance Off
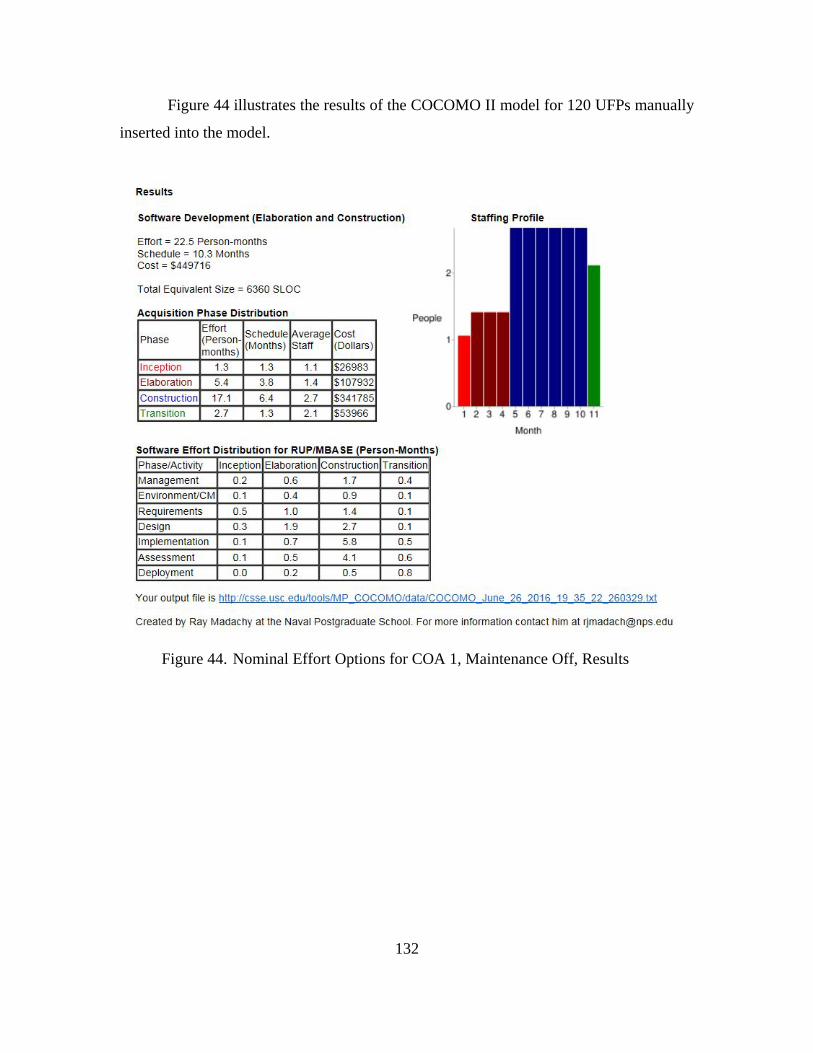
132
Figure 44 illustrates the results of the COCOMO II model for 120 UFPs manually
inserted into the model.
Figure 44. Nominal Effort Options for COA 1, Maintenance Off, Results
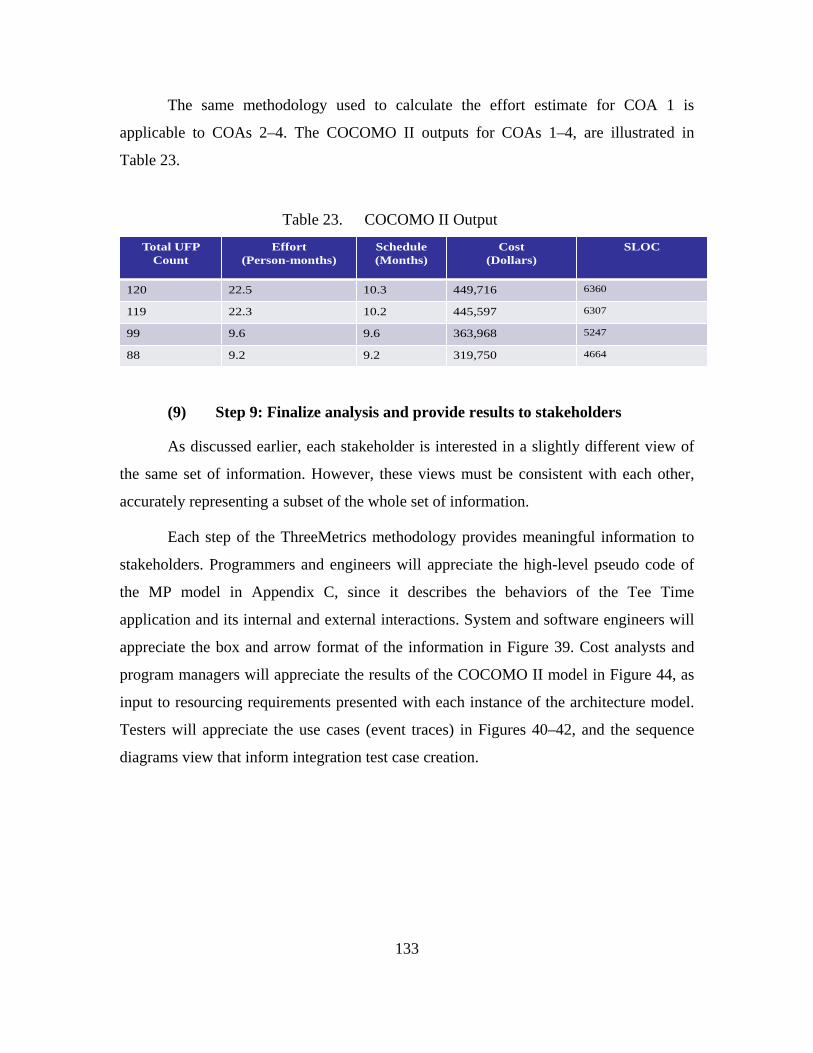
133
The same methodology used to calculate the effort estimate for COA 1 is
applicable to COAs 2–4. The COCOMO II outputs for COAs 1–4, are illustrated in
Table 23.
Table 23. COCOMO II Output
(9) Step 9: Finalize analysis and provide results to stakeholders
As discussed earlier, each stakeholder is interested in a slightly different view of
the same set of information. However, these views must be consistent with each other,
accurately representing a subset of the whole set of information.
Each step of the ThreeMetrics methodology provides meaningful information to
stakeholders. Programmers and engineers will appreciate the high-level pseudo code of
the MP model in Appendix C, since it describes the behaviors of the Tee Time
application and its internal and external interactions. System and software engineers will
appreciate the box and arrow format of the information in Figure 39. Cost analysts and
program managers will appreciate the results of the COCOMO II model in Figure 44, as
input to resourcing requirements presented with each instance of the architecture model.
Testers will appreciate the use cases (event traces) in Figures 40–42, and the sequence
diagrams view that inform integration test case creation.
Total UFP Count
Effort(Person-months)
Schedule(Months)
Cost(Dollars)
SLOC
120 22.5 10.3 449,716 6360
119 22.3 10.2 445,597 6307
99 9.6 9.6 363,968 5247
88 9.2 9.2 319,750 4664

134
THIS PAGE INTENTIONALLY LEFT BLANK
135
V. SUMMARY OF RESULTS AND FINDINGS
The initial goal of this research was to answer the question “Can unadjusted
function point counts be extracted from executable architectural behavioral models, for
use in cost estimation models such as COCOMO II, in order to inform effort estimates
early in the life cycle?”
ThreeMetrics methodology, and its application to the examples in Chapter IV,
confirm the following contributions of this work:
• The ThreeMetrics methodology does relate function point counting, COCOMO II cost estimates, and executable behavioral modeling of system and software architecture specifications.
• The ThreeMetrics methodology, based on MP architecture model, provides a way of establishing internal and external boundaries for function point counting.
• The use of the MP language and framework significantly simplified otherwise complex relationships. The ability to execute the model using MP Analyzer on Firebird, inspect it, and debug it, provided confidence in the results of the model.
• The ThreeMetrics methodology successfully unifies the two distinct function point counting concepts of data function types and transactional function types.
A. RESULTS AND FINDINGS
This research introduced a newly developed methodology called the
ThreeMetrics, whose name represents the three metrics resulting from the methodology:
UFP counts, use cases to inform integration test estimates, and views of the architecture.
The ThreeMetrics methodology employed architecture modeling of the behaviors
of a software-intensive system, the behaviors of the environment, and the behaviors of
the system interacting with the environment, in order to inform technical and investment
decisions. This research accomplished the following:
136
• As described in Chapter III, this research presented a nine-step methodology to extract an UFP count from MP’s executable architecture models for use in software cost estimation.
• As demonstrated in three examples in Chapter IV, the ThreeMetrics methodology leveraged precise behavioral modeling using MP and the MP Analyzer on Firebird to assess architecture design decisions and their impacts.
• As demonstrated in three examples in Chapter IV, the ThreeMetrics methodology related architecture modeling to resourcing through analysis of behaviors and UFP counts, leveraging complexity and size metrics such as DETs. The COCOMO II model extension was used to manually input the UFP count (extracted from the MP model) into the COCOMO II model, to determine cost estimates.
• As demonstrated in three examples in Chapter IV, the ThreeMetrics methodology used event traces (i.e. use cases) to inform integration testing estimates and decision making, based on estimates extracted from the Construction phase of the COCOMO II model.
• As demonstrated in three examples in Chapter IV, the ThreeMetrics methodology leveraged aspects of the FP counting methodology to write the MP model with key words to distinguish between EI, EO, and EQ transactional function types improved the accuracy of the UFP count.
• As demonstrated in the four COAs of example three in Chapter IV, accurately representing the data function interactions contributed to an accurate total UFP count.
• As demonstrated in three examples in Chapter IV, each step in the ThreeMetrics methodology contributed to information, consistently represented in multiple views and formats, that can be used communicate with multiple stakeholders.
The UFP results of the three examples explored in Chapter IV are summarized in
Table 24. The UFPs extracted from the model approached the UFP count from the source
info answer key, as more details associated with the ILF and EIF were used. Representing
the behaviors of the data function types was accomplished using the IAA and capturing
the interactions between the data functions and the IAA in the MP model.
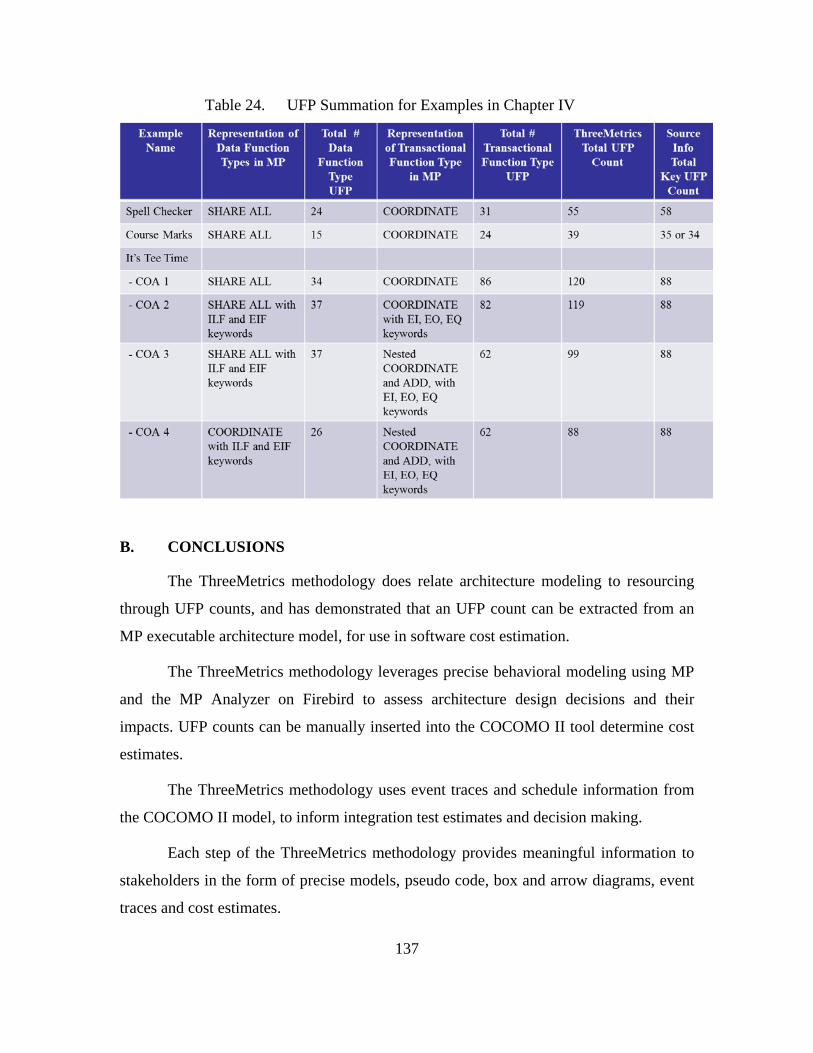
137
Table 24. UFP Summation for Examples in Chapter IV
B. CONCLUSIONS
The ThreeMetrics methodology does relate architecture modeling to resourcing
through UFP counts, and has demonstrated that an UFP count can be extracted from an
MP executable architecture model, for use in software cost estimation.
The ThreeMetrics methodology leverages precise behavioral modeling using MP
and the MP Analyzer on Firebird to assess architecture design decisions and their
impacts. UFP counts can be manually inserted into the COCOMO II tool determine cost
estimates.
The ThreeMetrics methodology uses event traces and schedule information from
the COCOMO II model, to inform integration test estimates and decision making.
Each step of the ThreeMetrics methodology provides meaningful information to
stakeholders in the form of precise models, pseudo code, box and arrow diagrams, event
traces and cost estimates.
138
C. FUTURE WORK
This research sets the conditions for interesting future work, building upon the
foundation of the ThreeMetrics methodology. Several topics are included below.
Although event traces were used to inform estimates for integration test cases, the
process and the criteria for the selection of a subset of relevant event traces to inform
integration test cases has not yet been done. Resourcing and schedule constraints may
limit the number of test cases that can be created from the set of MP event traces.
Currently, the UFP count extracted from the MP model is manually entered into
the COCOMO II model. A current prototype has demonstrated that a .mp file can
uploaded and parsed to extract the UFP count from the MP model. A future
implementation is required to automate the process to extract an UFP from a .mp file,
using the rules identified in the ThreeMetrics methodology.
The ThreeMetrics methodology must continue to be evaluated in the broader
context of the COCOMO II model. How MP metrics relate to the evaluation of actual
projects must be explored to demonstrate actual value, improve the mechanics of the
evaluation process, and establish new perspectives on COCOMO II and MP.
An MP model is a rich source of information, but not all the information in an MP
model, particularly the event grammar (i.e., pseudo code) has been utilized in this
research. Cost estimates derived from early architecture models need to take advantage of
all information available in the MP model. Besides using FPA, there are other complexity
and size metrics that can be employed. For example, consider that
Cost = K1*FP_metrics + K2*Complexity_metrics + K3*Size_estimate
FP counts are calculated mostly following the established FP methodology,
identifying the MP interactions and assigning functional complexity and size values.
Complexity metrics can also address alternatives and iterations in the MP model that
clearly indicate that an effort will be needed to implement them. Size estimates should
then consider the total number of events, composite events, roots, alternatives, iterations,
139
concurrent events. Additional consideration must be given to how to properly balance
these metrics, such as determining what other information from the MP model may be of
use (such as reuse metrics), and considering how K1, K2, K3 coefficients should be
obtained, perhaps based on heuristics.
The IFPUG is continuing to evolve the Software Non-functional Assessment
Process (SNAP) counting practice which “measures software by quantifying the size of
non-functional requirements” [70]. An MP model can be refined to include greater levels
of detail about the application, if that detail is available. This includes further
decomposition of functional requirements and then linking them to technical (or non-
functional) requirements. Since SNAP focuses on the non-functional requirements, the
role of MP, the ThreeMetrics methodology, and SNAP is another topic for future work.

140
THIS PAGE INTENTIONALLY LEFT BLANK
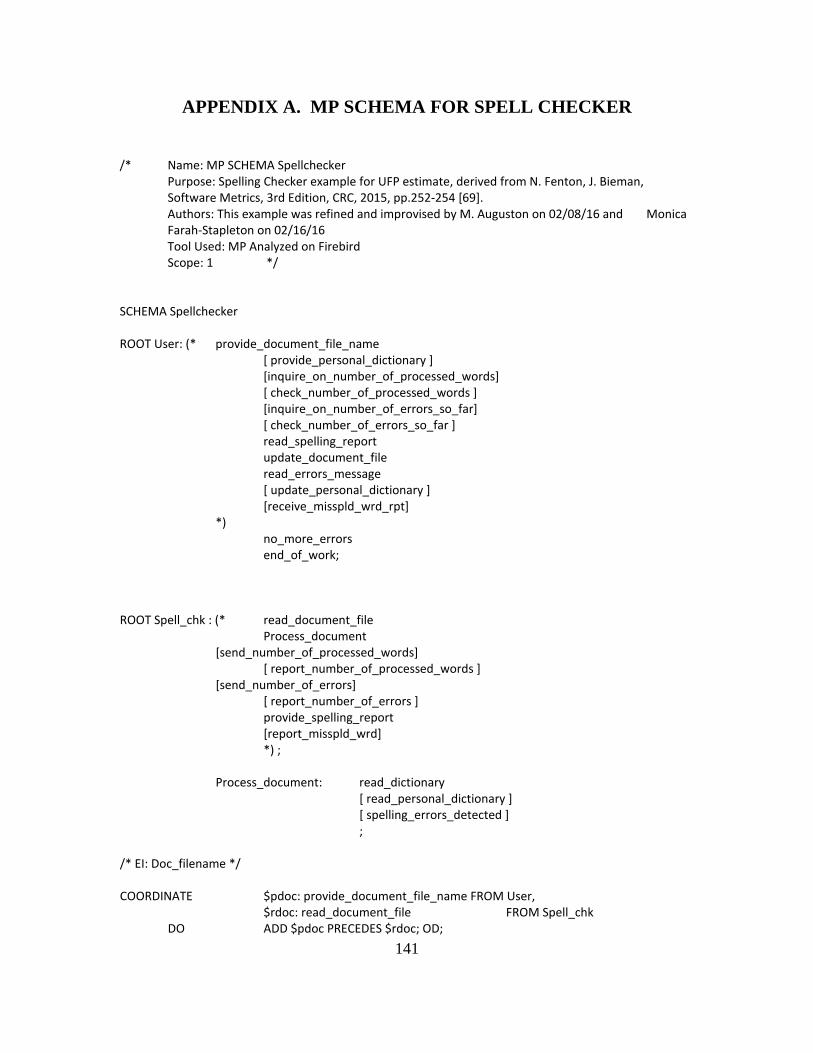
141
APPENDIX A. MP SCHEMA FOR SPELL CHECKER
/* Name: MP SCHEMA Spellchecker Purpose: Spelling Checker example for UFP estimate, derived from N. Fenton, J. Bieman, Software Metrics, 3rd Edition, CRC, 2015, pp.252-254 [69]. Authors: This example was refined and improvised by M. Auguston on 02/08/16 and Monica Farah-Stapleton on 02/16/16
Tool Used: MP Analyzed on Firebird Scope: 1 */ SCHEMA Spellchecker ROOT User: (* provide_document_file_name [ provide_personal_dictionary ] [inquire_on_number_of_processed_words] [ check_number_of_processed_words ] [inquire_on_number_of_errors_so_far] [ check_number_of_errors_so_far ] read_spelling_report update_document_file read_errors_message [ update_personal_dictionary ] [receive_misspld_wrd_rpt] *) no_more_errors end_of_work; ROOT Spell_chk : (* read_document_file Process_document [send_number_of_processed_words] [ report_number_of_processed_words ] [send_number_of_errors] [ report_number_of_errors ] provide_spelling_report [report_misspld_wrd] *) ; Process_document: read_dictionary [ read_personal_dictionary ] [ spelling_errors_detected ] ; /* EI: Doc_filename */ COORDINATE $pdoc: provide_document_file_name FROM User, $rdoc: read_document_file FROM Spell_chk DO ADD $pdoc PRECEDES $rdoc; OD;
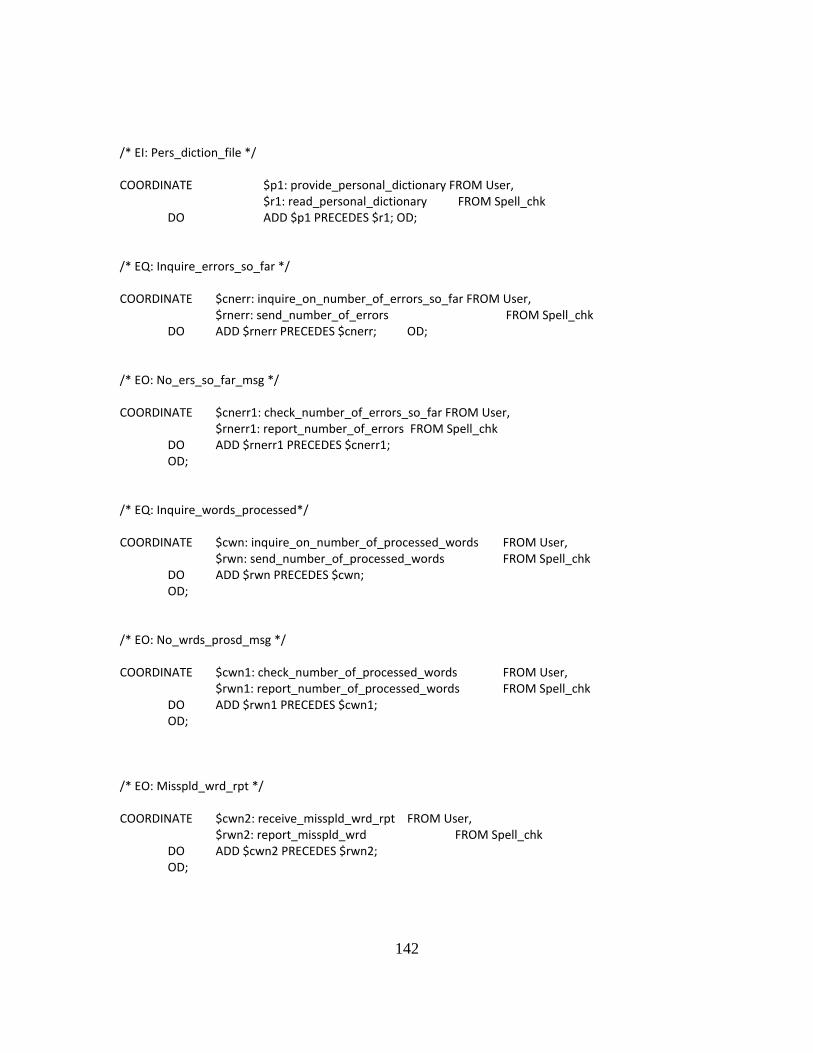
142
/* EI: Pers_diction_file */ COORDINATE $p1: provide_personal_dictionary FROM User, $r1: read_personal_dictionary FROM Spell_chk DO ADD $p1 PRECEDES $r1; OD; /* EQ: Inquire_errors_so_far */ COORDINATE $cnerr: inquire_on_number_of_errors_so_far FROM User, $rnerr: send_number_of_errors FROM Spell_chk DO ADD $rnerr PRECEDES $cnerr; OD; /* EO: No_ers_so_far_msg */ COORDINATE $cnerr1: check_number_of_errors_so_far FROM User, $rnerr1: report_number_of_errors FROM Spell_chk DO ADD $rnerr1 PRECEDES $cnerr1; OD; /* EQ: Inquire_words_processed*/ COORDINATE $cwn: inquire_on_number_of_processed_words FROM User, $rwn: send_number_of_processed_words FROM Spell_chk DO ADD $rwn PRECEDES $cwn; OD; /* EO: No_wrds_prosd_msg */ COORDINATE $cwn1: check_number_of_processed_words FROM User, $rwn1: report_number_of_processed_words FROM Spell_chk DO ADD $rwn1 PRECEDES $cwn1; OD; /* EO: Misspld_wrd_rpt */ COORDINATE $cwn2: receive_misspld_wrd_rpt FROM User, $rwn2: report_misspld_wrd FROM Spell_chk DO ADD $cwn2 PRECEDES $rwn2; OD;
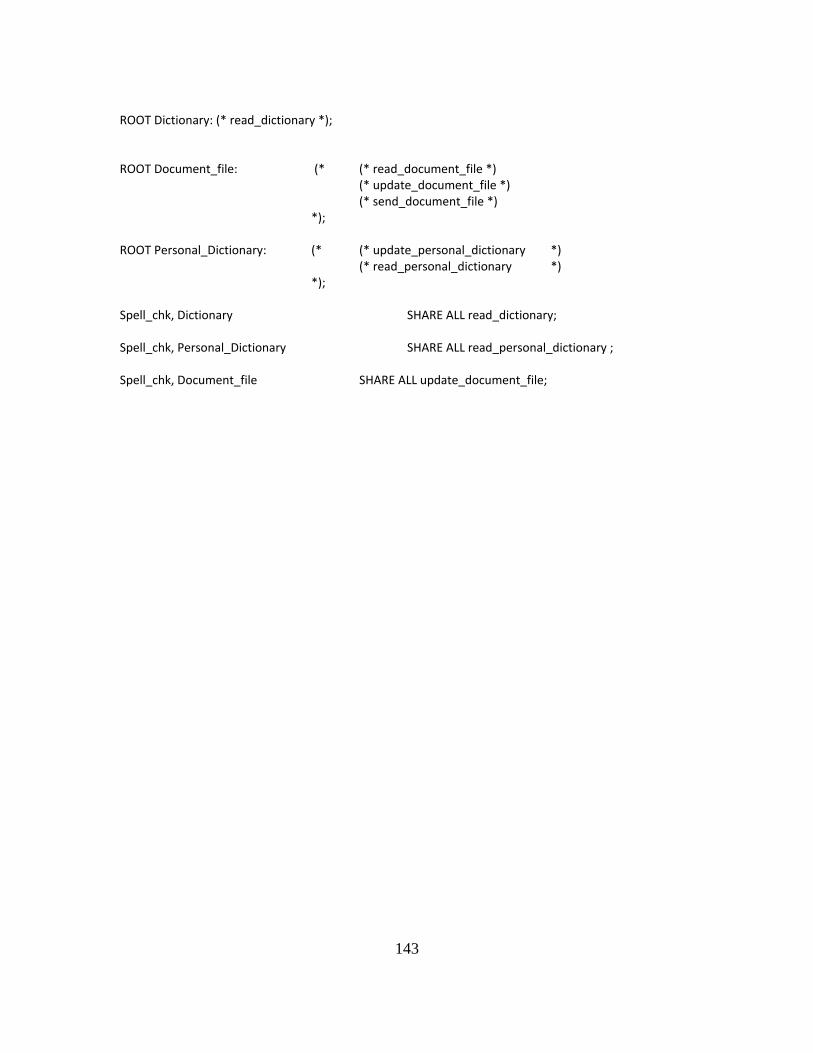
143
ROOT Dictionary: (* read_dictionary *); ROOT Document_file: (* (* read_document_file *) (* update_document_file *) (* send_document_file *) *); ROOT Personal_Dictionary: (* (* update_personal_dictionary *) (* read_personal_dictionary *) *); Spell_chk, Dictionary SHARE ALL read_dictionary; Spell_chk, Personal_Dictionary SHARE ALL read_personal_dictionary ; Spell_chk, Document_file SHARE ALL update_document_file;

144
THIS PAGE INTENTIONALLY LEFT BLANK
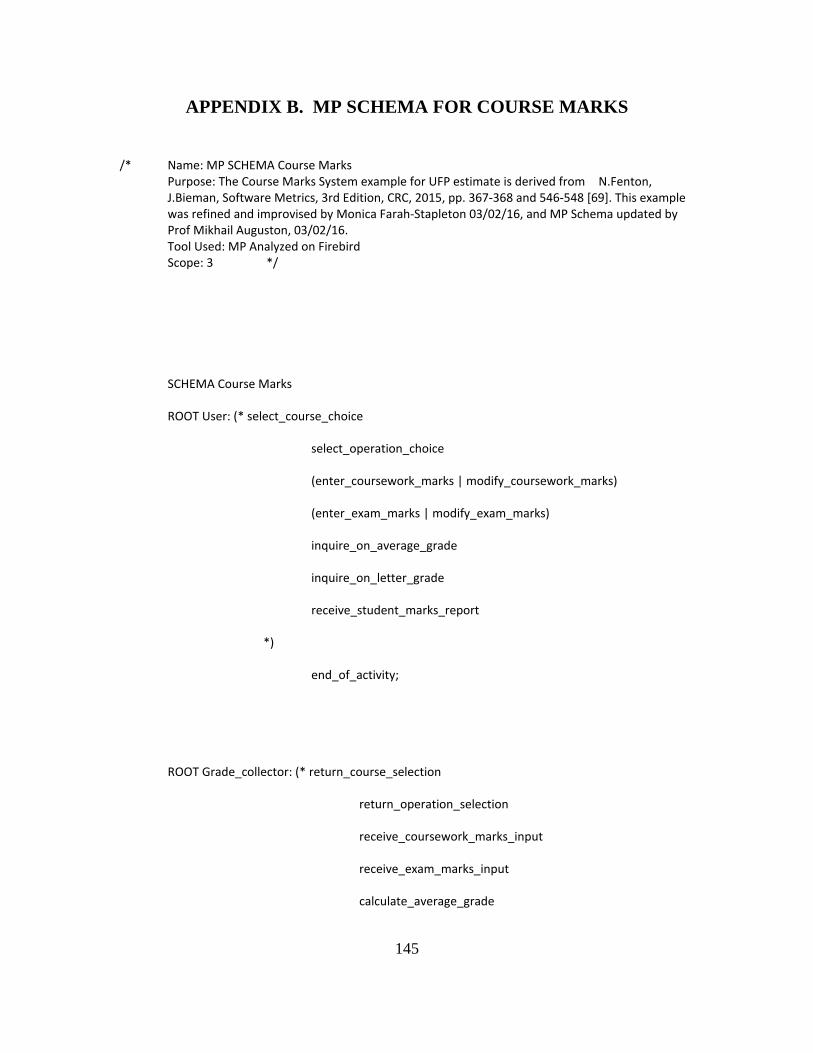
145
APPENDIX B. MP SCHEMA FOR COURSE MARKS
/* Name: MP SCHEMA Course Marks Purpose: The Course Marks System example for UFP estimate is derived from N.Fenton, J.Bieman, Software Metrics, 3rd Edition, CRC, 2015, pp. 367-368 and 546-548 [69]. This example was refined and improvised by Monica Farah-Stapleton 03/02/16, and MP Schema updated by Prof Mikhail Auguston, 03/02/16. Tool Used: MP Analyzed on Firebird Scope: 3 */
SCHEMA Course Marks
ROOT User: (* select_course_choice
select_operation_choice
(enter_coursework_marks | modify_coursework_marks)
(enter_exam_marks | modify_exam_marks)
inquire_on_average_grade
inquire_on_letter_grade
receive_student_marks_report
*)
end_of_activity;
ROOT Grade_collector: (* return_course_selection
return_operation_selection
receive_coursework_marks_input
receive_exam_marks_input
calculate_average_grade
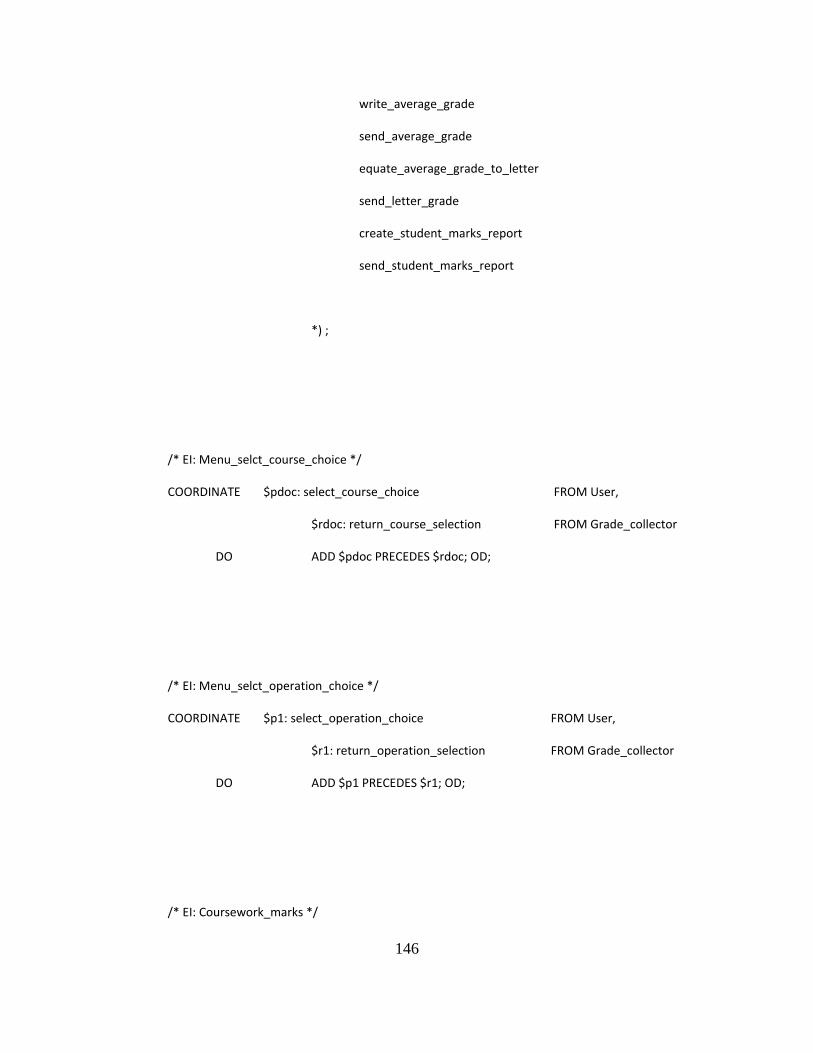
146
write_average_grade
send_average_grade
equate_average_grade_to_letter
send_letter_grade
create_student_marks_report
send_student_marks_report
*) ;
/* EI: Menu_selct_course_choice */
COORDINATE $pdoc: select_course_choice FROM User,
$rdoc: return_course_selection FROM Grade_collector
DO ADD $pdoc PRECEDES $rdoc; OD;
/* EI: Menu_selct_operation_choice */
COORDINATE $p1: select_operation_choice FROM User,
$r1: return_operation_selection FROM Grade_collector
DO ADD $p1 PRECEDES $r1; OD;
/* EI: Coursework_marks */
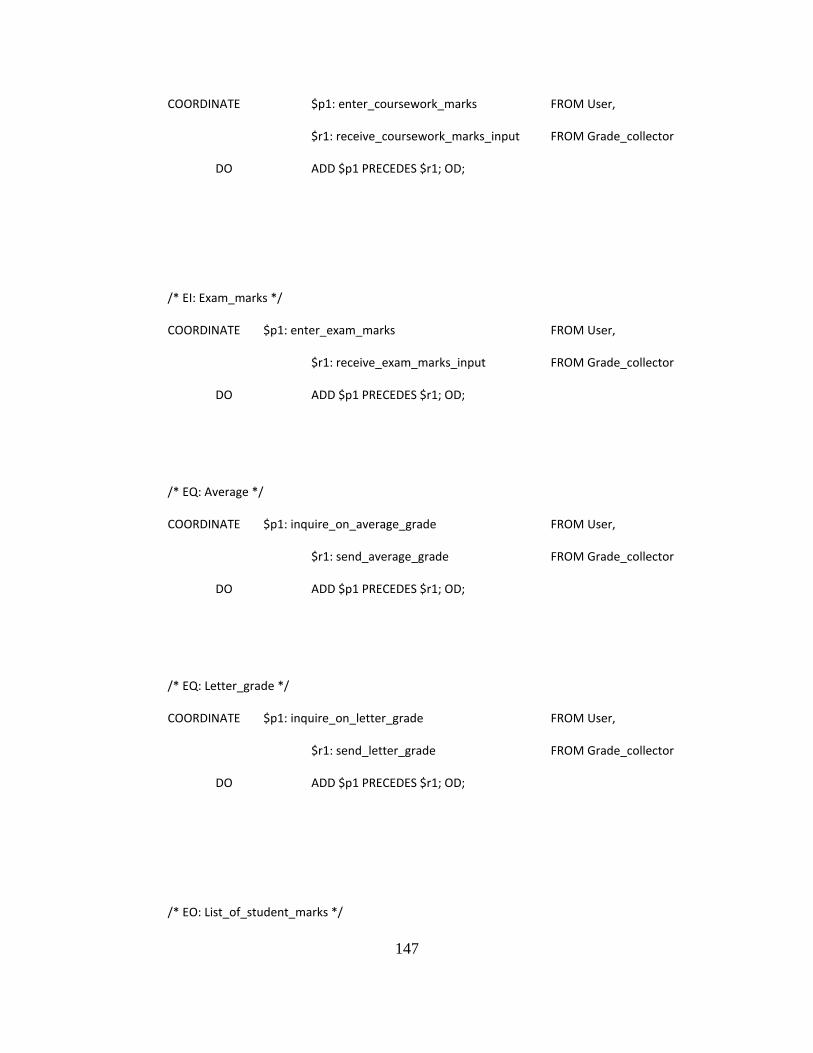
147
COORDINATE $p1: enter_coursework_marks FROM User,
$r1: receive_coursework_marks_input FROM Grade_collector
DO ADD $p1 PRECEDES $r1; OD;
/* EI: Exam_marks */
COORDINATE $p1: enter_exam_marks FROM User,
$r1: receive_exam_marks_input FROM Grade_collector
DO ADD $p1 PRECEDES $r1; OD;
/* EQ: Average */
COORDINATE $p1: inquire_on_average_grade FROM User,
$r1: send_average_grade FROM Grade_collector
DO ADD $p1 PRECEDES $r1; OD;
/* EQ: Letter_grade */
COORDINATE $p1: inquire_on_letter_grade FROM User,
$r1: send_letter_grade FROM Grade_collector
DO ADD $p1 PRECEDES $r1; OD;
/* EO: List_of_student_marks */
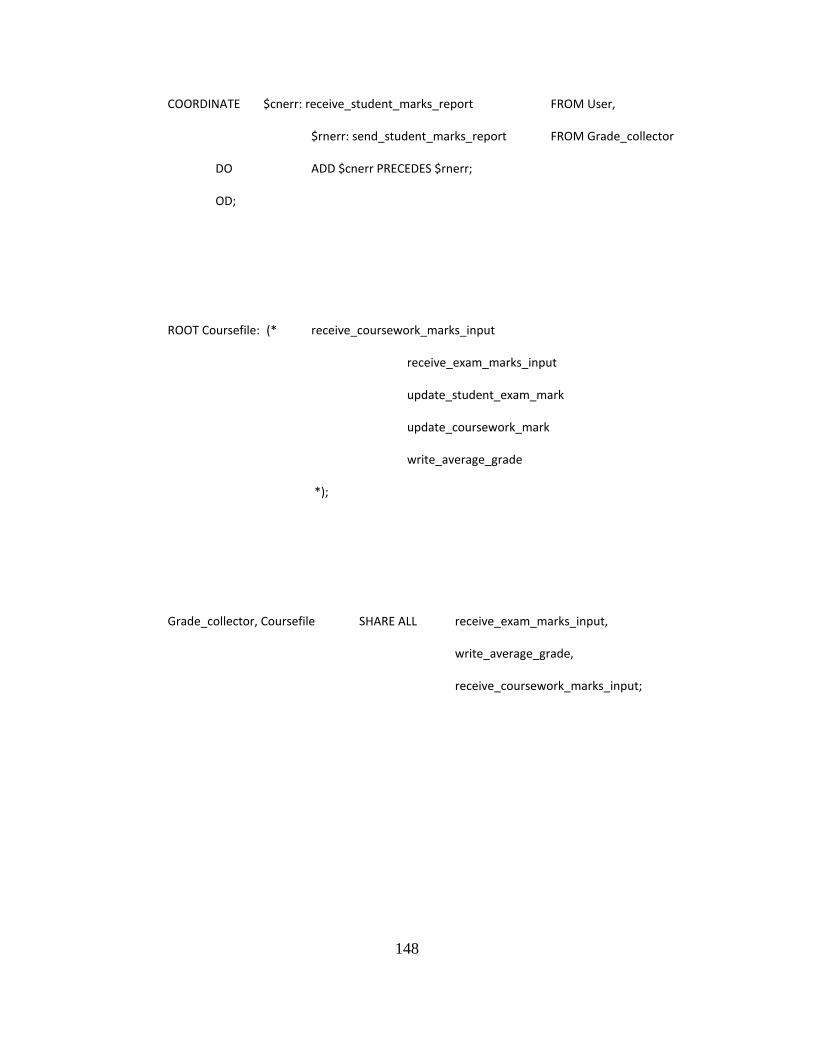
148
COORDINATE $cnerr: receive_student_marks_report FROM User,
$rnerr: send_student_marks_report FROM Grade_collector
DO ADD $cnerr PRECEDES $rnerr;
OD;
ROOT Coursefile: (* receive_coursework_marks_input
receive_exam_marks_input
update_student_exam_mark
update_coursework_mark
write_average_grade
*);
Grade_collector, Coursefile SHARE ALL receive_exam_marks_input,
write_average_grade,
receive_coursework_marks_input;
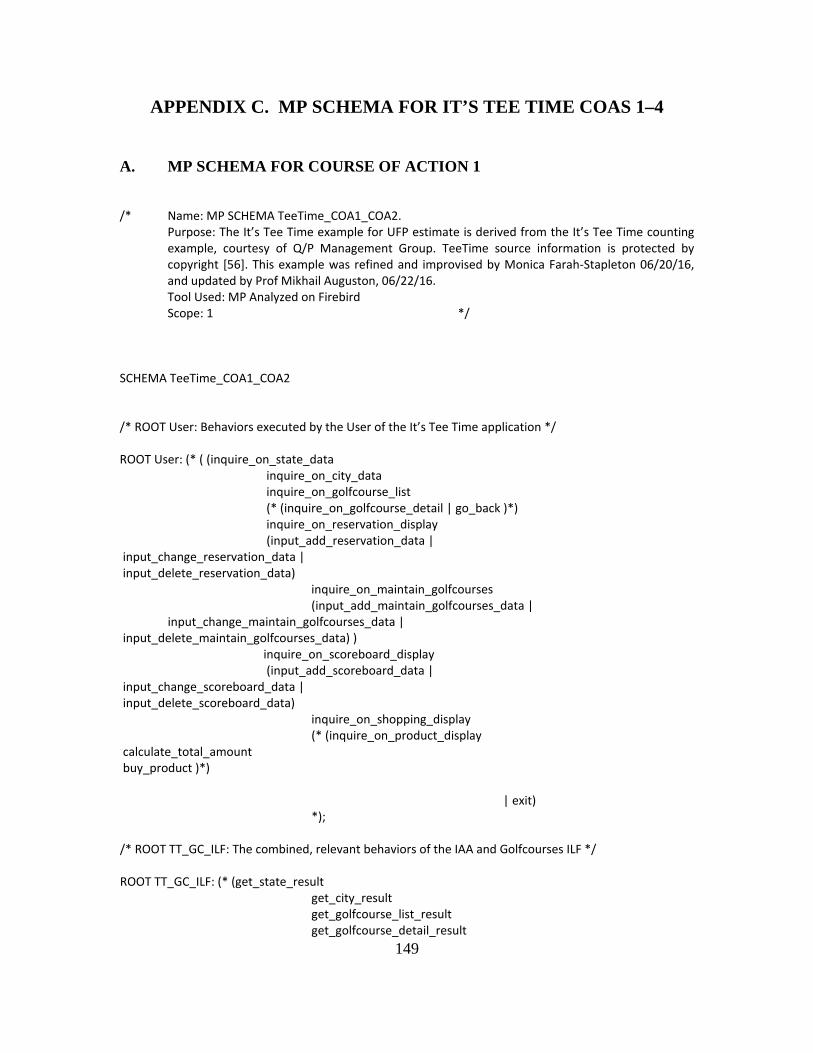
149
APPENDIX C. MP SCHEMA FOR IT’S TEE TIME COAS 1–4
A. MP SCHEMA FOR COURSE OF ACTION 1
/* Name: MP SCHEMA TeeTime_COA1_COA2.
Purpose: The It’s Tee Time example for UFP estimate is derived from the It’s Tee Time counting example, courtesy of Q/P Management Group. TeeTime source information is protected by copyright [56]. This example was refined and improvised by Monica Farah-Stapleton 06/20/16, and updated by Prof Mikhail Auguston, 06/22/16.
Tool Used: MP Analyzed on Firebird Scope: 1 */ SCHEMA TeeTime_COA1_COA2 /* ROOT User: Behaviors executed by the User of the It’s Tee Time application */ ROOT User: (* ( (inquire_on_state_data inquire_on_city_data inquire_on_golfcourse_list (* (inquire_on_golfcourse_detail | go_back )*) inquire_on_reservation_display (input_add_reservation_data | input_change_reservation_data | input_delete_reservation_data) inquire_on_maintain_golfcourses (input_add_maintain_golfcourses_data | input_change_maintain_golfcourses_data | input_delete_maintain_golfcourses_data) ) inquire_on_scoreboard_display (input_add_scoreboard_data | input_change_scoreboard_data | input_delete_scoreboard_data) inquire_on_shopping_display (* (inquire_on_product_display calculate_total_amount buy_product )*) | exit) *); /* ROOT TT_GC_ILF: The combined, relevant behaviors of the IAA and Golfcourses ILF */ ROOT TT_GC_ILF: (* (get_state_result get_city_result get_golfcourse_list_result get_golfcourse_detail_result
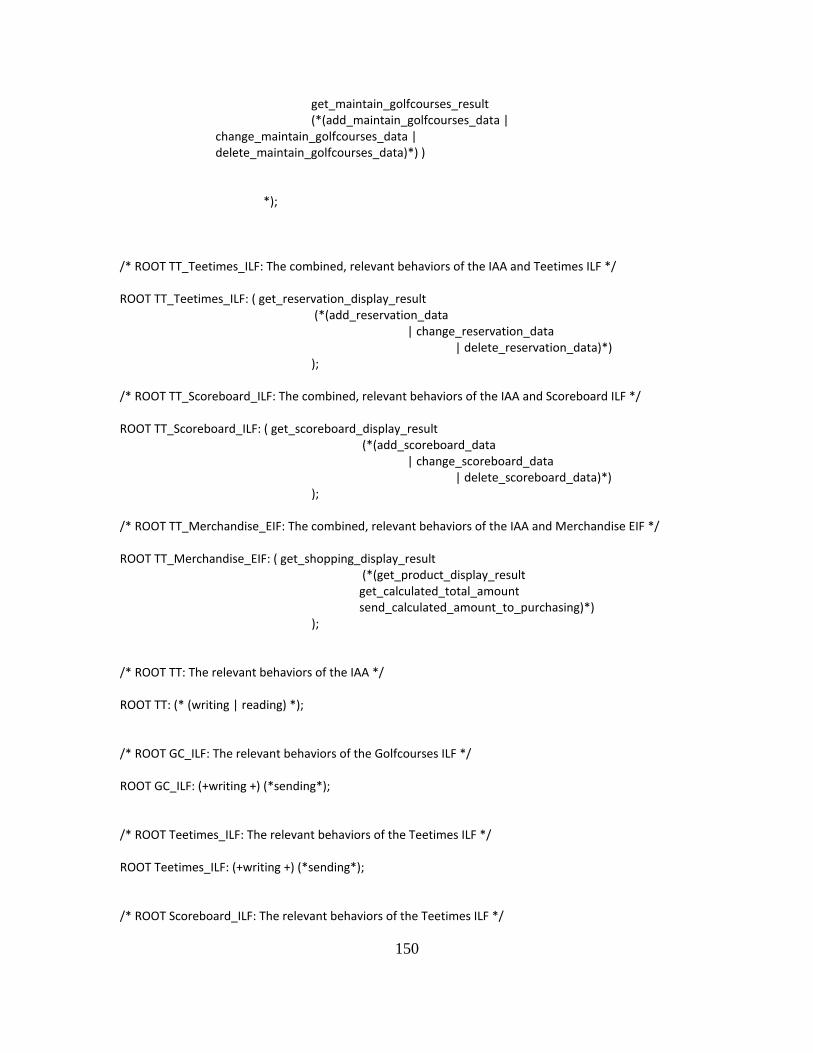
150
get_maintain_golfcourses_result (*(add_maintain_golfcourses_data | change_maintain_golfcourses_data | delete_maintain_golfcourses_data)*) ) *); /* ROOT TT_Teetimes_ILF: The combined, relevant behaviors of the IAA and Teetimes ILF */ ROOT TT_Teetimes_ILF: ( get_reservation_display_result (*(add_reservation_data | change_reservation_data | delete_reservation_data)*) ); /* ROOT TT_Scoreboard_ILF: The combined, relevant behaviors of the IAA and Scoreboard ILF */ ROOT TT_Scoreboard_ILF: ( get_scoreboard_display_result (*(add_scoreboard_data | change_scoreboard_data | delete_scoreboard_data)*) ); /* ROOT TT_Merchandise_EIF: The combined, relevant behaviors of the IAA and Merchandise EIF */ ROOT TT_Merchandise_EIF: ( get_shopping_display_result (*(get_product_display_result get_calculated_total_amount send_calculated_amount_to_purchasing)*) ); /* ROOT TT: The relevant behaviors of the IAA */ ROOT TT: (* (writing | reading) *); /* ROOT GC_ILF: The relevant behaviors of the Golfcourses ILF */ ROOT GC_ILF: (+writing +) (*sending*); /* ROOT Teetimes_ILF: The relevant behaviors of the Teetimes ILF */ ROOT Teetimes_ILF: (+writing +) (*sending*); /* ROOT Scoreboard_ILF: The relevant behaviors of the Teetimes ILF */
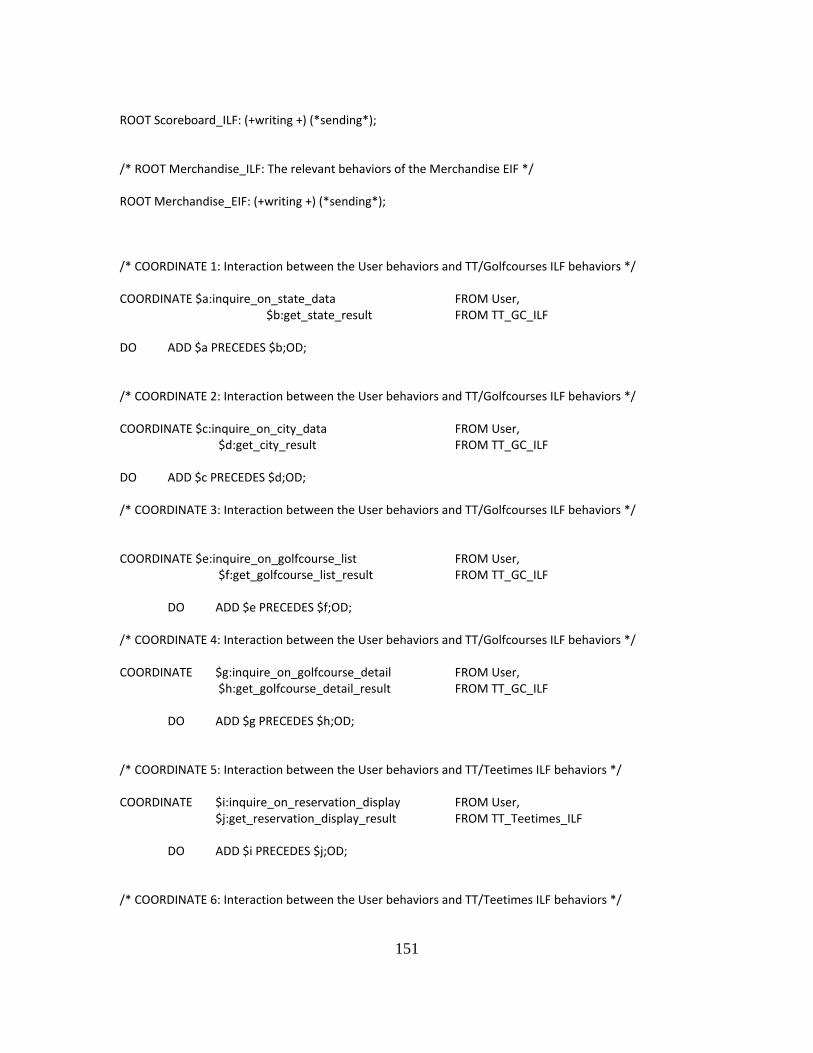
151
ROOT Scoreboard_ILF: (+writing +) (*sending*); /* ROOT Merchandise_ILF: The relevant behaviors of the Merchandise EIF */ ROOT Merchandise_EIF: (+writing +) (*sending*); /* COORDINATE 1: Interaction between the User behaviors and TT/Golfcourses ILF behaviors */ COORDINATE $a:inquire_on_state_data FROM User, $b:get_state_result FROM TT_GC_ILF DO ADD $a PRECEDES $b;OD; /* COORDINATE 2: Interaction between the User behaviors and TT/Golfcourses ILF behaviors */ COORDINATE $c:inquire_on_city_data FROM User, $d:get_city_result FROM TT_GC_ILF DO ADD $c PRECEDES $d;OD; /* COORDINATE 3: Interaction between the User behaviors and TT/Golfcourses ILF behaviors */ COORDINATE $e:inquire_on_golfcourse_list FROM User, $f:get_golfcourse_list_result FROM TT_GC_ILF DO ADD $e PRECEDES $f;OD; /* COORDINATE 4: Interaction between the User behaviors and TT/Golfcourses ILF behaviors */ COORDINATE $g:inquire_on_golfcourse_detail FROM User, $h:get_golfcourse_detail_result FROM TT_GC_ILF DO ADD $g PRECEDES $h;OD; /* COORDINATE 5: Interaction between the User behaviors and TT/Teetimes ILF behaviors */ COORDINATE $i:inquire_on_reservation_display FROM User, $j:get_reservation_display_result FROM TT_Teetimes_ILF DO ADD $i PRECEDES $j;OD; /* COORDINATE 6: Interaction between the User behaviors and TT/Teetimes ILF behaviors */
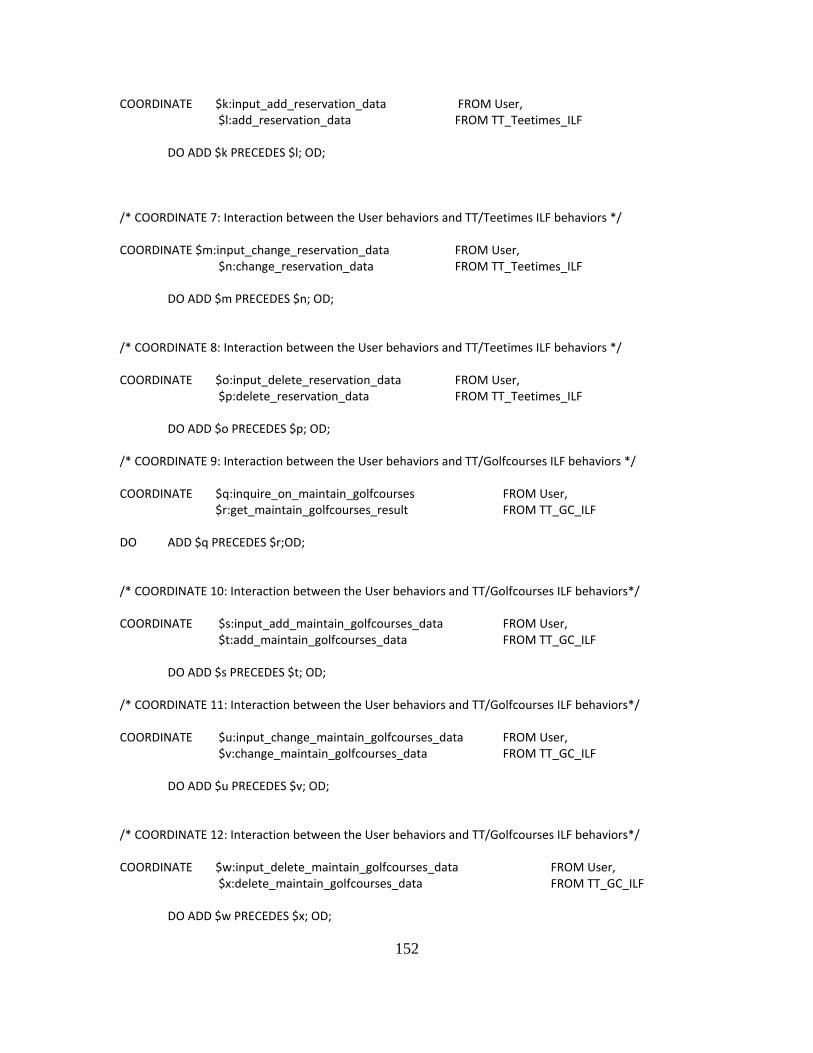
152
COORDINATE $k:input_add_reservation_data FROM User, $l:add_reservation_data FROM TT_Teetimes_ILF DO ADD $k PRECEDES $l; OD; /* COORDINATE 7: Interaction between the User behaviors and TT/Teetimes ILF behaviors */ COORDINATE $m:input_change_reservation_data FROM User, $n:change_reservation_data FROM TT_Teetimes_ILF DO ADD $m PRECEDES $n; OD; /* COORDINATE 8: Interaction between the User behaviors and TT/Teetimes ILF behaviors */ COORDINATE $o:input_delete_reservation_data FROM User, $p:delete_reservation_data FROM TT_Teetimes_ILF DO ADD $o PRECEDES $p; OD; /* COORDINATE 9: Interaction between the User behaviors and TT/Golfcourses ILF behaviors */ COORDINATE $q:inquire_on_maintain_golfcourses FROM User, $r:get_maintain_golfcourses_result FROM TT_GC_ILF DO ADD $q PRECEDES $r;OD; /* COORDINATE 10: Interaction between the User behaviors and TT/Golfcourses ILF behaviors*/ COORDINATE $s:input_add_maintain_golfcourses_data FROM User, $t:add_maintain_golfcourses_data FROM TT_GC_ILF DO ADD $s PRECEDES $t; OD; /* COORDINATE 11: Interaction between the User behaviors and TT/Golfcourses ILF behaviors*/ COORDINATE $u:input_change_maintain_golfcourses_data FROM User, $v:change_maintain_golfcourses_data FROM TT_GC_ILF DO ADD $u PRECEDES $v; OD; /* COORDINATE 12: Interaction between the User behaviors and TT/Golfcourses ILF behaviors*/ COORDINATE $w:input_delete_maintain_golfcourses_data FROM User, $x:delete_maintain_golfcourses_data FROM TT_GC_ILF DO ADD $w PRECEDES $x; OD;
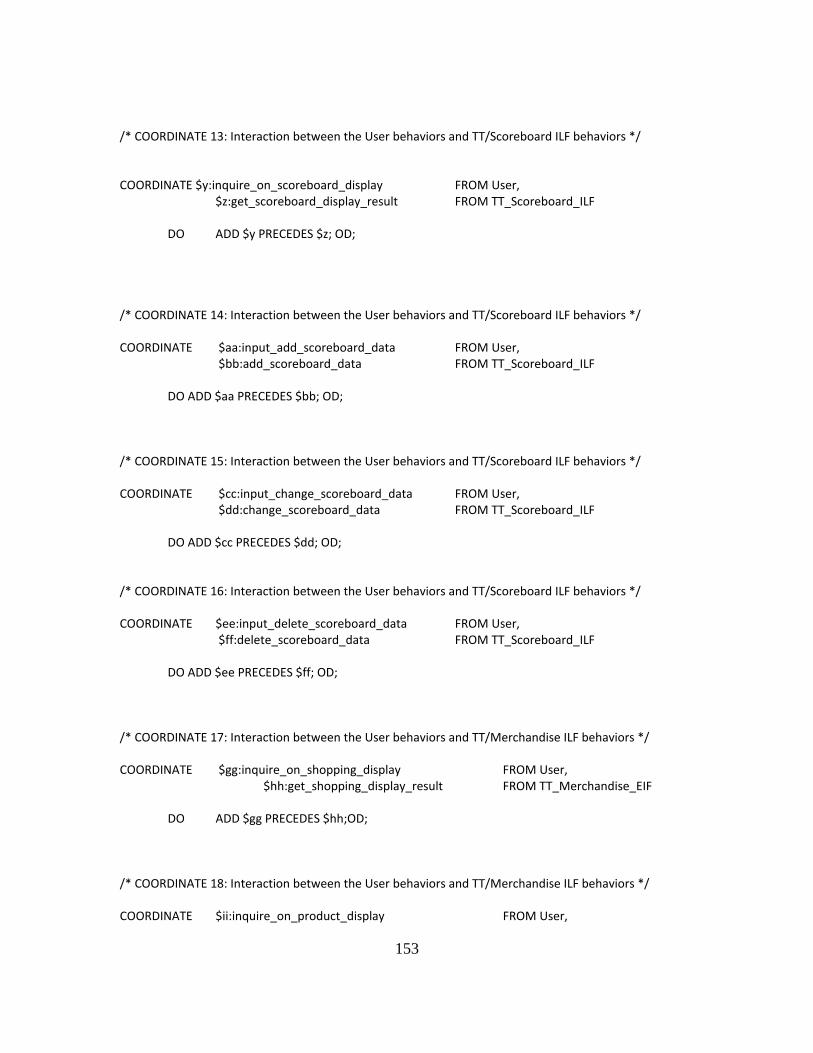
153
/* COORDINATE 13: Interaction between the User behaviors and TT/Scoreboard ILF behaviors */ COORDINATE $y:inquire_on_scoreboard_display FROM User, $z:get_scoreboard_display_result FROM TT_Scoreboard_ILF DO ADD $y PRECEDES $z; OD; /* COORDINATE 14: Interaction between the User behaviors and TT/Scoreboard ILF behaviors */ COORDINATE $aa:input_add_scoreboard_data FROM User, $bb:add_scoreboard_data FROM TT_Scoreboard_ILF DO ADD $aa PRECEDES $bb; OD; /* COORDINATE 15: Interaction between the User behaviors and TT/Scoreboard ILF behaviors */ COORDINATE $cc:input_change_scoreboard_data FROM User, $dd:change_scoreboard_data FROM TT_Scoreboard_ILF DO ADD $cc PRECEDES $dd; OD; /* COORDINATE 16: Interaction between the User behaviors and TT/Scoreboard ILF behaviors */ COORDINATE $ee:input_delete_scoreboard_data FROM User, $ff:delete_scoreboard_data FROM TT_Scoreboard_ILF DO ADD $ee PRECEDES $ff; OD; /* COORDINATE 17: Interaction between the User behaviors and TT/Merchandise ILF behaviors */ COORDINATE $gg:inquire_on_shopping_display FROM User, $hh:get_shopping_display_result FROM TT_Merchandise_EIF DO ADD $gg PRECEDES $hh;OD; /* COORDINATE 18: Interaction between the User behaviors and TT/Merchandise ILF behaviors */ COORDINATE $ii:inquire_on_product_display FROM User,
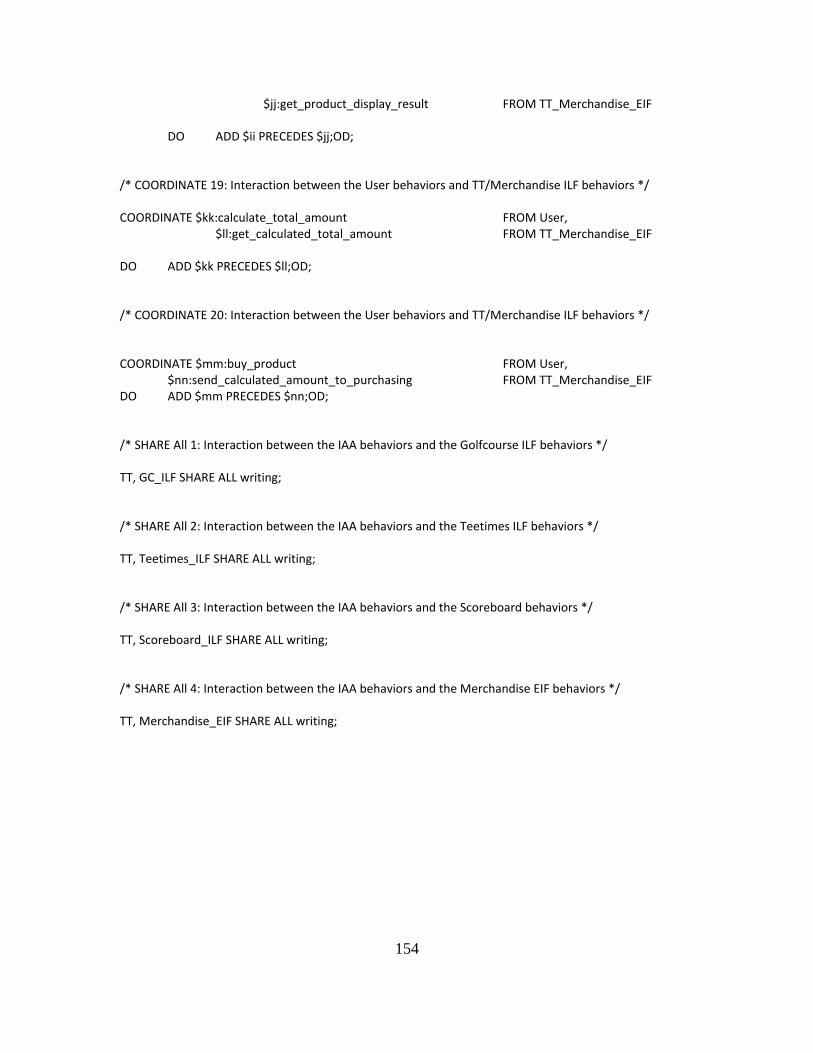
154
$jj:get_product_display_result FROM TT_Merchandise_EIF DO ADD $ii PRECEDES $jj;OD; /* COORDINATE 19: Interaction between the User behaviors and TT/Merchandise ILF behaviors */ COORDINATE $kk:calculate_total_amount FROM User, $ll:get_calculated_total_amount FROM TT_Merchandise_EIF DO ADD $kk PRECEDES $ll;OD; /* COORDINATE 20: Interaction between the User behaviors and TT/Merchandise ILF behaviors */ COORDINATE $mm:buy_product FROM User, $nn:send_calculated_amount_to_purchasing FROM TT_Merchandise_EIF DO ADD $mm PRECEDES $nn;OD; /* SHARE All 1: Interaction between the IAA behaviors and the Golfcourse ILF behaviors */ TT, GC_ILF SHARE ALL writing; /* SHARE All 2: Interaction between the IAA behaviors and the Teetimes ILF behaviors */ TT, Teetimes_ILF SHARE ALL writing; /* SHARE All 3: Interaction between the IAA behaviors and the Scoreboard behaviors */ TT, Scoreboard_ILF SHARE ALL writing; /* SHARE All 4: Interaction between the IAA behaviors and the Merchandise EIF behaviors */ TT, Merchandise_EIF SHARE ALL writing;
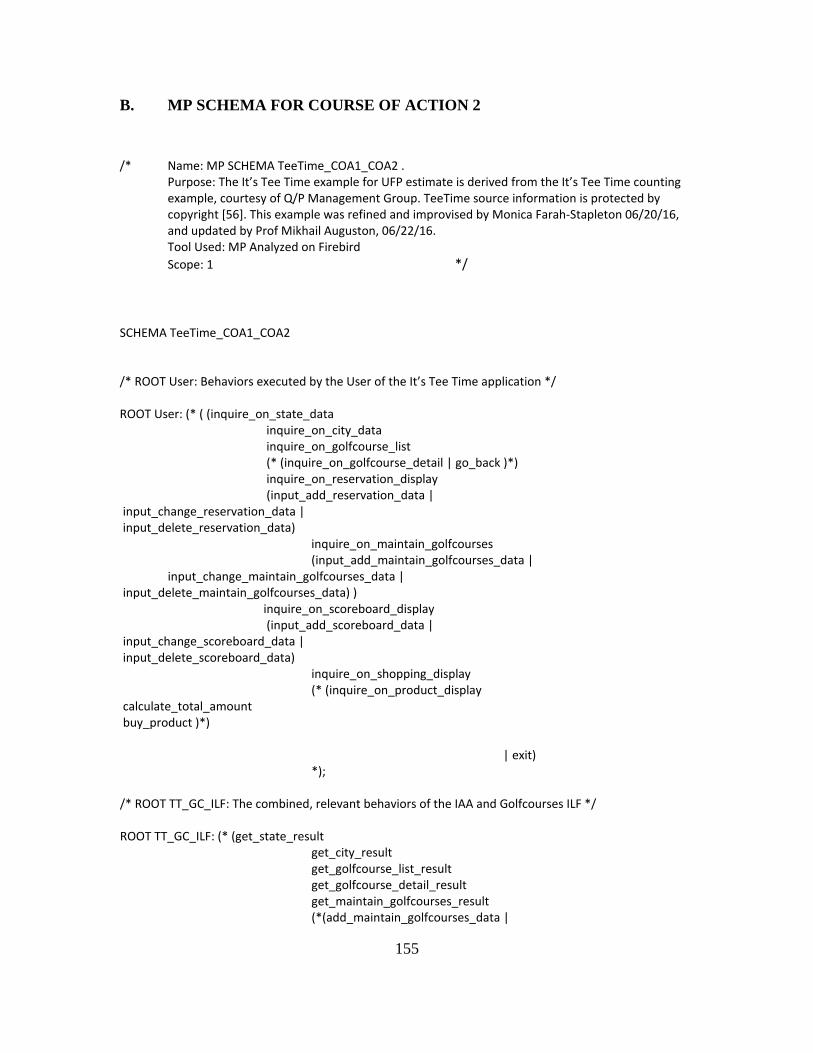
155
B. MP SCHEMA FOR COURSE OF ACTION 2
/* Name: MP SCHEMA TeeTime_COA1_COA2 .
Purpose: The It’s Tee Time example for UFP estimate is derived from the It’s Tee Time counting example, courtesy of Q/P Management Group. TeeTime source information is protected by copyright [56]. This example was refined and improvised by Monica Farah-Stapleton 06/20/16, and updated by Prof Mikhail Auguston, 06/22/16.
Tool Used: MP Analyzed on Firebird Scope: 1 */
SCHEMA TeeTime_COA1_COA2 /* ROOT User: Behaviors executed by the User of the It’s Tee Time application */ ROOT User: (* ( (inquire_on_state_data inquire_on_city_data inquire_on_golfcourse_list (* (inquire_on_golfcourse_detail | go_back )*) inquire_on_reservation_display (input_add_reservation_data | input_change_reservation_data | input_delete_reservation_data) inquire_on_maintain_golfcourses (input_add_maintain_golfcourses_data | input_change_maintain_golfcourses_data | input_delete_maintain_golfcourses_data) ) inquire_on_scoreboard_display (input_add_scoreboard_data | input_change_scoreboard_data | input_delete_scoreboard_data) inquire_on_shopping_display (* (inquire_on_product_display calculate_total_amount buy_product )*) | exit) *); /* ROOT TT_GC_ILF: The combined, relevant behaviors of the IAA and Golfcourses ILF */ ROOT TT_GC_ILF: (* (get_state_result get_city_result get_golfcourse_list_result get_golfcourse_detail_result get_maintain_golfcourses_result (*(add_maintain_golfcourses_data |
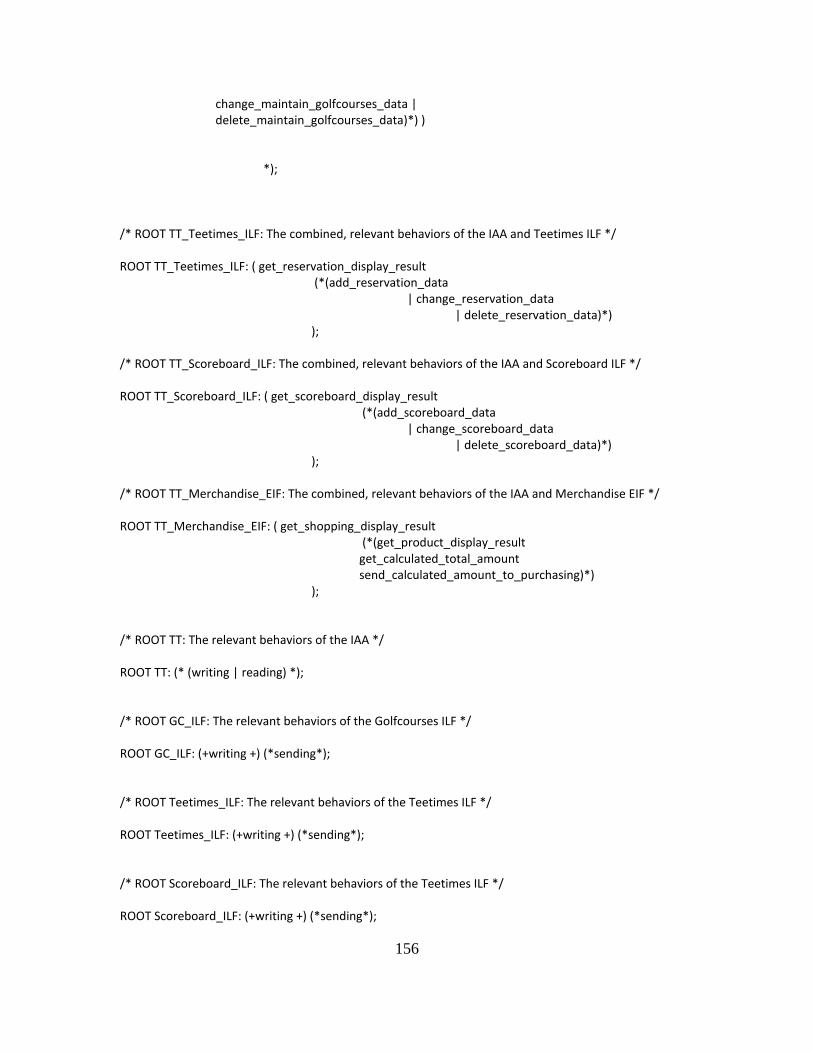
156
change_maintain_golfcourses_data | delete_maintain_golfcourses_data)*) ) *); /* ROOT TT_Teetimes_ILF: The combined, relevant behaviors of the IAA and Teetimes ILF */ ROOT TT_Teetimes_ILF: ( get_reservation_display_result (*(add_reservation_data | change_reservation_data | delete_reservation_data)*) ); /* ROOT TT_Scoreboard_ILF: The combined, relevant behaviors of the IAA and Scoreboard ILF */ ROOT TT_Scoreboard_ILF: ( get_scoreboard_display_result (*(add_scoreboard_data | change_scoreboard_data | delete_scoreboard_data)*) ); /* ROOT TT_Merchandise_EIF: The combined, relevant behaviors of the IAA and Merchandise EIF */ ROOT TT_Merchandise_EIF: ( get_shopping_display_result (*(get_product_display_result get_calculated_total_amount send_calculated_amount_to_purchasing)*) ); /* ROOT TT: The relevant behaviors of the IAA */ ROOT TT: (* (writing | reading) *); /* ROOT GC_ILF: The relevant behaviors of the Golfcourses ILF */ ROOT GC_ILF: (+writing +) (*sending*); /* ROOT Teetimes_ILF: The relevant behaviors of the Teetimes ILF */ ROOT Teetimes_ILF: (+writing +) (*sending*); /* ROOT Scoreboard_ILF: The relevant behaviors of the Teetimes ILF */ ROOT Scoreboard_ILF: (+writing +) (*sending*);
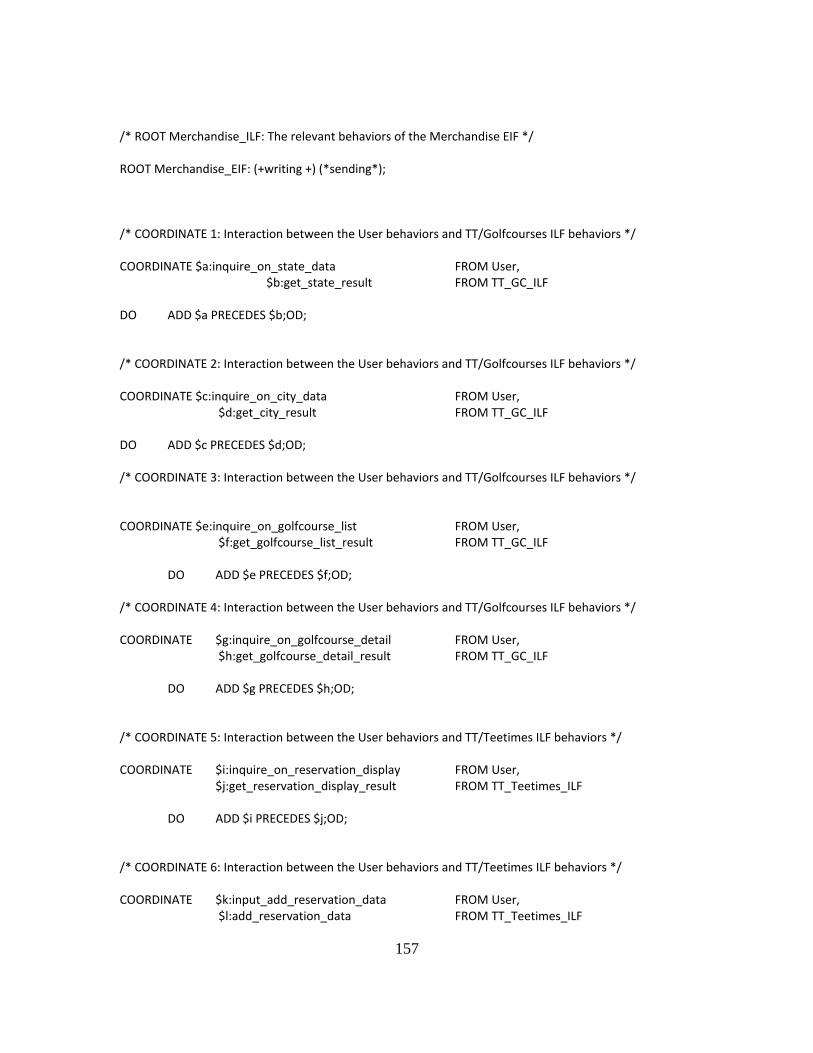
157
/* ROOT Merchandise_ILF: The relevant behaviors of the Merchandise EIF */ ROOT Merchandise_EIF: (+writing +) (*sending*); /* COORDINATE 1: Interaction between the User behaviors and TT/Golfcourses ILF behaviors */ COORDINATE $a:inquire_on_state_data FROM User, $b:get_state_result FROM TT_GC_ILF DO ADD $a PRECEDES $b;OD; /* COORDINATE 2: Interaction between the User behaviors and TT/Golfcourses ILF behaviors */ COORDINATE $c:inquire_on_city_data FROM User, $d:get_city_result FROM TT_GC_ILF DO ADD $c PRECEDES $d;OD; /* COORDINATE 3: Interaction between the User behaviors and TT/Golfcourses ILF behaviors */ COORDINATE $e:inquire_on_golfcourse_list FROM User, $f:get_golfcourse_list_result FROM TT_GC_ILF DO ADD $e PRECEDES $f;OD; /* COORDINATE 4: Interaction between the User behaviors and TT/Golfcourses ILF behaviors */ COORDINATE $g:inquire_on_golfcourse_detail FROM User, $h:get_golfcourse_detail_result FROM TT_GC_ILF DO ADD $g PRECEDES $h;OD; /* COORDINATE 5: Interaction between the User behaviors and TT/Teetimes ILF behaviors */ COORDINATE $i:inquire_on_reservation_display FROM User, $j:get_reservation_display_result FROM TT_Teetimes_ILF DO ADD $i PRECEDES $j;OD; /* COORDINATE 6: Interaction between the User behaviors and TT/Teetimes ILF behaviors */ COORDINATE $k:input_add_reservation_data FROM User, $l:add_reservation_data FROM TT_Teetimes_ILF
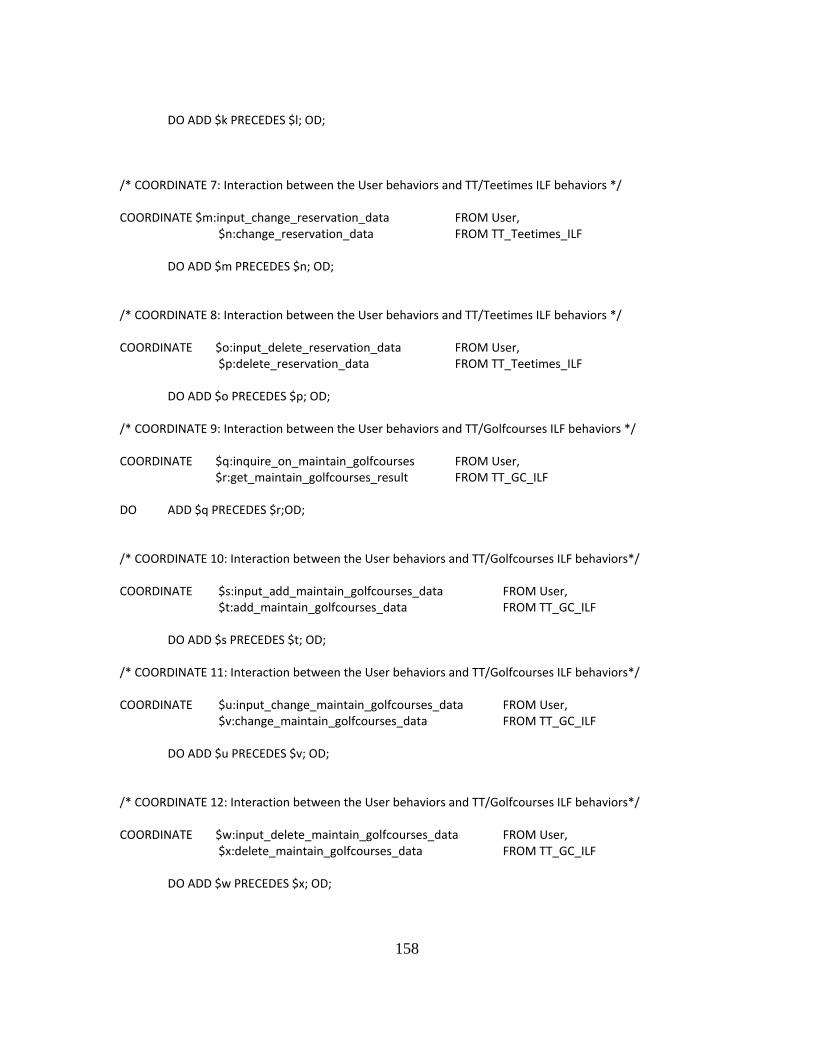
158
DO ADD $k PRECEDES $l; OD; /* COORDINATE 7: Interaction between the User behaviors and TT/Teetimes ILF behaviors */ COORDINATE $m:input_change_reservation_data FROM User, $n:change_reservation_data FROM TT_Teetimes_ILF DO ADD $m PRECEDES $n; OD; /* COORDINATE 8: Interaction between the User behaviors and TT/Teetimes ILF behaviors */ COORDINATE $o:input_delete_reservation_data FROM User, $p:delete_reservation_data FROM TT_Teetimes_ILF DO ADD $o PRECEDES $p; OD; /* COORDINATE 9: Interaction between the User behaviors and TT/Golfcourses ILF behaviors */ COORDINATE $q:inquire_on_maintain_golfcourses FROM User, $r:get_maintain_golfcourses_result FROM TT_GC_ILF DO ADD $q PRECEDES $r;OD; /* COORDINATE 10: Interaction between the User behaviors and TT/Golfcourses ILF behaviors*/ COORDINATE $s:input_add_maintain_golfcourses_data FROM User, $t:add_maintain_golfcourses_data FROM TT_GC_ILF DO ADD $s PRECEDES $t; OD; /* COORDINATE 11: Interaction between the User behaviors and TT/Golfcourses ILF behaviors*/ COORDINATE $u:input_change_maintain_golfcourses_data FROM User, $v:change_maintain_golfcourses_data FROM TT_GC_ILF DO ADD $u PRECEDES $v; OD; /* COORDINATE 12: Interaction between the User behaviors and TT/Golfcourses ILF behaviors*/ COORDINATE $w:input_delete_maintain_golfcourses_data FROM User, $x:delete_maintain_golfcourses_data FROM TT_GC_ILF DO ADD $w PRECEDES $x; OD;
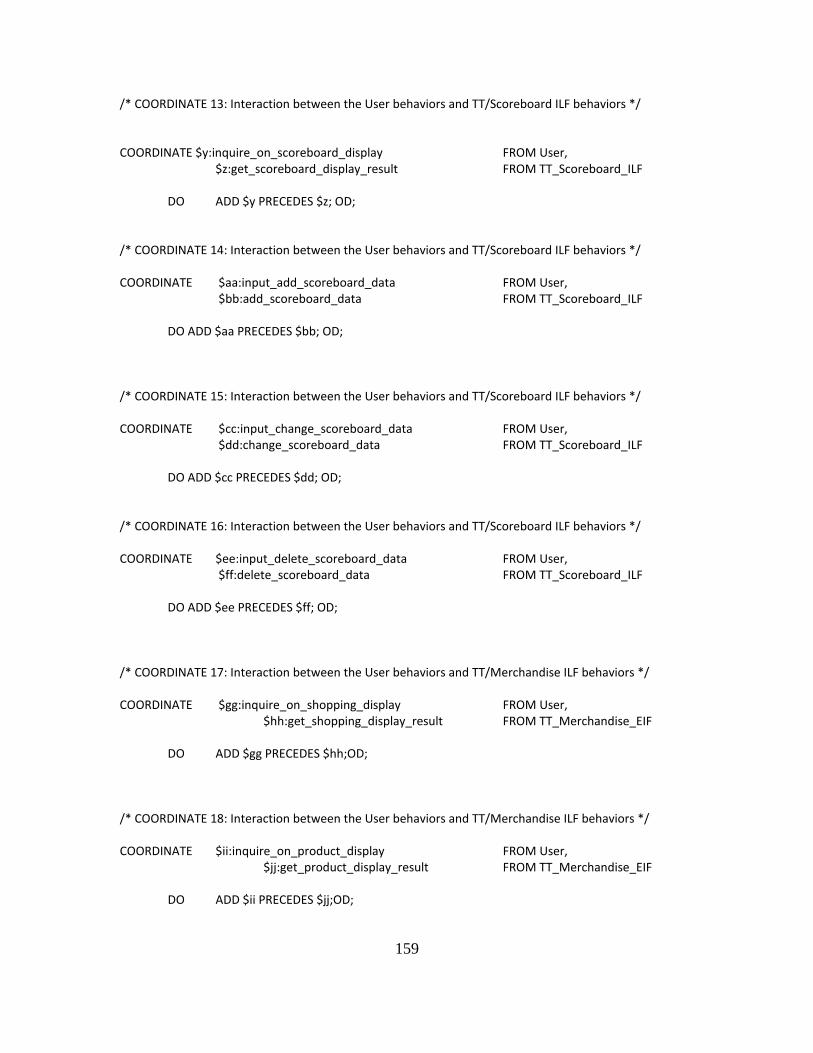
159
/* COORDINATE 13: Interaction between the User behaviors and TT/Scoreboard ILF behaviors */ COORDINATE $y:inquire_on_scoreboard_display FROM User, $z:get_scoreboard_display_result FROM TT_Scoreboard_ILF DO ADD $y PRECEDES $z; OD; /* COORDINATE 14: Interaction between the User behaviors and TT/Scoreboard ILF behaviors */ COORDINATE $aa:input_add_scoreboard_data FROM User, $bb:add_scoreboard_data FROM TT_Scoreboard_ILF DO ADD $aa PRECEDES $bb; OD; /* COORDINATE 15: Interaction between the User behaviors and TT/Scoreboard ILF behaviors */ COORDINATE $cc:input_change_scoreboard_data FROM User, $dd:change_scoreboard_data FROM TT_Scoreboard_ILF DO ADD $cc PRECEDES $dd; OD; /* COORDINATE 16: Interaction between the User behaviors and TT/Scoreboard ILF behaviors */ COORDINATE $ee:input_delete_scoreboard_data FROM User, $ff:delete_scoreboard_data FROM TT_Scoreboard_ILF DO ADD $ee PRECEDES $ff; OD; /* COORDINATE 17: Interaction between the User behaviors and TT/Merchandise ILF behaviors */ COORDINATE $gg:inquire_on_shopping_display FROM User, $hh:get_shopping_display_result FROM TT_Merchandise_EIF DO ADD $gg PRECEDES $hh;OD; /* COORDINATE 18: Interaction between the User behaviors and TT/Merchandise ILF behaviors */ COORDINATE $ii:inquire_on_product_display FROM User, $jj:get_product_display_result FROM TT_Merchandise_EIF DO ADD $ii PRECEDES $jj;OD;
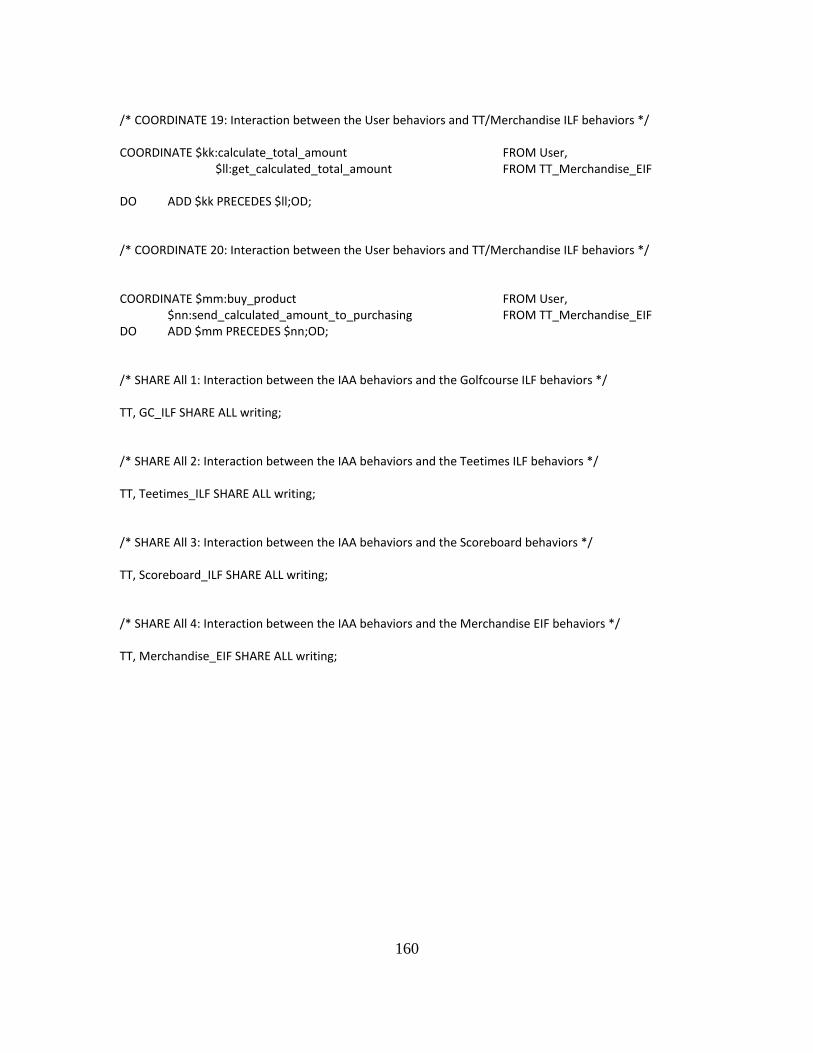
160
/* COORDINATE 19: Interaction between the User behaviors and TT/Merchandise ILF behaviors */ COORDINATE $kk:calculate_total_amount FROM User, $ll:get_calculated_total_amount FROM TT_Merchandise_EIF DO ADD $kk PRECEDES $ll;OD; /* COORDINATE 20: Interaction between the User behaviors and TT/Merchandise ILF behaviors */ COORDINATE $mm:buy_product FROM User, $nn:send_calculated_amount_to_purchasing FROM TT_Merchandise_EIF DO ADD $mm PRECEDES $nn;OD; /* SHARE All 1: Interaction between the IAA behaviors and the Golfcourse ILF behaviors */ TT, GC_ILF SHARE ALL writing; /* SHARE All 2: Interaction between the IAA behaviors and the Teetimes ILF behaviors */ TT, Teetimes_ILF SHARE ALL writing; /* SHARE All 3: Interaction between the IAA behaviors and the Scoreboard behaviors */ TT, Scoreboard_ILF SHARE ALL writing; /* SHARE All 4: Interaction between the IAA behaviors and the Merchandise EIF behaviors */ TT, Merchandise_EIF SHARE ALL writing;
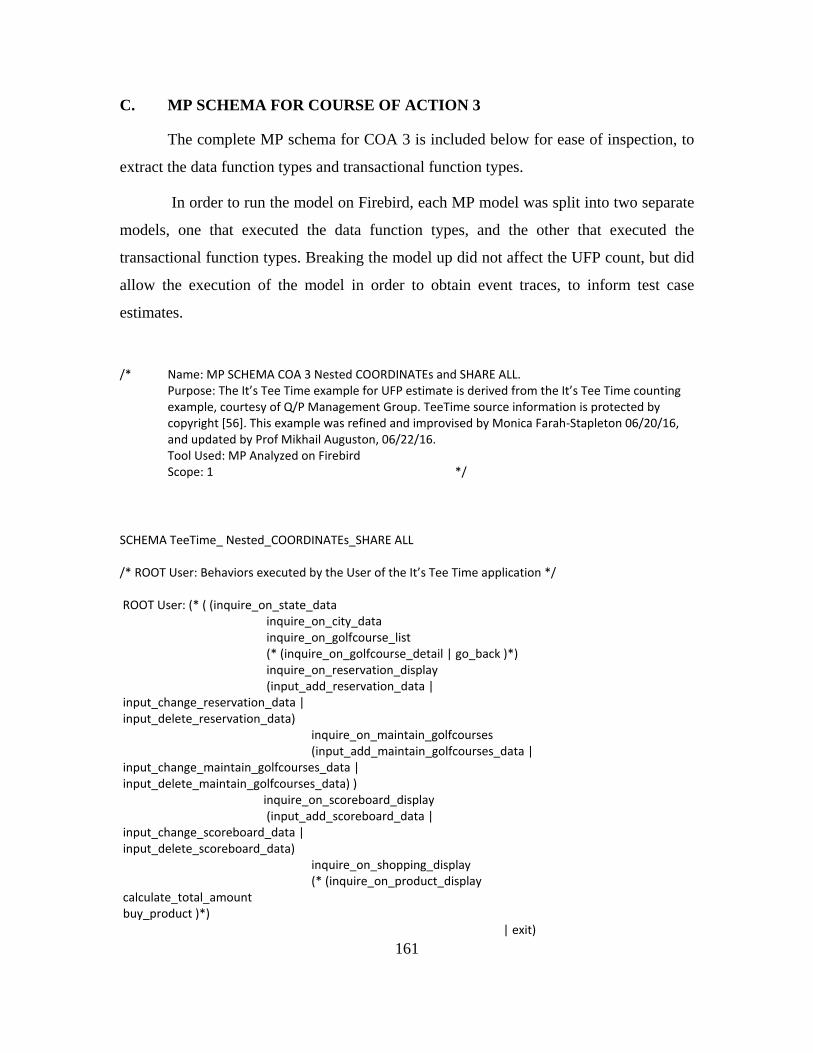
161
C. MP SCHEMA FOR COURSE OF ACTION 3
The complete MP schema for COA 3 is included below for ease of inspection, to
extract the data function types and transactional function types.
In order to run the model on Firebird, each MP model was split into two separate
models, one that executed the data function types, and the other that executed the
transactional function types. Breaking the model up did not affect the UFP count, but did
allow the execution of the model in order to obtain event traces, to inform test case
estimates.
/* Name: MP SCHEMA COA 3 Nested COORDINATEs and SHARE ALL.
Purpose: The It’s Tee Time example for UFP estimate is derived from the It’s Tee Time counting example, courtesy of Q/P Management Group. TeeTime source information is protected by copyright [56]. This example was refined and improvised by Monica Farah-Stapleton 06/20/16, and updated by Prof Mikhail Auguston, 06/22/16.
Tool Used: MP Analyzed on Firebird Scope: 1 */ SCHEMA TeeTime_ Nested_COORDINATEs_SHARE ALL /* ROOT User: Behaviors executed by the User of the It’s Tee Time application */ ROOT User: (* ( (inquire_on_state_data inquire_on_city_data inquire_on_golfcourse_list (* (inquire_on_golfcourse_detail | go_back )*) inquire_on_reservation_display (input_add_reservation_data | input_change_reservation_data | input_delete_reservation_data) inquire_on_maintain_golfcourses (input_add_maintain_golfcourses_data | input_change_maintain_golfcourses_data | input_delete_maintain_golfcourses_data) ) inquire_on_scoreboard_display (input_add_scoreboard_data | input_change_scoreboard_data | input_delete_scoreboard_data) inquire_on_shopping_display (* (inquire_on_product_display calculate_total_amount buy_product )*) | exit)
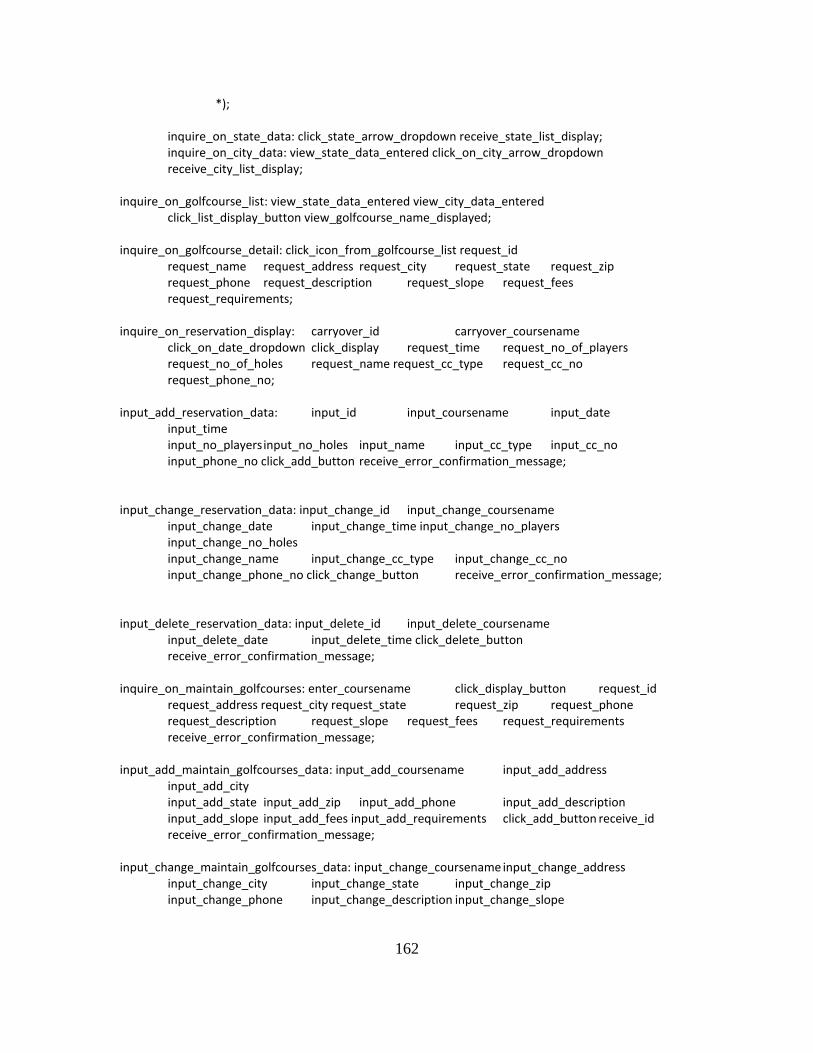
162
*); inquire_on_state_data: click_state_arrow_dropdown receive_state_list_display; inquire_on_city_data: view_state_data_entered click_on_city_arrow_dropdown receive_city_list_display; inquire_on_golfcourse_list: view_state_data_entered view_city_data_entered click_list_display_button view_golfcourse_name_displayed; inquire_on_golfcourse_detail: click_icon_from_golfcourse_list request_id request_name request_address request_city request_state request_zip request_phone request_description request_slope request_fees request_requirements; inquire_on_reservation_display: carryover_id carryover_coursename click_on_date_dropdown click_display request_time request_no_of_players request_no_of_holes request_name request_cc_type request_cc_no request_phone_no; input_add_reservation_data: input_id input_coursename input_date input_time input_no_players input_no_holes input_name input_cc_type input_cc_no input_phone_no click_add_button receive_error_confirmation_message; input_change_reservation_data: input_change_id input_change_coursename input_change_date input_change_time input_change_no_players input_change_no_holes input_change_name input_change_cc_type input_change_cc_no input_change_phone_no click_change_button receive_error_confirmation_message; input_delete_reservation_data: input_delete_id input_delete_coursename input_delete_date input_delete_time click_delete_button receive_error_confirmation_message; inquire_on_maintain_golfcourses: enter_coursename click_display_button request_id request_address request_city request_state request_zip request_phone request_description request_slope request_fees request_requirements receive_error_confirmation_message; input_add_maintain_golfcourses_data: input_add_coursename input_add_address input_add_city input_add_state input_add_zip input_add_phone input_add_description input_add_slope input_add_fees input_add_requirements click_add_button receive_id receive_error_confirmation_message; input_change_maintain_golfcourses_data: input_change_coursename input_change_address input_change_city input_change_state input_change_zip input_change_phone input_change_description input_change_slope
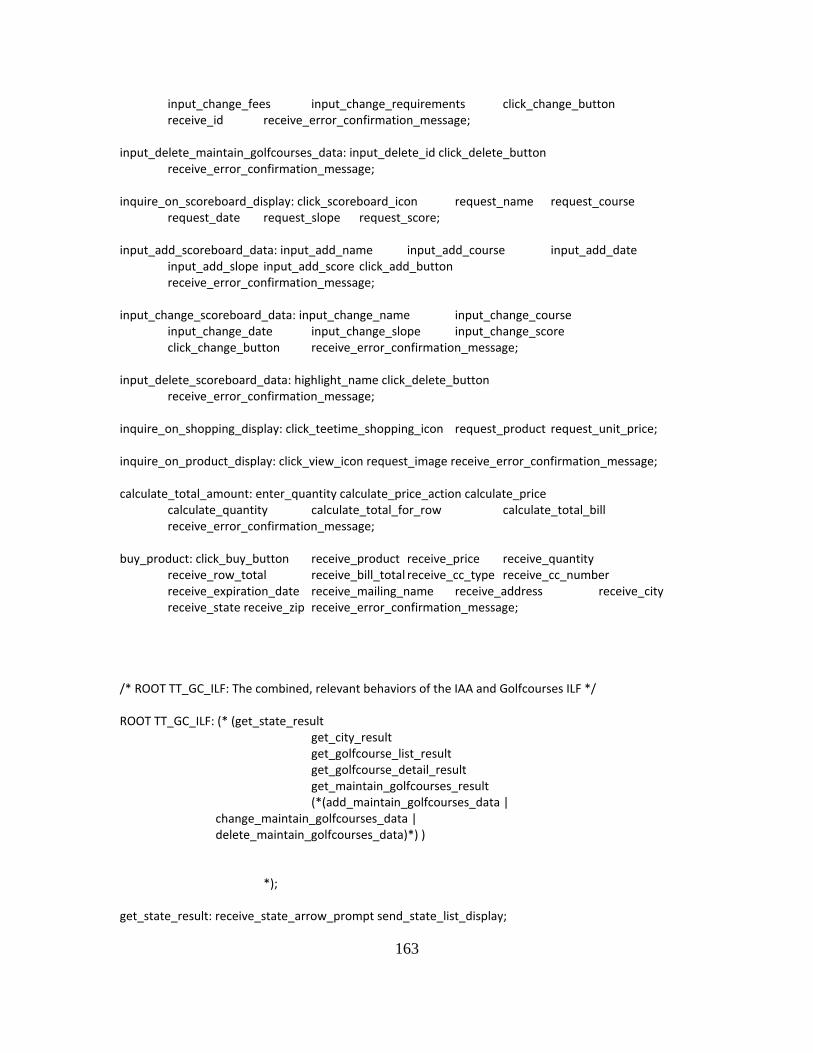
163
input_change_fees input_change_requirements click_change_button receive_id receive_error_confirmation_message; input_delete_maintain_golfcourses_data: input_delete_id click_delete_button receive_error_confirmation_message; inquire_on_scoreboard_display: click_scoreboard_icon request_name request_course request_date request_slope request_score; input_add_scoreboard_data: input_add_name input_add_course input_add_date input_add_slope input_add_score click_add_button receive_error_confirmation_message; input_change_scoreboard_data: input_change_name input_change_course input_change_date input_change_slope input_change_score click_change_button receive_error_confirmation_message; input_delete_scoreboard_data: highlight_name click_delete_button receive_error_confirmation_message; inquire_on_shopping_display: click_teetime_shopping_icon request_product request_unit_price; inquire_on_product_display: click_view_icon request_image receive_error_confirmation_message; calculate_total_amount: enter_quantity calculate_price_action calculate_price calculate_quantity calculate_total_for_row calculate_total_bill receive_error_confirmation_message; buy_product: click_buy_button receive_product receive_price receive_quantity receive_row_total receive_bill_total receive_cc_type receive_cc_number receive_expiration_date receive_mailing_name receive_address receive_city receive_state receive_zip receive_error_confirmation_message; /* ROOT TT_GC_ILF: The combined, relevant behaviors of the IAA and Golfcourses ILF */ ROOT TT_GC_ILF: (* (get_state_result get_city_result get_golfcourse_list_result get_golfcourse_detail_result get_maintain_golfcourses_result (*(add_maintain_golfcourses_data | change_maintain_golfcourses_data | delete_maintain_golfcourses_data)*) ) *); get_state_result: receive_state_arrow_prompt send_state_list_display;
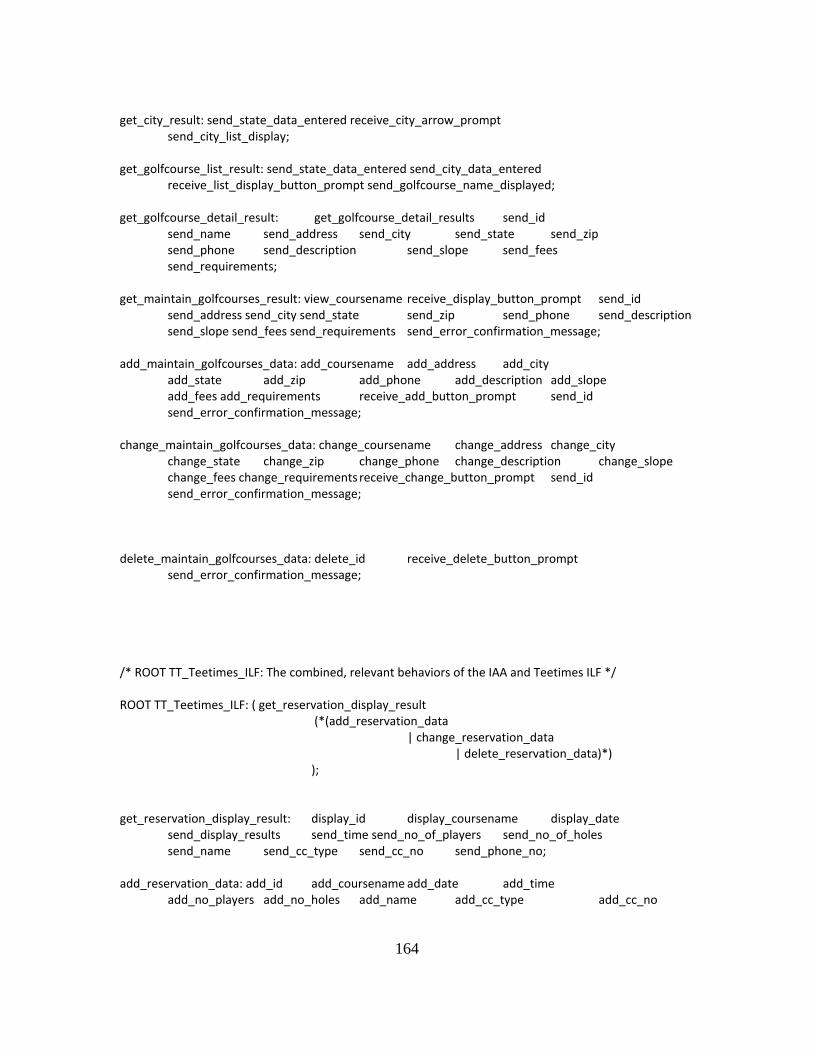
164
get_city_result: send_state_data_entered receive_city_arrow_prompt send_city_list_display; get_golfcourse_list_result: send_state_data_entered send_city_data_entered receive_list_display_button_prompt send_golfcourse_name_displayed; get_golfcourse_detail_result: get_golfcourse_detail_results send_id send_name send_address send_city send_state send_zip send_phone send_description send_slope send_fees send_requirements; get_maintain_golfcourses_result: view_coursename receive_display_button_prompt send_id send_address send_city send_state send_zip send_phone send_description send_slope send_fees send_requirements send_error_confirmation_message; add_maintain_golfcourses_data: add_coursename add_address add_city add_state add_zip add_phone add_description add_slope add_fees add_requirements receive_add_button_prompt send_id send_error_confirmation_message; change_maintain_golfcourses_data: change_coursename change_address change_city change_state change_zip change_phone change_description change_slope change_fees change_requirements receive_change_button_prompt send_id send_error_confirmation_message; delete_maintain_golfcourses_data: delete_id receive_delete_button_prompt send_error_confirmation_message; /* ROOT TT_Teetimes_ILF: The combined, relevant behaviors of the IAA and Teetimes ILF */ ROOT TT_Teetimes_ILF: ( get_reservation_display_result (*(add_reservation_data | change_reservation_data | delete_reservation_data)*) ); get_reservation_display_result: display_id display_coursename display_date send_display_results send_time send_no_of_players send_no_of_holes send_name send_cc_type send_cc_no send_phone_no; add_reservation_data: add_id add_coursename add_date add_time add_no_players add_no_holes add_name add_cc_type add_cc_no
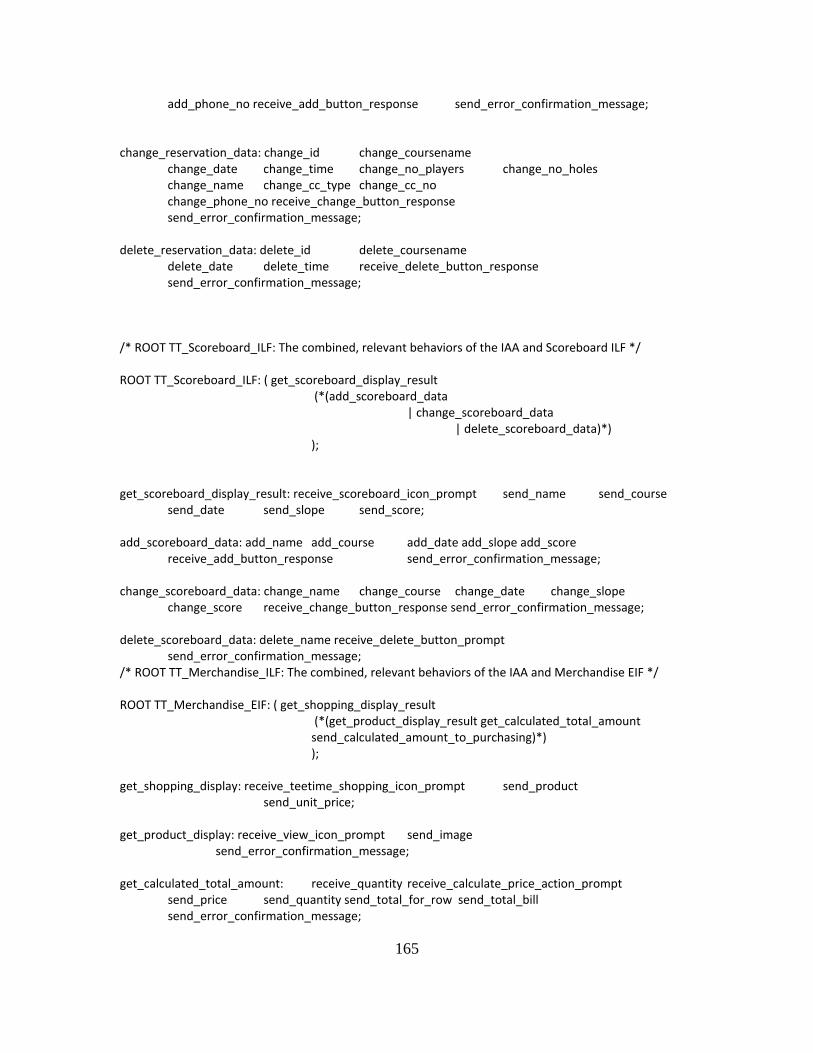
165
add_phone_no receive_add_button_response send_error_confirmation_message; change_reservation_data: change_id change_coursename change_date change_time change_no_players change_no_holes change_name change_cc_type change_cc_no change_phone_no receive_change_button_response send_error_confirmation_message; delete_reservation_data: delete_id delete_coursename delete_date delete_time receive_delete_button_response send_error_confirmation_message; /* ROOT TT_Scoreboard_ILF: The combined, relevant behaviors of the IAA and Scoreboard ILF */ ROOT TT_Scoreboard_ILF: ( get_scoreboard_display_result (*(add_scoreboard_data | change_scoreboard_data | delete_scoreboard_data)*) ); get_scoreboard_display_result: receive_scoreboard_icon_prompt send_name send_course send_date send_slope send_score; add_scoreboard_data: add_name add_course add_date add_slope add_score receive_add_button_response send_error_confirmation_message; change_scoreboard_data: change_name change_course change_date change_slope change_score receive_change_button_response send_error_confirmation_message; delete_scoreboard_data: delete_name receive_delete_button_prompt send_error_confirmation_message; /* ROOT TT_Merchandise_ILF: The combined, relevant behaviors of the IAA and Merchandise EIF */ ROOT TT_Merchandise_EIF: ( get_shopping_display_result (*(get_product_display_result get_calculated_total_amount send_calculated_amount_to_purchasing)*) ); get_shopping_display: receive_teetime_shopping_icon_prompt send_product send_unit_price; get_product_display: receive_view_icon_prompt send_image send_error_confirmation_message; get_calculated_total_amount: receive_quantity receive_calculate_price_action_prompt send_price send_quantity send_total_for_row send_total_bill send_error_confirmation_message;
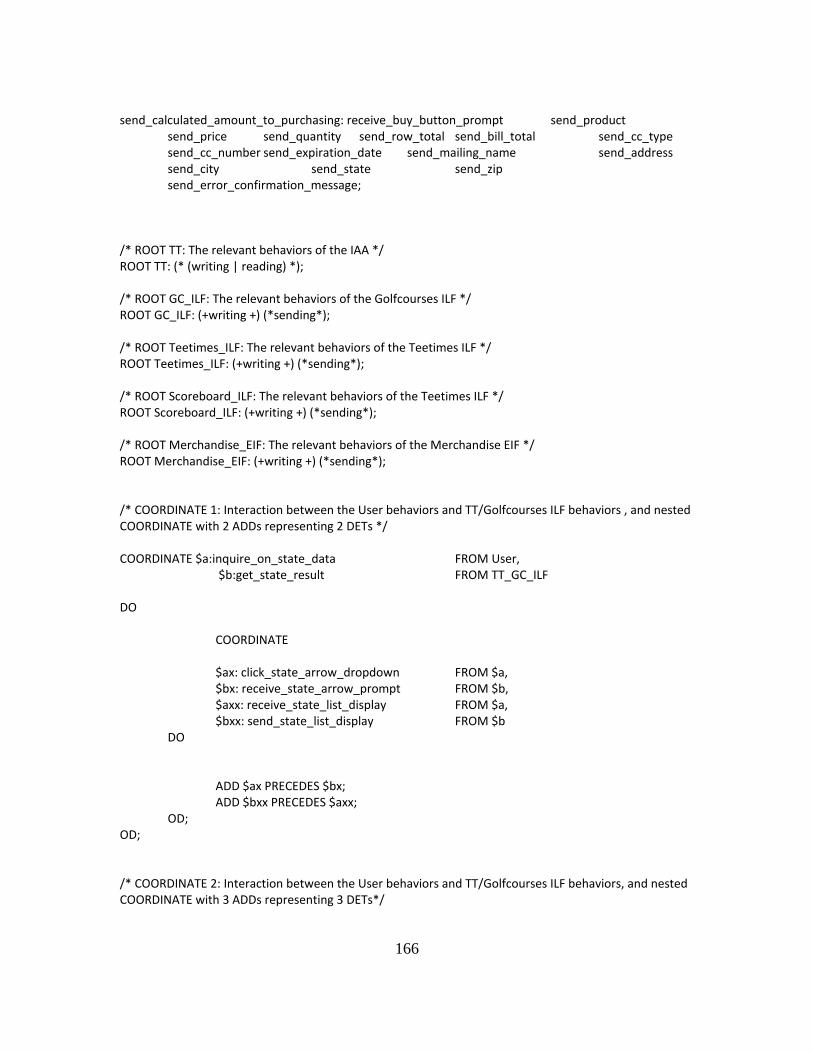
166
send_calculated_amount_to_purchasing: receive_buy_button_prompt send_product send_price send_quantity send_row_total send_bill_total send_cc_type send_cc_number send_expiration_date send_mailing_name send_address send_city send_state send_zip send_error_confirmation_message; /* ROOT TT: The relevant behaviors of the IAA */ ROOT TT: (* (writing | reading) *); /* ROOT GC_ILF: The relevant behaviors of the Golfcourses ILF */ ROOT GC_ILF: (+writing +) (*sending*); /* ROOT Teetimes_ILF: The relevant behaviors of the Teetimes ILF */ ROOT Teetimes_ILF: (+writing +) (*sending*); /* ROOT Scoreboard_ILF: The relevant behaviors of the Teetimes ILF */ ROOT Scoreboard_ILF: (+writing +) (*sending*); /* ROOT Merchandise_EIF: The relevant behaviors of the Merchandise EIF */ ROOT Merchandise_EIF: (+writing +) (*sending*); /* COORDINATE 1: Interaction between the User behaviors and TT/Golfcourses ILF behaviors , and nested COORDINATE with 2 ADDs representing 2 DETs */ COORDINATE $a:inquire_on_state_data FROM User, $b:get_state_result FROM TT_GC_ILF DO COORDINATE $ax: click_state_arrow_dropdown FROM $a, $bx: receive_state_arrow_prompt FROM $b, $axx: receive_state_list_display FROM $a, $bxx: send_state_list_display FROM $b DO ADD $ax PRECEDES $bx; ADD $bxx PRECEDES $axx; OD; OD; /* COORDINATE 2: Interaction between the User behaviors and TT/Golfcourses ILF behaviors, and nested COORDINATE with 3 ADDs representing 3 DETs*/
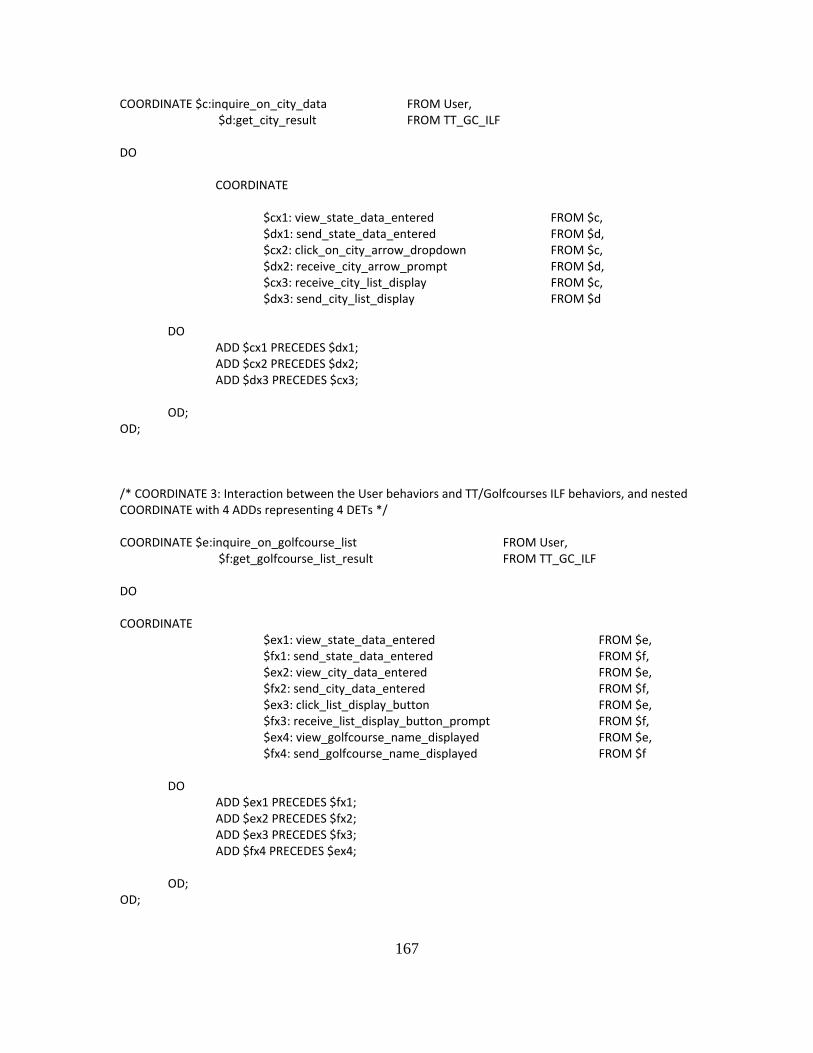
167
COORDINATE $c:inquire_on_city_data FROM User, $d:get_city_result FROM TT_GC_ILF DO COORDINATE $cx1: view_state_data_entered FROM $c, $dx1: send_state_data_entered FROM $d, $cx2: click_on_city_arrow_dropdown FROM $c, $dx2: receive_city_arrow_prompt FROM $d, $cx3: receive_city_list_display FROM $c, $dx3: send_city_list_display FROM $d DO ADD $cx1 PRECEDES $dx1; ADD $cx2 PRECEDES $dx2; ADD $dx3 PRECEDES $cx3; OD; OD; /* COORDINATE 3: Interaction between the User behaviors and TT/Golfcourses ILF behaviors, and nested COORDINATE with 4 ADDs representing 4 DETs */ COORDINATE $e:inquire_on_golfcourse_list FROM User, $f:get_golfcourse_list_result FROM TT_GC_ILF DO COORDINATE $ex1: view_state_data_entered FROM $e, $fx1: send_state_data_entered FROM $f, $ex2: view_city_data_entered FROM $e, $fx2: send_city_data_entered FROM $f, $ex3: click_list_display_button FROM $e, $fx3: receive_list_display_button_prompt FROM $f, $ex4: view_golfcourse_name_displayed FROM $e, $fx4: send_golfcourse_name_displayed FROM $f DO ADD $ex1 PRECEDES $fx1; ADD $ex2 PRECEDES $fx2; ADD $ex3 PRECEDES $fx3; ADD $fx4 PRECEDES $ex4; OD; OD;
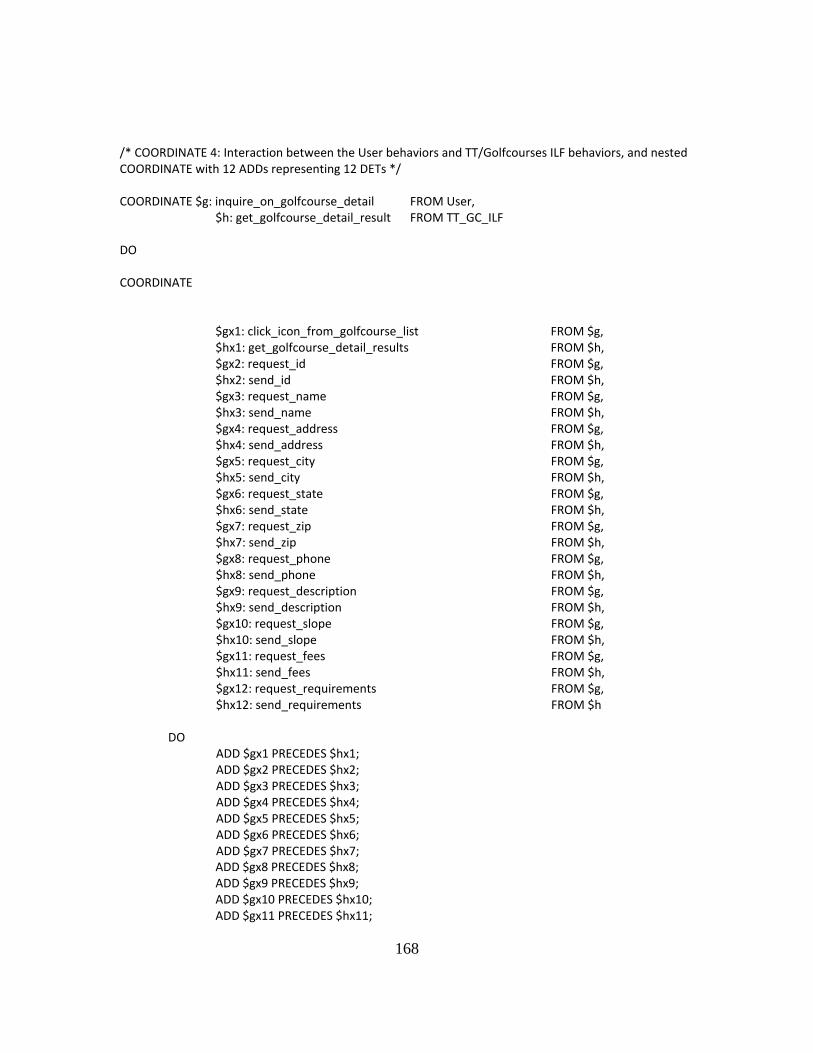
168
/* COORDINATE 4: Interaction between the User behaviors and TT/Golfcourses ILF behaviors, and nested COORDINATE with 12 ADDs representing 12 DETs */ COORDINATE $g: inquire_on_golfcourse_detail FROM User, $h: get_golfcourse_detail_result FROM TT_GC_ILF DO COORDINATE $gx1: click_icon_from_golfcourse_list FROM $g, $hx1: get_golfcourse_detail_results FROM $h, $gx2: request_id FROM $g, $hx2: send_id FROM $h, $gx3: request_name FROM $g, $hx3: send_name FROM $h, $gx4: request_address FROM $g, $hx4: send_address FROM $h, $gx5: request_city FROM $g, $hx5: send_city FROM $h, $gx6: request_state FROM $g, $hx6: send_state FROM $h, $gx7: request_zip FROM $g, $hx7: send_zip FROM $h, $gx8: request_phone FROM $g, $hx8: send_phone FROM $h, $gx9: request_description FROM $g, $hx9: send_description FROM $h, $gx10: request_slope FROM $g, $hx10: send_slope FROM $h, $gx11: request_fees FROM $g, $hx11: send_fees FROM $h, $gx12: request_requirements FROM $g, $hx12: send_requirements FROM $h DO ADD $gx1 PRECEDES $hx1; ADD $gx2 PRECEDES $hx2; ADD $gx3 PRECEDES $hx3; ADD $gx4 PRECEDES $hx4; ADD $gx5 PRECEDES $hx5; ADD $gx6 PRECEDES $hx6; ADD $gx7 PRECEDES $hx7; ADD $gx8 PRECEDES $hx8; ADD $gx9 PRECEDES $hx9; ADD $gx10 PRECEDES $hx10; ADD $gx11 PRECEDES $hx11;
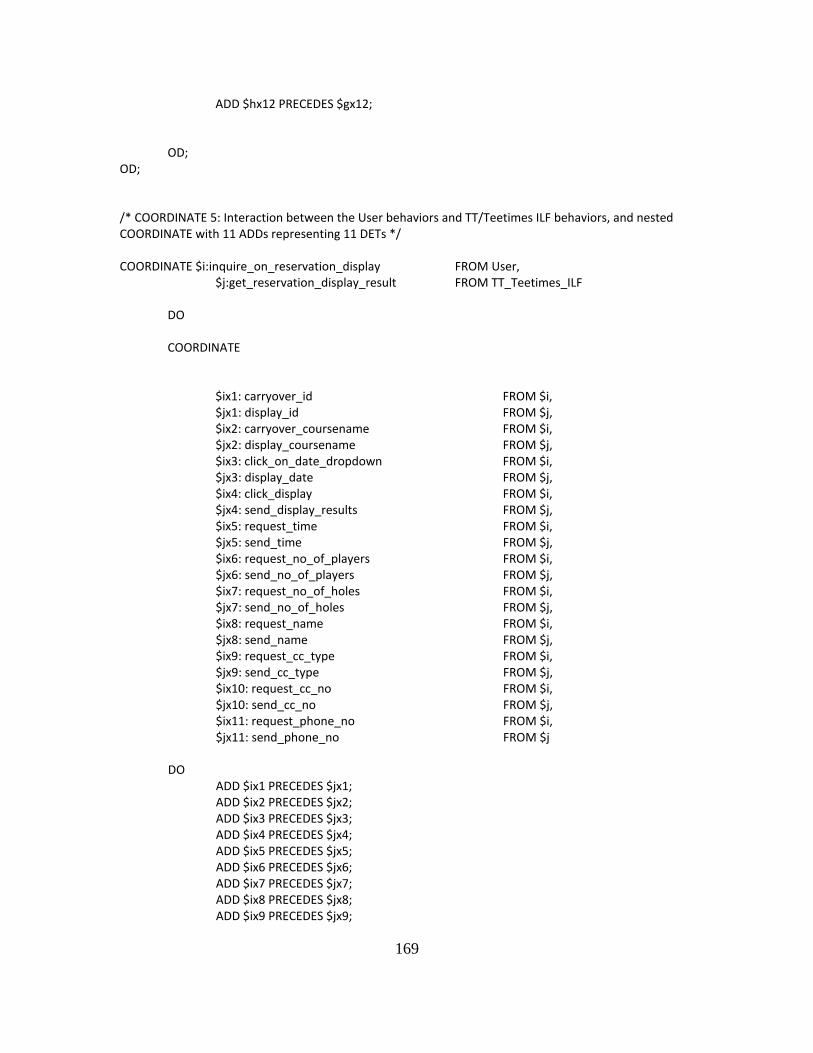
169
ADD $hx12 PRECEDES $gx12; OD; OD; /* COORDINATE 5: Interaction between the User behaviors and TT/Teetimes ILF behaviors, and nested COORDINATE with 11 ADDs representing 11 DETs */ COORDINATE $i:inquire_on_reservation_display FROM User, $j:get_reservation_display_result FROM TT_Teetimes_ILF DO COORDINATE $ix1: carryover_id FROM $i, $jx1: display_id FROM $j, $ix2: carryover_coursename FROM $i, $jx2: display_coursename FROM $j, $ix3: click_on_date_dropdown FROM $i, $jx3: display_date FROM $j, $ix4: click_display FROM $i, $jx4: send_display_results FROM $j, $ix5: request_time FROM $i, $jx5: send_time FROM $j, $ix6: request_no_of_players FROM $i, $jx6: send_no_of_players FROM $j, $ix7: request_no_of_holes FROM $i, $jx7: send_no_of_holes FROM $j, $ix8: request_name FROM $i, $jx8: send_name FROM $j, $ix9: request_cc_type FROM $i, $jx9: send_cc_type FROM $j, $ix10: request_cc_no FROM $i, $jx10: send_cc_no FROM $j, $ix11: request_phone_no FROM $i, $jx11: send_phone_no FROM $j DO ADD $ix1 PRECEDES $jx1; ADD $ix2 PRECEDES $jx2; ADD $ix3 PRECEDES $jx3; ADD $ix4 PRECEDES $jx4; ADD $ix5 PRECEDES $jx5; ADD $ix6 PRECEDES $jx6; ADD $ix7 PRECEDES $jx7; ADD $ix8 PRECEDES $jx8; ADD $ix9 PRECEDES $jx9;
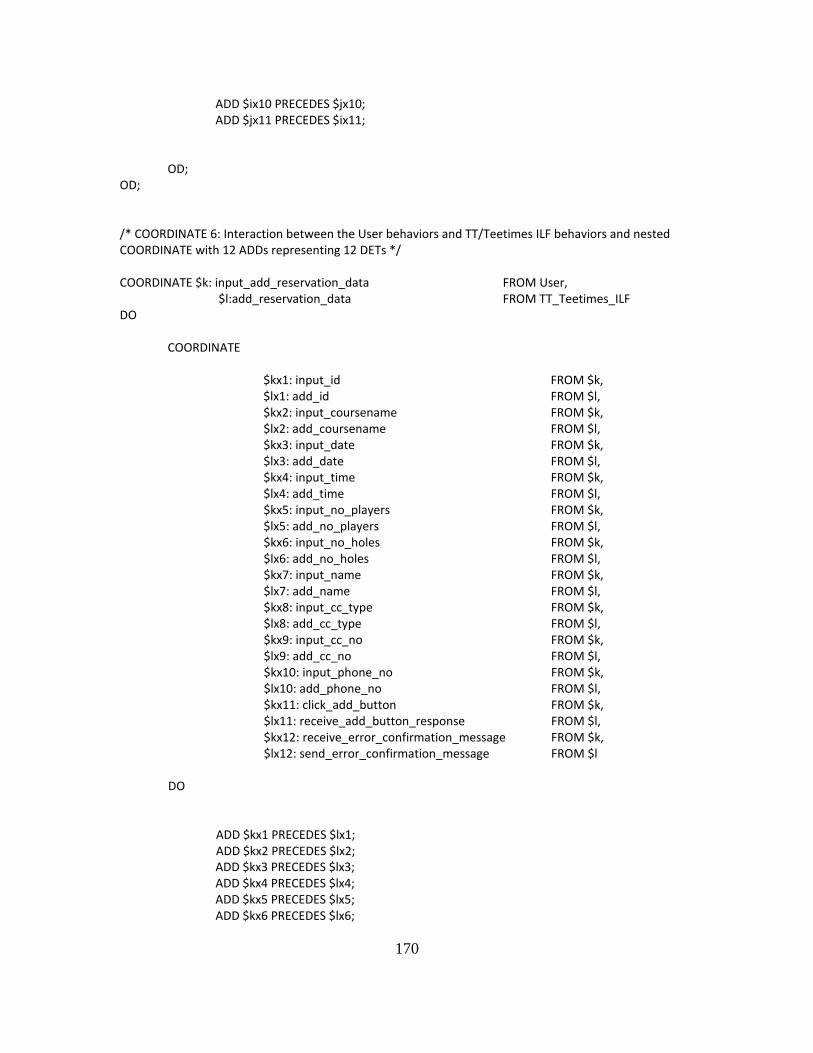
170
ADD $ix10 PRECEDES $jx10; ADD $jx11 PRECEDES $ix11; OD; OD; /* COORDINATE 6: Interaction between the User behaviors and TT/Teetimes ILF behaviors and nested COORDINATE with 12 ADDs representing 12 DETs */ COORDINATE $k: input_add_reservation_data FROM User, $l:add_reservation_data FROM TT_Teetimes_ILF DO COORDINATE $kx1: input_id FROM $k, $lx1: add_id FROM $l, $kx2: input_coursename FROM $k, $lx2: add_coursename FROM $l, $kx3: input_date FROM $k, $lx3: add_date FROM $l, $kx4: input_time FROM $k, $lx4: add_time FROM $l, $kx5: input_no_players FROM $k, $lx5: add_no_players FROM $l, $kx6: input_no_holes FROM $k, $lx6: add_no_holes FROM $l, $kx7: input_name FROM $k, $lx7: add_name FROM $l, $kx8: input_cc_type FROM $k, $lx8: add_cc_type FROM $l, $kx9: input_cc_no FROM $k, $lx9: add_cc_no FROM $l, $kx10: input_phone_no FROM $k, $lx10: add_phone_no FROM $l, $kx11: click_add_button FROM $k, $lx11: receive_add_button_response FROM $l, $kx12: receive_error_confirmation_message FROM $k, $lx12: send_error_confirmation_message FROM $l DO ADD $kx1 PRECEDES $lx1; ADD $kx2 PRECEDES $lx2; ADD $kx3 PRECEDES $lx3; ADD $kx4 PRECEDES $lx4; ADD $kx5 PRECEDES $lx5; ADD $kx6 PRECEDES $lx6;
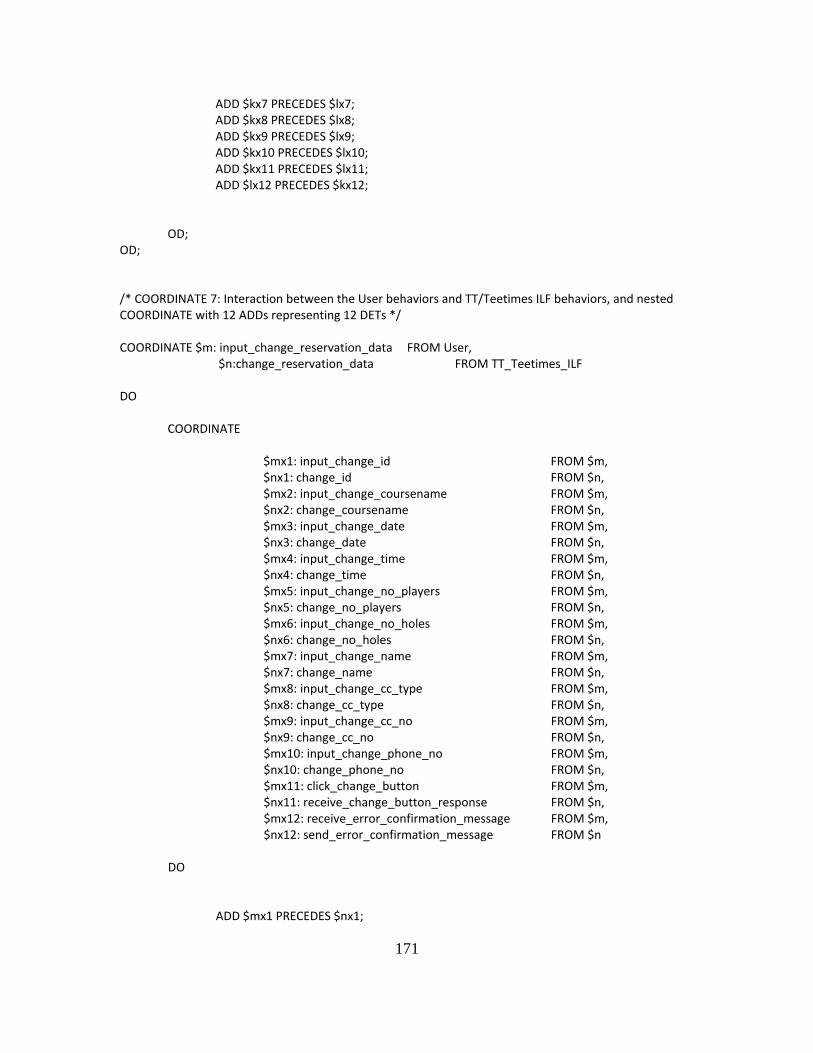
171
ADD $kx7 PRECEDES $lx7; ADD $kx8 PRECEDES $lx8; ADD $kx9 PRECEDES $lx9; ADD $kx10 PRECEDES $lx10; ADD $kx11 PRECEDES $lx11; ADD $lx12 PRECEDES $kx12; OD; OD; /* COORDINATE 7: Interaction between the User behaviors and TT/Teetimes ILF behaviors, and nested COORDINATE with 12 ADDs representing 12 DETs */ COORDINATE $m: input_change_reservation_data FROM User, $n:change_reservation_data FROM TT_Teetimes_ILF DO COORDINATE $mx1: input_change_id FROM $m, $nx1: change_id FROM $n, $mx2: input_change_coursename FROM $m, $nx2: change_coursename FROM $n, $mx3: input_change_date FROM $m, $nx3: change_date FROM $n, $mx4: input_change_time FROM $m, $nx4: change_time FROM $n, $mx5: input_change_no_players FROM $m, $nx5: change_no_players FROM $n, $mx6: input_change_no_holes FROM $m, $nx6: change_no_holes FROM $n, $mx7: input_change_name FROM $m, $nx7: change_name FROM $n, $mx8: input_change_cc_type FROM $m, $nx8: change_cc_type FROM $n, $mx9: input_change_cc_no FROM $m, $nx9: change_cc_no FROM $n, $mx10: input_change_phone_no FROM $m, $nx10: change_phone_no FROM $n, $mx11: click_change_button FROM $m, $nx11: receive_change_button_response FROM $n, $mx12: receive_error_confirmation_message FROM $m, $nx12: send_error_confirmation_message FROM $n DO ADD $mx1 PRECEDES $nx1;
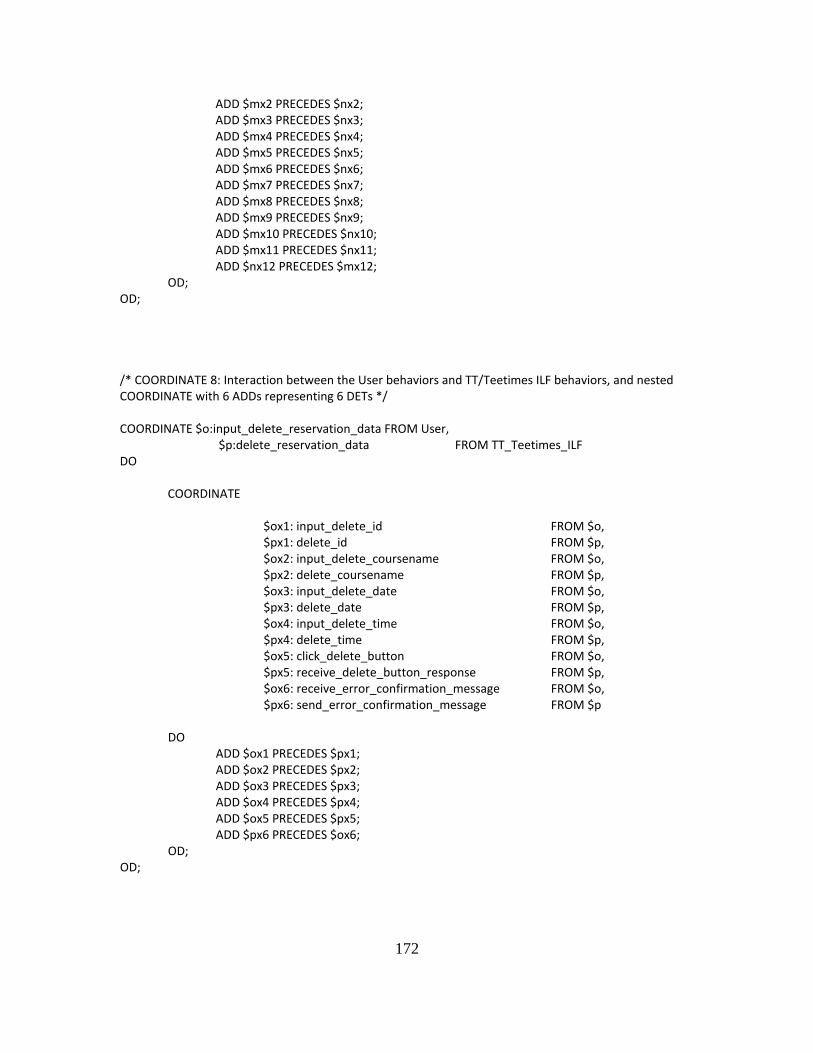
172
ADD $mx2 PRECEDES $nx2; ADD $mx3 PRECEDES $nx3; ADD $mx4 PRECEDES $nx4; ADD $mx5 PRECEDES $nx5; ADD $mx6 PRECEDES $nx6; ADD $mx7 PRECEDES $nx7; ADD $mx8 PRECEDES $nx8; ADD $mx9 PRECEDES $nx9; ADD $mx10 PRECEDES $nx10; ADD $mx11 PRECEDES $nx11; ADD $nx12 PRECEDES $mx12; OD; OD; /* COORDINATE 8: Interaction between the User behaviors and TT/Teetimes ILF behaviors, and nested COORDINATE with 6 ADDs representing 6 DETs */ COORDINATE $o:input_delete_reservation_data FROM User, $p:delete_reservation_data FROM TT_Teetimes_ILF DO COORDINATE $ox1: input_delete_id FROM $o, $px1: delete_id FROM $p, $ox2: input_delete_coursename FROM $o, $px2: delete_coursename FROM $p, $ox3: input_delete_date FROM $o, $px3: delete_date FROM $p, $ox4: input_delete_time FROM $o, $px4: delete_time FROM $p, $ox5: click_delete_button FROM $o, $px5: receive_delete_button_response FROM $p, $ox6: receive_error_confirmation_message FROM $o, $px6: send_error_confirmation_message FROM $p DO ADD $ox1 PRECEDES $px1; ADD $ox2 PRECEDES $px2; ADD $ox3 PRECEDES $px3; ADD $ox4 PRECEDES $px4; ADD $ox5 PRECEDES $px5; ADD $px6 PRECEDES $ox6; OD; OD;
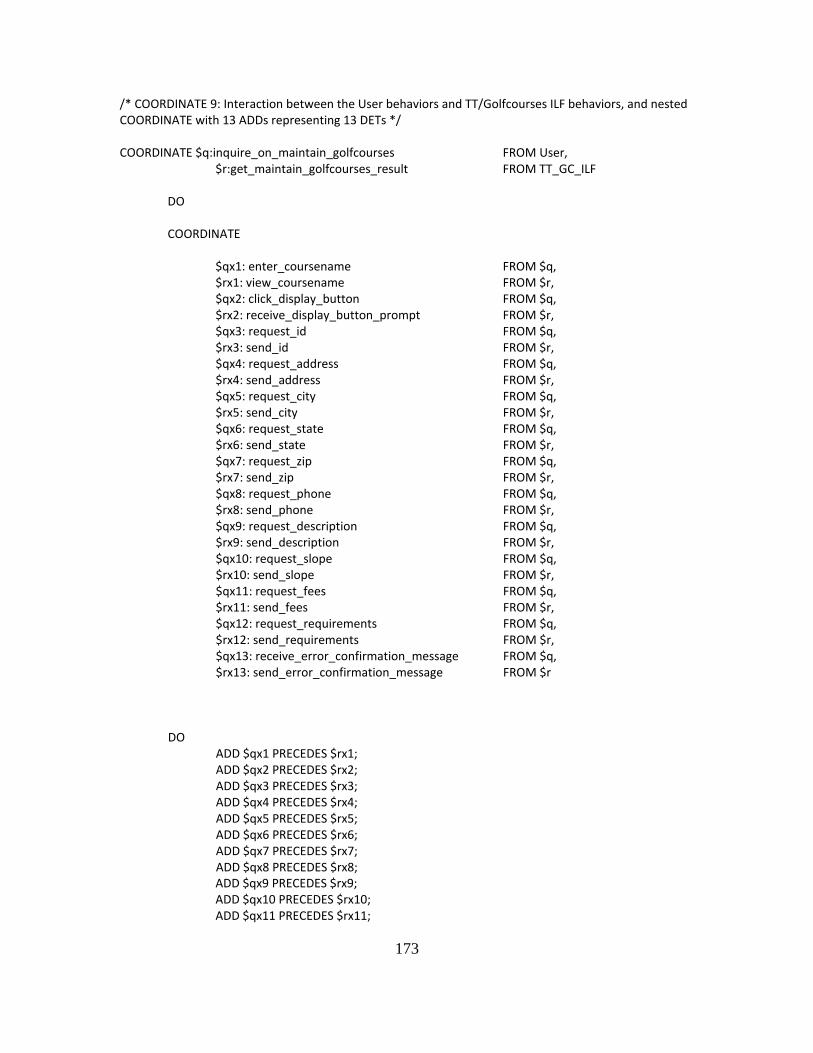
173
/* COORDINATE 9: Interaction between the User behaviors and TT/Golfcourses ILF behaviors, and nested COORDINATE with 13 ADDs representing 13 DETs */ COORDINATE $q:inquire_on_maintain_golfcourses FROM User, $r:get_maintain_golfcourses_result FROM TT_GC_ILF DO COORDINATE $qx1: enter_coursename FROM $q, $rx1: view_coursename FROM $r, $qx2: click_display_button FROM $q, $rx2: receive_display_button_prompt FROM $r, $qx3: request_id FROM $q, $rx3: send_id FROM $r, $qx4: request_address FROM $q, $rx4: send_address FROM $r, $qx5: request_city FROM $q, $rx5: send_city FROM $r, $qx6: request_state FROM $q, $rx6: send_state FROM $r, $qx7: request_zip FROM $q, $rx7: send_zip FROM $r, $qx8: request_phone FROM $q, $rx8: send_phone FROM $r, $qx9: request_description FROM $q, $rx9: send_description FROM $r, $qx10: request_slope FROM $q, $rx10: send_slope FROM $r, $qx11: request_fees FROM $q, $rx11: send_fees FROM $r, $qx12: request_requirements FROM $q, $rx12: send_requirements FROM $r, $qx13: receive_error_confirmation_message FROM $q, $rx13: send_error_confirmation_message FROM $r DO ADD $qx1 PRECEDES $rx1; ADD $qx2 PRECEDES $rx2; ADD $qx3 PRECEDES $rx3; ADD $qx4 PRECEDES $rx4; ADD $qx5 PRECEDES $rx5; ADD $qx6 PRECEDES $rx6; ADD $qx7 PRECEDES $rx7; ADD $qx8 PRECEDES $rx8; ADD $qx9 PRECEDES $rx9; ADD $qx10 PRECEDES $rx10; ADD $qx11 PRECEDES $rx11;
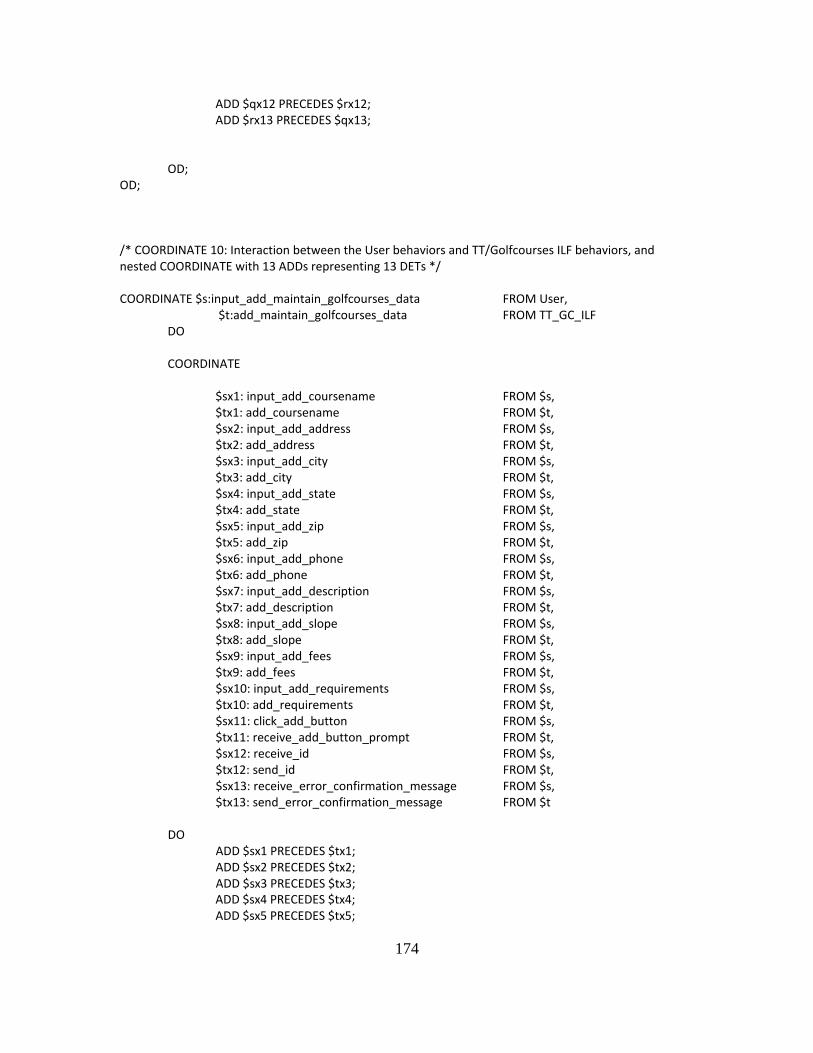
174
ADD $qx12 PRECEDES $rx12; ADD $rx13 PRECEDES $qx13; OD; OD; /* COORDINATE 10: Interaction between the User behaviors and TT/Golfcourses ILF behaviors, and nested COORDINATE with 13 ADDs representing 13 DETs */ COORDINATE $s:input_add_maintain_golfcourses_data FROM User, $t:add_maintain_golfcourses_data FROM TT_GC_ILF DO COORDINATE $sx1: input_add_coursename FROM $s, $tx1: add_coursename FROM $t, $sx2: input_add_address FROM $s, $tx2: add_address FROM $t, $sx3: input_add_city FROM $s, $tx3: add_city FROM $t, $sx4: input_add_state FROM $s, $tx4: add_state FROM $t, $sx5: input_add_zip FROM $s, $tx5: add_zip FROM $t, $sx6: input_add_phone FROM $s, $tx6: add_phone FROM $t, $sx7: input_add_description FROM $s, $tx7: add_description FROM $t, $sx8: input_add_slope FROM $s, $tx8: add_slope FROM $t, $sx9: input_add_fees FROM $s, $tx9: add_fees FROM $t, $sx10: input_add_requirements FROM $s, $tx10: add_requirements FROM $t, $sx11: click_add_button FROM $s, $tx11: receive_add_button_prompt FROM $t, $sx12: receive_id FROM $s, $tx12: send_id FROM $t, $sx13: receive_error_confirmation_message FROM $s, $tx13: send_error_confirmation_message FROM $t DO ADD $sx1 PRECEDES $tx1; ADD $sx2 PRECEDES $tx2; ADD $sx3 PRECEDES $tx3; ADD $sx4 PRECEDES $tx4; ADD $sx5 PRECEDES $tx5;
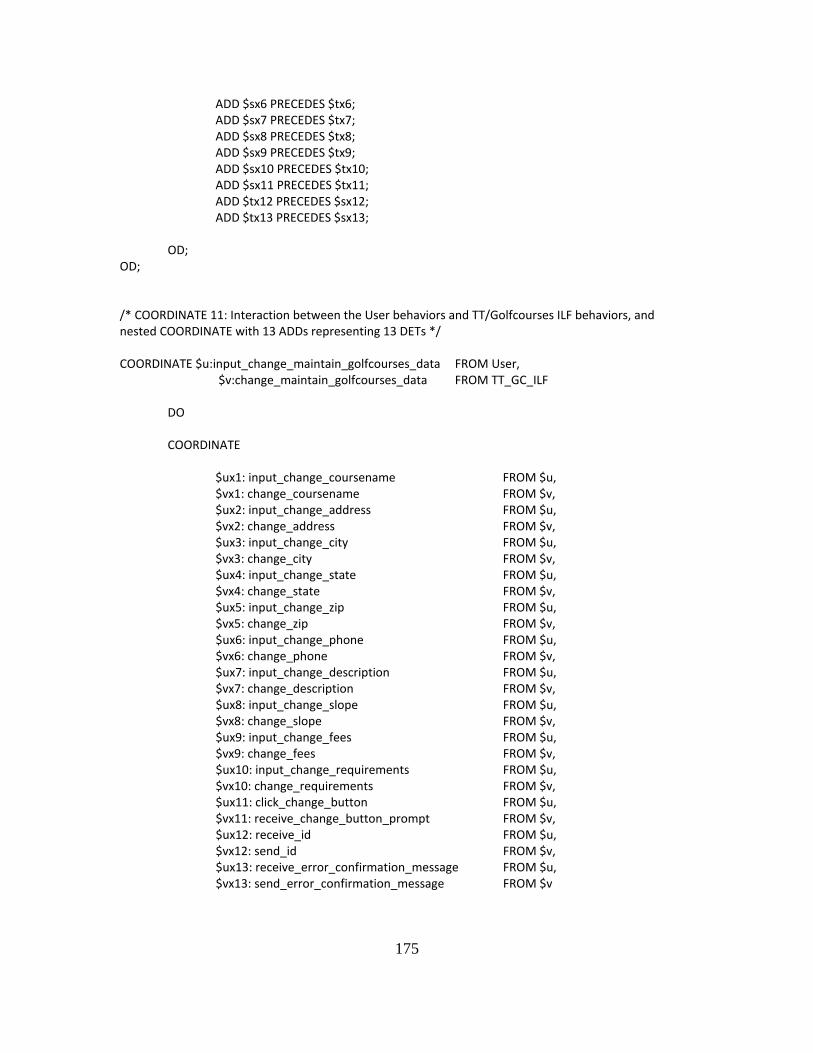
175
ADD $sx6 PRECEDES $tx6; ADD $sx7 PRECEDES $tx7; ADD $sx8 PRECEDES $tx8; ADD $sx9 PRECEDES $tx9; ADD $sx10 PRECEDES $tx10; ADD $sx11 PRECEDES $tx11; ADD $tx12 PRECEDES $sx12; ADD $tx13 PRECEDES $sx13; OD; OD; /* COORDINATE 11: Interaction between the User behaviors and TT/Golfcourses ILF behaviors, and nested COORDINATE with 13 ADDs representing 13 DETs */ COORDINATE $u:input_change_maintain_golfcourses_data FROM User, $v:change_maintain_golfcourses_data FROM TT_GC_ILF DO COORDINATE $ux1: input_change_coursename FROM $u, $vx1: change_coursename FROM $v, $ux2: input_change_address FROM $u, $vx2: change_address FROM $v, $ux3: input_change_city FROM $u, $vx3: change_city FROM $v, $ux4: input_change_state FROM $u, $vx4: change_state FROM $v, $ux5: input_change_zip FROM $u, $vx5: change_zip FROM $v, $ux6: input_change_phone FROM $u, $vx6: change_phone FROM $v, $ux7: input_change_description FROM $u, $vx7: change_description FROM $v, $ux8: input_change_slope FROM $u, $vx8: change_slope FROM $v, $ux9: input_change_fees FROM $u, $vx9: change_fees FROM $v, $ux10: input_change_requirements FROM $u, $vx10: change_requirements FROM $v, $ux11: click_change_button FROM $u, $vx11: receive_change_button_prompt FROM $v, $ux12: receive_id FROM $u, $vx12: send_id FROM $v, $ux13: receive_error_confirmation_message FROM $u, $vx13: send_error_confirmation_message FROM $v
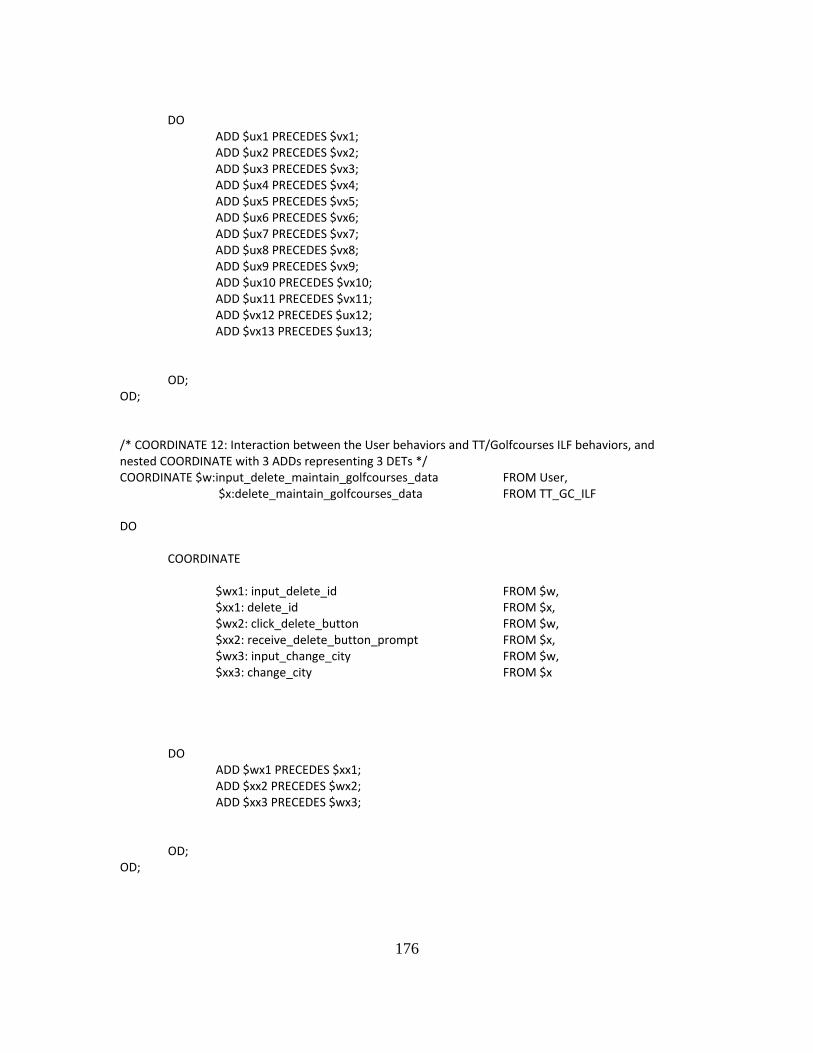
176
DO ADD $ux1 PRECEDES $vx1; ADD $ux2 PRECEDES $vx2; ADD $ux3 PRECEDES $vx3; ADD $ux4 PRECEDES $vx4; ADD $ux5 PRECEDES $vx5; ADD $ux6 PRECEDES $vx6; ADD $ux7 PRECEDES $vx7; ADD $ux8 PRECEDES $vx8; ADD $ux9 PRECEDES $vx9; ADD $ux10 PRECEDES $vx10; ADD $ux11 PRECEDES $vx11; ADD $vx12 PRECEDES $ux12; ADD $vx13 PRECEDES $ux13; OD; OD; /* COORDINATE 12: Interaction between the User behaviors and TT/Golfcourses ILF behaviors, and nested COORDINATE with 3 ADDs representing 3 DETs */ COORDINATE $w:input_delete_maintain_golfcourses_data FROM User, $x:delete_maintain_golfcourses_data FROM TT_GC_ILF DO COORDINATE $wx1: input_delete_id FROM $w, $xx1: delete_id FROM $x, $wx2: click_delete_button FROM $w, $xx2: receive_delete_button_prompt FROM $x, $wx3: input_change_city FROM $w, $xx3: change_city FROM $x DO ADD $wx1 PRECEDES $xx1; ADD $xx2 PRECEDES $wx2; ADD $xx3 PRECEDES $wx3; OD; OD;
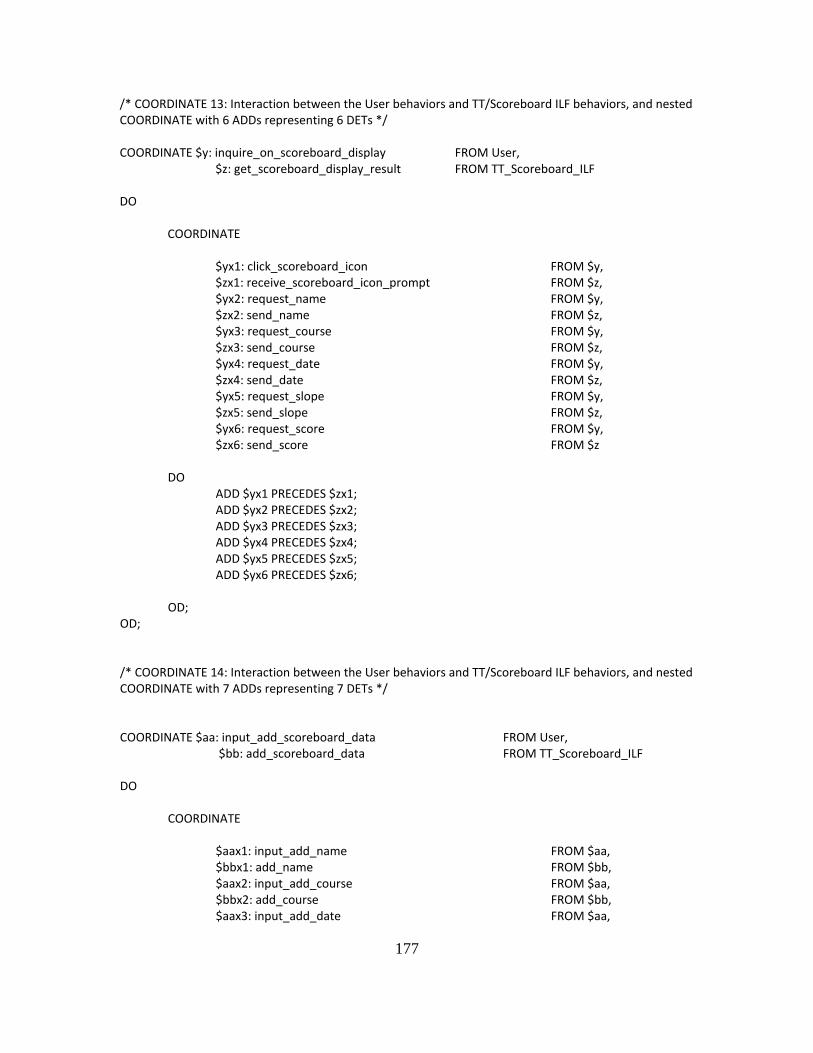
177
/* COORDINATE 13: Interaction between the User behaviors and TT/Scoreboard ILF behaviors, and nested COORDINATE with 6 ADDs representing 6 DETs */ COORDINATE $y: inquire_on_scoreboard_display FROM User, $z: get_scoreboard_display_result FROM TT_Scoreboard_ILF DO COORDINATE $yx1: click_scoreboard_icon FROM $y, $zx1: receive_scoreboard_icon_prompt FROM $z, $yx2: request_name FROM $y, $zx2: send_name FROM $z, $yx3: request_course FROM $y, $zx3: send_course FROM $z, $yx4: request_date FROM $y, $zx4: send_date FROM $z, $yx5: request_slope FROM $y, $zx5: send_slope FROM $z, $yx6: request_score FROM $y, $zx6: send_score FROM $z DO ADD $yx1 PRECEDES $zx1; ADD $yx2 PRECEDES $zx2; ADD $yx3 PRECEDES $zx3; ADD $yx4 PRECEDES $zx4; ADD $yx5 PRECEDES $zx5; ADD $yx6 PRECEDES $zx6; OD; OD; /* COORDINATE 14: Interaction between the User behaviors and TT/Scoreboard ILF behaviors, and nested COORDINATE with 7 ADDs representing 7 DETs */ COORDINATE $aa: input_add_scoreboard_data FROM User, $bb: add_scoreboard_data FROM TT_Scoreboard_ILF DO COORDINATE $aax1: input_add_name FROM $aa, $bbx1: add_name FROM $bb, $aax2: input_add_course FROM $aa, $bbx2: add_course FROM $bb, $aax3: input_add_date FROM $aa,
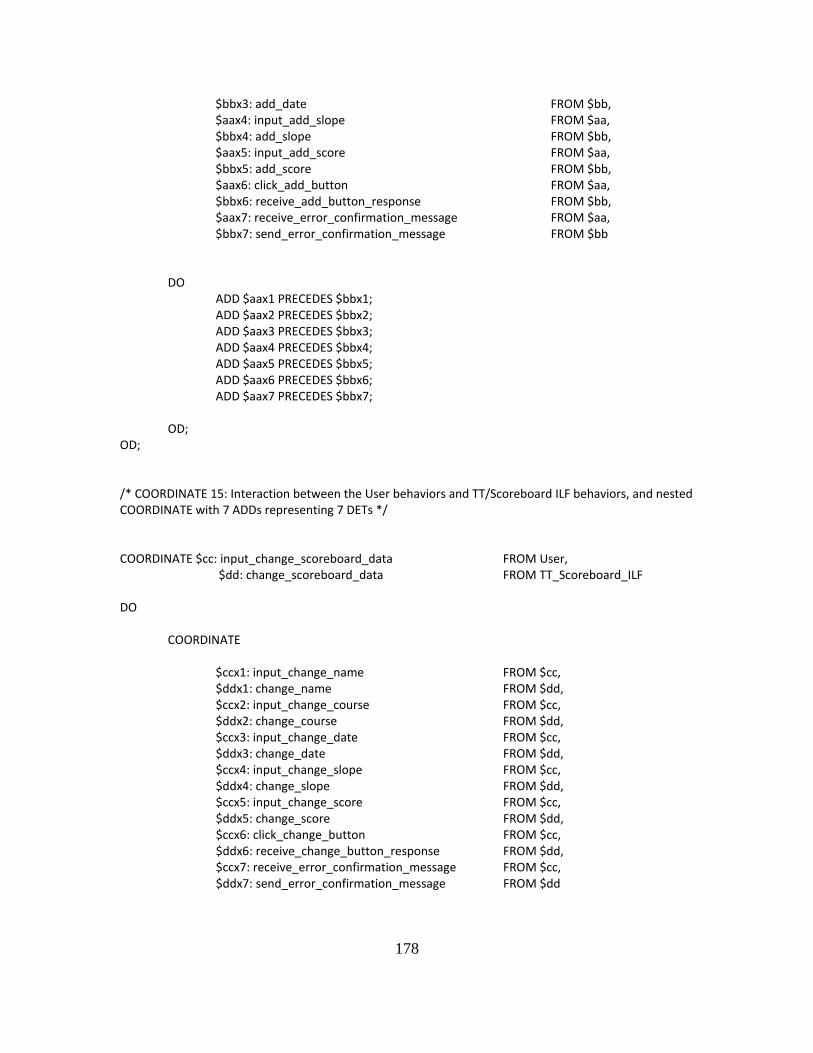
178
$bbx3: add_date FROM $bb, $aax4: input_add_slope FROM $aa, $bbx4: add_slope FROM $bb, $aax5: input_add_score FROM $aa, $bbx5: add_score FROM $bb, $aax6: click_add_button FROM $aa, $bbx6: receive_add_button_response FROM $bb, $aax7: receive_error_confirmation_message FROM $aa, $bbx7: send_error_confirmation_message FROM $bb DO ADD $aax1 PRECEDES $bbx1; ADD $aax2 PRECEDES $bbx2; ADD $aax3 PRECEDES $bbx3; ADD $aax4 PRECEDES $bbx4; ADD $aax5 PRECEDES $bbx5; ADD $aax6 PRECEDES $bbx6; ADD $aax7 PRECEDES $bbx7; OD; OD; /* COORDINATE 15: Interaction between the User behaviors and TT/Scoreboard ILF behaviors, and nested COORDINATE with 7 ADDs representing 7 DETs */ COORDINATE $cc: input_change_scoreboard_data FROM User, $dd: change_scoreboard_data FROM TT_Scoreboard_ILF DO COORDINATE $ccx1: input_change_name FROM $cc, $ddx1: change_name FROM $dd, $ccx2: input_change_course FROM $cc, $ddx2: change_course FROM $dd, $ccx3: input_change_date FROM $cc, $ddx3: change_date FROM $dd, $ccx4: input_change_slope FROM $cc, $ddx4: change_slope FROM $dd, $ccx5: input_change_score FROM $cc, $ddx5: change_score FROM $dd, $ccx6: click_change_button FROM $cc, $ddx6: receive_change_button_response FROM $dd, $ccx7: receive_error_confirmation_message FROM $cc, $ddx7: send_error_confirmation_message FROM $dd
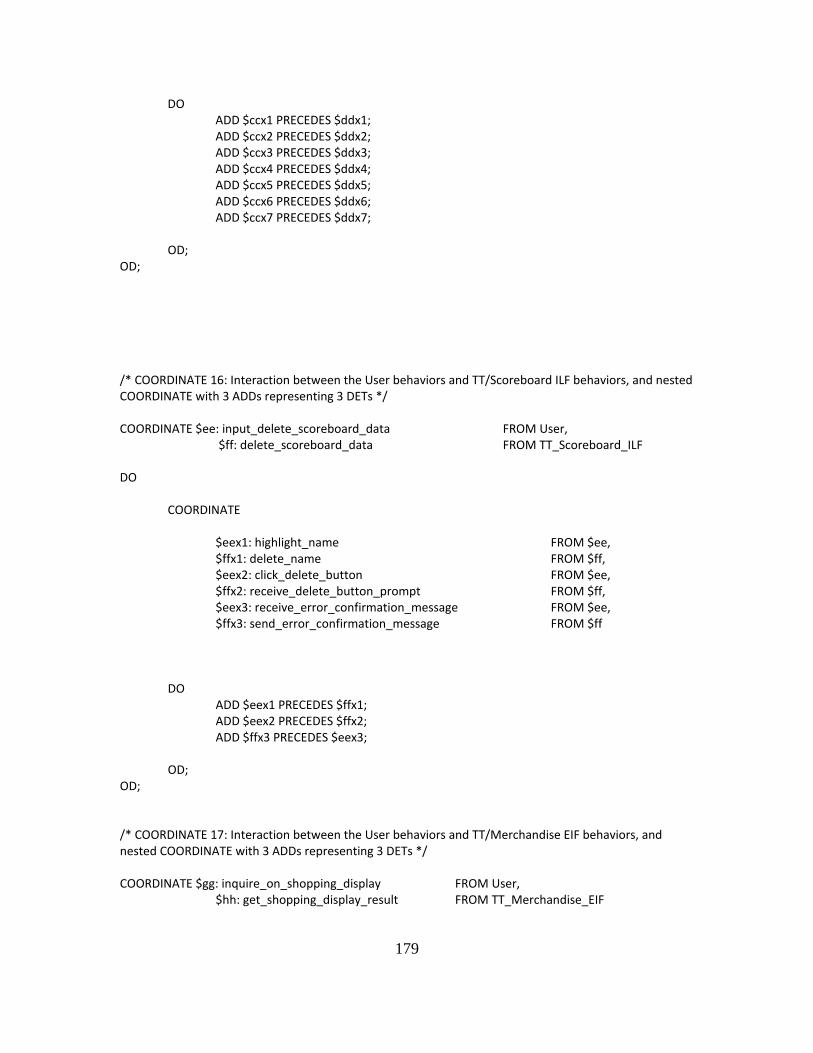
179
DO ADD $ccx1 PRECEDES $ddx1; ADD $ccx2 PRECEDES $ddx2; ADD $ccx3 PRECEDES $ddx3; ADD $ccx4 PRECEDES $ddx4; ADD $ccx5 PRECEDES $ddx5; ADD $ccx6 PRECEDES $ddx6; ADD $ccx7 PRECEDES $ddx7; OD; OD; /* COORDINATE 16: Interaction between the User behaviors and TT/Scoreboard ILF behaviors, and nested COORDINATE with 3 ADDs representing 3 DETs */ COORDINATE $ee: input_delete_scoreboard_data FROM User, $ff: delete_scoreboard_data FROM TT_Scoreboard_ILF DO COORDINATE $eex1: highlight_name FROM $ee, $ffx1: delete_name FROM $ff, $eex2: click_delete_button FROM $ee, $ffx2: receive_delete_button_prompt FROM $ff, $eex3: receive_error_confirmation_message FROM $ee, $ffx3: send_error_confirmation_message FROM $ff DO ADD $eex1 PRECEDES $ffx1; ADD $eex2 PRECEDES $ffx2; ADD $ffx3 PRECEDES $eex3; OD; OD; /* COORDINATE 17: Interaction between the User behaviors and TT/Merchandise EIF behaviors, and nested COORDINATE with 3 ADDs representing 3 DETs */ COORDINATE $gg: inquire_on_shopping_display FROM User, $hh: get_shopping_display_result FROM TT_Merchandise_EIF
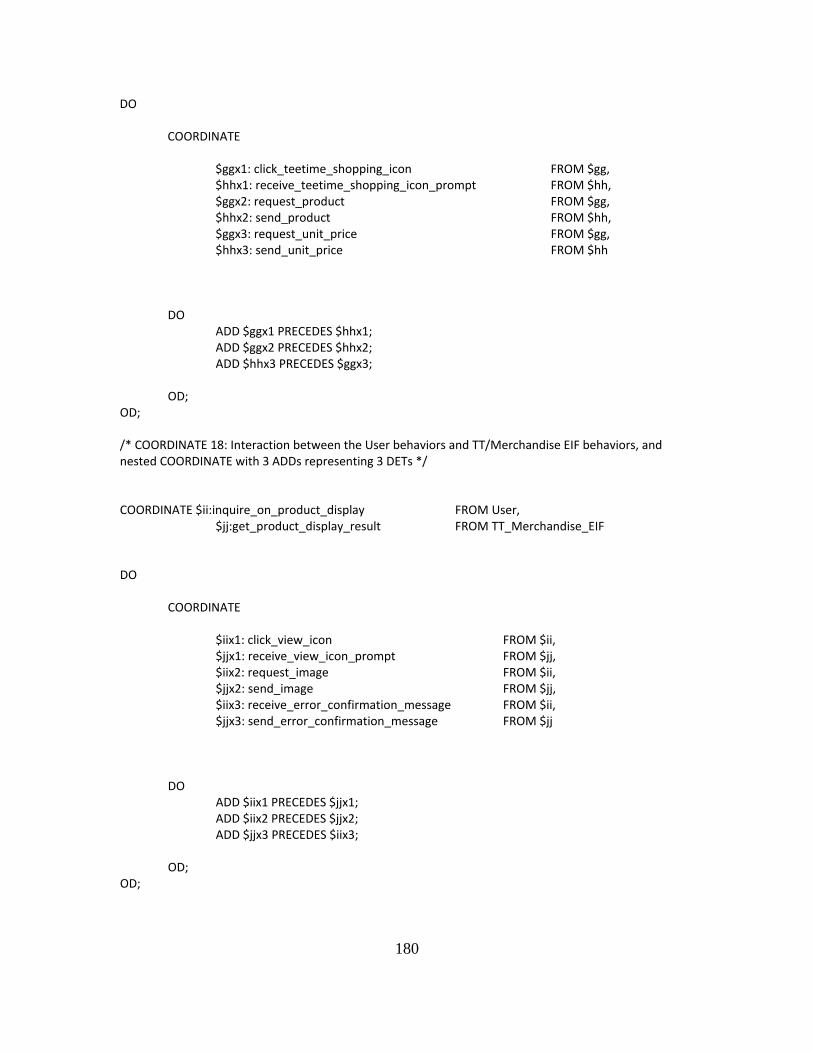
180
DO COORDINATE $ggx1: click_teetime_shopping_icon FROM $gg, $hhx1: receive_teetime_shopping_icon_prompt FROM $hh, $ggx2: request_product FROM $gg, $hhx2: send_product FROM $hh, $ggx3: request_unit_price FROM $gg, $hhx3: send_unit_price FROM $hh DO ADD $ggx1 PRECEDES $hhx1; ADD $ggx2 PRECEDES $hhx2; ADD $hhx3 PRECEDES $ggx3; OD; OD; /* COORDINATE 18: Interaction between the User behaviors and TT/Merchandise EIF behaviors, and nested COORDINATE with 3 ADDs representing 3 DETs */ COORDINATE $ii:inquire_on_product_display FROM User, $jj:get_product_display_result FROM TT_Merchandise_EIF DO COORDINATE $iix1: click_view_icon FROM $ii, $jjx1: receive_view_icon_prompt FROM $jj, $iix2: request_image FROM $ii, $jjx2: send_image FROM $jj, $iix3: receive_error_confirmation_message FROM $ii, $jjx3: send_error_confirmation_message FROM $jj DO ADD $iix1 PRECEDES $jjx1; ADD $iix2 PRECEDES $jjx2; ADD $jjx3 PRECEDES $iix3; OD; OD;
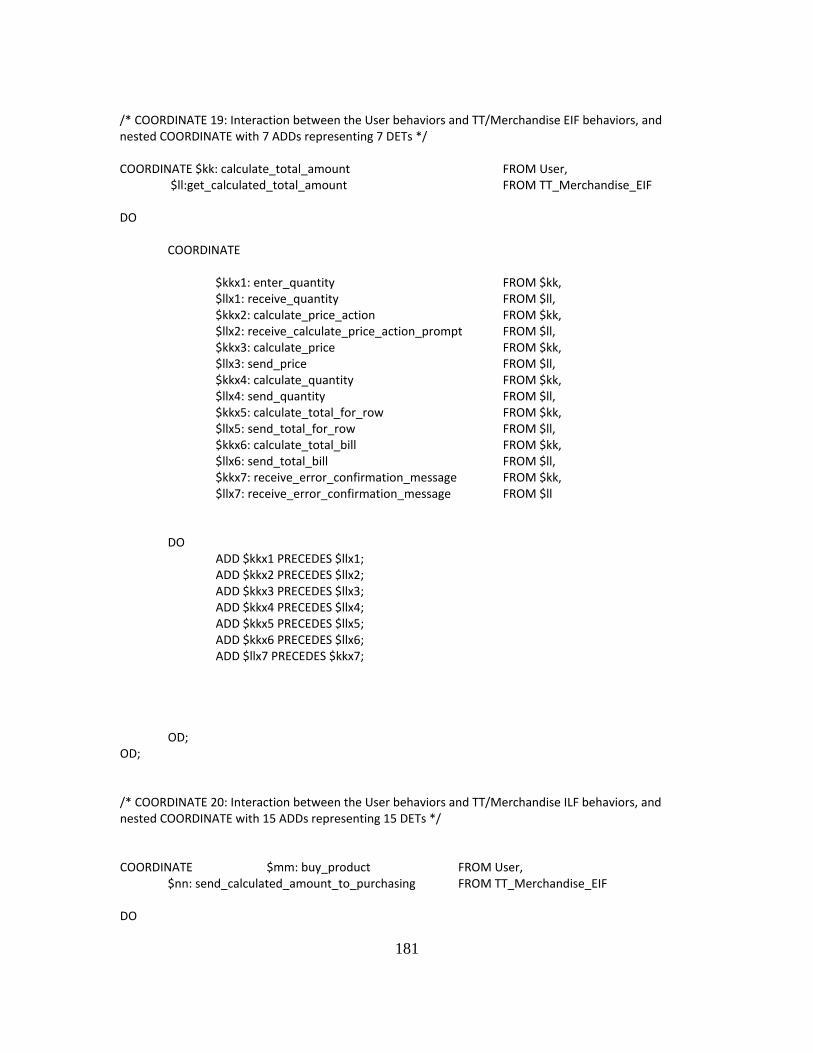
181
/* COORDINATE 19: Interaction between the User behaviors and TT/Merchandise EIF behaviors, and nested COORDINATE with 7 ADDs representing 7 DETs */ COORDINATE $kk: calculate_total_amount FROM User, $ll:get_calculated_total_amount FROM TT_Merchandise_EIF DO COORDINATE $kkx1: enter_quantity FROM $kk, $llx1: receive_quantity FROM $ll, $kkx2: calculate_price_action FROM $kk, $llx2: receive_calculate_price_action_prompt FROM $ll, $kkx3: calculate_price FROM $kk, $llx3: send_price FROM $ll, $kkx4: calculate_quantity FROM $kk, $llx4: send_quantity FROM $ll, $kkx5: calculate_total_for_row FROM $kk, $llx5: send_total_for_row FROM $ll, $kkx6: calculate_total_bill FROM $kk, $llx6: send_total_bill FROM $ll, $kkx7: receive_error_confirmation_message FROM $kk, $llx7: receive_error_confirmation_message FROM $ll DO ADD $kkx1 PRECEDES $llx1; ADD $kkx2 PRECEDES $llx2; ADD $kkx3 PRECEDES $llx3; ADD $kkx4 PRECEDES $llx4; ADD $kkx5 PRECEDES $llx5; ADD $kkx6 PRECEDES $llx6; ADD $llx7 PRECEDES $kkx7; OD; OD; /* COORDINATE 20: Interaction between the User behaviors and TT/Merchandise ILF behaviors, and nested COORDINATE with 15 ADDs representing 15 DETs */ COORDINATE $mm: buy_product FROM User,
$nn: send_calculated_amount_to_purchasing FROM TT_Merchandise_EIF DO
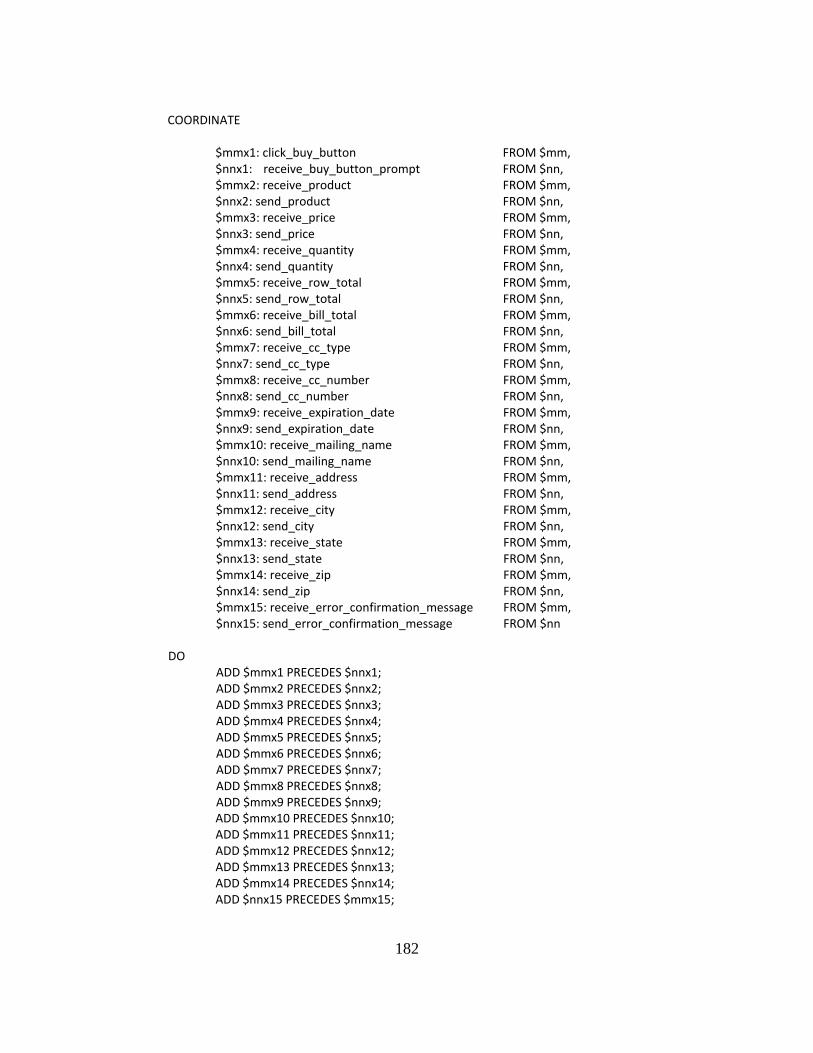
182
COORDINATE $mmx1: click_buy_button FROM $mm, $nnx1: receive_buy_button_prompt FROM $nn, $mmx2: receive_product FROM $mm, $nnx2: send_product FROM $nn, $mmx3: receive_price FROM $mm, $nnx3: send_price FROM $nn, $mmx4: receive_quantity FROM $mm, $nnx4: send_quantity FROM $nn, $mmx5: receive_row_total FROM $mm, $nnx5: send_row_total FROM $nn, $mmx6: receive_bill_total FROM $mm, $nnx6: send_bill_total FROM $nn, $mmx7: receive_cc_type FROM $mm, $nnx7: send_cc_type FROM $nn, $mmx8: receive_cc_number FROM $mm, $nnx8: send_cc_number FROM $nn, $mmx9: receive_expiration_date FROM $mm, $nnx9: send_expiration_date FROM $nn, $mmx10: receive_mailing_name FROM $mm, $nnx10: send_mailing_name FROM $nn, $mmx11: receive_address FROM $mm, $nnx11: send_address FROM $nn, $mmx12: receive_city FROM $mm, $nnx12: send_city FROM $nn, $mmx13: receive_state FROM $mm, $nnx13: send_state FROM $nn, $mmx14: receive_zip FROM $mm, $nnx14: send_zip FROM $nn, $mmx15: receive_error_confirmation_message FROM $mm, $nnx15: send_error_confirmation_message FROM $nn DO ADD $mmx1 PRECEDES $nnx1; ADD $mmx2 PRECEDES $nnx2; ADD $mmx3 PRECEDES $nnx3; ADD $mmx4 PRECEDES $nnx4; ADD $mmx5 PRECEDES $nnx5; ADD $mmx6 PRECEDES $nnx6; ADD $mmx7 PRECEDES $nnx7; ADD $mmx8 PRECEDES $nnx8; ADD $mmx9 PRECEDES $nnx9; ADD $mmx10 PRECEDES $nnx10; ADD $mmx11 PRECEDES $nnx11; ADD $mmx12 PRECEDES $nnx12; ADD $mmx13 PRECEDES $nnx13; ADD $mmx14 PRECEDES $nnx14; ADD $nnx15 PRECEDES $mmx15;
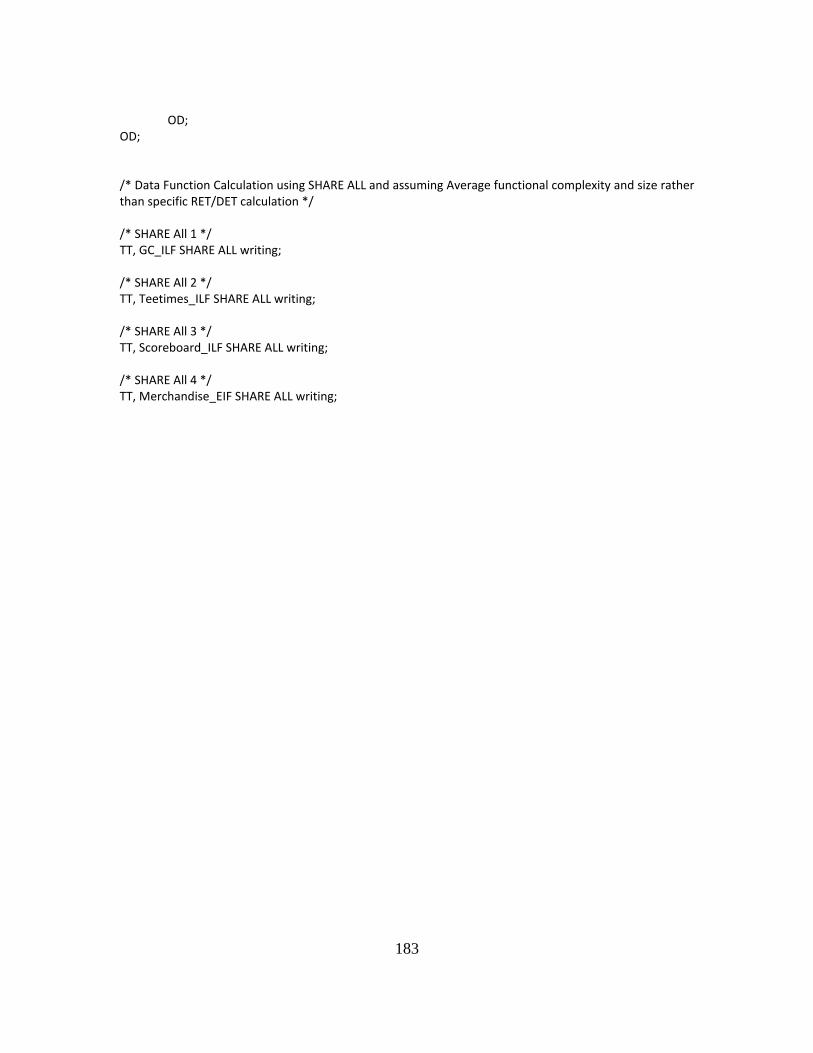
183
OD; OD; /* Data Function Calculation using SHARE ALL and assuming Average functional complexity and size rather than specific RET/DET calculation */ /* SHARE All 1 */ TT, GC_ILF SHARE ALL writing; /* SHARE All 2 */ TT, Teetimes_ILF SHARE ALL writing; /* SHARE All 3 */ TT, Scoreboard_ILF SHARE ALL writing; /* SHARE All 4 */ TT, Merchandise_EIF SHARE ALL writing;
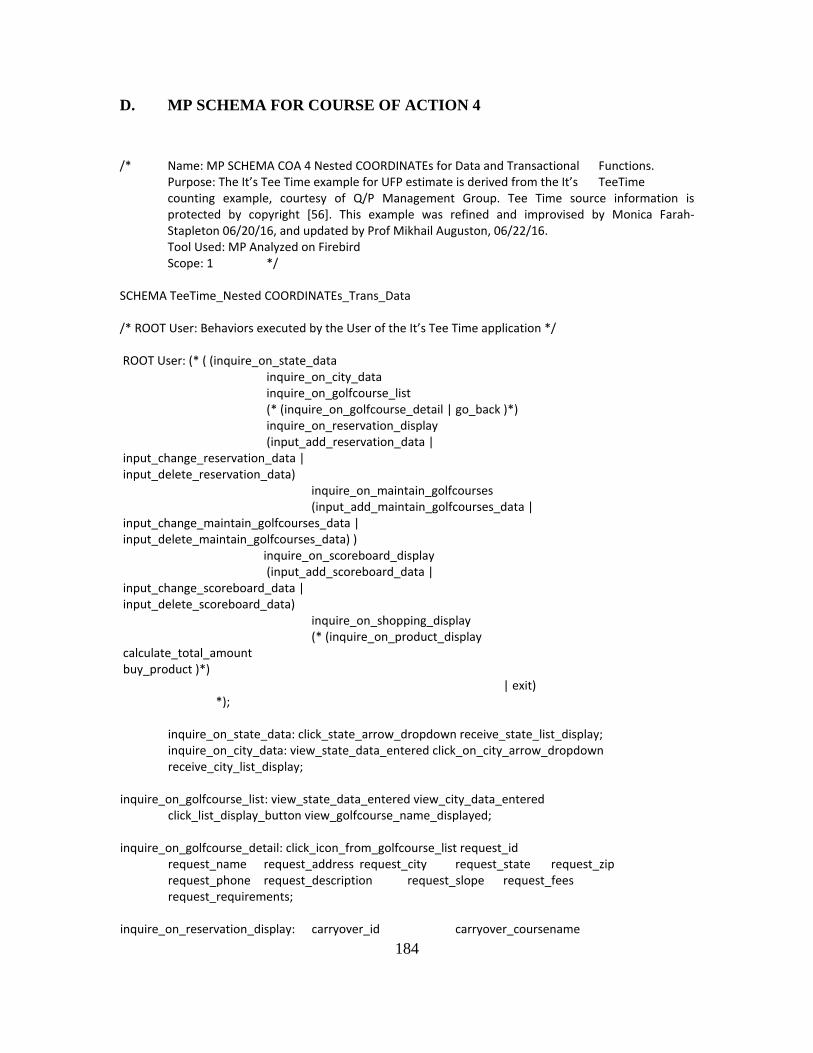
184
D. MP SCHEMA FOR COURSE OF ACTION 4
/* Name: MP SCHEMA COA 4 Nested COORDINATEs for Data and Transactional Functions.
Purpose: The It’s Tee Time example for UFP estimate is derived from the It’s TeeTime counting example, courtesy of Q/P Management Group. Tee Time source information is protected by copyright [56]. This example was refined and improvised by Monica Farah-Stapleton 06/20/16, and updated by Prof Mikhail Auguston, 06/22/16.
Tool Used: MP Analyzed on Firebird Scope: 1 */ SCHEMA TeeTime_Nested COORDINATEs_Trans_Data /* ROOT User: Behaviors executed by the User of the It’s Tee Time application */ ROOT User: (* ( (inquire_on_state_data inquire_on_city_data inquire_on_golfcourse_list (* (inquire_on_golfcourse_detail | go_back )*) inquire_on_reservation_display (input_add_reservation_data | input_change_reservation_data | input_delete_reservation_data) inquire_on_maintain_golfcourses (input_add_maintain_golfcourses_data | input_change_maintain_golfcourses_data | input_delete_maintain_golfcourses_data) ) inquire_on_scoreboard_display (input_add_scoreboard_data | input_change_scoreboard_data | input_delete_scoreboard_data) inquire_on_shopping_display (* (inquire_on_product_display calculate_total_amount buy_product )*) | exit) *); inquire_on_state_data: click_state_arrow_dropdown receive_state_list_display; inquire_on_city_data: view_state_data_entered click_on_city_arrow_dropdown receive_city_list_display; inquire_on_golfcourse_list: view_state_data_entered view_city_data_entered click_list_display_button view_golfcourse_name_displayed; inquire_on_golfcourse_detail: click_icon_from_golfcourse_list request_id request_name request_address request_city request_state request_zip request_phone request_description request_slope request_fees request_requirements; inquire_on_reservation_display: carryover_id carryover_coursename
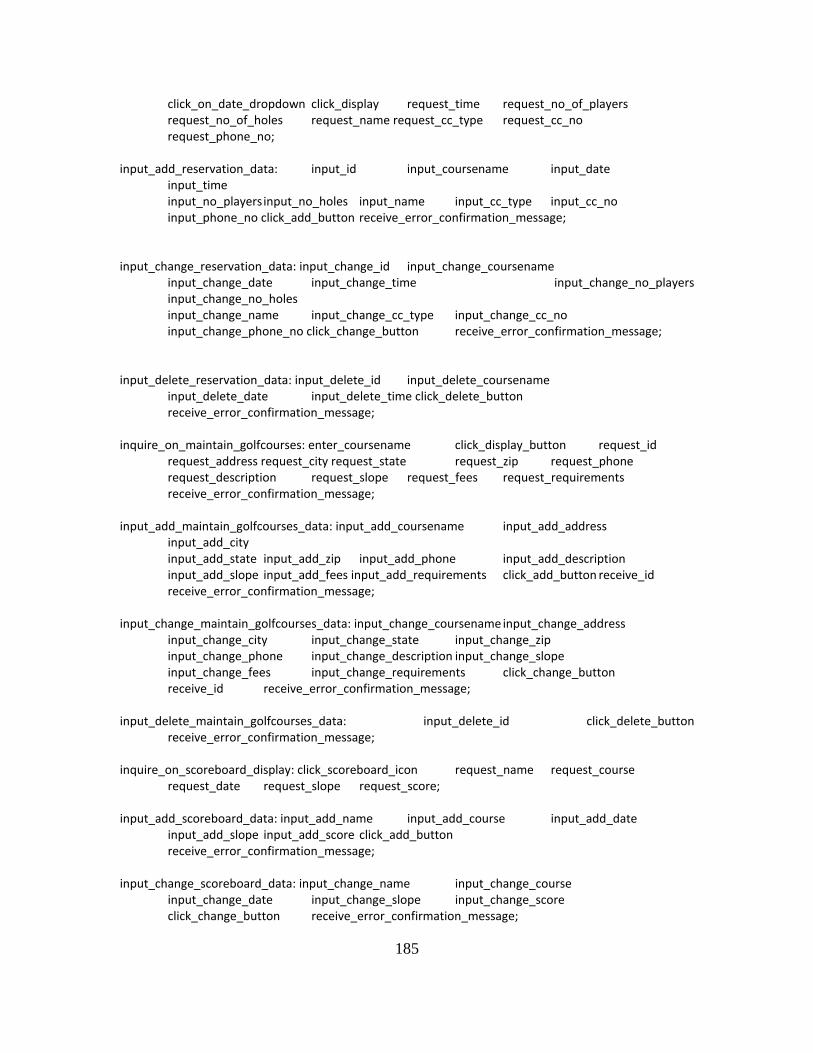
185
click_on_date_dropdown click_display request_time request_no_of_players request_no_of_holes request_name request_cc_type request_cc_no request_phone_no; input_add_reservation_data: input_id input_coursename input_date input_time input_no_players input_no_holes input_name input_cc_type input_cc_no input_phone_no click_add_button receive_error_confirmation_message; input_change_reservation_data: input_change_id input_change_coursename input_change_date input_change_time input_change_no_players input_change_no_holes input_change_name input_change_cc_type input_change_cc_no input_change_phone_no click_change_button receive_error_confirmation_message; input_delete_reservation_data: input_delete_id input_delete_coursename input_delete_date input_delete_time click_delete_button receive_error_confirmation_message; inquire_on_maintain_golfcourses: enter_coursename click_display_button request_id request_address request_city request_state request_zip request_phone request_description request_slope request_fees request_requirements receive_error_confirmation_message; input_add_maintain_golfcourses_data: input_add_coursename input_add_address input_add_city input_add_state input_add_zip input_add_phone input_add_description input_add_slope input_add_fees input_add_requirements click_add_button receive_id receive_error_confirmation_message; input_change_maintain_golfcourses_data: input_change_coursename input_change_address input_change_city input_change_state input_change_zip input_change_phone input_change_description input_change_slope input_change_fees input_change_requirements click_change_button receive_id receive_error_confirmation_message; input_delete_maintain_golfcourses_data: input_delete_id click_delete_button receive_error_confirmation_message; inquire_on_scoreboard_display: click_scoreboard_icon request_name request_course request_date request_slope request_score; input_add_scoreboard_data: input_add_name input_add_course input_add_date input_add_slope input_add_score click_add_button receive_error_confirmation_message; input_change_scoreboard_data: input_change_name input_change_course input_change_date input_change_slope input_change_score click_change_button receive_error_confirmation_message;
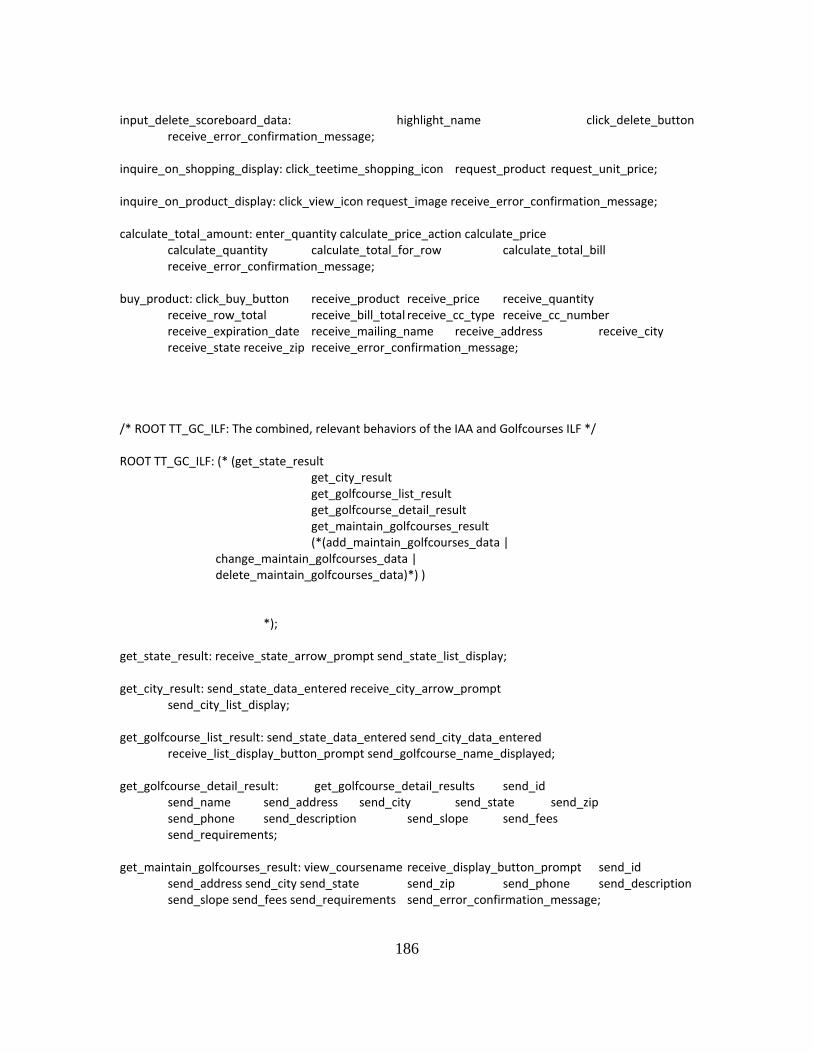
186
input_delete_scoreboard_data: highlight_name click_delete_button receive_error_confirmation_message; inquire_on_shopping_display: click_teetime_shopping_icon request_product request_unit_price; inquire_on_product_display: click_view_icon request_image receive_error_confirmation_message; calculate_total_amount: enter_quantity calculate_price_action calculate_price calculate_quantity calculate_total_for_row calculate_total_bill receive_error_confirmation_message; buy_product: click_buy_button receive_product receive_price receive_quantity receive_row_total receive_bill_total receive_cc_type receive_cc_number receive_expiration_date receive_mailing_name receive_address receive_city receive_state receive_zip receive_error_confirmation_message; /* ROOT TT_GC_ILF: The combined, relevant behaviors of the IAA and Golfcourses ILF */ ROOT TT_GC_ILF: (* (get_state_result get_city_result get_golfcourse_list_result get_golfcourse_detail_result get_maintain_golfcourses_result (*(add_maintain_golfcourses_data | change_maintain_golfcourses_data | delete_maintain_golfcourses_data)*) ) *); get_state_result: receive_state_arrow_prompt send_state_list_display; get_city_result: send_state_data_entered receive_city_arrow_prompt send_city_list_display; get_golfcourse_list_result: send_state_data_entered send_city_data_entered receive_list_display_button_prompt send_golfcourse_name_displayed; get_golfcourse_detail_result: get_golfcourse_detail_results send_id send_name send_address send_city send_state send_zip send_phone send_description send_slope send_fees send_requirements; get_maintain_golfcourses_result: view_coursename receive_display_button_prompt send_id send_address send_city send_state send_zip send_phone send_description send_slope send_fees send_requirements send_error_confirmation_message;
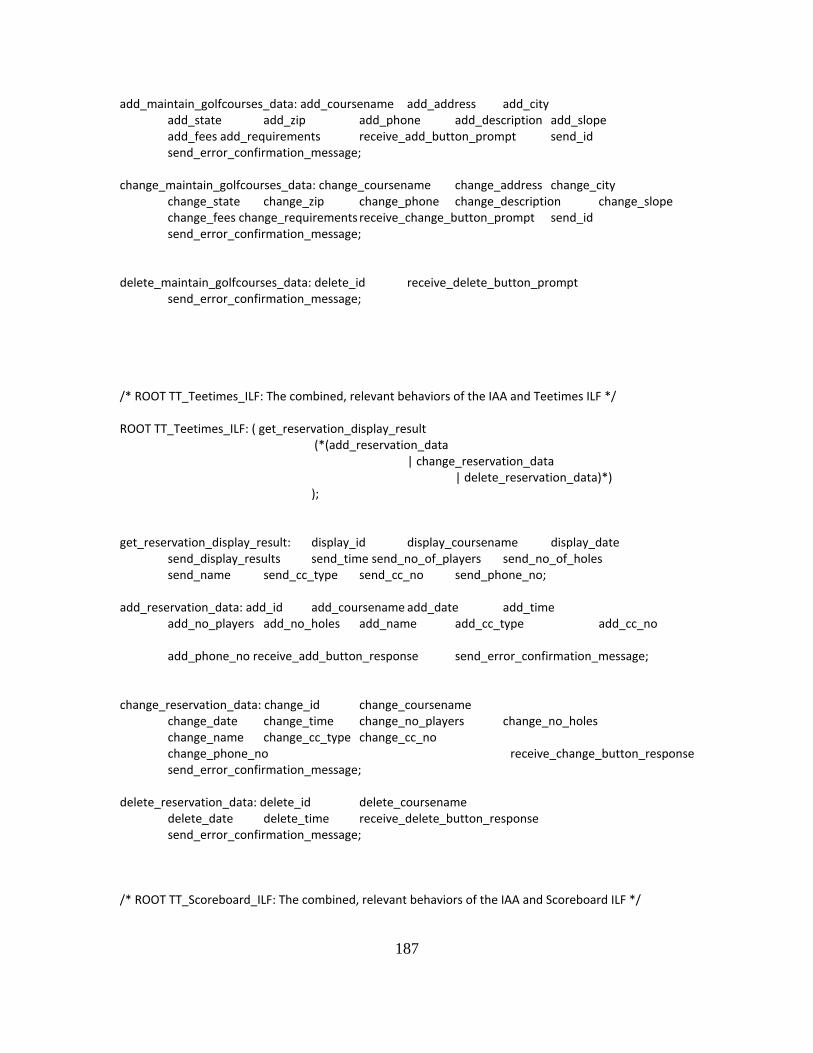
187
add_maintain_golfcourses_data: add_coursename add_address add_city add_state add_zip add_phone add_description add_slope add_fees add_requirements receive_add_button_prompt send_id send_error_confirmation_message; change_maintain_golfcourses_data: change_coursename change_address change_city change_state change_zip change_phone change_description change_slope change_fees change_requirements receive_change_button_prompt send_id send_error_confirmation_message; delete_maintain_golfcourses_data: delete_id receive_delete_button_prompt send_error_confirmation_message; /* ROOT TT_Teetimes_ILF: The combined, relevant behaviors of the IAA and Teetimes ILF */ ROOT TT_Teetimes_ILF: ( get_reservation_display_result (*(add_reservation_data | change_reservation_data | delete_reservation_data)*) ); get_reservation_display_result: display_id display_coursename display_date send_display_results send_time send_no_of_players send_no_of_holes send_name send_cc_type send_cc_no send_phone_no; add_reservation_data: add_id add_coursename add_date add_time add_no_players add_no_holes add_name add_cc_type add_cc_no add_phone_no receive_add_button_response send_error_confirmation_message; change_reservation_data: change_id change_coursename change_date change_time change_no_players change_no_holes change_name change_cc_type change_cc_no change_phone_no receive_change_button_response send_error_confirmation_message; delete_reservation_data: delete_id delete_coursename delete_date delete_time receive_delete_button_response send_error_confirmation_message; /* ROOT TT_Scoreboard_ILF: The combined, relevant behaviors of the IAA and Scoreboard ILF */
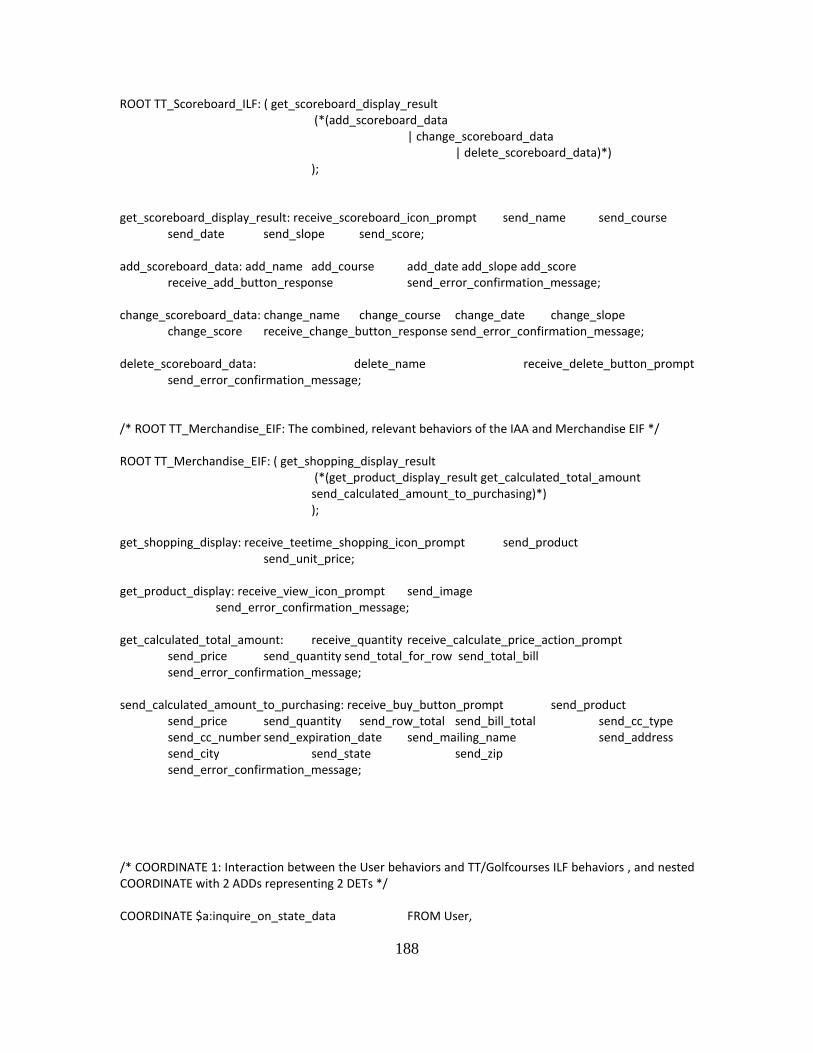
188
ROOT TT_Scoreboard_ILF: ( get_scoreboard_display_result (*(add_scoreboard_data | change_scoreboard_data | delete_scoreboard_data)*) ); get_scoreboard_display_result: receive_scoreboard_icon_prompt send_name send_course send_date send_slope send_score; add_scoreboard_data: add_name add_course add_date add_slope add_score receive_add_button_response send_error_confirmation_message; change_scoreboard_data: change_name change_course change_date change_slope change_score receive_change_button_response send_error_confirmation_message; delete_scoreboard_data: delete_name receive_delete_button_prompt send_error_confirmation_message; /* ROOT TT_Merchandise_EIF: The combined, relevant behaviors of the IAA and Merchandise EIF */ ROOT TT_Merchandise_EIF: ( get_shopping_display_result (*(get_product_display_result get_calculated_total_amount send_calculated_amount_to_purchasing)*) ); get_shopping_display: receive_teetime_shopping_icon_prompt send_product send_unit_price; get_product_display: receive_view_icon_prompt send_image send_error_confirmation_message; get_calculated_total_amount: receive_quantity receive_calculate_price_action_prompt send_price send_quantity send_total_for_row send_total_bill send_error_confirmation_message; send_calculated_amount_to_purchasing: receive_buy_button_prompt send_product send_price send_quantity send_row_total send_bill_total send_cc_type send_cc_number send_expiration_date send_mailing_name send_address send_city send_state send_zip send_error_confirmation_message; /* COORDINATE 1: Interaction between the User behaviors and TT/Golfcourses ILF behaviors , and nested COORDINATE with 2 ADDs representing 2 DETs */ COORDINATE $a:inquire_on_state_data FROM User,
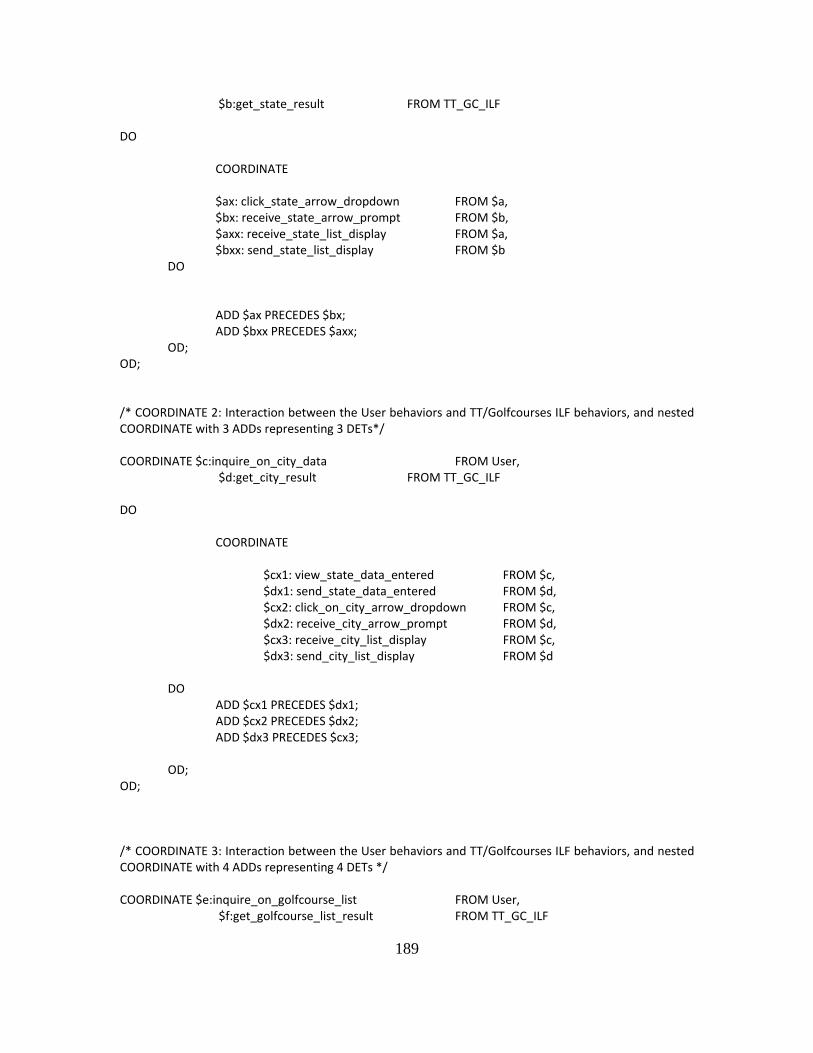
189
$b:get_state_result FROM TT_GC_ILF DO COORDINATE $ax: click_state_arrow_dropdown FROM $a, $bx: receive_state_arrow_prompt FROM $b, $axx: receive_state_list_display FROM $a, $bxx: send_state_list_display FROM $b DO ADD $ax PRECEDES $bx; ADD $bxx PRECEDES $axx; OD; OD; /* COORDINATE 2: Interaction between the User behaviors and TT/Golfcourses ILF behaviors, and nested COORDINATE with 3 ADDs representing 3 DETs*/ COORDINATE $c:inquire_on_city_data FROM User, $d:get_city_result FROM TT_GC_ILF DO COORDINATE $cx1: view_state_data_entered FROM $c, $dx1: send_state_data_entered FROM $d, $cx2: click_on_city_arrow_dropdown FROM $c, $dx2: receive_city_arrow_prompt FROM $d, $cx3: receive_city_list_display FROM $c, $dx3: send_city_list_display FROM $d DO ADD $cx1 PRECEDES $dx1; ADD $cx2 PRECEDES $dx2; ADD $dx3 PRECEDES $cx3; OD; OD; /* COORDINATE 3: Interaction between the User behaviors and TT/Golfcourses ILF behaviors, and nested COORDINATE with 4 ADDs representing 4 DETs */ COORDINATE $e:inquire_on_golfcourse_list FROM User, $f:get_golfcourse_list_result FROM TT_GC_ILF
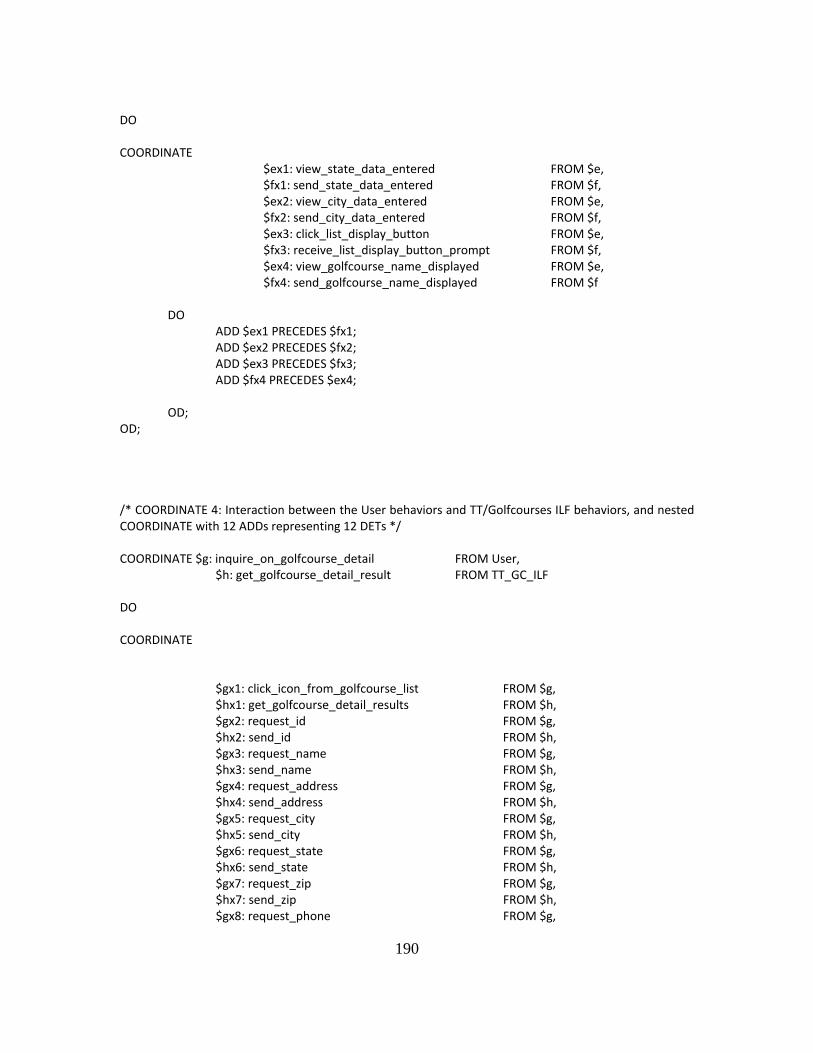
190
DO COORDINATE $ex1: view_state_data_entered FROM $e, $fx1: send_state_data_entered FROM $f, $ex2: view_city_data_entered FROM $e, $fx2: send_city_data_entered FROM $f, $ex3: click_list_display_button FROM $e, $fx3: receive_list_display_button_prompt FROM $f, $ex4: view_golfcourse_name_displayed FROM $e, $fx4: send_golfcourse_name_displayed FROM $f DO ADD $ex1 PRECEDES $fx1; ADD $ex2 PRECEDES $fx2; ADD $ex3 PRECEDES $fx3; ADD $fx4 PRECEDES $ex4; OD; OD; /* COORDINATE 4: Interaction between the User behaviors and TT/Golfcourses ILF behaviors, and nested COORDINATE with 12 ADDs representing 12 DETs */ COORDINATE $g: inquire_on_golfcourse_detail FROM User, $h: get_golfcourse_detail_result FROM TT_GC_ILF DO COORDINATE $gx1: click_icon_from_golfcourse_list FROM $g, $hx1: get_golfcourse_detail_results FROM $h, $gx2: request_id FROM $g, $hx2: send_id FROM $h, $gx3: request_name FROM $g, $hx3: send_name FROM $h, $gx4: request_address FROM $g, $hx4: send_address FROM $h, $gx5: request_city FROM $g, $hx5: send_city FROM $h, $gx6: request_state FROM $g, $hx6: send_state FROM $h, $gx7: request_zip FROM $g, $hx7: send_zip FROM $h, $gx8: request_phone FROM $g,
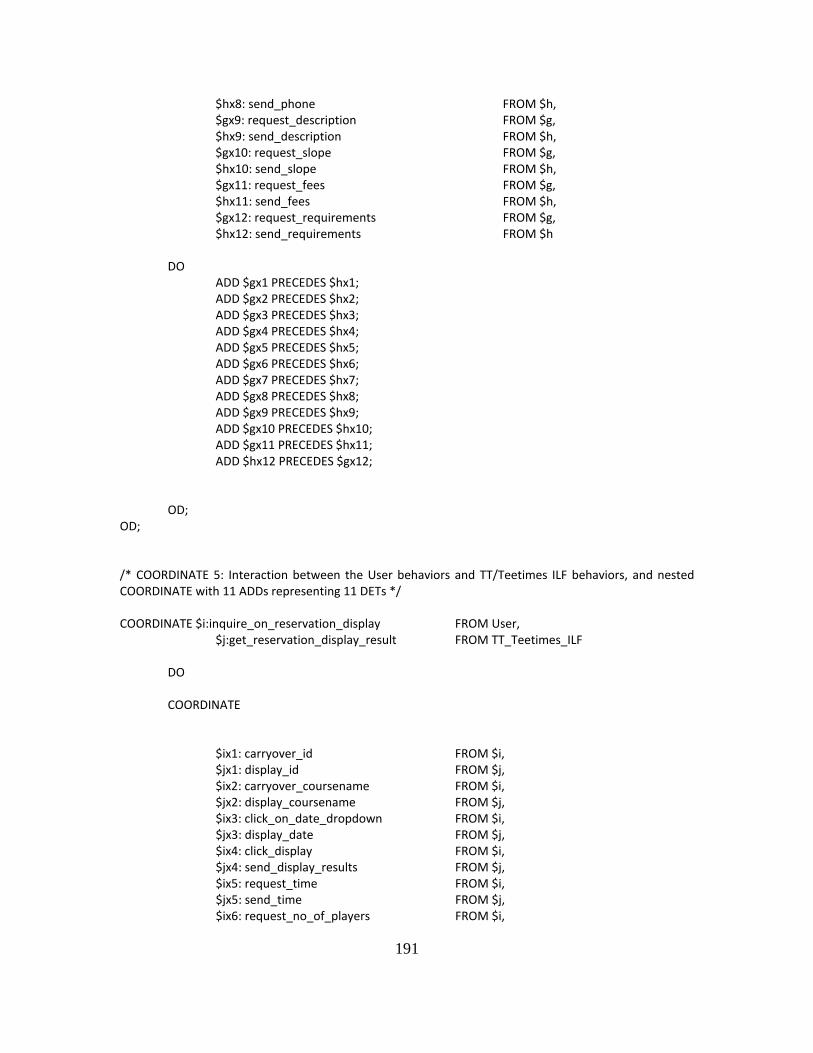
191
$hx8: send_phone FROM $h, $gx9: request_description FROM $g, $hx9: send_description FROM $h, $gx10: request_slope FROM $g, $hx10: send_slope FROM $h, $gx11: request_fees FROM $g, $hx11: send_fees FROM $h, $gx12: request_requirements FROM $g, $hx12: send_requirements FROM $h DO ADD $gx1 PRECEDES $hx1; ADD $gx2 PRECEDES $hx2; ADD $gx3 PRECEDES $hx3; ADD $gx4 PRECEDES $hx4; ADD $gx5 PRECEDES $hx5; ADD $gx6 PRECEDES $hx6; ADD $gx7 PRECEDES $hx7; ADD $gx8 PRECEDES $hx8; ADD $gx9 PRECEDES $hx9; ADD $gx10 PRECEDES $hx10; ADD $gx11 PRECEDES $hx11; ADD $hx12 PRECEDES $gx12; OD; OD; /* COORDINATE 5: Interaction between the User behaviors and TT/Teetimes ILF behaviors, and nested COORDINATE with 11 ADDs representing 11 DETs */ COORDINATE $i:inquire_on_reservation_display FROM User, $j:get_reservation_display_result FROM TT_Teetimes_ILF DO COORDINATE $ix1: carryover_id FROM $i, $jx1: display_id FROM $j, $ix2: carryover_coursename FROM $i, $jx2: display_coursename FROM $j, $ix3: click_on_date_dropdown FROM $i, $jx3: display_date FROM $j, $ix4: click_display FROM $i, $jx4: send_display_results FROM $j, $ix5: request_time FROM $i, $jx5: send_time FROM $j, $ix6: request_no_of_players FROM $i,
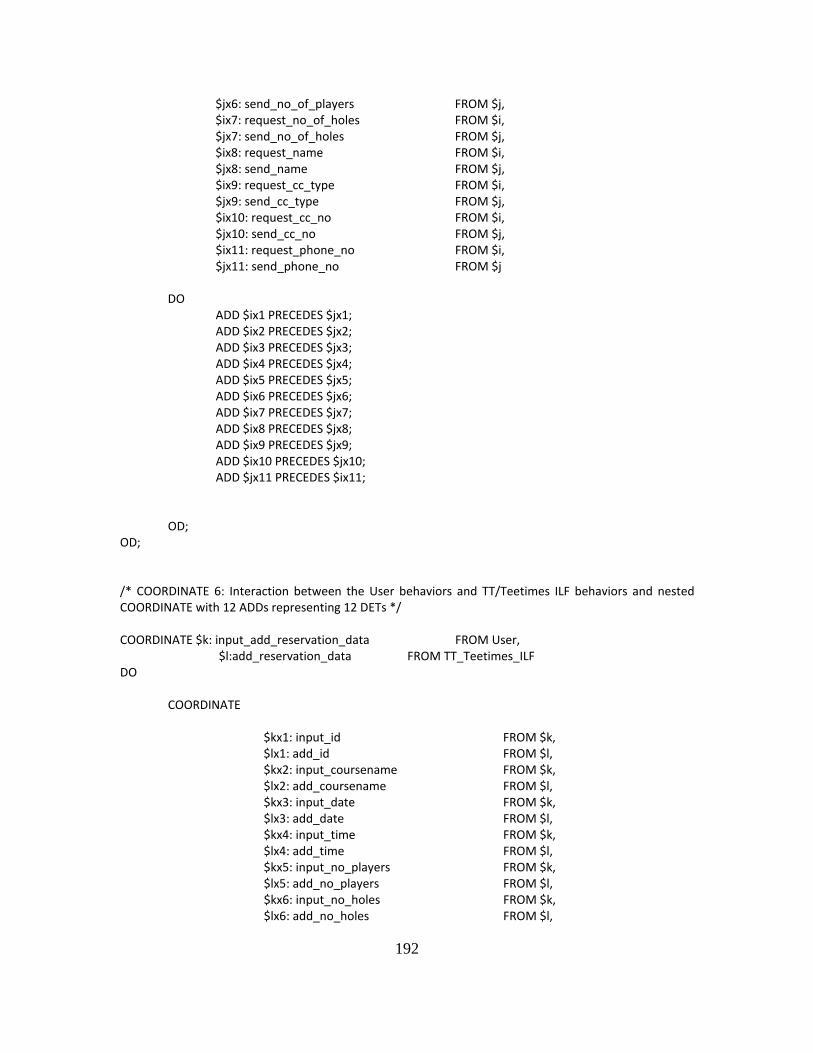
192
$jx6: send_no_of_players FROM $j, $ix7: request_no_of_holes FROM $i, $jx7: send_no_of_holes FROM $j, $ix8: request_name FROM $i, $jx8: send_name FROM $j, $ix9: request_cc_type FROM $i, $jx9: send_cc_type FROM $j, $ix10: request_cc_no FROM $i, $jx10: send_cc_no FROM $j, $ix11: request_phone_no FROM $i, $jx11: send_phone_no FROM $j DO ADD $ix1 PRECEDES $jx1; ADD $ix2 PRECEDES $jx2; ADD $ix3 PRECEDES $jx3; ADD $ix4 PRECEDES $jx4; ADD $ix5 PRECEDES $jx5; ADD $ix6 PRECEDES $jx6; ADD $ix7 PRECEDES $jx7; ADD $ix8 PRECEDES $jx8; ADD $ix9 PRECEDES $jx9; ADD $ix10 PRECEDES $jx10; ADD $jx11 PRECEDES $ix11; OD; OD; /* COORDINATE 6: Interaction between the User behaviors and TT/Teetimes ILF behaviors and nested COORDINATE with 12 ADDs representing 12 DETs */ COORDINATE $k: input_add_reservation_data FROM User, $l:add_reservation_data FROM TT_Teetimes_ILF DO COORDINATE $kx1: input_id FROM $k, $lx1: add_id FROM $l, $kx2: input_coursename FROM $k, $lx2: add_coursename FROM $l, $kx3: input_date FROM $k, $lx3: add_date FROM $l, $kx4: input_time FROM $k, $lx4: add_time FROM $l, $kx5: input_no_players FROM $k, $lx5: add_no_players FROM $l, $kx6: input_no_holes FROM $k, $lx6: add_no_holes FROM $l,
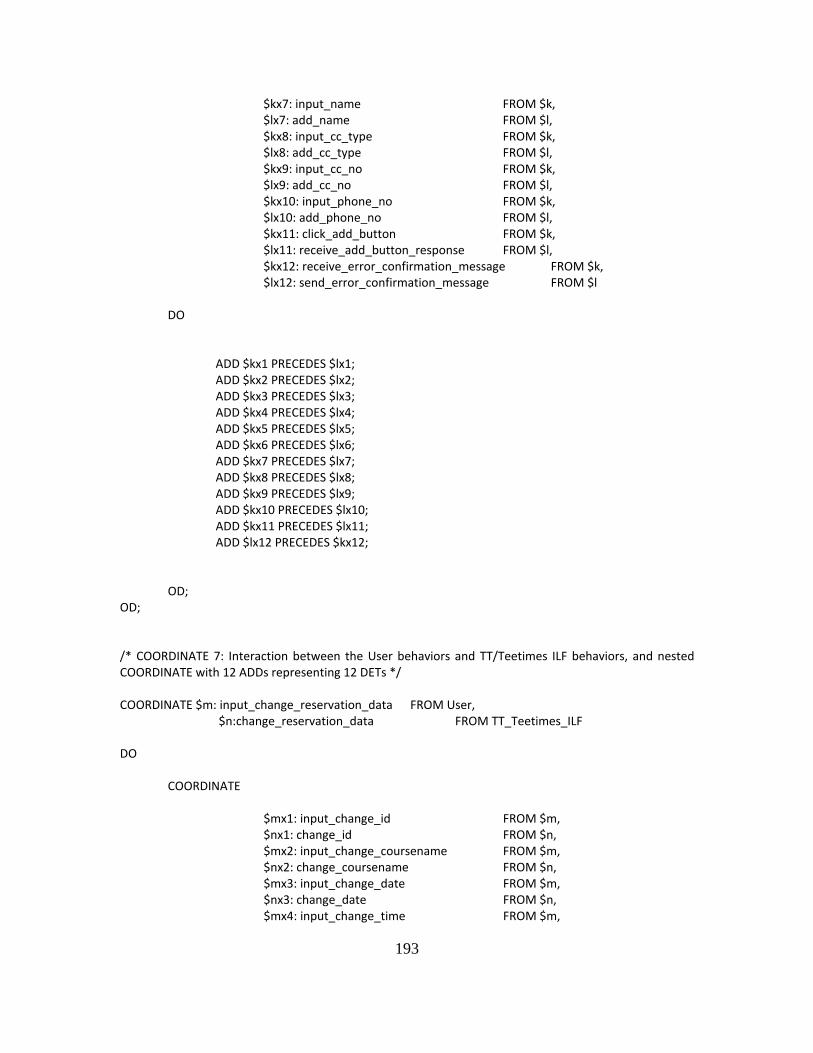
193
$kx7: input_name FROM $k, $lx7: add_name FROM $l, $kx8: input_cc_type FROM $k, $lx8: add_cc_type FROM $l, $kx9: input_cc_no FROM $k, $lx9: add_cc_no FROM $l, $kx10: input_phone_no FROM $k, $lx10: add_phone_no FROM $l, $kx11: click_add_button FROM $k, $lx11: receive_add_button_response FROM $l, $kx12: receive_error_confirmation_message FROM $k, $lx12: send_error_confirmation_message FROM $l DO ADD $kx1 PRECEDES $lx1; ADD $kx2 PRECEDES $lx2; ADD $kx3 PRECEDES $lx3; ADD $kx4 PRECEDES $lx4; ADD $kx5 PRECEDES $lx5; ADD $kx6 PRECEDES $lx6; ADD $kx7 PRECEDES $lx7; ADD $kx8 PRECEDES $lx8; ADD $kx9 PRECEDES $lx9; ADD $kx10 PRECEDES $lx10; ADD $kx11 PRECEDES $lx11; ADD $lx12 PRECEDES $kx12; OD; OD; /* COORDINATE 7: Interaction between the User behaviors and TT/Teetimes ILF behaviors, and nested COORDINATE with 12 ADDs representing 12 DETs */ COORDINATE $m: input_change_reservation_data FROM User, $n:change_reservation_data FROM TT_Teetimes_ILF DO COORDINATE $mx1: input_change_id FROM $m, $nx1: change_id FROM $n, $mx2: input_change_coursename FROM $m, $nx2: change_coursename FROM $n, $mx3: input_change_date FROM $m, $nx3: change_date FROM $n, $mx4: input_change_time FROM $m,
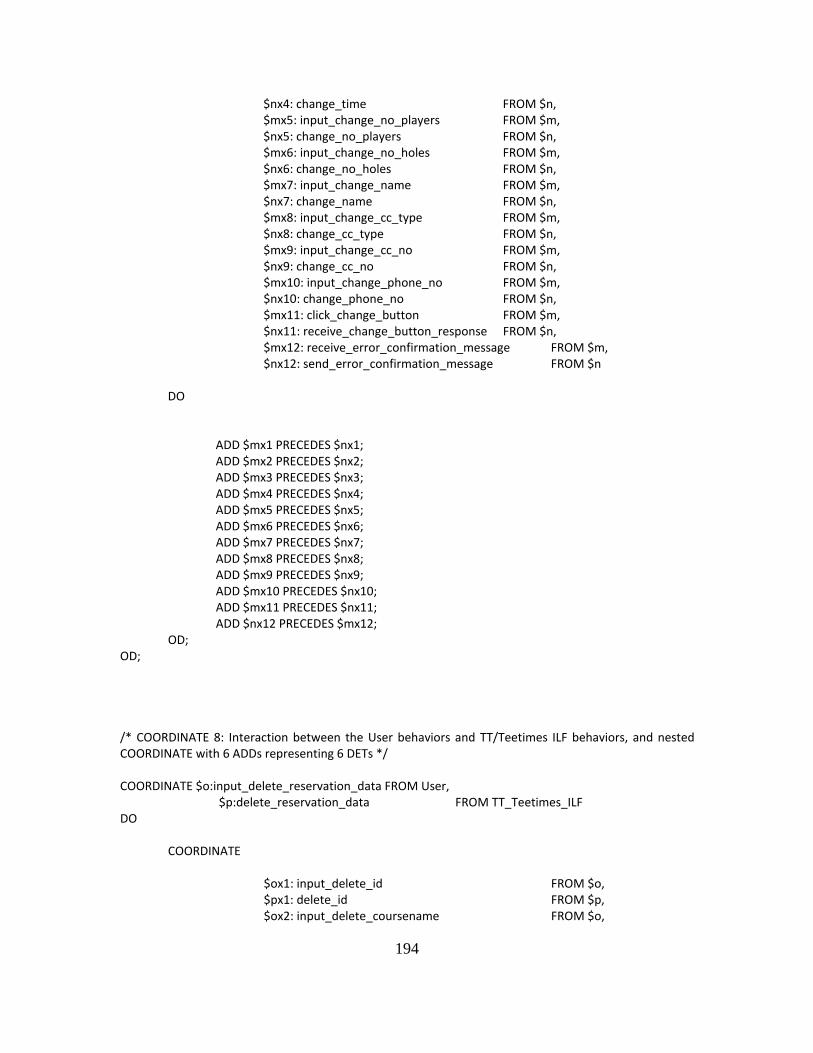
194
$nx4: change_time FROM $n, $mx5: input_change_no_players FROM $m, $nx5: change_no_players FROM $n, $mx6: input_change_no_holes FROM $m, $nx6: change_no_holes FROM $n, $mx7: input_change_name FROM $m, $nx7: change_name FROM $n, $mx8: input_change_cc_type FROM $m, $nx8: change_cc_type FROM $n, $mx9: input_change_cc_no FROM $m, $nx9: change_cc_no FROM $n, $mx10: input_change_phone_no FROM $m, $nx10: change_phone_no FROM $n, $mx11: click_change_button FROM $m, $nx11: receive_change_button_response FROM $n, $mx12: receive_error_confirmation_message FROM $m, $nx12: send_error_confirmation_message FROM $n DO ADD $mx1 PRECEDES $nx1; ADD $mx2 PRECEDES $nx2; ADD $mx3 PRECEDES $nx3; ADD $mx4 PRECEDES $nx4; ADD $mx5 PRECEDES $nx5; ADD $mx6 PRECEDES $nx6; ADD $mx7 PRECEDES $nx7; ADD $mx8 PRECEDES $nx8; ADD $mx9 PRECEDES $nx9; ADD $mx10 PRECEDES $nx10; ADD $mx11 PRECEDES $nx11; ADD $nx12 PRECEDES $mx12; OD; OD; /* COORDINATE 8: Interaction between the User behaviors and TT/Teetimes ILF behaviors, and nested COORDINATE with 6 ADDs representing 6 DETs */ COORDINATE $o:input_delete_reservation_data FROM User, $p:delete_reservation_data FROM TT_Teetimes_ILF DO COORDINATE $ox1: input_delete_id FROM $o, $px1: delete_id FROM $p, $ox2: input_delete_coursename FROM $o,
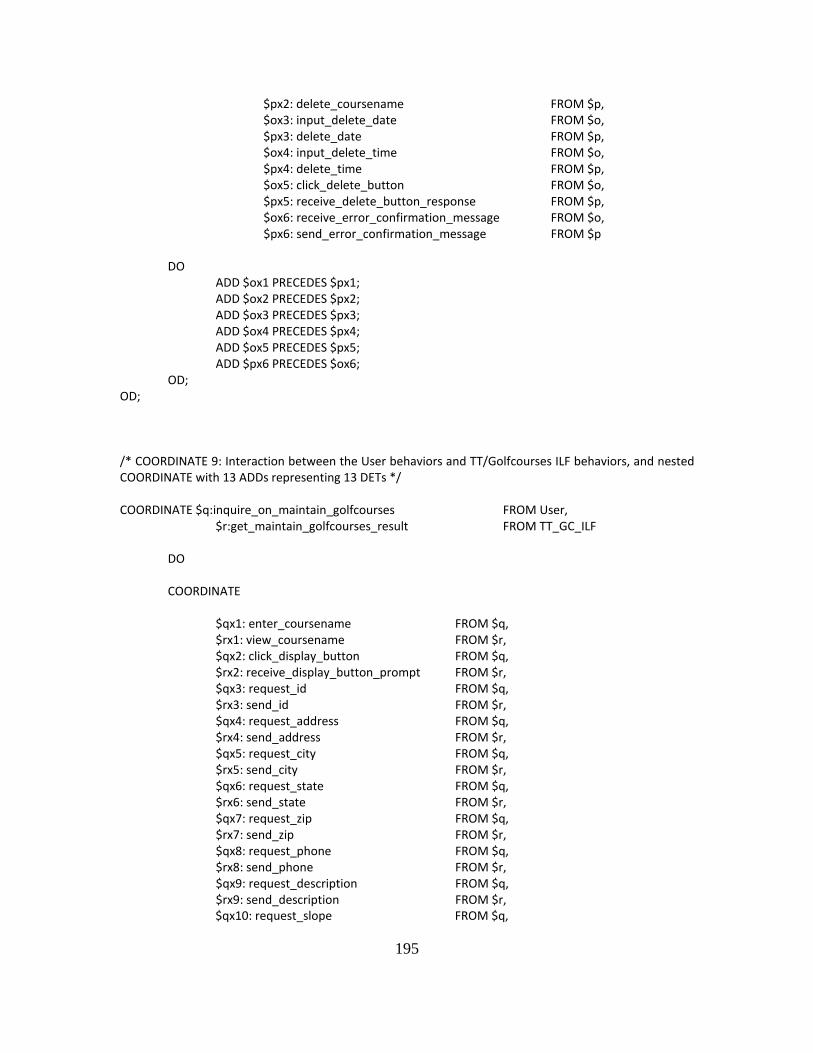
195
$px2: delete_coursename FROM $p, $ox3: input_delete_date FROM $o, $px3: delete_date FROM $p, $ox4: input_delete_time FROM $o, $px4: delete_time FROM $p, $ox5: click_delete_button FROM $o, $px5: receive_delete_button_response FROM $p, $ox6: receive_error_confirmation_message FROM $o, $px6: send_error_confirmation_message FROM $p DO ADD $ox1 PRECEDES $px1; ADD $ox2 PRECEDES $px2; ADD $ox3 PRECEDES $px3; ADD $ox4 PRECEDES $px4; ADD $ox5 PRECEDES $px5; ADD $px6 PRECEDES $ox6; OD; OD; /* COORDINATE 9: Interaction between the User behaviors and TT/Golfcourses ILF behaviors, and nested COORDINATE with 13 ADDs representing 13 DETs */ COORDINATE $q:inquire_on_maintain_golfcourses FROM User, $r:get_maintain_golfcourses_result FROM TT_GC_ILF DO COORDINATE $qx1: enter_coursename FROM $q, $rx1: view_coursename FROM $r, $qx2: click_display_button FROM $q, $rx2: receive_display_button_prompt FROM $r, $qx3: request_id FROM $q, $rx3: send_id FROM $r, $qx4: request_address FROM $q, $rx4: send_address FROM $r, $qx5: request_city FROM $q, $rx5: send_city FROM $r, $qx6: request_state FROM $q, $rx6: send_state FROM $r, $qx7: request_zip FROM $q, $rx7: send_zip FROM $r, $qx8: request_phone FROM $q, $rx8: send_phone FROM $r, $qx9: request_description FROM $q, $rx9: send_description FROM $r, $qx10: request_slope FROM $q,
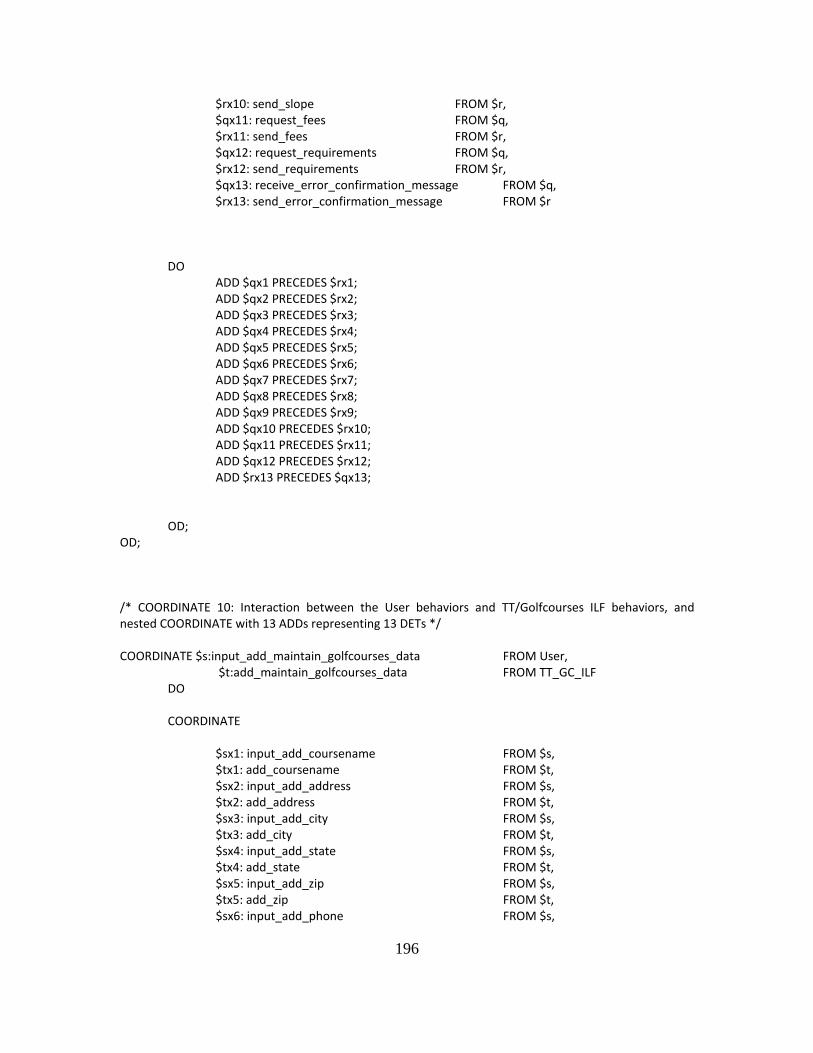
196
$rx10: send_slope FROM $r, $qx11: request_fees FROM $q, $rx11: send_fees FROM $r, $qx12: request_requirements FROM $q, $rx12: send_requirements FROM $r, $qx13: receive_error_confirmation_message FROM $q, $rx13: send_error_confirmation_message FROM $r DO ADD $qx1 PRECEDES $rx1; ADD $qx2 PRECEDES $rx2; ADD $qx3 PRECEDES $rx3; ADD $qx4 PRECEDES $rx4; ADD $qx5 PRECEDES $rx5; ADD $qx6 PRECEDES $rx6; ADD $qx7 PRECEDES $rx7; ADD $qx8 PRECEDES $rx8; ADD $qx9 PRECEDES $rx9; ADD $qx10 PRECEDES $rx10; ADD $qx11 PRECEDES $rx11; ADD $qx12 PRECEDES $rx12; ADD $rx13 PRECEDES $qx13; OD; OD; /* COORDINATE 10: Interaction between the User behaviors and TT/Golfcourses ILF behaviors, and nested COORDINATE with 13 ADDs representing 13 DETs */ COORDINATE $s:input_add_maintain_golfcourses_data FROM User, $t:add_maintain_golfcourses_data FROM TT_GC_ILF DO COORDINATE $sx1: input_add_coursename FROM $s, $tx1: add_coursename FROM $t, $sx2: input_add_address FROM $s, $tx2: add_address FROM $t, $sx3: input_add_city FROM $s, $tx3: add_city FROM $t, $sx4: input_add_state FROM $s, $tx4: add_state FROM $t, $sx5: input_add_zip FROM $s, $tx5: add_zip FROM $t, $sx6: input_add_phone FROM $s,
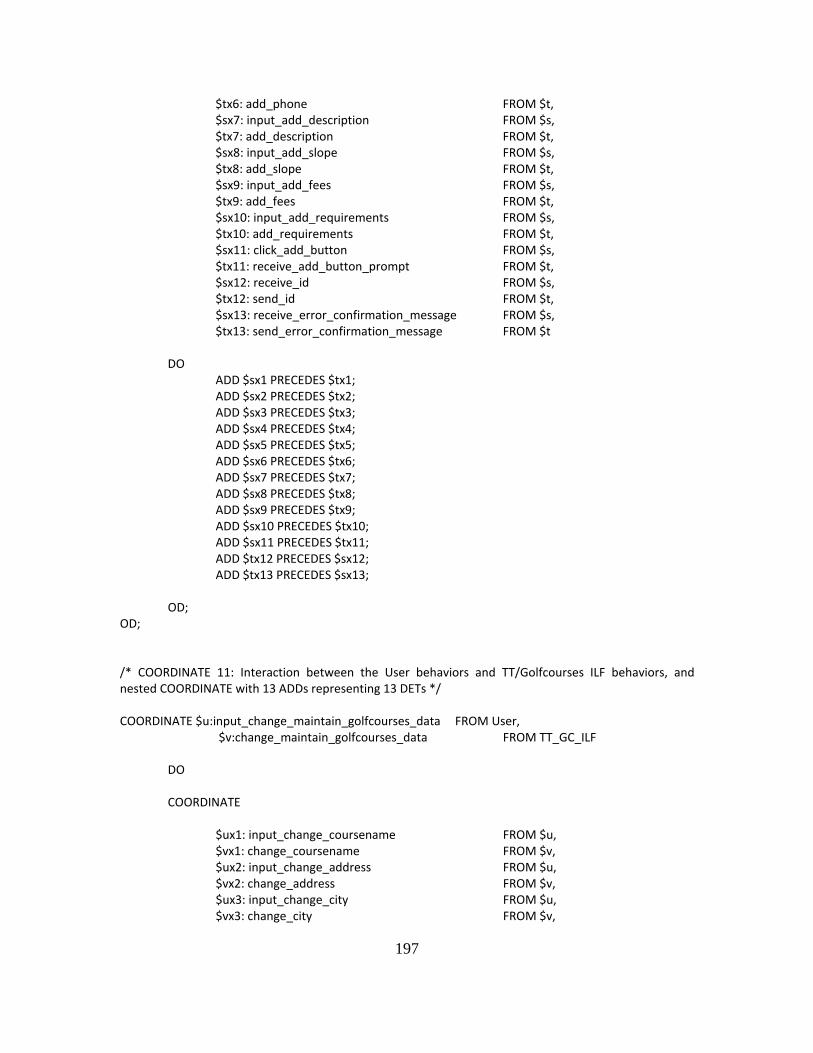
197
$tx6: add_phone FROM $t, $sx7: input_add_description FROM $s, $tx7: add_description FROM $t, $sx8: input_add_slope FROM $s, $tx8: add_slope FROM $t, $sx9: input_add_fees FROM $s, $tx9: add_fees FROM $t, $sx10: input_add_requirements FROM $s, $tx10: add_requirements FROM $t, $sx11: click_add_button FROM $s, $tx11: receive_add_button_prompt FROM $t, $sx12: receive_id FROM $s, $tx12: send_id FROM $t, $sx13: receive_error_confirmation_message FROM $s, $tx13: send_error_confirmation_message FROM $t DO ADD $sx1 PRECEDES $tx1; ADD $sx2 PRECEDES $tx2; ADD $sx3 PRECEDES $tx3; ADD $sx4 PRECEDES $tx4; ADD $sx5 PRECEDES $tx5; ADD $sx6 PRECEDES $tx6; ADD $sx7 PRECEDES $tx7; ADD $sx8 PRECEDES $tx8; ADD $sx9 PRECEDES $tx9; ADD $sx10 PRECEDES $tx10; ADD $sx11 PRECEDES $tx11; ADD $tx12 PRECEDES $sx12; ADD $tx13 PRECEDES $sx13; OD; OD; /* COORDINATE 11: Interaction between the User behaviors and TT/Golfcourses ILF behaviors, and nested COORDINATE with 13 ADDs representing 13 DETs */ COORDINATE $u:input_change_maintain_golfcourses_data FROM User, $v:change_maintain_golfcourses_data FROM TT_GC_ILF DO COORDINATE $ux1: input_change_coursename FROM $u, $vx1: change_coursename FROM $v, $ux2: input_change_address FROM $u, $vx2: change_address FROM $v, $ux3: input_change_city FROM $u, $vx3: change_city FROM $v,
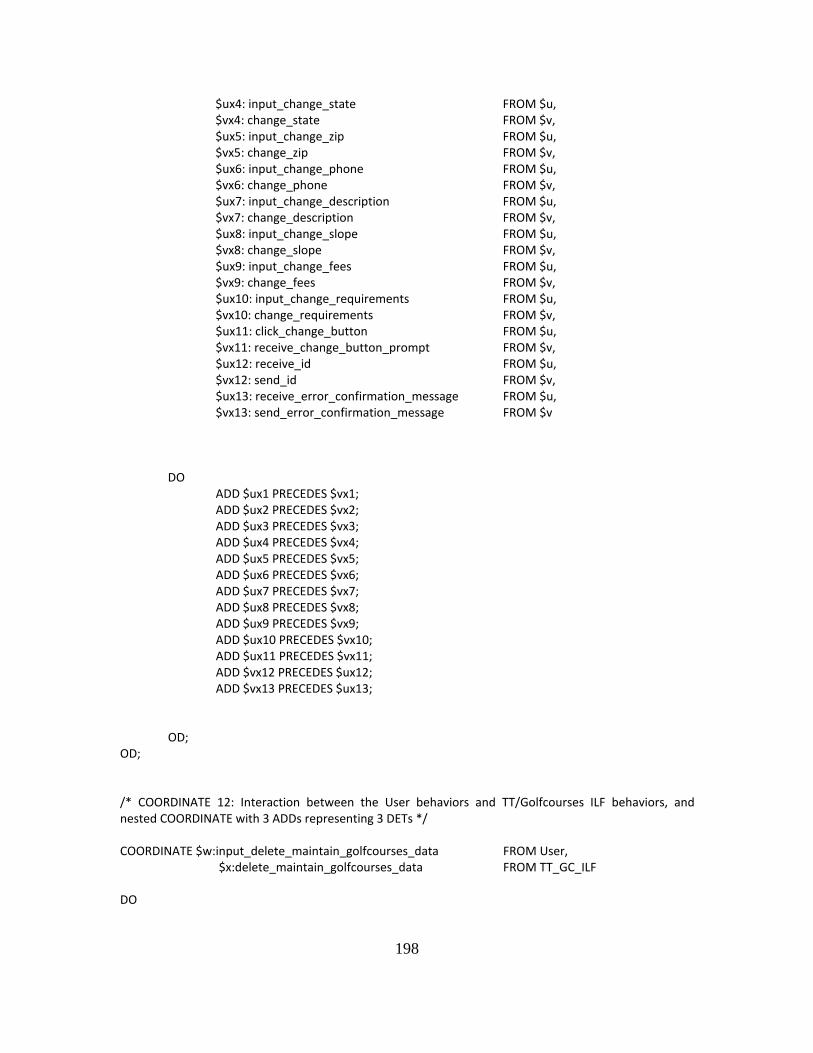
198
$ux4: input_change_state FROM $u, $vx4: change_state FROM $v, $ux5: input_change_zip FROM $u, $vx5: change_zip FROM $v, $ux6: input_change_phone FROM $u, $vx6: change_phone FROM $v, $ux7: input_change_description FROM $u, $vx7: change_description FROM $v, $ux8: input_change_slope FROM $u, $vx8: change_slope FROM $v, $ux9: input_change_fees FROM $u, $vx9: change_fees FROM $v, $ux10: input_change_requirements FROM $u, $vx10: change_requirements FROM $v, $ux11: click_change_button FROM $u, $vx11: receive_change_button_prompt FROM $v, $ux12: receive_id FROM $u, $vx12: send_id FROM $v, $ux13: receive_error_confirmation_message FROM $u, $vx13: send_error_confirmation_message FROM $v DO ADD $ux1 PRECEDES $vx1; ADD $ux2 PRECEDES $vx2; ADD $ux3 PRECEDES $vx3; ADD $ux4 PRECEDES $vx4; ADD $ux5 PRECEDES $vx5; ADD $ux6 PRECEDES $vx6; ADD $ux7 PRECEDES $vx7; ADD $ux8 PRECEDES $vx8; ADD $ux9 PRECEDES $vx9; ADD $ux10 PRECEDES $vx10; ADD $ux11 PRECEDES $vx11; ADD $vx12 PRECEDES $ux12; ADD $vx13 PRECEDES $ux13; OD; OD; /* COORDINATE 12: Interaction between the User behaviors and TT/Golfcourses ILF behaviors, and nested COORDINATE with 3 ADDs representing 3 DETs */ COORDINATE $w:input_delete_maintain_golfcourses_data FROM User, $x:delete_maintain_golfcourses_data FROM TT_GC_ILF DO
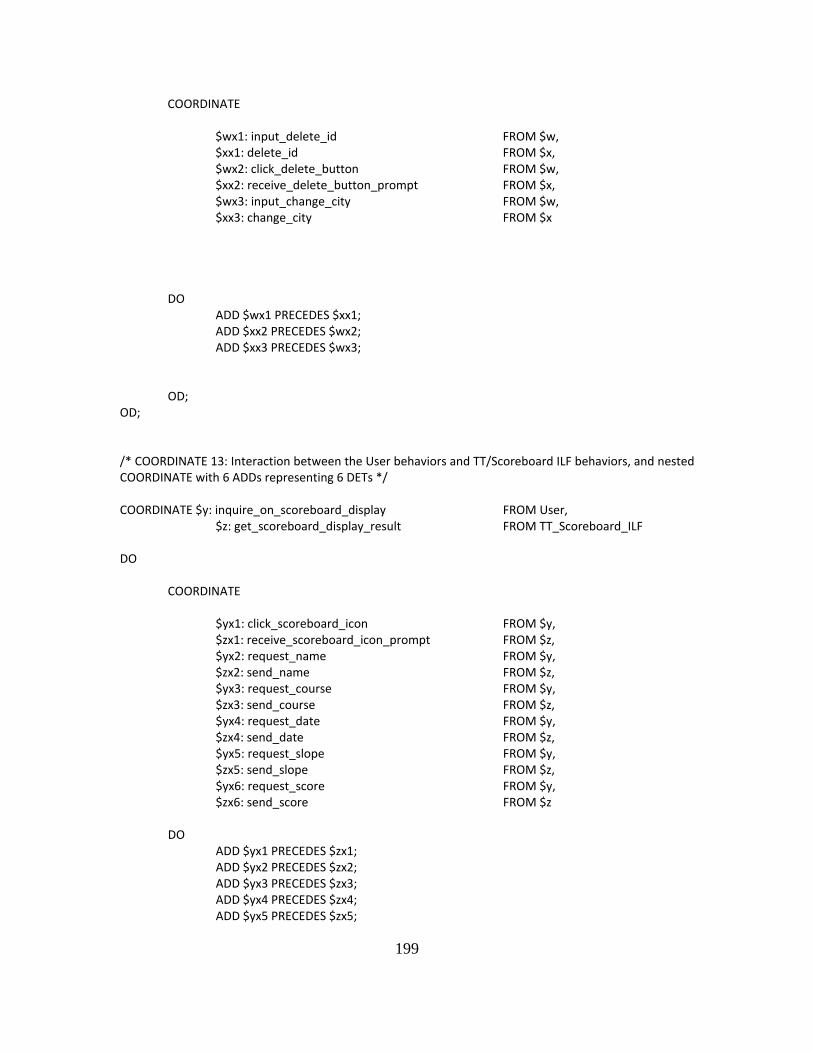
199
COORDINATE $wx1: input_delete_id FROM $w, $xx1: delete_id FROM $x, $wx2: click_delete_button FROM $w, $xx2: receive_delete_button_prompt FROM $x, $wx3: input_change_city FROM $w, $xx3: change_city FROM $x DO ADD $wx1 PRECEDES $xx1; ADD $xx2 PRECEDES $wx2; ADD $xx3 PRECEDES $wx3; OD; OD; /* COORDINATE 13: Interaction between the User behaviors and TT/Scoreboard ILF behaviors, and nested COORDINATE with 6 ADDs representing 6 DETs */ COORDINATE $y: inquire_on_scoreboard_display FROM User, $z: get_scoreboard_display_result FROM TT_Scoreboard_ILF DO COORDINATE $yx1: click_scoreboard_icon FROM $y, $zx1: receive_scoreboard_icon_prompt FROM $z, $yx2: request_name FROM $y, $zx2: send_name FROM $z, $yx3: request_course FROM $y, $zx3: send_course FROM $z, $yx4: request_date FROM $y, $zx4: send_date FROM $z, $yx5: request_slope FROM $y, $zx5: send_slope FROM $z, $yx6: request_score FROM $y, $zx6: send_score FROM $z DO ADD $yx1 PRECEDES $zx1; ADD $yx2 PRECEDES $zx2; ADD $yx3 PRECEDES $zx3; ADD $yx4 PRECEDES $zx4; ADD $yx5 PRECEDES $zx5;
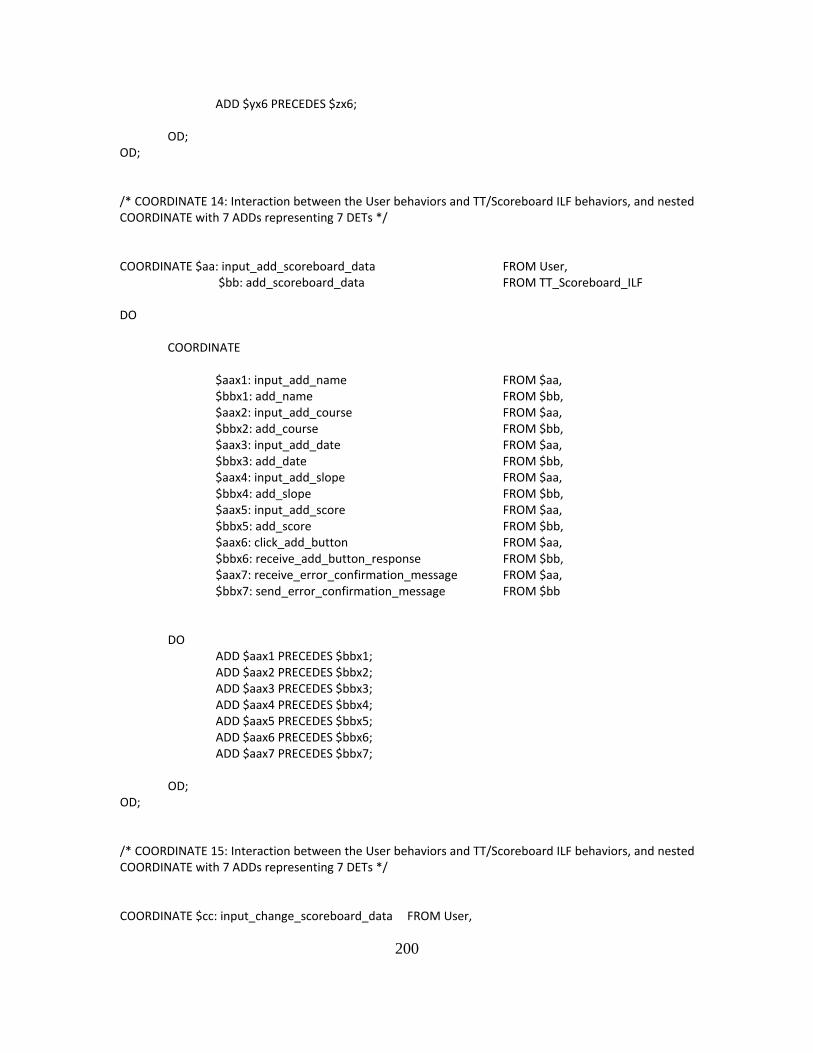
200
ADD $yx6 PRECEDES $zx6; OD; OD; /* COORDINATE 14: Interaction between the User behaviors and TT/Scoreboard ILF behaviors, and nested COORDINATE with 7 ADDs representing 7 DETs */ COORDINATE $aa: input_add_scoreboard_data FROM User, $bb: add_scoreboard_data FROM TT_Scoreboard_ILF DO COORDINATE $aax1: input_add_name FROM $aa, $bbx1: add_name FROM $bb, $aax2: input_add_course FROM $aa, $bbx2: add_course FROM $bb, $aax3: input_add_date FROM $aa, $bbx3: add_date FROM $bb, $aax4: input_add_slope FROM $aa, $bbx4: add_slope FROM $bb, $aax5: input_add_score FROM $aa, $bbx5: add_score FROM $bb, $aax6: click_add_button FROM $aa, $bbx6: receive_add_button_response FROM $bb, $aax7: receive_error_confirmation_message FROM $aa, $bbx7: send_error_confirmation_message FROM $bb DO ADD $aax1 PRECEDES $bbx1; ADD $aax2 PRECEDES $bbx2; ADD $aax3 PRECEDES $bbx3; ADD $aax4 PRECEDES $bbx4; ADD $aax5 PRECEDES $bbx5; ADD $aax6 PRECEDES $bbx6; ADD $aax7 PRECEDES $bbx7; OD; OD; /* COORDINATE 15: Interaction between the User behaviors and TT/Scoreboard ILF behaviors, and nested COORDINATE with 7 ADDs representing 7 DETs */ COORDINATE $cc: input_change_scoreboard_data FROM User,
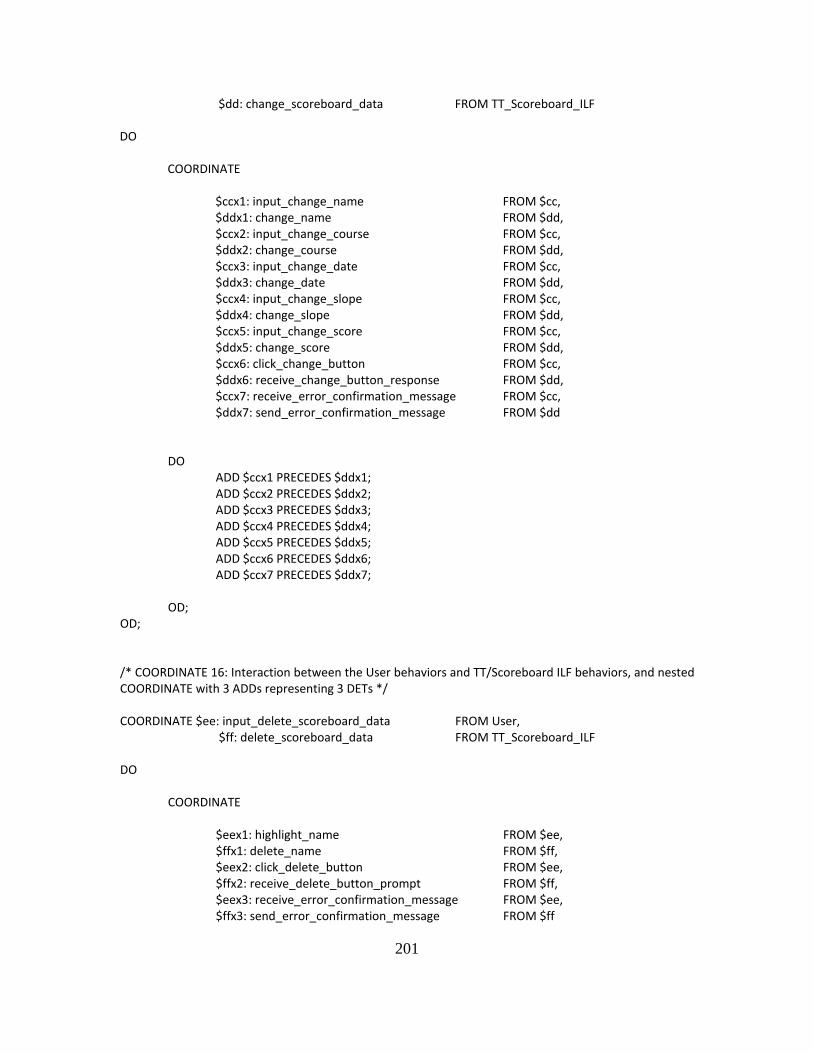
201
$dd: change_scoreboard_data FROM TT_Scoreboard_ILF DO COORDINATE $ccx1: input_change_name FROM $cc, $ddx1: change_name FROM $dd, $ccx2: input_change_course FROM $cc, $ddx2: change_course FROM $dd, $ccx3: input_change_date FROM $cc, $ddx3: change_date FROM $dd, $ccx4: input_change_slope FROM $cc, $ddx4: change_slope FROM $dd, $ccx5: input_change_score FROM $cc, $ddx5: change_score FROM $dd, $ccx6: click_change_button FROM $cc, $ddx6: receive_change_button_response FROM $dd, $ccx7: receive_error_confirmation_message FROM $cc, $ddx7: send_error_confirmation_message FROM $dd DO ADD $ccx1 PRECEDES $ddx1; ADD $ccx2 PRECEDES $ddx2; ADD $ccx3 PRECEDES $ddx3; ADD $ccx4 PRECEDES $ddx4; ADD $ccx5 PRECEDES $ddx5; ADD $ccx6 PRECEDES $ddx6; ADD $ccx7 PRECEDES $ddx7; OD; OD; /* COORDINATE 16: Interaction between the User behaviors and TT/Scoreboard ILF behaviors, and nested COORDINATE with 3 ADDs representing 3 DETs */ COORDINATE $ee: input_delete_scoreboard_data FROM User, $ff: delete_scoreboard_data FROM TT_Scoreboard_ILF DO COORDINATE $eex1: highlight_name FROM $ee, $ffx1: delete_name FROM $ff, $eex2: click_delete_button FROM $ee, $ffx2: receive_delete_button_prompt FROM $ff, $eex3: receive_error_confirmation_message FROM $ee, $ffx3: send_error_confirmation_message FROM $ff
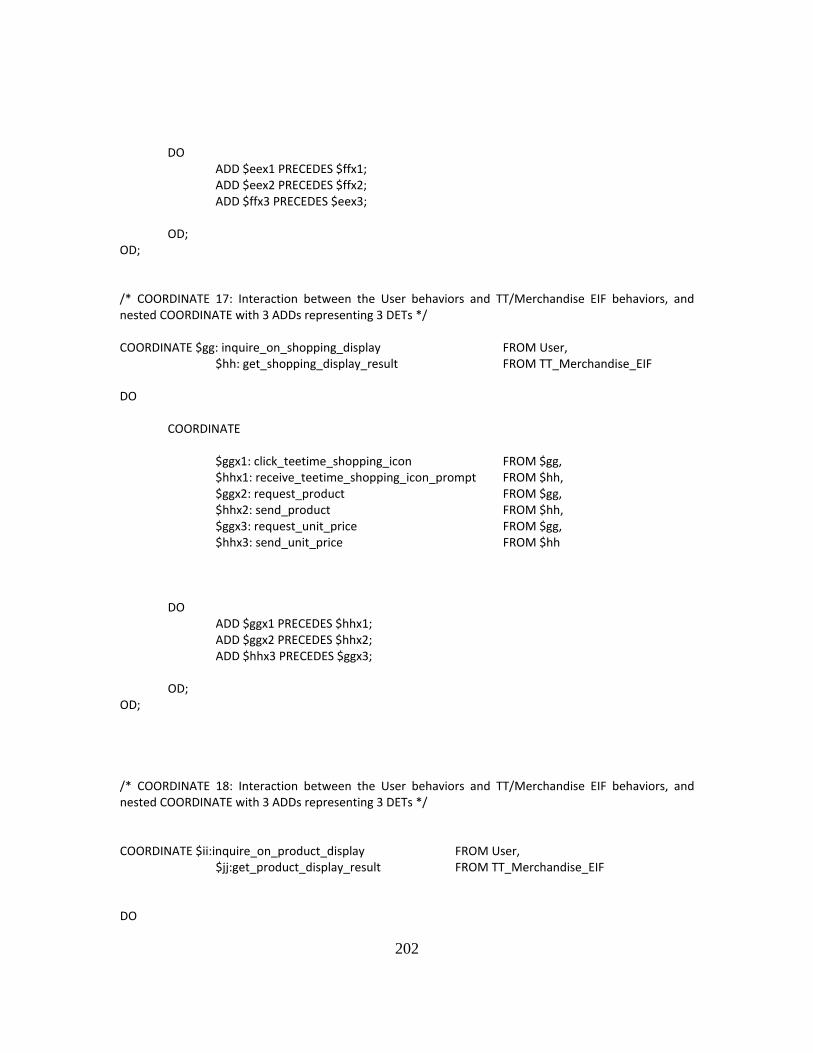
202
DO ADD $eex1 PRECEDES $ffx1; ADD $eex2 PRECEDES $ffx2; ADD $ffx3 PRECEDES $eex3; OD; OD; /* COORDINATE 17: Interaction between the User behaviors and TT/Merchandise EIF behaviors, and nested COORDINATE with 3 ADDs representing 3 DETs */ COORDINATE $gg: inquire_on_shopping_display FROM User, $hh: get_shopping_display_result FROM TT_Merchandise_EIF DO COORDINATE $ggx1: click_teetime_shopping_icon FROM $gg, $hhx1: receive_teetime_shopping_icon_prompt FROM $hh, $ggx2: request_product FROM $gg, $hhx2: send_product FROM $hh, $ggx3: request_unit_price FROM $gg, $hhx3: send_unit_price FROM $hh DO ADD $ggx1 PRECEDES $hhx1; ADD $ggx2 PRECEDES $hhx2; ADD $hhx3 PRECEDES $ggx3; OD; OD; /* COORDINATE 18: Interaction between the User behaviors and TT/Merchandise EIF behaviors, and nested COORDINATE with 3 ADDs representing 3 DETs */ COORDINATE $ii:inquire_on_product_display FROM User, $jj:get_product_display_result FROM TT_Merchandise_EIF DO
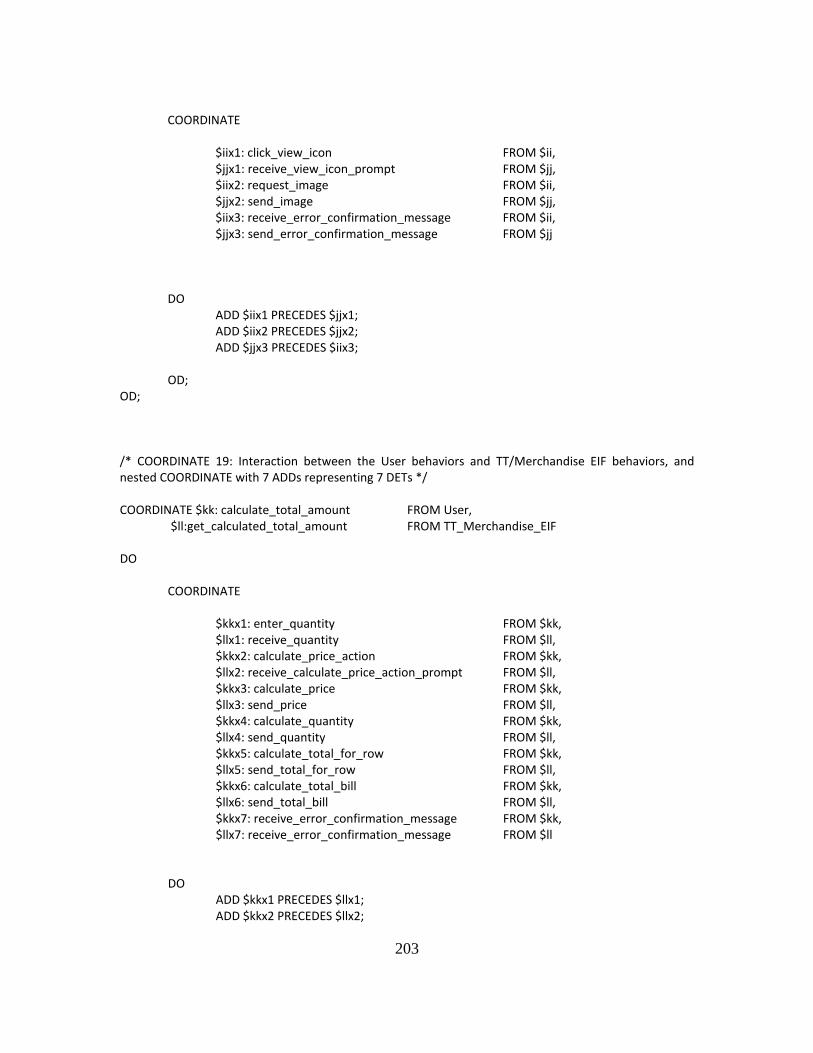
203
COORDINATE $iix1: click_view_icon FROM $ii, $jjx1: receive_view_icon_prompt FROM $jj, $iix2: request_image FROM $ii, $jjx2: send_image FROM $jj, $iix3: receive_error_confirmation_message FROM $ii, $jjx3: send_error_confirmation_message FROM $jj DO ADD $iix1 PRECEDES $jjx1; ADD $iix2 PRECEDES $jjx2; ADD $jjx3 PRECEDES $iix3; OD; OD; /* COORDINATE 19: Interaction between the User behaviors and TT/Merchandise EIF behaviors, and nested COORDINATE with 7 ADDs representing 7 DETs */ COORDINATE $kk: calculate_total_amount FROM User, $ll:get_calculated_total_amount FROM TT_Merchandise_EIF DO COORDINATE $kkx1: enter_quantity FROM $kk, $llx1: receive_quantity FROM $ll, $kkx2: calculate_price_action FROM $kk, $llx2: receive_calculate_price_action_prompt FROM $ll, $kkx3: calculate_price FROM $kk, $llx3: send_price FROM $ll, $kkx4: calculate_quantity FROM $kk, $llx4: send_quantity FROM $ll, $kkx5: calculate_total_for_row FROM $kk, $llx5: send_total_for_row FROM $ll, $kkx6: calculate_total_bill FROM $kk, $llx6: send_total_bill FROM $ll, $kkx7: receive_error_confirmation_message FROM $kk, $llx7: receive_error_confirmation_message FROM $ll DO ADD $kkx1 PRECEDES $llx1; ADD $kkx2 PRECEDES $llx2;
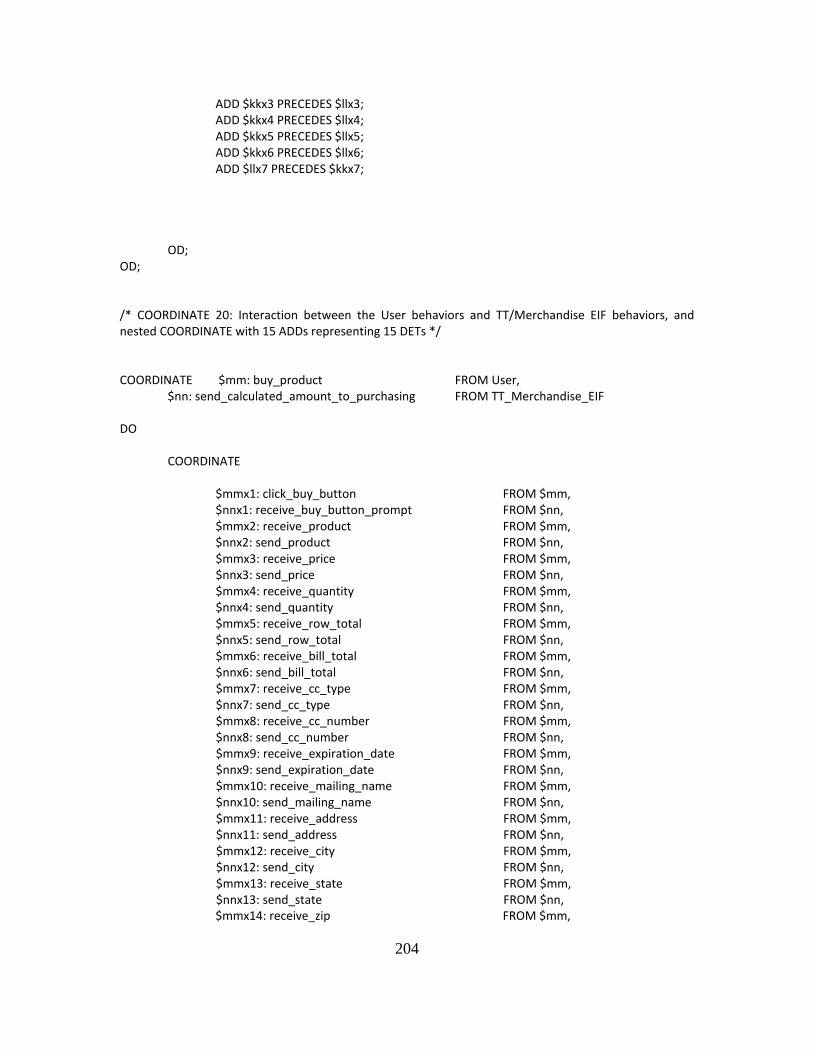
204
ADD $kkx3 PRECEDES $llx3; ADD $kkx4 PRECEDES $llx4; ADD $kkx5 PRECEDES $llx5; ADD $kkx6 PRECEDES $llx6; ADD $llx7 PRECEDES $kkx7; OD; OD; /* COORDINATE 20: Interaction between the User behaviors and TT/Merchandise EIF behaviors, and nested COORDINATE with 15 ADDs representing 15 DETs */ COORDINATE $mm: buy_product FROM User, $nn: send_calculated_amount_to_purchasing FROM TT_Merchandise_EIF DO COORDINATE $mmx1: click_buy_button FROM $mm, $nnx1: receive_buy_button_prompt FROM $nn, $mmx2: receive_product FROM $mm, $nnx2: send_product FROM $nn, $mmx3: receive_price FROM $mm, $nnx3: send_price FROM $nn, $mmx4: receive_quantity FROM $mm, $nnx4: send_quantity FROM $nn, $mmx5: receive_row_total FROM $mm, $nnx5: send_row_total FROM $nn, $mmx6: receive_bill_total FROM $mm, $nnx6: send_bill_total FROM $nn, $mmx7: receive_cc_type FROM $mm, $nnx7: send_cc_type FROM $nn, $mmx8: receive_cc_number FROM $mm, $nnx8: send_cc_number FROM $nn, $mmx9: receive_expiration_date FROM $mm, $nnx9: send_expiration_date FROM $nn, $mmx10: receive_mailing_name FROM $mm, $nnx10: send_mailing_name FROM $nn, $mmx11: receive_address FROM $mm, $nnx11: send_address FROM $nn, $mmx12: receive_city FROM $mm, $nnx12: send_city FROM $nn, $mmx13: receive_state FROM $mm, $nnx13: send_state FROM $nn, $mmx14: receive_zip FROM $mm,
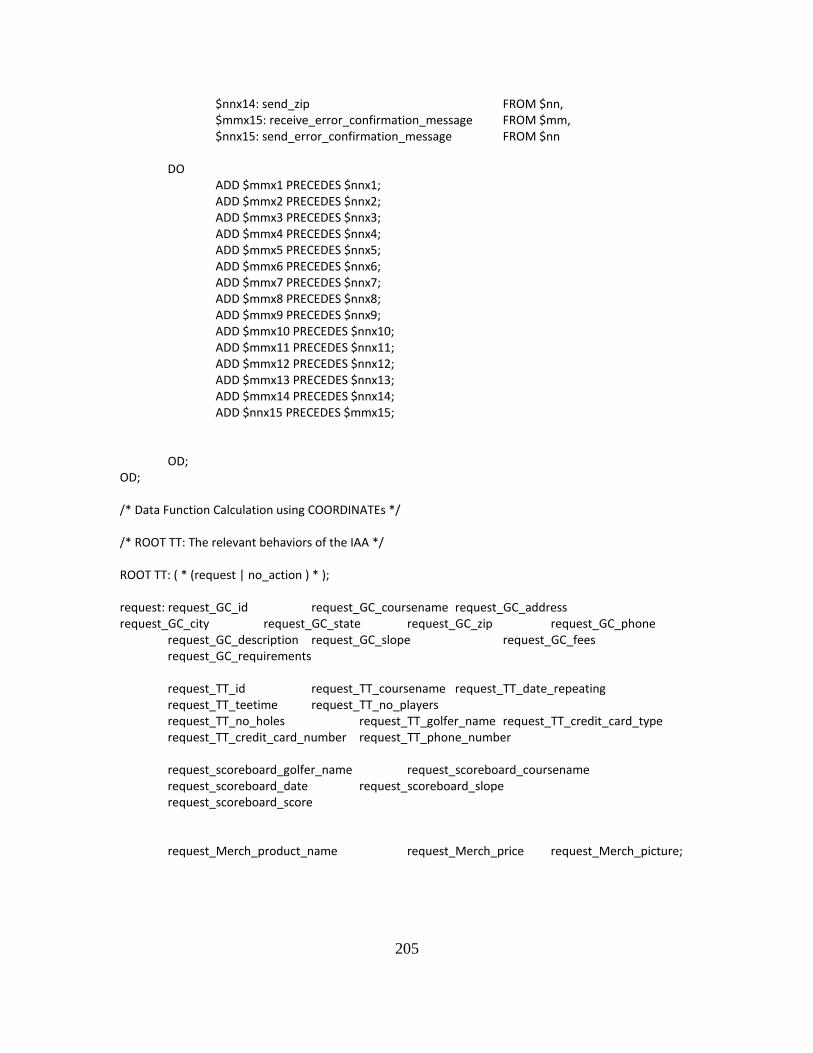
205
$nnx14: send_zip FROM $nn, $mmx15: receive_error_confirmation_message FROM $mm, $nnx15: send_error_confirmation_message FROM $nn DO ADD $mmx1 PRECEDES $nnx1; ADD $mmx2 PRECEDES $nnx2; ADD $mmx3 PRECEDES $nnx3; ADD $mmx4 PRECEDES $nnx4; ADD $mmx5 PRECEDES $nnx5; ADD $mmx6 PRECEDES $nnx6; ADD $mmx7 PRECEDES $nnx7; ADD $mmx8 PRECEDES $nnx8; ADD $mmx9 PRECEDES $nnx9; ADD $mmx10 PRECEDES $nnx10; ADD $mmx11 PRECEDES $nnx11; ADD $mmx12 PRECEDES $nnx12; ADD $mmx13 PRECEDES $nnx13; ADD $mmx14 PRECEDES $nnx14; ADD $nnx15 PRECEDES $mmx15; OD; OD; /* Data Function Calculation using COORDINATEs */ /* ROOT TT: The relevant behaviors of the IAA */ ROOT TT: ( * (request | no_action ) * ); request: request_GC_id request_GC_coursename request_GC_address request_GC_city request_GC_state request_GC_zip request_GC_phone request_GC_description request_GC_slope request_GC_fees request_GC_requirements request_TT_id request_TT_coursename request_TT_date_repeating request_TT_teetime request_TT_no_players request_TT_no_holes request_TT_golfer_name request_TT_credit_card_type request_TT_credit_card_number request_TT_phone_number request_scoreboard_golfer_name request_scoreboard_coursename request_scoreboard_date request_scoreboard_slope request_scoreboard_score request_Merch_product_name request_Merch_price request_Merch_picture;
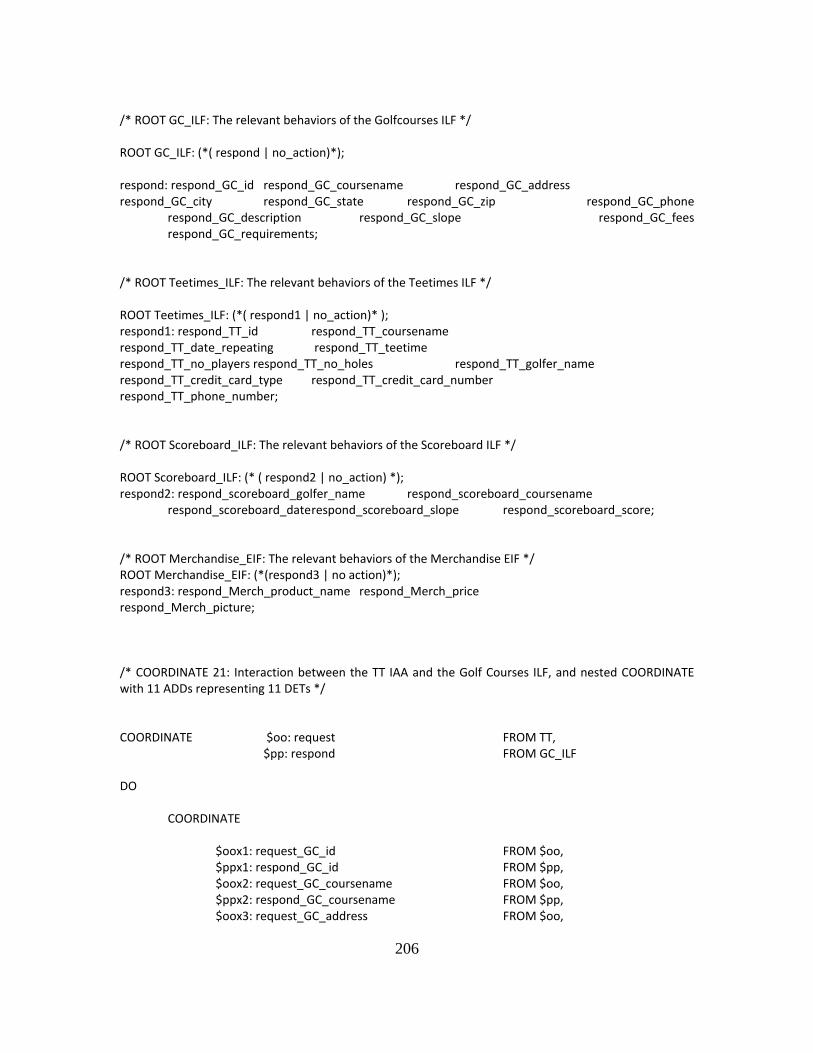
206
/* ROOT GC_ILF: The relevant behaviors of the Golfcourses ILF */ ROOT GC_ILF: (*( respond | no_action)*); respond: respond_GC_id respond_GC_coursename respond_GC_address respond_GC_city respond_GC_state respond_GC_zip respond_GC_phone respond_GC_description respond_GC_slope respond_GC_fees respond_GC_requirements; /* ROOT Teetimes_ILF: The relevant behaviors of the Teetimes ILF */ ROOT Teetimes_ILF: (*( respond1 | no_action)* ); respond1: respond_TT_id respond_TT_coursename respond_TT_date_repeating respond_TT_teetime respond_TT_no_players respond_TT_no_holes respond_TT_golfer_name respond_TT_credit_card_type respond_TT_credit_card_number respond_TT_phone_number; /* ROOT Scoreboard_ILF: The relevant behaviors of the Scoreboard ILF */ ROOT Scoreboard_ILF: (* ( respond2 | no_action) *); respond2: respond_scoreboard_golfer_name respond_scoreboard_coursename respond_scoreboard_date respond_scoreboard_slope respond_scoreboard_score; /* ROOT Merchandise_EIF: The relevant behaviors of the Merchandise EIF */ ROOT Merchandise_EIF: (*(respond3 | no action)*); respond3: respond_Merch_product_name respond_Merch_price respond_Merch_picture; /* COORDINATE 21: Interaction between the TT IAA and the Golf Courses ILF, and nested COORDINATE with 11 ADDs representing 11 DETs */ COORDINATE $oo: request FROM TT, $pp: respond FROM GC_ILF DO COORDINATE $oox1: request_GC_id FROM $oo, $ppx1: respond_GC_id FROM $pp, $oox2: request_GC_coursename FROM $oo, $ppx2: respond_GC_coursename FROM $pp, $oox3: request_GC_address FROM $oo,
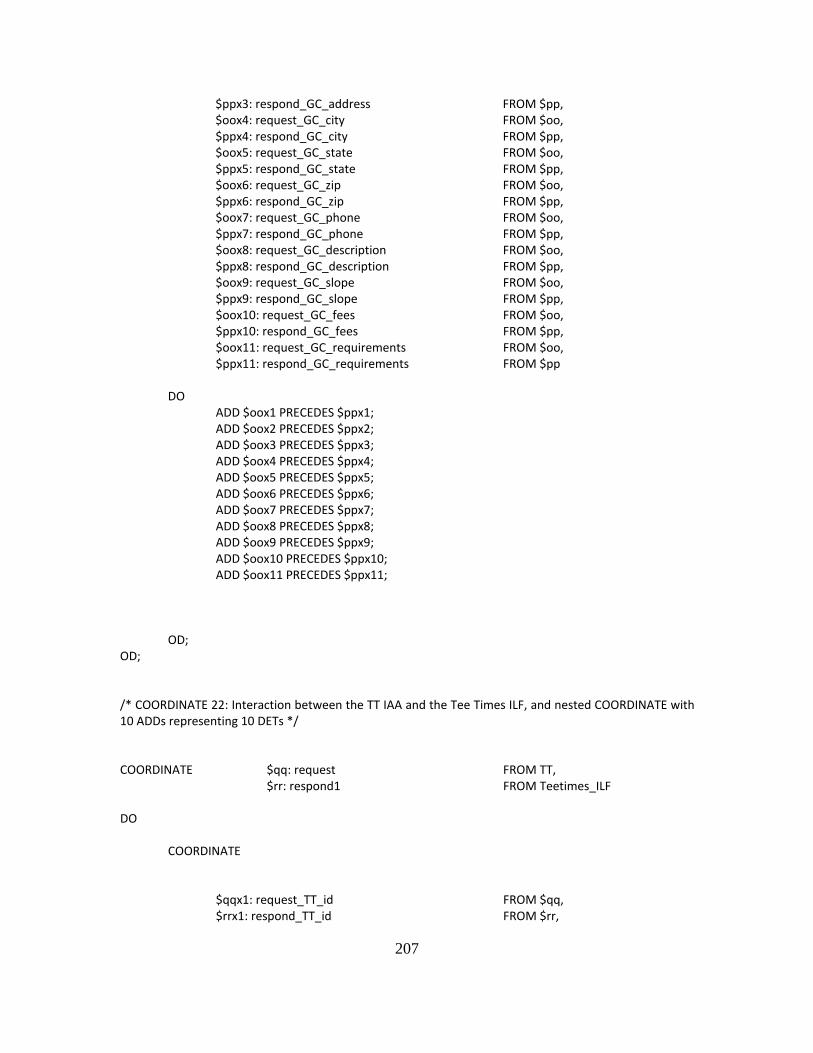
207
$ppx3: respond_GC_address FROM $pp, $oox4: request_GC_city FROM $oo, $ppx4: respond_GC_city FROM $pp, $oox5: request_GC_state FROM $oo, $ppx5: respond_GC_state FROM $pp, $oox6: request_GC_zip FROM $oo, $ppx6: respond_GC_zip FROM $pp, $oox7: request_GC_phone FROM $oo, $ppx7: respond_GC_phone FROM $pp, $oox8: request_GC_description FROM $oo, $ppx8: respond_GC_description FROM $pp, $oox9: request_GC_slope FROM $oo, $ppx9: respond_GC_slope FROM $pp, $oox10: request_GC_fees FROM $oo, $ppx10: respond_GC_fees FROM $pp, $oox11: request_GC_requirements FROM $oo, $ppx11: respond_GC_requirements FROM $pp DO ADD $oox1 PRECEDES $ppx1; ADD $oox2 PRECEDES $ppx2; ADD $oox3 PRECEDES $ppx3; ADD $oox4 PRECEDES $ppx4; ADD $oox5 PRECEDES $ppx5; ADD $oox6 PRECEDES $ppx6; ADD $oox7 PRECEDES $ppx7; ADD $oox8 PRECEDES $ppx8; ADD $oox9 PRECEDES $ppx9; ADD $oox10 PRECEDES $ppx10; ADD $oox11 PRECEDES $ppx11; OD; OD; /* COORDINATE 22: Interaction between the TT IAA and the Tee Times ILF, and nested COORDINATE with 10 ADDs representing 10 DETs */ COORDINATE $qq: request FROM TT, $rr: respond1 FROM Teetimes_ILF DO COORDINATE $qqx1: request_TT_id FROM $qq, $rrx1: respond_TT_id FROM $rr,
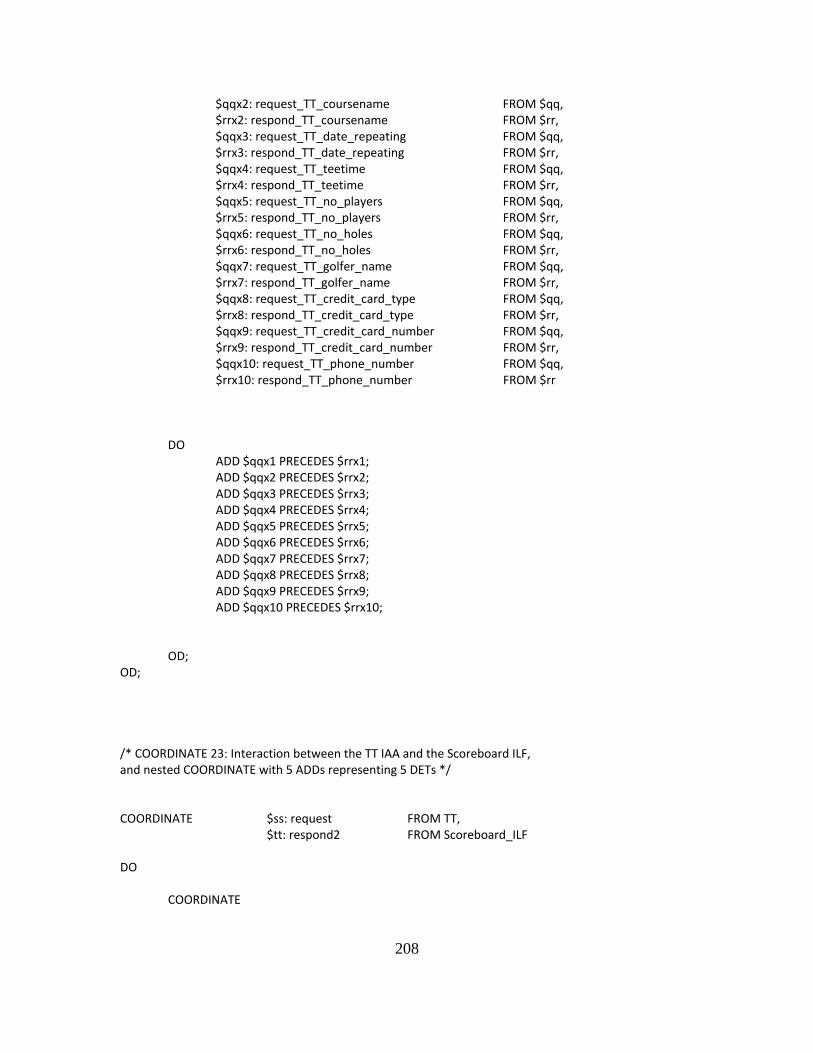
208
$qqx2: request_TT_coursename FROM $qq, $rrx2: respond_TT_coursename FROM $rr, $qqx3: request_TT_date_repeating FROM $qq, $rrx3: respond_TT_date_repeating FROM $rr, $qqx4: request_TT_teetime FROM $qq, $rrx4: respond_TT_teetime FROM $rr, $qqx5: request_TT_no_players FROM $qq, $rrx5: respond_TT_no_players FROM $rr, $qqx6: request_TT_no_holes FROM $qq, $rrx6: respond_TT_no_holes FROM $rr, $qqx7: request_TT_golfer_name FROM $qq, $rrx7: respond_TT_golfer_name FROM $rr, $qqx8: request_TT_credit_card_type FROM $qq, $rrx8: respond_TT_credit_card_type FROM $rr, $qqx9: request_TT_credit_card_number FROM $qq, $rrx9: respond_TT_credit_card_number FROM $rr, $qqx10: request_TT_phone_number FROM $qq, $rrx10: respond_TT_phone_number FROM $rr DO ADD $qqx1 PRECEDES $rrx1; ADD $qqx2 PRECEDES $rrx2; ADD $qqx3 PRECEDES $rrx3; ADD $qqx4 PRECEDES $rrx4; ADD $qqx5 PRECEDES $rrx5; ADD $qqx6 PRECEDES $rrx6; ADD $qqx7 PRECEDES $rrx7; ADD $qqx8 PRECEDES $rrx8; ADD $qqx9 PRECEDES $rrx9; ADD $qqx10 PRECEDES $rrx10; OD; OD; /* COORDINATE 23: Interaction between the TT IAA and the Scoreboard ILF, and nested COORDINATE with 5 ADDs representing 5 DETs */ COORDINATE $ss: request FROM TT, $tt: respond2 FROM Scoreboard_ILF DO COORDINATE
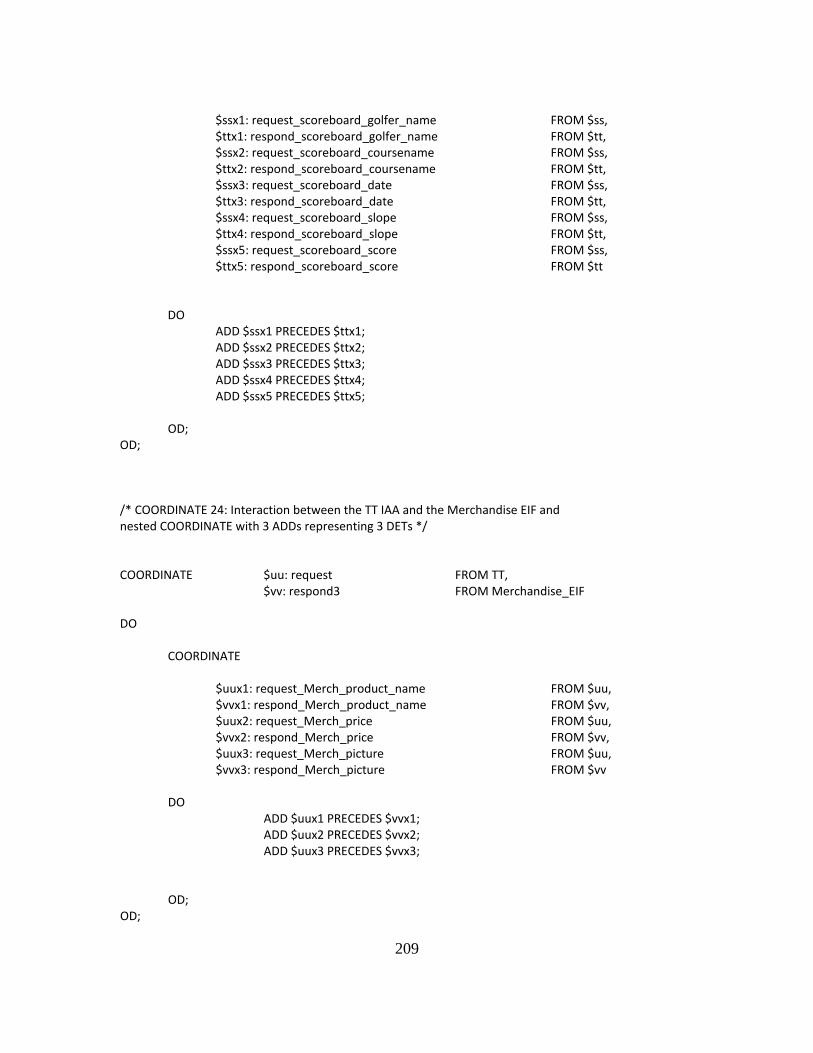
209
$ssx1: request_scoreboard_golfer_name FROM $ss, $ttx1: respond_scoreboard_golfer_name FROM $tt, $ssx2: request_scoreboard_coursename FROM $ss, $ttx2: respond_scoreboard_coursename FROM $tt, $ssx3: request_scoreboard_date FROM $ss, $ttx3: respond_scoreboard_date FROM $tt, $ssx4: request_scoreboard_slope FROM $ss, $ttx4: respond_scoreboard_slope FROM $tt, $ssx5: request_scoreboard_score FROM $ss, $ttx5: respond_scoreboard_score FROM $tt DO ADD $ssx1 PRECEDES $ttx1; ADD $ssx2 PRECEDES $ttx2; ADD $ssx3 PRECEDES $ttx3; ADD $ssx4 PRECEDES $ttx4; ADD $ssx5 PRECEDES $ttx5; OD; OD; /* COORDINATE 24: Interaction between the TT IAA and the Merchandise EIF and nested COORDINATE with 3 ADDs representing 3 DETs */ COORDINATE $uu: request FROM TT, $vv: respond3 FROM Merchandise_EIF DO COORDINATE $uux1: request_Merch_product_name FROM $uu, $vvx1: respond_Merch_product_name FROM $vv, $uux2: request_Merch_price FROM $uu, $vvx2: respond_Merch_price FROM $vv, $uux3: request_Merch_picture FROM $uu, $vvx3: respond_Merch_picture FROM $vv DO ADD $uux1 PRECEDES $vvx1; ADD $uux2 PRECEDES $vvx2; ADD $uux3 PRECEDES $vvx3; OD; OD;

210
THIS PAGE INTENTIONALLY LEFT BLANK
211
LIST OF REFERENCES
[1] N. Rozanski, and E. Woods, Software Systems Architecture, 2nd ed. Upper Saddle River, NJ: Addison Wesley, 2012.
[2] R. Hamming, The Art of Doing SCIENCE and Engineering: Learning to Learn, Boca Raton, FL: CRC Press, 1997.
[3] M. Auguston and C. Whitcomb, “Behavior models and composition for software and systems architecture,” presented at the 24th ICSSEA Conference, Paris, France, 2012.
[4] COCOMO II Model Definition Manual, Version 2000.3, USC Center for Software Engineering. [Online]. Available: http://csse.usc.edu/csse/affiliate/private/COCOMOII_2000_3/COCOMO_II_2000_3.html. Accessed July 21, 2016.
[5] COCOMO II. (n.d.). USC Center for Systems and Software Engineering (UCSSE). [Online]. Available: http://csse.usc.edu/csse/research/COCOMOII/cocomo_main.htm. Accessed July 21, 2016.
[6] NPS Center for Educational Design, Development, and Distribution (CED3), Monterey CA (2016), Firebird Analyzer 2.0. [Online]. Available: http://firebird.nps.edu/. Accessed Aug. 3, 2016.
[7] Rivera Group. (2016). Eagle6. [Online]. Available: http://www.riverainc.com/eagle6.php. Accessed Aug. 3, 2016.
[8] MIT Software Design Group, Cambridge, MA. (2016). Alloy Analyzer 4.2. [Online]. Available: http://alloy.mit.edu/alloy/download.html. Accessed Aug. 3, 2016.
[9] Function Point Counting Practices Manual, Release 4.3.1, International Function Point User Group (IFPUG), Princeton Junction, NJ, 2010.
[10] I. Sommerville, Software Engineering, 6th ed. Boston, MA: Addison-Wesley Longman Publishing Co., Inc., 2001
[11] B. Boehm, J. Lane, S. Koolmanojwong, and R. Turner. The Incremental Commitment Spiral Model, Principles and Practices for Successful Systems and Software, Table 14-1 Estimation Method Comparison, 1st ed., Upper Saddle River: NJ Addison Wesley, 2014, pp. 225.
212
[12] COCOMO II Model Definition Manual v. 2.1. (1995–2000). USC Center for Software Engineering, p. 6. [Online] Available: http://csse.usc.edu/csse/research/COCOMOII/cocomo2000.0/CII_modelman2000.0.pdf Accessed . Accessed Aug 27, 2016.
[13] Princeton Junction. (n.d.). International Function Point Users Group [Online]. Available: http://www.ifpug.org/about-ifpug/Introduction/. Accessed Aug. 3, 2016.
[14] D. Garmus, J. Russac, and R. Edwards, Certified Function Point Specialist Examination Guide, 1st ed. Boca Raton, FL: CRC Press, 2010.
[15] D. Longstreet. (n.d.). Function points analysis training course. [Online]. Available: www.SoftwareMetrics.Com. Accessed Aug. 3, 2016.
[16] R.G. Mathew, D. E. Middletown. (2014). Progressive function point analysis, advanced estimation techniques for IT projects. [Online]. Available: https://sourceforge.net/projects/functionpoints/. Accessed: Aug. 3, 2016.
[17] R. Heller. (n.d.). An introduction to function point analysis.” Q/P Management Group, Inc. [Online]. Available: http://www.qpmg.com/fp-intro.htm. Accessed Aug. 4, 2016.
[18] C.F. Kemerer, “Reliability of function points measurement, a field experiment,” ACM Communications, vol. 36, no. 2, pp. 85–97, Feb. 1993.
[19] G.C. Low, and D.R. Jeffery, “Function points in the estimation and evaluation of the software process,” IEEE Transactions on Software Engineering, vol.16, no. 64–71, Jan. 1990.
[20] P. Fraternali, M. Tisi, and A. Bongio. (2006). Automating function point analysis with model driven development. Proceedings of CASCON 2006. [Online]. Available: http://citeseerx.ist.psu.edu/viewdoc/summary;jsessionid=115E733630A4E79E3FF1D73481AECE51?doi=10.1.1.105.1517. Accessed June 2015, 2016.
[21] M. Aguiar, International Function Point Users Group Introduction to Function Points. (2004). International Function Point User Group. [Onlin]. Available: http://www.ifpug.org/Conference%20Proceedings/IFPUG-2004/IFPUG2004-04-Aguiar-introduction-to-function-point-analysis.pdf. Accessed Aug. 21, 2016.
[22] R. Selby, Software Engineering, Barry W. Boehm’s Lifetime Contributions to Software Development, Management, and Research, 1st ed. Hoboken NJ: John Wiley and Sons, 2007.
[23] S.Pfleeger, and J. Atlee, Software Engineering Theory and Practice, 3rd ed. Upper Saddle River, NJ: Pearson Prentice Hall, 2006.
213
[24] Rechtin, E., Systems Architecting, Creating and Building Complex Systems. Englewood Cliffs, NJ: Prentice Hall, 1991.
[25] Department of Defense Architecture Framework (DODAF), Version 2.02, U.S. Dept. of Defense, Washington, DC, 2010, [Online], Available: http://dodcio.defense.gov/Portals/0/Documents/DODAF/DoDAF_v2-02_web.pdf. Accessed Aug. 27, 2016.
[26] M. Conway (1968). How do committees invent? Datamation Magazine, April pp. 28–31. [Online]. Available: http://www.melconway.com/Home/Committees_Paper.html . Accessed: Aug. 27, 2016.
[27] W. Vaneman and R. Jaskot , “A criteria-based framework for establishing system of systems governance,” in Proceedings of the 7th Annual International IEEE Systems Conference, Orlando, FL, 2013, pp. 491-496.
[28] M. W. Maier, E. Rechtin, The Art of Systems Architecting. Boca Raton, FL: CRC Press, p.415.
[29] R. Taylor, N. Medvidovic, and E. Dashofy, Software Architectures, Foundations, Theory, and Practice. Hoboken, NJ: John Wiley & Sons, 2010.
[30] L. Bass, P.Clements, and R. Kazman, Software Engineering in Practice, 2nd ed. Boston, MA: Addison Wesley, 2003, p.21.
[31] OMG Unified Modeling Language (UML), version 2.5. (2015). Object Management Group, City, Stat. [Online]. Available: http://www.omg.org/spec/UML/2.5/PDF/, Accessed Aug. 5, 2016.
[32] M. Auguston and C. Whitcomb, “System architecture specification based on behavior models,” in Proceedings of the 15th International Command and Control Research and Technology Symposium (ICCRTS), Santa Monica, CA, 2010, Paper ID 053, pp. 01–20.
[33] M. Auguston, Monterey Phoenix System and Software Architecture and Workflow Modeling Language Manual, v.2, Naval Postgraduate School, Monterey, CA, 2016. [Online]. Available: https://wiki.nps.edu/display/MP/Monterey+Phoenix+Home. Acessed Aug. 24, 2016.
[34] M. Auguston, “Software architecture built from behavior models,” ACM SIGSOFT, vol. 34, no. 5, pp. 1–15, Sep. 2009.
[35] E. Seidewitz, “What models mean,” IEEE Software, vol. 20, no.5, pp. 26–32, Sep. 2003.
214
[36] B. Selic, “The pragmatics of model-driven development,” IEEE Software, vol. 20, no.5, pp. 19–25, Sep. 2003.
[37] P. Kruchten, “Architectural blueprints - the ‘4+1’ view model of software architecture,” IEEE Software, vol. 12, no. 6, pp. 42–50, Nov. 1995.
[38] C. Tinelli, “Propositional logic” class notes for Formal Methods in Software Engineering, Dept. of CS, University of Iowa, Spring 2010. [Online]. Available: http://homepage.cs.uiowa.edu/~tinelli/classes/181/Spring10/Notes/02-prop-logic.pdf
[39] M. Collins, “Formal methods” class notes for Dependable Embedded Systems, Dept. of Electrical and Computer Engineering, Pittsburg, PA, Spring 1998. [Online]. Available: https://users.ece.cmu.edu/~koopman/des_s99/formal_methods/ Accessed: May 15, 2016.
[40] D. Jackson, Software Abstractions: Logic, Language, and Analysis, 1st ed. Cambridge, MA: The MIT Press, 2006, p. 50.
[41] A. Hall, “Seven myths of formal methods,” IEEE Software, vol. 7, no. 5, pp. 11–19, Sep. 1990. [Online]. Available: http://dl.acm.org/citation.cfm?id=624978. Accessed: Apr. 20, 2016.
[42] S. Sastry. (1998). Formal vs. semi-formal design methods and tools. [Online]. Available: http://robotics.eecs.berkeley.edu/~sastry/darpa.sec/prop/node4.html. Accessed Aug. 27, 2016.
[43] R. Wieringa, “A survey of structured and object-oriented software, specification methods and techniques.” ACM Computing Surveys, vol. 30, no. 4, pp. 459–527, Dec. 1998. [Online]. Available: http://dl.acm.org.libproxy.nps.edu/citation.cfm?id=299919&CFID=652319511&CFTOKEN=62061440. http://dl.acm.org/citation.cfm?doid=299917.299919 Accessed May 20, 2016.
[44] J. Wing, “A specifier’s introduction to formal methods,” IEEE Computer, vol. 23, no. 9, pp. 8–23, Sep. 1990. [Online]. Available: http://dl.acm.org.libproxy.nps.edu/citation.cfm?id=102816&CFID=652435018&CFTOKEN=61786300
[45] S. Easterbrook, R.R. Lutz, R. Covington, J.C. Kelly, Y. Ampo, and D. Hamilton, “Experiences using lightweight formal methods for requirements modeling,” IEEE Transactions on Software Engineering, vol. 24, no. 1, pp.4–14, Jan. 1998. [Online]. Available: http://www.cs.toronto.edu/~sme/papers/1998/NASA-IVV-97-015.pdf
215
[46] S. Agerholm, and P.G. Larsen, “A lightweight approach to formal methods,” Proceedings of the International Workshop on Current Trends in Applied Formal Method: Applied Formal Methods, pp.168–183, 1998. [Online]. Available: http://citeseerx.ist.psu.edu/viewdoc/download;jsessionid=25CE43CD1B31C680D61A66F744BB0DFE?doi=10.1.1.52.9515&rep=rep1&type=pdf
[47] N. Sharrock, and K. Giammarco, Monterey, CA, Monterey Phoenix Home, May 2016. [Online] Available: https://wiki.nps.edu/display/MP/Monterey+Phoenix+Home;jsessionid=64EE920DEE277FBCF7018919578C12D8Accessed Aug. 27, 2016.
[48] K. Giammarco, and M. Auguston, Monterey, CA, Monterey Phoenix Event Grammar, May 2015 [Online]. Available: https://wiki.nps.edu/display/MP/Event+Grammar Accessed Aug. 20, 2016.
[49] M.Auguston, B.Michael, and M.Shing, Environment behavior models for automation of testing and assessment of system safety. Information and Software Technology, vol. 48, no.10, pp. 971–980. Oct. 2006. [Online]. Available: http://www.sciencedirect.com/science/article/pii/S0950584906000413
[50] M. Auguston, “Behavior models for software architecture,” Naval Postgraduate School, Monterey, CA, Rep. NPS-CS-14-003, Nov. 2014. Available: http://calhoun.nps.edu/handle/10945/43851. Accessed Aug. 27, 2016.
[51] K.Giammarco, “Formal methods for architecture model assessment in systems engineering,” in Proceedings of the 8th Conference on Systems Engineering Research, Hoboken, NJ, 2010, pp. 522–531. [Online]. Available: https://calhoun.nps.edu/bitstream/handle/10945/14783/p522-giammarco.pdf;sequence=1
[52] B. Boehm, (1984). Verifying and validating software requirements and design specifications. [Online]. Available: http://citeseerx.ist.psu.edu/viewdoc/download;jsessionid=1FD28E7F832A0B5543B60DDC5DB09DBA?doi=10.1.1.365.8494&rep=rep1&type=pdf. Accessed Aug. 27, 2016
[53] F. Brooks, The Mythical Man Month: Essays on Software Engineering Anniversary Edition, 1st ed. Reading, MA: Addison Wesley, 1995.
[54] TutorialsPoint Simply Learning. (n.d.). [Online]. Available: http://www.tutorialspoint.com/software_testing_dictionary/test_case.htm.Accessed: Aug. 27, 2016.
[55] R. Madachy, USC Center for Systems and Software Engineering (UCSSE). COCOMO II Subject Matter Expert (SME), personal communication, May 25, 2016
216
[56] Q/P Management Group Inc, “It’s Tee Time function point counting example,” source information protected by copyright, 2010. Stoneham, MA 02180. Complete counting example available from Q/P Management Group on request http://www.qpmg.com/
[57] COCOMO II MP Extension. (2015). USC Center for Systems and Software Engineering (UCSSE). [Online]. Available: http://csse.usc.edu/tools/MP_COCOMO/ Accessed Aug. 5, 2016.
[58] E.Wolff, “Flexible software architectures,” Leanpub, Feb. 5, 2016. [Online]. Available: http://microservices-book.com/. Accessed Aug. 20, 2016.
[59] M. Farah-Stapleton, M. Auguston, R. Madachy, and K. Giammarco, “Executable behavioral modeling of system- and software-architecture specifications to inform resourcing decisions,” 31st International Forum on COCOMO and Systems/Software Cost Modeling, Los Angeles, CA, Oct. 2016. (Abstract Submitted) http://csse.usc.edu/new/events/event/31st-international-forum-on-cocomo-and-systemssoftware-cost-modeling
[60] M. Farah-Stapleton, M. Auguston, and K. Giammarco, “Executable behavioral modelingof system and software architecture specifications to inform resourcing decisions,” Complex Adaptive Systems (CAS) Conference, Los Angeles, CA, Nov. 2016. (Paper Accepted) http://complexsystems.mst.edu/
[61] M. Farah-Stapleton, M. Auguston, K. Giammarco, “Behavioral Modeling of Software Intensive System Architectures” at the Complex Adaptive Systems (CAS) Conference, Baltimore, MD, 2013, pp. 204-209.
[62] K. Giammarco, M. Auguston, C. Baldwin, J. Crump, and M. Farah-Stapleton, “Controlling design complexity with the Monterey Phoenix approach,” Complex Adaptive Systems (CAS) Conference, Philadelphia, PA, 2014, vol. 36, pp. 204–209.
[63] M. Farah-Stapleton, Resource analysis based on system architecture behavior, technical presentation, 30th International Forum on COCOMO and Systems/Software Cost Modeling, November 2015. Arlington, VA http://www.google.com/url?sa=t&rct=j&q=&esrc=s&source=web&cd=3&ved=0ahUKEwiXuuGLzoXMAhWHuBoKHTXbBTsQFggsMAI&url=http%3A%2F%2Fcsse.usc.edu%2Fnew%2Fwp-content%2Fuploads%2F2015%2F11%2FCOCOMO_Farah-Stapleton__November-2015-DRAFT9_MFS.pptx&usg=AFQjCNEcSGfu3opnpKfOYG9LAfAfChKthA&sig2=y3COAQP5B4QsGwi4kvvXyg
217
[64] M. Farah-Stapleton, “Behavioral modeling of software system architectures and verification & validation,” FAA 10th Annual Verification & Validation Summit, Sep. 2015, Atlantic City, NJ, https://www.faa.gov/about/office_org/headquarters_offices/ang/offices/tc/library/v&vsummit/v&vsummit2015/presentations/V%20and%20V%20and%20Behavorial%20Modeling_Monica%20Farah-Stapleton.pdf
[65] M. Farah-Stapleton, and K. Giammarco, “Behavioral modeling of system architectures,” International Council on Systems Engineering (INCOSE) System of Systems Working Group Webinar series, Jan 2014,Arlington, VA.
[66] M. Farah-Stapleton, and K. Giammarco, “Behavioral modeling of software intensive system of system architectures and emergence,” International Forum, Office of the Secretary of Defense (OSD), Systems Engineering, TTCP TP4 SoS Workstream, May 2014, Arlington, VA.
[67] M. Farah-Stapleton, “Executable behaviorial architetcture modeling to inform resourcing,” 2015 Systems Engineering Research Forum (SERC) Doctoral Students Forum & SERC Sponsor Research Review Poster Session,Washington, DC, Dec 2015, http://www.sercuarc.org/research/annual-serc-research-review/sdsf-2015/
[68] M. Farah-Stapleton, “Behavioral modeling of software intensive system architectures using Monterey Phoenix,” CRUSER Newsletter, Dec. 2013. Naval Postgraduate School. [Online] Available: http://my.nps.edu/web/cruser/-/2013_12-cruser-news?inheritRedirect=true
[69] N. Fenton, and J. Bieman, Software Metrics, A Rigorous and Practical Approach 3rd ed. Boca Raton, FL: CRC, 2015.
[70] International Function Point User Group (IFPUG), Software Non-functional Assessment Process (SNAP) Assessment Practices Manual, Release 2.1, Part 1, Chapter 1, p. 10, Princeton Junction, NJ, 2013.
218
THIS PAGE INTENTIONALLY LEFT BLANK

219
INITIAL DISTRIBUTION LIST
1. Defense Technical Information Center Ft. Belvoir, Virginia 2. Dudley Knox Library Naval Postgraduate School Monterey, California