Embed Size (px)
Citation preview

EXCITING TIMES FOR EVs
Dr. Kara Kockelman, UT Austin’s Transport Engineering

Should we be anxious about EV Range?
q GPS units provided 360 days (!) of daily VKT data on 445 household vehicles across Seattle between 2004 & 2006.
q Average vehicle-distance per day is 41 km, with standard deviation of 20 km (across all vehicles & days).
q Multi-day data reflect Americans’ great variability in day-to-daypersonal-vehicle use.
q Household weights used to reflect entire Seattle population.

Analysis Framework
Household
Single-vehicle household
Switch to a BEV (Case 1)
What % Days can VKT be served if just
charging at night?
Switch to a PHEV (Case 2)
What % Miles are electrified?
Multi-vehicle household
Switch a vehicle to a BEV
Which Vehicle to switch?
Swap w/vehicle that travels less on
average (Case 3)
What %Days canVKT be served if
charge only at night?
Swap w/veh. that travels less on any given day (Case 4)
What %Days can VKT be served if
charge only at night?
Switch a vehicle to a PHEV
Which Vehicle to switch?
Swap w/veh. that travels more on average (Case 5)
What % HH Miles are
electrified?
Swap w/veh. that travels more on any given day (Case 6)
What % HH Miles are
electrified?

%Days BEV Range Not Exceeded: 2+ veh HHs
0%
10%
20%
30%
40%
50%
60%
70%
80%
90%
100%
30 40 50 60 70 80 90 100 110 120 130
% o
f Hou
seho
lds
All Electric Range (AER), in miles
90% of days 95% of days 99% of days
BEV Replacing the Lower Overall-VMT Vehicle (Case 3)
Nissan LEAF (95 miles AER)

%VMT Electrified: Multi-vehicle HHs
0%
10%
20%
30%
40%
50%
60%
70%
80%
90%
0 10 20 30 40 50 60 70
% o
f Hou
seho
ld V
MT
Elec
trifi
ed
All Electric Range (AER), in miles
PHEV assigned day-to-day Highest average-VMT vehicle replaced by PHEV
Average Shares of Household Miles Electrified (with Std. Deviations shown) using PHEVs in Multiple-vehicle Seattle Households
Prius PHEV
Chevy Volt

Key Findings
q Typical PEV designs show great potential for adoption & use, with minimal household adjustment.
q If owners are willing to charge >2 times/day on heavy-use days, or use another form of transport a few days a year, even limited-range BEVs appear feasible for significant shares of households.
q When assigned thoughtfully to household drivers (based on planned travel distances each day), even limited-AERangePHEVs offer significant distance electrification – even for multi-vehicle households!

But will a PEV be Pricey?
§ Fuel Prices: Varied here, providing insight into NPV for regions with different energy prices.
§ Battery Replacement: $0 cost under 8-year, 160,000-km warranty, else replace at various $/kWh values in Year 8.
§ Electric-power cost of US average $0.12/kWh.§ 241,000-km vehicle lifetime (U.S. average) over 15
years.
!"# = %&'()*
+, )* -./012 − -./0451(1 + 9)&

Volt vs. Cruze over 15 yr/150k miles

¨ EV emissions costs 45-80% lower (per VKT) around TX.¨ DFW offers lowest-cost EV emissions (gen + exposure).¨ Vehicle emissions regs. had lowered ICE emissions faster
than those for electric power generation, but fracking for natural gas, plus solar advances, will take over.
¨ In an interconnected grid, costs & benefits are shared across the region (state or province, for example), but are not necessarily equally distributed.
¨ Reliance on coal, especially eastern(high-sulfur) coal does not deliver EV emissions-cost benefits.
How “Clean” are EVs?

Where is Best for Charging Stations?
¨ We started with Seattle application.¨ Mixed integer program to locate 20
stations across 218 zones, objective = minimize average walk distance of those parking cars.
¨ 95% able to access within 1 mi, with 1.5 mi max walk distance (reducing range anxiety).

US Application for Long-distance Trips
¨ Constrained maximization of #LD trips completed by car across US (196 zones).
¨ Just 100 stations + 200 mi range serve 93% (!) of US inter-city car trips.
¨ Adding range more beneficial than adding stations.
30.87%
41.76%
50.33%
58.03%
64.66%
44.42%
59.43%
70.13%
78.75%
85.33%
62.64%
79.53%
89.77%96.48%
99.31%
76.09%
93.15%98.79%
100.00%
83.75%
97.39%86.17%
98.63% 100.00% 100.00%
30%
40%
50%
60%
70%
80%
90%
100%
50 100 150 200 250
Y =
% o
f Lon
g-di
stan
ce tr
ips
serv
ed
X = # charging stations across US
60 miles100 miles150 miles200 miles250 miles300 miles
Optimal CS Locations for 150 mi range + 100-station solution

Energy + Travel Survey Findings
¨ Policy of adaptation (to climate change) more often preferred by workers & households owning many vehicles.
¨ Caps on household energy use preferred to taxes.¨ Long-term behavioral changes are difficult to implement.¨ Most agree that climate change is a concern, but are
unwilling to change their own behaviors.
¨ Higher income & education levels associated with greater (stated) concern about one’s environmental impacts.
¨ Information on gas costs & environmental costs is very powerful in motivating vehicle (stated) choices.

US Fleet Evolution: Survey Results
¨ 42% Americans may pay $3,000 more to buy HEV version of a conventional vehicle.
¨ 36% express interest in buying a PHEV at $6,000 more than comparable ICE.
¨ 56% have power access when parked at home.
¨ Just 29% support a feebate policy, vs. 63% of Austinites.
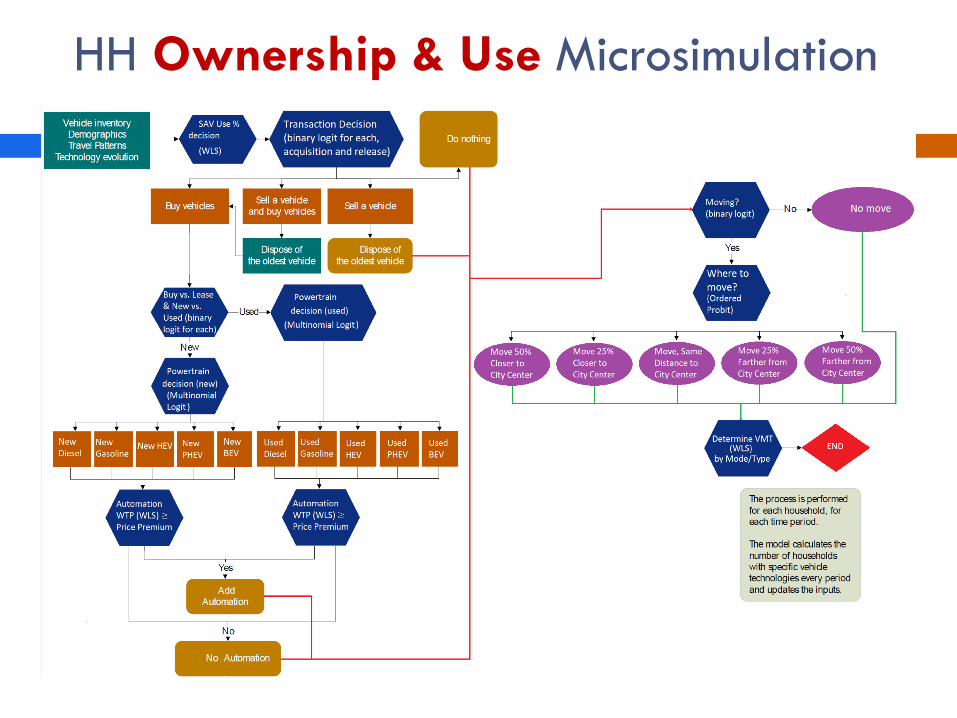
HH Ownership & Use Microsimulation
Scenarios Simulated
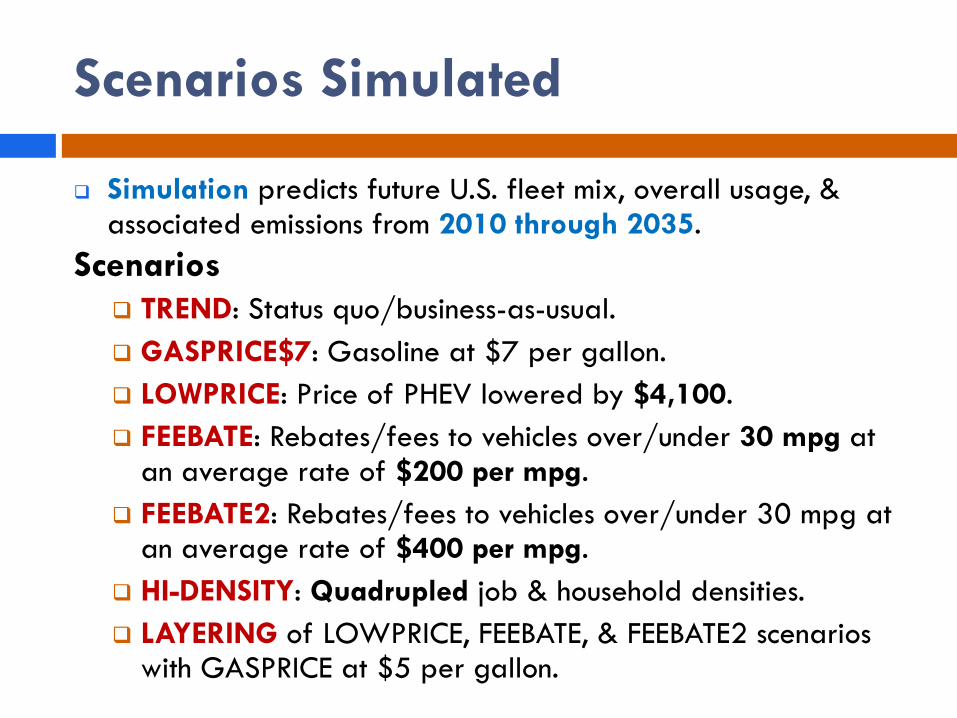
q Simulation predicts future U.S. fleet mix, overall usage, & associated emissions from 2010 through 2035.
Scenariosq TREND: Status quo/business-as-usual.q GASPRICE$7: Gasoline at $7 per gallon.q LOWPRICE: Price of PHEV lowered by $4,100.q FEEBATE: Rebates/fees to vehicles over/under 30 mpg at
an average rate of $200 per mpg.q FEEBATE2: Rebates/fees to vehicles over/under 30 mpg at
an average rate of $400 per mpg.q HI-DENSITY: Quadrupled job & household densities.q LAYERING of LOWPRICE, FEEBATE, & FEEBATE2 scenarios
with GASPRICE at $5 per gallon.

Results: US Fleet Simulation
q $7/gallon gas prices had greater impact on vehicle ownership & VKT than any other policy examined (including feebates).
q Changes in fleet mix, VKT, & emissions across scenarios are far less than needed to address environmental issues.
q Widespread use EVs may emerge with strategic & pronounced marketing, technological advances(lower prices + automated vehicles), as well as other incentives (e.g., HOV lane & fast-charge access) & greater awareness of energy & climate issues.

2017 Survey on EVs & AVs
• n = 1,426 US adults (screened to remove insincere responses & weighted to match U.S. population).
• Anticipate future-year vehicle & travel choices
• Focus on electric, autonomous, & shared vehicles– CAVs, SAVs, SAEVs, + DRS
(dynamic ride-sharing)
• Questions tailored for regression model variables for fleet evolution simulation.

AV Ownership Shares by US Households Over Time, across 7 Scenarios

Will AVs Make “Driving” too Easy?
• We expect +30% MORE VKT in US due to AVs (!)
• AV sensors & computers require power, prompting electrification of the drivetrain (so AVs are likely to be at least Hybrid EVs … phew!).
• Shared Autonomous Electric Vehicles (SAEVs) can eliminate range anxiety & charging delays for travelers…
… but shared HEVs are easier & less expensive to implement (45 ct/mi vs. 60 ct/mi).
• BEV technology will be KEY to offsetting AVs’ added energy use & emissions. Only BEV adoption (or strong road tolls?) can offset (or moderate) rising VKT, enabling 15% to 65% overall energy savings.
• Cleaner feedstocks (to power plants) also key to reducing transport’s emissions & GHGs (even beyond the 15 to 65% energy savings shared, battery-only AVs can provide).

My EV Partners…
Moby KhanSashank MustiBinny Paul David TuttleYantao HuangBen LoebYawei HeDonna ChenKen PerrineMatt Reiter
Thank youfor your kind attention!
Questions & Suggestions?
Papers available at www.caee.utexas.edu/prof/kockelman