Embed Size (px)
Citation preview
Zoned: - C-2HR - Intermediate Commercial District, High Rise - R-5 - Multiple Residence District in Transit Overlay District. Current Zoning Permits 24 Stories, Possible Zoning Variance
for 34 Stories
Downtown Phoenix Residential Redevelopment Site
1.69 Acres, 73,930 Square Feet
Seller Financing Available
Owner Will Consider a Trade
Located One Block from the Light Rail Station
Within 1/2 Mile from I-10 with Access to SR-51, Loop 202, and I-17 and 10 Minutes to Phoenix International Airport
Area Attractions Include: Burton Barr Library, Margaret T. Hance Park, Herberger Theater, Chase Field, US Airways Center, Phoe-nix Symphony Hall, Orpheum Theater, Heard Museum, Dodge Theater, ASU Downtown Campus, U of A Medical School, The Arizona Center, Arizona Science Center, and Heritage Square
EXCITING DOWNTOWN PHOENIX
MIXED USE RESIDENTIAL DEVELOPMENT
NORTHEAST CORNER OF 1ST STREET AND PORTLAND STREET, PHOENIX, ARIZONA 85004
Central A
venue Herberger Herberger
TheaterTheater
INVESTMENT
PAUL BLUM, CCIM
480-682-3170
Experience + Creativity = Results
This information is given without representation or warranty. It should be verified
independently and is subject to change, correction, prior sale, lease or withdrawal
without notice. Each Office Independently Owned and Operated
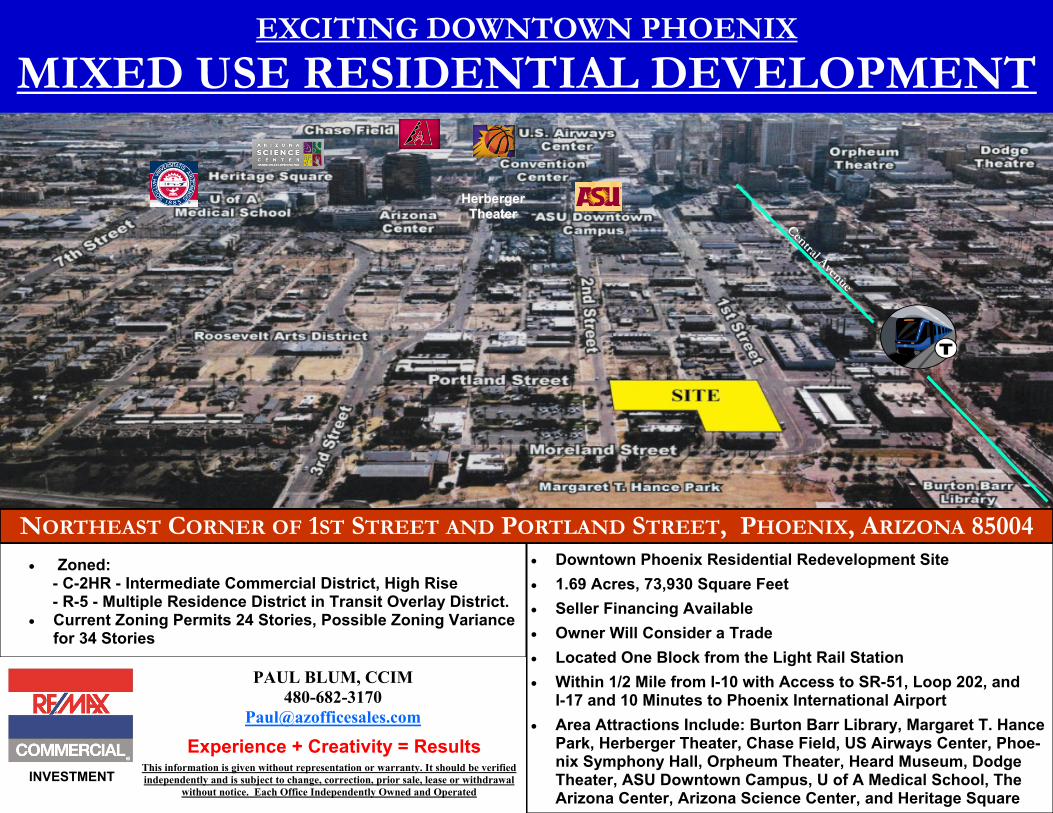
EXCITING DOWNTOWN PHOENIX
MIXED USE RESIDENTIAL DEVELOPMENT
Central A
venue
Herberger Theater
INVESTMENT
PAUL BLUM, CCIM
480-682-3170
Experience + Creativity = Results
This information is given without representation or warranty. It should be verified
independently and is subject to change, correction, prior sale, lease or withdrawal
without notice. Each Office Independently Owned and Operated
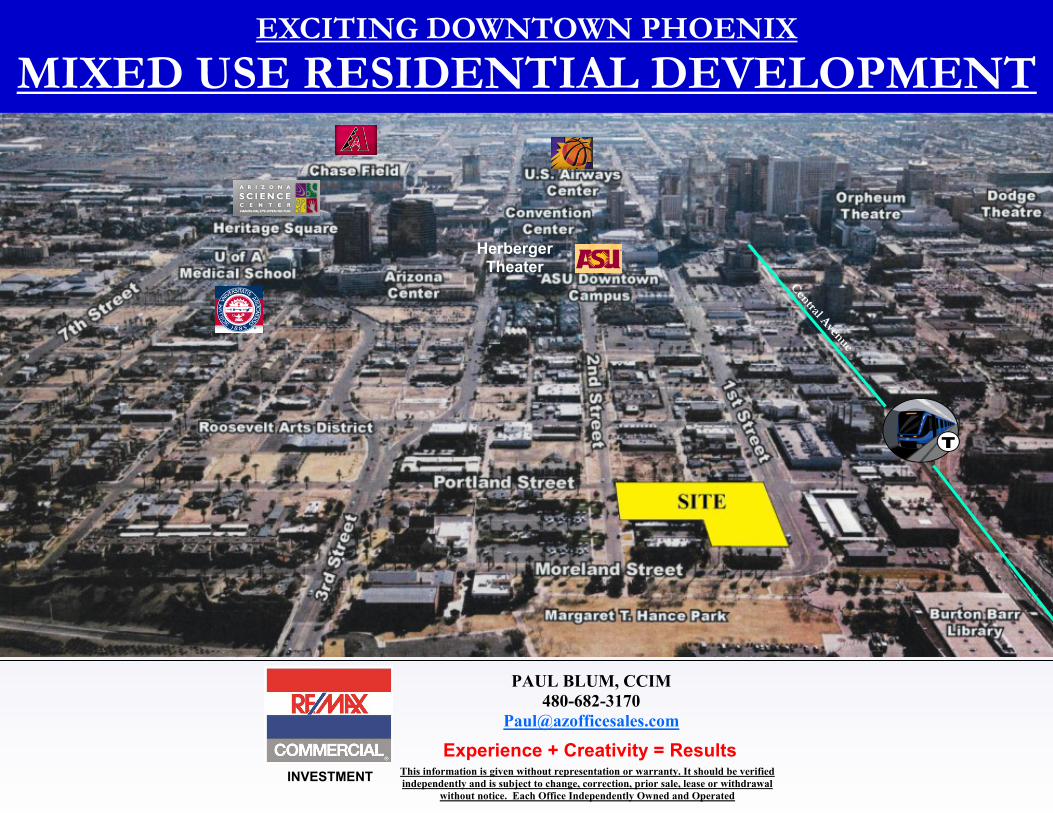
COUNTY PARCELS MAP (LOTS 1-6, 13-16)
PORTLAND STREET
MORELAND STREET
1S
T S
TR
EE
T
INVESTMENT
PAUL BLUM, CCIM
480-682-3170
Experience + Creativity = Results
This information is given without representation or warranty. It
should be verified independently and is subject to change, correc-
tion, prior sale, lease or withdrawal without notice. Each Office
Independently Owned and Operated
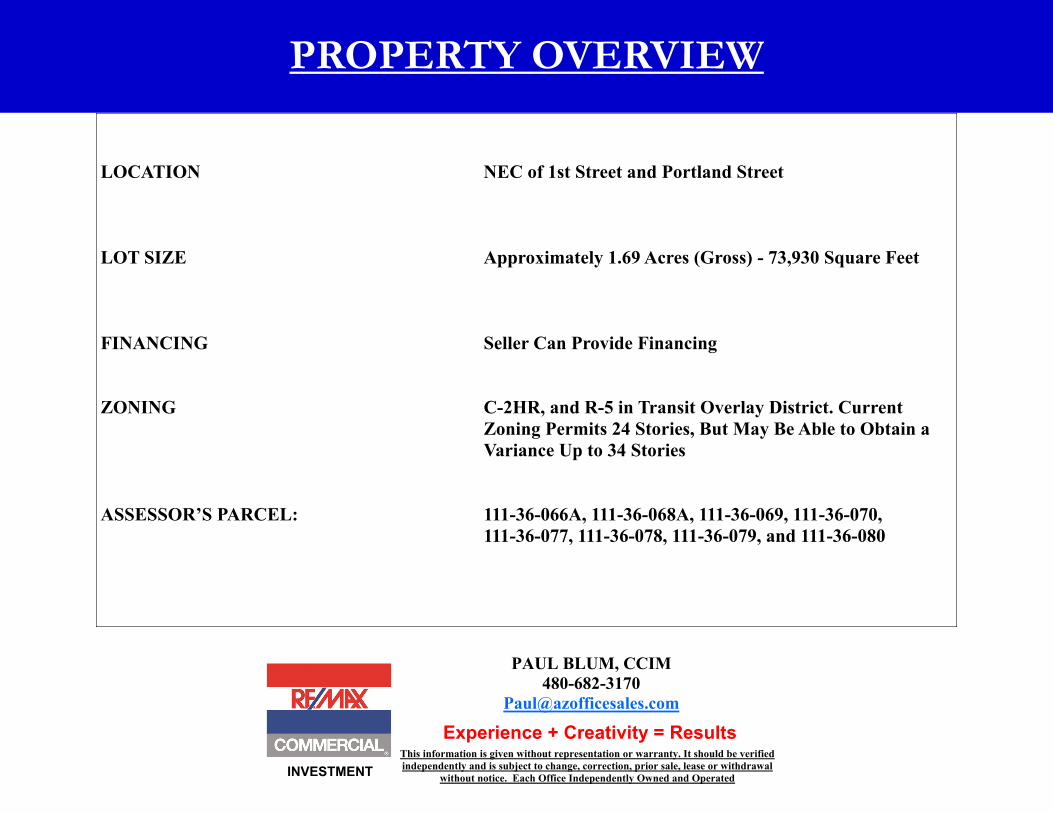
PROPERTY OVERVIEW
LOCATION NEC of 1st Street and Portland Street
LOT SIZE Approximately 1.69 Acres (Gross) - 73,930 Square Feet
FINANCING Seller Can Provide Financing
ZONING C-2HR, and R-5 in Transit Overlay District. Current
Zoning Permits 24 Stories, But May Be Able to Obtain a
Variance Up to 34 Stories
ASSESSOR’S PARCEL: 111-36-066A, 111-36-068A, 111-36-069, 111-36-070,
111-36-077, 111-36-078, 111-36-079, and 111-36-080
INVESTMENT
PAUL BLUM, CCIM
480-682-3170
Experience + Creativity = Results
This information is given without representation or warranty. It should be verified
independently and is subject to change, correction, prior sale, lease or withdrawal
without notice. Each Office Independently Owned and Operated
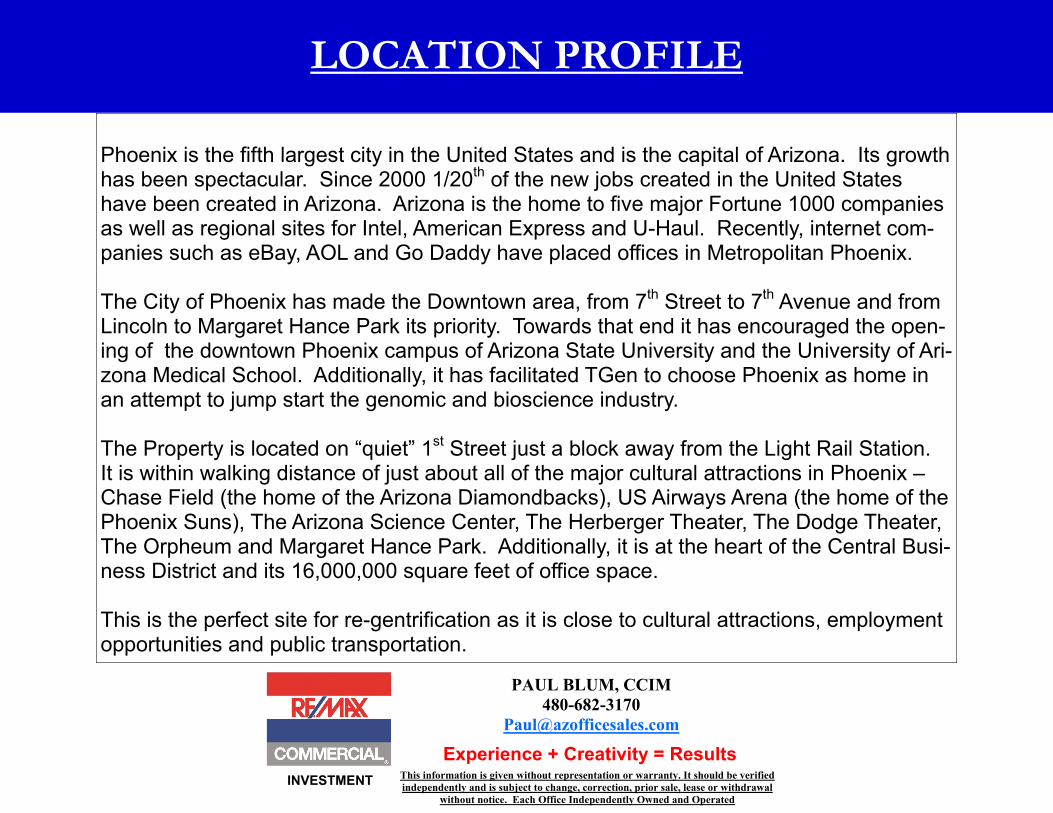
LOCATION PROFILE
Phoenix is the fifth largest city in the United States and is the capital of Arizona. Its growth has been spectacular. Since 2000 1/20
th of the new jobs created in the United States
have been created in Arizona. Arizona is the home to five major Fortune 1000 companies as well as regional sites for Intel, American Express and U-Haul. Recently, internet com-panies such as eBay, AOL and Go Daddy have placed offices in Metropolitan Phoenix. The City of Phoenix has made the Downtown area, from 7
th Street to 7
th Avenue and from
Lincoln to Margaret Hance Park its priority. Towards that end it has encouraged the open-ing of the downtown Phoenix campus of Arizona State University and the University of Ari-zona Medical School. Additionally, it has facilitated TGen to choose Phoenix as home in an attempt to jump start the genomic and bioscience industry. The Property is located on “quiet” 1
st Street just a block away from the Light Rail Station.
It is within walking distance of just about all of the major cultural attractions in Phoenix – Chase Field (the home of the Arizona Diamondbacks), US Airways Arena (the home of the Phoenix Suns), The Arizona Science Center, The Herberger Theater, The Dodge Theater, The Orpheum and Margaret Hance Park. Additionally, it is at the heart of the Central Busi-ness District and its 16,000,000 square feet of office space. This is the perfect site for re-gentrification as it is close to cultural attractions, employment opportunities and public transportation.
INVESTMENT
PAUL BLUM, CCIM
480-682-3170
Experience + Creativity = Results
This information is given without representation or warranty. It should be verified
independently and is subject to change, correction, prior sale, lease or withdrawal
without notice. Each Office Independently Owned and Operated
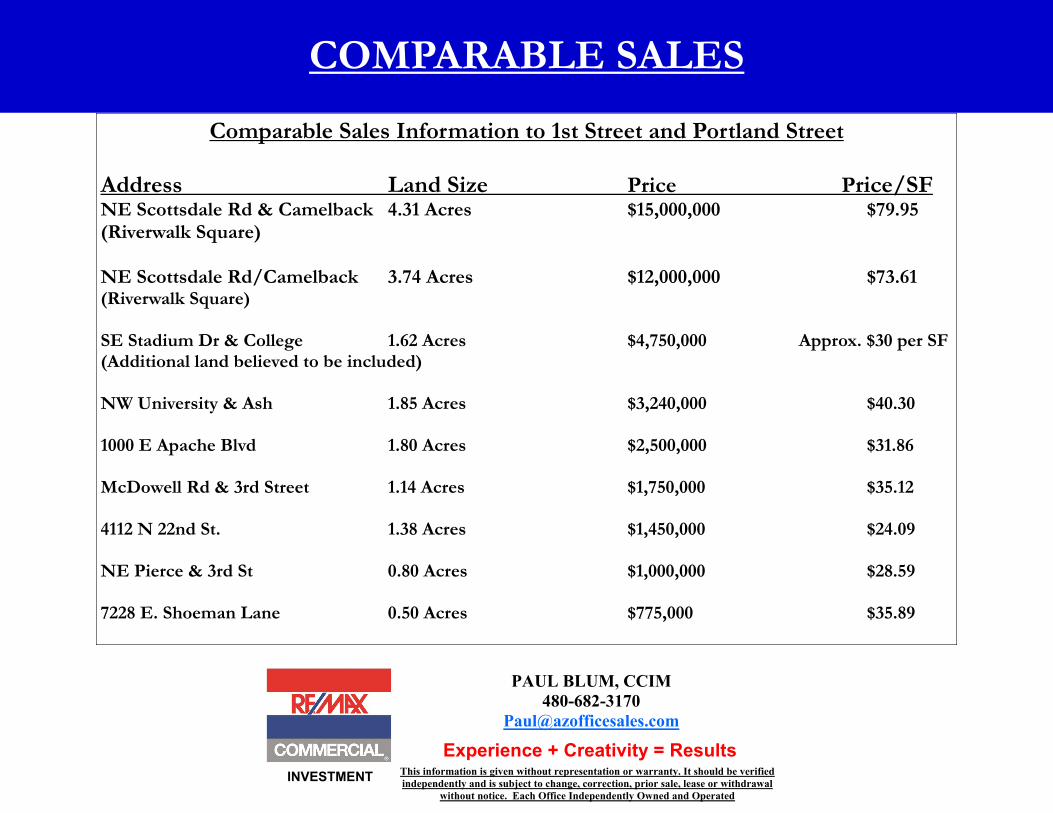
COMPARABLE SALES
Comparable Sales Information to 1st Street and Portland Street
Address Land Size Price Price/SF NE Scottsdale Rd & Camelback 4.31 Acres $15,000,000 $79.95 (Riverwalk Square) NE Scottsdale Rd/Camelback 3.74 Acres $12,000,000 $73.61 (Riverwalk Square) SE Stadium Dr & College 1.62 Acres $4,750,000 Approx. $30 per SF (Additional land believed to be included) NW University & Ash 1.85 Acres $3,240,000 $40.30 1000 E Apache Blvd 1.80 Acres $2,500,000 $31.86 McDowell Rd & 3rd Street 1.14 Acres $1,750,000 $35.12 4112 N 22nd St. 1.38 Acres $1,450,000 $24.09 NE Pierce & 3rd St 0.80 Acres $1,000,000 $28.59 7228 E. Shoeman Lane 0.50 Acres $775,000 $35.89
INVESTMENT
PAUL BLUM, CCIM
480-682-3170
Experience + Creativity = Results
This information is given without representation or warranty. It should be verified
independently and is subject to change, correction, prior sale, lease or withdrawal
without notice. Each Office Independently Owned and Operated
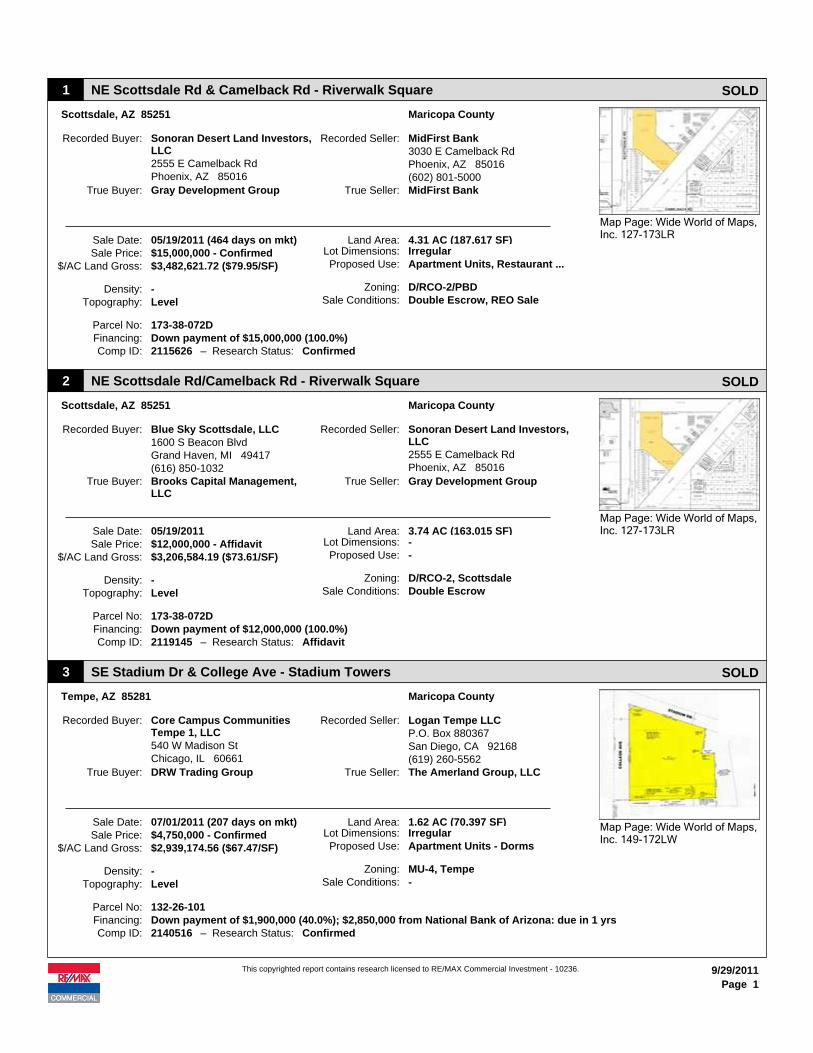
1 NE Scottsdale Rd & Camelback Rd - Riverwalk Square SOLD
Scottsdale, AZ 85251 Maricopa County
Sonoran Desert Land Investors, LLC
Recorded Buyer: Recorded Seller: MidFirst Bank
2555 E Camelback RdPhoenix, AZ 85016
True Buyer: Gray Development Group
3030 E Camelback RdPhoenix, AZ 85016(602) 801-5000MidFirst BankTrue Seller:
Sale Date:
– Research Status:
Density:
Sale Price:
Topography:
$3,482,621.72 ($79.95/SF)$15,000,000 - Confirmed05/19/2011 (464 days on mkt) Land Area:
Zoning:Sale Conditions:
Lot Dimensions:Proposed Use:
-Level
Parcel No:Financing:
173-38-072DDown payment of $15,000,000 (100.0%)
Confirmed
4.31 AC (187,617 SF)IrregularApartment Units, Restaurant ...
D/RCO-2/PBDDouble Escrow, REO Sale
$/AC Land Gross:
2115626Comp ID:
Map Page: Wide World of Maps, Inc. 127-173LR
2 NE Scottsdale Rd/Camelback Rd - Riverwalk Square SOLD
Scottsdale, AZ 85251 Maricopa County
Blue Sky Scottsdale, LLCRecorded Buyer: Recorded Seller: Sonoran Desert Land Investors, LLC1600 S Beacon Blvd
Grand Haven, MI 49417(616) 850-1032
True Buyer: Brooks Capital Management, LLC
2555 E Camelback RdPhoenix, AZ 85016
Gray Development GroupTrue Seller:
Sale Date:
– Research Status:
Density:
Sale Price:
Topography:
$3,206,584.19 ($73.61/SF)$12,000,000 - Affidavit05/19/2011 Land Area:
Zoning:Sale Conditions:
Lot Dimensions:Proposed Use:
-Level
Parcel No:Financing:
173-38-072DDown payment of $12,000,000 (100.0%)
Affidavit
3.74 AC (163,015 SF)--
D/RCO-2, ScottsdaleDouble Escrow
$/AC Land Gross:
2119145Comp ID:
Map Page: Wide World of Maps, Inc. 127-173LR
3 SE Stadium Dr & College Ave - Stadium Towers SOLD
Tempe, AZ 85281 Maricopa County
Core Campus Communities Tempe 1, LLC
Recorded Buyer: Recorded Seller: Logan Tempe LLC
540 W Madison StChicago, IL 60661
True Buyer: DRW Trading Group
P.O. Box 880367San Diego, CA 92168(619) 260-5562The Amerland Group, LLCTrue Seller:
Sale Date:
– Research Status:
Density:
Sale Price:
Topography:
$2,939,174.56 ($67.47/SF)$4,750,000 - Confirmed07/01/2011 (207 days on mkt) Land Area:
Zoning:Sale Conditions:
Lot Dimensions:Proposed Use:
-Level
Parcel No:Financing:
132-26-101Down payment of $1,900,000 (40.0%); $2,850,000 from National Bank of Arizona: due in 1 yrs
Confirmed
1.62 AC (70,397 SF)IrregularApartment Units - Dorms
MU-4, Tempe-
$/AC Land Gross:
2140516Comp ID:
Map Page: Wide World of Maps, Inc. 149-172LW
This copyrighted report contains research licensed to RE/MAX Commercial Investment - 10236. 9/29/2011
Page 1
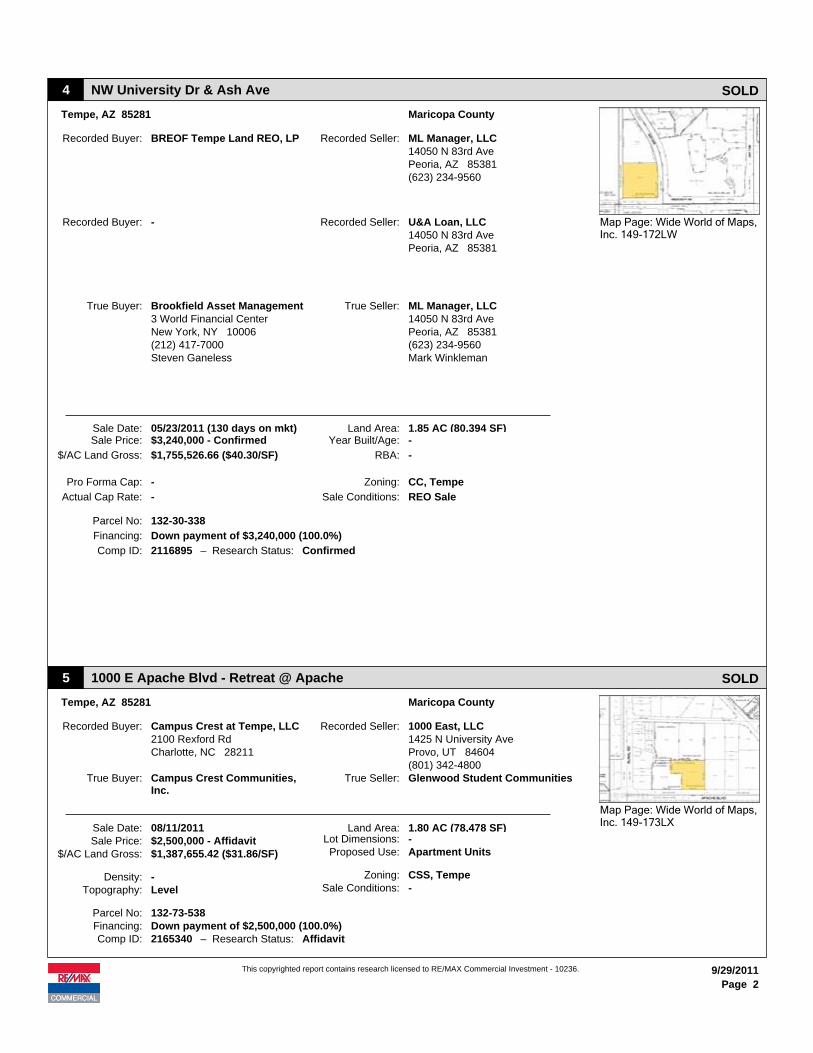
4 NW University Dr & Ash Ave SOLD
Tempe, AZ 85281 Maricopa County
BREOF Tempe Land REO, LPRecorded Buyer: Recorded Seller: ML Manager, LLC
True Buyer: Brookfield Asset Management
14050 N 83rd AvePeoria, AZ 85381(623) 234-9560
ML Manager, LLCTrue Seller:
Sale Date:
– Research Status:
Pro Forma Cap:
$/AC Land Gross:
Sale Price:
Actual Cap Rate:
$1,755,526.66 ($40.30/SF)
$3,240,000 - Confirmed05/23/2011 (130 days on mkt) Land Area:
Zoning:
Sale Conditions:
Year Built/Age:
RBA:
-
-
Parcel No:
Financing:
132-30-338
Down payment of $3,240,000 (100.0%)
Confirmed
1.85 AC (80,394 SF)-
-
CC, Tempe
REO Sale
-Recorded Buyer: Recorded Seller: U&A Loan, LLC14050 N 83rd AvePeoria, AZ 85381
3 World Financial CenterNew York, NY 10006
Steven Ganeless(212) 417-7000
14050 N 83rd AvePeoria, AZ 85381
Mark Winkleman(623) 234-9560
Comp ID: 2116895
Map Page: Wide World of Maps, Inc. 149-172LW
5 1000 E Apache Blvd - Retreat @ Apache SOLD
Tempe, AZ 85281 Maricopa County
Campus Crest at Tempe, LLCRecorded Buyer: Recorded Seller: 1000 East, LLC2100 Rexford RdCharlotte, NC 28211
True Buyer: Campus Crest Communities, Inc.
1425 N University AveProvo, UT 84604(801) 342-4800Glenwood Student CommunitiesTrue Seller:
Sale Date:
– Research Status:
Density:
Sale Price:
Topography:
$1,387,655.42 ($31.86/SF)$2,500,000 - Affidavit08/11/2011 Land Area:
Zoning:Sale Conditions:
Lot Dimensions:Proposed Use:
-Level
Parcel No:Financing:
132-73-538Down payment of $2,500,000 (100.0%)
Affidavit
1.80 AC (78,478 SF)-Apartment Units
CSS, Tempe-
$/AC Land Gross:
2165340Comp ID:
Map Page: Wide World of Maps, Inc. 149-173LX
This copyrighted report contains research licensed to RE/MAX Commercial Investment - 10236. 9/29/2011
Page 2
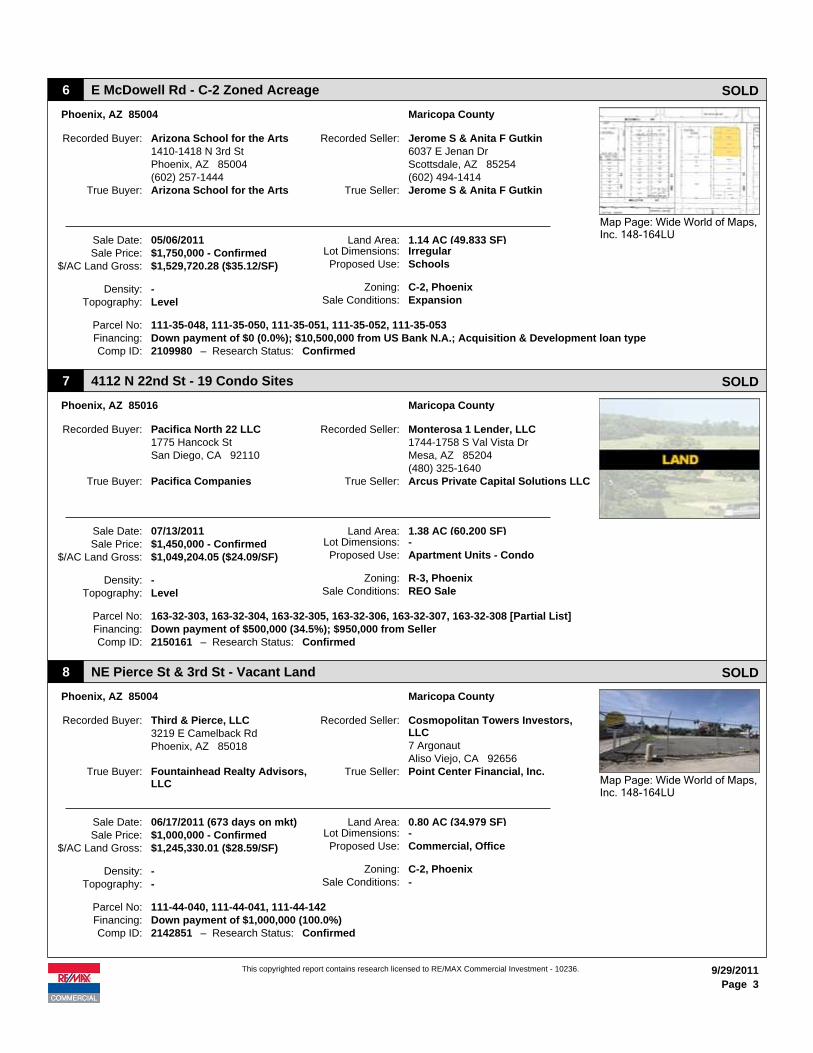
6 E McDowell Rd - C-2 Zoned Acreage SOLD
Phoenix, AZ 85004 Maricopa County
Arizona School for the ArtsRecorded Buyer: Recorded Seller: Jerome S & Anita F Gutkin1410-1418 N 3rd StPhoenix, AZ 85004(602) 257-1444
True Buyer: Arizona School for the Arts
6037 E Jenan DrScottsdale, AZ 85254(602) 494-1414Jerome S & Anita F GutkinTrue Seller:
Sale Date:
– Research Status:
Density:
Sale Price:
Topography:
$1,529,720.28 ($35.12/SF)$1,750,000 - Confirmed05/06/2011 Land Area:
Zoning:Sale Conditions:
Lot Dimensions:Proposed Use:
-Level
Parcel No:Financing:
111-35-048, 111-35-050, 111-35-051, 111-35-052, 111-35-053Down payment of $0 (0.0%); $10,500,000 from US Bank N.A.; Acquisition & Development loan type
Confirmed
1.14 AC (49,833 SF)IrregularSchools
C-2, PhoenixExpansion
$/AC Land Gross:
2109980Comp ID:
Map Page: Wide World of Maps, Inc. 148-164LU
7 4112 N 22nd St - 19 Condo Sites SOLD
Phoenix, AZ 85016 Maricopa County
Pacifica North 22 LLCRecorded Buyer: Recorded Seller: Monterosa 1 Lender, LLC1775 Hancock StSan Diego, CA 92110
True Buyer: Pacifica Companies
1744-1758 S Val Vista DrMesa, AZ 85204(480) 325-1640Arcus Private Capital Solutions LLCTrue Seller:
Sale Date:
– Research Status:
Density:
Sale Price:
Topography:
$1,049,204.05 ($24.09/SF)$1,450,000 - Confirmed07/13/2011 Land Area:
Zoning:Sale Conditions:
Lot Dimensions:Proposed Use:
-Level
Parcel No:Financing:
163-32-303, 163-32-304, 163-32-305, 163-32-306, 163-32-307, 163-32-308 [Partial List]Down payment of $500,000 (34.5%); $950,000 from Seller
Confirmed
1.38 AC (60,200 SF)-Apartment Units - Condo
R-3, PhoenixREO Sale
$/AC Land Gross:
2150161Comp ID:
8 NE Pierce St & 3rd St - Vacant Land SOLD
Phoenix, AZ 85004 Maricopa County
Third & Pierce, LLCRecorded Buyer: Recorded Seller: Cosmopolitan Towers Investors, LLC3219 E Camelback Rd
Phoenix, AZ 85018
True Buyer: Fountainhead Realty Advisors, LLC
7 ArgonautAliso Viejo, CA 92656Point Center Financial, Inc.True Seller:
Sale Date:
– Research Status:
Density:
Sale Price:
Topography:
$1,245,330.01 ($28.59/SF)$1,000,000 - Confirmed06/17/2011 (673 days on mkt) Land Area:
Zoning:Sale Conditions:
Lot Dimensions:Proposed Use:
--
Parcel No:Financing:
111-44-040, 111-44-041, 111-44-142Down payment of $1,000,000 (100.0%)
Confirmed
0.80 AC (34,979 SF)-Commercial, Office
C-2, Phoenix-
$/AC Land Gross:
2142851Comp ID:
Map Page: Wide World of Maps, Inc. 148-164LU
This copyrighted report contains research licensed to RE/MAX Commercial Investment - 10236. 9/29/2011
Page 3
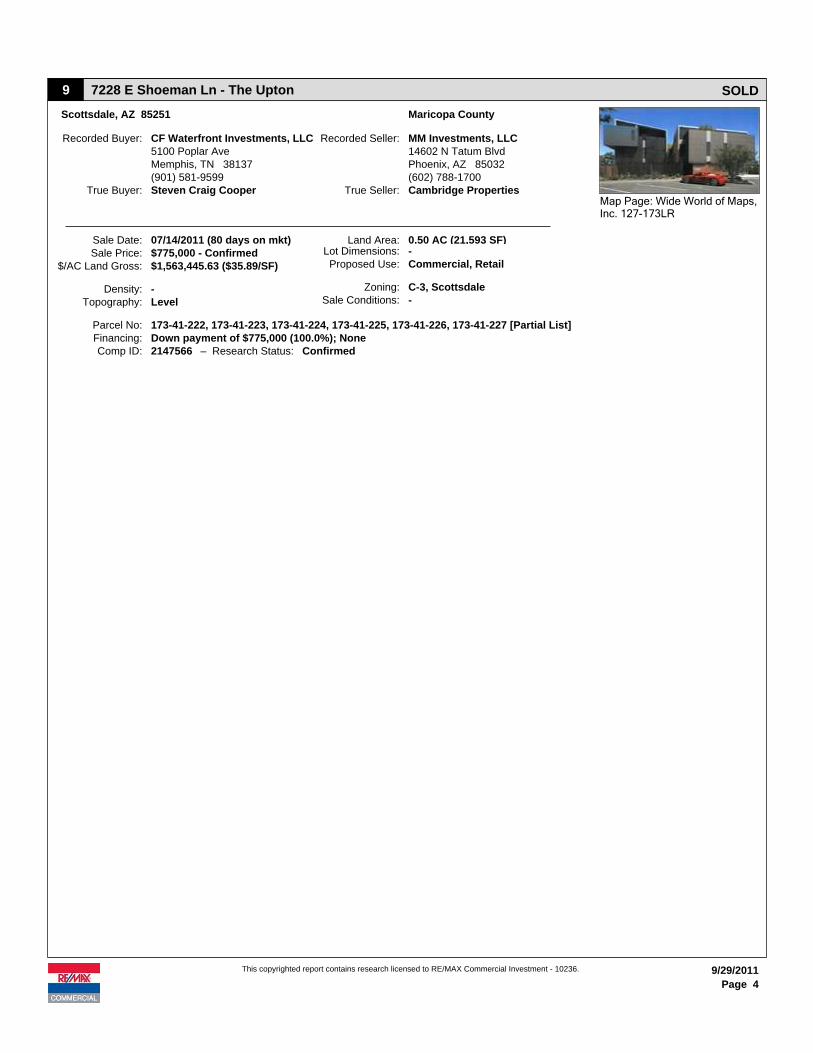
9 7228 E Shoeman Ln - The Upton SOLD
Scottsdale, AZ 85251 Maricopa County
CF Waterfront Investments, LLCRecorded Buyer: Recorded Seller: MM Investments, LLC5100 Poplar AveMemphis, TN 38137(901) 581-9599
True Buyer: Steven Craig Cooper
14602 N Tatum BlvdPhoenix, AZ 85032(602) 788-1700Cambridge PropertiesTrue Seller:
Sale Date:
– Research Status:
Density:
Sale Price:
Topography:
$1,563,445.63 ($35.89/SF)$775,000 - Confirmed07/14/2011 (80 days on mkt) Land Area:
Zoning:Sale Conditions:
Lot Dimensions:Proposed Use:
-Level
Parcel No:Financing:
173-41-222, 173-41-223, 173-41-224, 173-41-225, 173-41-226, 173-41-227 [Partial List]Down payment of $775,000 (100.0%); None
Confirmed
0.50 AC (21,593 SF)-Commercial, Retail
C-3, Scottsdale-
$/AC Land Gross:
2147566Comp ID:
Map Page: Wide World of Maps, Inc. 127-173LR
This copyrighted report contains research licensed to RE/MAX Commercial Investment - 10236. 9/29/2011
Page 4
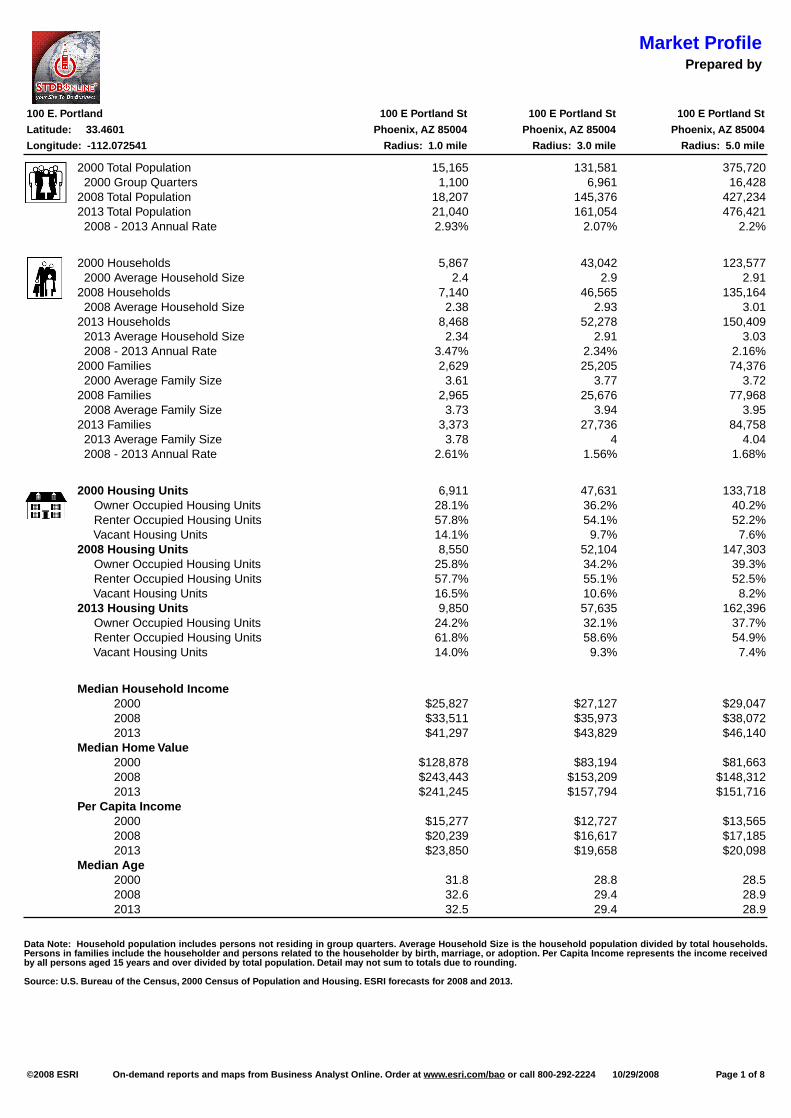
Market ProfilePrepared by
©2008 ESRI On-demand reports and maps from Business Analyst Online. Order at www.esri.com/bao or call 800-292-2224 10/29/2008 Page 1 of 8
100 E. Portland 100 E Portland St 100 E Portland St 100 E Portland St
Latitude: 33.4601 Phoenix, AZ 85004 Phoenix, AZ 85004 Phoenix, AZ 85004
Longitude: -112.072541 Radius: 1.0 mile Radius: 3.0 mile Radius: 5.0 mile
2000 Total Population 15,165 131,581 375,720 2000 Group Quarters 1,100 6,961 16,4282008 Total Population 18,207 145,376 427,2342013 Total Population 21,040 161,054 476,421 2008 - 2013 Annual Rate 2.93% 2.07% 2.2%
2000 Households 5,867 43,042 123,577 2000 Average Household Size 2.4 2.9 2.912008 Households 7,140 46,565 135,164 2008 Average Household Size 2.38 2.93 3.012013 Households 8,468 52,278 150,409 2013 Average Household Size 2.34 2.91 3.03 2008 - 2013 Annual Rate 3.47% 2.34% 2.16%2000 Families 2,629 25,205 74,376 2000 Average Family Size 3.61 3.77 3.722008 Families 2,965 25,676 77,968 2008 Average Family Size 3.73 3.94 3.952013 Families 3,373 27,736 84,758 2013 Average Family Size 3.78 4 4.04 2008 - 2013 Annual Rate 2.61% 1.56% 1.68%
2000 Housing Units 6,911 47,631 133,718 Owner Occupied Housing Units 28.1% 36.2% 40.2% Renter Occupied Housing Units 57.8% 54.1% 52.2% Vacant Housing Units 14.1% 9.7% 7.6%2008 Housing Units 8,550 52,104 147,303 Owner Occupied Housing Units 25.8% 34.2% 39.3% Renter Occupied Housing Units 57.7% 55.1% 52.5% Vacant Housing Units 16.5% 10.6% 8.2%2013 Housing Units 9,850 57,635 162,396 Owner Occupied Housing Units 24.2% 32.1% 37.7% Renter Occupied Housing Units 61.8% 58.6% 54.9% Vacant Housing Units 14.0% 9.3% 7.4%
Median Household Income 2000 $25,827 $27,127 $29,047 2008 $33,511 $35,973 $38,072 2013 $41,297 $43,829 $46,140 Median Home Value 2000 $128,878 $83,194 $81,663 2008 $243,443 $153,209 $148,312 2013 $241,245 $157,794 $151,716 Per Capita Income 2000 $15,277 $12,727 $13,565 2008 $20,239 $16,617 $17,185 2013 $23,850 $19,658 $20,098 Median Age 2000 31.8 28.8 28.5 2008 32.6 29.4 28.9 2013 32.5 29.4 28.9
Data Note: Household population includes persons not residing in group quarters. Average Household Size is the household population divided by total households. Persons in families include the householder and persons related to the householder by birth, marriage, or adoption. Per Capita Income represents the income received by all persons aged 15 years and over divided by total population. Detail may not sum to totals due to rounding.
Source: U.S. Bureau of the Census, 2000 Census of Population and Housing. ESRI forecasts for 2008 and 2013.
Market ProfilePrepared by
©2008 ESRI On-demand reports and maps from Business Analyst Online. Order at www.esri.com/bao or call 800-292-2224 10/29/2008 Page 2 of 8
100 E. Portland 100 E Portland St 100 E Portland St 100 E Portland St
Latitude: 33.4601 Phoenix, AZ 85004 Phoenix, AZ 85004 Phoenix, AZ 85004
Longitude: -112.072541 Radius: 1.0 mile Radius: 3.0 mile Radius: 5.0 mile
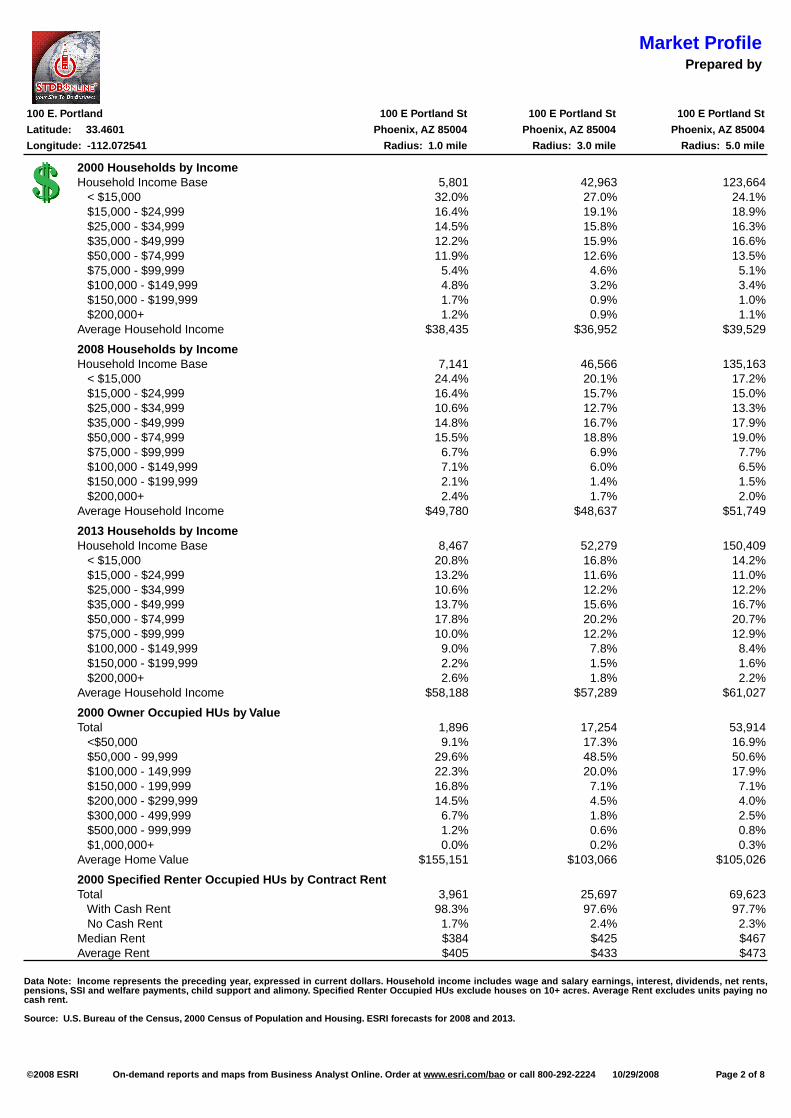
2000 Households by IncomeHousehold Income Base 5,801 42,963 123,664 < $15,000 32.0% 27.0% 24.1% $15,000 - $24,999 16.4% 19.1% 18.9% $25,000 - $34,999 14.5% 15.8% 16.3% $35,000 - $49,999 12.2% 15.9% 16.6% $50,000 - $74,999 11.9% 12.6% 13.5% $75,000 - $99,999 5.4% 4.6% 5.1% $100,000 - $149,999 4.8% 3.2% 3.4% $150,000 - $199,999 1.7% 0.9% 1.0%
$200,000+ 1.2% 0.9% 1.1% Average Household Income $38,435 $36,952 $39,529
2008 Households by Income Household Income Base 7,141 46,566 135,163 < $15,000 24.4% 20.1% 17.2% $15,000 - $24,999 16.4% 15.7% 15.0% $25,000 - $34,999 10.6% 12.7% 13.3% $35,000 - $49,999 14.8% 16.7% 17.9% $50,000 - $74,999 15.5% 18.8% 19.0% $75,000 - $99,999 6.7% 6.9% 7.7% $100,000 - $149,999 7.1% 6.0% 6.5% $150,000 - $199,999 2.1% 1.4% 1.5% $200,000+ 2.4% 1.7% 2.0% Average Household Income $49,780 $48,637 $51,749
2013 Households by Income Household Income Base 8,467 52,279 150,409 < $15,000 20.8% 16.8% 14.2% $15,000 - $24,999 13.2% 11.6% 11.0% $25,000 - $34,999 10.6% 12.2% 12.2% $35,000 - $49,999 13.7% 15.6% 16.7% $50,000 - $74,999 17.8% 20.2% 20.7% $75,000 - $99,999 10.0% 12.2% 12.9% $100,000 - $149,999 9.0% 7.8% 8.4% $150,000 - $199,999 2.2% 1.5% 1.6% $200,000+ 2.6% 1.8% 2.2% Average Household Income $58,188 $57,289 $61,027
2000 Owner Occupied HUs by Value Total 1,896 17,254 53,914 <$50,000 9.1% 17.3% 16.9% $50,000 - 99,999 29.6% 48.5% 50.6% $100,000 - 149,999 22.3% 20.0% 17.9% $150,000 - 199,999 16.8% 7.1% 7.1% $200,000 - $299,999 14.5% 4.5% 4.0% $300,000 - 499,999 6.7% 1.8% 2.5% $500,000 - 999,999 1.2% 0.6% 0.8% $1,000,000+ 0.0% 0.2% 0.3% Average Home Value $155,151 $103,066 $105,026
2000 Specified Renter Occupied HUs by Contract Rent Total 3,961 25,697 69,623 With Cash Rent 98.3% 97.6% 97.7% No Cash Rent 1.7% 2.4% 2.3% Median Rent $384 $425 $467 Average Rent $405 $433 $473
Data Note: Income represents the preceding year, expressed in current dollars. Household income includes wage and salary earnings, interest, dividends, net rents, pensions, SSI and welfare payments, child support and alimony. Specified Renter Occupied HUs exclude houses on 10+ acres. Average Rent excludes units paying no cash rent.
Source: U.S. Bureau of the Census, 2000 Census of Population and Housing. ESRI forecasts for 2008 and 2013.
Market ProfilePrepared by
©2008 ESRI On-demand reports and maps from Business Analyst Online. Order at www.esri.com/bao or call 800-292-2224 10/29/2008 Page 3 of 8
100 E. Portland 100 E Portland St 100 E Portland St 100 E Portland St
Latitude: 33.4601 Phoenix, AZ 85004 Phoenix, AZ 85004 Phoenix, AZ 85004
Longitude: -112.072541 Radius: 1.0 mile Radius: 3.0 mile Radius: 5.0 mile
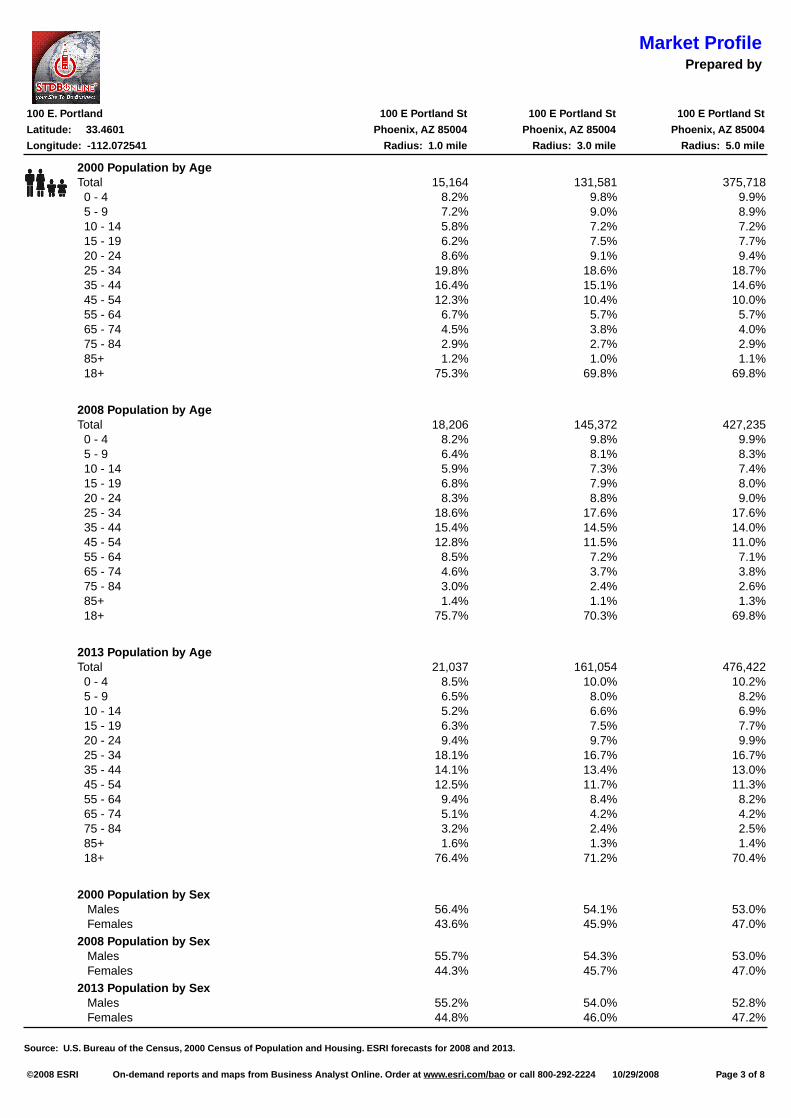
2000 Population by Age Total 15,164 131,581 375,718 0 - 4 8.2% 9.8% 9.9% 5 - 9 7.2% 9.0% 8.9% 10 - 14 5.8% 7.2% 7.2% 15 - 19 6.2% 7.5% 7.7% 20 - 24 8.6% 9.1% 9.4% 25 - 34 19.8% 18.6% 18.7% 35 - 44 16.4% 15.1% 14.6% 45 - 54 12.3% 10.4% 10.0% 55 - 64 6.7% 5.7% 5.7% 65 - 74 4.5% 3.8% 4.0% 75 - 84 2.9% 2.7% 2.9% 85+ 1.2% 1.0% 1.1%
18+ 75.3% 69.8% 69.8%
2008 Population by Age Total 18,206 145,372 427,235 0 - 4 8.2% 9.8% 9.9% 5 - 9 6.4% 8.1% 8.3% 10 - 14 5.9% 7.3% 7.4% 15 - 19 6.8% 7.9% 8.0% 20 - 24 8.3% 8.8% 9.0% 25 - 34 18.6% 17.6% 17.6% 35 - 44 15.4% 14.5% 14.0% 45 - 54 12.8% 11.5% 11.0% 55 - 64 8.5% 7.2% 7.1% 65 - 74 4.6% 3.7% 3.8% 75 - 84 3.0% 2.4% 2.6% 85+ 1.4% 1.1% 1.3% 18+ 75.7% 70.3% 69.8%
2013 Population by Age Total 21,037 161,054 476,422 0 - 4 8.5% 10.0% 10.2% 5 - 9 6.5% 8.0% 8.2% 10 - 14 5.2% 6.6% 6.9% 15 - 19 6.3% 7.5% 7.7% 20 - 24 9.4% 9.7% 9.9% 25 - 34 18.1% 16.7% 16.7% 35 - 44 14.1% 13.4% 13.0% 45 - 54 12.5% 11.7% 11.3% 55 - 64 9.4% 8.4% 8.2% 65 - 74 5.1% 4.2% 4.2% 75 - 84 3.2% 2.4% 2.5% 85+ 1.6% 1.3% 1.4% 18+ 76.4% 71.2% 70.4%
2000 Population by Sex Males 56.4% 54.1% 53.0% Females 43.6% 45.9% 47.0%
2008 Population by Sex Males 55.7% 54.3% 53.0% Females 44.3% 45.7% 47.0%
2013 Population by Sex Males 55.2% 54.0% 52.8% Females 44.8% 46.0% 47.2%
Source: U.S. Bureau of the Census, 2000 Census of Population and Housing. ESRI forecasts for 2008 and 2013.
Market ProfilePrepared by
©2008 ESRI On-demand reports and maps from Business Analyst Online. Order at www.esri.com/bao or call 800-292-2224 10/29/2008 Page 4 of 8
100 E. Portland 100 E Portland St 100 E Portland St 100 E Portland St
Latitude: 33.4601 Phoenix, AZ 85004 Phoenix, AZ 85004 Phoenix, AZ 85004
Longitude: -112.072541 Radius: 1.0 mile Radius: 3.0 mile Radius: 5.0 mile
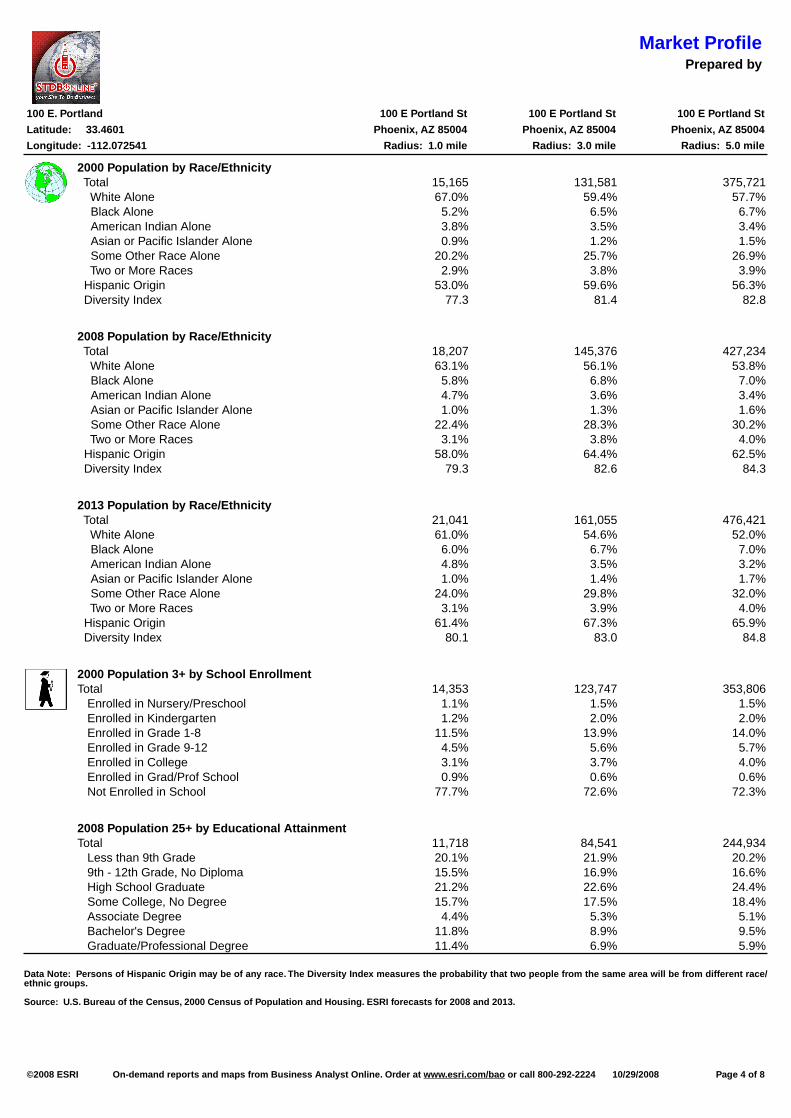
2000 Population by Race/Ethnicity Total 15,165 131,581 375,721 White Alone 67.0% 59.4% 57.7% Black Alone 5.2% 6.5% 6.7% American Indian Alone 3.8% 3.5% 3.4% Asian or Pacific Islander Alone 0.9% 1.2% 1.5% Some Other Race Alone 20.2% 25.7% 26.9% Two or More Races 2.9% 3.8% 3.9% Hispanic Origin 53.0% 59.6% 56.3% Diversity Index 77.3 81.4 82.8
2008 Population by Race/Ethnicity Total 18,207 145,376 427,234 White Alone 63.1% 56.1% 53.8% Black Alone 5.8% 6.8% 7.0% American Indian Alone 4.7% 3.6% 3.4% Asian or Pacific Islander Alone 1.0% 1.3% 1.6% Some Other Race Alone 22.4% 28.3% 30.2% Two or More Races 3.1% 3.8% 4.0% Hispanic Origin 58.0% 64.4% 62.5% Diversity Index 79.3 82.6 84.3
2013 Population by Race/Ethnicity Total 21,041 161,055 476,421 White Alone 61.0% 54.6% 52.0% Black Alone 6.0% 6.7% 7.0% American Indian Alone 4.8% 3.5% 3.2% Asian or Pacific Islander Alone 1.0% 1.4% 1.7% Some Other Race Alone 24.0% 29.8% 32.0% Two or More Races 3.1% 3.9% 4.0% Hispanic Origin 61.4% 67.3% 65.9% Diversity Index 80.1 83.0 84.8
2000 Population 3+ by School EnrollmentTotal 14,353 123,747 353,806 Enrolled in Nursery/Preschool 1.1% 1.5% 1.5% Enrolled in Kindergarten 1.2% 2.0% 2.0% Enrolled in Grade 1-8 11.5% 13.9% 14.0% Enrolled in Grade 9-12 4.5% 5.6% 5.7% Enrolled in College 3.1% 3.7% 4.0% Enrolled in Grad/Prof School 0.9% 0.6% 0.6% Not Enrolled in School 77.7% 72.6% 72.3%
2008 Population 25+ by Educational Attainment Total 11,718 84,541 244,934 Less than 9th Grade 20.1% 21.9% 20.2% 9th - 12th Grade, No Diploma 15.5% 16.9% 16.6% High School Graduate 21.2% 22.6% 24.4% Some College, No Degree 15.7% 17.5% 18.4% Associate Degree 4.4% 5.3% 5.1% Bachelor's Degree 11.8% 8.9% 9.5% Graduate/Professional Degree 11.4% 6.9% 5.9%
Data Note: Persons of Hispanic Origin may be of any race. The Diversity Index measures the probability that two people from the same area will be from different race/ethnic groups.
Source: U.S. Bureau of the Census, 2000 Census of Population and Housing. ESRI forecasts for 2008 and 2013.
Market ProfilePrepared by
100 E. Portland 100 E Portland St 100 E Portland St 100 E Portland St
Latitude: 33.4601 Phoenix, AZ 85004 Phoenix, AZ 85004 Phoenix, AZ 85004
Longitude: -112.072541 Radius: 1.0 mile Radius: 3.0 mile Radius: 5.0 mile
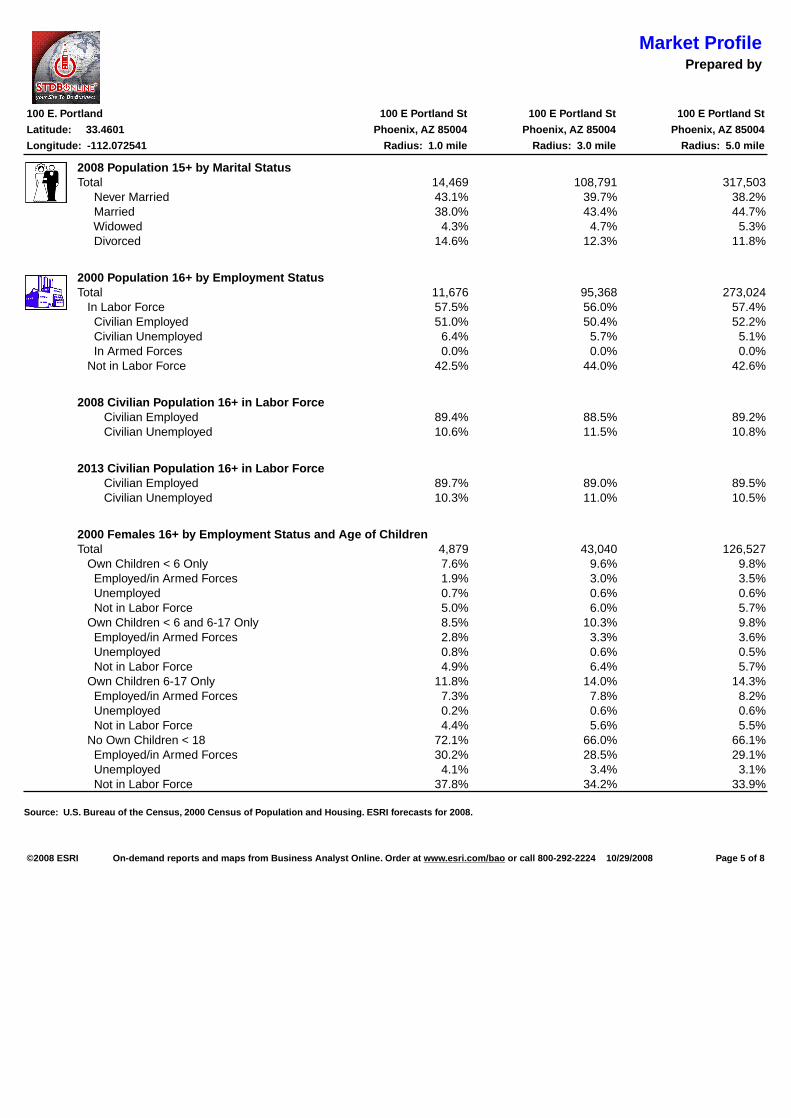
2008 Population 15+ by Marital StatusTotal 14,469 108,791 317,503 Never Married 43.1% 39.7% 38.2% Married 38.0% 43.4% 44.7% Widowed 4.3% 4.7% 5.3% Divorced 14.6% 12.3% 11.8%
2000 Population 16+ by Employment StatusTotal 11,676 95,368 273,024 In Labor Force 57.5% 56.0% 57.4% Civilian Employed 51.0% 50.4% 52.2% Civilian Unemployed 6.4% 5.7% 5.1% In Armed Forces 0.0% 0.0% 0.0% Not in Labor Force 42.5% 44.0% 42.6%
2008 Civilian Population 16+ in Labor Force Civilian Employed 89.4% 88.5% 89.2% Civilian Unemployed 10.6% 11.5% 10.8%
2013 Civilian Population 16+ in Labor Force Civilian Employed 89.7% 89.0% 89.5% Civilian Unemployed 10.3% 11.0% 10.5%
2000 Females 16+ by Employment Status and Age of Children Total 4,879 43,040 126,527 Own Children < 6 Only 7.6% 9.6% 9.8% Employed/in Armed Forces 1.9% 3.0% 3.5% Unemployed 0.7% 0.6% 0.6% Not in Labor Force 5.0% 6.0% 5.7% Own Children < 6 and 6-17 Only 8.5% 10.3% 9.8% Employed/in Armed Forces 2.8% 3.3% 3.6% Unemployed 0.8% 0.6% 0.5% Not in Labor Force 4.9% 6.4% 5.7% Own Children 6-17 Only 11.8% 14.0% 14.3% Employed/in Armed Forces 7.3% 7.8% 8.2% Unemployed 0.2% 0.6% 0.6% Not in Labor Force 4.4% 5.6% 5.5% No Own Children < 18 72.1% 66.0% 66.1% Employed/in Armed Forces 30.2% 28.5% 29.1% Unemployed 4.1% 3.4% 3.1% Not in Labor Force 37.8% 34.2% 33.9%
Source: U.S. Bureau of the Census, 2000 Census of Population and Housing. ESRI forecasts for 2008.
©2008 ESRI On-demand reports and maps from Business Analyst Online. Order at www.esri.com/bao or call 800-292-2224 10/29/2008 Page 5 of 8
Market ProfilePrepared by
100 E. Portland 100 E Portland St 100 E Portland St 100 E Portland St
Latitude: 33.4601 Phoenix, AZ 85004 Phoenix, AZ 85004 Phoenix, AZ 85004
Longitude: -112.072541 Radius: 1.0 mile Radius: 3.0 mile Radius: 5.0 mile
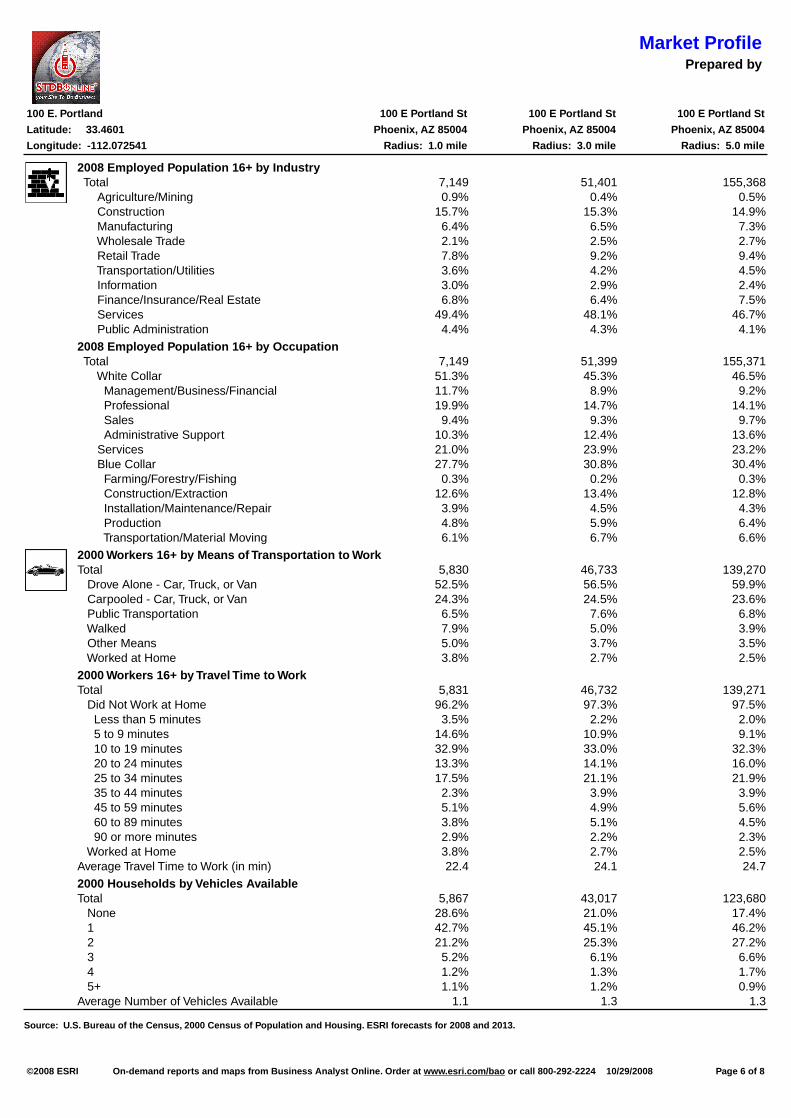
2008 Employed Population 16+ by Industry Total 7,149 51,401 155,368 Agriculture/Mining 0.9% 0.4% 0.5% Construction 15.7% 15.3% 14.9% Manufacturing 6.4% 6.5% 7.3% Wholesale Trade 2.1% 2.5% 2.7% Retail Trade 7.8% 9.2% 9.4% Transportation/Utilities 3.6% 4.2% 4.5% Information 3.0% 2.9% 2.4% Finance/Insurance/Real Estate 6.8% 6.4% 7.5% Services 49.4% 48.1% 46.7% Public Administration 4.4% 4.3% 4.1%
2008 Employed Population 16+ by Occupation Total 7,149 51,399 155,371 White Collar 51.3% 45.3% 46.5% Management/Business/Financial 11.7% 8.9% 9.2% Professional 19.9% 14.7% 14.1% Sales 9.4% 9.3% 9.7% Administrative Support 10.3% 12.4% 13.6% Services 21.0% 23.9% 23.2% Blue Collar 27.7% 30.8% 30.4% Farming/Forestry/Fishing 0.3% 0.2% 0.3% Construction/Extraction 12.6% 13.4% 12.8% Installation/Maintenance/Repair 3.9% 4.5% 4.3% Production 4.8% 5.9% 6.4% Transportation/Material Moving 6.1% 6.7% 6.6%
2000 Workers 16+ by Means of Transportation to WorkTotal 5,830 46,733 139,270 Drove Alone - Car, Truck, or Van 52.5% 56.5% 59.9% Carpooled - Car, Truck, or Van 24.3% 24.5% 23.6% Public Transportation 6.5% 7.6% 6.8% Walked 7.9% 5.0% 3.9% Other Means 5.0% 3.7% 3.5% Worked at Home 3.8% 2.7% 2.5%
2000 Workers 16+ by Travel Time to Work Total 5,831 46,732 139,271 Did Not Work at Home 96.2% 97.3% 97.5% Less than 5 minutes 3.5% 2.2% 2.0% 5 to 9 minutes 14.6% 10.9% 9.1% 10 to 19 minutes 32.9% 33.0% 32.3% 20 to 24 minutes 13.3% 14.1% 16.0% 25 to 34 minutes 17.5% 21.1% 21.9% 35 to 44 minutes 2.3% 3.9% 3.9% 45 to 59 minutes 5.1% 4.9% 5.6% 60 to 89 minutes 3.8% 5.1% 4.5% 90 or more minutes 2.9% 2.2% 2.3% Worked at Home 3.8% 2.7% 2.5% Average Travel Time to Work (in min) 22.4 24.1 24.7
2000 Households by Vehicles Available Total 5,867 43,017 123,680 None 28.6% 21.0% 17.4% 1 42.7% 45.1% 46.2% 2 21.2% 25.3% 27.2% 3 5.2% 6.1% 6.6% 4 1.2% 1.3% 1.7% 5+ 1.1% 1.2% 0.9% Average Number of Vehicles Available 1.1 1.3 1.3
Source: U.S. Bureau of the Census, 2000 Census of Population and Housing. ESRI forecasts for 2008 and 2013.
©2008 ESRI On-demand reports and maps from Business Analyst Online. Order at www.esri.com/bao or call 800-292-2224 10/29/2008 Page 6 of 8
Market ProfilePrepared by
100 E. Portland 100 E Portland St 100 E Portland St 100 E Portland St
Latitude: 33.4601 Phoenix, AZ 85004 Phoenix, AZ 85004 Phoenix, AZ 85004
Longitude: -112.072541 Radius: 1.0 mile Radius: 3.0 mile Radius: 5.0 mile
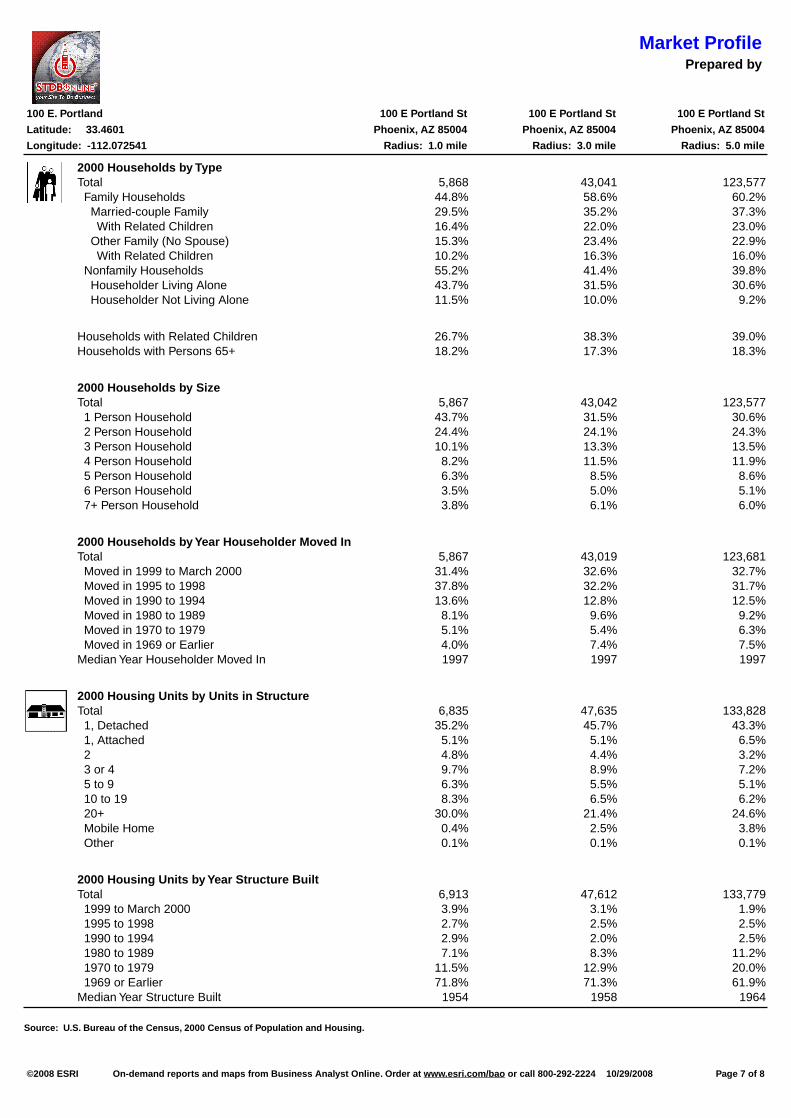
2000 Households by Type Total 5,868 43,041 123,577 Family Households 44.8% 58.6% 60.2% Married-couple Family 29.5% 35.2% 37.3% With Related Children 16.4% 22.0% 23.0% Other Family (No Spouse) 15.3% 23.4% 22.9% With Related Children 10.2% 16.3% 16.0% Nonfamily Households 55.2% 41.4% 39.8% Householder Living Alone 43.7% 31.5% 30.6% Householder Not Living Alone 11.5% 10.0% 9.2%
Households with Related Children 26.7% 38.3% 39.0% Households with Persons 65+ 18.2% 17.3% 18.3%
2000 Households by Size Total 5,867 43,042 123,577 1 Person Household 43.7% 31.5% 30.6% 2 Person Household 24.4% 24.1% 24.3% 3 Person Household 10.1% 13.3% 13.5% 4 Person Household 8.2% 11.5% 11.9% 5 Person Household 6.3% 8.5% 8.6% 6 Person Household 3.5% 5.0% 5.1% 7+ Person Household 3.8% 6.1% 6.0%
2000 Households by Year Householder Moved In Total 5,867 43,019 123,681 Moved in 1999 to March 2000 31.4% 32.6% 32.7% Moved in 1995 to 1998 37.8% 32.2% 31.7% Moved in 1990 to 1994 13.6% 12.8% 12.5% Moved in 1980 to 1989 8.1% 9.6% 9.2% Moved in 1970 to 1979 5.1% 5.4% 6.3% Moved in 1969 or Earlier 4.0% 7.4% 7.5% Median Year Householder Moved In 1997 1997 1997
2000 Housing Units by Units in StructureTotal 6,835 47,635 133,828 1, Detached 35.2% 45.7% 43.3% 1, Attached 5.1% 5.1% 6.5% 2 4.8% 4.4% 3.2% 3 or 4 9.7% 8.9% 7.2% 5 to 9 6.3% 5.5% 5.1% 10 to 19 8.3% 6.5% 6.2% 20+ 30.0% 21.4% 24.6% Mobile Home 0.4% 2.5% 3.8% Other 0.1% 0.1% 0.1%
2000 Housing Units by Year Structure Built Total 6,913 47,612 133,779 1999 to March 2000 3.9% 3.1% 1.9% 1995 to 1998 2.7% 2.5% 2.5% 1990 to 1994 2.9% 2.0% 2.5% 1980 to 1989 7.1% 8.3% 11.2% 1970 to 1979 11.5% 12.9% 20.0% 1969 or Earlier 71.8% 71.3% 61.9% Median Year Structure Built 1954 1958 1964
Source: U.S. Bureau of the Census, 2000 Census of Population and Housing.
©2008 ESRI On-demand reports and maps from Business Analyst Online. Order at www.esri.com/bao or call 800-292-2224 10/29/2008 Page 7 of 8
Market ProfilePrepared by
100 E. Portland 100 E Portland St 100 E Portland St 100 E Portland St
Latitude: 33.4601 Phoenix, AZ 85004 Phoenix, AZ 85004 Phoenix, AZ 85004
Longitude: -112.072541 Radius: 1.0 mile Radius: 3.0 mile Radius: 5.0 mile
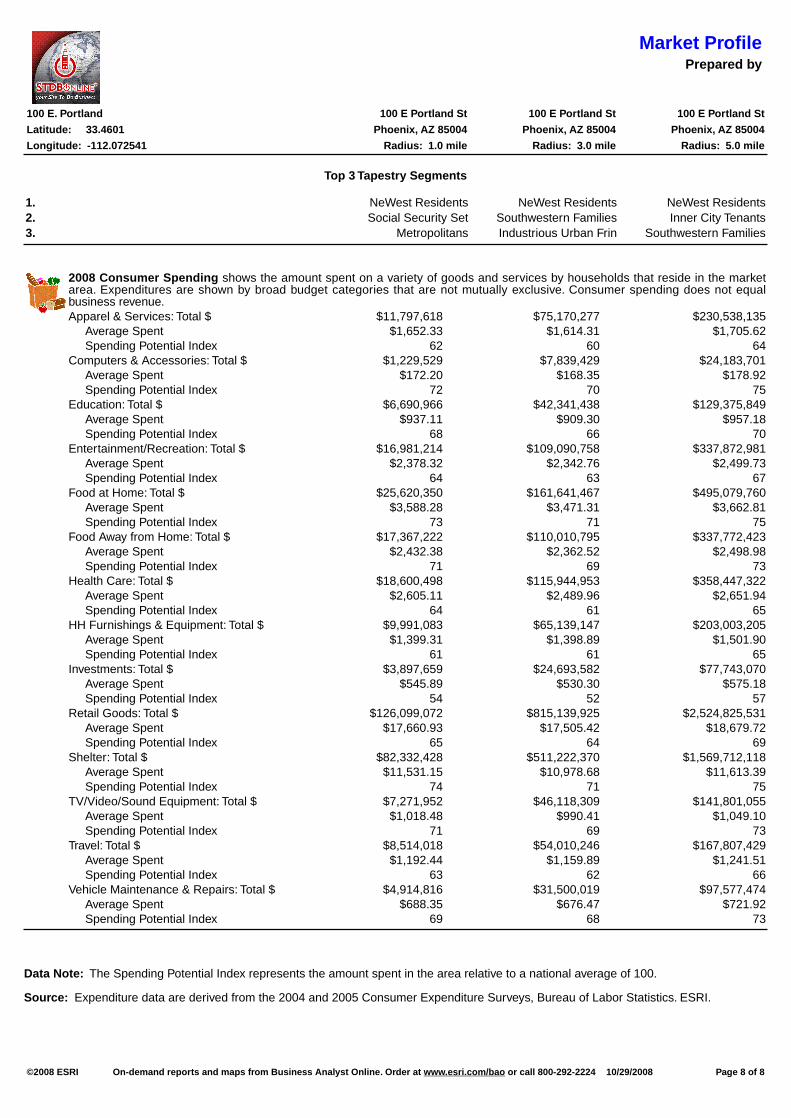
Top 3 Tapestry Segments
1. NeWest Residents NeWest Residents NeWest Residents2. Social Security Set Southwestern Families Inner City Tenants3. Metropolitans Industrious Urban Frin Southwestern Families
2008 Consumer Spending shows the amount spent on a variety of goods and services by households that reside in the market area. Expenditures are shown by broad budget categories that are not mutually exclusive. Consumer spending does not equal business revenue.Apparel & Services: Total $ $11,797,618 $75,170,277 $230,538,135 Average Spent $1,652.33 $1,614.31 $1,705.62 Spending Potential Index 62 60 64Computers & Accessories: Total $ $1,229,529 $7,839,429 $24,183,701 Average Spent $172.20 $168.35 $178.92 Spending Potential Index 72 70 75Education: Total $ $6,690,966 $42,341,438 $129,375,849 Average Spent $937.11 $909.30 $957.18 Spending Potential Index 68 66 70
Entertainment/Recreation: Total $ $16,981,214 $109,090,758 $337,872,981 Average Spent $2,378.32 $2,342.76 $2,499.73 Spending Potential Index 64 63 67 Food at Home: Total $ $25,620,350 $161,641,467 $495,079,760 Average Spent $3,588.28 $3,471.31 $3,662.81 Spending Potential Index 73 71 75 Food Away from Home: Total $ $17,367,222 $110,010,795 $337,772,423 Average Spent $2,432.38 $2,362.52 $2,498.98 Spending Potential Index 71 69 73 Health Care: Total $ $18,600,498 $115,944,953 $358,447,322 Average Spent $2,605.11 $2,489.96 $2,651.94 Spending Potential Index 64 61 65 HH Furnishings & Equipment: Total $ $9,991,083 $65,139,147 $203,003,205 Average Spent $1,399.31 $1,398.89 $1,501.90 Spending Potential Index 61 61 65 Investments: Total $ $3,897,659 $24,693,582 $77,743,070 Average Spent $545.89 $530.30 $575.18 Spending Potential Index 54 52 57 Retail Goods: Total $ $126,099,072 $815,139,925 $2,524,825,531 Average Spent $17,660.93 $17,505.42 $18,679.72 Spending Potential Index 65 64 69 Shelter: Total $ $82,332,428 $511,222,370 $1,569,712,118 Average Spent $11,531.15 $10,978.68 $11,613.39 Spending Potential Index 74 71 75 TV/Video/Sound Equipment: Total $ $7,271,952 $46,118,309 $141,801,055 Average Spent $1,018.48 $990.41 $1,049.10 Spending Potential Index 71 69 73 Travel: Total $ $8,514,018 $54,010,246 $167,807,429 Average Spent $1,192.44 $1,159.89 $1,241.51 Spending Potential Index 63 62 66 Vehicle Maintenance & Repairs: Total $ $4,914,816 $31,500,019 $97,577,474 Average Spent $688.35 $676.47 $721.92 Spending Potential Index 69 68 73
Data Note: The Spending Potential Index represents the amount spent in the area relative to a national average of 100.
Source: Expenditure data are derived from the 2004 and 2005 Consumer Expenditure Surveys, Bureau of Labor Statistics. ESRI.
©2008 ESRI On-demand reports and maps from Business Analyst Online. Order at www.esri.com/bao or call 800-292-2224 10/29/2008 Page 8 of 8