Embed Size (px)
Citation preview

BILATERAL EXCHANGE RATES AND THE PERFORMANCE OF THE TOURISM INDUSTRY: EVIDENCE FOR CANADA
Aminata Kanta
A Thesis In
The Faculty of
Commerce and Administration
Presented in Partial Fulfilment of the Requirements for the Degree of Master of Science in Administration at
Concordia University Montreal, Quebec, Canada
October 1998
%minata Kanta, 1998
National Library 1*1 of Canada Bibliothèque nationale du Canada
Acquisitions and Acquisitions et Bibliographie Services services bibliographiques 395 Wellington Street 395. rue Wellington OttawaON K1AON4 Ottawa ON K I A ON4 Canada Canada
The author has granted a non- L'auteur a accordé une licence non exclusive licence allowing the exclusive permettant à la National Library of Canada to Bibliothèque nationale du Canada de reproduce, loan, distribute or sell reproduire, prêter, distribuer ou copies of this thesis in microform, vendre des copies de cette thèse sous paper or electronic formats. la forme de microfiche/film, de
reproduction sur papier ou sur format électronique.
The author retains ownership of the L'auteur conserve la propriété du copyright in this thesis. Neither the droit d'auteur qui protège cette thèse. thesis nor substantial extracts fkom it Ni la thèse ni des extraits substantiels may be printed or otherwise de celle-ci ne doivent être imprimés reproduced without the author's ou autrement reproduits sans son permission. autorisation.

Abstract
Bilateral Exchange Rates and the Performance of the Tourism Industry: Evidence for Canada
Aminata Kanta
This thesis is devoted to test the widely held hypothesis that a depreciation of the home currency is beneficial to a country tourism account. Using the aggregate tourism account as well as the accounts between Canada and three of its most important partners in international travel, we examine the sensitivity of the cash oufflows and infiows to bilateral exchange rates changes. The exchange rate exposure is rnodeled using both a regression framework as well as a causality test. The results suggest that at the aggregate level the cash oufflows tend to be Granger caused by the Yen and the Pound while there is some forrn of correlation between the receipt series and the Yen.
We extend this research by examining the impacts of the fluctuations of the Canadian dollar vis a vis the US dollar on the stock returns of tourism related firms. Evidence is presented that the firms in the sample do not benefit from a depreciation of the Canadian dollar. We also find that the risk coefficient appears to change over time and the predictive power of the mode1 is not sensitive to the exchange variables used but do change with the market p roxy.
..- Ill

Acknowledgements
I would like to thank my supervisor Dr L. N. Switzer for his guidance and
helpful comments. Un merci special à mes parents qui m'ont toujours
encouragée a poursuivre mes études.
Finally, a very special thought for my husband and our kids who fully shared
my everyday student life.

Table of Contents
Introduction ......... ....................................................................................... 1
............................................................................... 1 . Literature Review 5
1 . Overview of Tourism Forecasting Studies ............................. 5 2.Tourism Cash flows and Exchange rates .................. .. ......... 8 3 . Stock Performance and Currency Exposure ......................... 10
................................................. ................................... II . Data ................. 13
III . Methodology ...................................................................................... 16
IV . Empirical Results ............................................................................ 20
Tests for Unit Roots .................................................................. 20 Cointegration Test .................................................................... 21 Causality Test ........................................................................... 22 Regression Analysis: Cash Flows .......................................... 23 Regression Analysis: Firms' Exposure ................................. 26
................................................................................................. Conclusion 31
.................................................................................................... Appendices 33
................................................................................................... Bibliography 53

A mon mari Cheick Oumar Avec toute ma gratitude

Introduction
The tourism industry represents an important sector of the Canadian
economy. According to Statistics Canada it has generated over $1 0,194 millions
in receipts in 1994 which represented 4.8% of the country GNP and ranked fifth
in ternis of persons employed. But the last 10 years has been marked by
successive international travel account deficits not only at the aggregate level but
also with most of the countries with which Canada has a travel balance. The
tourisrn output is perishable and its demand and industry cash flows should be
very elastic vis a vis several factors. Hence, identifying the key factors affecting
the cash flows of the industry is an important issue.
There are several reasons to expect exchange rates to be one of the
factors to influence tourism destination choices as well as the related
expenditures. especially for international tourism, frorn financial theory. If the
exchange rate is more volatile than the inflation and interest rates (Jorion 1990),
it is clear that exchange rate risk can be important. It is cornrnonly held that a
depreciation of the local currency makes the country attractive to foreigners and
has a positive effect on the international tourism account of that country.
Interestingly, the Canadian tourisrn account deficit coincides with a large
depreciation of the Canadian dollar. Therefore. it is worth investigating the nature
of the relationship between tourism industry and the fluctuations of the dollar.

Previous work examining the relationship between exchange rates and the
tourism industry has primarily focused on the tounsts fiows; and the few studies
that examined the cash flows examined only cash inflows ( Loeb, 1982; Gibbons
and Fish, 1985: Chadee and Mieczkowski, 1987; Qiu and Zhang, 1995), and
have ignored cash outflows. There is no consensus from these studies: the siope
of the exchange rate variable is either insignificant or only slightly positive.
This study provides new evidence on the following issues: (1) how do
exchange rate changes affect the aggregate Canadian tourism cash inflows as
well as outflows? In the analysis, we also examine the currency exposure of the
travel account with the most important partners in tourism of the country.
(2) How are individual firms affected by changes in the exchange rate? In
particular, what is the currency exposure of tourism related companies in
Canada. We also address the issue of contemporaneous and lagged
relationship between unexpected exchange rate fluctuations and stock retums.
The thesis is organized as follows. Section I provides an ovewiew of the
literature on the relationship between the exchange rate changes and the tourism
industry. Section II describes the data, while section III outlines the methodology
used. In section IV the empirical results are presented. A summary and
concluding remarks are provided in section V.

The foreign exchange risk: definitions
The international finance literature traditionally classifies foreign exchange
risk into three categories: 1 ) Transaction exposure; 2) translation exposure and
3) economic exposure. Transaction exposure is a cash fiow exposure. It stems
from the sensitivity of contractual cash flows to unexpected changes in the
exchange rate; it is the incurred gain or loss on domestic currency value of
foreign denominated assets or liabilities (Shapiro, 1994).
Translation exposure results from converting the financial statement of
foreign operations from the local currency into the home currency. when the
currency value has changed since the last reporting period.
Economic exposure incorporates the transaction exposure and the
operating exposure. The economic exposure is the impact of exchange rates on
the current and future profitability of a firm. First, firm specific characteristics are
helpful in determining currency exposure. The exposure can derive from the
sector or the environment in which a firm operates and the sources of its inputs.
Firms with assets and revenues denominated in foreign currency or the ones with
their production costs in local currency would tend to benefit from a depreciation
of the local currency. By the same token, import oriented firms would more likely
be hurt by a depreciating currency. Besides being firm detemined, currency
exposure might also be industry specific.

The way the currency sensitivity is measured would depend on how the
exposure is defined. Economic exposure is superior to the first two in that the
exposure is defined in t e n s of market rather than book values. Under the
hypothesis of efficient markets. the stock price of any firm should reflect the
impact of exchange rate changes on the firm in ali the ways they may affect it.
That is why most of the research in the field uses a stock rneasure of the value of
the fin.
In this study, we examine the impact of currency changes on a single
industry: first, the way they affect the cash flows streams is assessed; and later
how they alter the value of the firms in this particular industry.
1. Literature review
1. Overview of Tourism Forecasting Studies
Sheldon and Var(1985) provide a summary of econometric causal models
used in early studies. They note that such studies were limited by the existence
of a strong multicollinearity arnong the variables. Causal models were shown to
provide the best forecasts for expenditures while time series models tend to be
superior for tourist arriva1 forecasts. One interesting point that stems from many
of these studies is the uniqueness of each tourkt data series; what might work
for one destination. might not work with another one.
Geurts and Ibrahim (1 975) compare the forecasting accuracy of the Box-
Jenkins Approach and the Exponentially Smoothed Forecasting Model applied to
Hawaii tourists. They use monthly numbers of tourists visiting Hawaii for the
period 1952-1 971 to build the rnodels and a subsequent twenty four month
period is used to make a one month ahead forecasts. The forecast error is
computed for both techniques. They found that the two models perfonn equally
well.
Martin and Witt (1989) test the forecasting accuracy of six econometric
models applied to tourist Rows in several countries. The relative performance of
each model is assessed with the mean absolute percentage error as well with the
root mean square percentage error. The random walk naive model (the no
change model) outperformed al1 the other techniques for al1 the countries except

the US. The econometric models had the highest error terms. Witt (1 990) finds
that estimates of future income, travel costs and costs of tourism value are good
predictors of the demand for inward international tourisrn to Hong Kong.
Athiyarnan and Robertson (1 992) use 7 methods to forecast Thailand
tourist flows to Hong Kong. Data for the period 1986 to 1989 are used to make
either a one month or a tweIve month forecast while the 1990 actual tourists
flows are used to check the accuracy of each forecasting method. They find that
the single exponential smoothing rnethod yields the best one-month forecast with
the lowest mean absolute percentage error. For the twelve rnonth forecasts, the
Holt two parameter linear exponential smoothing and Brown's one parameter
linear exponential smoothing are very close in accuracy and provide the best
forecast. On the other hand, Chan (1993) makes use of a sine wave tirne series
regression model to forecast tou rist arrivals in Singa pore. His basic assumption
is that tourist data has a lot of seasonality and a cyclic trend which is easily
rnodeled by a sine function in tirne. In such a case, recent data points would
tend to reflect more the trend than less recent ones.
His model explains alrnost 98% of the variation in the seasonally adjusted
tourist arrivals. It outperforms the naive model. the proportionai change model, a
simple regression time series model and the ARIMA (2,1,2).

Sheldon(1993) is the first study to examine the accuracy of different
methods in forecasting tourism expenditures as opposed to the fIow of tounsts.
She found that international tourist arrivals series do not fluctuate in the same
way as the expenditures series. She concludes that different variables do affect
the two series. Therefore the use of different forecasting methods is motivated.
The author tests several models to predict annual tourkt fiows and expenditures
in the US from six originating countries: Canada, Japan, UK. West Germany,
France and ltaly for the period 1970-1986. The mean absolute error is computed
for each rnethodology and for each country. The author finds that the no change
model and the Brown's exponential smoothing were best indicated for the
forecasting of tourist flows. The log linear model was superior in forecasting
expenditures.
In a more recent paper, KuIendran(1997) test the effectiveness of many of
these forecasting models in predicting the quarteriy tourist flows into Australia.
He finds that in forecasting tourism, error correction models per fon poorly
compared to times series models.
2. Tourism Cash flows and exchange rates
Most of the research in this area has been concerned with the sensitivity
of the industry cash-flows to currency changes. There seems to be some
consensus that a weakening of the local currency should be favorable to a
country's tourism industry; however, the statistical significance of the relationship
remains a matter of dispute.
Loeb(1982) investigated the impact of several variables on the US tourisrn
cash inflows frorn seven importing countries. The variables include the per
capita income, the exchange rates and the relative prices. The log linear rnodel
is fitted and the expenditure levels are expressed in constant dollars.
First, the real per capita expenditures made by travelers from each country in
the US are estimated and used as the dependent variable. The model explains
up to 98% of the variations of the dependent variable. The exchange rate
variable has the expected positive sign in most of the countries but is found to be
insignificant in Canada. Second, the sensitivity of the aggregate US travel
services receipts to the same independent variables is assessed. The exchange
rate variable is significant for oniy two of the seven countries, while the real
income of the originating country has the expected positive effect significant in al1
of the countries.

Gibbons and Fish (1985) examine the effects of the Peso devaluation on
the US tourism expenditures in Mexico as well as the impact of price changes for
the period 1970-1 982. They found that the Peso devaluation led to an increase
of the US tourism expenditures in Mexico in both nominal and real terms. They
also found that border expenditures are more important than interior
expenditures and more sensitive to exchange rates changes.
Chadee and Mieczkowski (1987) investigate the effects of exchange rates
changes on the Canadian tourism for the period 1976 to 1985. Using quarterly
data, the number of US visitors to Canada and their expenditures are regressed
on various explanatory variables. They include the real exchange rate between
Canada and the US, the total disposable income in the US, the travel price index,
the size of the US population as well as seasonal dummies. They find that the
exchange rate coefficient is statistically significant with the expected positive sign
for the tourist flow variable, which is consistent with the hypothesis that a
depreciation of the Canadian dollar increases the number of US visitors in
Canada.
Surprisingly, the US visitors' expenditures in Canada are not sensitive to
changes in exchange rates. The authors also found an important seasonality in
tourism dernand series and an inverse relationship between the level of
disposable income and the US demand for Canadian travel services.

Qiu and Zhang(1995) examine the determinants of the Canadian tourism
demand (defined as the numbers of visitors entering in Canada) as well as their
expenditures frorn the major originating countries of tourists to Canada(US, UK,
France. the former West Germany and Japan) for the period 1975 to 1990. They
estimated both the linear and log linear foms using a much larger number of
independent variables. The exchange rate variable is insignificant in the tourism
dernand equation except for France where it is significant at the 10% level while
it is significant in the expenditure equation in ail countries except Japan.
3. Stock performance and currency exposure
The impact of exchange rates on the value of firms had been widely
documented. Jorion (1990) focuses on the currency exposure of US
multinationals. Using a trade-weighted exchange rate, he finds that the sample
firms undergo some form of exchange rate exposure. He also finds a significant
cross sectional difference in the exposure: for firms with international activities,
the exposure is positively related to the degree of foreign involvement, while it is
stable across domestic firms.
Jorion (1 991) classified NYSE stocks into twenty value-weighted portfolios
to analyze the impact of exchange rate changes on US industries. He finds that
the exchange rate coefficient is significant but the sign of the exposure is
different across the industries.

Export oriented industries like "chernical" or "Machinery" gain from a
depreciation of the US dollar. while import oriented industries like "Textile and
Apparel" or "Department Stores" suffer from it. The author also finds that
exchange rate risk is not priced by investors.
Luehrman (1 991 ) investigates the widely held hypothesis that a
depreciation of the home currency is beneficial to the home companies involved
in international competition. He examines two industries in particular: the world
automobile and steel industries. By using daily and weekly data, he assesses
the impacts of the real exchange rate changes on the industries' cash flows.
Interestingly, he finds that to the contrary, a depreciation of the home currency
leads to a decline in the value of both industries.
Bodnar and Gentry (1993) use aggregate industry portfolio returns to
examine industry level currency exposure for Canada, Japan and the USA for the
1983-1 988 period. They find that only 30% of the industries are exposed to
significant exchange rate risk. They also find that an appreciation of the
domestic currency is positive for non-traded goods industries, importers and
users of internationally priced inputs and negative for exporters and foreign
investors.

Bartov and Bodnar (1 994) find no significant relationship between
abnomal retums to firms with international activities and conternporaneous
exchange rate changes. However, they record a negative association between a
lagged change in the dollar and the abnorrnal returns. On the other hand, Choi
and Prasad (1 995) find that exchange rates do affect finn value but the exposure
is positively related to f i n specific foreign involvement variables such as profits,
sales and assets. Most of the f ims in the sample benefit from a depreciation of
the dollar. Aggregating the data into industries yields to insignificant exposure
coefficients. This is due to the loss of information resulting from this process.
Fang and Loo (1 996) investigate the relationship between the exchange
rate and common stock returns using an APT framework. They formed a total of
20 portfolios of common stocks of the markets of the US, Canada, UK, and
Japan. Using end of rnonths SDR values per unit of local currencies, they find the
returns to be significantly correlated to the currency coefficient, cross sectionally.
In brief, while we know the impact of exchange rate changes on tourism
cash inflows to be positive from the existing literature, nothing is known about the
nature of the relationship between cash outfiows and currency changes.
Furthemore, we believe that the analysis of the currency sensitivity of the
tourisrn industry cannot be cornplete without a comprehensive investigation of
tourism related companies' exposure. Previous research has focused in general
on the cash Row exposure and was limited to the tourism account.

If capital markets are efficient, then the way exchange rates affect the
tourism industry should be reflected in the stock returns of tourism related firms.
This study would shed some lights on the relationship between the value of the
Canadian dollar and the performance of the tourism industry by including tourism
firms.
II. Data
Statistics Canada's Database CANSlM as well as its publication Travel
between Canada and other countries were searched for quarterly receipts and
payments of the international travel accounts of between Canada and of its three
most important partners in tourism: The USA, The UK and Japan for the period
1980-1 995. According to Statistics Canada, the United States is the
international destination Canadians visit the most and American residents the
largest group of international visitors to Canada (in 1995, they represented
76.8% of non residents entering Canada). After the USA. the UK was the most
popular destination for Canadian residents in 1994 and also the most frequent
origin of overseas residents visiting Canada followed by Japan.
In the course of this study, the payments and receipts in the country global
international travel account are analyzed as well as in its accounts with each of
the selected countries. The payments are the real expenditures(expressed in
Canadian dollars) made by Canadian tourists in the visiting country.

They include international fare payments by residents to foreign carriers,
expenditures for lodging, food, entertainment, local transportation and other
purchases of goods and services.
The receipts are the expenditures made by visitors in Canada and include
international fare payments by non residents to Canadian carriers; their
expenditures in Canada for lodging, food, entertainrnent. local transportation and
other purchases of goods and services.
Monthly bilateral exchange rates were also collected from CANSIM for the
same period. The exchange rates are expressed as unit of foreign currency per
one Canadian dollar. Therefore, a i the cash flow level analysis an increase in
the rate means an appreciation of the Canadian dollar. The monthly series were
averaged out to produce quarterly series.
The TSE monthly review was searched for tourism related cornpanies.
The tourism industry is difficult to define because the defining feature cannot be
a product as with other industries. Tourists purchase a variety of products (food,
transportation, accommodation etc. ..) that corne from different industries.
Therefore, to define the tourism industry in this study, we would look at three
industries that can be considered to be rnainly tourism related: Hotels and
Restaurants, Food Services, Transportation and related activities (package tours
for instance).

The TSE monthly Review classifies firms according to their operating
sector. A total of 15 companies were identified to be in the hotellrestaurant and
transportation businesses. Seven firms were removed from the sample due to
the lack of sufficient data (Firms with more than 5 consecutive missing data
points ). Therefore, the final sample for the Company level analysis consists of
eight fims. They are listed in appendix 3 along with a description of their
activities and statistics on individual returns. Monthly stock retums of these
companies from August 1986 and to March 1996 were retrieved from the
TSENVestern Database.
The return on the value weighted TSE index for the sarne penod is used
as a proxy for the market. The drawback of using the TSE index is that it
considers a stock degree of risk only in terms of the domestic market. Since
tourism related firms operate on different markets, we assume that they are
exposed to worldwide events and relatively integrated with global capital
markets. Therefore, we also introduce the Morgan Stanley World total return
index (translated into Canadian dollars) as the benchmark market index. It could
be interesting to check whether the predictive power of the model is sensitive to
the choice of the index.

The returns on the TSE 300 and the bilateral US dollar /Canadian doliar
exchange rate are also taken from the TSUWestem Database. To get more
insight on the relationship between the exchange rate changes and the tourism
firms returns, we added two new exchange rate variables: the real and nominal
trade weighted value of the US dollar vs the Canadian dollar. These are taken
from FR6 Dallas. Both the bilateral exchange rates as well as the trade weighted
rates are expressed one Canadian dollar per unit of US dollar. Therefore. an
increase in the rate (or in the index) means a depreciation of the Canadian dollar.
Methodology
To assess the sensitivity of the tourism industry's performance to
exchange rate changes, we first use a three country framework to run OLS
regressions as in many related studies where the dependent variables would be
cash inflows and outnows.
Our point of departure is the basic mode1 as by Loeb (1982) and Chadee et al
(1 987):
Cijt=al + PiExjt (1)
COjt =a2 + P~Exjt (2)

Where
Cljt = Quarterly travel cash inflow from destination j at time t
COjt = Quarterly travel cash outflow to destination j at time t
Exjt = The bilateral exchange rate at time t between Canada and
destination j
al ,a2 ,Pi, P2 are parameters to be estimated.
The main hypothesis to be tested is that a depreciating (appreciating) currency
favors (hurts) the inflows of cash to the tourism account.
We also test the robustness of (1) and (2) to the possibility that economic
agents react to past exchange rates by adding the first lag of the exchange rate
variable.
In addition to the linear form, the log linear regression was run as in related
studies. The log linear mode1 is obtained by taking the logarithm of each variable
in the basic regression.
Equations (1) and (2) can be tho ught of as problematic since they implj
that only exchange rates unidirectionally influence the cash Rows of the tourism
account. However, the causation may be bi-directional. Therefore, one should
test for possible causation and cointegration. Our study would be the first one to
address this issue. Prior to specifj'ing the appropriate causal form. we first
conduct tests of the time series properties of the variables.

After examining the tourism cash flows at an aggregate level, we
investigate whether tourism related firms are exposed to currency risk. The
foreign exchange exposure is measured by the regression coefficient of the stock
return of the firm on the exchange rate variable. Estimates of the firrns' exposure
can be obtained from the following two-factor standard market model as
extended by Jorion(l990).
Rit = al +P2Rxt +Ps fmt (3)
where
Rit = rate of return of firm i at time t
Rxt = The monthly rate of change in the Canadianlus exchange rate at tirne t or
in the trade-weighted value of the dollar
fmt = orthogonal TSE or World index return (orthogonal to the exchange rate).
The US dollar is the sole currency used in this model to check the exchange rate
exposure. The parameters j2 and are measures of the sensitivity of stock
returns to unanticipated exchange rate and market movements.
The use of the orthogonal market return would avoid any bias resulting
from the possible correlation between the two explanatory variables and hence
enhance the explanatory power of the model. The orthogonal market factor is the
residual from the following one factor regression:

Rmt =pl Rxt + fmt (4)
Rmt = The monthly return on the value weighted market index
Rxt = The monthly rate of change in the Canadianlus exchange rate at time t
fmt = residual factor
Since a depreciation of the Canadian is supposed to be beneficial to the country
tourism account fom international finance theory, we can therefore expect that
the impact of the depreciation would be positive for tourism related firms. We
also test the lag exposure hypothesis as extended by Bartov and Bodnar (1 994)
who state that past currency changes are good predictors of future stock returns,
because there is a mispricing of contemporaneous currency effects on stock
return.
The lag exposure hypothesis is tested by regressing stock returns against market
adjusted current and lagged exchange rate variables. To check the hypothesis,
one, two and three month lags lengths are also tested.

IV. Ernpirical results
Tests for unit roots
The first step in Our analysis is to test whether each series follows a
random walk. Standard regression tests for causation when unit roots are
present could lead to spurious results. Our test would basically involve the
Dickey-Fuller (DF) and Phillips-Perron (PP) unit root type of analysis. The nuIl
hypothesis is that the series have unit roots, against the alternative that they do
not. If the t-statistics are below the critical value. the nuIl hypothesis cannot be
rejected. Table 1 presents the stationarity results using the DF as well as the PP
tests for models estimated with and without a time trend for each of the series
and the first difference of the series.
The reported results indicate that the exchange rate series follow a
random walk as posited in some studies. This finding is important for our study.
In particular, based on this result, we can be justified to use the change in
exchange rates as a good proxy for unexpected exchange rate changes. We also
find the presence of unit roots only for the global payrnents series and the
payments to Japan. Stationarity is achieved by taking the first difference; which
implies that the series are integrated at order one. The global receipts series and
the remaining series on the travel accounts with the US. the UK and Japan are
stationary. Therefore a standard regression would be used to test for causation
for these series.
The non-stationary series are now tested for cointegration and later for causality.

Cointegration test
Since the payments series of the Canadian global travel account and of
the account with Japan follow a white noise, it is important to examine whether
the residuîls of the regressions between the payments and the exchange rate
series are stationary. When non-stationary variables are cointegrated, a long run
equilibrium relationship may exist between them and prevent them from moving
far apart.
An OLS estimation of the cointegration regression is performed on the
series and the same Dickey-Fuller and Philip-Perron tests are used to test the
stationarity of the residual series. The cointegration regression is in the form:
Y = a +Pxt +st
Table II presents the results of the cointegration test. They show that the
global payments series is integrated with the US dollar and the Japanese yen.
However, the nuIl hypothesis of no cointegration with the Pound Sterling cannot
be rejected. The reported DF statistic. -2.08. is well below the critical value of
3.37. at 5 percent level of significance. The payrnentslJapan is also not
cointegrated with the Canadian Dollar 1 Japanese Yen exchange rate.

Causality test.
A causality test is performed to determine the nature of the interaction
between these payments series and the changes in the exchange rates. First,
we use the standard Granger-Sims causality test for both payment series.
The Granger causality test is based on the following two sets of regressions:
Unrestricted regression: Y = xa iYt-l +xBiXt-l +et
Restricted regression : Y = xaiYt-l +Q
The same regressions are also run for X (to test whether Y causes X). The nuIl
hypothesis of no causality is rejected if the two p's are significantly different from
ze ro.
We test whether individually there was any causal relationship between any of
the currencies and the series. Table 3 presents the results of the causality test.
The cash oufflow of the Canadian tourism account is Granger caused by the
British pound and also by the Japanese yen. As far as the US dollar is
concerned, the relationship is bi-directional. Changes in the exchange rate cause
changes in the cash oufflows of the tourism account and vice versa. The results
show also that the payments to Japan are Granger caused by the Canadian
dollar1Yen exchange rate.

Second, we make use of the multivariate generalization of the Granger-
Sims causality test for the payments to the global account. AI1 the three
currencies (the US dollar, the British pound and the Japanese yen) were to be
included in the system.
But since the results suggest that the relationship is in both ways between
the US dollar and the global payment series, the US dollar is dropped from the
multivariate causality test.
We find evidence that both the Pound Sterling and the Japanese Yen cause
changes in the cash ouMows of the global tourism account.
Regression analysis
Tourism cash flows
We now examine the impact of the exchange rates on the tourism cash
flows in the OLS regression framework. In appendix 2, we plot the cash Rows
from inward and outward travel between Canada and the selected countries
along with the exchange rates for the period 1980-1 995.
Table 4.1 (on p.36) presents the results of the linear form of the regression
model for Canadian toufism with the USA, Japan and the United Kingdom. In
Table 4.2 the same regressions are nin with the sole difference that al1 the
variables are expressed in logarithm form so that the estimated coefficients can
be interpreted as average elasticities.

F rom table 4.1 we note that the Japanese yen is the only currency with a
highly significant coefficient in the regression of the global receipts account. The
model explains up to 27% of the variations of the dependent variable.
The sign of the coefficient is negative which means that as the Canadian dollar
appreciates vis a vis the Japanese yen, there is less cash inflows in the
Canadian travel account. This confirms our expectations.
The contemporaneous exchange rate variable is insignificant in the payments as
well as the receipts regressions for the UK and the US. In the receipts series with
Japan, the lagged one variable is negative and significant at 10%. The
remaining regressions checking for the lagged relationship do not show any
sig nificant results.
Table 4.2 presents the same regressions results but in the logarithm form.
Again, the yen is highly significant in the global receipts regression while the
other currencies are non significant at conventional levels. In a stepwise
regression framework, it is the only significant variable.
We notice that the use of the log form increases the explanatory power of
the model. The model explains over 37% of the variation of the global receipts
and 60% of the variation of receipts in Canada /Japan tourism account. The
receiptsljapan series has no conternporaneous relationship with the exchange
rate but the lag variable is negative and highly significant (1 %).

This lagged relationship with the receipts would mean that a depreciation
of the Japanese yen (an appreciation of the Canadian dollar) a quarter ago would
translate to a decrease of the cash inflows to Canada tourism account. ln other
words, when their currency depreciates, Japanese spend less in Canada.
The lagged exchange rate variable is insignificant for the US. It is significant for
the United Kingdom, where it is positive in the payment series and slightly above
6% ievel of significance: a depreciation of the British pound a quarter ago (an
appreciation of the Canadian dollar) would increase the spending of Canadian
tourists in the UK.
In view of these results we find evidence that lagged changes in the value
of the dollar are associated with the performance of the tourism industry; an
issue that has not been explored by previous studies. In line with these, our
study shows that an appreciating dollar has a negative impact on the cash
inflows of the tourism account.
Furthermore. our analysis indicates that there is a difference in the way
exchange rates changes affect the tounsm account cash inflows and outfiows.
As far as the global account is concemed, there appears to be a correlation
between exchange rates and the receipts account; however. the payments are
rather caused by the currency movements.

Firms' exposure
With the swings in the value of the Canadian dollar, the impact of the
exchange rate can be important on common stocks returns of tourism related
firms. The performance of the Canadian dollar vis a vis the US dollar is proxied
by the bilateral exchange rate and the trade-weighted real and nominal value of
the dollar in this model.
We use equation (3) to investigate whether exchange rate changes affect
the stock returns. Estimates of the exposure coefficient are obtained by the
ordinary least squares (OLS) method. First. we assess the exchange rate
sensitivity of individual firms. Table 5.1 presents the results of the bilateral
exchange risk of the individual firms, when the market is proxied by the TSE and
the world indices. We notice that the sign of the exposure is the same, but on
average the exposure coefficients appear to be slightly larger when the TSE
index is used. Of the eight companies, we note that seven of them undergo some
form of currency exposure. Of these, four firms have highly significant negative
(above 5%) contemporaneous exposure when the market is proxied by the TSE
300 return.
Only one of eight firms exhibit a lagged exposure (each of the lagged variables is
significant). Two of them exhibit significant negative one month lag exposure
while the lag {33) parameter is significant for one firm.

In Table 5.2, the same regressions are run with the difference that we use
the trade-weighted nominal and real exchange rates. The results indicate that the
sign of the coefficient is negative in each of the tables. This means that the f ims
experience a decrease in stock returns when the Canadian dollar depreciates vis
a vis the US dollar.
This can be explained by firms specific characteristics ; for instance, they might
have their operating costs denominated in Us dollar.
One interesting point to be noted is the sensitivity of the model to the choice of
the market proxy: the predictive power of the model is higher when we use the
TSE index return for each of the three exchange rate variables mentioned.
The negative impact of the Canadian dollar depreciation on tourism
related firms does not support the hypothesis that Canadian tourism f i n s should
benefit from a depreciation of the Canadian dollar. However, these results are
entirely consistent with Luehrman(l991). The classification of an industry to be
traded or non traded is arbitrary; but if we consider the tourism industry to be a
non traded good industry, these findings would also be consistent with Bodnar
and Gentry. Further research should be interesting in order to determine
whether these firms are more net cash outflows exposed than cash inflows
exposed to exchange rate changes.

Second, we f o n a portfolio by taking the average retums on the eight
stocks over the same period. This portfolio should reflect the currency sensitivity
of the tourism industry. We again make use of the OLS method to determine this
exposure. The results are also presented in tables 5.1 and 5.2 (on p.38-40).
The signs of the coefficients are also negative. We note that there is no
significant correlation between the contemporaneous change in the dollar and
the tourism industry stock performance when the bilateral exchange rate is used.
The estirnate of the coefficient on the current change in the dollar is not
significantly different from zero at standard levels. The contemporaneous
parameter is highly significant when the real and nominal trade-weighted value of
the dollar are used instead. But, the estimate of the coefficient on both the first
lagged dollar change and the third lagged dollar change is different from zero at
respectively ten percent and five percent levels of significance when the bilateral
exchange rate is used. Only the third lagged change is significant when the
explanatory variable is either the real or the nominal trade weighted value of the
Canadian do1 lar.
Interestingly, we notice that there is not that much of a difference in the
results whether we use the real or the nominal value of the currency both in the
regressions for the individual firms and the portfolio.

The nominal and real exchange rate sensitivities of the firms in the sarnple are
very similar. The firms that have a nominal currency exposure are also the ones
with a real currency exposure. The predictive power of the mode1 is also quite the
same, although slightly higher with the real exchange rate variable.
The finding of the lagged response is consistent with Bartov and
Bodnar(1994) who hypothesize that investors are unable to characterize the
relationship between the changes in the dollar and stock performance without
bias; the impact of past changes in the dollar is known only when information on
economic performance of the firm become available.
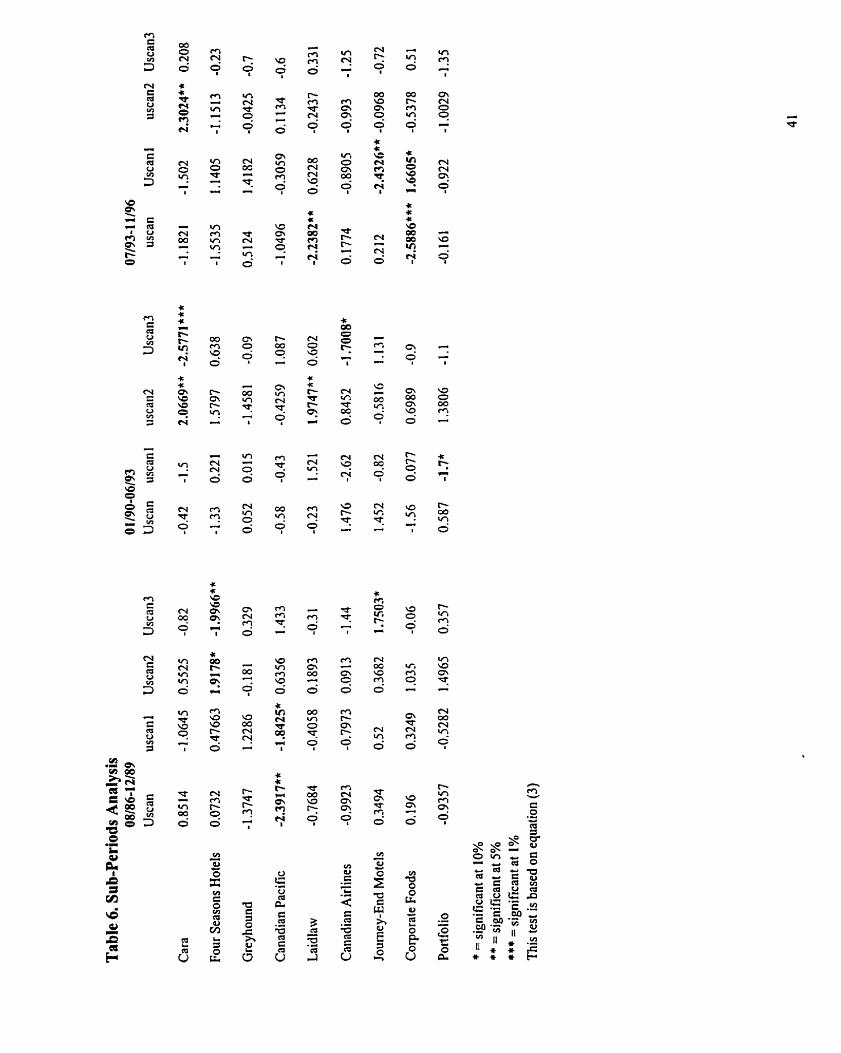
The stability of the exposure coefficients is tested because the firms might
be differently exposed from one period to the other. We use only the bilateral
exchange rate for this test. In order to do so, the sample is divided in three sub-
periods. The results of the regressions for the periods 1986 to 1989, 1990 to
1993 and 1994 to 1996 are presented in table 6. The coefficient appears to
change over tirne.
For the portfolio, none of the exchange rate variables is significant in the
first and the third sub-periods: the lagged one variable is significant at only 10%
in the second period. None of the firms has an exposure in both the first and
second sub-periods; while only two firms have changing coefficients when we
compare the second and third periods.

To better understand the relationship between exchange rates changes
and the tourism industry performance, we investigated the sensitivity of the stock
returns(individua1 firms as well as the portfolio) to the performance of the
aggregate tourism account. The logarithms of the global payments and receipts
of the Canadian tourism account as well as the lagged (one month lag) of these
variables are used as regressors. Since the payment series follows a random
walk, we only orthogonalize the receipts series (orthogonal to the exchange rate
variables).
As far as the portfolio is concerned, the payments as well as the first lag
of this variable are insignificant at conventional levels. But there is a negative
contemporaneous as well as a lagged relationship between the receipts to the
Canadian tourism account and the stock performance of the industry. The firms
are differently exposed: some of the firms are sensitive to the performance of the
international travel account of the country, while others are indifferent to it. The
results of these regressions are presented in appendix 3. It is worth noting that
we transformed the receipt and payments series from quarterly to monthly data.
This process might have altered the performance of the model.

V. Conclusion
This paper examines the sensitivity of the Canadian tourism account as
well as the industry stock performance to the fiuctuations of the Canadian dollar.
We find that an appreciation of the Canadian dollar vis a vis the Japanese Yen
has a negative effect on the cash inflows to both the global tourism account and
the account with Japan. Lagged exchange rate changes are also found to have
some predictive power. But, in contrast to previous studies. we also consider the
impact of exchange rate changes on the cash outflows of the account. We find
that the oufflows are Granger-caused by the Japanese Yen and the British
Pound. Since the two sides of the cash flows are differently affected by the
fiuctuations of the dollar, we do not know the nature of the overall impact of
currency risk on the tourism account as a whole.
To get more insight on the relationship between the exchange rate
changes and the tourism industry, we also test whether the stock performance of
tourism related firms is affected by currency risk. We measure the exchange rate
risk by using a standard two-factor market model. The model is estimated for
eight tourism related firms between august 1986 and march 1996 and for the
industry portfolio. We find that Canadian f i n s do no benefit from a depreciation
of the home currency and that lagged changes in the dollar are significant in
predicting future stock retums.

We are aware that the size of the sample is rather very small and that some firm
specific characteristics might be helpful to consider in order to detemine
currency exposure. This is an open question for future research.

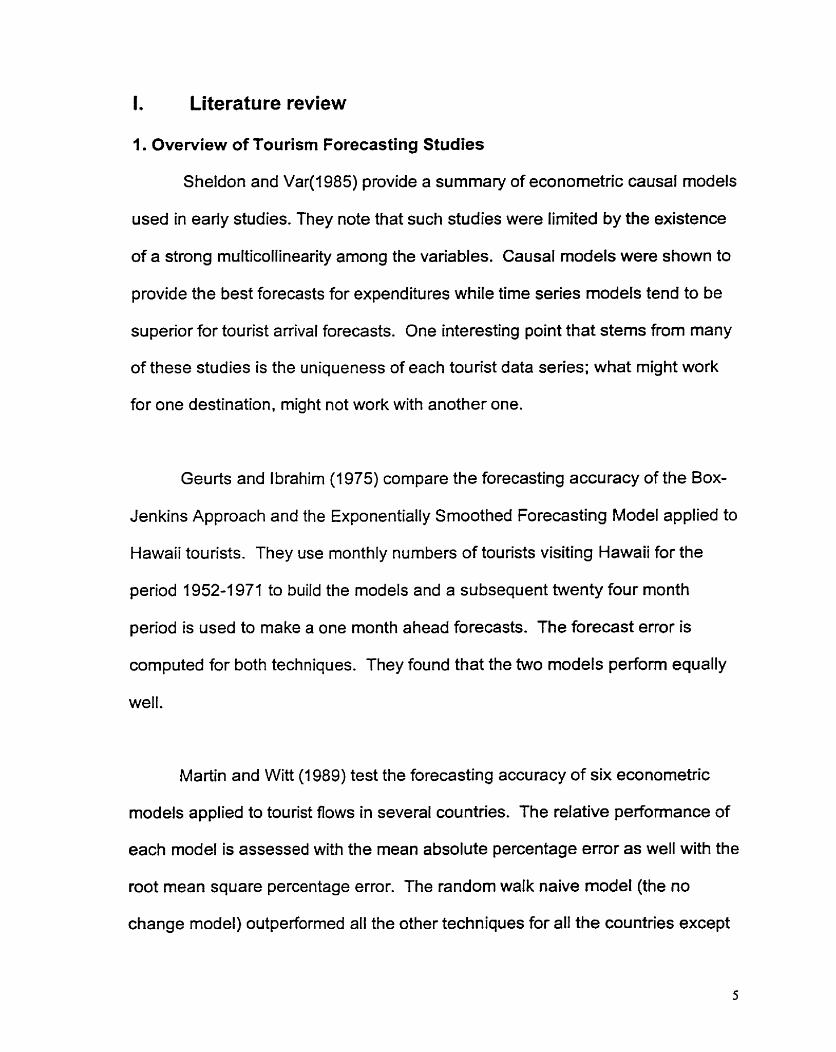
Appendix 1

Table 1. Unit Root Tests Statistics
Levels differen ces
Series PAYMENTS US UK Japan Canada
RECEIPTS US UK Japan Canada
EXCHANGE M T E S
CDNIUS dollar -0.995 1 CNDIPOUND -2.51 96 CDNNEN -0.8778
' DF and PP denote the Dickey-Fuller and Phillips-Perron t-statistics without a time trend 2 DFT and PPT denote the Dickey-Fuller and Phillips-Perron t-statistics with a time trend
TABLE 2: COlNTEGRATlON REGRESSIONS DF D FT PP PPT
CDNNEN - PaymentsIJapan -2.6301 -2.4382 -2.7001 -2.4987
CDNIUS - PaymentslCanada CDNIPOUND - PaymentslCanada CDNNEN - Payrnents /Canada
95% critical value -3.37 -3.8 -3.37 -3.8

Table 3: Granger Causality Test
Direction of causation CdnIUS PaymentslCanada
PaymentslCanada ,-> CDNIUS
Pound/CDN PaymentslCanada
PaymentslCanada PoundICDN
YenICDN -3 PayrnentslCanada
PaymentslCanada - YenlCDN
YenfCDN .-> PaymentsIJapan
Multivariate Granger Causality Test
F- statistics
P P 100,31"*
Yen , PaymentslCanada Pound
F= 174.34***


TABLE Regression Results 4.2 (log-linear)
CDNlUS CDN/US(I) POUND POUND{1} YEN Yen{l}
RECEIPT Canada
Japan
PAYMENTS US
*" slgnificant at the 1% level
' slgnificant at the 10% level
Tabtes 4.1 and 4.2 are based on equatlons (1) and (2) on page 16 In 4.1 and 4.2 the equations are estirnated in the linear and log-linear forms respectively,

Z
$ g an! v <
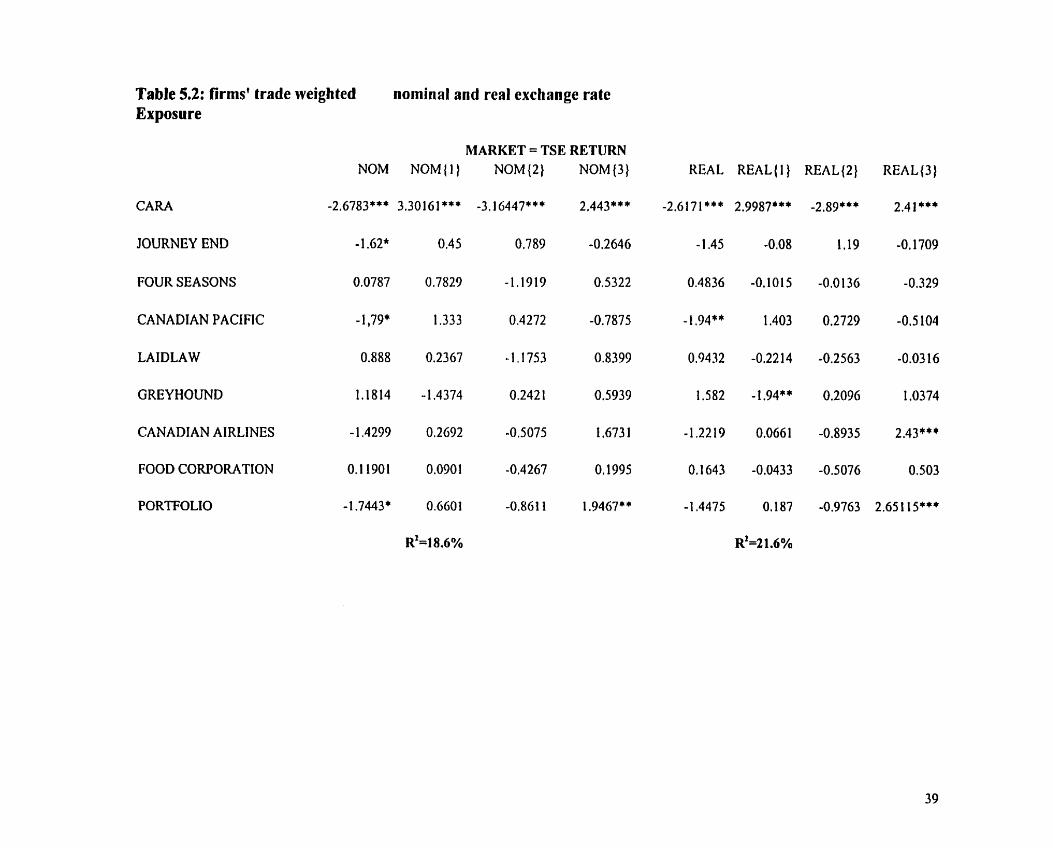
Table 5.2: firms' trade weighted nominal and real exchange rate Exposure
MARKET = TSE RETURN NOM NOM(1) NOM(2) NOM(3)
C A M -2.6783*** 3.30161 *** -3,16447*** 2.443***
JOURNEY END - 1.62* 0.45 0.789 -0.2646
FOUR SEASONS 0.0787 0.7829 -1.1919 0.5322
CANADIAN PACIFIC - 1,79* 1.333 0.4272 -0.7875
LAIDLAW 0.888 0.2367 -1,1753 0.8399
GREYHOUNI) 1.1814 -1.4374 0.242 1 0.5939
CANADIAN AIRLINES - 1.4299 0.2692 -0.5075 1.673 1
FOOD CORPORATION 0.1 1901 0.0901 -0,4267 O. 1995
PORTFOLIO -1.7443* 0.6601 -0.861 1 1.9467* *
~ ' = l 8 , 6 %
REAL REAL{]]
-2.6171*** 2.9987***
- 1.45 -0.08
0.4836 -0,lO 15
- 1.94** 1.403
0.9432 -0.22 14
1.582 -1.94**
-1.2219 0.0661
O. 1643 -0.0433
- 1.4475 O. 187
~ ' = 2 1.6%
REAL (2 1
-2.89***
1.19
-0,O 136
0.2729
-0.2563
0.2096
-0.8935
-0,5076
-0.9763

CV 'Q cri
2
iA Cr) m 9 -
1

Appendix 2
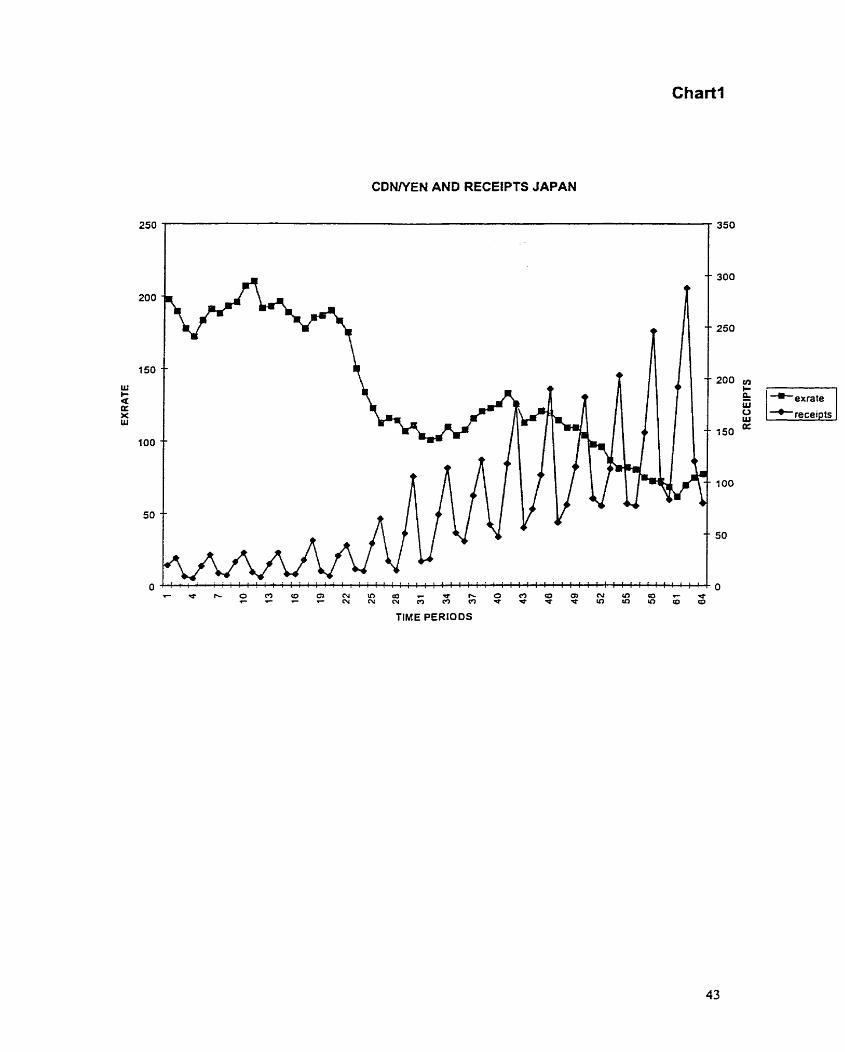
CDNNEN AND RECEIPTS JAPAN
250 1

CDNlYEN EXCHANGE RATE AND PAYMENTS TO JAPAN

CDNIPOUND EXCHANGE RATE AND PAYMENTS TO UK

CDNIPOUND EXCHANGE RATE AND PAYMENTS TO UK
+ex rate

CDNIUS DOLLAR EXCHANGE RATE AND PAYMENTS 10 THE US

CDNIUS EXCHANGE RATE AND RECEIPTS FROM THE US
3000


Al. Companies in the Sample (stock symbols in parenthesis)
Joumey's End Motels Corporation (JEM); main activities : accommodation
Cara Operations Ltd (CAO): Restauration
Four Seasons Hotels Inc. (FSH): Hotels
Laidlaw Inc (LDM):Transportation ; also organites package tours
Corporate Foods Ltd (CFL)
CP Rail (CP); owns hotels through subsidiary CP Hotels
Canadian Airlines Corporation(CA) . Air Transportation
Greyhound Canada Transportation Corp.(GHC)
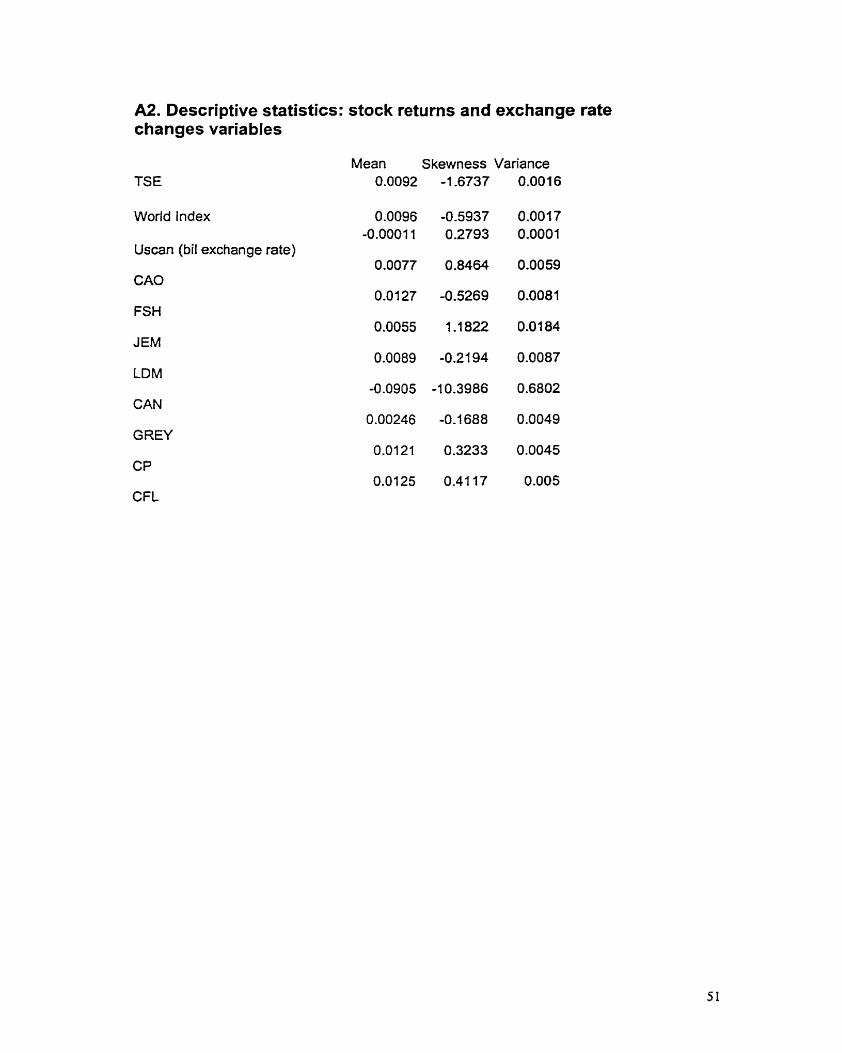
A2. Descriptive statistics: stock returns and exchange rate changes variables
Mean Skewness Variance TSE
World Index
Uscan (bil exchange rate)
CAO
FSH
JEM
LDM
CAN
GREY
CP
CFL
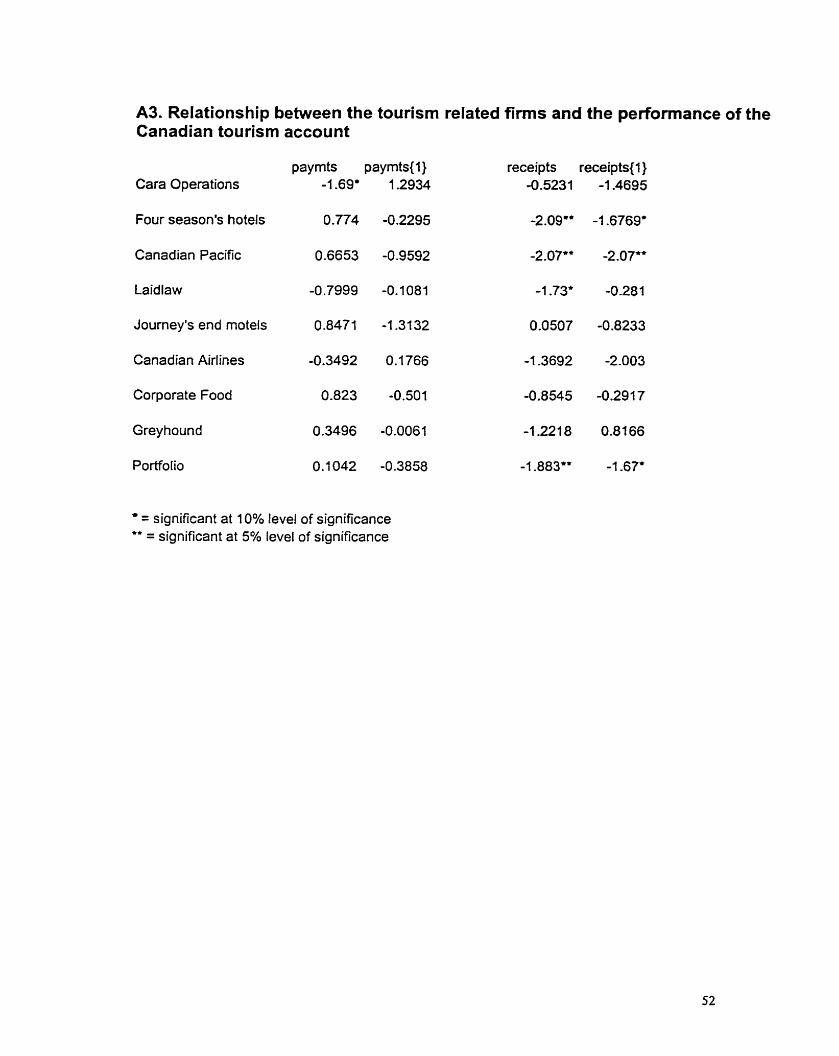
A3. Relationship between the tourism related firrns and the performance of the Canadian tourism account
paymts paymts(1) receipts receipts(1) Cara Operations
four season's hotels
Canadian Pacific
Laidlaw
Journey's end motels
Canadian Airlines
Corporate Food
Greyhound
Portfolio
= significant at 10% tevel of significance " = significant at 5% level of significance

Bibliography
Athiyaman, A. and R.W.Robertçon. "Tirne Series Forecasting Techniques: Short T e m Planning in Tourism". International Joumal of Contem~oraw Hos~italit-v Manaaement, Vo1.4(1992): 8-1 0
Bartov, E. and G. Bodnar. "Firm Valuation, Eamings Expectations and the Exchange Rate Exposure Effect". Journal of Finance , December 1994: 7755-1 786
Bodnar, G and W. Gentry. " Exchange rate Expoçure and lndustry Characteristics : Evidence from Canada , Japan and the USA". Joumal of International Monev and Finance, vol1 2 (1 993): 2945
Chadee, D and Z. Mieczkowski. " An Empirical Analysis of the Effects of the Exchange Rate on Canadian Tourism". Journal of Travel Research . Summer 1987: 13-1 7
Chan, Yiu-Man "Forecasting Tourism: A Sine Wave Tirne Series Regression Approach". Journal of Travel Research. Fall 1993: 58-60
Choi. J. and A Prasad . "Exchange risk Sensitivity and its Deterrninants : a firm and lndustry Analysis of US Multinationals". Financial Manaaement, Vol24 (1 995): 77-88
Ceglowski, J. "Dollar Depreciation and Us Industry Performance. Joumal of lnternational Mone-v and Finance, Vol 8 (1 989): 233-251
Geurts, Michael and [.B. Ibrahim. "Comparing the Box-Jenkings Approach with the Exponentially Smoothed Forecasting Model Application to Hawaii Tourists". Journal of Marketina Research, Vol 12 (1 975): 182-1 88
Fang, Hsing and Jean C.H. Loo. "Foreign Exchange Risk And Common Stock Returns: A Note on International Evidence". Journal of Business Finance and Accountinq, Vol 23(1996): 473-480
Gibbons, Jean and Mary Fish. "Devaluation and US Tourism Expenditures in Mexico". Annals of Toutkm Research. Vol 12 (1 985): 547-561
Jorion, P. "The Pricing of Exchange rate in the Stock Market". Journal of Financial and Quantitative Analvsis ",Vol 26 (1 991 ): 363-376
Loeb, Peter D. "lnternational Travel to the United States: An Econometric Evaluation".Annals of Tourism Research, Vol 9 (1 982): 7-20

Luehrman, T. A "Exchange rate changes and the distribution of Industry value" . Journal of lntemational Business Studies, 4Th Quarter (1 991 ): 6 1 9-649
Martin, Christine and Stephen Witt. " Accuracy of Econometric Forecasts of Tourisrn". Annals Tourism Research. vol 1 6 ( 1 989): 407-30
Pindyck, R.S and D.L. Rubinfeld. Economefric Models and Economic Forecast. 3rd edition, 199 1
S ha p iro. A.C. Foundations of Multinational Financial Management. znd ed ition , 1994
Sheldon, Pauline. "Forecasting Tourism: Expenditures versus Amvals". Journal of Travel Research, Summer 1993: 14-20
Sheldon, Pauline and Turgut Var. "Tourism forecasting: A Review of Empirical Research". Journal of Forecastinq, Vol 4 (1 985): 183-1 95.
Statistics Canada. "Travel between Canada and other Countries".
Qiu, Hanqin and Junsen Zhang. "Determinants of Tourist Arrivals and Expenditures In Canada", Journal of Travel Research . Fall 1995: 44-49
Witt. Stephen F. "Cash Flow Forecasting In the lntemational Tourism Industry". Advances in Financial Plannino and Forecastina. Vo14. Part Il(1990):229-244