Embed Size (px)
Citation preview

WP/07/113
Exchange Rate Fluctuations and Output in Oil-Producing Countries: The Case of Iran
Mohsen Bahmani-Oskooee and Magda Kandil


© 2007 International Monetary Fund WP/07/113 IMF Working Paper Western Hemisphere Department
Exchange Rate Fluctuations and Output in Oil-Producing Countries: The Case of Iran
Prepared by Mohsen Bahmani-Oskooee and Magda Kandil1
Authorized for Distribution by Sanjaya Panth
May 2007
Abstract
This Working Paper should not be reported as representing the views of the IMF. The views expressed in this Working Paper are those of the author(s) and do not necessarily represent those of the IMF or IMF policy. Working Papers describe research in progress by the author(s) and are published to elicit comments and to further debate.
Conventional wisdom states that currency depreciation in oil-producing countries are contractionary because demand effects, limited by the prevalence of oil exports priced in dollars, are more than offset by adverse supply effects. Iran, however, has experienced a rapid increase in non-oil exports in the last decade. Against this background, the paper tests whether the conventional wisdom still applies to Iran and concludes that the emergence of the non-oil export sector has made currency depreciation expansionary. The expansionary effect is particularly evident with respect to anticipated persistent depreciation in the long-run. Notwithstanding the varying effects of exchange rate fluctuations on the demand and supply sides of the economy, managing a flexible exchange rate gradually over time towards achieving stability in the real effective exchange rate may strike the necessary balance. JEL Classification Numbers: F41, F31, F32, F34 Keywords: Currency depreciation, non-oil exports, imported inputs Authors’ E-Mail Address: [email protected]; [email protected]
1 Mohsen Bahmani-Oskooee is the Wilmeth Professsor of Economics, University of Wisconsin-Milwaukee. Magda Kandil is a Senior Economist in Caribbean II Division of the Western Hemisphere Department. The authors would like to thank Hossein Bastanzad, Leo Bonato, Eric Clifton, Hamid Faruquee, Michael Gapen, Bassem Kamar, Leslie Lipschitz, S. Assadollah Monajemi, Hanan Morsy, Sanjaya Panth, Mounir Rached, Hossein Samiei, Miguel Savastano, Evan Tanner and seminar participants at the IMF Institute for helpful comments and suggestions.

2
Contents Page
I. Introduction ..........................................................................................................................3
II. The Model and the Method ...................................................................................................6
III.The Results............................................................................................................................9 A. Basic Model Estimation .............................................................................................10 B. Extension of Basic Models.........................................................................................17
IV. Summary and Conclusions ................................................................................................19
References................................................................................................................................29 Tables 1. Results Employing the Real Bilateral rial-dollar Exchange Rate........................................22 2. Results Employing the Nominal Bilateral rial-dollar Exchange Rate .................................23 3. Iran’s Exports to and Imports from her Major Trading Partners in 2003............................24 4. Results Employing Real and Nominal Effective Exchange Rate ........................................25 5. Results Employing Anticipated and Unanticipated Bilateral (rial/dollar) Exchange Rate ......................................................................................................................................26 6. Results Employing Anticipated and Unanticipated Real and Nominal Effective Exchange Rate .....................................................................................................................27 Figures 1. Non-oil Exports as a Percent of Total Exports (Ratio)...........................................................5 2. Plots of Various Exchange Rates..........................................................................................16 Appendix Data Definition and Sources.....................................................................................................28

3
I. INTRODUCTION
The effect of exchange rate fluctuations on real activity has been subject to an extensive debate. On the demand side, there has been a common belief that devaluation or depreciation could boost domestic production through stimulating the net export component. Additional channels on the demand side could also be responsive to fluctuations in the exchange rate. Alexander (1952) illustrates the possibility that devaluation could lower the consumption component of aggregate demand. The inflationary effect of currency devaluation redistributes income from workers to producers. Since workers are said to have a high marginal propensity to consume compared to producers, total consumption declines as a result of currency depreciation. Channels of interaction between the exchange rate and the macroeconomy are made more complicated by developments on the supply side of the economy. Since currency depreciation raises the cost of imported inputs, it contributes to an increase in the production cost and thus curtails the aggregate supply. If the reduction in aggregate supply more than offsets the increase in aggregate demand, depreciation will result in a decrease in domestic production. In this case, devaluation or depreciation is said to be contractionary. Otherwise, it could be expansionary.2 The empirical literature on the relationship between currency depreciation and real output is extensive. Different researchers have adopted different approaches. Early studies, such as Cooper (1971), Krueger (1978) and Edwards (1989a) use what is known as the “before-after approach”. These studies analyze the performance of output before and after a devaluation episode. A second group of studies compares the performance of output in a devaluing country to that of a group of countries which did not devalue. These studies are known as the group approach, which include Donovan (1982), Gylfason (1987), Kamin (1988), and Edwards (1989b). The third group includes studies that have followed a “macro-simulation approach”. More specifically, these studies assume a shock to the exchange rate and simulate a model to infer the performance of output after the shock. Examples include Agenor (1991), Krugman and Taylor (1978), Gylfason and Shmid (1983), Gylfason and Risager (1984), Solimano (1986), Barbone and Rivera-Batiz (1987) and Taye (1999). The last group of studies analyzes the relationship between output and exchange rate fluctuations using various econometric estimation techniques. Inference is based on various data structures that include cross-sectional data (e.g., Connolly 1983), panel data (e.g., Edwards 1989a, Nunnenkamp and Schweickert 1990, and Agenor 1991) and time-series data (e.g., Rogers and Wang 1995; Hoffmaister and Vegh 1996; Santaella and Vela 1996; Kamin and Rogers 1997; Bahmani-Oskooee and Mirzaie 2000; Bahmani-Oskooee and Anker 2001; Kandil 2000; Bahmani-Oskooee, Chomsisengphet, and Kandil 2002; Kandil and Mirzaie 2002; Kandil 2004; and Kandil and Mirzaie 2003, 2005).3 2 For a discussion of choices of exchange rate regimes with respect to demand and supply shocks impinging on the economic system, see Beidas and Kandil (2005).
3 For a comprehensive review of all the studies mentioned as well as other literature, see Bahmani-Oskooee and Miteza (2003).

4
The bulk of the research has considered the impact of the exchange rate on output in nonoil producing countries. Oil producing countries, especially members of the OPEC, have been excluded in this regard. The presumption is that oil dominates the output supply. Capacity constraints and/or international coordination may dominate decisions regarding oil exports. Oil is priced in foreign currency (e.g., U.S. dollars). Moreover, many of the oil-producing countries have a pegged exchange rate system to stabilize the domestic proceeds of oil exports. Therefore, oil exports could not respond to a change in the exchange rate. While decisions to produce and export oil are not likely to vary with fluctuations in the exchange rate, the supply side of oil-producing countries may further react to fluctuations in the exchange rate. Aggregate supply could decline because of an increase in the cost of imported inputs due to a depreciation of the domestic currency. Bahmani-Oskooee (1996), who considered the experience of Iran, demonstrated empirically that in an oil-producing country depreciation could be contractionary, despite dominant oil exports over the sample period 1959–1990. More recently, however, Iran has taken serious steps to diversify and promote nonoil exports. Nonoil exports, as a percent of total exports, was little over 3% when the Iranian revolution took place in 1979. This percent has smoothly increased over time and in 2000, the last year for which data are available, non-oil exports stood at almost 27% of total exports. We suspect that this ratio has increased to, perhaps, 40% in more recent years.4
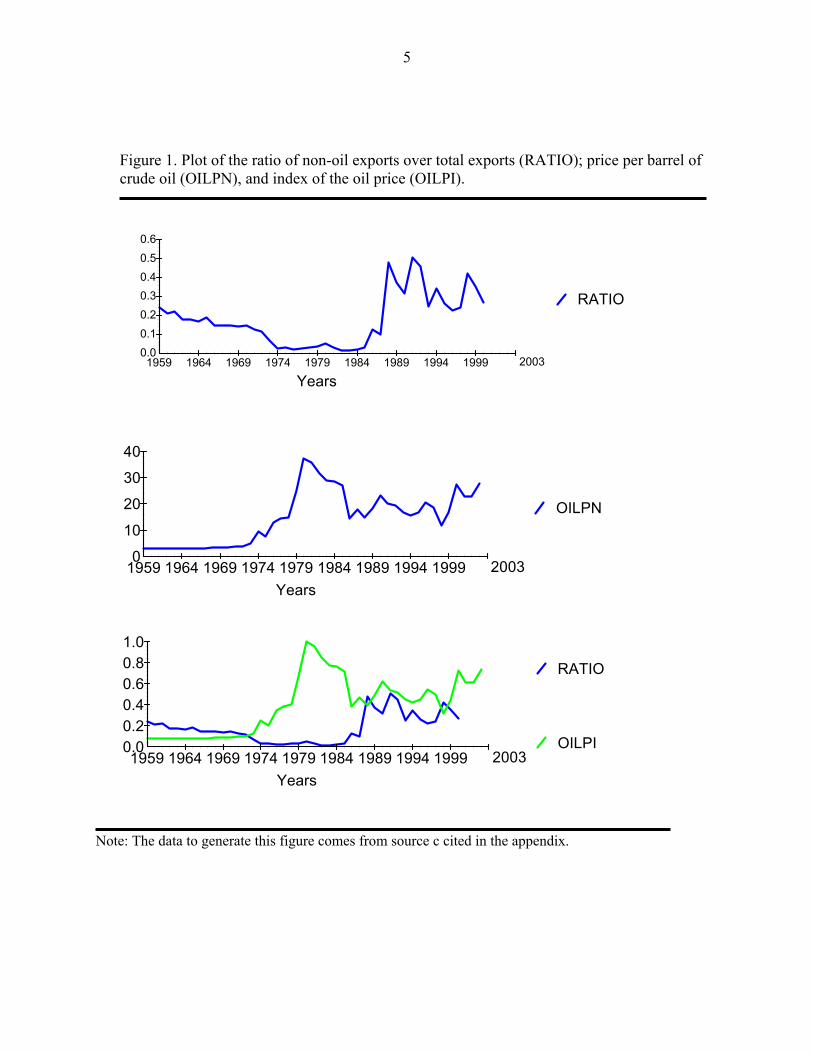
To get some insight into the trend we plot the ratio of nonoil exports to total exports in Figure 1. To determine whether changes in oil prices have played any role, we also plot the price per barrel of crude oil. Furthermore, for ease of exposure, we set the oil price in index form ranging from zero to one and plot the two variables together in one graph. In Figure 1, there is a clear evidence of an increase in the relative importance of non-oil exports to total exports.
The ratio of non-oil exports to total exports increased rapidly in the mid eighties, during the war with Iraq, largely as a result of government investment in “strategic” sectors, including petrochemical industry. As of today, petrochemical exports from state-owned enterprises account for a large share of non-oil exports. The surge in non-oil exports/total exports does not appear to be dependent on the oil price.5 We believe that non-oil exports have gained more dominance in Iran in the last decade. Our research will test empirically the validity of this hypothesis.
4 In addition to petrochemical products, the list of nonoil exports includes carpets, fresh and dried fruits, pistachio, raisins, all kinds of skin and leather, caviar, casings, gum tragacanth, cumin, cotton, metallic mineral ores, detergents and soaps, chemical products, footwear, ready-made clothes, fabric, cement, stones and construction materials, transportation vehicles and their spare parts, aluminum and articles thereof, copper and copper bar, cast iron, iron and steel, and others.
5 The correlation coefficient between the ratio of nonoil exports to total exports and the oil price is negative, -0.09, although statistically insignificant.
5
Figure 1. Plot of the ratio of non-oil exports over total exports (RATIO); price per barrel of crude oil (OILPN), and index of the oil price (OILPI).
RATIO
Years
0.00.10.20.30.40.50.6
1959 1964 1969 1974 1979 1984 1989 1994 1999 2003
OILPN
Years
0
10
20
30
40
1959 1964 1969 1974 1979 1984 1989 1994 1999 2003
RATIO
OILPI
Years
0.00.20.40.60.81.0
1959 1964 1969 1974 1979 1984 1989 1994 1999 2003
Note: The data to generate this figure comes from source c cited in the appendix.

6
As can be seen from Figure 1, Iran’s recent emphasis on non-oil exports has gained momentum mostly during the 1990s.6 The surge in non-oil exports has introduced a new dimension through which a depreciation of the Iranian rial may prove expansionary. On the demand side, a depreciation of the rial may boost competitiveness and the demand for nonoil exports. On the supply side, a depreciation of the Iranian rial may stimulate an increase in the production of non-oil exports, as producers aim to capitalize on additional profits in domestic currency. The aim of this study is to contrast the effects of exchange rate fluctuations on real output growth in Iran over two sample periods: a period that excludes the recent surge in non-oil exports and the longer sample period, including the 1990s. The objective is to contrast contractionary and expansionary effects of exchange rate fluctuations over the two sample periods. To this end, Section II describes the estimation method. Section III presents the empirical results and section IV concludes. Data definition and sources are cited in the appendix.
II. THE MODEL AND THE METHOD
To motivate the empirical analysis, we draw on the theoretical predictions of the model in Kandil and Mirzaie (2002). In brief, the demand side of the economy is specified using standard IS-LM equations with a modification for an open economy. Real consumption expenditure varies positively with real disposable income. Real investment expenditure varies negatively with the real interest rate. The exchange rate measures the degree of competitiveness of foreign produced goods and services relative to those produced domestically. Real exports are related to an autonomous element which rises when the income level abroad rises and to relative prices. When the foreign price is higher relative to domestic goods, exports will increase. Real imports are assumed to rise with the level of real income and to decrease with the foreign price relative to domestic goods. Real government spending is assumed to be exogenous. The total expenditure by domestic residents in real terms is the sum of real consumption expenditure, real investment, real government spending and net exports. Substituting all equations into the equilibrium condition for the goods market results in the expression for real income. It is a function of the exchange rate, the domestic price level, the foreign price level, and the domestic interest rate. This expression is the IS equation which describes the relationship between real income and the real interest rate. Equilibrium in the money market is obtained by equating the demand and supply of real money balances. The real money supply is determined by nominal balances deflated by price. The demand for real money balances is positively related to real income and inversely related to the nominal interest rate, the sum of the real interest rate and inflationary expectation. It is assumed that citizens in each country must hold domestic money for transaction purposes but they may speculate by holding foreign currency. An unexpected temporary depreciation of the domestic currency would lead to speculation of future appreciation to restore the steady state normal trend of the exchange rate. Consequently, agents increase the speculative demand for domestic 6 The data for total exports and nonoil exports are nominal. Data are not available for the specific deflator of nonoil exports compared to total exports.
7
currency, establishing a positive relationship between the demand for real money balances and agents’ expectation of the price of the domestic currency relative to its current value. The LM equation is determined by the equilibrium condition in the money market. It establishes a positive relationship between real income and the real interest rate. Solving for the interest rate from the LM equation and substituting the result into the IS equation results in the equation for aggregate demand. On the supply side, output is produced using a production function that combines labor, capital, and imported intermediate goods. The demand for labor varies negatively with the real wage and positively with imported intermediate goods. Similarly, the demand for imported intermediate goods increases with the labor input. When the currency depreciates (or is devalued), it is more expensive to buy intermediate goods from abroad, decreasing the demand for these goods. The supply of labor increases with the increase in the nominal wage relative to workers’ expected price. The nominal wage solution is obtained by equating labor demand and supply. Substituting the nominal wage into labor demand results in the solutions for employment and imported intermediate goods. Substituting these solutions into the production function results in the specification for aggregate supply of domestic value added. Aggregate supply has a direct positive relationship with output price surprises. Workers decide on labor supply based on their expectation of the aggregate price level. An increase in aggregate price, relative to workers’ expectations, increases the demand for labor and, hence, the nominal wage. A rise in expected real wage increases employment and, hence, the output supplied. In addition, aggregate supply moves negatively with the domestic price of foreign currency. Currency depreciation increases the cost of imported goods and decreases the output supplied. The combination of demand and supply channels indicates that real output depends on movements in the exchange rate, the money supply, and government spending. In the short-run, transitory exchange rate fluctuations determine competitiveness and, in turn, producers’ reaction to the change in the relative price of tradables and non-tradables. For example, a transitory currency appreciation would decrease demand for exports and increase demand for imports, decreasing supply of tradables. Nonetheless, a cheaper cost of imports may increase the output supply in the short-run. In the long-run, persistent exchange rate appreciation would necessitate a sustained adjustment in the output supply. Depending on the relative strengths of the competitiveness and cost channel, producers may increase or decrease the output supply with respect to persistent fluctuations in the exchange rate in the long-run.

8
In light of the theoretical predictions we study the impact of currency depreciation on domestic output using an empirical model that replicates the reduced-form solution of the theoretical model in Kandil and Mirzaie (2002) as follows:7
t t t t tLnGDP a bLnM cLnG dLnRE ε= + + + + ( 1 )
Ln is the natural logarithm of variables. Real output, tGDP varies with three policy variables. The log of the money supply, tM , approximates monetary policy. Fiscal policy is measured by real government spending, tG , and the real exchange rate is denoted by tRE . Other fluctuations in real output growth is measured by tξ . Positive estimates of b and c would indicate that expansionary monetary and fiscal policies could boost real output growth in the long-run. In the interest of identifying channels of interaction between the exchange rate and real output, the analysis will employ two measures of the exchange rate. The first measure is the bilateral exchange rate, which is defined as the number of Iranian rial per US dollar. Accordingly, an increase in the exchange rate measures currency depreciation. The rial has been pegged to the dollar which limits fluctuations in the real exchange rate to price movements. Given limited supply of dollar reserves, the rial-dollar bilateral exchange rate fluctuated in the parallel market relative to the official price. Fluctuations in the parallel market price capture the effects of excess demand for the dollar, relative to the limited supply. If depreciation of the rial, i.e., an increase in RE is to be expansionary, an estimate of d should be positive. Otherwise, for contractionary devaluations, an estimate of d could be negative. Reduced form models, such as equation (1) in which all variables enter in levels, are referred to as long-run models. In order to get more consistent and efficient estimates, short-run dynamics must be incorporated into the estimation procedure. The task is reduced to one of specifying (1) in an error-correction format following the suggestions of Engle and Granger (1987). In the short-run, real output growth varies with its lags and distributed lags of policy variables: the money supply, government spending, and the real exchange rate:
1 2 3
0 1 2 31 0 0
4
4 10
n n n
t k t k k t k k t kk k k
n
k t k t tk
LnGDP LnGDP LnM LnG
LnRE
α α α α
α βε ω
− − −= = =
− −=
Δ = + Δ + Δ + Δ
+ Δ + +
∑ ∑ ∑
∑ ( 2 )
7 The results are robust with respect to a modification that accounts for other variables in the model. Since we are interested in the interaction between domestic policies and the exchange rate, we prefer to report the results employing the money supply and government spending.
9
Given that real output varies with policy variables in the long-run, the gap between the two sides of (1), as measured by ε, should decrease. To capture the speed of adjustment towards equilibrium, the lagged value of tξ is included in the empirical model (2). A negative and significant coefficient for εt-1 indicates that variables are converging toward their long-run equilibrium, i.e., cointegrated (provided that all variables in the model are non-stationary). Of course, another way of establishing cointegration in this setting is to show that all variables in (1) are integrated of order one, denoted by I(1), and the residual, as a proxy for their linear combination, is integrated of order zero, I(0). In the event some variables are I(1) and some I(0), Pesaran and others (2001) propose yet another method for testing cointegration that does not require pre-unit root testing and variables could be I(1), I(0) or mutually cointegrated. They basically solve for εt-1 in (1) and substitute the result into (2). The resulting specification yields (3), as follows:
Equation (3) is somewhat different than a standard VAR model. It includes a linear combination of lagged variables themselves, rather than the lagged error term from (1). Pesaran and others (2001) propose applying the familiar F test for joint significance of the lagged level variables. If the lagged level variables are jointly significant, there is a single level relationship between the dependent variable and the independent variables (i.e., they adjust jointly towards full-equilibrium). The F test that Pesaran and others (2001) propose has new critical values that they tabulate using Monte Carlo experiment. By assuming all variables to be I(1) they provide an upper bound critical value and by assuming all variables are I(0), a lower bound critical value is provided. For cointegration, the calculated F statistic should be greater than the upper bound critical value. Once cointegration is established, the long-run effects of independent variables on the dependent variable are inferred by the size and significance of β1- β3 that is normalized by β0. The short-run effects are inferred by the size and significance of α2k – α4k.8
III. THE RESULTS
We estimate the error-correction model outlined by equation (3), using annual data.
8 This bound testing approach has a special appeal in models that include the real exchange rate. In countries where the Purchasing Power Parity (PPP) holds, the real rate is stationary or I(0) where other variables are I (1). Indeed, in the case of Iran, Bahmani-Oskooee (1993) has shown that, using the parallel exchange rate, the PPP holds, implying stationary real exchange rate.
1 2 3 4
0 1 2 3 41 0 0 0
0 1 1 1 2 1 3 1
n n n n
t k t k k t k k t k k t kk k k k
t t t t t
LnGDP LnGDP LnM LnG LnRE
LnGDP LnM LnG LnRE
α α α α α
β β β β ω
− − − −= = = =
− − − −
Δ = + Δ + Δ + Δ + Δ
+ + + + +
∑ ∑ ∑ ∑
( 3 )

10
A. Basic Model Estimation
The objective of our investigation is to analyze the effect of exchange rate fluctuations on real output growth, controlling for monetary and fiscal policies. The primary hypothesis under investigation relates to the possibility of a structural break that marks a surge in non-oil exports in early nineties. Iran has maintained a formal peg of the rial to the dollar. Nonetheless, fluctuations in the exchange rate can be captured by two measures. First, in the parallel market the rial-dollar value deviated from the official rate in response to supply and demand pressures. In addition, fluctuations in the real effective exchange rate developed in response to fluctuations in the rial value relative to currencies (other than the U.S. dollar) of major trading partners. In the shorter sample period, 1959–90, the export sector in Iran was dominated by oil exports. Over this sample period, fluctuations in the exchange rate, regardless of its measure, is not likely to have affected the export sector significantly. Oil exports are mostly determined by capacity constraints and/or the central government’s decisions regarding oil production in the context of international coordination. Nonetheless, currency depreciation could have resulted in an increase in the cost of intermediate imports, shrinking the output supply and contracting output growth. As Iran’s exports have become more diversified, currency depreciation over the longer sample period, 1959–2003, is likely to have increased incentives to promote and produce non-oil exports. Before embarking on the estimation, a number of decisions have to be finalized. First, is the selection of the optimal lag length in (3). Given the limited number of observations using annual data, we impose a maximum of four lags on each first differenced variable and rely on the Akiake Information Criterion (AIC). Second, we test for cointegration, without invoking the requirement that all variables in the model are non-stationary. Specifically, we test for the joint significance of lagged level variables in (3) by carrying out the F test. We do this using the optimum number of lags on each first-differenced variable. We estimate the empirical model in (3) using several variants.9 We estimate each variant over the short sample period that ends in 1990 and the longer sample period through 2003. The evidence will contrast the effects of the exchange rate on real output growth before and after the surge in non-oil exports. Depreciation in Real Parallel Exchange Rate
9 Following Bahmani-Oskooee (1996) a dummy variable is included in the model to account for the effect of the Islamic revolution in 1979. It takes a value of zero before 1979 and one thereafter. It was excluded if it did not carry a significant coefficient.

11
Table 1 reports the results of estimating the model using the real value of the dollar in rial terms in the parallel market. An increase in this exchange rate indicates depreciation of the rial relative to the dollar. Fluctuations in this exchange rate are likely to affect producers’ decisions to export and import in Iran. External demand is not likely to vary with fluctuations in the parallel market. Panel A presents estimates of short-term dynamics. Monetary growth stimulates real output growth in the short-run. The evidence is supported over the short and long sample periods. Government spending is a major determinant of short-term fluctuations in real output growth in both periods. This evidence attests to the success of monetary and fiscal policies in determining real output growth in Iran in the short-run. Moreover, the positive significant effect supports the procyclical nature of fiscal policy in Iran. Large swings in the oil price determine fluctuations in oil reserves and budgetary resources in the short-run, which coincide with cyclical episodes of economic booms and recessions. In the short-run, fluctuations in the real parallel price of the U.S. dollar are insignificant on real growth in the sample period 1959–90. Over the longer sample period, 1959–2003, depreciation shrinks real output growth, as evident by the negative and significant coefficient. Transitory currency depreciation increases the cost of imports and shrinks the output supply. Accordingly, the cost channel dominates in guiding suppliers decisions with respect to currency depreciation in the short-run. The long-run estimates reported in Panel B support the central theme of the paper. While the real exchange rate carries an insignificant coefficient in the sample period 1959–90, it carries a positive and highly significant coefficient during the period 1959–2003. In the long-run, as producers anticipate sustained real depreciation and an increase in profits in domestic currency, they have higher incentives to produce and promote non-oil exports, resulting in a long-lasting increase in output growth.10 In Panel C, the F-statistic exceeds the upper bound critical value. Hence, cointegration among the variables is supported over the 1959–90 sample period and the extended sample period, 1959–2003. There is a common stochastic trend, implying close coordination between monetary, fiscal and the exchange rate policy in the long-run. To establish robustness, we use the long-run coefficient estimates from panel B to form a lagged error-correction term, ECMt-1. Having replaced the linear combination of the lagged level variables in equation (3) by ECMt-1, we re-estimate the model, imposing the optimal number of lags. A significantly negative coefficient for ECMt-1 provides additional and stronger support for cointegration.11 The ECMt-1 in Panel C carries a significant negative coefficient only during the
10 The estimated negative intercept in Table 1 (-7.3) indicates that, absent other factors in the empirical model, real output growth would have been negative. This evidence supports the role of stabilization policies (monetary, fiscal and the exchange rate) to stimulate real output growth. Moreover, exchange rate depreciation had a positive effect, which sustained real growth in the long-run.
11 See, for example, Bahmani-Oskooee and Ardalani (2006). Note that the negative and significant coefficient obtained for ECMt-1 is also indicative of the exogeniety of the right-hand side variables in the
(Continued)

12
extended period 1959-2003. Consistent with the evidence in Panel B over the period 1959–2003, the unique significance of the exchange rate effect in the long-run implies significant adjustment towards full-equilibrium in Panel C. Depreciation in Nominal Parallel Exchange Rate Two factors underlie movements in the exchange rate in Table 1: the nominal price of the dollar relative to rial in the parallel market and inflation in Iran relative to the U.S. For policy consideration, however, fluctuations in the parallel market rate provide an important signal. It measures pressures on the rial value relative to the dollar, in response to supply and demand pressures in the parallel market, compared to the official pegged rate. Interventions by the central bank in the foreign exchange market often target deviations in the parallel market relative to the official rate. More recently, the Iranian central bank has unified the official and the free parallel market rate and has followed a strategy of gradual depreciation vis-à-vis the US dollar.12 To isolate the signal effect attributed to fluctuations in the parallel market on real activity, we employ the nominal rial-dollar parallel rate (NE) in equation (3) and carry out the same analysis. The results are in Table 2. In Panel A, fluctuations in fiscal and monetary policy determine real output growth significantly in the short run, attesting to the procyclical nature of these policies. Depreciation of the rial relative to the dollar in the parallel market has a positive expansionary effect on real output growth. Transitory currency depreciation increases incentives to produce and promote non-oil exports in the short-run. This evidence is robust in the short sample period, 1959–1990, and in the longer sample period, 1959–2003. In panel B, over the longer sample period 1959–2003, both fiscal and monetary policies carry their expected positive signs and are all highly significant.13 Having isolated the exchange rate measure from inflation in Table 2, fiscal and monetary expansions induce long-lasting real effects on real output growth. model. However, it is still possible to have feedback effect between dependent and independent variables. Bahmani-Oskooee and Tanku (2006, p. 261) have argued that the issue cannot be too serious mostly because lagged values in the model could be considered as instruments for current values.
12 Since 2002, the exchange rate regime is characterized by a defacto crawling peg. For more on the foreign exchange policy in Iran see Bahmani-Oskooee (2005).
13 The positive effect of monetary policy on output growth in the long-run indicates rigidity in wage and/or price adjustment in the long-run. Institutional rigidity may have interfered with nominal adjustment, necessitating that output growth absorbs the effects of monetary policy in the long-run. Furthermore, the non-neutral effects of monetary and fiscal policy indicate the relevance of oil resources to sustaining real growth in Iran. Oil resources contribute to foreign reserves and monetary expansion. Moreover, these resources support government spending on infrastructure and investment, which are evident to be an important source of real growth in the long-run.

13
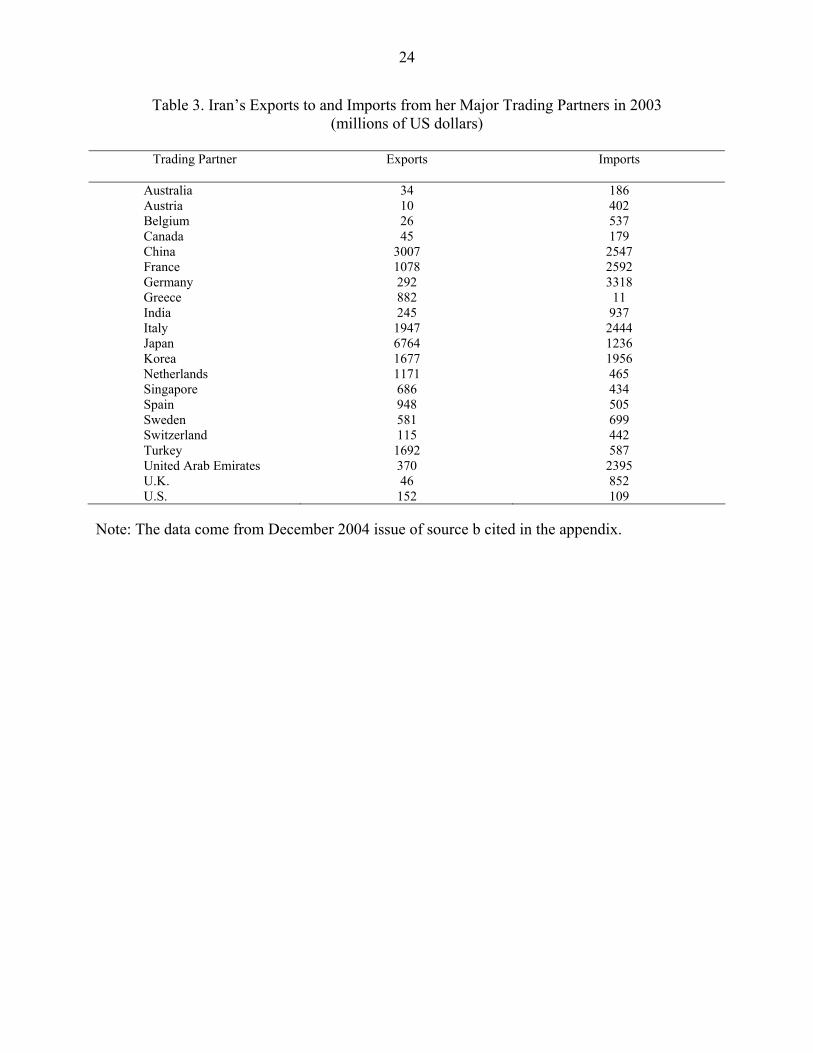
Consistent with the evidence in Table 1, the nominal exchange rate does not determine real output growth significantly in the long-run during the 1959–1990 period. In contrast, it carries a positive and highly significant coefficient for the period 1959–2003. Hence, the positive expansionary effect of persistent exchange rate depreciation on output growth is attributed to pressure on the exchange rate value in the parallel market, independently of the relative price channel. Depreciation increases incentives to gear production towards promoting non-oil exports. Through this channel, persistent depreciation has a long-lasting significant effect in the longer sample period that accounts for the surge in non-oil exports. Appreciation in the Effective Exchange Rate Historically, the dollar has served as a major reserve currency in Iran and the rial-dollar rate was the most dominant exchange rate in Iran’s trade with the rest of the world. However, since the advent of the Islamic revolution in 1979, the share of trade with the United States has shrunk over time. Indeed, trade shares with countries like China and Japan have gone up over time. Table 3 reports 21 major trading partners of Iran whose trade constitutes almost 70% of Iranian Trade. Fluctuations in the effective exchange rate capture the composite effects of bilateral exchange rate fluctuations with major trading partners. While the central bank may devalue the rial against a major currency, like the U.S. dollar, the rial may gain against the currency of another trading partner if Iran’s exports to that partner exceed her imports. To incorporate fluctuations of the rial against currencies of all trading partners, we investigate the impact of the real and nominal effective exchange rates on domestic output. To that end, we construct the real effective exchange rate following the formulation by Bahmani-Oskooee (1995), as outlined in identity (4) below:
( 4 )
Where λj is the total trade share (exports plus imports) of trading partner j such that ∑λj = 1. Note that in (4), Ej is the nominal bilateral exchange rate defined as the number of units of j’s currency per Iranian rial; Pi is the price level in Iran and Pj is the price level in trading partner j. Identity (4) basically amounts to taking a weighted average of the 21 real bilateral exchange rates. Given the definition of Ej, an increase in REFEC will reflect a real appreciation of the rial. The nominal effective exchange rate (NEFEC) is constructed in the same manner, omitting the price levels
21
12000
.( )[ 100].( )
i Jt
jt j
i jJ
j
P EP
REFEC xP EP
λ=
=∑

14
from the formula. Due to the lack of CPI data for some trading partners, the effective rates are constructed only for the 1966–2003 period.14
In contrast to the parallel market value of the US dollar, the effective exchange rate is a better measure to assess the impact of relative competitiveness on the demand for net exports.15 In addition, suppliers maybe inclined to take fluctuations in the effective exchange rate into consideration to calculate profits and the cost of imports into the production function. Having employed the effective exchange rate in (3), we report the estimation results from the optimal models in Table 4 for the sample period 1966–2003. If a depreciation of the rial (nominal or real), i.e., a reduction in the real or nominal effective rate is to be expansionary, the estimate of β3 normalized on β0 must be negative. The results establish the superiority of the effective exchange rate, relative to the parallel market rate, to determine fluctuations in real output growth in Iran. Almost all of the estimated coefficients in Table 4 are significant. In Panel A, significant coefficients for the lagged values of real output growth indicates high degree of persistence. Both monetary and fiscal policies are important determinants of fluctuations in real output growth, attesting to the significance of procyclical policies in the short-run. Appreciation of the effective exchange rate has an expansionary effect on real output growth in the short-run, as evident by the positive significant coefficient. Transitory currency appreciation stimulates growth via a cheaper cost of intermediate imports in the short-run. This channel dominates the negative effect of currency appreciation on competitiveness and, therefore, real growth in the short-run. The long-run evidence in Panel B, indicates the long-run significant effects of government spending on real growth, which is robust regardless of the exchange rate measure. More importantly for our purpose, an appreciation in the effective exchange rate is contractionary in the long-run. This is evident by the negative and significant coefficient measuring the effects of the effective exchange rate, both nominal and real, on real output growth.16 In contrast to the
14 Given the maximum lag structure in the model estimation (four lags), the effective period for estimation is 1970–2003. Hence, it was not possible to truncate the sample period into pre- and post-1990 periods, using the effective exchange rate.
15 Fluctuations in the parallel rial-dollar exchange rate are likely to be determining supply decisions.This is because the domestic value of exports varies with this value. It is unlikely that fluctuations in this exchange rate will affect the demand side, as exports are recorded according to the official rate in the world market.
16 The nominal effective exchange rate is measured such that an increase indicates appreciation. An appreciation has a negative significant effect on real growth, which supports the negative impact of exchange rate appreciation on nonoil exports. The bilateral exchange rate is measured such that an increase indicates depreciation. The positive sign indicates that depreciation stimulates incentives to produce nonoil exports. Hence, the evidence is consistent for both measures of the exchange rate.

15
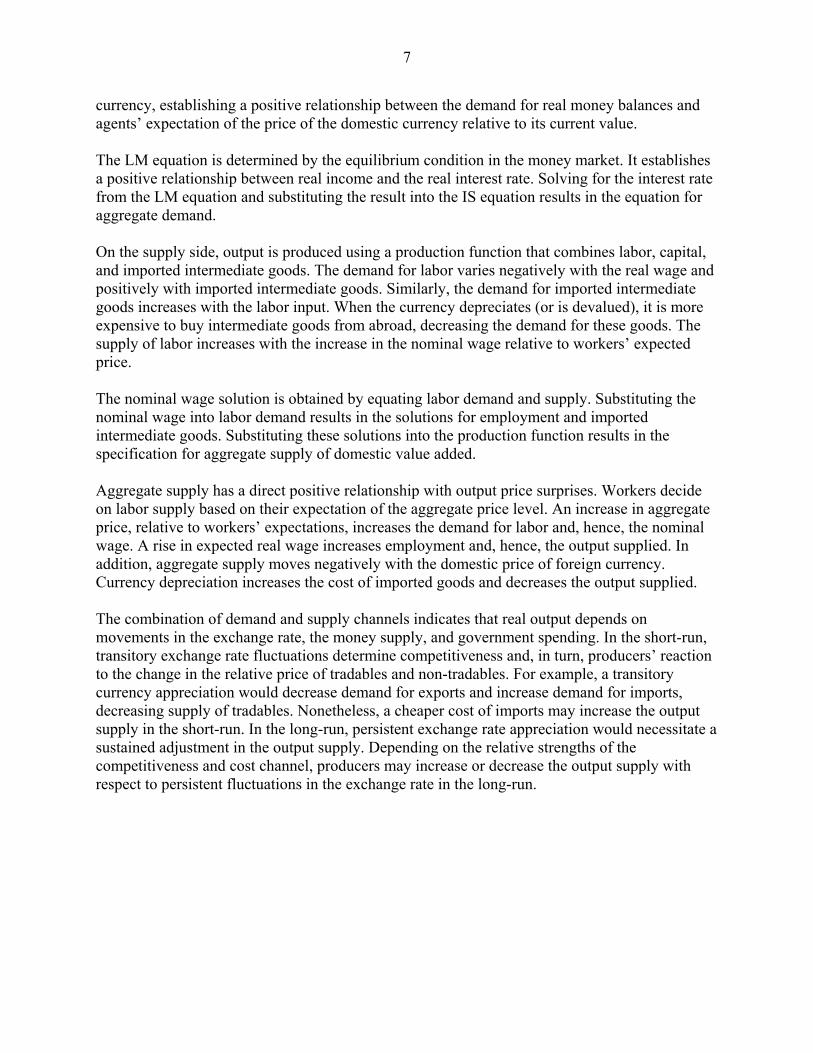
short-run evidence, persistent currency appreciation decreases competitiveness and incentives to export in the long-run. This channel dominates the effect of currency appreciation on the cost of production, resulting in a decrease in real growth in the long-run. While the money supply is insignificant in determining real output growth in the long-run when the real effective exchange rate is used, it is highly significant when the nominal rate is used. Fluctuations in the real effective exchange rate capture the price channel that varies with monetary growth in the long-run. In panel C, cointegration is confirmed. The F test values exceed the upper bound using both nominal and real effective exchange rates. Consistently, the coefficients of the error correction term, ECMt-1, are significant in both models.17 Clearly, the evidence attests to the importance of exchange rate fluctuations that have gained more importance with the surge in non-oil exports in the nineties. To get additional insights of underlying fluctuations in the exchange rate, we plot the four measures of the exchange rate under investigation in Figure 2. The advent of the Islamic revolution in 1979 marks a break point in the four measures of exchange rate. The evidence, however, does not support a significant structural break in the nineties. Hence, the varying effects of the exchange rate on output growth in the longer sample period are primarily the result of a structural break in the export composition towards more non-oil exports in the nineties.
17 Using the nominal effective exchange rate, the coefficient of the error correction term, -1.62, indicates faster adjustment to full-equilibrium. In contrast to the evidence using the real effective exchange rate, real growth would have converged more quickly towards full-equilibrium. The speed of adjustment, albeit unrealistic, describes convergence towards full-equilibrium under a hypothetical scenario that leaves out inflation.

16
Figure 2: Plots of log of real effective exchange rate (LREFEC); nominal effective rate (LNEFEC), real rial-dollar rate (LREX); and nominal rial-dollar rate (LNEX).
LREFEC
Years
4.04.55.05.56.06.5
1966 1971 1976 1981 1986 1991 1996 2001 2003
LNEFEC
Years
456789
10
1966 1971 1976 1981 1986 1991 1996 2001 2003
LREX
Years
7.07.58.08.59.09.5
1966 1971 1976 1981 1986 1991 1996 2001 2003
LNEX
Years
456789
10
1966 1971 1976 1981 1986 1991 1996 2001 2003

17
B. Extension of Basic Models
The previous analysis clearly distinguishes between the effects on output growth of transitory fluctuations in the exchange rate in the short-run, compared to persistent fluctuations in the long-run. To further identify channels of interaction between these fluctuations and the macroeconomy, we proceed with an extension that distinguishes between anticipated and unanticipated fluctuations in the exchange rate. In the real world, stochastic uncertainty may arise on the demand or supply sides of the economy. Economic agents are assumed to be rational. Following the detailed theoretical model outlined in Kandil and Mirzaie (2002), exchange rate fluctuations are realized around a steady-state trend that is consistent with variation in macroeconomic fundamentals over time. Uncertainty enters the model in the form of disturbances to both aggregate demand and aggregate supply. Within this framework, aggregate demand is affected by currency depreciation through exports, imports, and the demand for domestic currency, and aggregate supply is affected through the cost of imported intermediate goods. On the supply side, output varies with anticipated changes in the exchange rate. Through the cost channel, when producers anticipate currency depreciation (appreciation), it is more (less) expensive to buy intermediate goods from abroad. Hence, anticipated currency depreciation (appreciation) is likely to shrink (expand) the output supplied, raising (decreasing) the price level. Through the profit channel, anticipated depreciation (appreciation) is likely to boost (decrease) competitiveness, stimulate (slow) external demand, and increase (decrease) the domestic value of exports. The result is an expansion (contraction) in the output supplied. The relative effects of both channels will determine the response of the output supplied to the anticipated currency depreciation (appreciation). Similarly, the combination of demand and supply channels indicates that real output depends on unanticipated movement in the exchange rate. In the goods market, an unexpected depreciation (appreciation) will make exports less (more) expensive and imports more (less) expensive. As a result, competitiveness increases (decreases) foreign demand for domestic products and decreases (increases) domestic demand of imports, increasing (decreasing) output. On the supply side, an unanticipated depreciation (appreciation) increases (decreases) the cost of imported intermediate goods, decreasing (increasing) domestic output. The observed effects of exchange rate fluctuations on real output growth maybe differentiated according to expectations. Significant effects of anticipated exchange rate fluctuations would signal to policy makers the importance of managing agents’ forecasts over time. Significant effects of random unanticipated exchange rate fluctuations would warrant a speedy policy intervention to reduce uncertainty. Anticipation of Depreciation in the Parallel Market We decompose the change in the rial/dollar parallel exchange rate into anticipated and unanticipated components. In Table 5, we report the results using each component, applying this

18
decomposition to each of the real and nominal rial/dollar parallel exchange rate over the sample period 1959–2003.18 The evidence, in general, supports the role of anticipated exchange rate movements in determining real output growth. In Panel A, the significant effects of procyclical policies remain robust in the short-run. Interestingly, however, significant fluctuations in real growth are attributed only to the anticipated component of exchange rate movements. In the short-run, anticipated depreciation in the parallel exchange rate increases incentives to produce non-oil exports, and increase real output growth. Random unanticipated fluctuations in the exchange rate dissipate quickly with no significant effects on real growth in the short-run. In panel B, the evidence remains robust regarding the positive effects of monetary and fiscal policies on real output growth in the long-run. Anticipated depreciation (both real and nominal), an increase in the rial/dollar exchange rate, has a positive significant effect on output in the long run. Consistent with the supply-side channel, anticipated persistent depreciation of the rial value in the parallel market increases anticipated profit in the export sector and stimulates output growth. Consistently, the error correction term, in Panel C, is negative and significant, indicating a tendency for output, along with independent regressors, to adjust jointly towards full-equilibrium. In contrast, unanticipated exchange rate shocks do not exhibit a long lasting effect on output growth. As shocks dissipate quickly, they do not contribute with a permanent increase in output growth. Consistent with theory’s predictions, conflicting channels on the demand and supply sides render the effects of unanticipated depreciation of the rial/dollar parallel exchange rate insignificant on output growth in the short-run.19 Anticipation of Appreciation in the Effective Exchange Rate Similar results arise in an extension that tests the effects of anticipation on the interaction between real output growth and the real effective exchange rate. In Table 6, we employ the anticipated and unanticipated components of the real and nominal effective exchange rates into the empirical model (3) over the sample period 1966–2003. 18 In generating the anticipated exchange rate we assume that expectations are adaptive and they depend on the past behavior of the exchange rate with more weights assigned to the recent past and less weights to the distant past. To capture this notion, we regress the exchange rate on four lags and use the fitted values as the anticipated component and the residuals as the unanticipated component. This is applied to the real or nominal rial-dollar rate as well as the real or nominal effective exchange rate. Since lagged variables of other explanatory variables are also included in the regression to perform the upper-bound F-test, it is not possible to invoke a rational expectation assumption in forecasting the exchange rate to avoid multicollineraity between the anticipated exchange rate and other regressors in the model. 19 In light of institutional rigidity, the large long-run impact of monetary policy reflects the cumulative short-run effects that build up in the long run, as nominal rigidity persists. This evidence is unique in the model with unanticipated exchange rate shocks, indicating high correlation between the anticipated exchange rate and the growth of the money supply.

19
The results, in general, support the aforementioned implications. In Panel A, the effects of procyclical policies, both fiscal and monetary, are significant on real output growth in the short-run. An increase in the anticipated effective exchange rate, an anticipated currency appreciation, stimulates real output growth in the short-run, although with a lag. The evidence, which is robust for nominal and real effective exchange rates, indicates the effect of anticipated appreciation in decreasing the cost of imported inputs and increasing output growth. In contrast, unanticipated currency fluctuations dissipate quickly, with no significant effect on real output growth in the short-run. In Panel B, significant effects of fiscal and monetary policies are evident on real output growth in the long-run. The results are unique in the model specification employing anticipated nominal effective exchange rate.20In contrast to the short-run evidence, anticipated persistent currency appreciation decreases real output growth significantly in the long-run. As appreciation persists over time, anticipated appreciation prompts decisions to shrink the output supply in light of concerns about deteriorating competitiveness. Consistently, the error correction term, in Panel C, is significant, indicating output moves closely with the right-hand side variables, including persistent anticipated appreciation of the exchange rate, towards full equilibrium. Unanticipated transitory appreciation of the effective exchange rate, both nominal and real, is insignificant in the long run. Consistent with the cyclical nature of these shocks, they do not produce a long-lasting effect and, hence, do not contribute to the output adjustment towards full-equilibrium.
IV. SUMMARY AND CONCLUSIONS
Using annual data for Iran between 1959 and 2003, the analysis has focused on the effects of currency fluctuations on output growth over time. Previous studies have ruled out the expansionary effect of currency depreciation in Iran. Since the rial is pegged to the dollar and oil is priced in dollar, a depreciation of the rial does not affect export competitiveness. To the contrary, depreciation increases the cost of imported inputs, forcing a contraction in the output supply. Over time, Iran has expanded its non-oil export sector, which appears to have picked up in the nineties. This diversification has renewed interest to study the effect of exchange rate depreciation on the economy. To detect the possibility of a structural break in the nineties, the empirical investigation studies the effects of exchange rate fluctuations over the sample period through 2003 and a truncated sample period that ends in 1990.
Employing a new test for cointegration, we test the existence of a single level relationship, without invoking any prior test, i.e., assuming the series are stationary, non-stationary, or mutually co-integrated. Prior to the surge in nonoil exports, 1959–1990, there is no evidence of cointegration between output growth and the parallel rial-dollar exchange rate, both real and nominal. In contrast, over an extended sample period, 1959–2003, there is a strong evidence of 20 This evidence indicates high correlation between fiscal and monetary variables and the price level, embedded in the real effective exchange rate.

20
cointegration. Further, in support of export competitiveness in the longer sample, currency depreciation has a positive expansionary effect on output growth, both in the short and in the long run. A reduction in the rial value relative to the dollar in the parallel market increases export proceeds in domestic currency, stimulating an increase in the supply of non-oil exports. The aforementioned evidence is robust to variation in the exchange rate measurement. Using real and nominal measures of the effective exchange rate, currency appreciation is contractionary in the long run and expansionary in the short-run. The latter channel supports the effects of currency appreciation in reducing the cost of imports and expanding the output supplied in the short-run. In the long run, however, currency appreciation decreases demand, forcing a long-lasting output contraction. The demand channel is more responsive to fluctuations in the real effective exchange rate, as opposed to the rial-dollar parallel market rate which influences domestic suppliers’ decisions. Interactions between the exchange rate and real activity may vary with agents’ forecasts. Recent theoretical developments have differentiated the effects of exchange rate movements on demand and supply, based on agents’ forecasts. To further elaborate on the channels governing demand and supply adjustments, we decompose movements in the exchange rate into anticipated and unanticipated components. Theory predicts a more dominant effect of anticipated exchange rate movements on the supply side of the economy. In contrast, unanticipated exchange rate shocks determine both demand and supply decisions. Using the rial-dollar parallel exchange rate and the effective exchange rate, the evidence differentiates the effects of anticipated and unanticipated exchange rate movements. Anticipated rial-dollar depreciation increases the output supply, which is significant on output growth in the short- and long-run. Consistently, anticipated effective exchange rate appreciation decreases the output supply in the long run. Deteriorating competitiveness is a dominant factor that gauges suppliers’ decisions, resulting in a reduction in output growth with respect to anticipated currency appreciation in the long-run. Regardless of the exchange rate measure, unanticipated exchange rate shocks are insignificant in determining real output growth, both in the short and in the long run. Consistent with theory’s prediction, conflicting channels on the demand and supply sides render the effects of these shocks insignificant on output growth in the short-run. Moreover, shocks disappear over time, canceling their effects on the output adjustment towards full-equilibrium in the long run. Overall, the evidence supports the importance of exchange rate fluctuations to output growth in Iran, both in the short- and in the long-run. Attesting to the country’s success in diversifying its export base, fluctuations in the exchange rate have determined demand competitiveness and suppliers’ decisions over the long sample period that accounts for the surge in non-oil exports in the nineties. For policy implications, the evidence points to the need to maintain a higher degree of flexibility in managing the exchange rate, as oil-producing economies take serious steps towards diversifying their export base. The recent surge in the oil price has demonstrated the inflationary risk of accumulated reserves under a pegged exchange rate. Exchange rate flexibility does not

21
necessarily imply abandoning the peg in favor of a floating exchange rate. To the contrary, countries in transition need to manage the exchange rate mindful the implications of changes in the exchange rate on the demand and supply sides of the economy, both in the short- and long-run. While some trade-off might be necessary, managing a flexible exchange rate gradually over time towards achieving stability in the real effective exchange rate may strike the necessary balance.

22
Table 1. Results Employing the Real Bilateral rial-dollar Exchange Rate
Study Period: 1959–90
Study Period: 1959–2003
A. Short-Run Estimates ∆Ln GDPt-1 0.06 (0.32) ∆Ln GDPt-2 -0.42 (2.09) ∆Ln GDPt-3 ∆Ln Mt 1.12 (2.53) 0.98 (4.27) ∆Ln Mt-1 0.55 (2.03) 0.21 (1.02) ∆Ln Mt-2 -0.23 (0.88) 0.29 (1.28) ∆Ln Mt-3 0.43 (1.51) ∆Ln Gt 0.35 (2.17) 0.37 (3.32) ∆Ln Gt-1 0.27 (1.22) -0.03 (0.22) ∆Ln Gt-2 0.57 (3.28) 0.33 (2.61) ∆Ln Gt-3 0.23 (1.50) ∆Ln REt -0.04 (0.75) 0.11 (1.35) ∆Ln REt-1 0.11 (0.69) -0.13 (1.96) ∆Ln REt-2 0.24 (1.59) ∆Ln REt-3 0.33 (3.64) B. Long-Run Estimates
Constant 10.54 (0.33) -7.32 (1.95) Ln M 14.59 (0.31) 0.71 (1.61) Ln G -13.01 (0.29) 0.22 (0.56) Ln RE -3.23 (0.29) 1.05 (2.51) C. Diagnostics
Adjusted R2 0.91 0.72 F 4.57 3.67 ECMt-1 -0.07 (0.33) -0.24 (2.79) Note: a. Numbers inside the parentheses are absolute value of the t-ratios. b. The upper bound critical value of the F-test at 5% level of significance is 4.01. The comparable figure at the 10% level is 3.52. These come from Pesaran and others (2001, Table CI(iii)-Case III, p. 300).

23
Table 2. Results Employing the Nominal Bilateral rial-dollar Exchange Rate
Study Period: 1959-1990
Study Period: 1959-2003
A. Short-Run Estimates ∆Ln GDPt-1 -0.29 (1.15) 0.36 (2.43) ∆Ln GDPt-2 ∆Ln GDPt-3 ∆Ln Mt 1.07 (2.56) 0.66 (3.87) ∆Ln Mt-1 0.11 (0.39) ∆Ln Mt-2 -0.47 (1.89) ∆Ln Mt-3 ∆Ln Gt 0.34 (1.69) 0.38 (4.51) ∆Ln Gt-1 0.89 (2.73) -0.13 (1.31) ∆Ln Gt-2 0.85 (3.72) 0.19 (2.74) ∆Ln Gt-3 0.45 (2.71) ∆Ln NEt -0.12 (1.21) 0.08 (4.21) ∆Ln NEt-1 0.31 (2.53) ∆Ln NEt-2 0.40 (3.13) ∆Ln NEt-3 0.44 (5.11) B. Long-Run Estimates
Constant 5.62 (1.03) 1.85 (7.60) Ln M -11.60 (0.80) 0.49 (3.90) Ln G 11.42 (0.85) 0.27 (2.35) Ln NE 2.50 (0.89) 0.15 (8.55) C. Diagnostics
Adjusted R2 0.92 0.78 F 5.54 6.90 ECMt-1 0.14 (0.68) -0.58 (4.69) Note: a. Numbers inside the parentheses are absolute value of the t-ratios. b. The upper bound critical value of the F-test at 5% level of significance is 4.01. The comparable figure at the 10% level is 3.52. These come from Pesaran and others (2001, Table CI(iii)-Case III, p. 300).
24
Table 3. Iran’s Exports to and Imports from her Major Trading Partners in 2003 (millions of US dollars)
Trading Partner Exports Imports
Australia 34 186 Austria 10 402 Belgium 26 537 Canada 45 179 China 3007 2547 France 1078 2592 Germany 292 3318 Greece 882 11 India 245 937 Italy 1947 2444 Japan 6764 1236 Korea 1677 1956 Netherlands 1171 465 Singapore 686 434 Spain 948 505 Sweden 581 699 Switzerland 115 442 Turkey 1692 587 United Arab Emirates 370 2395 U.K. 46 852 U.S. 152 109
Note: The data come from December 2004 issue of source b cited in the appendix.

25
Table 4. Results Employing Real and Nominal Effective Exchange Rate
EX=Real Effective Rate
EX=Nominal Effective Rate
A. Short-Run Estimates ∆Ln GDPt-1 0.22 (1.22) 0.98 (6.02) ∆Ln GDPt-2 -0.49 (2.60) 0.47 (5.00) ∆Ln GDPt-3 -0.21 (1.41) 0.35 (4.00) ∆Ln Mt 1.31 (5.37) 0.57 (8.25) ∆Ln Mt-1 1.16 (4.15) ∆Ln Mt-2 1.19 (4.12) ∆Ln Mt-3 1.17 (3.39) ∆Ln Gt 0.17 (1.54) 0.45 (7.07) ∆Ln Gt-1 -0.41 (2.69) -0.46 (4.58) ∆Ln Gt-2 0.24 (1.98) ∆Ln Gt-3 ∆Ln EXt -0.17 (2.45) -0.09 (2.34) ∆Ln EXt-1 0.63 (5.26) 0.06 (1.43) ∆Ln EXt-2 0.36 (3.84) ∆Ln EXt-3 0.17 (2.38) B. Long-Run Estimates
Constant 10.83 (6.50) 3.56 (24.6) Ln M -0.11 (0.67) 0.35 (10.5) Ln G 0.57 (4.71) 0.47 (16.9) Ln EX -1.19 (5.69) -0.13 (25.4) C. Diagnostics
Adjusted R2 0.84 0.90 F 10.33 19.62 ECMt-1 -0.63 (4.45) -1.62 (9.46) Note: a. Numbers inside the parentheses are absolute value of the t-ratios. b. The upper bound critical value of the F-test at 5% level of significance is 4.01. The comparable figure at the 10% level is 3.52. These come from Pesaran and others (2001, Table CI(iii)-Case III, p. 300). .

26
Table 5. Results Employing Anticipated and Unanticipated Bilateral (rial/dollar) Exchange Rate
EX = Anticipated
Real Bilateral Rate
EX = Unanticipated Real Bilateral Rate
EX = Anticipated Nominal
Bilateral Rate
EX = Unanticipated Nominal Bilateral Rate
A. Short-Run Estimates ∆Ln GDPt-1 ∆Ln GDPt-2 ∆Ln GDPt-3 ∆Ln Mt 0.91 (4.25) 0.78 (3.64) 0.83 (4.65) 0.77 (3.53) ∆Ln Mt-1 0.28 (1.33) 0.34 (2.04) ∆Ln Mt-2 ∆Ln Mt-3 ∆Ln Gt 0.36 (3.50) 0.36 (3.36) 0.44 (4.87) 0.36 (3.40) ∆Ln Gt-1 -0.05 (0.53) 0.02 (0.22) 0.02 (0.29) 0.02 (0.27) ∆Ln Gt-2 0.18 (1.97) 0.18 (1.88) 0.22 (2.94) 0.18 (1.96) ∆Ln Gt-3 0.13 (1.36) 0.20 (2.42) ∆Ln EXt 0.13 (2.22) -0.04 (0.59) 0.08 (4.20) -0.04 (0.58) ∆Ln EXt-1 ∆Ln EXt-2 ∆Ln EXt-3 B. Long-Run Estimates
Constant -3.36 (1.51) 0.08 (0.04) 1.60 (7.05) 0.06 (0.03) Ln M 0.85 (1.94) 1.83 (1.73) 0.54 (4.92) 1.81 (1.72) Ln G -0.001 (0.01) -0.88 (0.80) 0.27 (2.45) -0.84 (0.78) Ln EX 0.59 (2.04) -0.31 (0.58) 0.12 (8.25) -0.30 (0.56) C. Diagnostics
Adjusted R2 0.71 0.67 0.80 0.67 F 4.38 2.83 7.67 2.87 ECMt-1 -0.22 (2.31) -0.11 (1.30) -0.66 (4.57) -0.11 (1.31) Note: a. Numbers inside the parentheses are absolute value of the t-ratios. b. The upper bound critical value of the F-test at 5% level of significance is 4.01. The comparable figure at the 10% level is 3.52. These come from Pesaran and others (2001, Table CI(iii)-Case III, p. 300).

27
Table 6. Results Employing Anticipated and Unanticipated Real and Nominal Effective Exchange Rate
EX = Anticipated
Real Effective Exchange Rate
EX = Unanticipated Real Effective Exchange Rate
EX = Anticipated Nominal Effective
Exchange Rate
EX = Unanticipated Nominal Effective Exchange Rate
A. Short-Run Estimates ∆Ln GDPt-1 -0.25 (1.34) 0.27 (1.66) ∆Ln GDPt-2 -0.48 (2.42) ∆Ln GDPt-3 -0.59 (2.32) ∆Ln Mt 1.09 (4.50) 0.64 (2.79) 0.67 (3.29) 0.62 (2.65) ∆Ln Mt-1 1.44 (3.93) 0.39 (2.08) ∆Ln Mt-2 0.84 (2.79) 0.14 (0.75) ∆Ln Mt-3 0.44 (2.22) ∆Ln Gt 0.31 (2.52) 0.40 (3.18) 0.34 (3.03) 0.40 (3.17) ∆Ln Gt-1 -0.14 (1.04) -0.16 (1.65) ∆Ln Gt-2 0.29 (2.34) 0.20 (2.68) ∆Ln Gt-3 0.29 (1.94) 0.15 (1.83) ∆Ln EXt -0.10 (1.28) 0.04 (0.55) -0.01 (0.27) 0.03 (0.43) ∆Ln EXt-1 0.42 (3.66) 0.12 (2.03) ∆Ln EXt-2 ∆Ln EXt-3 B. Long-Run Estimates
Constant 10.71 (4.05) 0.51 (0.04) 4.76 (6.91) 0.61 (0.04) Ln M 0.16 (0.85) 2.49 (0.58) 0.29 (3.62) 2.84 (0.46) Ln G 0.31 (1.54) -1.68 (0.30) 0.33 (3.96) -2.11 (0.26) Ln EX -1.25 (4.52) 0.78 (0.40) -0.14 (9.37) 0.71 (0.30) C. Diagnostics
Adjusted R2 0.84 0.63 0.85 0.64 F 10.77 1.09 8.42 1.06 ECMt-1 -0.53 (3.63) -0.05 (0.43) -1.02 (5.34) -0.04 (0.35) Note: a. Numbers inside the parentheses are absolute value of the t-ratios. b. The upper bound critical value of the F-test at 5% level of significance is 4.01. The comparable figure at the 10% level is 3.52. These come from Pesaran and others (2001, Table CI(iii)-Case III, p. 300).
28 APPENDIX I
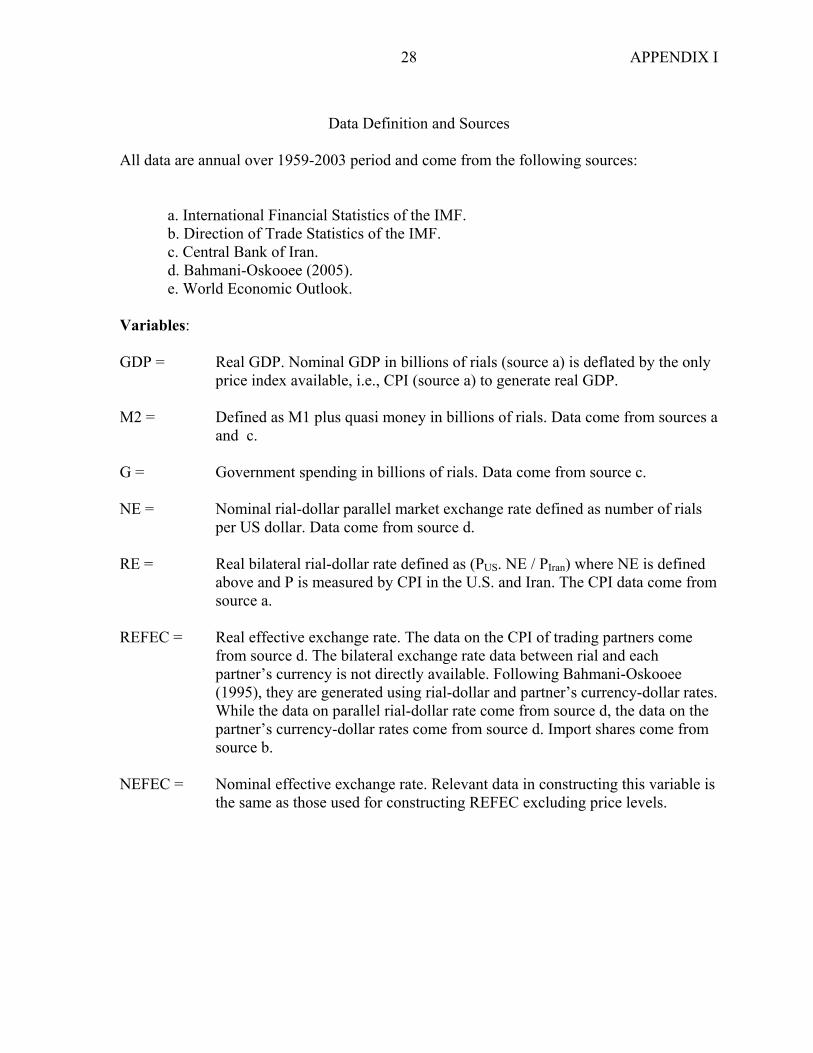
Data Definition and Sources
All data are annual over 1959-2003 period and come from the following sources: a. International Financial Statistics of the IMF.
b. Direction of Trade Statistics of the IMF. c. Central Bank of Iran. d. Bahmani-Oskooee (2005).
e. World Economic Outlook. Variables: GDP = Real GDP. Nominal GDP in billions of rials (source a) is deflated by the only price index available, i.e., CPI (source a) to generate real GDP. M2 = Defined as M1 plus quasi money in billions of rials. Data come from sources a and c. G = Government spending in billions of rials. Data come from source c. NE = Nominal rial-dollar parallel market exchange rate defined as number of rials per US dollar. Data come from source d. RE = Real bilateral rial-dollar rate defined as (PUS. NE / PIran) where NE is defined above and P is measured by CPI in the U.S. and Iran. The CPI data come from source a. REFEC = Real effective exchange rate. The data on the CPI of trading partners come from source d. The bilateral exchange rate data between rial and each partner’s currency is not directly available. Following Bahmani-Oskooee (1995), they are generated using rial-dollar and partner’s currency-dollar rates. While the data on parallel rial-dollar rate come from source d, the data on the partner’s currency-dollar rates come from source d. Import shares come from source b. NEFEC = Nominal effective exchange rate. Relevant data in constructing this variable is the same as those used for constructing REFEC excluding price levels.

29
REFERENCES Agenor, P.R., 1991, “Output, Devaluation, and the Real Exchange Rate in Developing
Countries,” Weltwirtschaftliches Archive, Vol. 127, pp. 18–41.
Alexander, S. S., 1952, “Effects of a Devaluation on a Trade Balance,” IMF Staff Papers, Vol. 2, pp. 263–278. (Washington: International Monetary Fund)
Bahmani-Oskooee, M., 1993, "Black Market Exchange Rates vs. Official Exchange Rates in
Testing PPP: An Examination of the Iranian Rial," Applied Economics, Vol. 25, pp. 465–472.
_______, 1995, "Real and Nominal Effective Exchange Rates for 22 LDCs: 1971I–1990 IV,"
Applied Economics, Vol. 27, pp. 591–604. _______, 1996, “Source of Stagflation in an Oil-Exporting Country: Evidence from Iran,”
Journal of Post Keynesian Economics, Vol. 18, pp. 609–620. _______, 2005, “History of the Rial and Foreign Exchange Policy in Iran,” Iranian Economic
Review, Vol. 10, pp. 1-20. Bahmani-Oskooee, M., and Mirzaie A., 2000, “The Long-run Effects of Depreciation of the
Dollar on Sectoral Output,” International Economic Journal, Vol. 14, pp. 51–61. Bahmani-Oskooee, M., and P. Anker, 2001, “On the Relationship between the Value of the
Mark and German Production,” Applied Economics, Vol. 33, pp. 1525–1530. Bahmani-Oskooee, M., and I. Miteza, 2003, “Are Devaluations Expansionary or
Contractionary? A Survey Article,” Economic Issues, Vol. 8, pp. 1–28. Bahmani-Oskooee, M., and Goswami, G., 2004, “Exchange Rate Sensitivity of Japan’s
Bilateral Trade Flows Japan and the World Economy,” Vol. 16, pp. 1–15. Bahmani-Oskooee, M. and Ardalani, Z., 2006, “Exchange Rate Sensitivity of U.S. Trade Flows:
Evidence from Industry Data,” Southern Economic Journal, Vol. 72, pp. 542-559. Bahmani-Oskooee, M., Chomsisengphet S., and Kandil M., 2002, “Are Devaluations
Contractionary in Asia?” Journal of Post Keynesian Economics, Vol. 25, pp. 69–81. Barbone, L., and Rivera-Batiz F., 1987, “Foreign Capital and the Contractionary Impact of
Currency Devaluation, with an application to Jamaica,” Journal of Development Economics, Vol. 26, pp. 1–15.
30
Beidas, S., and M. Kandil, 2005, “Setting the Stage for a National Currency in the West Bank and Gaza: The Choice of Exchange Rate Regime,” IMF Working Paper, WP/05/70 (Washington: International Monetary Fund)
Connolly, M., 1983, “Exchange Rates, Real Economic Activity and the Balance of
Payments: Evidence from the 1960s,” In: Classen, E and Salin, P. (Eds.), Recent Issues in the Theory of the Flexible Exchange Rate, Elsevier, Amsterdam, pp. 129–143.
Cooper, R. N., 1971, “Currency Devaluation in Developing Countries,” In: Ranis, G. (ed.),
Government and Economic Development, (New Haven: Yale University Press). Donovan, D. J., 1982, “Macroeconomic Performance and Adjustment under Fund-supported
Programs: The Experience of the Seventies,” IMF Staff Papers, Vol. 29, pp. 171–203 (Washington: International Monetary Fund).
Edwards, S., 1989a, “Real Exchange Rates, Devaluation, and Adjustment” (Cambridge, MA.:
MIT Press) _______, 1989b “Exchange Controls, Devaluations, and Real Exchange Rates: The Latin
American Experience,” Economic Development and Cultural Change, Vol. 37, pp. 457–494.
Engle, R.F,. and C.W.J. Granger, 1987, “Co-integration and Error Correction: Representation,
Estimation, and Testing,” Econometrica, Vol. 55, pp. 251–276. Gylfason, T., 1987, “Credit Policy and Economic Activity in Developing Countries with IMF
Stabilization Programs,” Princeton Studies in International Finance, No.60, Princeton. _______, and Risager, O., 1984, “Does Devaluation Improve the Current Account?,” European
Economic Review, Vol. 25, pp. 37–64. Gylfason, and Schmid, M., 1983, “Does Devaluation Cause Stagflation?” The Canadian
Journal of Economics, Vol. 25, pp. 37–64. Hoffmaister, A. W., and Végh, C.A., 1996, “Disinflation and the Recession-now-versus
Recession-later Hypothesis: Evidence from Uruguay,” IMF Staff Papers, Vol. 43, pp. 355–394 (Washington: International Monetary Fund).
Kamin, S. B., 1988, “Devaluation, External Balance, and Macroeconomic Performance in
Developing Countries: A Look at the numbers,” Princeton Essays in International Finance No. 62.

31
_______, and Rogers, J. H., 1997: “Output and the Real Exchange Rate in Developing Countries: An Application to Mexico,” International Finance Discussion Paper No. 580, Board of Governors of the Federal Reserve System (Washington, D.C.).
Kandil, M., 2000. “The Asymmetric Effects of Exchange Rate Fluctuations: Theory and
Evidence from Developing Countries," IMF Working Paper, WP/00/184 (Washington: International Monetary Fund).
_______, 2004, “Exchange Rate Fluctuations and Economic Activity in Developing
Countries: Theory and Evidence," Journal of Economic Development," Vol. 29, pp. 85–108.
Kandil, M., and Mirzaie, A., 2002, “Exchange Rate Fluctuations and Disaggregated
Economic Activity in the US: Theory and Evidence”, Journal of International Money and Finance, Vol. 21, pp. 1–31.
_______, 2003, “The Effects of Dollar Appreciation on Sectoral Labor Market Adjustments:
Theory and Evidence," The Quarterly Review of Economics and Finance, Vol. 43, pp. 89–117.
_______, 2005, “The Effects of Exchange Rate Fluctuations on Output and Prices: Evidence
from Developing Countries," Journal of Developing Areas, Vol. 38, pp. 189–219. Krueger, A., 1978, Foreign Trade Regimes and Economic Development: Liberalization
Attempts and Consequences, (Cambridge, M.A.: Ballinger) Krugman, P., and Taylor, L., 1978, “Contractionary Effects of Devaluation”, Journal of
International Economics, Vol. 8, pp. 445–456. Nunnenkamp, P., and Schweickert, R., 1990, “Adjustment Policies and Economic Growth in
Developing Countries – Is Devaluation Contractionary?” Weltwirtschaftliches Archive, Vol. 126, pp. 474–493.
Pesaran, M., Shin, Y., and R. Smith, 2001, “Bound Testing Approaches to the Analysis of
Level Relationships”. Journal of Applied Econometrics, Vol. 16, pp. 289–326. Rogers, J. H, and Wang, P., 1995, “Output, Inflation and Stabilization in a Small Open
Economy: Evidence from Mexico”, Journal of Development Economics, Vol. 46, pp. 271–93.
Santaella, J. A, and Vela A. E., 1996, “The 1987 Mexican Disinflation Program: An Exchange
Rate-based Stabilization?” IMF Working Paper, No. 24 (Washington: International Monetary Fund).

32
Solimano, A., 1986, “Contractionary Devaluation in the Southern Cone: The Case of Chile”, Journal of Development Economics, Vol. 23, pp. 135–151.
Taye, H. K., 1999, “The Impact of Devaluation on Macroeconomic Performance: The case of
Ethiopia”, Journal of Policy Modeling, Vol. 21, pp. 481–496.