Embed Size (px)
Citation preview

18 June 2020 Corporate Relationship Department Company Code - 524000 BSE Limited 25th Floor, P.J. Towers, Dalal Street, Fort, Mumbai – 400 001 The Manager Symbol - MAGMA Listing Department, National Stock Exchange of India Limited “Exchange Plaza” Bandra- Kurla Complex, Bandra (E), Mumbai – 400 051
Sub: Investors/Analysts’ Presentation Ref: Regulation 30 of the Securities and Exchange Board of India (Listing Obligations and Disclosure Requirements) Regulations, 2015 (Listing Regulations) Dear Sir, Pursuant to Regulation 30 of the Listing Regulations we are enclosing herewith the presentation to be made to the Investors/Analysts on the Audited Financial Results of the Company for the fourth quarter and financial year ended 31 March 2020.
The presentation is also being uploaded on the website of the Company at the URL https://magma.co.in/about-us/investor-relations/financial-results/investor-presentation/ in accordance with Regulation 46 of the Listing Regulations. Kindly take the same on record
Thanking you,
Yours faithfully,
Encl:as above

TOWARDS A ROBUST, SUSTAINABLE AND PROFITABLE GROWTH
Magma Fincorp LimitedInvestor Presentation – Q4 & FY20

Company Overview
Financial Performance – Q4 & FY20
Business Strategy
Business enablers to drive sustainable growth
Leadership Team & Shareholding Structure
Annexures
1
2
3
4
5
6
Note: We have used various abbreviations, nomenclature, financial & non-financial ratios in this presentation. These may differ from the customaryor industry practices and some of the products / geographical breakup are on best estimate basis. Please refer to the Glossary in this presentationfor the definition or description of such abbreviations, nomenclature, financial & non-financial ratios.
2

COMPANY
OVERVIEW
3

Company into 32nd year of retail
Financing business
AUM1 – ₹ 16,134 Crore
Evenly spread across India
North 37%, East 20%
West 18%, South 25%
Diversified product portfolio
Asset-backed finance (Cars, CV, CE,
Used Assets, Agri Finance), SME
Finance, Affordable Housing Finance
and General Insurance
Strong technology platform systems
& processes
Robust risk management framework
~ 3 Million customers serviced
since inception
> 2 Million Active customer
Pan India presence across
21 States
1 - As on 31 March, 2020
CV- Commercial Vehicles, CE- Construction Equipment
Quick Snapshot
Strong management team with
extensive industry experience
4

Customer
Focus
Underserved
‘Rurban’ India
Taxi / Truck driver /
operators, Small
Farmers
Small trader / fleet operator,
factory / shop owner with
working capital needs
Self employed customer with
informal income sources (Home /
Car buyer)
Customers with informal
income and low eligibility
for bank loans
Recognised and
Trusted Brand in
‘Rurban’ India
Core strengths-
Widespread
presence, deep
‘Rurban’ insight,
robust technology for
faster customer
acquisition, loan
servicing and
effective cross-sell
Rurban includes Ruraland Semi-Urbanlocations
Provide Financing Solutions to Underbanked Customers in ‘Rurban’ India
5

Customer Segments Illustrative Asset Profile1
First Time
Buyers
Self Employed
Non
Professionals
Small &
Medium
Entrepreneurs
Limited
banking /
credit
history
Average
Ticket
Size
(Rs lakh)
Average
Loan to
Value
Ratio
Average
Tenure
(months)
ABF: Commercial
Finance24-6 75-80% 40-45
ABF: Agri
Finance33-4 65-70% 45-50
SME Finance4 17-20 NA 30-35
AHF: Affordable
Housing Finance59-13 50-60% 150-180
General
Insurance
Focus on Higher Cross-Selling of Products for Deep Customer Engagement
1. Numbers indicative of disbursements done during FY20
2. Commercial Finance includes trucks, construction equipment, cars, auto lease
3. Agri Finance includes Tractors
4. SME Finance includes Unsecured Loans to Business Enterprises
5. Affordable Housing Finance includes Home Loans and Loan against property
6

ABF AUM1: ₹ 10,395 crs
Total
AUM1:
16,134 Cr.
SME Finance AUM1: ₹ 1,859 crs
Zone-wise Breakup
Rural-Urban Breakup
Diverse Product Offerings
AHF* AUM1: ₹ 3,880 crs
Well diversified portfolio across segment & geography
South, 25%
North, 37%
East, 20%
West, 18%
Rural, 25%
Semi Urban, 43%
Urban, 32%
1 - As of 31st March, 2020; 2- For FY20
* Split between MFL (₹ 597 crs) and MHF (₹ 3,283 crs)
General Insurance
GWP2 :₹ 1,294 crs
7

Wide retail presence through hub and spoke model
Delhi, 6
Uttarakhand, 3
Uttar Pradesh, 40
Bihar, 18
Jharkhand, 8
West Bengal,18
Chhattisgarh,17
Odisha, 15
Telangana, 10
Andhra Pradesh,17
Puducherry, 1
Tamil Nadu, 10
Himachal Pradesh,3
Punjab, 9
Haryana,19
Rajasthan,26
Gujarat,18
Madhya Pradesh,25
Maharashtra, 33
Karnataka, 16
Kerala,15
Wide retail presence through hub and spoke model
Digital footprint enables Field Executives to conduct
business from channel/customer locations, leading
to better sales productivity, deepens market
coverage and improves channel and customer
experience
Strong customer engagement through large team
of Field Executives
Toll free Inbound/Outbound Customer Call Centre
for servicing and cross sell
Extensive Pan India Network
8
327 Branches as on 31st March, 2020Asset Light Branch Network

INTEGRITYDo the right thing
COLLABORATIONInvite ideas and inspiration
from all
RESPECTTreat pepole
equally
Magma Culture Code
9

FinancialPerformance– Q4 & FY20
10

Liquidity crisis in financial services sector since Sep-18 resulted in broader economic slowdown impacting all sections of
economy, however government interventions improved the liquidity scenario in Q3FY20.
Unprecedented prolonged lockdown in times of COVID-19 impacted entire world economy; India’s GDP is estimated to
contract 3.2%-5% in FY21.
Lock down has severely impacted MSME segment, barring few sectors like Health care, FMCG, Allied Agri etc.
Surge in unemployment numbers, leading to uncertainty of income, will slowdown consumption.
Restart of economic activity after a prolonged lockdown, under fear of COVID-19, is very challenging.
Government schemes to recuperate Indian economy, under ‘Atmanirbhar Bharat’, Liquidity measures to MSME like ECLGS,
Sub-debt for Stressed MSMEs, Equity Infusion via fund, etc. should provide help to resume march to normalcy.
Prolonged disruption – started with the liquidity crisis, transcended into confidence crisis and now the Covid-19 crisis – has led
NBFCs / HFCs to sacrifice growth, prune balance sheets and become asset light.
External Environment stressed by liquidity and growth issues, further impacted by COVID-19
11

Our Strategy
A robust Business Continuity Plan as a response to COVID-19 addressing financial planning, business strategy realignment,
employee productivity re-focus, IT enablement and renewed customer engagement.
Focus on capital preservation, collections, stringent operating expenses management and strengthening Balance Sheet.
Company has a healthy capital adequacy, strong liquidity position, a well diversified retail portfolio with excellent geographic
distribution and 97% of receivables are either secured by collateral or have a sovereign guarantee cover.
Business & Liquidity Management
First the economic downturn and then the COVID-19 impact led to FY20 disbursement decrease by 27%. Decrease in AUM by 5%
YoY to ₹16,134 crs.
Continued with change in Product mix towards focus products. Contribution of focus products in AUM increase to 60% (PY 51%).
Contribution of safest asset class, Affordable Housing Finance, increases to 24% (PY 19%).
Amidst Covid-19, taken a cautious stance on new business, tightened underwriting norms. Currently open for business in 305
locations (as on 12-Jun-20).
Company exited March 2020 with a comfortable liquidity of over ₹1,500 crs.
Offered the option of moratorium to all customers. Have not availed moratorium on any borrowing. In spite of this, have
comfortable Liquidity of over ₹1,600 Crore as on 31st May 2020.
Executive Summary - Living in times of Covid-19
12

Customer engagement
Supported MSME and Affordable Housing Customers during lockdown with various government benefits such as Interest
subvention, PMAY scheme etc.
Undertaken Customer survey covering over 75% customers during April & May, to understand customers’ liquidity, business
impact and support they need.
Employee engagement
Enabled Employees to Work From Home, providing adequate protection in times of COVID-19.
By mid June 2020, ~95% of employees are working in nearly ‘Business as Usual’ environment
Ensuring Employee welfare – A very active health support desk and medical emergency helpline etc. for employees and their
families.
Moratorium & COVID-19 Provisioning
Moratorium 1.0 - ABF ~84%, AHF ~53% and SME ~56% customers opted for moratorium.
Additional one-time COVID-19 provision amounting to ₹117 crore in Q4. Provision @0.9% on ABF AUM, @0.4% on AHF AUM
and @0.3% on SME portfolio.
Focus on collections with additional rigour on customers availing moratorium.
Executive Summary - Living in times of Covid-19
13
Opex Management
Stringent control over operating expenses with Go Direct and Go Digital policy
Digital platform supporting end-to-end customer lifecycle implemented in FY20, increasing productivity and reducing cost
Initiated cost rationalisation journey in FY20, leading to absolute reduction in operating expense YoY
Profitability and Balance Sheet strength
Operating profit before COVID provision at ₹199 crore in a very challenging year; After COVID-19 provision, PBT stood at ₹83
crore
Standard asset provisioning increased to 2.2% from 2.0% in previous year
Healthy PCR of 36.5%
Strong Capital adequacy at 25.9%
Priorities for FY21
Focus on Collections and improvement in Asset Quality
Continued reduction in operating expense
Improve NIMs, by change in product mix and reduction in Cost of Funds.
Maintain adequate liquidity and protect capital.
Executive Summary - Living in times of Covid-19
14

Disbursal momentum of previous 3 years impacted due to Liquidity Crisis and COVID-19
Values in Rs crore 15
Disbursement AUM
37% 39% 36%
21%
17% 11% 7%
4%
17%23%
25%
38%
11%8%
12%
21%
18%18%
20%
16%
6,7167,287
8,757
6,428
FY17 FY18 FY19 FY20
Cars / CV / CE Agri Used Assets
Affordable Housing SME & Others
Focus
products
75%
Focus
products
46%
39% 38% 38%32%
19%16% 11%
8%
12%16% 19%
25%
18%17%
19%24%
12%12%
13%12%
16,468 15,801
17,029 16,134
FY17 FY18 FY19 FY20
Cars / CV / CE Agri Used Assets
Affordable Housing SME & Others
Focus
products
42%Focus
products
60%

Business enabler for sustained growth – Technology
16
Lead-To-Disbursal TAT reduction powered by Digital Workflows, STP and
automated checkers
Robotic Process Automation for delivering scale to recon activities in back-
office functions
CRM: Omni-channel 360 degree view of Customer across various mediums
of engagements such as Branch OTC, SMS, Email, Call Centre, WhatsApp,
Facebook, LinkedIn and Twit t er
WhatsApp Chatbot: launched for Customer-service and Channel-
engagement; Website ChatBot launched for facilitating dialog on moratorium
Digital document delivery: Achieved across 11 vernacular languages to
customers
DigitalLOS: End-to-End Digital Loan Processing powered by engines
for real-time decisioning, API driven ecosystem engagement
with FinTechs, automated workflows, rules for multi-bureau
analysis, analytical scorecards, digital NACH and eSign
BYOD: Empowered Field-force with Bring-Your-Own-Device
to securely access corporate applications using personal
mobile devices
Digitial Collections: Over 75% of monthly collections via
digital modes of NACH, PDC, RTGS, UPI, Net Banking, Debit
Cards, Google Pay, PhonePe and PayTM
Data
Analytics
Credit Rule Engine: 2/3rd of credit
underwriting is Straight-Through-Processed
and digital Approved
Data Marts: for Risk Analytics, Cross Sell
and Financial Analytics
Customer Engagement Security
Work-From-Home enabled through secured
infrastruc- ture encompassing hardened laptops,
Firewalls, Virtual Private Network, Mobile Device
Management and 24x7 Security Operations
Center
Operational Efficiency

Business enabler for sustained growth – Customer Service
17Values in Rs crore
Leads
3K to 12K
Instant
48%
1/2 4x
4x
4x
IMPACT
Servicing TAT
7days to 7mins
Net Promoters Score
28% to 48%
Call Handling Time
8mins to 4mins
Customer Interactions
10K to 40K
Disbursal per month
35 crs to 150 crs
Key Initiatives :
• Significant Tat reduction through automated STP
(Straight Through Processing) initiatives
• Best in class Net promoter scores (NPS) in Asset
finance business
• Analytics driven customized cross-sell product offers
for customers
• Servicing customers in 11 regional languages
364
536
704
1141
47%
31%
62%
FY 17 FY 18 FY 19 FY 20
Cross-Sell (in crs) Value % increase
28%
35%38%
30%
40%
May-19 July-19 Sep-19 Dec-19 Feb-19
Magma NPS

Parameter FY19
Net NPA 3.1%
NIM 8.4%
NCL# 1.5%
Opex Ratio# 4.1%
AUM ₹ 17,029 crs
Disbursement ₹ 8,757 crs
Profit Before Tax ₹ 442 crs
Key Financial Metrics
CRAR 24.9%
18
FY20 Before COVID
4.2%
7.7%
2.4%
4.1%
₹ 16,134 crs
₹ 6,428 crs
₹ 199 crs
25.9%
# Premium paid under Credit Guarantee scheme clubbed with NCL.
FY20 After COVID
4.2%
7.7%
3.1%
4.1%
₹ 16,134 crs
₹ 6,428 crs
₹ 83 crs
25.9%

Moratorium Impact
Values in Rs crore 19
SegmentAUM as of 31
March 2020
% of AUM
under
Moratorium
(May exit)
Collection
Efficiency
(Apr-20)
Collection
Efficiency
(May-20)
COVID-19
Provision
amount
COVID-19
Provision as
% of AUM
ABF 10,395 84% 94.6% 136.1% 96 0.9%
AHF 3,880 53% 95.0% 92.1% 15 0.4%
SME & Others 1,859 56% 92.4% 92.3% 6 0.3%
Total 16,134 73% 93.9% 112.2% 117 0.7%
Note:
1. Customers availing moratorium (by value) for March-20 was 26% and for April was 64%.
2. MTD Collections as on 16-Jun-20 is ~81% of Mar-20 MTD Collections, assuming 100% billing (ABF: 86%; AHF: 74% & SME: 73%)
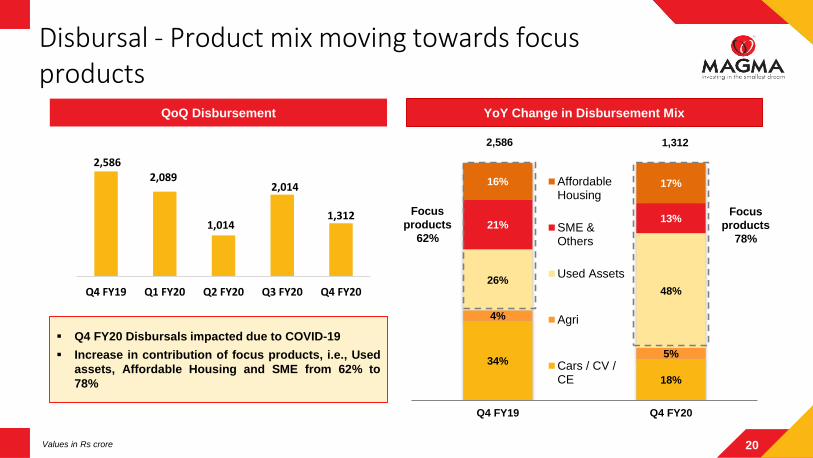
34%
18%
4%
5%
26%48%
21%13%
16% 17%
Q4 FY19 Q4 FY20
AffordableHousing
SME &Others
Used Assets
Agri
Cars / CV /CE
QoQ Disbursement YoY Change in Disbursement Mix
2,586 1,312
Q4 FY20 Disbursals impacted due to COVID-19
Increase in contribution of focus products, i.e., Used
assets, Affordable Housing and SME from 62% to
78%
Focus
products
62%
Focus
products
78%
Disbursal - Product mix moving towards focus products
Values in Rs crore
2,586 2,089
1,014
2,014
1,312
Q4 FY19 Q1 FY20 Q2 FY20 Q3 FY20 Q4 FY20
20
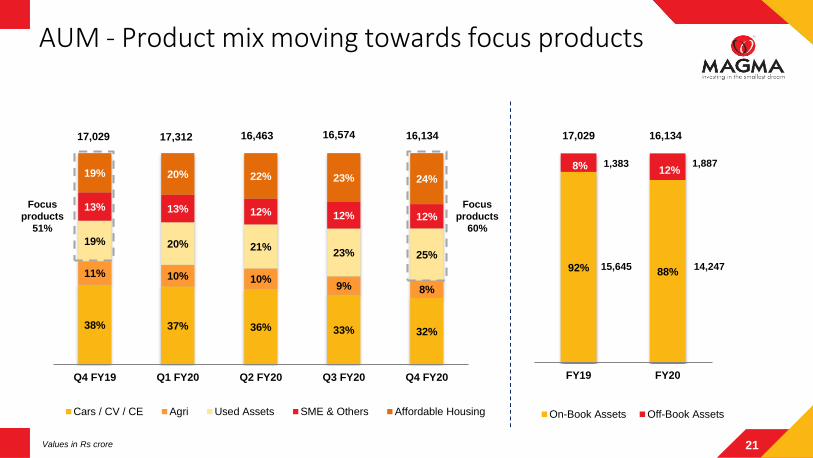
AUM - Product mix moving towards focus products
38% 37% 36% 33% 32%
11% 10% 10%9% 8%
19% 20% 21%23% 25%
13% 13% 12% 12% 12%
19% 20% 22% 23% 24%
Q4 FY19 Q1 FY20 Q2 FY20 Q3 FY20 Q4 FY20
Cars / CV / CE Agri Used Assets SME & Others Affordable Housing
17,029 16,574
92% 88%
8% 12%
FY19 FY20
On-Book Assets Off-Book Assets
1,887
16,13417,029
14,24715,645
1,383
Values in Rs crore
17,312 16,134
Focus
products
60%
Focus
products
51%
16,463
21

Particulars Q1 FY20 Q2 FY20 Q3 FY20 FY19 FY20
Gross Stage 1 and Stage 2 Assets 15,282 13,653 13,790 14,898 13,333
ECL Provision – Stage 1 and 2 300 286 277 293 291
Stage 1 and Stage 2 Coverage Ratio (%) 2.0% 2.1% 2.0% 2.0% 2.2%
Gross Stage 3 Assets 814 928 987 747 914
Net Stage 3 Assets 523 599 647 472 580
Gross Stage 3 Assets (%) (~ GNPA) 5.1% 6.4% 6.7% 4.8% 6.4%
Net Stage 3 Assets (%) (~NNPA) 3.3% 4.2% 4.5% 3.1% 4.2%
Stage 3 Coverage Ratio (%) 35.8% 35.4% 34.4% 36.8% 36.5%
• Assets quality ratios are calculated basis On Book AUM (i.e. Direct Assignment book is excluded)
• Figures for the previous periods have been restated/ regrouped to align with current quarter’s presentation.
Asset Quality
22Values in Rs crore

8% 8% 8% 8% 7%
45% 49%56% 61% 57%
4%5%
5%6%
6%29%
32%31%
25% 30%
14%6%
Mar-19 June-19 Sep-19 Dec-19 Mar-20
Perpetual & Sub Debt Term Loan incl. PTC NCD Working Capital Commercial paper
12,686
• Entire borrowings from Long Term Sources of funds (Working
Capital facilities are long term in nature, though shown as
repayable in 6m-12m bucket for purpose of ALM).
• Source of liabilities as at 31 March 2020 – Banks: 83%, Debt
capital market: 17%.
Instrument Rating
Short term Debt A1+ (CARE & CRISIL)
Long term Debt AA- (CARE, ICRA & India Ratings)
12,44113,290
Balance Sheet Debt based on MFL Consolidated financials; Values in Rs crore.
On Balance Sheet
Debt13,133 11,987
Liability Profile - Structural Shift to Long Term Liquidity
23

Borrowing Profile
Borrowing Mix as at 31 March 2020
Particulars Fixed Rate Borrowings Floating Rate Borrowings
MFL 44% 56%
MHFL 15% 85%
Consolidated 40% 60%
Fresh Borrowings in FY20
Instrument MFL MHFL Consolidated
Term Loans including
PTC/PCG3,672 962 4,634
NCDs 551 - 551
Direct Assignment 1,000 282 1,282
Total 5,223 1,244 6,467
24Values in Rs crore

1,578 1,542 1,846
2,507
(692)
1,925 1,910
434%
252% 191%
153%
-9%
18% 16%
-200%
400%
(1,400)
(700)
-
700
1,400
2,100
2,800
1 month 2 month 3 month 6 month 1 year 3 year 5 year
Cumulative Mismatch (Rs Crs) Cumulative Mismatch (%)Note:
Moratorium was offered to all customers, however did not seek any moratorium from our lenders, leading to a small
mismatch in 6 - 12 months time bucket, well within generally accepted mismatch in this bucket
Working capital limits (30% of total borrowing) are considered as repayable in 6 - 12 months time bucket
Liquidity Risk Management (LRM) Framework:
o Adequate High Quality Liquid Assets (HQLA) to cover well over 100% requirement.
o Surplus in each of the new granular buckets i.e. 1-7 days, 8-14 days, 15-30/31 days
Based on MFL Standalone numbers; Values in Rs crore.
Structural Liquidity for MFL as at Mar 20
-15%
25

Based on MHFL Standalone numbers; Values in Rs crore.
Structural Liquidity for MHFL as at Mar 20
26
246
281 287 309
9
180
301
0
392%358%
212%
138%
1% 13% 17%0% 0%
50%
100%
150%
200%
250%
300%
350%
400%
450%
-
50
100
150
200
250
300
350
1 month 2 month 3 month 6 month 1 year 3 year 5 year > 5 year
Cum Gap Cum Gap (%)
Note:
Working capital limits (20% of total borrowing) are considered as repayable in 6 - 12 months time bucket
Liquidity Risk Management (LRM) Framework:
o Surplus in each of the new granular buckets i.e. 1-7 days, 8-14 days, 15-30/31 days
-15%

15.4%12.8%
20.7%23.0%
5.0%
4.5%
4.1%
2.9%
FY17 FY18 FY19 FY20
Tier 1 Tier 2
2,125 1,925
2,690 2,694
47
47
54 54
FY17 FY18 FY19 FY20
Reserves and Surplus Share Capital
Net Worth Capital Adequacy*
17.3%
* Subject to RBI guidelines
2,17220.4%
1,972
2,74824.9%
Adequately capitalized for growth
2,744 25.9%
27Values in Rs crore
Note: FY17 numbers are as per I-GAAP; FY18, FY19 and FY20 numbers are as per Ind-AS

Particulars Q4FY20 Q3FY20 Q4FY19 FY20 FY19
Net Revenue 308 318 335 1,272 1,372
Expenses# 162 164 171 674 679
Operating Profit 147 154 164 598 693
Net Credit Loss (Normal) # 30 126 37 398 251
Profit Before Tax (before COVID-19 provision) 117 28 127 199 442
Additional Provision - COVID-19 117 0 0 117 0
Profit Before Tax 0 28 127 83 442
Tax (Normal) (4) 7 40 19 138
Opening DTA impact due to change in tax rates 36 0 0 36 0
Profit After Tax (31) 21 87 28 303
Share of profit in Joint Ventures / Associates (4) 2 (2) (1) 1
Consolidated Profit After Tax (36) 22 85 27 304
RoA -0.9% 0.5% 2.0% 0.2% 1.9%
RoE -5.2% 3.3% 12.7% 1.0% 13.0%
Consolidated Profit & Loss Statement*
28
* Re-formatted for better analysis# Premium paid under Credit Guarantee scheme clubbed with NCL
Values in Rs crore

Particulars 31-Mar-20 31-Dec-19 31-Mar-19
Cash and Cash Equivalents 708 1,384 957
Loans and Advances 13,555 14,091 15,007
Other Assets 784 757 623
Fixed Assets 193 201 203
Total Assets 15,240 16,432 16,789
Borrowings 11,987 12,686 13,133
Other Liabilities 504 971 912
Share Capital 54 54 54
Reserves & Surplus 2,694 2,721 2,690
Total Liabilities 15,240 16,432 16,789
Consolidated Balance Sheet
29Values in Rs crore

FINANCIAL PERFORMANCE– Q4 FY20
Business Strategy - Asset Backed Finance (ABF)
30

Product-wise AUM Contribution
• Portfolio is being reshaped by increasing contribution of focus products and customer segments
• Flow through of higher Disbursal in Focus products is increasingly reflecting in AUM mix
• This will lead to improved Revenue Profile in ABF AUM
• Q2 disbursals curtailed with a view on liquidity; Q4 disbursals impacted by lockdown in March
Disbursal % (Value)
ABF Business Momentum
31Values in Rs crore
52% 53% 53%
33%
26% 15% 10%
7%
22%32%
37%
60%
4781
5345
5877
4055
FY17 FY18 FY19 FY20
Cars / CV / CE Agri Used Assets
55% 54% 56%49%
27%24% 16%
13%
17%22% 28%
38%
11,513 11,080
11,591
10,395
FY17 FY18 FY19 FY20
Cars / CV / CE Agri Used Assets Total

Used Asset Disbursement (Units) Used Asset Disbursement (Rs. in Crs)
• Continued shift towards increasing the proportion of Used Assets since FY18
• 27% CAGR growth in Disbursals over three year period
• Q2 disbursals curtailed with a view on liquidity; Q4 disbursals impacted by lockdown in March
ABF Disbursal Strategy focused on used assets
3 Yr CAGR – 26% 3 Yr CAGR – 27%
32Values in Rs crore
33,851
45,378
61,412
67,164
FY17 FY18 FY19 FY20
1,174
1,710
2,190
2,426
FY17 FY18 FY19 FY20

Cross sell Disbursement Direct Business % of total ABF Disbursal (Units)
• Significant growth in direct business from 22% in FY17 to
42% in FY20
• Direct business contribution to overall business is steadily
improving
Focus on Cross Sell and Direct Business
33Values in Rs crore
364
536
704
1055
FY 17 FY 18 FY 19 FY 20
22%
32%35%
42%
FY 17 FY 18 FY 19 FY 20
FY Volume (in cr) % Increase
FY17 364
FY18 536 ↑ 47%
FY19 704 ↑ 31%
FY20 1,055 ↑ 50%
* FY 20 - Q2 disbursals curtailed with a view on liquidity; Q4 disbursals impacted by lockdown in March

EWI Trend for ABF CPMI Trend for ABF
EWI: Early Warning Indicators are the 0+% of each quarterly portfolio with 1 Quarter Lag (Tractor Non-Monthly structure is with 2 Quarter Lag)
CPMI: Continuous Portfolio Monitoring Indicator is a composite index of 4 indices monitoring the 60+% movement of quarterly portfolio at different time lag
Portfolio Quality Indicators
34
16.7%
10.7%
5.9%
4.2%
2.9%
8.0% 7.9% 8.0% 8.3%
10.2%
Mar-16 Mar-17 Mar-18 Mar-19 Feb-20
Overall ABF EWI % Overall ABF EWI Benchmark %
13.9%
11.0%
7.3%
4.1%
5.6%
4.7% 4.5% 4.5%4.3%
5.0%
Mar-16 Mar-17 Mar-18 Mar-19 Feb-20
Overall ABF CPMI % Overall ABF CPMI Benchmark %

FINANCIAL PERFORMANCE– Q4 FY20
Business Strategy - Asset Backed Finance (ABF)
35
Business Strategy -SME and Others

‘MScore’ Proprietary
Credit Scorecard
Integrated Rule Engine
Disbursement
Disbursals curtailed to focus only on high quality assets in current stressed times for MSMEs
SME and Others
Aberration in Q2 FY20 numbers due to change in ALM strategy and in Q4 FY20 due to COVID-19 induced lockdown in March
36
API enabled digital
workflow platform
Empowering SMEs
with government
schemes like interest
subvention and credit
guarantee
Values in Rs crore
1,208 1,348
1,789
1,018
FY17 FY18 FY19 FY20

Prudence adopted in unsecured SME business given tough
macro conditions
AUM Geographical Diversification
Geographically well diversified portfolio
SME and Others
East, 21%
North, 17%
South, 34%
West, 28%
37Values in Rs crore
1,920 1,959
2,278
1,859
FY17 FY18 FY19 FY20

ID = 0+ bkt % for cases sourced in last 6 months on 1 month lag basis including current month .
ED = 60+ bkt % for cases sourced in last 12 months on 3 month lag basis including current month.
ID & ED Trend for SME Finance
SME Finance - Early Indicators: ID & ED Trends
38
0.8%
0.6%
0.5%
0.4%
0.2%
0.6%
Mar-16 Mar-17 Mar-18 Mar-19 Feb-20
ID% ID Target
1.2%
1.4% 1.4%
1.6%1.7%
1.3%
Mar-16 Mar-17 Mar-18 Mar-19 Feb-20
ED% ED Target

FINANCIAL PERFORMANCE– Q4 FY20
Business Strategy - Asset Backed Finance (ABF)
39
Business Strategy -SME and Others
Business Strategy -Affordable Housing Finance

Disbursal Momentum - AHF
* AHF includes HL, LAP and CF
Values in Rs crore40
Disbursement Disbursement (# Nos. Accts)
167 201
647827473 385
407
521
87
8
38
7
FY17 FY18 FY19 FY20
HL LAP CF
API enabled
digital workflow;
integrated rule
engine
National
Presence
19 States and
103 Branches
53% of
customers
sourced in FY20
are new to credit
51% PMAY
penetration in
fresh Home Loan
on-boarding
727 594 1,092 1,355
5,659 5,527
13,008
16,981
FY17 FY18 FY19 FY20

25% 27%38%
47%
72% 72%60%
53%
3% 1% 1% 1%
FY17 FY18 FY19 FY20
HL LAP CF
AUM Momentum - AHF
* AHF includes HL, LAP and CF
Values in Rs crore 41
Product Mix AUM
3,035 2,762 3,160 3,880
3,035
2,762
3,160
3,880
FY17 FY18 FY19 FY20

Go Home Loan Go Direct
• Home Loan share is consistently around 65%
• Direct distribution capabilities set up in last 2 years
• 80% of sourcing is relationship based direct sourcing
Key Takeaways
HL does not include Construction Finance. Direct Biz means Business directly generated by Magma employees without help from DDSAs / NDSAs / Brokers, and includes Cross-sell
Progressing Well – Core Business Values
42
24% 26%
34%
61%
67%
Mar-16 Mar-17 Mar-18 Mar-19 Mar-20
HL Ratio (Units)
33%33%
43%
76%80%
Mar-16 Mar-17 Mar-18 Mar-19 Mar-20
Direct Ratio (Units)

Well Diversified Business
43
Salaried Formal20%
Salaried Informal
5%
S/E Formal30%
S/E Informal45%
North37%
South25%
West33%
East5%
Customer MixGeographical Distribution Collateral Mix
Residential 76%
Self Under Construction
17%
Commercial 6%
Builder under construction 2%
Geo-risk optimized; diversified National presence
Minimal construction risk, under-construction builder property only 2% of disbursement
Balanced Mix of Salaried: Self employed and Formal: Informal customers

ID = 0+ bkt % for cases sourced in last 6 months on 1 months lag basis including current month .
ED = 30+ bkt % for cases sourced in last 12 months on 2 month lag basis including current month.
ID & ED Trend for AHF
Y-o-Y & Q-o-Q improvement in ED and ID for Affordable Housing Finance
Improving Delinquency Parameters
44
5.2%
4.7%
1.3%0.7%
0.2%
0.80%
Mar-16 Mar-17 Mar-18 Mar-19 Feb-20
ID% ID Benchmark
2.7%
3.7%
1.3%
0.4%0.6%
1.0%
Mar-16 Mar-17 Mar-18 Mar-19 Feb-20
ED% ED Benchmark

FINANCIAL PERFORMANCE– Q4 FY20
Business Strategy - Asset Backed Finance (ABF)
45
Business Strategy -SME and Others
Magma Housing Finance
(Subsidiary)

187382 313
167 201
647827
233
454431
222353
400
481
42
142130
87
8
38
7
FY14 FY15 FY16 FY17 FY18 FY19 FY20
MHF – Emerging as a strong Affordable Housing Finance Entity
46
Transformation
Phase
Initial Ramp Up
LAP & CFMHF in reckoning
Affordable Home Loans & Retail LAP
462 978 874 476 561 1,085 1,315
“The company has consciously transformed towards building the granular long term affordable housing book”
Values in Rs crore
Construction
Finance
Loan Against
Property
Home Loan
41%
50%
9% 63%
37%
0.1%
223%
28%

Relationship based direct sourcing…
47Values in Rs crore
33%
80%
67%
20%
FY16 FY17 FY18 FY19 FY20
Direct Sourcing Channel sourcing
824
1808
992
1448
139
27
FY16 FY17 FY18 FY19 FY20
HL LAP CF
1,955 1,790 1,809 2,429 3,283874 475 562 1,085 1,315
Go Direct 80% Go Home Loan 55%
55%
44%
1%
42%
51%
7%
Sourcing Mix AUM
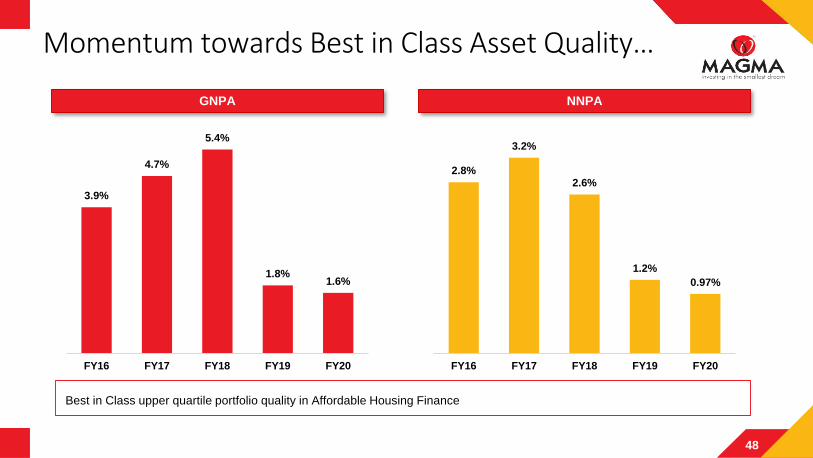
Momentum towards Best in Class Asset Quality…
48
3.9%
4.7%
5.4%
1.8%1.6%
FY16 FY17 FY18 FY19 FY20
2.8%
3.2%
2.6%
1.2%
0.97%
FY16 FY17 FY18 FY19 FY20
GNPA NNPA
Best in Class upper quartile portfolio quality in Affordable Housing Finance

Serving the under-served MIG and LIG customers
4949
Middle Income Group II
Middle Income Group I
Low income Group
Economically Weaker Section
Household Income
3 lakhs
6 lakhs
18 lakhs
12 lakhs
> INR 30 lakhs
INR 6 - 15 lakhs
INR 2 - 5 lakhs
INR 16 - 30 lakhs
Average Loan Ticket Size
MHF Customer segment
• Primarily new to credit customers
buying first home
• 72% of loans disbursed in Tier 2 and
Tier 3 towns
• Income type: Self Employed, Salaried
Informal, Self Employed-Professional,
Salaried
• Lending towards affordable housing
with Average Ticket Size of 9-13 lakhs
Note: According to RBI classification, cities with a population in the range of 50,000 to 100,000 are classified as tier 2 cities, while those with a population of 20,000 to 50,000
are classified as tier 3 cities

Pan India Affordable Housing Finance Company
Values in Rs crore
Wide retail presence through hub and spoke model
Technology enabled solutions leading to industry best
productivity, national coverage and best in class
customer experience
Strong customer engagement through large team
of Field Executives
Toll free Inbound/Outbound Customer Call Centre for
servicing and cross sell
103 Branches as on 31st March, 2020Asset Light Branch Network
Deep presence in select geographies pan India through
hub and spoke model,
50

MHF - Value in Consistent Performance
51
Parameter FY20*
Disbursement IRR 13.8%
Gross NPA 1.6%
Net NPA 0.97%
Opex Ratio 3.6%
FY19*
13.1%
1.8%
1.2%
3.9%
AUM Rs. 3,283 crsRs. 2,430 crs
FY18*
13.3%
5.4%
3.3%
3.1%
Rs. 1,809 crs
PAT Rs. 43 crsRs. 34 crsRs. 34 crs
ROA 1.5%1.6%1.9%
ROE 10.4%10.4%11.5%
FY17*
14.0%
4.7%
3.7%
2.8%
Rs. 1,790 crs
Rs. 34 crs
1.9%
13.1%
FY16*
13.9%
3.9%
3.1%
3.1%
Rs. 1,955 crs
Rs. 23 crs
1.3%
9.5%
*Note: Performance for FY16 and FY17 as per I-GAAP; FY18 to FY20 performance as per Ind-AS

FINANCIAL PERFORMANCE– Q4 FY20
Business Strategy- Asset Backed Finance (ABF)
Business Strategy-Affordable Housing Finance
Business Strategy-SME and OthersBusiness Strategy - MHDI
52

Magma HDI General Insurance - Registering robust growth built on strong risk foundation
19% 12% 9% 14% 33% 17% 13% 12%
96
430
555
427 423
560
1,026
1,294
FY13 FY14 FY15 FY16 FY17 FY18 FY19 FY20
Consolidation
PhaseInitial Ramp Up
Responsible
Growth
83%
26%
“The company has registered growth rate higher than industry growth rate for 3 years in a row”
GWP
Co. Growth Rate
Industry Growth
Rate
53Values in Rs crore

Portfolio Composition
Portfolio Type FY13 FY17 FY20CAGR over
FY17
Industry CAGR
over FY17
91.1% 80.5% 79.5% 45.0% 11.3%
8.9% 18.8% 16.4% 38.7% 11.4%
0.0% 0.7% 4.0% 161.8% 18.2%
Crop Insurance
0.0% 0.0% 0.0% 0.0% 16.1%
Total 100% 100% 100% 45.5% 14.0%
Motor Insurance
Commercial Insurance
Health Insurance
“Retail franchise contributing 83.2% of total business, increasing focus on health”
54
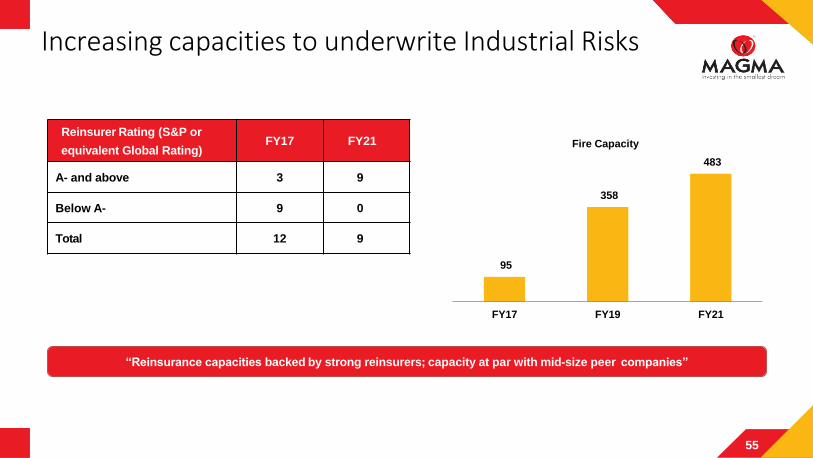
Increasing capacities to underwrite Industrial Risks
Reinsurer Rating (S&P or
equivalent Global Rating)FY17 FY21
A- and above 3 9
Below A- 9 0
Total 12 9
95
358
483
FY17 FY19 FY21
Fire Capacity
“Reinsurance capacities backed by strong reinsurers; capacity at par with mid-size peer companies”
55

Enhancing distribution through partnerships
Offices & Channel Partners FY16 FY17 FY18 FY19 FY20
Number of Branches 80 80 125 169 170
Agents + POS* + MISP# 1,751 1,867 2,790 5,028 6,558
Corporate Agents 1 3 5 7 13
OEM Tie-ups 0 0 1 1 6
Number of Districts where policies are issued : 534 Number of Districts where claims are serviced : 604
*POS – Point of Sale, #MISP – Motor Insurance Service Provider
Generating business from over 70% districts with the ability to service claims in more than 80% districts in India through
strong use of technology”
56

Diversifying channel mix
35.3%
14.1%
45.9% 45.8%
0.0%
18.7%16.2% 16.8%
FY17 FY20
CA# Agency* OEM Corporate Sales
# Corporate Agency; reduced dependence on captive business,
*includes Direct & others
#
“Reducing dependence on Corporate Agency – Magma Group and increasing share from OEM relationships”
57

Technology Led Scalable GrowthShift Towards Quicker, Safer Customer Touch Points
Number of policies (in
lacs)
“Technology leading to smoother distribution experience; Rule based automated systems for checks and control”
58
13%
63%75%
24%
5%
1%
49%
30%24%
14%2%
FY16 FY18 FY20
Portals Branch Central Hub Manual ICN
3.4 6.6 16.2
Accelerated gravitation
towards portals leading to
quicker TATs
Shift away from lengthier
TAT channels

Investment Corpus
“More than 80% of the Investment Corpus is invested in AAA rated securities”
59
866 9001,137
1,462
2,285
3.4 3.5
4.4 4.7
5.4
FY16 FY17 FY18 FY19 FY20$
Investment Corpus Leverage Ratio @
@ - Closing Investment corpus by closing capital, $Partial allotment of share Application money considered in closing capital
Values in Rs crore
8.69% 8.46% 8.21% 8.38% 7.40%Yield %

Magma HDI General: Financial Performance
60Values in Rs crore
Particulars FY16 FY17 FY18 FY19 FY20
Gross Written Premium 427 423 560 1026 1294
Net Earned Premium 373 327 335 385 708
Net Incurred Claims 319 259 277 272 597
Net Commission 12 4 (12) (29) (63)
Management Expenses 126 143 154 258 373
Underwriting Loss (85) (78) (85) (105) (180)
Investment & Other Income 78 85 91 107 201
Investment write-off/Provision 0 0 0 (10) (19)
PBT (7) 7 6 (8) 2
PAT (12) 6 5 1 (6)
Key Ratios
Retention Ratio 78% 77% 67% 50% 61%
Combined Ratio 126.8% 123.6% 120.2% 112.1%* 120.7%
Solvency Ratio# 1.78 2.07 2.01 1.58 1.71
Other Details
Share Capital & Reserves$ 258 258 258 308 384*
Accumulated Losses (39) (32) (28) (26) (32)
“Lowest accumulated losses in the initial 8 years of operation. For other second wave peer companies, it ranges
between Rs.175 crores to Rs.1000+ crores ”
Note : *FY19 Combined ratio is post one time TP transaction, #Solvency ratio excludes share application money pending allotment, $Share Application money pending allotment of
Rs. 75 crores & Rs. 53.2 crores is not included as at March 19 & March 20 resp. in Share Capital & Reserves.

Ind AS
Particulars Q4 FY20 Q4 FY19 Q3 FY20 FY20 FY19
Gross Written Premium 345.4 358.5 358.3 1,293.9 1,025.8
Net Written Premium 200.4 224.2 227.4 790.2 516.9
Net Earned Premium 193.9 188.2 180.9 708.3 384.9
Net Claims Incurred 162.2 165.6 156.6 597.5 272.0
Net Commission (12.1) (14.6) (21.6) (62.9) (28.9)
Management Expenses 89.8 76.0 93.3 355.2 247.4
Impairment loss 10.9 8.3 0.1 18.6 10.4
Underwriting Profit (56.9) (47.1) (47.5) (200.1) (115.9)
Investment & Other Income 52.9 33.4 52.4 205.8 107.4
Profit Before Tax (4.0) (13.7) 4.8 5.7 (8.4)
Taxes 7.9 (9.7) 0.1 8.8 (9.7)
(-)Current Taxes (including MAT Credit) 7.9 (11.0) (0.1) 7.8 8.7
(-)Deferred Taxes 0.1 1.3 0.2 1.0 (18.4)
Profit After Tax (11.9) (4.1) 4.8 (3.1) 1.3
Magma HDI General: Profit & Loss Statement
61Values in Rs crore

FINANCIAL PERFORMANCE– Q4 FY20
Business Strategy- Asset Backed Finance (ABF)
Business Strategy-SME and Others
Business enablers to drive sustainable growth
62

Operational and Business
Units (design and operating effectiveness)
1st line of defense
Independent Assurance
by Internal Audit
3rd line of defense
Independent Risk
Management Unit
Risk Management
CommitteeAudit Committee ITSC
Credit Governance, Operational Risk,
Fraud Risk, InfoSec and Compliance
2nd line of defense
Components of Risk Management Overarching principles and execution
Risk Governance
• Risk Appetite Statement and Strategic Risk Assessment set the guardrails
• Quarterly Committee meetings to assess enterprise risk profile
• Well defined risk policies and standards
Operating controls and
compliance
• Comprehensive Risk library. Regular monitoring of Key Risk Indicators.
• Internal Financial Controls (IFC) standards as mandated by Companies Act
Credit underwriting strategies• Decisioning platforms based on segmental behavior and risk based pricing
• Automated Credit Rule Engine with connectivity to bureau and fraud systems
Analytics driven portfolio
management
• Statistically derived Early Warning Indicators (EWI) and Continuous Portfolio Monitoring Indicators (CPMI)
• Robust PD and LGD models guide consistently accurate loss forecasting
Capital and Liquidity Management• Proactive management of ALM mismatch in each time bucket
• Prudent capital and liquidity buffers for stress resilience
ALCO
Board of Directors
Enterprise wide, independent risk management framework, An integrated approach covering entity wide risks
Risk Management
CommitteeALCO
Risk Management
CommitteeAudit CommitteeALCO
Risk Management
CommitteeITSCAudit CommitteeALCO
Risk Management
Committee
63

Enterprise wide, independent risk management framework, Risk strategy to deal with COVID-19 situation
Minimum disruption
of activities
• Being a geographically neutral team, which can work from a non-office location without much disruption, the Risk team
has ensured minimum disruption of its planned activities during the crisis
Key initiatives by
the Risk team
• All planned risk activities like risk reviews, IFC exercise, KRI monitoring, committee meetings have been carried out as
per plan
• Developed an Event Risk register to monitor the new risks, and corresponding controls put in place to deal with the
COVID-19 situation
• Participated in COVID-19 specific webinars to get valuable insights into risks due to the pandemic and undertaken
discussions with the business units for mitigating the same
• Intensified surveillance activities by FRM happening on a regular basis. Team has also focused on the training of other
support functions for better fraud prevention
• Credit pre-approved customers are being reassessed by the Credit team for loans in uncertain scenario
• Customer Survey done to understand how they have been affected by this crisis and obtained invaluable feedback to
improve credit processes / re design lending and collection strategies
Road ahead
• Increased use of secured technology tools to conduct risk activities
• Identifying and eliminating redundant processes, identified during the crisis, across the organization
• More impetus on telephonic discussion for investigations and cross verifications
During the end of financial year, we have been faced with unprecedented health and economic crisis on account of
COVID-19 which has led us to fine tune our existing risk strategy due to the uncertain conditions.
64

Fully functional role based and state of the art learning tools aimed at enhancing productivity and behavior
Structured Onboarding Program across levels for smooth onboarding and integration.
Development interventions through International program for Senior leadership, including 360 degree feedback
Leadership Talent evaluation for VPs & SVPs with an objective of building leadership depth & succession
Talent management framework with objective of building internal talent pipeline and strengthening retention
Empowering business leaders with real time HR dashboards to help them make informed people related decisions
Empowering business leaders with structured Performance Review Program to have a review rigor among teams
Business enablers to drive sustainable growth -People
65

FINANCIAL PERFORMANCE– Q4 FY20
Business Strategy- Asset Backed Finance (ABF)
Business Strategy-SME and Others
Business enablers to drive sustainable growth
Leadership Teamand ShareholdingStructure
66

Mayank
Poddar
Chairman
Emeritus
and
Whole time
Director
• Supports policy formulation and
guidance to the
Management/Board
• Over 30 years of experience in the
financial sector.
Sanjay
Chamria
VC and MD
• Anchors strategic policy formulation
and execution.
• Drives new business initiatives and
leads management team
Narayan K
Seshadri
Chairman
He is on the Board of companies
including Clearing Corporation of
India Limited, PI Industries
Limited and SBI Capital Markets
Limited
Promoter Directors Non Executive Independent Directors
VK
Viswanathan
Director
He served as the Chairman and
Managing Director of Bosch Ltd. He
currently serves on board of various
reputed Indian corporates as an
Independent Director.
Vijayalakshmi
R Iyer
Director
Previously served as an
Executive Director of Central
Bank of India, Chairperson and
Managing Director of Bank of
India. She was also a Whole
Time Member (Finance and
Investment) in the IRDAI.
Bontha Prasad
Rao
Director
Mr Rao has served as the Chairman
and Managing Director of Bharat
Heavy Electricals Limited. He is
currently the Managing Director of
Steag Energy Services India,
subsidiary of Steag Energy Services
Germany
Sunil
Chandiramani
Director
He is a Management Consultant
& CEO of NYKA Advisory
Services. Earlier, he was
associated with Ernst & Young
LLP in various capacities for 25
years. He is on the board of
various Indian corporates as an
Independent Director
Board of Directors
67

Joined Title and Previous Company
Manish Jaiswal
MD & CEO - HFC,
CEO - SME
Jun-2017
Head, Risk
Advisory,
Research and
SME Ratings,
CRISIL
Rajive Kumaraswami
MD & CEO - MHDI
Jun-2016
Chief
Representative
Officer - India
Liaison office,
SCOR Re, India
Harshvardhan Chamria
Chief Digital Officer
Sep-2014
Chief Strategy
Officer- Housing
and SME, Magma
Fincorp Limited
Rajneesh Mishra
Chief People Officer
Jan-2019
Vice president-
HR,
Bajaj Finserv
Limited
Deepak Patkar
CEO - ABF
Sep-2018
Chief Risk Officer,
Fullerton India
Credit Company
Limited.
Kailash Baheti
Chief Financial Officer
Oct-2011
CEO,
Century
Extrusions Limited
Sanjay Chamria
VC and MDBusiness CEO / Functions Support Functions
Management Team
68

Magma Housing Finance
Limited
Magma HDI General
Insurance Company
Limited
Magma Fincorp Limited
100% 35.41%
Shareholding (31-Mar-2020)
Holding Structure & Shareholding Pattern
Promoters, 24.40%
Overseas Bodies, 9.67%
FII, 27.39%
Domestic Investors,
6.18%
Public, 32.36%
69

AUM Assets Under Management: On-Book & Off-Book Loan AssetsAverage AUM (AAUM) Average of XXing and closing AUMFOS / Field Officer Feet on StreetABF Asset Backed FinanceAHF Affordable Housing FinanceHL Home LoanLAP Loan against propertySME Small & Medium EnterprisesNDSA Non-dealer Direct Selling AgentDDSA Dealer Direct Selling AgentDirect Biz Direct Biz means Business directly generated by Magma employees without help from DDSAs / NDSAs / Brokers, and includes Cross-sellMortgage Direct Biz Business through connectors is included in Direct businessATS Average Ticket SizeMortgage ATS Disbursals during the month / Number of first time disbursalsODPOS Overdue + Principal OutstandingNIM Net Interest Margin: [Total Income (incl. Other Income)– Interest Expenses]/Average AUMYield Weighted average yield on Loan Assets including Off-Book Loan assetsCoF Cost of Funds: Weighted average cost of borrowings including securitizationOpex / AUM% Opex / Average AUMTotal Assets On B/S Assets of MFL (Consolidated)NCL Prov. & Write-off/ Average AUMGross Stage 3 Assets % Gross Stage 3 Assets / Closing AUM (On-book)Net Stage 3 Assets % (Gross Stage 3 Assets – ECL Provision – Stage 3) / (Closing AUM (On-book) – ECL Provision Stage 3)ECL Estimated Credit LossRoA PAT (excluding OCI) / Average AUMRoE PAT (Excluding OCI) / (Net worth - Goodwill)Networth Equity Share Capital + Reserves & SurplusBVPS Book Value per share: (Net worth-Goodwill) / No. of Equity shares outstandingEPS Earnings Per Share (Diluted)MITL Magma ITL Finance Limited (Merged with MFL)MHF Magma Housing Finance Limited (100% Subsidiary)MHDI Magma HDI General Insurance Company Limited (Joint Venture)SENP Self-employed Non ProfessionalSEP Self-employed ProfessionalNIP No income ProofGWP Gross Written PremiumGDPI Gross Direct Premium Income
Glossary
70

FINANCIAL PERFORMANCE– Q4 FY20
Business Strategy- Asset Backed Finance (ABF)
Business Strategy-SME and Others
Business enablers to drive sustainable growth
Annexures
71

Particulars Q4 FY20 Q3 FY20 Q4 FY19 FY20 FY19
Net Revenue 266 268 309 1,098 1,250
Expenses# 138 138 145 573 597
Operating Profit 128 130 164 525 653
Net Credit Loss (Normal)# 20 123 39 382 250
Additional provision - COVID-19 109 0 0 109 0
Profit Before Tax (1) 7 125 34 403
Tax (Normal) (3) 1 39 7 128
Opening DTA impact due to change in tax rates 37 0 0 37 0
Profit After Tax (35) 5 87 (10) 275
Magma Fincorp Ltd. (MFL) Standalone Profit & Loss Statement*
72
* Re-formatted for better analysis# Premium paid under Credit Guarantee scheme clubbed with NCL
Values in Rs crore

Particulars 31-Mar-20 31-Dec-19 31-Mar-19
Cash and Cash Equivalents 648 1,133 933
Loans and Advances 11,183 11,866 13,138
Other Assets 948 837 730
Fixed Assets 176 185 187
Total Assets 12,955 14,021 14,988
Borrowings 10,109 10,952 11,750
Other Liabilities 331 518 682
Share Capital 54 54 54
Reserves & Surplus 2,461 2,497 2,502
Total Liabilities 12,955 14,021 14,988
Magma Fincorp Ltd. (MFL) Standalone Balance Sheet
73Values in Rs crore

Magma Housing Finance Ltd. (MHFL) Standalone Profit & Loss Statement*
Particulars Q4 FY20 Q3 FY20 Q4 FY19 FY20 FY19
Net Revenue 41 50 34 179 131
Expenses 24 26 26 101 82
Operating Profit 17 24 8 78 49
Net Credit Loss (Normal) 10 3 (1) 16 2
Additional provision - COVID-19 7 0 0 7 0
Profit Before Tax (0) 21 9 54 47
Tax (Normal) (2) 6 3 13 13
Opening DTL impact due to change in tax rates (1) 0 0 (1) 0
Profit After Tax 3 15 6 43 34
74
* Re-formatted for better analysis
Values in Rs crore
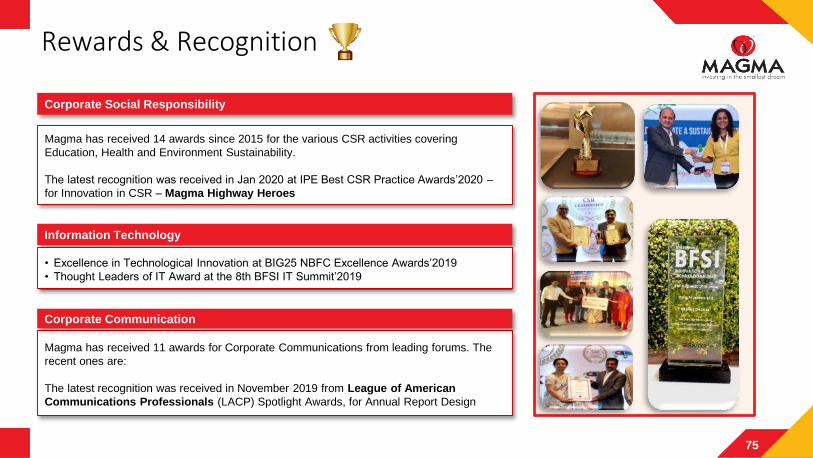
Corporate Social Responsibility
Magma has received 14 awards since 2015 for the various CSR activities covering
Education, Health and Environment Sustainability.
The latest recognition was received in Jan 2020 at IPE Best CSR Practice Awards’2020 –
for Innovation in CSR – Magma Highway Heroes
Information Technology
• Excellence in Technological Innovation at BIG25 NBFC Excellence Awards’2019
• Thought Leaders of IT Award at the 8th BFSI IT Summit’2019
Magma has received 11 awards for Corporate Communications from leading forums. The
recent ones are:
The latest recognition was received in November 2019 from League of American
Communications Professionals (LACP) Spotlight Awards, for Annual Report Design
Corporate Communication
Rewards & Recognition
75

Mid Day meal, M-Education, Swayam Programmes
Magma Highway Heroes
• Training provided to around 2 Lac Truck Drivers at around 300 camps across the
country. PCRA is our official training partner in the activity
• Significant reduction in CO2 Emission and Diesel consumption YOY basis
• Medical camps & E-Toilets at Transport Nagars benefit approx. 70,000 Truck
drivers per year
Magma M-Care – Mobile health Camps
Magma M- Scholar
• Magma M Scholar offers
Scholarship to meritorious
students from poor families
• Dry ration and cooked meal to approx. 15000
families badly effected during COVID-19
pandemic. Most of the beneficiary belongs to
daily wage earner community
• In the last 5 years Magma has supported the academic aspiration of
around 400 meritorious students from humble background
• Few students from 2015 & 2016 batch has completed their college and
has received the job offers from prestigious corporate house
Group level CSR activities are
managed by Magma Foundation
• Magma runs M Care health camps
at Rural India. More than 1 Lac
people benefitted.
• We are planning to conduct 100
camps at COVID-19 effected areas
in FY 21
• Mid-day Meal offered to 6500 kids in Govt. Schools in 7 states (West Bengal,
NCR, Maharashtra, Jharkhand, Andhra, Haryana and Rajasthan)
• Adopted 35 nos. of single teacher school in and around Chennai, TN
• Adopted 3 anganwadi at Alwar, Rajasthan. The center provides learning kits &
meals to approx. 80 kids living in the nearby villages
Swayam – COVID-19 relief activity
Community Commitment: Corporate Social Responsibility
76

This presentation has been prepared by Magma Fincorp Limited (the “Company”), for general information purposes only, without regard to any specific
objectives, suitability, financial situations and needs of any particular person and does not constitute any recommendation or form part of any offer or
invitation, directly or indirectly, in any manner, or inducement to sell or issue, or any solicitation of any offer to purchase or subscribe for, any securities of the
Company, nor shall it or any part of it or the fact of its distribution form the basis of, or be relied on in connection with, any contract or commitment therefor.
This presentation does not solicit any action based on the material contained herein. Nothing in this presentation is intended by the Company to be construed
as legal, accounting or tax advice.
This presentation has been prepared by the Company based upon information available in the public domain. This presentation has not been approved and
will not or may not be reviewed or approved by any statutory or regulatory authority in India or by any Stock Exchange in India. This presentation may include
statements which may constitute forward-looking statements. The actual results could differ materially from those projected in any such forward-looking
statements because of various factors. The Company assumes no responsibility to publicly amend, modify or revise any forward-looking statements, on the
basis of any subsequent developments, information or events, or otherwise.
This presentation contains certain forward-looking statements relating to the business, financial performance, strategy and results of the Company and/or the
industry in which it operates. Forward-looking statements are statements concerning future circumstances and results, and any other statements that are not
historical facts, sometimes identified by the words including, without limitation "believes", "expects", "predicts", "intends", "projects", "plans", "estimates",
"aims", "foresees", "anticipates", "targets", and similar expressions. The forward-looking statements, including those cited from third party sources, contained
in this presentation are based on numerous assumptions and are uncertain and subject to risks. A multitude of factors including, but not limited to, changes in
demand, competition and technology, can cause actual events, performance or results to differ significantly from any anticipated development. Neither the
Company nor its affiliates or advisors or representatives nor any of its or their parent or subsidiary undertakings or any such person's officers or employees
guarantees that the assumptions underlying such forward-looking statements are free from errors nor does either accept any responsibility for the future
accuracy of the forward-looking statements contained in this presentation or the actual occurrence of the forecasted developments. Forward-looking
statements speak only as of the date of this presentation and are not guarantees of future performance. As a result, the Company expressly disclaims any
obligation or undertaking to release any update or revisions to any forward-looking statements in this presentation as a result of any change in expectations or
any change in events, conditions, assumptions or circumstances on which these forward looking statements are based. Given these uncertainties and other
factors, viewers of this presentation are cautioned not to place undue reliance on these forward-looking statements.
DisclaimerDisclaimer
77

The information contained in these materials has not been independently verified. None of the Company, its directors, promoter or affiliates, nor any of its or
their respective employees, advisers or representatives or any other person accepts any responsibility or liability whatsoever, whether arising in tort, contract or
otherwise, for any errors, omissions or inaccuracies in such information or opinions or for any loss, cost or damage suffered or incurred howsoever arising,
directly or indirectly, from any use of this presentation or its contents or otherwise in connection with this presentation, and makes no representation or
warranty, express or implied, for the contents of this presentation including its accuracy, fairness, completeness or verification or for any other statement made
or purported to be made by any of them, or on behalf of them, and nothing in this presentation or at this presentation shall be relied upon as a promise or
representation in this respect, whether as to the past or the future. Past performance is not a guide for future performance. The information contained in this
presentation is current, and if not stated otherwise, made as of the date of this presentation. The Company undertakes no obligation to update or revise any
information in this presentation as a result of new information, future events or otherwise. Any person/ party intending to provide finance/ invest in the shares/
businesses of the Company shall do so after seeking their own professional advice and after carrying out their own due diligence procedure to ensure that they
are making an informed decision.
This presentation is not a prospectus, a statement in lieu of a prospectus, an offering circular, an advertisement or an offer document under the Companies Act,
2013, as amended, the Securities and Exchange Board of India (Issue of Capital and Disclosure Requirements) Regulations, 2009, as amended, or any other
applicable law in India.
This presentation is strictly confidential and may not be copied or disseminated, in whole or in part, and in any manner or for any purpose. No person is
authorized to give any information or to make any representation not contained in or inconsistent with this presentation and if given or made, such information
or representation must not be relied upon as having been authorized by any person. Failure to comply with this restriction may constitute a violation of the
applicable securities laws. Neither this document nor any part or copy of it may be distributed, directly or indirectly, in the United States. The distribution of this
document in certain jurisdictions may be restricted by law and persons in to whose possession this presentation comes should inform themselves about and
observe any such restrictions. By reviewing this presentation, you agree to be bound by the foregoing limitations. You further represent and agree that you are
located outside the United States and you are permitted under the laws of your jurisdiction to receive this presentation.
This presentation is not an offer to sell or a solicitation of any offer to buy the securities of the Company in the United States or in any other jurisdiction where
such offer or sale would be unlawful. Securities may not be offered, sold, resold, pledged, delivered, distributed or transferred, directly or indirectly, in to or
within the United States absent registration under the United States Securities Act of 1933, as amended (the “Securities Act”), except pursuant to an exemption
from, or in a transaction not subject to, the registration requirements of the Securities Act and in compliance with any applicable securities laws of any state or
other jurisdiction of the United States. The Company’s securities have not been and will not be registered under the Securities Act.
Disclaimer (Contd.)
78