Embed Size (px)
Citation preview

Excel Charts and Graphs
Instructor Heidi Lyons
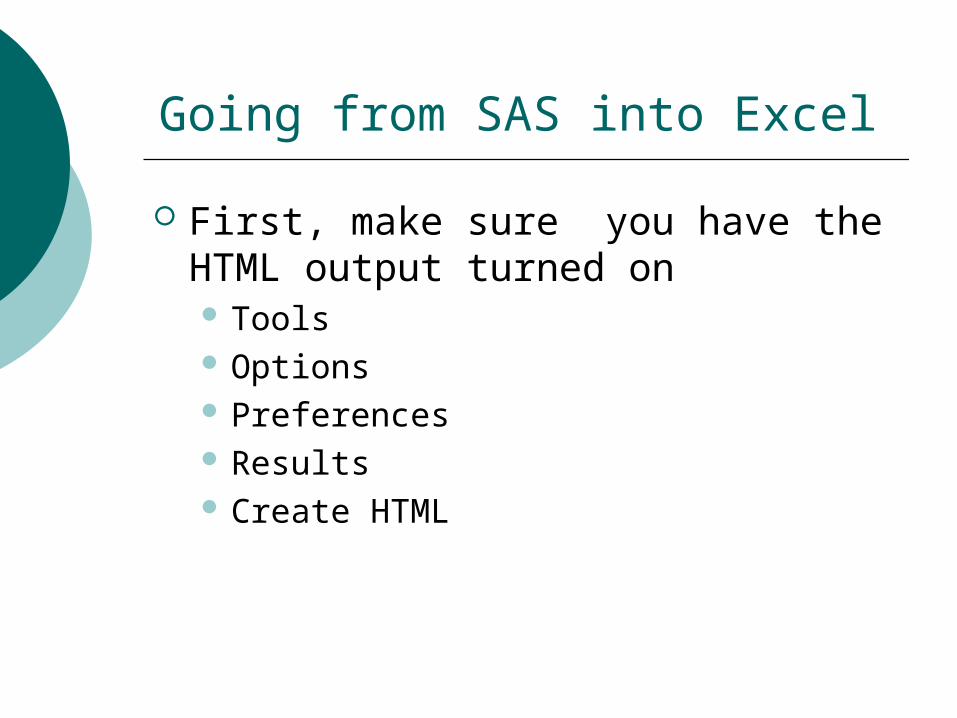
Going from SAS into Excel
First, make sure you have the HTML output turned on Tools Options Preferences Results Create HTML

Using the Chart Wizard

Using Chart Wizard
1. Select the cells that contain the numbers wanted in the chart
2. Click on the Wizard tool3. Choose a type of chart4. Data ranges5. Added Detail6. As object in or As new sheet

Using the Chart Wizard

Using the Chart Wizard

Using the Chart Wizard

Using the Chart Wizard

Using the Chart Wizard

Using the Chart Wizard
Percent of Children under 18 Below Poverty
0
5
10
15
20
25
30
35
Place
Per
cen
t
Series1

More than one Data Series
Example


Percent of Children under 18 years Below Poverty Level in the Past 12 Months
05
10152025303540
Place
Per
cen
t
Place

Percent of Children under 18 Below Poverty
0
5
10
15
20
25
30
35
Place
Percent Series1

Other Types of Charts
There are 14 different types of Charts Column Bar Line Pie Scatter Surface Cylinder, Cone, and Pyramid

Bar
Percent of Children under 18 years Below Poverty Level in the Past 12 Months
0 5 10 15 20 25 30 35
District of Columbia
Mississippi
Louisiana
New Mexico
West Virginia
Arkansas
Texas
Alabama
Oklahoma
South Carolina
Place Place

Line
Percent of Children under 18 years Below Poverty Level in the Past 12 Months
0
5
10
15
20
25
30
35
Place
Place

Pie
Married-couple family:
Male householder, no wifepresent:
Female householder, nohusband present:
Pie
Example

Scatter
Residuals X-Y graphs

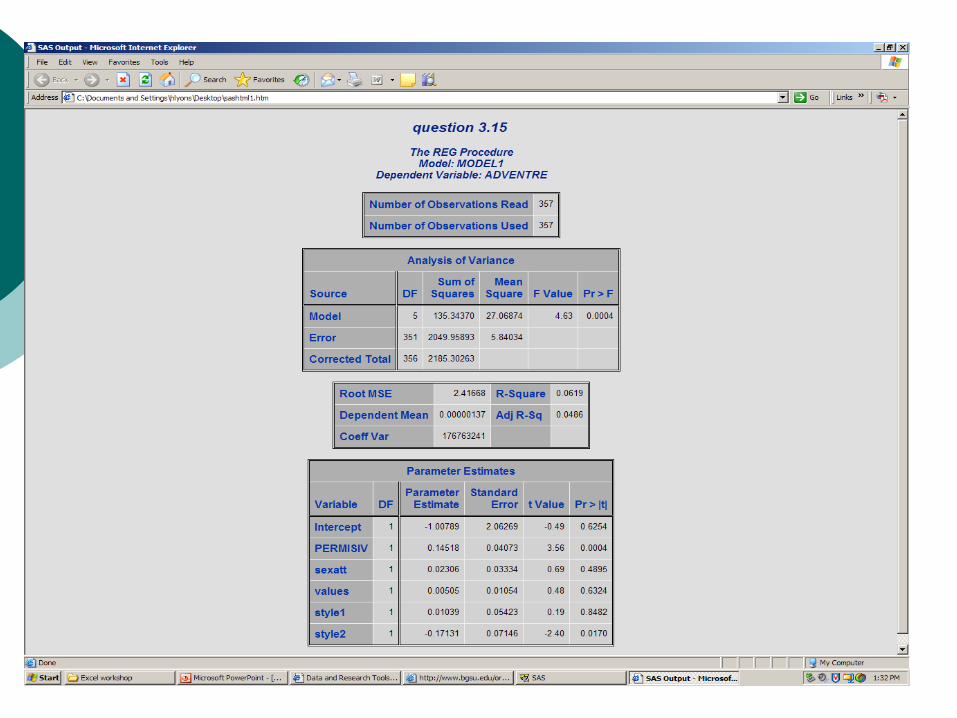
Running Regression in Excel
Very limited Tool
Add-Ins….

Running Regression in Excel
Tools Data Analysis

Running Regression in Excel
Y-range put in your dependent variables values Must be a column Same with X-range
Ask for output in new workbook
Ask for residuals


Scatter
-6
-4
-2
0
2
4
6
0 1 2 3 4 5 6 7Series1

Cylinder, Cone, and Pyramid
Dis
tric
t of C
olum
bia
Loui
sian
a
Wes
t Virg
inia
Tex
as
Okl
ahom
a
0
5
10
15
20
25
30
35
Percent
Place
Percent of Children under 18 Below Poverty
Series1

Combination

Combination
0.00%
0.50%
1.00%
1.50%
2.00%
2.50%
3.00%
3.50%
4.00%
4.50%
1996 1997 1998 1999 2000 2001 2002 2003
48,000
49,000
50,000
51,000
52,000
53,000
54,000
55,000
Unmarried HH
Percent of Births to UnmarriedMothers

Population Pyramid
5 4 3 2 1 0 1 2 3 4 5
under 5
5-9
10-14
15-19
20-24
25-29
30-34
35-39
40-44
45-49
50-54
55-59
60-64
65-69
70-74
75-79
80-84
85 and over


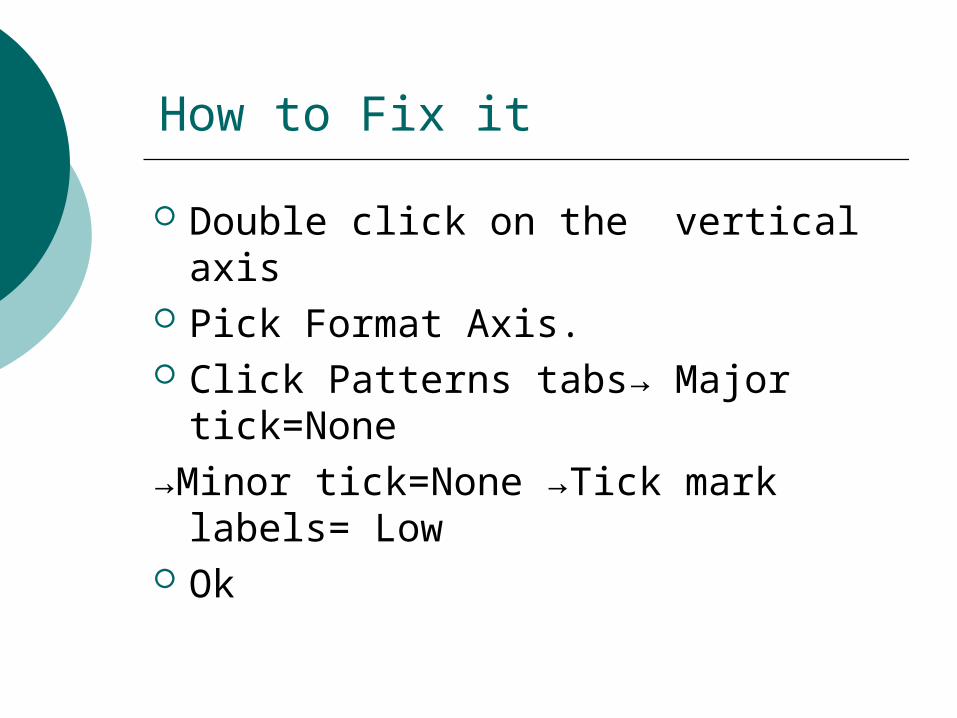
How to Fix it
Double click on the vertical axis Pick Format Axis. Click Patterns tabs→ Major
tick=None→Minor tick=None →Tick mark
labels= Low Ok

How to Fix it
Double click on the horizontal axis Pick Format Axis. Click Number tabs→ Category =
Custom→Type = 0 Ok

How to Fix it
Click on the Bars Go to Options Overlap=100 Type=0 OK


Getting the Cart into Word
Right Click Copy Edit Paste Special

Paste Special

Getting your Chart into Power Point

Other CFDR Help
Come on down CFDR: Bowling Green State Universi
ty