Embed Size (px)
Citation preview
Exane BNP Paribas
CEO Conference
Paris
June 14-15, 2017
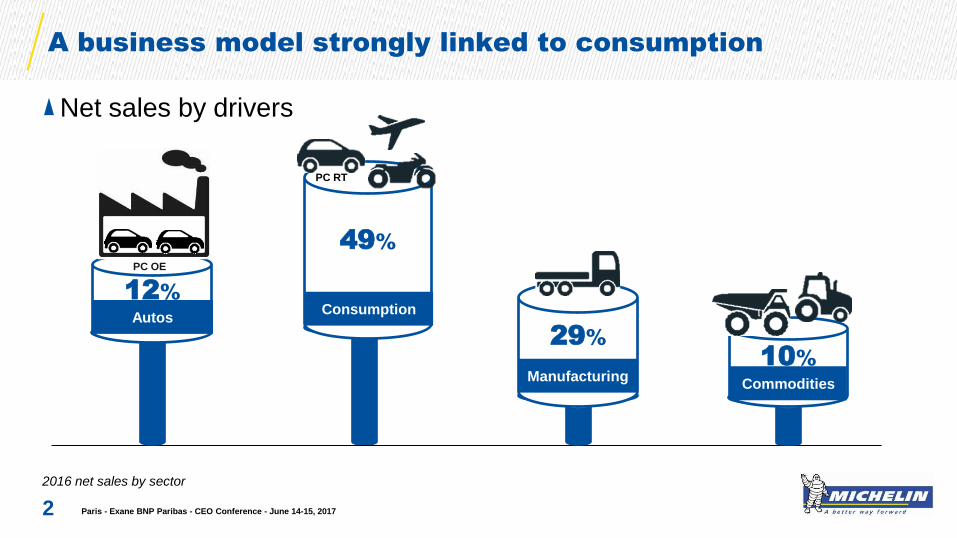
A business model strongly linked to consumption
2016 net sales by sector
49%
Consumption
Net sales by drivers
Autos
PC OE
12%
29%
Manufacturing 10%
Commodities
PC RT
2 Paris - Exane BNP Paribas - CEO Conference - June 14-15, 2017

June 14-15, 2017
CEO Conference
Levers for Growth
Levers for Competitiveness
Ambition for Profitability
Paris - Exane BNP Paribas - CEO Conference - June 14-15, 2017 3
1
2
3

June 14-15, 2017
CEO Conference
1 Levers for Growth
Paris - Exane BNP Paribas - CEO Conference - June 14-15, 2017 4
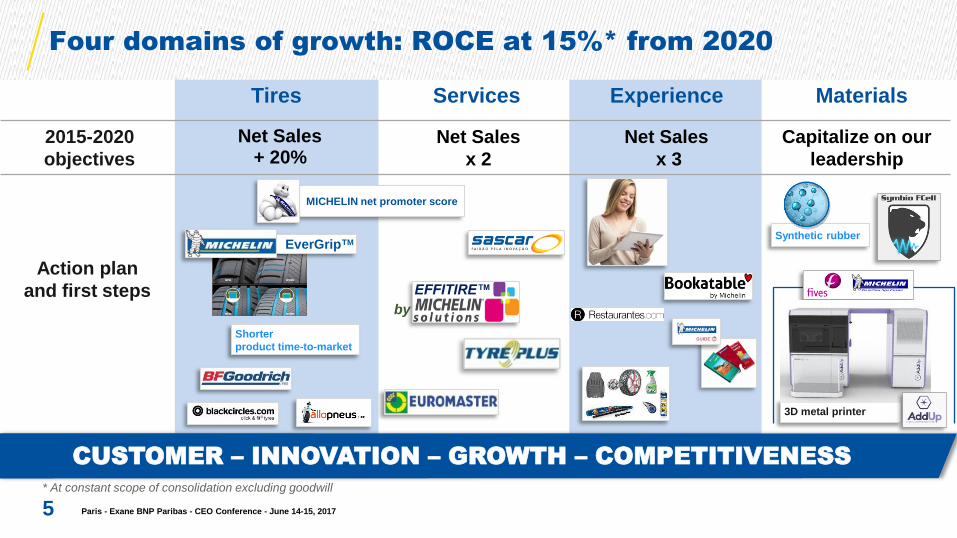
Four domains of growth: ROCE at 15%* from 2020
Paris - Exane BNP Paribas - CEO Conference - June 14-15, 2017 5
Tires Services Experience Materials
CUSTOMER – INNOVATION – GROWTH – COMPETITIVENESS
by
EFFITIRE™
Shorter
product time-to-market
MICHELIN net promoter score
2015-2020
objectives
Net Sales
+ 20% Net Sales
x 2
Net Sales
x 3
Capitalize on our
leadership
Action plan
and first steps
3D metal printer
* At constant scope of consolidation excluding goodwill
EverGrip
TM Synthetic rubber
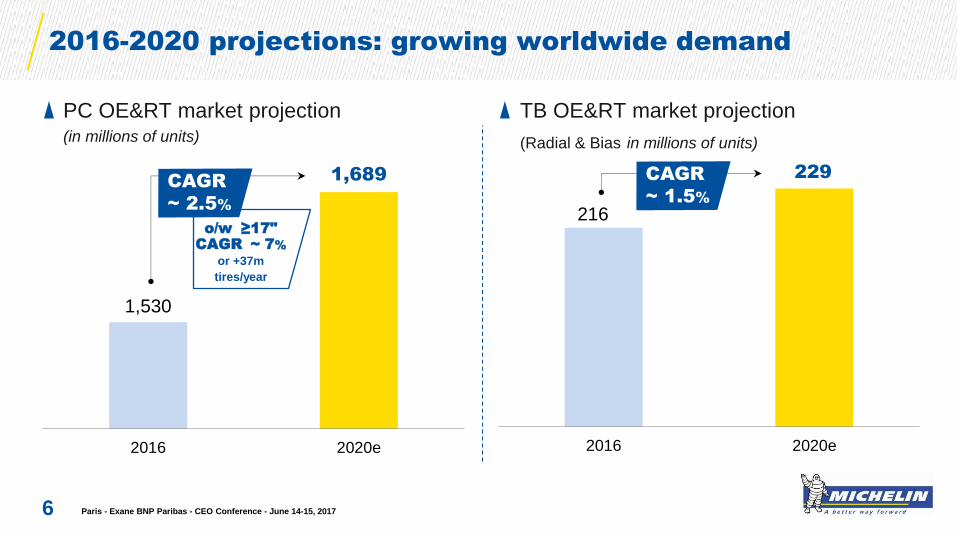
216
229
2016 2020e
2016-2020 projections: growing worldwide demand
PC OE&RT market projection (in millions of units)
TB OE&RT market projection
(Radial & Bias in millions of units)
6
1,530
1,689
2016 2020e
o/w ≥17" CAGR ~ 7%
or +37m
tires/year
CAGR
~ 1.5%
CAGR
~ 2.5%
Paris - Exane BNP Paribas - CEO Conference - June 14-15, 2017

2017: Mining tires, return to growth – Agricultural tires,
stabilizing before returning to growth
Paris - Exane BNP Paribas - CEO Conference - June 14-15, 2017
Agricultural tires* (base 100 in 2016, in tonnes)
* OE & RT in Europe and North America
Mining tires (base 100 in 2016, in tonnes)
7
100 ~100
2016 2017e 2020e
~104/108
100
2016 2017e 2020e
~110/115
~125/130

Product launches driving volume and market share gains
Paris - Exane BNP Paribas - CEO Conference - June 14-15, 2017 8
Passenger Car Truck Specialty
MICHELIN
X-One Urban Bus MICHELIN
X®Guard
MICHELIN
XWorks
MICHELIN
X Line Energy Z
MICHELIN
Power RS MICHELIN
XDR3
Convoy TripleA
MICHELIN Pilot
Sport 4 S
MICHELIN
CrossClimate +
MICHELIN
Premier LTX
2 tires in 1
technology
BFGoodrich All Terrain T/A K02
MICHELIN
Alpin 5
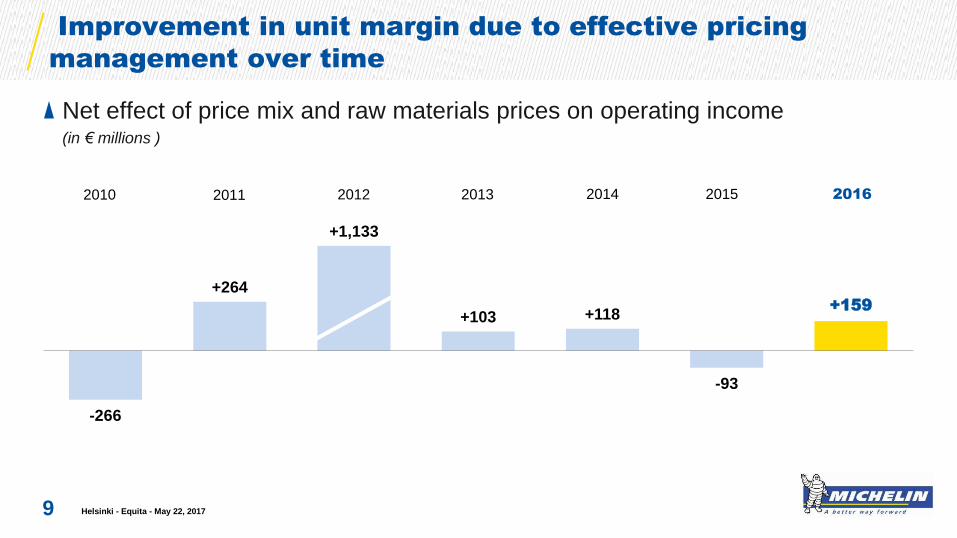
Net effect of price mix and raw materials prices on operating income (in € millions )
-266
+264
+1,133
+103 +118
-93
+159
Improvement in unit margin due to effective pricing
management over time
Helsinki - Equita - May 22, 2017 9
2013 2014 2015 2016 2012 2011 2010

Passenger car and Light truck tires: solid performance
across all brands and in every segment
Paris - Exane BNP Paribas - CEO Conference - June 14-15, 2017
Passenger car and Light truck tires Q1 2017 growth (YoY)
Source: Michelin
10
+5%
+15%
+8% +9%
+31%
+8%
Market OE + RT
Market ≥ 18"
RS1Total
≥ 18"
Otherbrands
MICHELIN brand

June 14-15, 2017
CEO Conference
2 Levers for Competitiveness
Paris - Exane BNP Paribas - CEO Conference - June 14-15, 2017 11
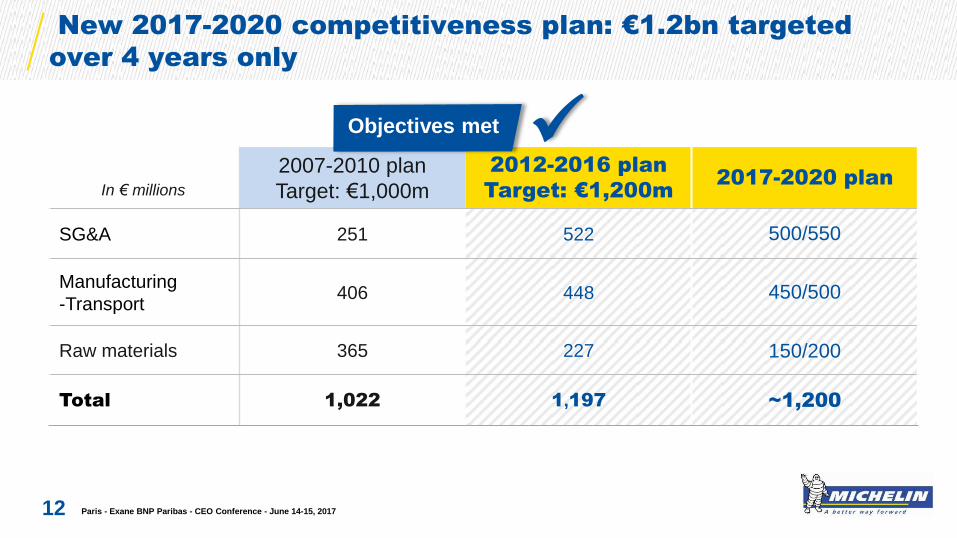
New 2017-2020 competitiveness plan: €1.2bn targeted
over 4 years only
12 Paris - Exane BNP Paribas - CEO Conference - June 14-15, 2017
2007-2010 plan
Target: €1,000m
2012-2016 plan
Target: €1,200m 2017-2020 plan
SG&A 251 522 500/550
Manufacturing
-Transport 406 448 450/500
Raw materials 365 227 150/200
Total 1,022 1,197 ~1,200
In € millions
Objectives met
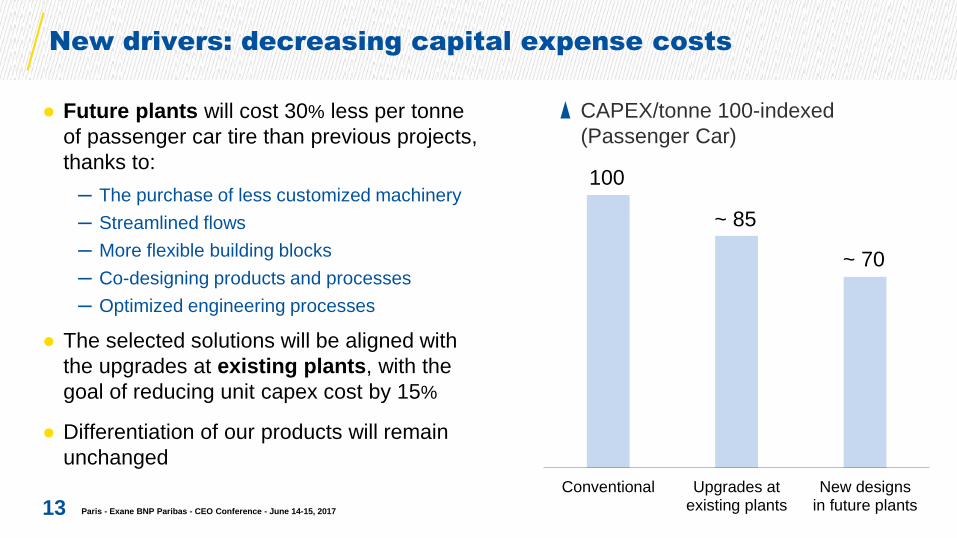
● Future plants will cost 30% less per tonne
of passenger car tire than previous projects,
thanks to:
─ The purchase of less customized machinery
─ Streamlined flows
─ More flexible building blocks
─ Co-designing products and processes
─ Optimized engineering processes
● The selected solutions will be aligned with
the upgrades at existing plants, with the
goal of reducing unit capex cost by 15%
● Differentiation of our products will remain
unchanged
New drivers: decreasing capital expense costs
Paris - Exane BNP Paribas - CEO Conference - June 14-15, 2017 13
100
~ 85
~ 70
Conventional Upgrades atexisting plants
New designsin future plants
CAPEX/tonne 100-indexed
(Passenger Car)
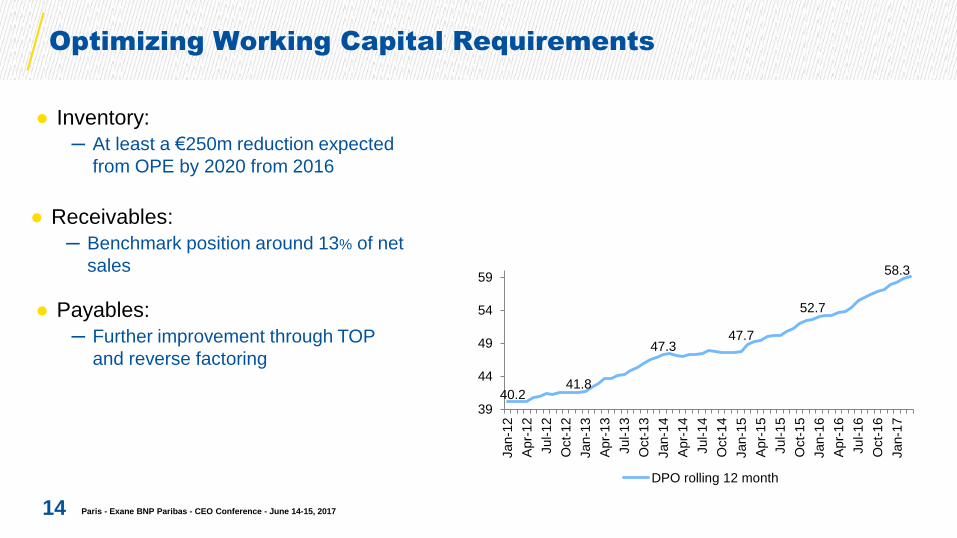
Optimizing Working Capital Requirements
Paris - Exane BNP Paribas - CEO Conference - June 14-15, 2017 14
● Inventory:
─ At least a €250m reduction expected
from OPE by 2020 from 2016
● Receivables:
─ Benchmark position around 13% of net
sales
● Payables:
─ Further improvement through TOP
and reverse factoring
40.2 41.8
47.3 47.7
52.7
58.3
39
44
49
54
59
Jan-1
2
Apr-
12
Jul-1
2
Oct-
12
Jan-1
3
Apr-
13
Jul-1
3
Oct-
13
Jan-1
4
Apr-
14
Jul-1
4
Oct-
14
Jan-1
5
Apr-
15
Jul-1
5
Oct-
15
Jan-1
6
Apr-
16
Jul-1
6
Oct-
16
Jan-1
7
DPO rolling 12 month

June 14-15, 2017
CEO Conference
3 Ambition for Profitability
Paris - Exane BNP Paribas - CEO Conference - June 14-15, 2017 15
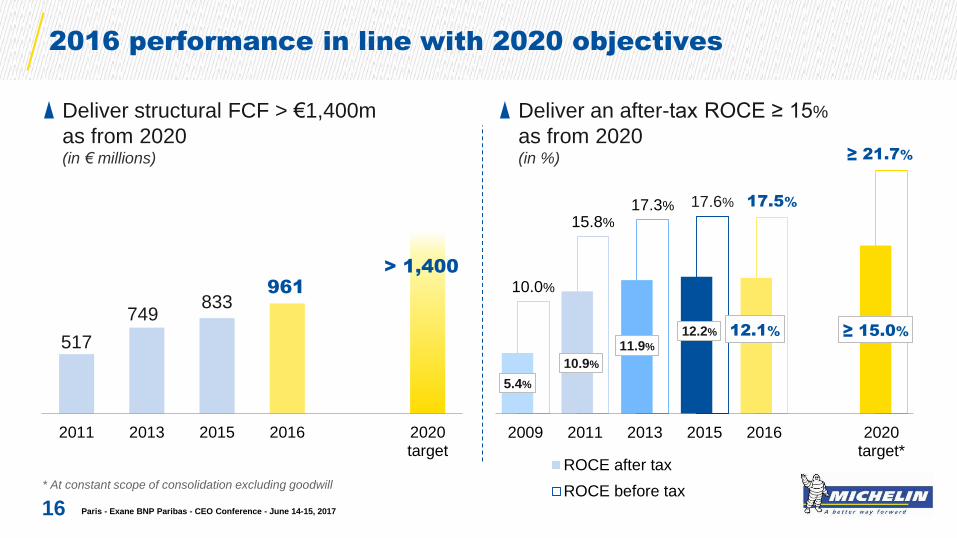
5.4%
10.9%
11.9%
12.2% 12.1% ≥ 15.0%
10.0%
15.8%
17.3% 17.6% 17.5%
≥ 21.7%
2009 2011 2013 2015 2016 2020target*
ROCE after tax
ROCE before tax
Deliver an after-tax ROCE ≥ 15%
as from 2020 (in %)
2016 performance in line with 2020 objectives
Deliver structural FCF > €1,400m
as from 2020 (in € millions)
* At constant scope of consolidation excluding goodwill
16
517
749 833
961
2011 2013 2015 2016 2020target
> 1,400
Paris - Exane BNP Paribas - CEO Conference - June 14-15, 2017
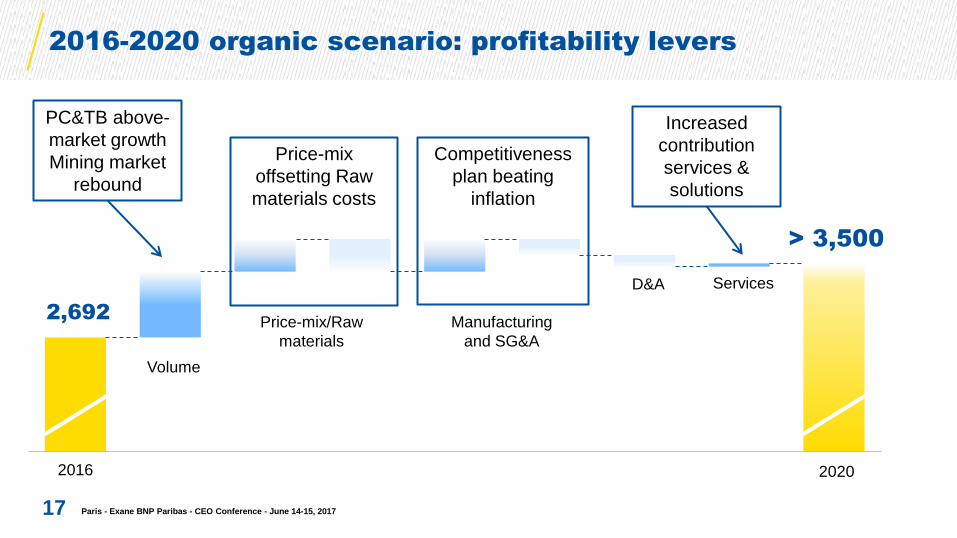
Price-mix
offsetting Raw
materials costs
2016 2020
2016-2020 organic scenario: profitability levers
Paris - Exane BNP Paribas - CEO Conference - June 14-15, 2017 17
Competitiveness
plan beating
inflation
2,692
> 3,500
PC&TB above-
market growth
Mining market
rebound
Increased
contribution
services &
solutions
Volume
Price-mix/Raw
materials
Manufacturing
and SG&A
D&A Services
2020

2017 guidance confirmed: on the road to our 2020 objectives
Paris - Exane BNP Paribas - CEO Conference - June 14-15, 2017
* Adjusted for the payment in January 2017 of the €193m in interest
on the 2017 Océane zero-coupon convertible bonds.
18
2017
Volumes Growth in line
with the markets
Operating income from recurring activities
at constant exchange rates
Net price-mix/raw materials effect
≥ 2016
Non-indexed businesses: neutral
Structural FCF* > €900m
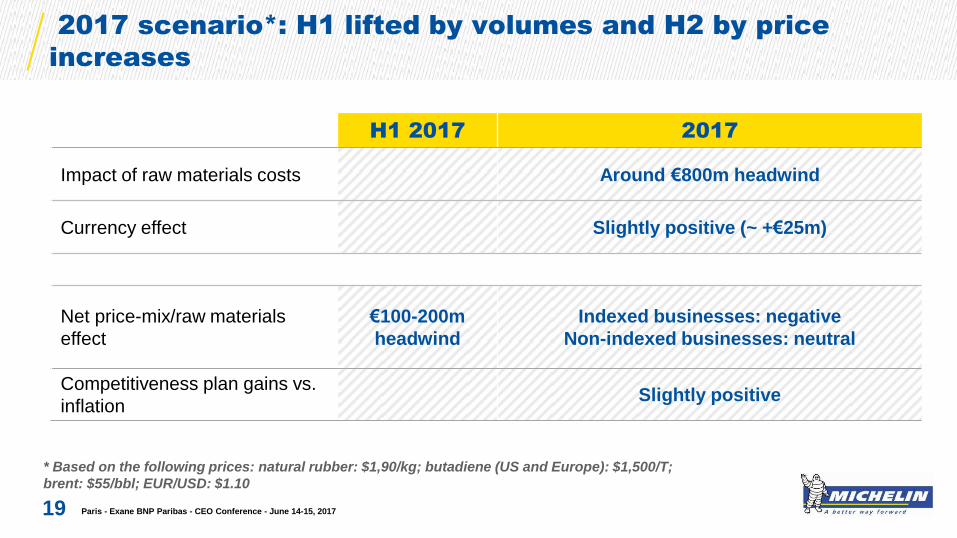
2017 scenario*: H1 lifted by volumes and H2 by price
increases
Paris - Exane BNP Paribas - CEO Conference - June 14-15, 2017 19
H1 2017 2017
Impact of raw materials costs Around €800m headwind
Currency effect Slightly positive (~ +€25m)
Net price-mix/raw materials
effect
€100-200m
headwind
Indexed businesses: negative
Non-indexed businesses: neutral
Competitiveness plan gains vs.
inflation Slightly positive
* Based on the following prices: natural rubber: $1,90/kg; butadiene (US and Europe): $1,500/T;
brent: $55/bbl; EUR/USD: $1.10
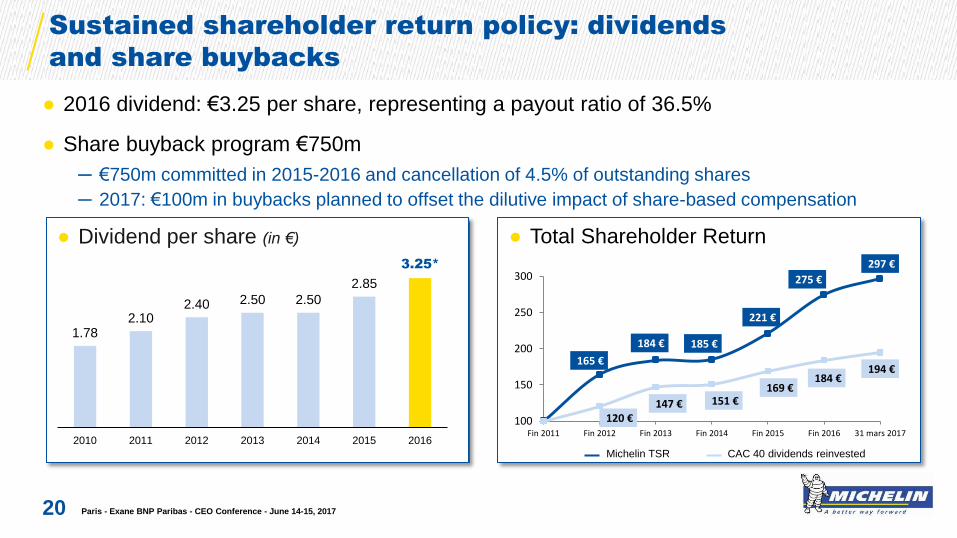
● 2016 dividend: €3.25 per share, representing a payout ratio of 36.5%
● Share buyback program €750m
─ €750m committed in 2015-2016 and cancellation of 4.5% of outstanding shares
─ 2017: €100m in buybacks planned to offset the dilutive impact of share-based compensation
Sustained shareholder return policy: dividends
and share buybacks
Paris - Exane BNP Paribas - CEO Conference - June 14-15, 2017 20
● Dividend per share (in €)
1.78 2.10
2.40 2.50 2.50
2.85
3.25*
2010 2011 2012 2013 2014 2015 2016
● Total Shareholder Return
Michelin TSR CAC 40 dividends reinvested
165 €
184 € 185 €
221 €
275 €
297 €
120 € 147 € 151 €
169 € 184 €
194 €
100
150
200
250
300
Fin 2011 Fin 2012 Fin 2013 Fin 2014 Fin 2015 Fin 2016 31 mars 2017
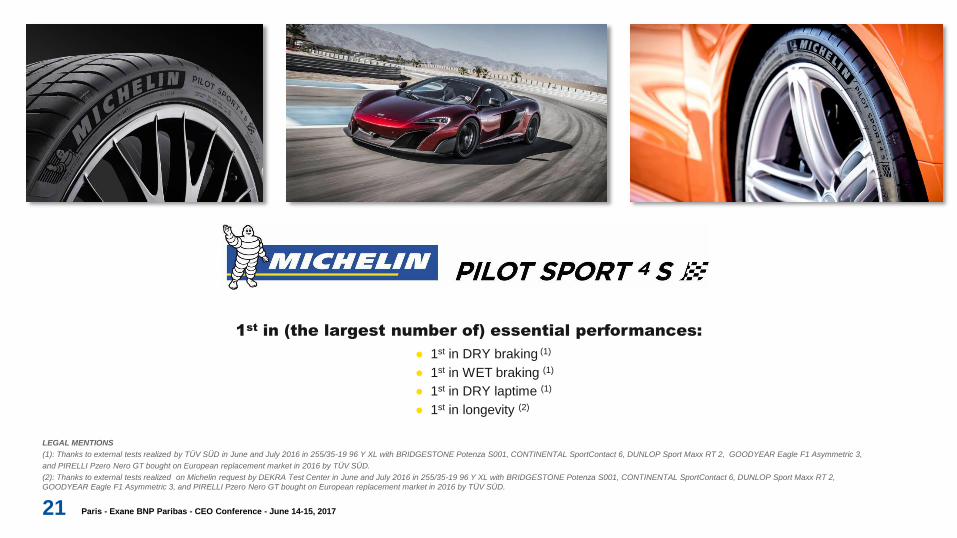
LEGAL MENTIONS
(1): Thanks to external tests realized by TÜV SÜD in June and July 2016 in 255/35-19 96 Y XL with BRIDGESTONE Potenza S001, CONTINENTAL SportContact 6, DUNLOP Sport Maxx RT 2, GOODYEAR Eagle F1 Asymmetric 3,
and PIRELLI Pzero Nero GT bought on European replacement market in 2016 by TÜV SÜD.
(2): Thanks to external tests realized on Michelin request by DEKRA Test Center in June and July 2016 in 255/35-19 96 Y XL with BRIDGESTONE Potenza S001, CONTINENTAL SportContact 6, DUNLOP Sport Maxx RT 2,
GOODYEAR Eagle F1 Asymmetric 3, and PIRELLI Pzero Nero GT bought on European replacement market in 2016 by TÜV SÜD.
21 Paris - Exane BNP Paribas - CEO Conference - June 14-15, 2017
1st
in (the largest number of) essential performances:
● 1st in DRY braking (1)
● 1st in WET braking (1)
● 1st in DRY laptime (1)
● 1st in longevity (2)
● July 25, 2017 after close of trading: First-half 2017 results
● October 19, 2017 after close of trading: Third-quarter 2017 net sales
Investor calendar
22 Paris - Exane BNP Paribas - CEO Conference - June 14-15, 2017

June 14-15, 2017
CEO Conference
Appendices
Paris - Exane BNP Paribas - CEO Conference - June 14-15, 2017 23

Friendly draft simplified cash public tender offer to acquire
the outstanding shares of SIPH
Paris - Exane BNP Paribas - CEO Conference - June 14-15, 2017 24
SIPH production &
remiling
33%
Remiling by
SIPH
67%
SAPH in Cote d’Ivoire
- 6 plantations
- 5 plants
CRC in Liberia
- 1 plantation
- 1 plant
GREL in Ghana
- 1 plantation
- 1 plant
RENL in Nigeria
- 4 plantations
- 1 plant
SIPH Headquarter
● in concert with the Ivory Coast company SIFCA
● to acquire the 1,042,324 shares in SIPH not
currently held by the concert parties
● at a price of €85 per SIPH share
● 220,000 ton production, o/w 70kT from SIPH-
owned plantations
95
100
105
110
115
120
125
130
135
140
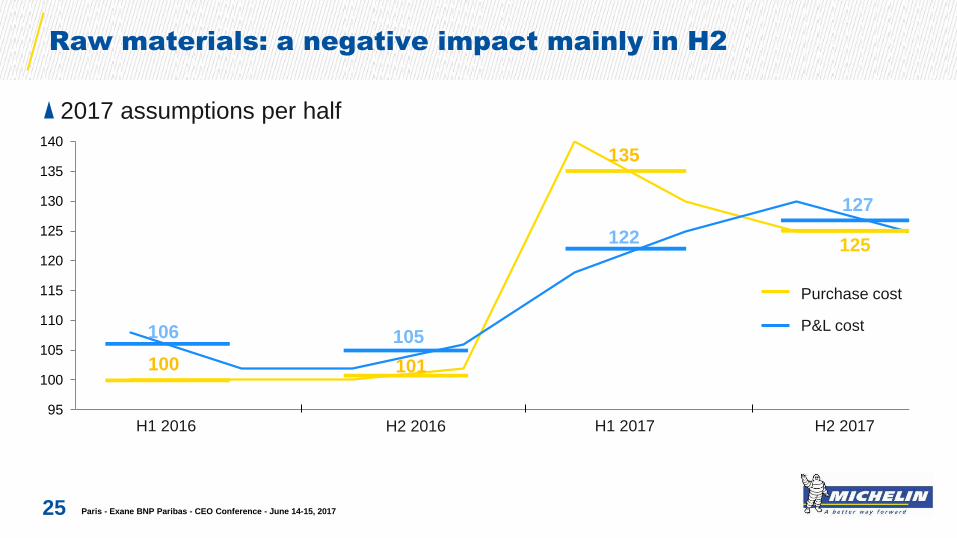
Raw materials: a negative impact mainly in H2
Paris - Exane BNP Paribas - CEO Conference - June 14-15, 2017
2017 assumptions per half
25
Purchase cost
P&L cost
101
H1 2016 H2 2016 H1 2017 H2 2017
106
100
105
135
122
127
125
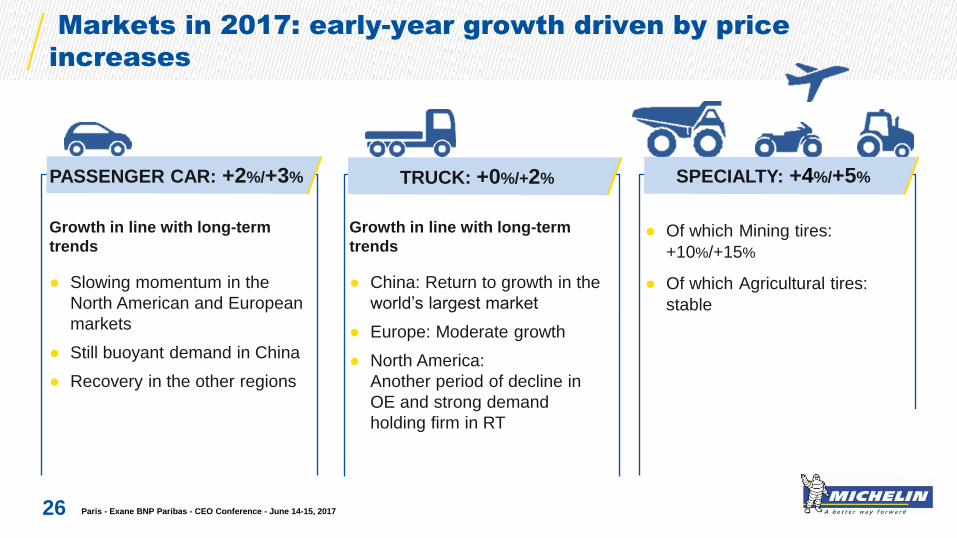
Markets in 2017: early-year growth driven by price
increases
Paris - Exane BNP Paribas - CEO Conference - June 14-15, 2017 26
Growth in line with long-term
trends
● China: Return to growth in the
world’s largest market
● Europe: Moderate growth
● North America:
Another period of decline in
OE and strong demand
holding firm in RT
● Of which Mining tires:
+10%/+15%
● Of which Agricultural tires:
stable
TRUCK: +0%/+2% PASSENGER CAR: +2%/+3% SPECIALTY: +4%/+5%
Growth in line with long-term
trends
● Slowing momentum in the
North American and European
markets
● Still buoyant demand in China
● Recovery in the other regions
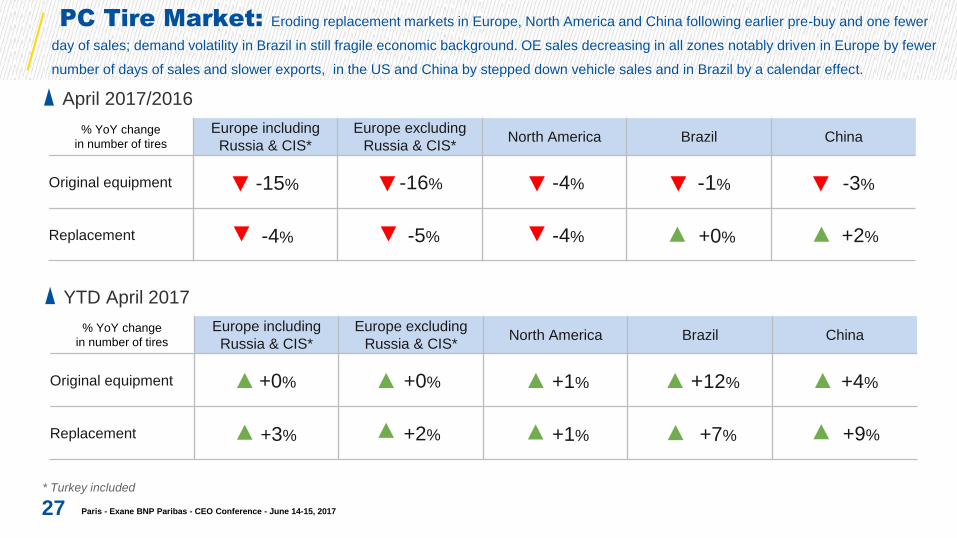
PC Tire Market: Eroding replacement markets in Europe, North America and China following earlier pre-buy and one fewer
day of sales; demand volatility in Brazil in still fragile economic background. OE sales decreasing in all zones notably driven in Europe by fewer
number of days of sales and slower exports, in the US and China by stepped down vehicle sales and in Brazil by a calendar effect.
27 * Turkey included
Paris - Exane BNP Paribas - CEO Conference - June 14-15, 2017
April 2017/2016
% YoY change
in number of tires
Europe including
Russia & CIS*
Europe excluding
Russia & CIS* North America Brazil China
Original equipment -15% -16% -4% -1% -3%
Replacement -4% -5% -4% +0% +2%
YTD April 2017
% YoY change
in number of tires
Europe including
Russia & CIS*
Europe excluding
Russia & CIS* North America Brazil China
Original equipment +0% +0% +1% +12% +4%
Replacement +3% +2% +1% +7% +9%
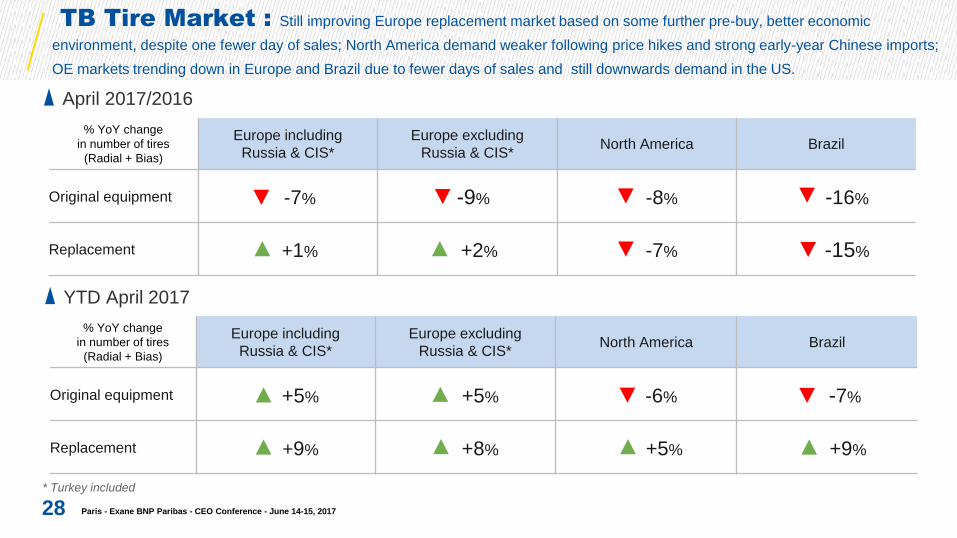
TB Tire Market : Still improving Europe replacement market based on some further pre-buy, better economic
environment, despite one fewer day of sales; North America demand weaker following price hikes and strong early-year Chinese imports;
OE markets trending down in Europe and Brazil due to fewer days of sales and still downwards demand in the US.
28 Paris - Exane BNP Paribas - CEO Conference - June 14-15, 2017
* Turkey included
April 2017/2016
% YoY change
in number of tires
(Radial + Bias)
Europe including
Russia & CIS*
Europe excluding
Russia & CIS* North America Brazil
Original equipment -7% -9% -8% -16%
Replacement +1% +2% -7% -15%
YTD April 2017
% YoY change
in number of tires
(Radial + Bias)
Europe including
Russia & CIS*
Europe excluding
Russia & CIS* North America Brazil
Original equipment +5% +5% -6% -7%
Replacement +9% +8% +5% +9%

Worldwide price increases for Michelin
29
Europe North
America
South
America China ASEAN
Up to 8% over the
first four months
Up to 8% from
Feb. to April
Up to 3%
in January
Up to 8%
in February
Up to 8%
in March-April
● Further price increases have been announced in Europe in the Truck (up 5% to 8% from May),
Passenger car and Light truck (up 2% to 3% from June), and Agricultural (up 12% from July) segments.
Paris - Exane BNP Paribas - CEO Conference - June 14-15, 2017
Q1 2017: €5.6 billion in net sales (up 10%), with strong
growth in volumes
● Generally expanding market environment
─ Sustained OE demand
─ RT demand buoyed by early buying ahead of price increases
─ Rebound in Mining tire demand
● Q1 volumes up 7.3%, lifted by early dealer buying and the recovery in Mining tire sales
● The price-mix effect reduced net sales by just 0.1%, a sharp improvement led by:
─ The success of the new tire and services solutions aligned with customer needs
─ The favorable mix effect, primarily reflecting 31% growth in volumes in the premium 18’’+ segment
● 2017 guidance confirmed, in line with our 2020 objectives
Paris - Exane BNP Paribas - CEO Conference - June 14-15, 2017 30
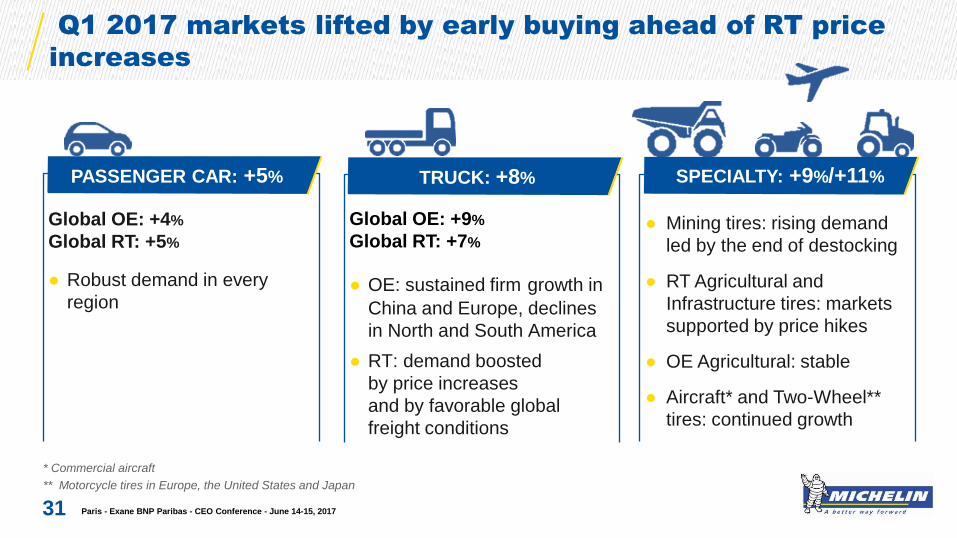
Q1 2017 markets lifted by early buying ahead of RT price
increases
Paris - Exane BNP Paribas - CEO Conference - June 14-15, 2017 31
Global OE: +4%
Global RT: +5%
● Robust demand in every
region
Global OE: +9%
Global RT: +7%
● OE: sustained firm growth in
China and Europe, declines
in North and South America
● RT: demand boosted
by price increases
and by favorable global
freight conditions
● Mining tires: rising demand
led by the end of destocking
● RT Agricultural and
Infrastructure tires: markets
supported by price hikes
● OE Agricultural: stable
● Aircraft* and Two-Wheel**
tires: continued growth
* Commercial aircraft
** Motorcycle tires in Europe, the United States and Japan
TRUCK: +8% PASSENGER CAR: +5% SPECIALTY: +9%/+11%
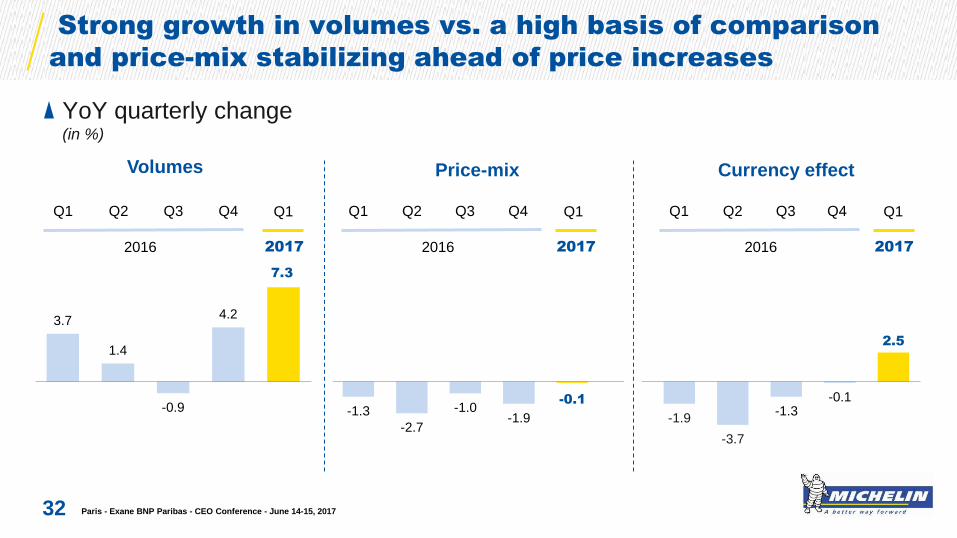
Strong growth in volumes vs. a high basis of comparison
and price-mix stabilizing ahead of price increases
Paris - Exane BNP Paribas - CEO Conference - June 14-15, 2017
YoY quarterly change (in %)
32
-1.3
-2.7
-1.0 -1.9
-0.1
-1.9
-3.7
-1.3 -0.1
2.5
Volumes Price-mix Currency effect
3.7
1.4
-0.9
4.2
7.3
2016 2017
Q1 Q2 Q3 Q4 Q1
2016 2017
Q1 Q2 Q3 Q4 Q1
2016 2017
Q1 Q2 Q3 Q4 Q1

2016 guidance
Volumes Above-market
growth
Operating income from recurring
activities at constant exchange
rates > 2015
Structural FCF > €800m
2016: a year of progress, in line with our 2020 roadmap
Paris - Exane BNP Paribas - CEO Conference - June 14-15, 2017 33
2016 actual
+2.1%
€2,692m
up €235m
€961m
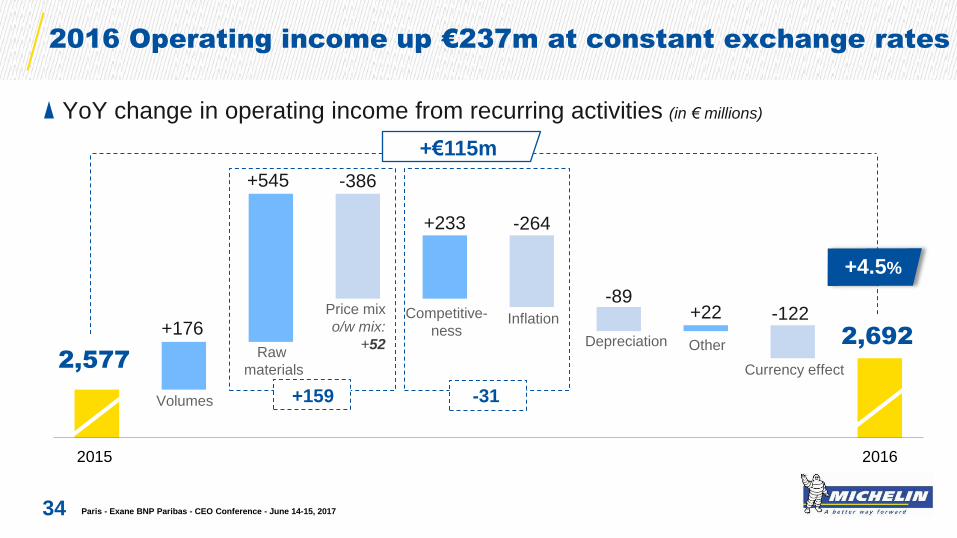
2,577
2,692 +176
+545 -386
+233 -264
-89 +22 -122
2015 2016
YoY change in operating income from recurring activities (in € millions)
2016 Operating income up €237m at constant exchange rates
Paris - Exane BNP Paribas - CEO Conference - June 14-15, 2017 34
Volumes
Currency effect
Other
Inflation Competitive-
ness
Price mix
o/w mix:
+52 Raw
materials
-31 +159
Depreciation
+€115m
+4.5%
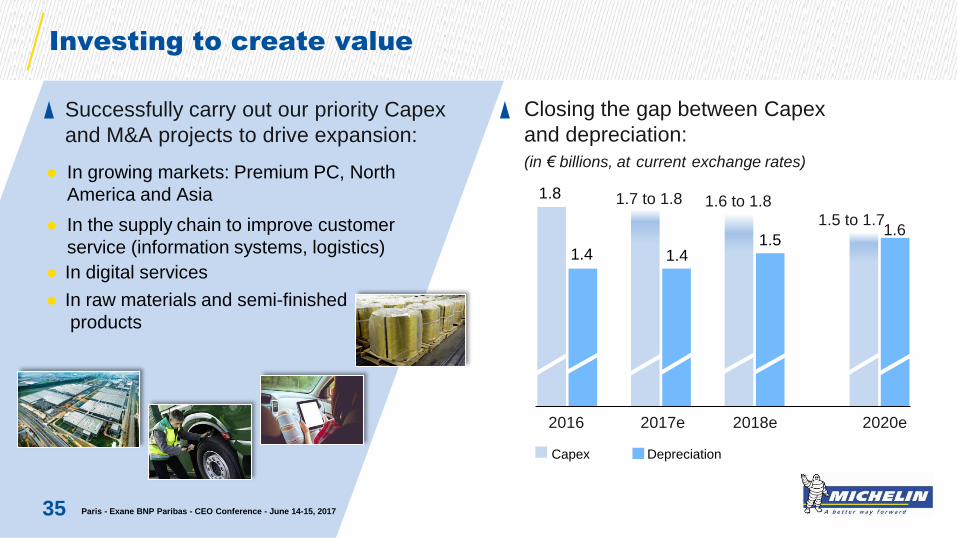
Investing to create value
Paris - Exane BNP Paribas - CEO Conference - June 14-15, 2017
Closing the gap between Capex
and depreciation:
(in € billions, at current exchange rates) ● In growing markets: Premium PC, North
America and Asia
● In the supply chain to improve customer
service (information systems, logistics)
● In digital services
● In raw materials and semi-finished
products
Successfully carry out our priority Capex
and M&A projects to drive expansion:
35
2016 2017e 2018e 2020e
1.8
1.4 1.4 1.5
1.5 to 1.7
Capex Depreciation
1.6 to 1.8
1.6
1.7 to 1.8
1,00
1,05
1,10
1,15
1,20
1,25
1,30
1,35
1,40
1,45
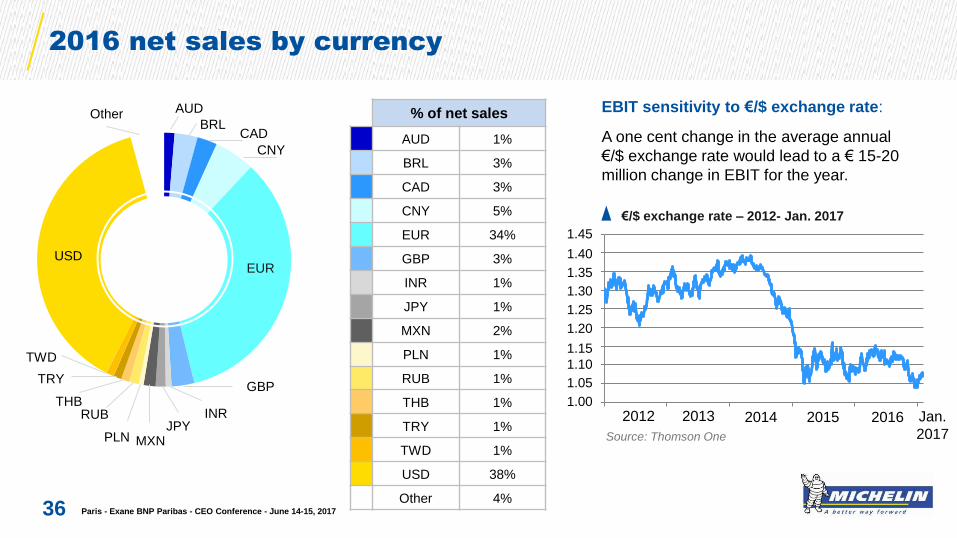
2016 net sales by currency
36
Source: Thomson One
EBIT sensitivity to €/$ exchange rate:
A one cent change in the average annual
€/$ exchange rate would lead to a € 15-20
million change in EBIT for the year.
€/$ exchange rate – 2012- Jan. 2017
USD EUR
GBP
CNY
CAD BRL
AUD Other
TRY
THB RUB
MXN JPY
INR
PLN
% of net sales
AUD 1%
BRL 3%
CAD 3%
CNY 5%
EUR 34%
GBP 3%
INR 1%
JPY 1%
MXN 2%
PLN 1%
RUB 1%
THB 1%
TRY 1%
TWD 1%
USD 38%
Other 4%
TWD
Paris - Exane BNP Paribas - CEO Conference - June 14-15, 2017
2012 2014 2015 2016 2013 Jan.
2017
1.45
1.40
1.35
1.30
1.25
1.20
1.15
1.10
1.05
1.00
100
150
200
250
300
0
100
200
300
400
0
50
100
150
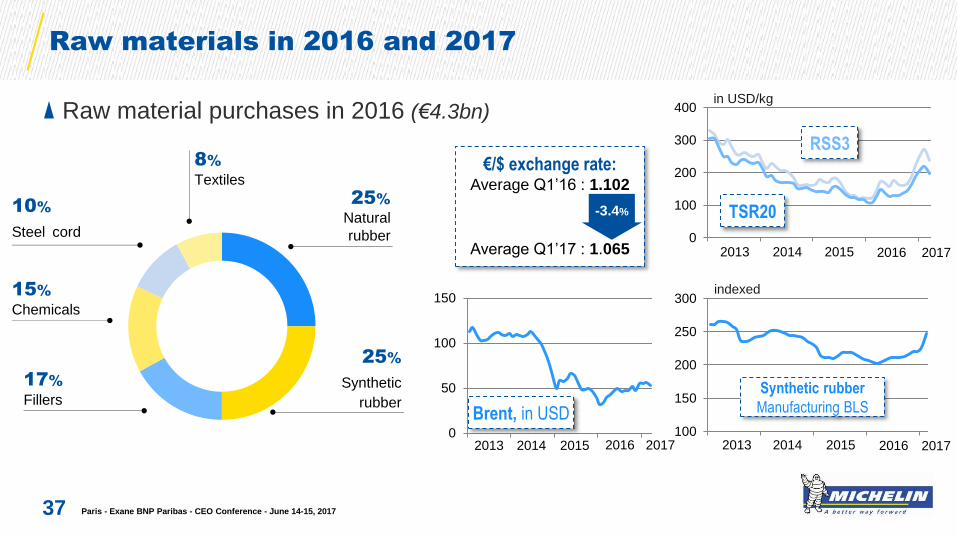
Raw materials in 2016 and 2017
Paris - Exane BNP Paribas - CEO Conference - June 14-15, 2017
Raw material purchases in 2016 (€4.3bn)
37
25%
Natural
rubber
25%
Synthetic
rubber
17%
Fillers
15%
Chemicals
10%
Steel cord
8%
Textiles
Brent, in USD
€/$ exchange rate: Average Q1’16 : 1.102
Average Q1’17 : 1.065
-3.4%
Synthetic rubber
Manufacturing BLS
RSS3
TSR20
in USD/kg
indexed
2013 2014 2015 2016 2013 2014 2015 2016
2013 2014 2015 2016
2017
2017
2017
40,0
60,0
80,0
100,0
120,0
140,0
160,0
180,0
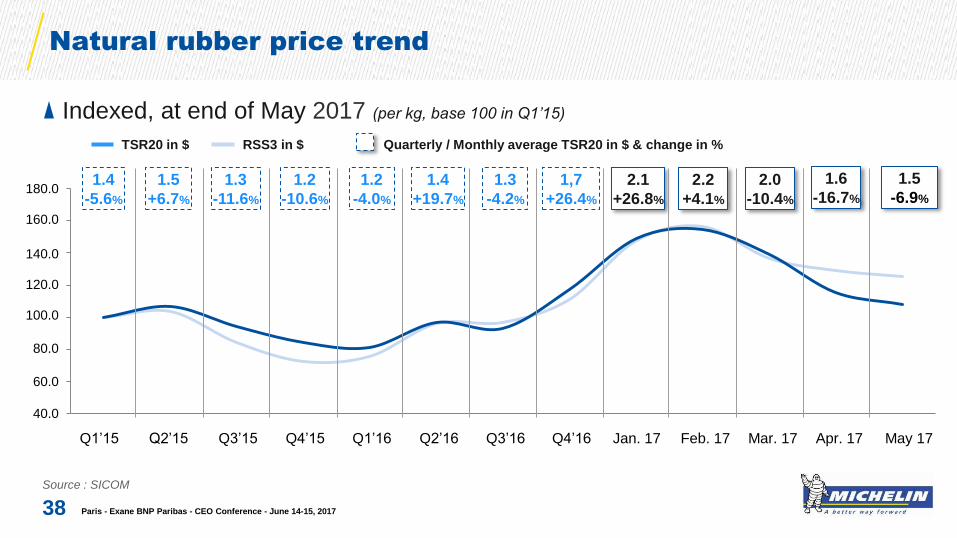
Natural rubber price trend
Paris - Exane BNP Paribas - CEO Conference - June 14-15, 2017
Indexed, at end of May 2017 (per kg, base 100 in Q1’15)
Source : SICOM
38
TSR20 in $ RSS3 in $
1.4
-5.6%
1.5
+6.7%
1.3
-11.6%
1.2
-10.6%
1.2
-4.0%
1.4
+19.7%
1,7
+26.4%
1.3
-4.2%
2.1
+26.8%
2.2
+4.1%
2.0
-10.4%
Quarterly / Monthly average TSR20 in $ & change in %
Q1’15 Q2’15 Q3’15 Q4’15 Q1’16 Q2’16 Q3’16 Q4’16 Jan. 17 Feb. 17 Mar. 17 Apr. 17
1.6
-16.7%
1.5
-6.9%
May 17
180.0
160.0
140.0
120.0
100.0
80.0
60.0
40.0
0
20
40
60
80
100
120
140
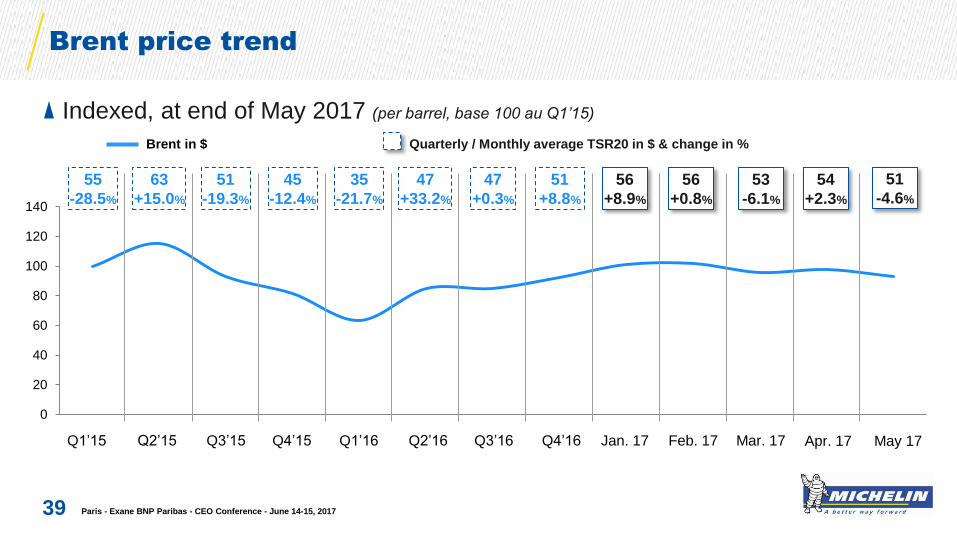
Brent price trend
Paris - Exane BNP Paribas - CEO Conference - June 14-15, 2017
Indexed, at end of May 2017 (per barrel, base 100 au Q1’15)
39
Brent in $ Quarterly / Monthly average TSR20 in $ & change in %
55
-28.5%
63
+15.0%
51
-19.3%
45
-12.4%
35
-21.7%
47
+33.2%
47
+0.3%
56
+8.9%
56
+0.8%
53
-6.1%
51
+8.8%
54
+2.3%
51
-4.6%
Q1’15 Q2’15 Q3’15 Q4’15 Q1’16 Q2’16 Q3’16 Q4’16 Jan. 17 Feb. 17 Mar. 17 Apr. 17 May 17
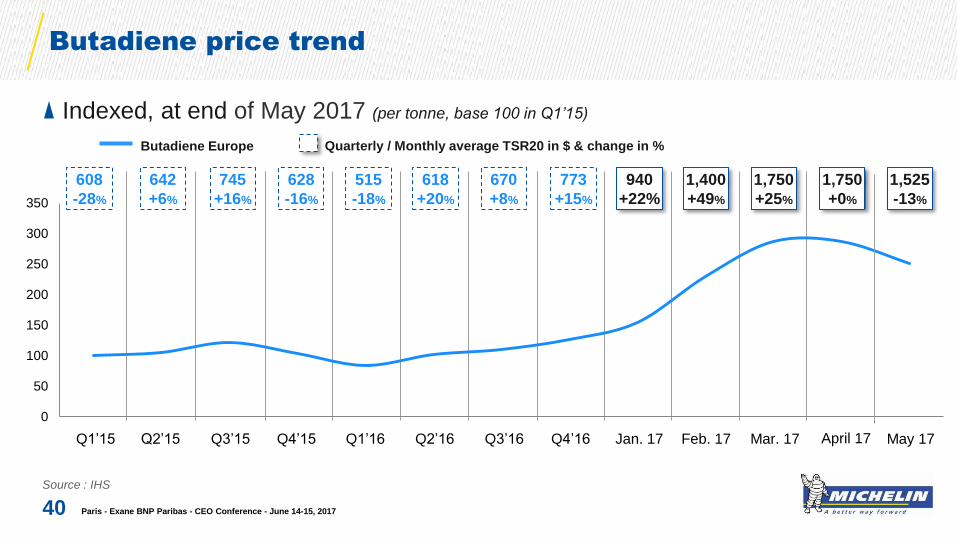
Butadiene price trend
Paris - Exane BNP Paribas - CEO Conference - June 14-15, 2017
Indexed, at end of May 2017 (per tonne, base 100 in Q1’15)
Source : IHS
40
Quarterly / Monthly average TSR20 in $ & change in % Butadiene Europe
608
-28%
642
+6%
745
+16%
628
-16%
515
-18%
618
+20%
773
+15%
670
+8%
940
+22%
1,400
+49%
1,750
+25%
Q1’15 Q2’15 Q3’15 Q4’15 Q1’16 Q2’16 Q3’16 Q4’16 Jan. 17 Feb. 17 Mar. 17 May 17
1,750
+0%
1,525
-13%
0
50
100
150
200
250
300
350
April 17
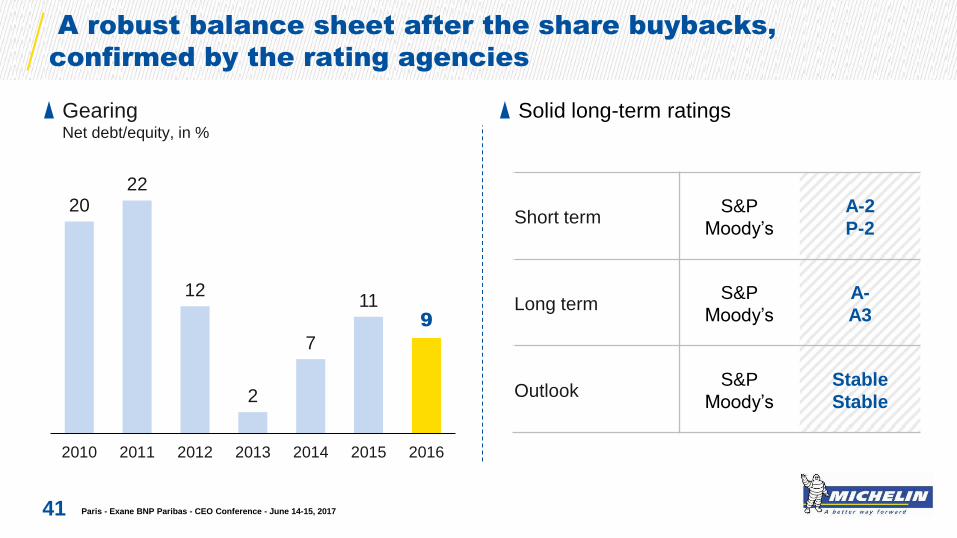
Short term S&P
Moody’s
A-2
P-2
Long term S&P
Moody’s
A-
A3
Outlook S&P
Moody’s
Stable
Stable
A robust balance sheet after the share buybacks,
confirmed by the rating agencies
Gearing Net debt/equity, in %
Solid long-term ratings
Paris - Exane BNP Paribas - CEO Conference - June 14-15, 2017 41
20 22
12
2
7
11 9
2010 2011 2012 2013 2014 2015 2016

1,645
920 862
1,695 1,945
2,423 2,234 2,170 2,577 2,692
9.8%
5.6%
5.8%
9.5% 9.4% 11.3%
11.0%
11.1% 12.2% 12.9%
9.7%
5.6%
5.4%
10.5% 10.9%
12.8% 11.9%
11.1% 12.2%
12.1%
0%
2%
4%
6%
8%
10%
12%
14%
0
500
1000
1500
2000
2500
3000
2007 2008 2009 2010 2011 2012 2013 2014 2015 2016
Operating profit (in €m) Operating margin (as a % of net sales) ROCE after tax (in %)
2016: a year of progress, in line with our 2020 roadmap
Paris - Exane BNP Paribas - CEO Conference - June 14-15, 2017
Group operating income and margin* & ROCE
* On recurring activities.
42
3,000
2,500
2,000
1,500
1,000
500
0
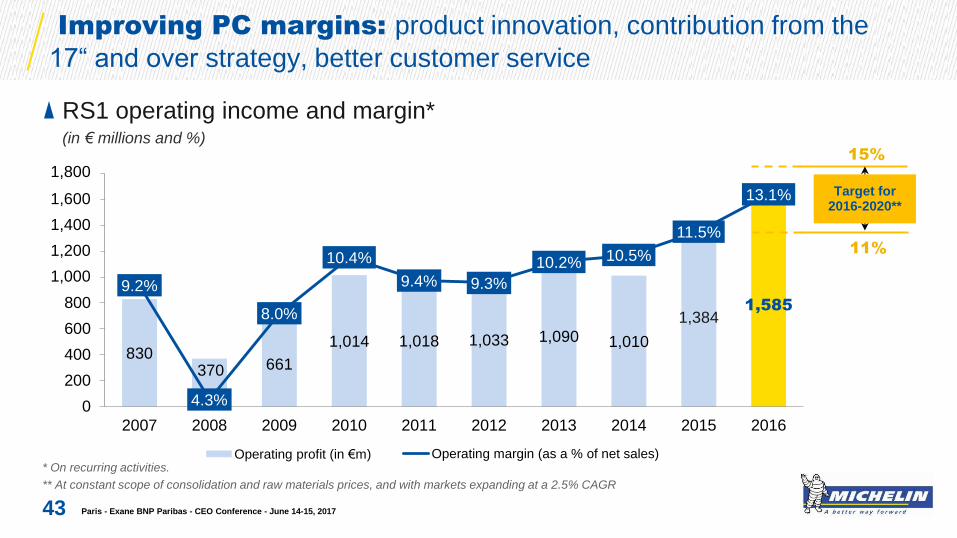
830 370 661
1,014 1,018 1,033 1,090 1,010
1,384 1,585
9.2%
4.3%
8.0%
10.4%
9.4% 9.3%
10.2% 10.5%
11.5%
13.1%
0
200
400
600
800
1 000
1 200
1 400
1 600
1 800
2007 2008 2009 2010 2011 2012 2013 2014 2015 2016
Operating profit (in €m) Operating margin (as a % of net sales)
Improving PC margins: product innovation, contribution from the
17“ and over strategy, better customer service
RS1 operating income and margin* (in € millions and %)
* On recurring activities.
** At constant scope of consolidation and raw materials prices, and with markets expanding at a 2.5% CAGR
Paris - Exane BNP Paribas - CEO Conference - June 14-15, 2017 43
11%
Target for 2016-2020**
15%
1,800
1,600
1,400
1,200
1,000

Consolidation in TB margin led by competitiveness, product
innovation and customer satisfaction
* On recurring activities.
** At constant scope of consolidation and raw materials prices, and with markets expanding at a 1.5% CAGR
Paris - Exane BNP Paribas - CEO Conference - June 14-15, 2017 44
RS2 operating income and margin* (in € millions and %)
427
138
-69
249 233 444 503 495
645 580
7.6%
2.5%
-1.5%
4.4% 3.5%
6.6%
7.8% 8.1%
10.4% 9.7%
-200
0
200
400
600
800
1 000
1 200
2007 2008 2009 2010 2011 2012 2013 2014 2015 2016
Operating profit (in €m) Operating margin (as a % of net sales)
13%
9%
Target for 2016-2020**
1,200
1,000

Specialty businesses: solid margin resistance in challenging
markets
* On recurring activities.
** At constant scope of consolidation and raw materials prices, and with markets expanding
Paris - Exane BNP Paribas - CEO Conference - June 14-15, 2017 45
RS3 operating income and margin* (in € millions and %)
388 412
270
432
694
946
645 574 548 527
17.8% 17.9%
13.3%
17.8%
21.5%
26.0%
20.6% 19.3%
18.6% 18.6%
0
100
200
300
400
500
600
700
800
900
2007 2008 2009 2010 2011 2012 2013 2014 2015 2016
Operating profit (in €m) Operating margin (as a % of net sales)
24%
17%
Target for 2016-2020**
"This presentation is not an offer to purchase or a solicitation to recommend the purchase
of Michelin shares. To obtain more detailed information on Michelin, please consult the
documentation published in France by Autorité des Marchés Financiers available from the
http://www.michelin.com/eng/ website.
This presentation may contain a number of forward-looking statements. Although the
Company believes that these statements are based on reasonable assumptions at the time
of the publication of this document, they are by nature subject to risks and contingencies
liable to translate into a difference between actual data and the forecasts made or induced
by these statements."
Disclaimer
Paris - Exane BNP Paribas - CEO Conference - June 14-15, 2017 46
Contacts
Paris - Exane BNP Paribas - CEO Conference - June 14-15, 2017 47
Valérie MAGLOIRE
Matthieu DEWAVRIN
Humbert de FEYDEAU
+33 (0)4 15 39 84 68
27, cours de l’île Seguin
92100 Boulogne-Billancourt - France