Embed Size (px)
Citation preview
1
Examples of ALARA evaluation at the SCK•CEN
Vermeersch Fernand
Head of the Unit, Safety, Control and Environment
SCK•CEN, Hermann Debrouxlaan 40, Brussel October 5, 2007
2
General overviewThe BR3 decommissioningThe REBUS projectAlmaraz site characterisation in the VRIMOR project
Content
3
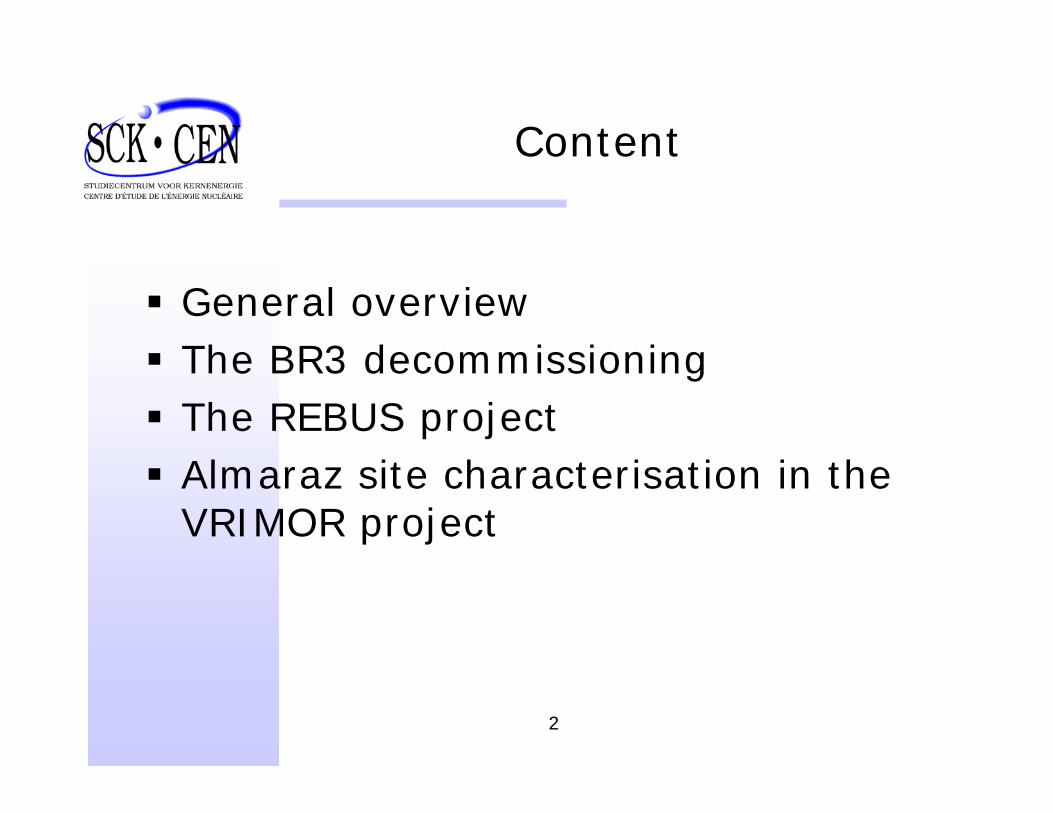
ALARAput into practice
Planner• Work description• Site information
Radiation protection
• Radiological characterisation of the site
Workers and Technicians
• Work duration• Technical realisation
ALARA analyst BrainstormingEvaluate options
Dec
isio
n
Dose follow upALARA database
REX
4
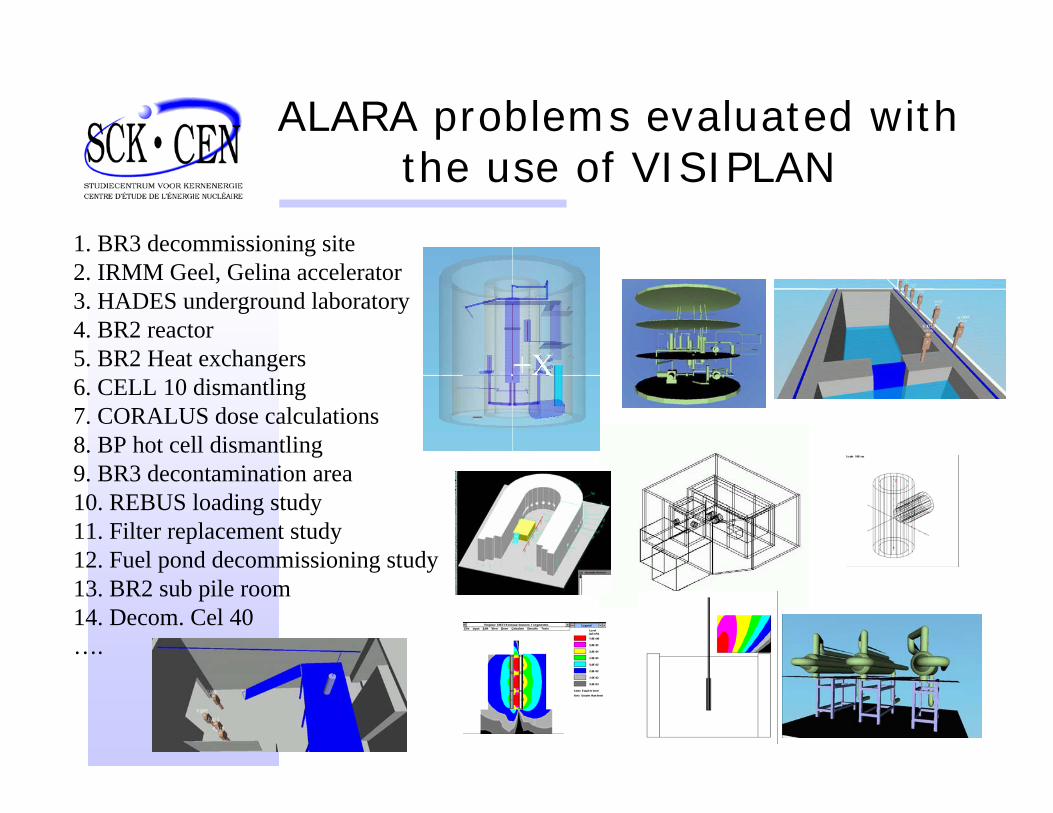
ALARA problems evaluated with the use of VISIPLAN
1. BR3 decommissioning site2. IRMM Geel, Gelina accelerator3. HADES underground laboratory4. BR2 reactor5. BR2 Heat exchangers6. CELL 10 dismantling7. CORALUS dose calculations8. BP hot cell dismantling9. BR3 decontamination area10. REBUS loading study11. Filter replacement study12. Fuel pond decommissioning study13. BR2 sub pile room14. Decom. Cel 40….
5
Decommissioning of BR3Operations under the operation deck
6
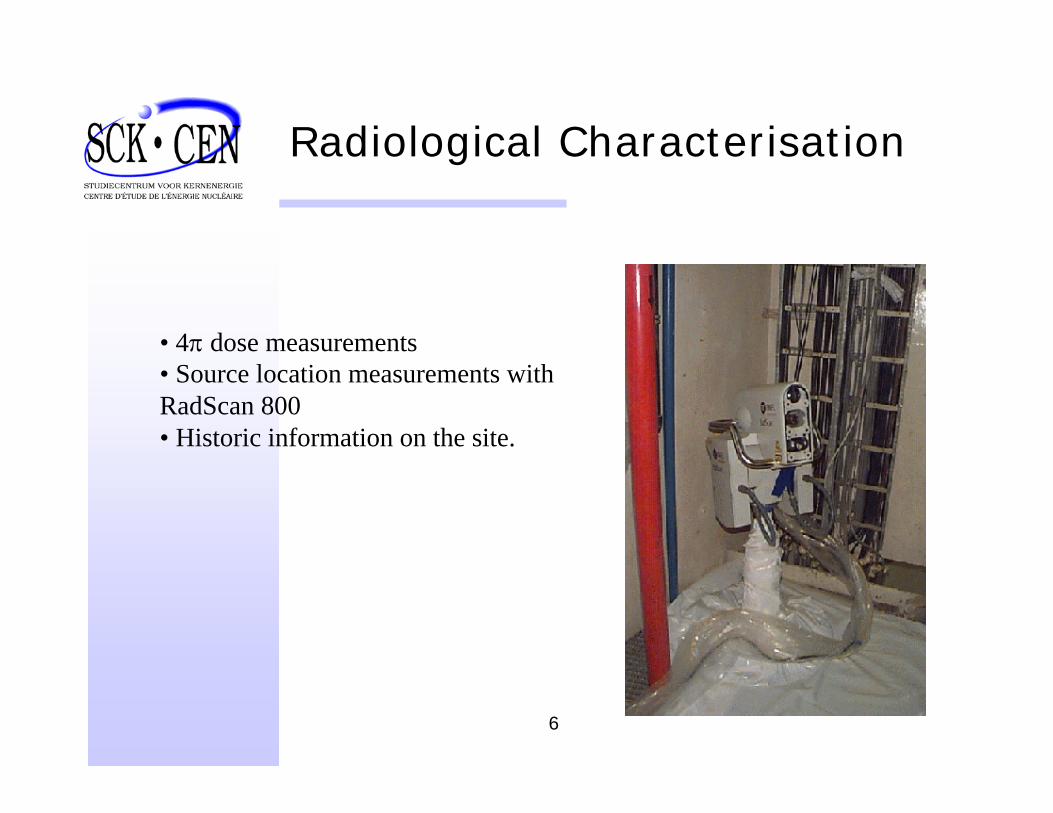
Radiological Characterisation
• 4π dose measurements• Source location measurements with RadScan 800• Historic information on the site.
7
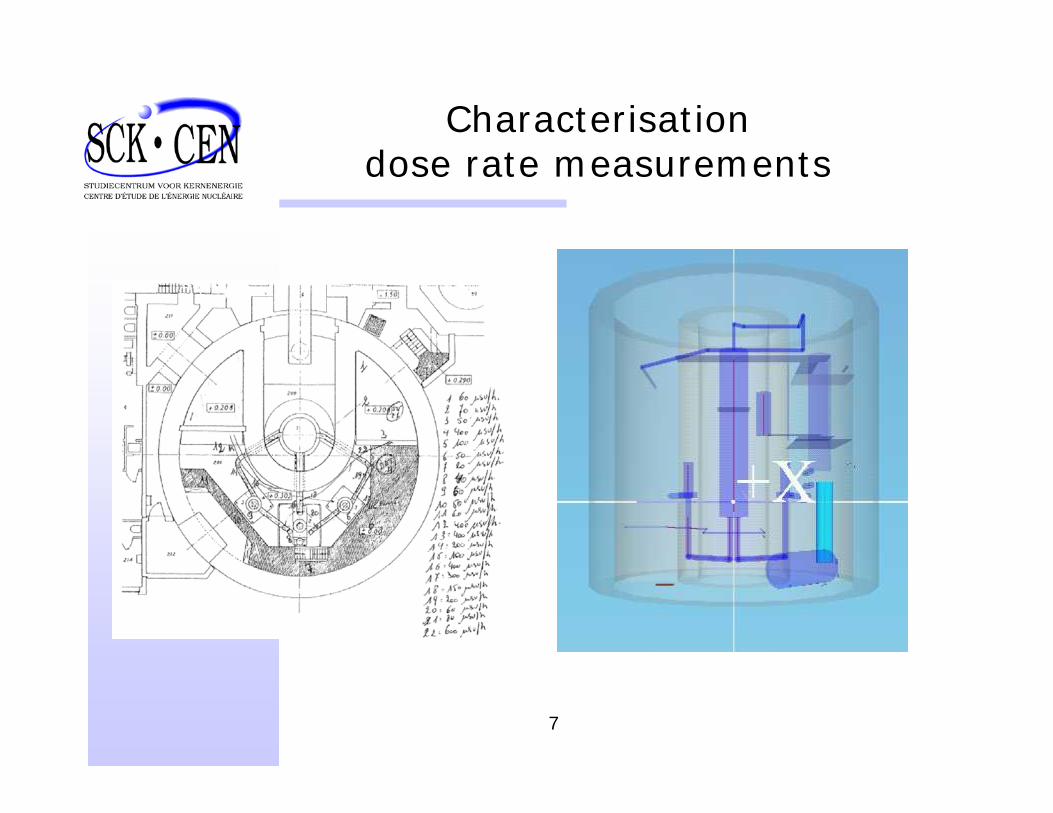
Characterisationdose rate measurements
8
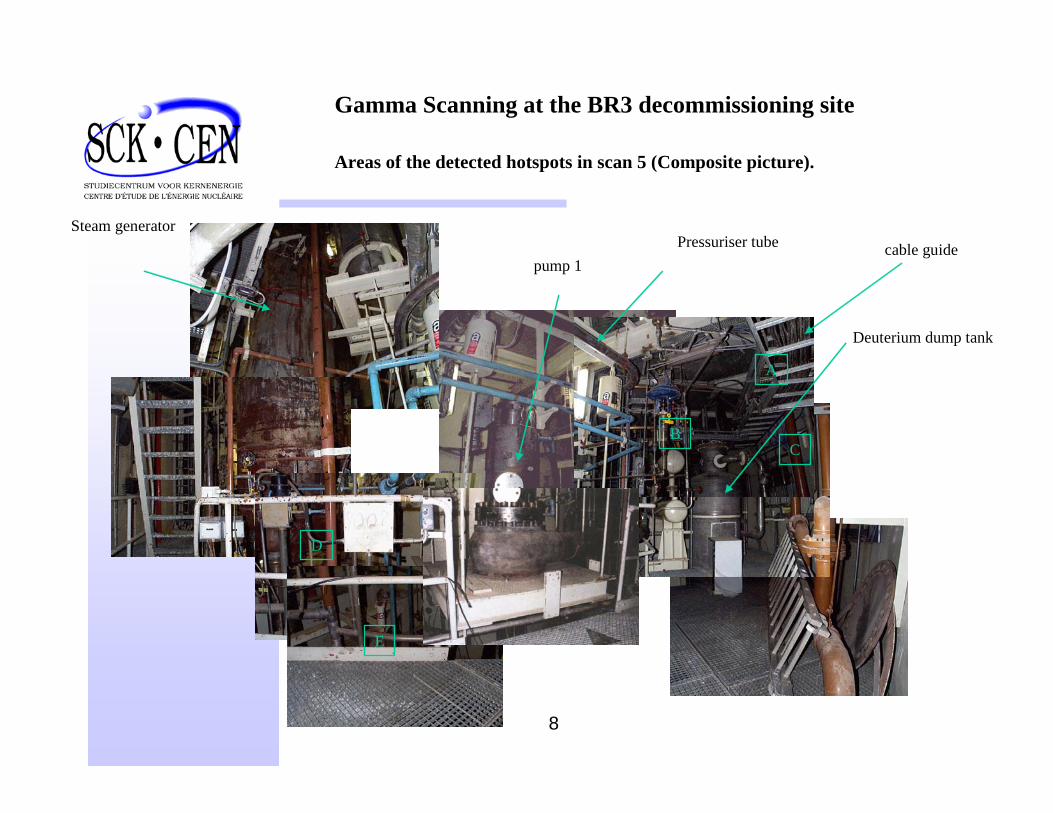
Gamma Scanning at the BR3 decommissioning site
Areas of the detected hotspots in scan 5 (Composite picture).
Steam generatorcable guide
Deuterium dump tank
Pressuriser tubepump 1
A
BC
D
E
9
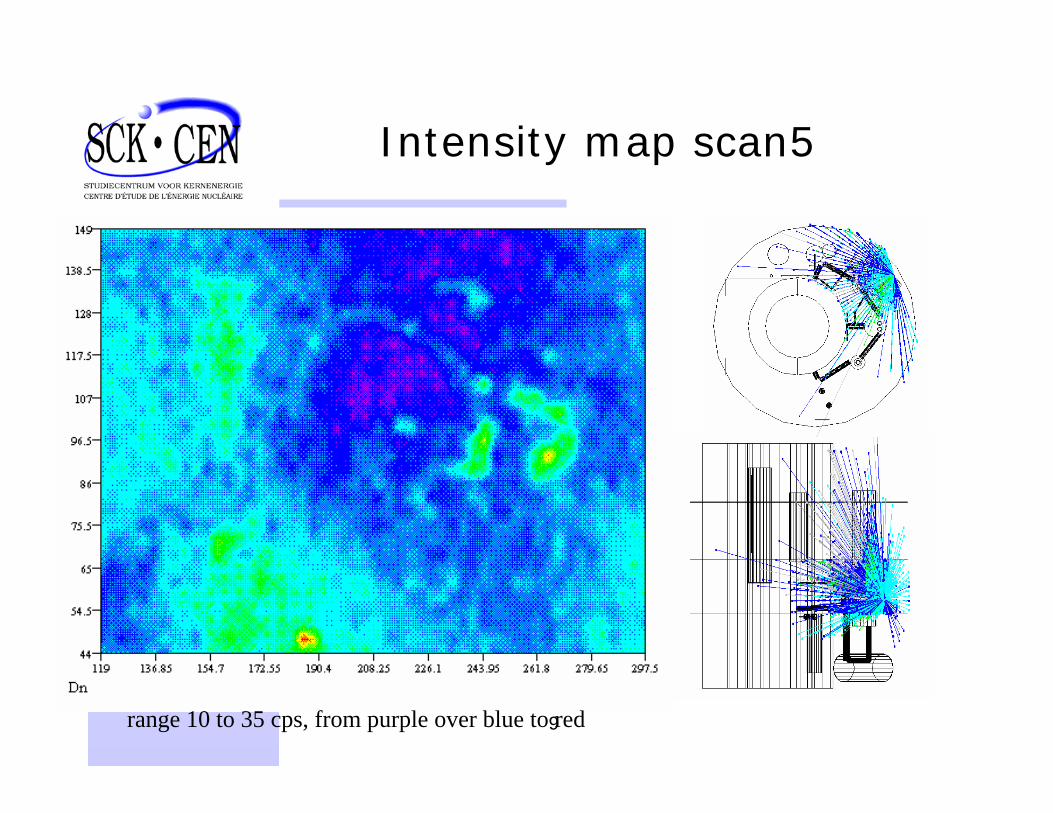
Intensity map scan5
range 10 to 35 cps, from purple over blue to red
10
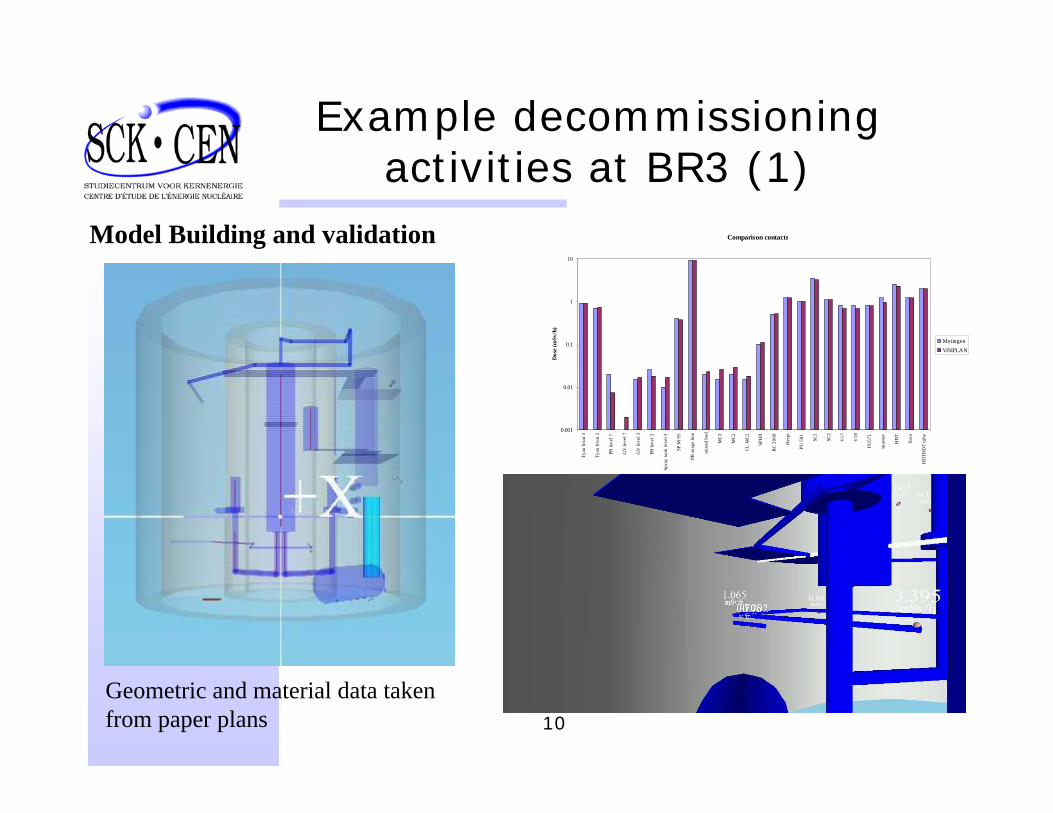
Example decommissioningactivities at BR3 (1)
Geometric and material data takenfrom paper plans
Model Building and validation Comparison contacts
0.001
0.01
0.1
1
10
Tyau
bru
n 1
Tyau
bru
n 2
PR le
vel 7
GV
leve
l 7
GV
leve
l 3
PR le
vel 3
Spra
y ta
nk le
vel 3
SP M
95
PR su
rge
line
mix
ed b
ed
MC1
MC2
CL M
C2
SPH
X
RC 2
060
Her
pi
PU 5
01 SC1
SC2
V17
V18
PU57
1
strai
ner
HD
T
floor
HD
TDD
T tu
be
Sources
Dos
e (m
Sv/h
)
MetingenVISIPLAN
11
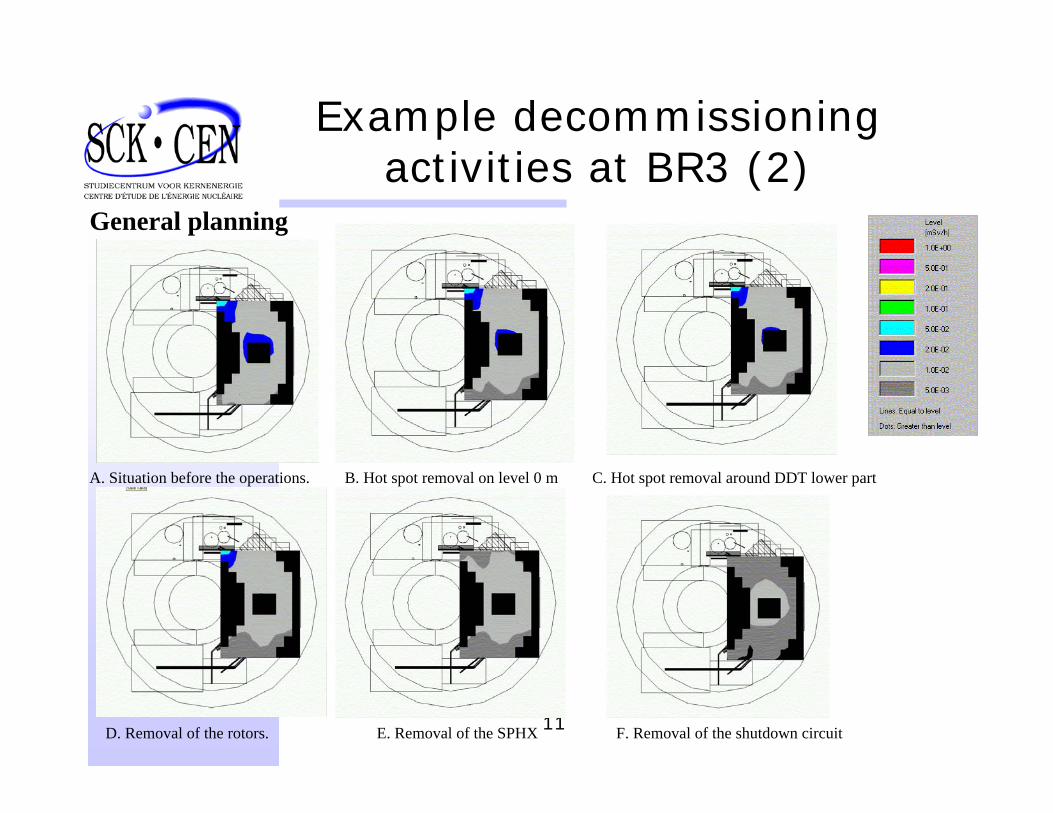
Example decommissioningactivities at BR3 (2)
A. Situation before the operations. B. Hot spot removal on level 0 m C. Hot spot removal around DDT lower part
D. Removal of the rotors. E. Removal of the SPHX F. Removal of the shutdown circuit
General planning
12
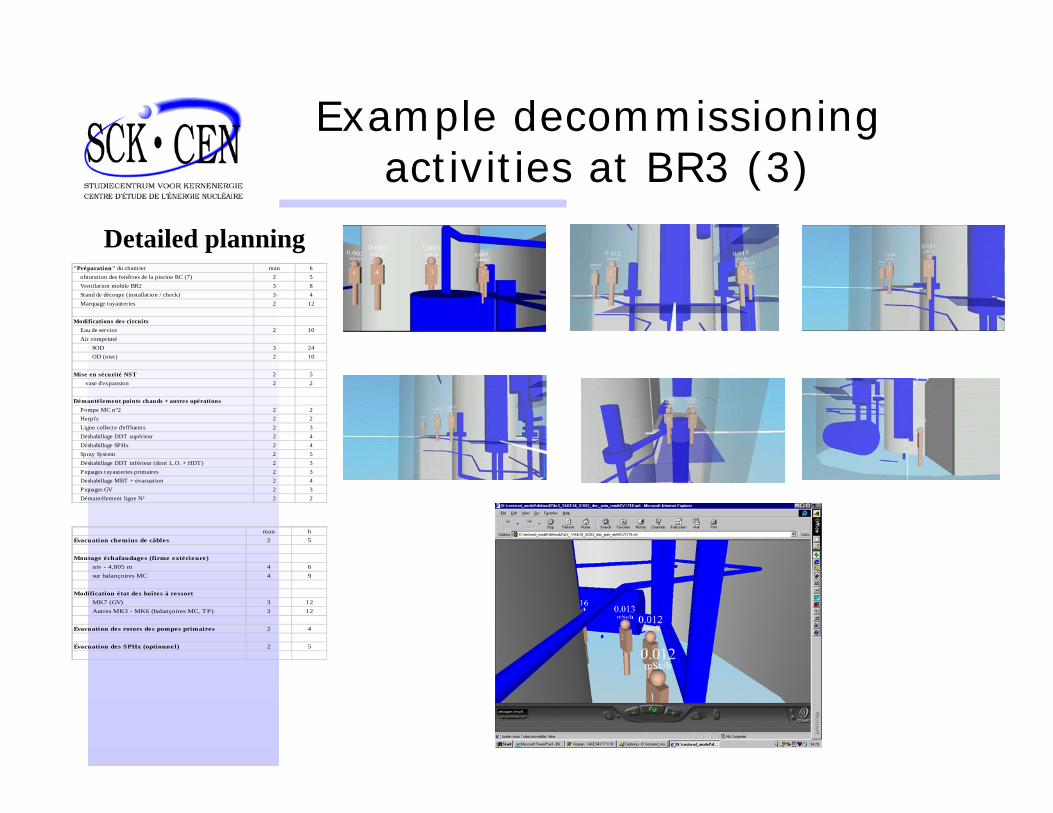
Example decommissioningactivities at BR3 (3)
"Préparation" du chantier man h� obturation des fenêtres de la piscine RC (7) 2 5� Ventilat ion mobile BR2 3 8� Stand de découpe (installat ion / check) 3 4� Marquage tuyauteries 2 12
Modifications des circuits� Eau de service 2 10� Air comprimé � SOD 3 24 � OD (niet) 2 10
Mise en sécurité NST 2 5 vase d'expansion 2 2
Démantèlement points chauds + autres opérations� Pompe MC n°2 2 2� Herpi's 2 2� Ligne collecte d'effluents 2 3� Déshabillage DDT supérieur 2 4� Déshabillage SPHx 2 4� Spray System 2 5� Déshabillage DDT inférieur (dont L.O. + HDT) 2 3� Piquages tuyauteries primaires 2 3� Déshabillage MBT + évacuation 2 4� Piquages GV 2 3� Démantèlement ligne N² 2 2
man hÉvacuation chemins de câbles 2 5
Montage échafaudages (firme extérieure) � niv - 4,805 m 4 6 � sur balançoires MC 4 9
Modification état des boîtes à ressort � MK7 (GV) 3 12 � Autres MK3 - MK6 (balançoires MC, TP) 3 12
Évacuation des rotors des pompes primaires 2 4
Évacuation des SPHx (optionnel) 2 5
Detailed planning
13
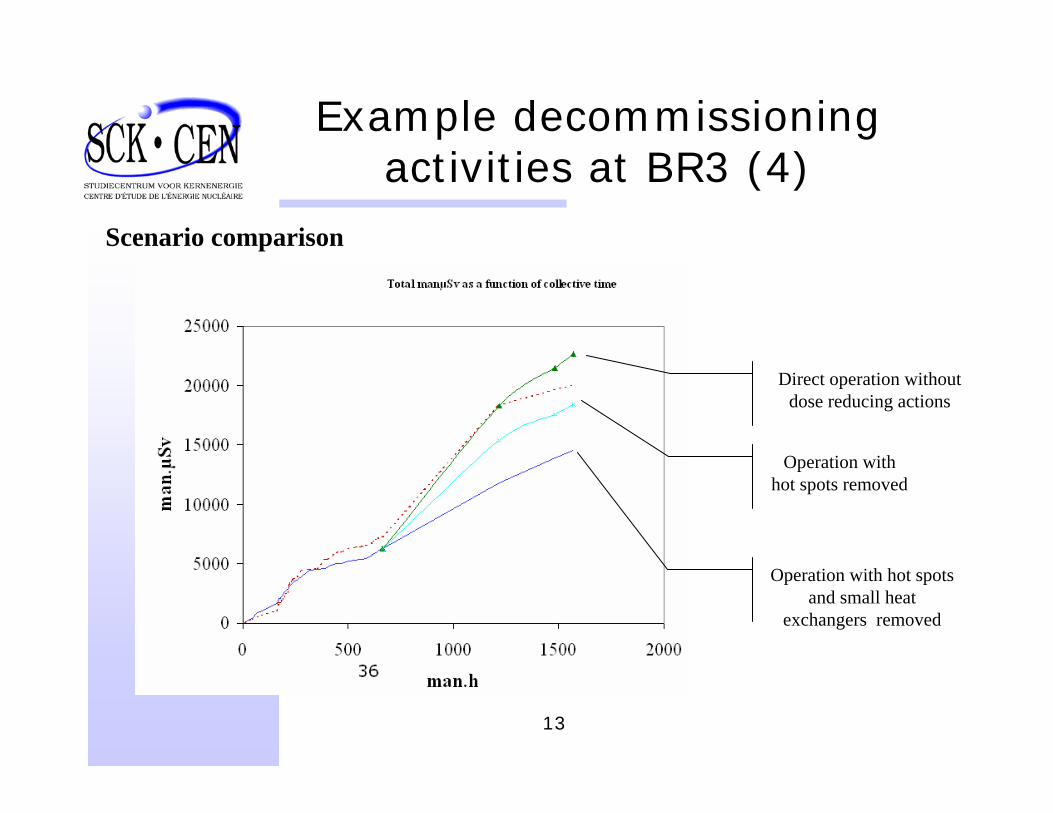
Example decommissioningactivities at BR3 (4)
Scenario comparison
Direct operation without dose reducing actions
Operation with hot spots removed
Operation with hot spots and small heat
exchangers removed
14
The REBUS project
15
The REBUS project
• Loading of a spent fuel bundle in a critical facility
First of a kindNeed for radiation protectionTechnical boundary condition
Limited lifting power of the hoist 1.5 ton
16
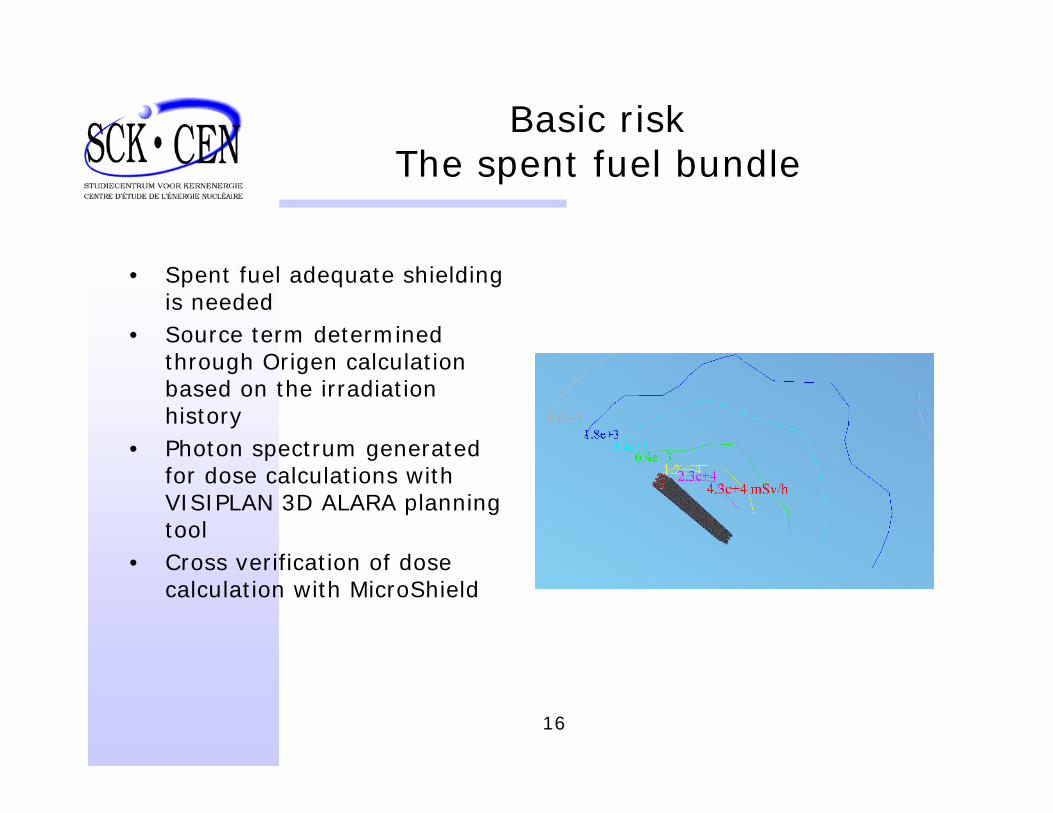
Basic riskThe spent fuel bundle
• Spent fuel adequate shielding is needed
• Source term determined through Origen calculation based on the irradiation history
• Photon spectrum generated for dose calculations with VISIPLAN 3D ALARA planning tool
• Cross verification of dose calculation with MicroShield
17
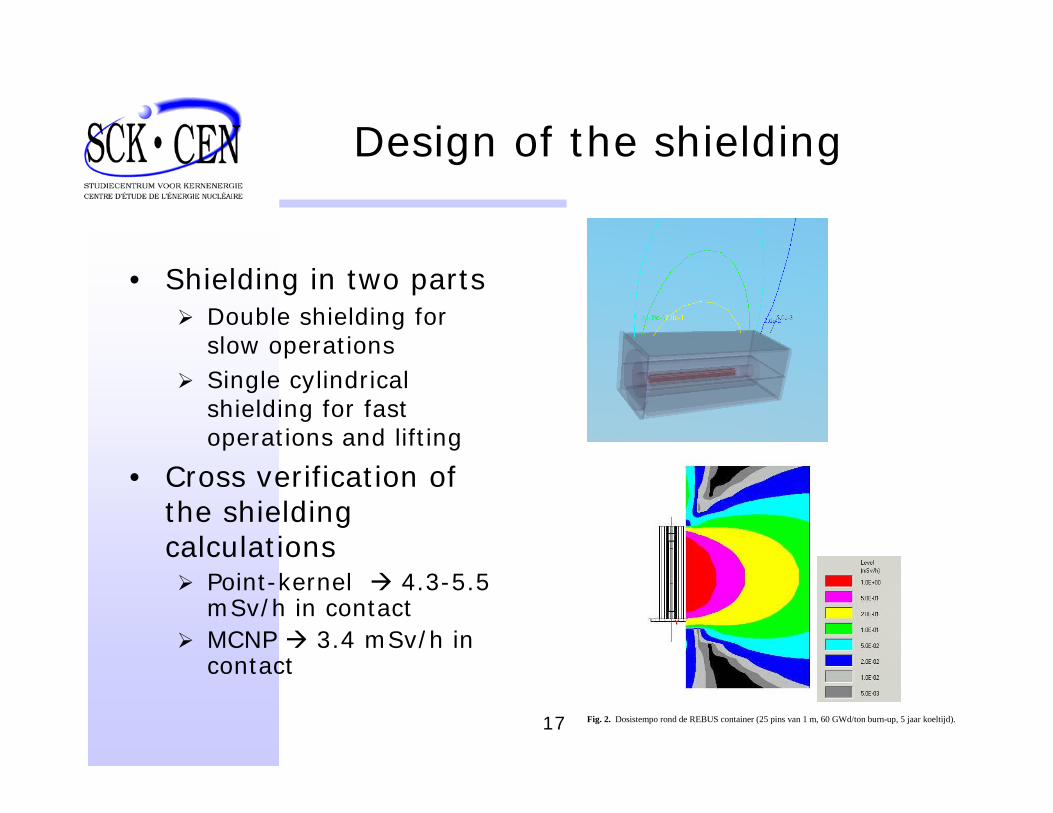
Design of the shielding
• Shielding in two partsDouble shielding for slow operationsSingle cylindrical shielding for fast operations and lifting
• Cross verification of the shielding calculations
Point-kernel 4.3-5.5 mSv/h in contactMCNP 3.4 mSv/h in contact
Fig. 2. Dosistempo rond de REBUS container (25 pins van 1 m, 60 GWd/ton burn-up, 5 jaar koeltijd).
18
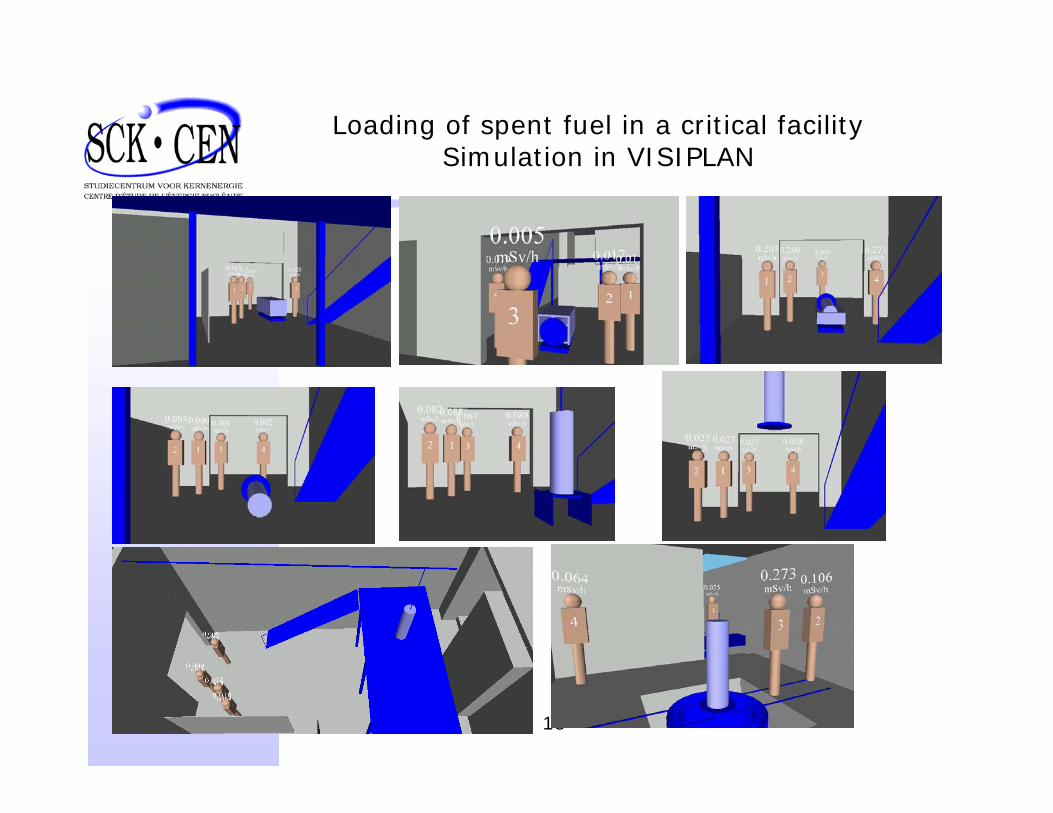
Loading of spent fuel in a critical facility Simulation in VISIPLAN
19
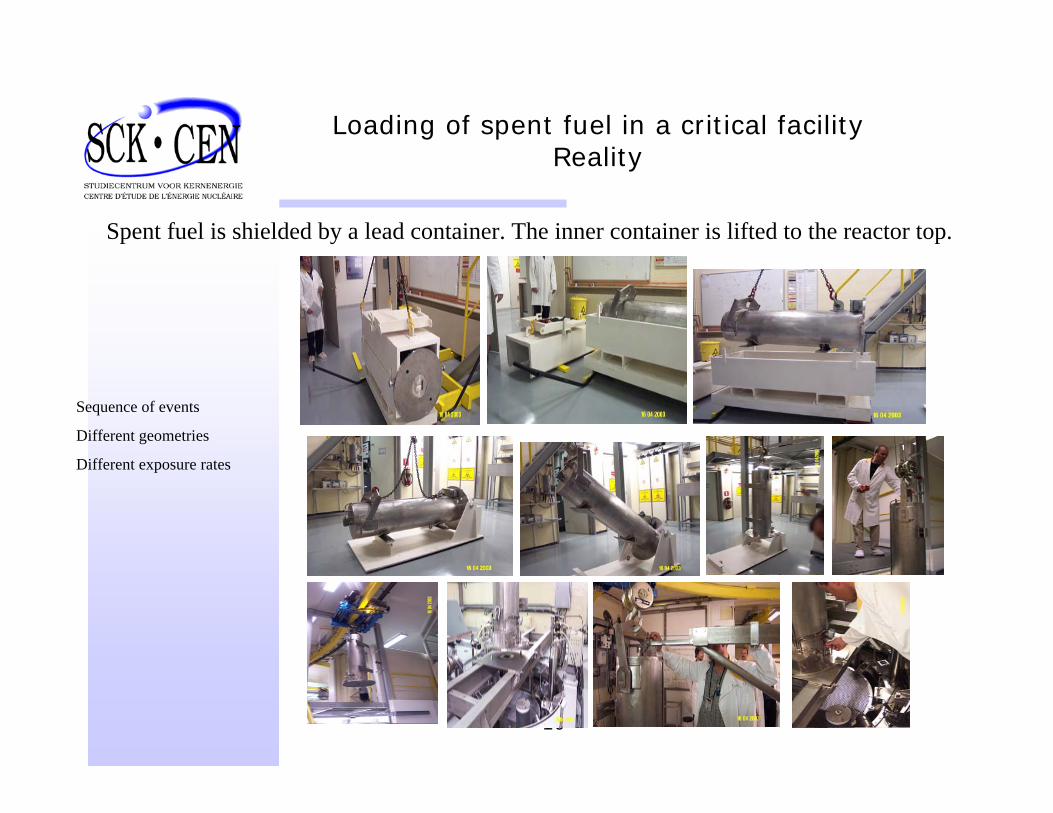
Loading of spent fuel in a critical facility Reality
Spent fuel is shielded by a lead container. The inner container is lifted to the reactor top.
Sequence of events
Different geometries
Different exposure rates
20
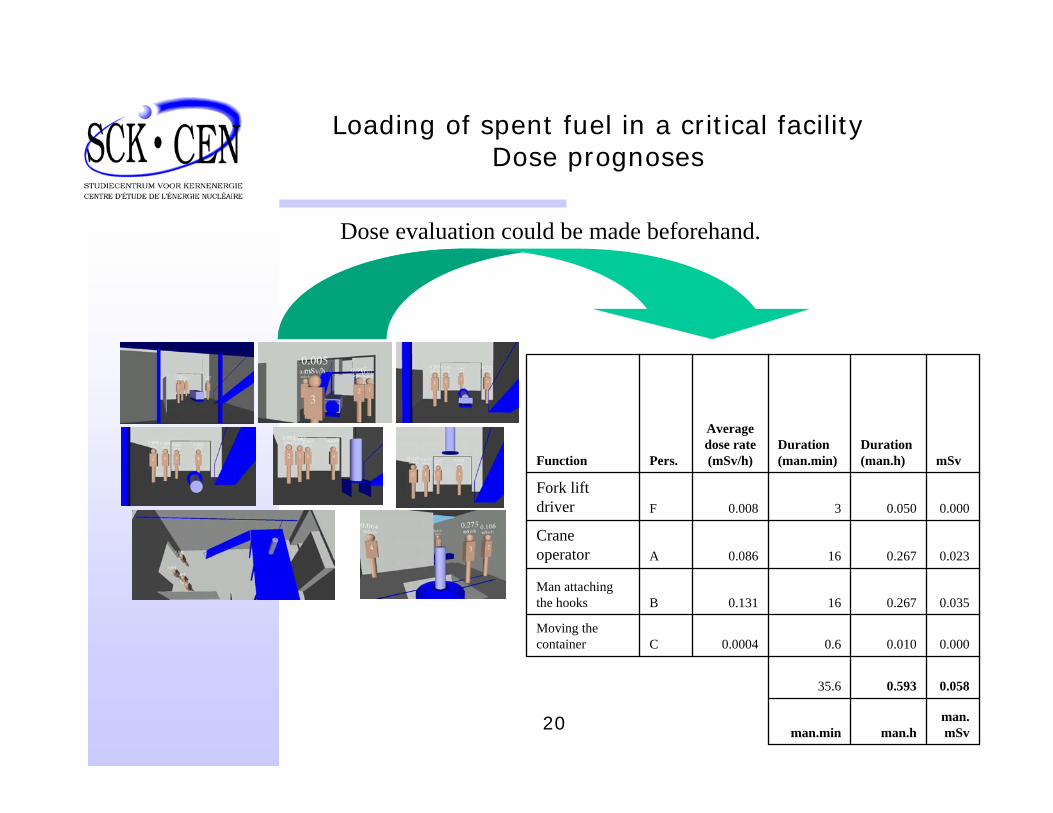
Loading of spent fuel in a critical facility Dose prognoses
man.mSvman.hman.min
0.0580.59335.6
0.0000.0100.60.0004CMoving the container
0.0350.267160.131BMan attachingthe hooks
0.0230.267160.086ACraneoperator
0.0000.05030.008FFork lift driver
mSvDuration(man.h)
Duration(man.min)
Average dose rate(mSv/h)Pers.Function
Dose evaluation could be made beforehand.
21
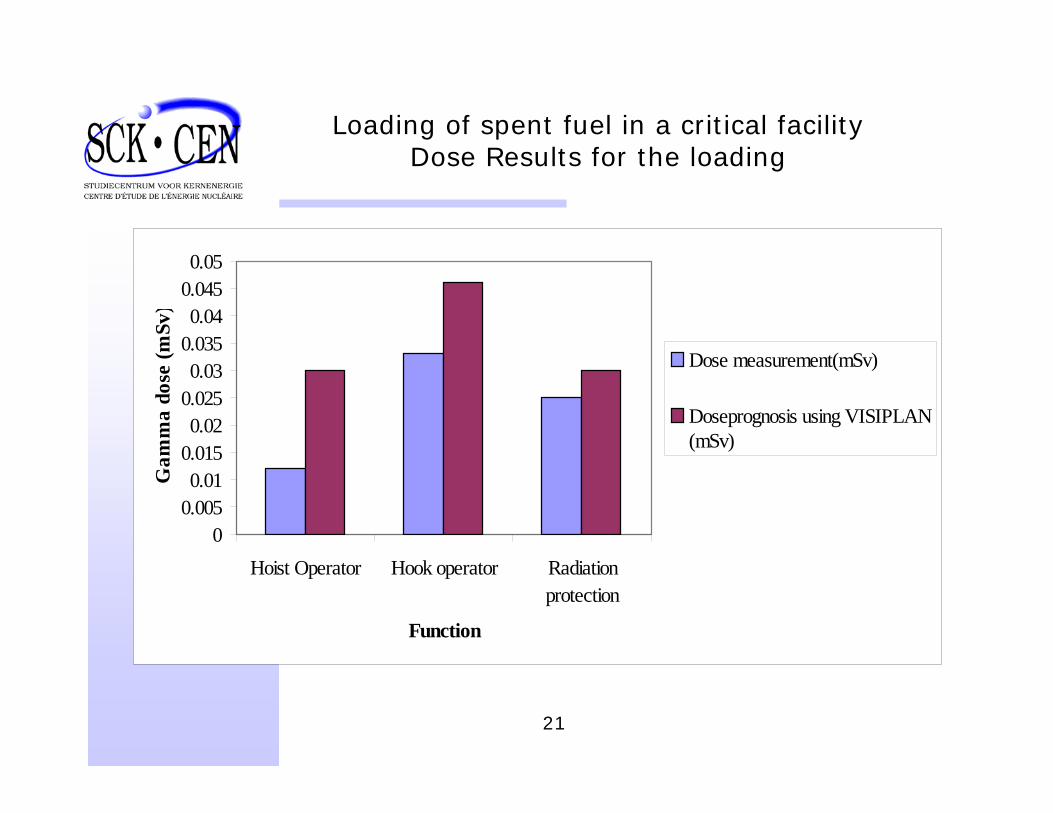
Loading of spent fuel in a critical facility Dose Results for the loading
00.0050.01
0.0150.02
0.0250.03
0.0350.04
0.0450.05
Hoist Operator Hook operator Radiationprotection
Function
Gam
ma
dose
(mSv
)
Dose measurement(mSv)
Doseprognosis using VISIPLAN(mSv)
22
What if analysis ?
• The bundle is lowered out of the shielding with a remote system, what can we do when
this system fails ?
• Backup plan• Development of a manual recovery, based on
a gear box system and a long handling tool
23
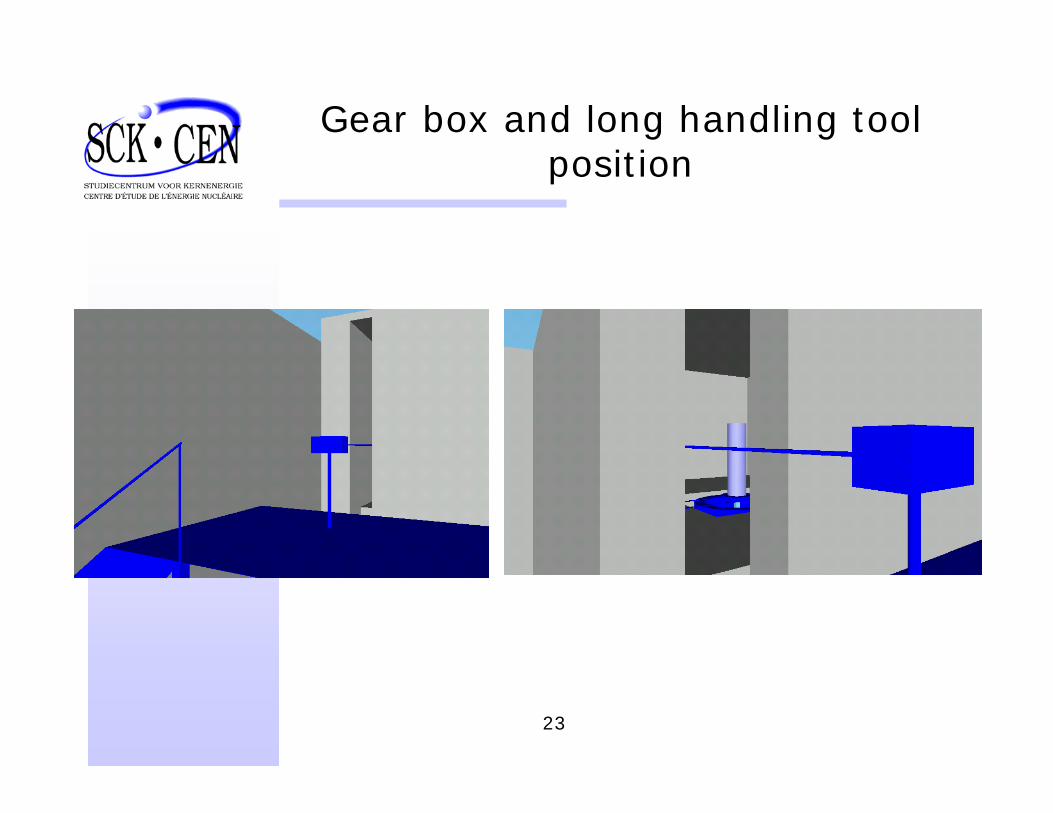
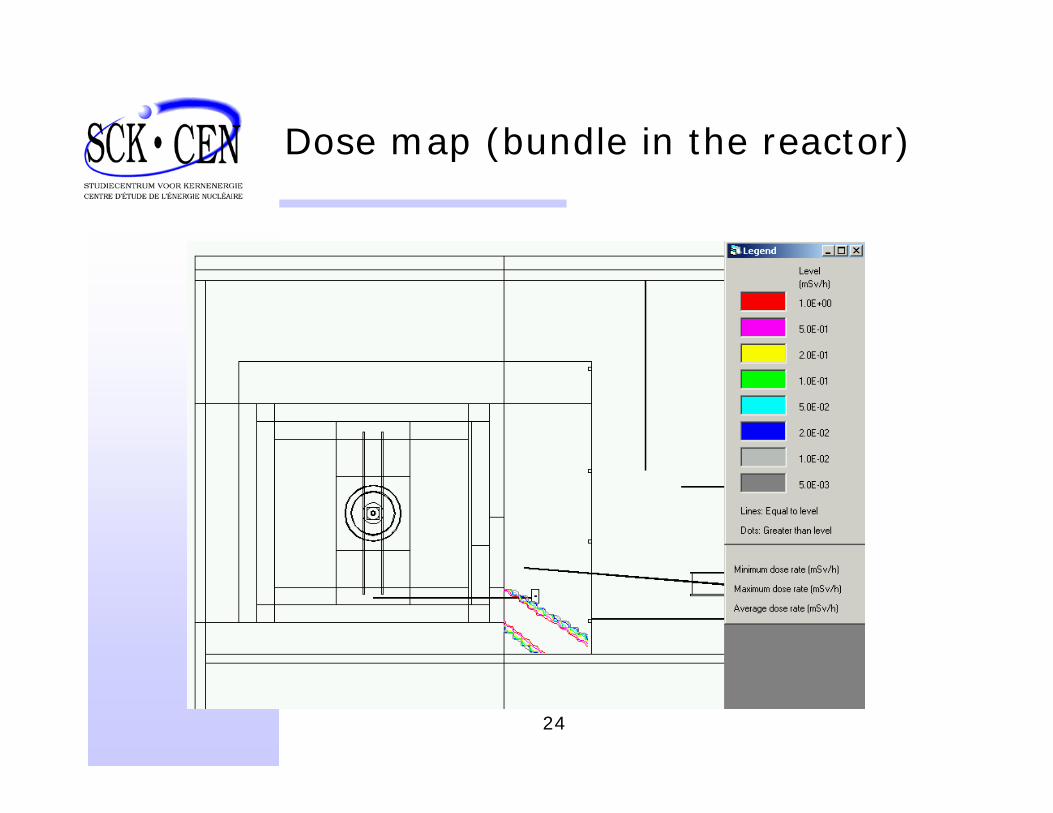
Gear box and long handling tool position
24
Dose map (bundle in the reactor)
25
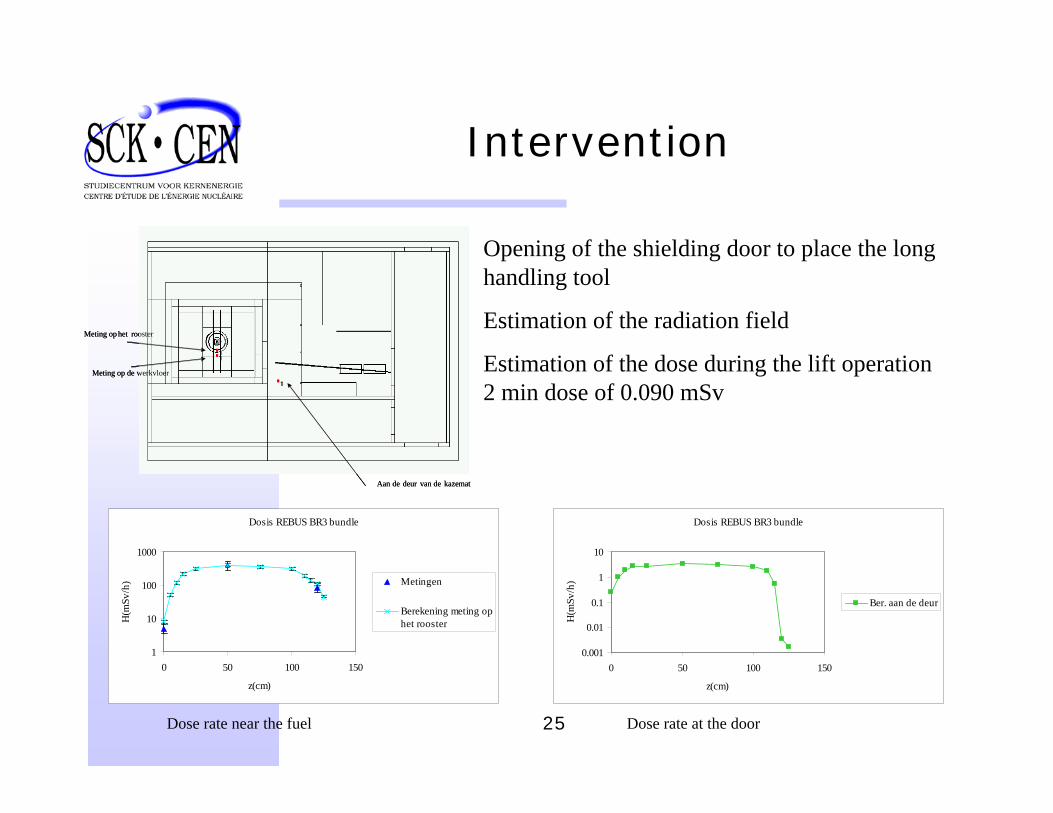
Intervention
Dosis REBUS BR3 bundle
1
10
100
1000
0 50 100 150
z(cm)
H(m
Sv/h
) Metingen
Berekening meting ophet rooster
Opening of the shielding door to place the long handling tool
Estimation of the radiation field
Estimation of the dose during the lift operation 2 min dose of 0.090 mSv
Dosis REBUS BR3 bundle
0.001
0.01
0.1
1
10
0 50 100 150
z(cm)
H(m
Sv/h
)
Ber. aan de deur
Aan de deur van de kazemat
Meting op het rooster
Meting op de werkvloer
Aan de deur van de kazemat
Meting op het rooster
Meting op de werkvloer
Dose rate near the fuel Dose rate at the door
26
Cleaning the HLLW tanks
27
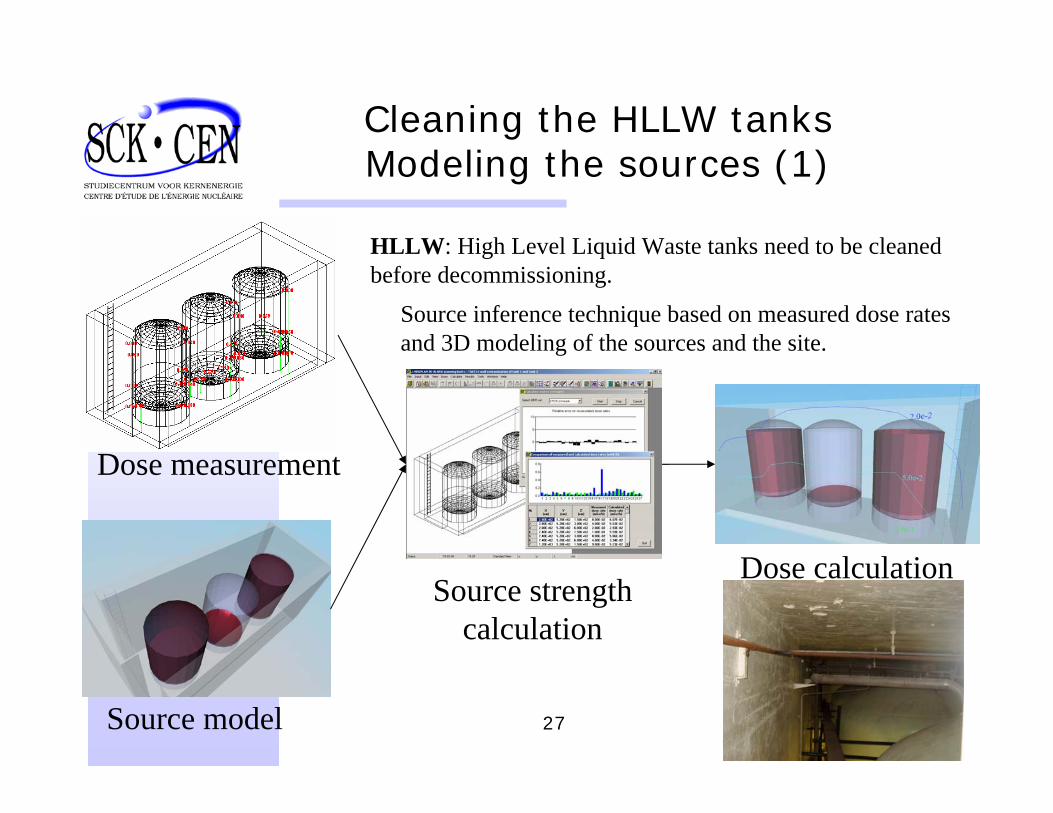
Cleaning the HLLW tanksModeling the sources (1)
Dose measurement
Source model
Source strength calculation
Dose calculation
Source inference technique based on measured dose rates and 3D modeling of the sources and the site.
HLLW: High Level Liquid Waste tanks need to be cleaned before decommissioning.
28
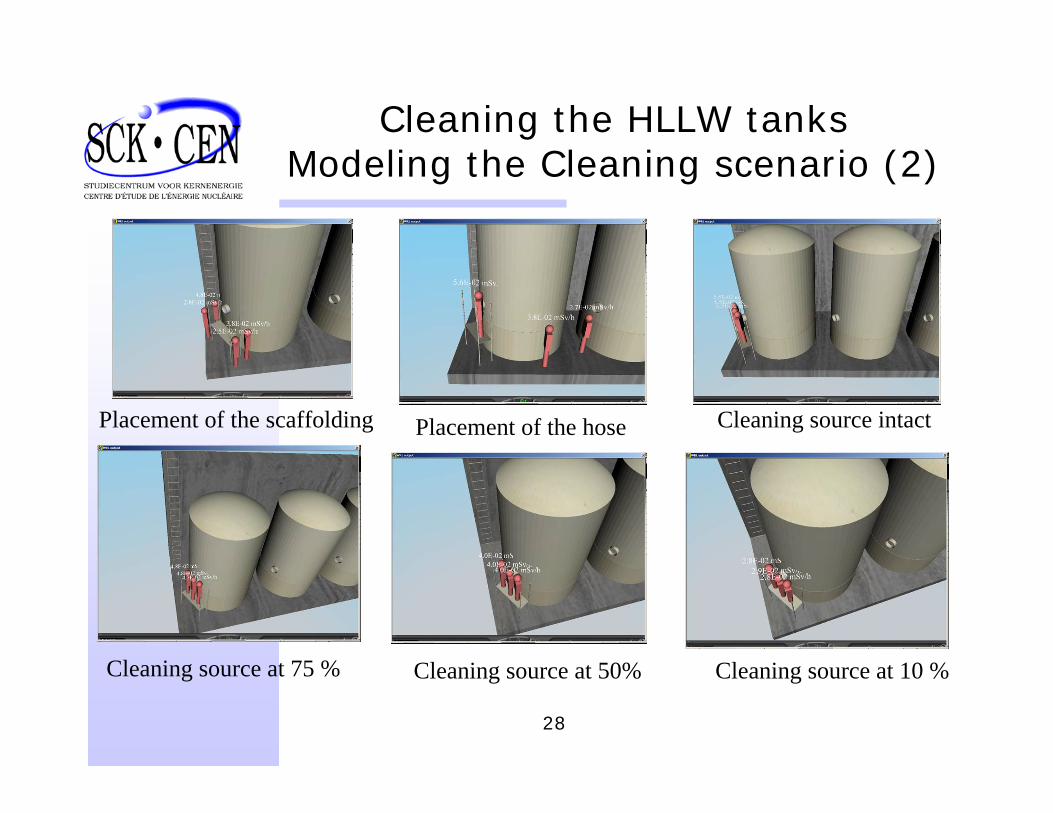
Cleaning the HLLW tanksModeling the Cleaning scenario (2)
Placement of the scaffolding Placement of the hose Cleaning source intact
Cleaning source at 75 % Cleaning source at 50% Cleaning source at 10 %
29
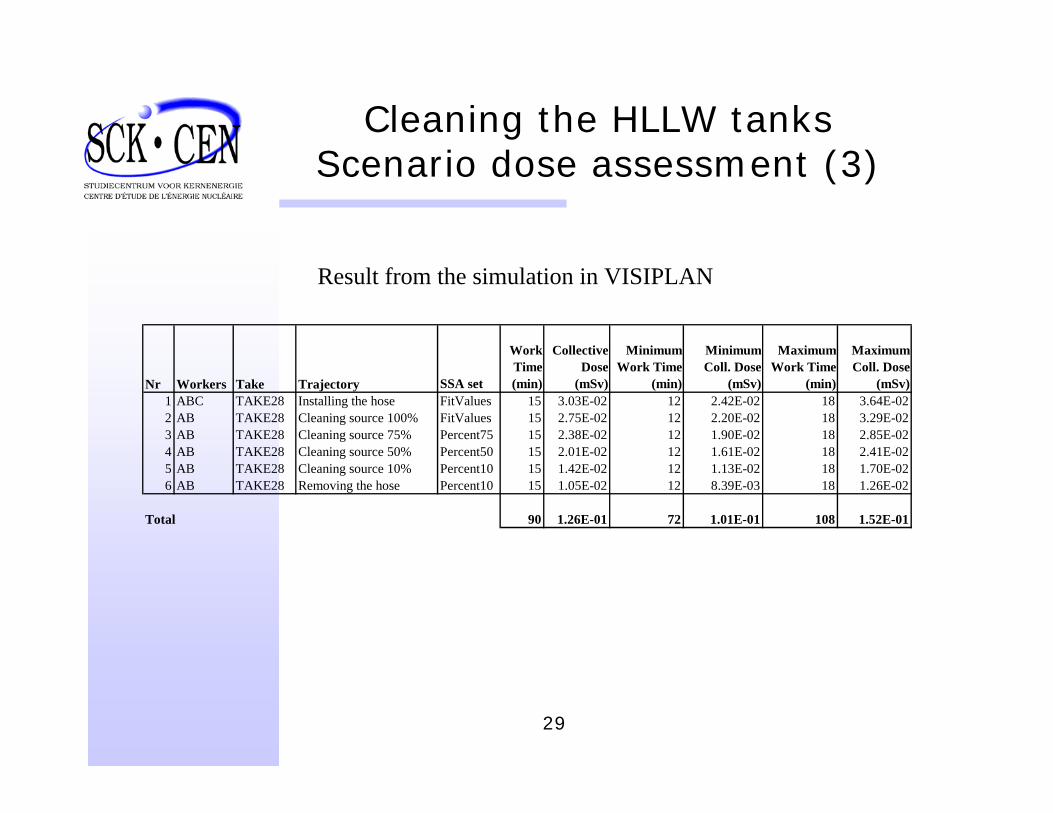
Cleaning the HLLW tanksScenario dose assessment (3)
Nr Workers Take Trajectory SSA set
Work Time (min)
Collective Dose
(mSv)
Minimum Work Time
(min)
Minimum Coll. Dose
(mSv)
Maximum Work Time
(min)
Maximum Coll. Dose
(mSv)1 ABC TAKE28 Installing the hose FitValues 15 3.03E-02 12 2.42E-02 18 3.64E-022 AB TAKE28 Cleaning source 100% FitValues 15 2.75E-02 12 2.20E-02 18 3.29E-023 AB TAKE28 Cleaning source 75% Percent75 15 2.38E-02 12 1.90E-02 18 2.85E-024 AB TAKE28 Cleaning source 50% Percent50 15 2.01E-02 12 1.61E-02 18 2.41E-025 AB TAKE28 Cleaning source 10% Percent10 15 1.42E-02 12 1.13E-02 18 1.70E-026 AB TAKE28 Removing the hose Percent10 15 1.05E-02 12 8.39E-03 18 1.26E-02
Total 90 1.26E-01 72 1.01E-01 108 1.52E-01
Result from the simulation in VISIPLAN
30
Simulation of the dose near a steam generator
31
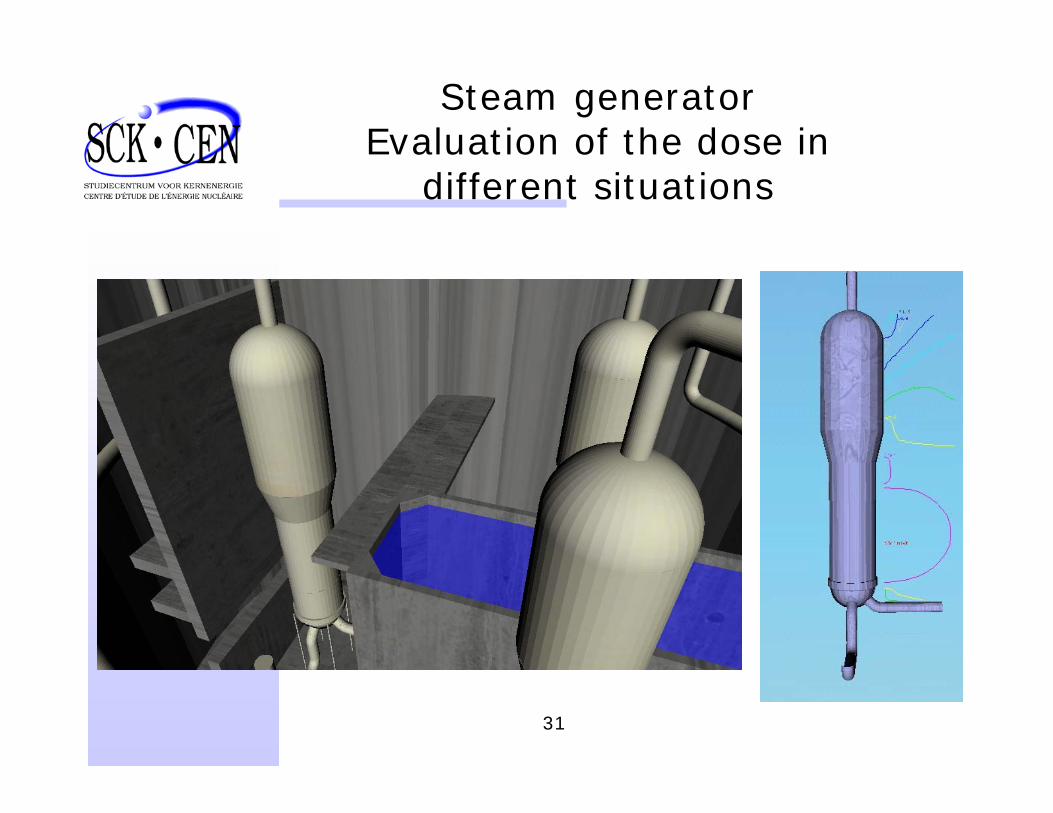
Steam generatorEvaluation of the dose in
different situations
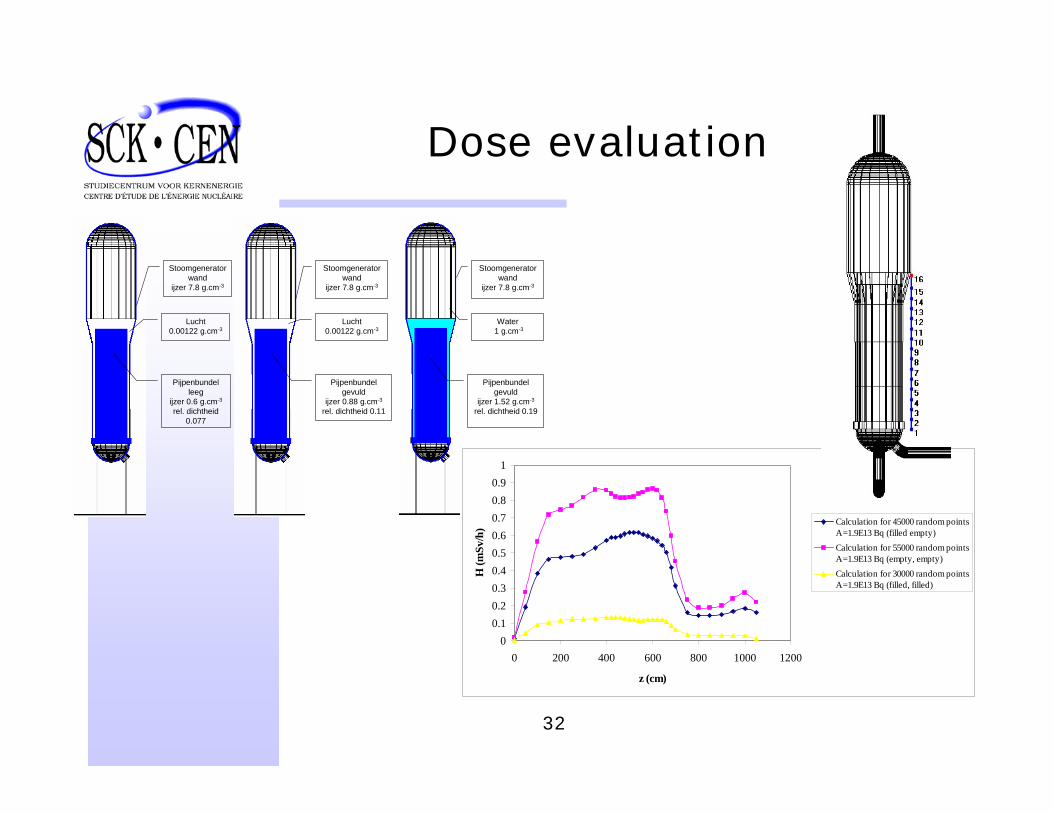
32
Dose evaluation
00.10.20.30.40.50.60.70.80.9
1
0 200 400 600 800 1000 1200
z (cm)
H (m
Sv/h
) Calculation for 45000 random pointsA=1.9E13 Bq (filled empty)Calculation for 55000 random pointsA=1.9E13 Bq (empty, empty)Calculation for 30000 random pointsA=1.9E13 Bq (filled, filled)
Pijpenbundel leeg
ijzer 0.6 g.cm-3
rel. dichtheid 0.077
Stoomgenerator wand
ijzer 7.8 g.cm-3
Lucht0.00122 g.cm-3
Pijpenbundel gevuld
ijzer 0.88 g.cm-3
rel. dichtheid 0.11
Stoomgenerator wand
ijzer 7.8 g.cm-3
Lucht0.00122 g.cm-3
Pijpenbundel gevuld
ijzer 1.52 g.cm-3
rel. dichtheid 0.19
Stoomgenerator wand
ijzer 7.8 g.cm-3
Water1 g.cm-3
33
Decommissioning of the hot cell 41
34
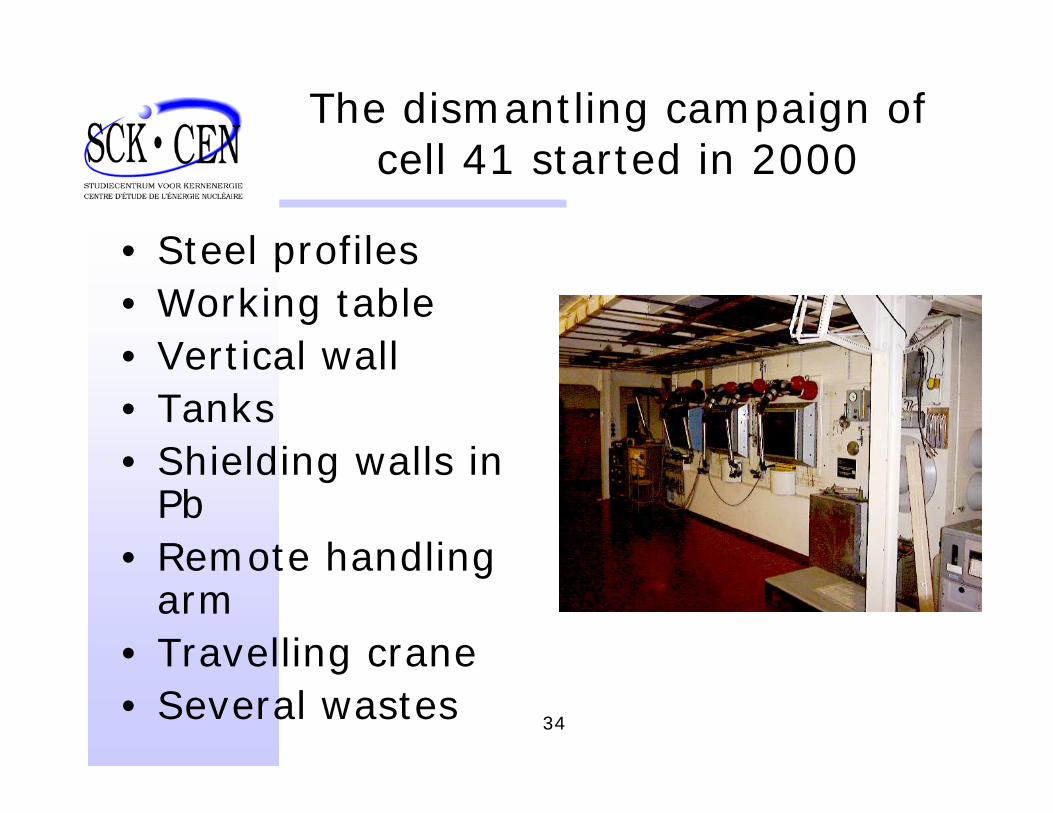
The dismantling campaign of cell 41 started in 2000
• Steel profiles • Working table• Vertical wall• Tanks• Shielding walls in
Pb• Remote handling
arm• Travelling crane• Several wastes
35
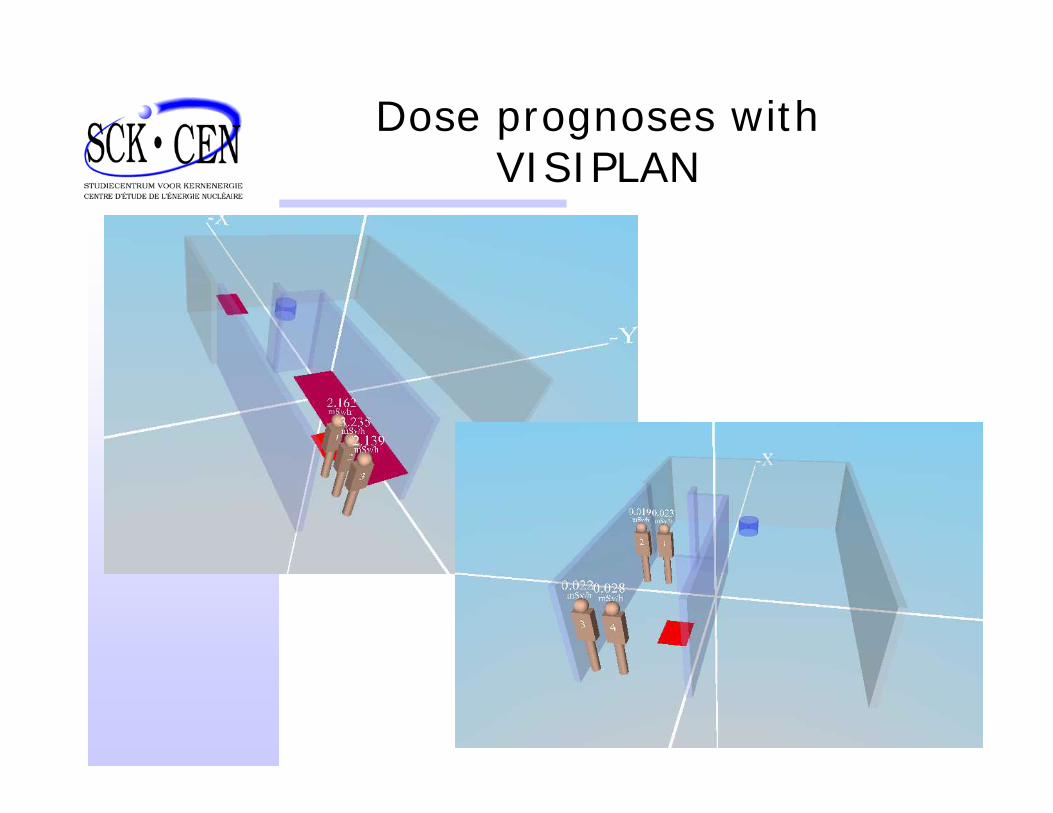
Dose prognoses with VISIPLAN
36
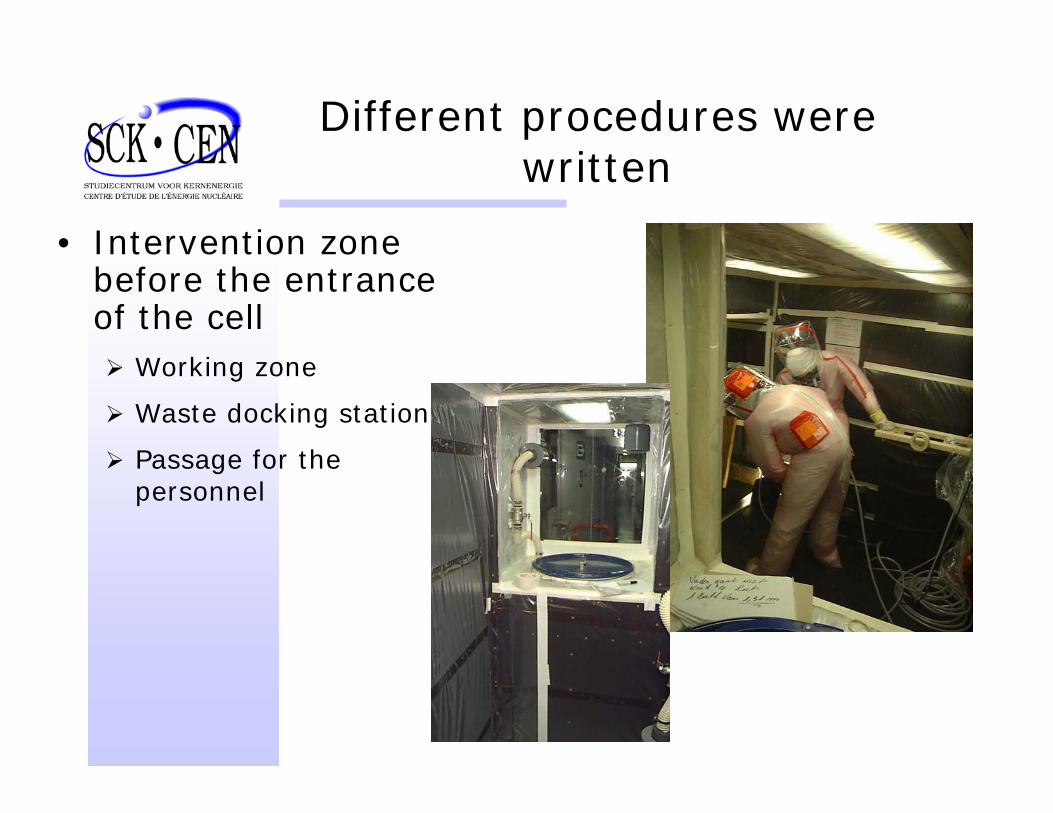
Different procedures were written
• Intervention zone before the entrance of the cell
Working zone
Waste docking station
Passage for the personnel
37
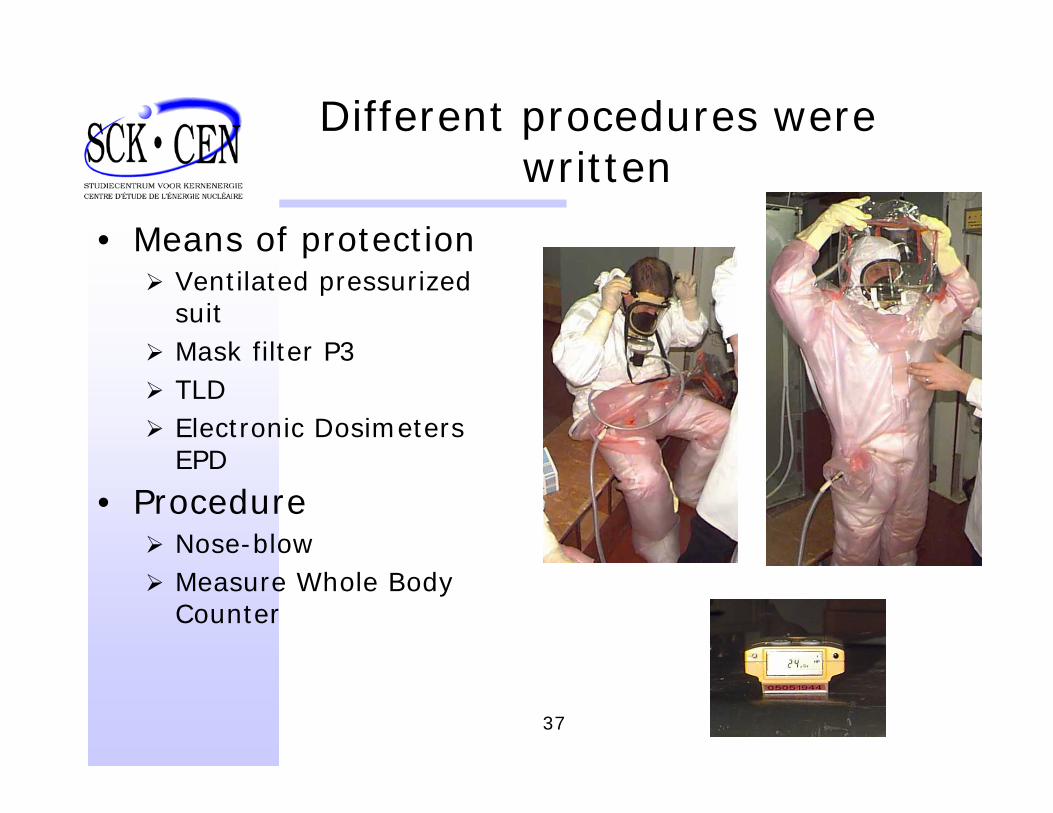
Different procedures were written
• Means of protectionVentilated pressurized suit Mask filter P3TLDElectronic Dosimeters EPD
• Procedure Nose-blowMeasure Whole Body Counter
38
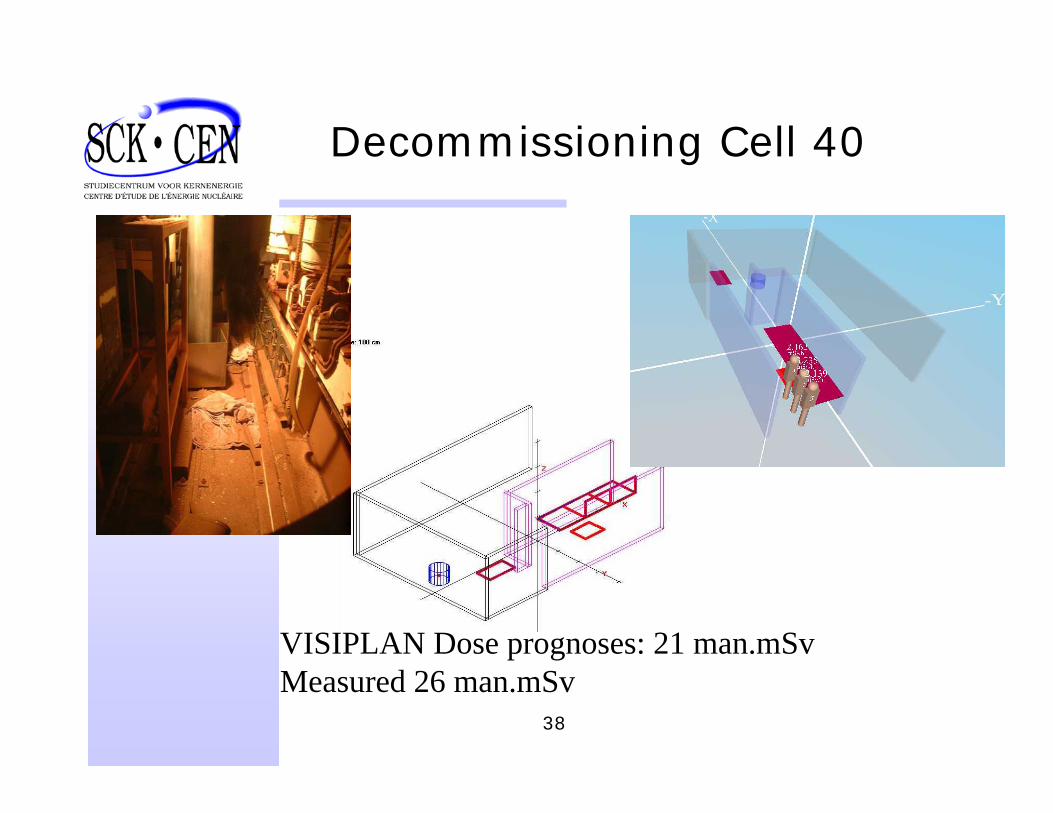
Decommissioning Cell 40
VISIPLAN Dose prognoses: 21 man.mSvMeasured 26 man.mSv

39
Almaraz site characterisation in the VRIMOR project
40
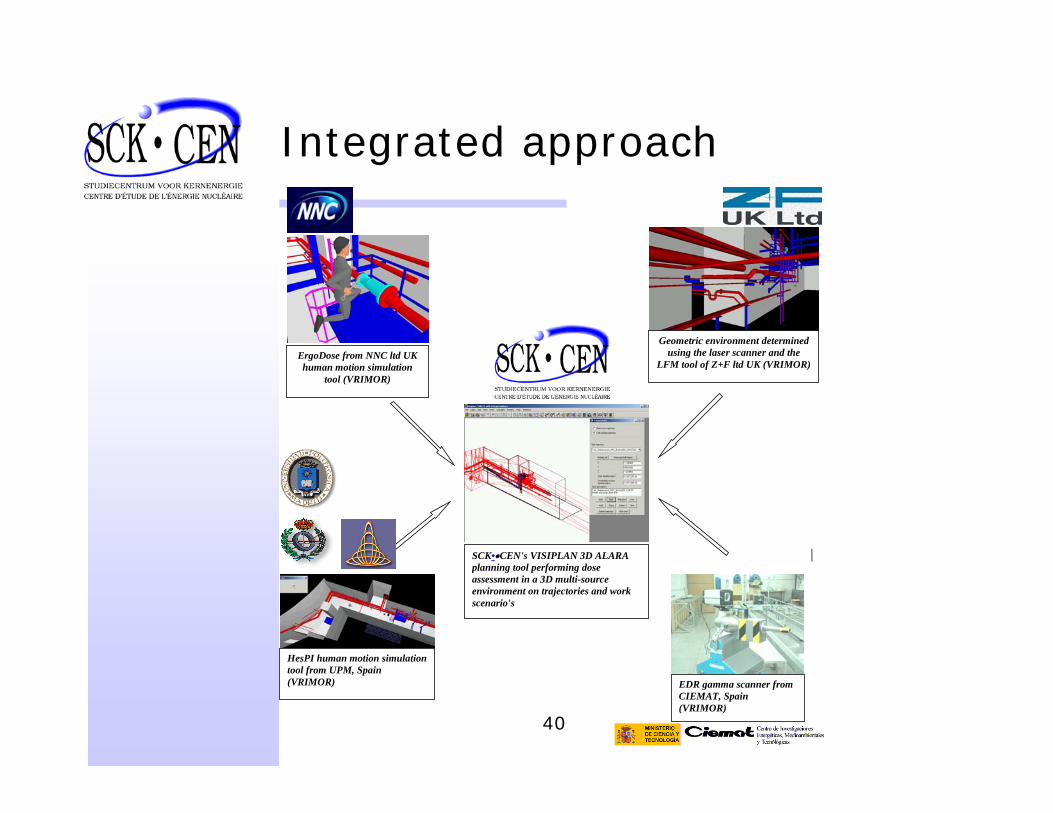
Integrated approach
SCK••CEN's VISIPLAN 3D ALARAplanning tool performing doseassessment in a 3D multi-sourceenvironment on trajectories and workscenario's
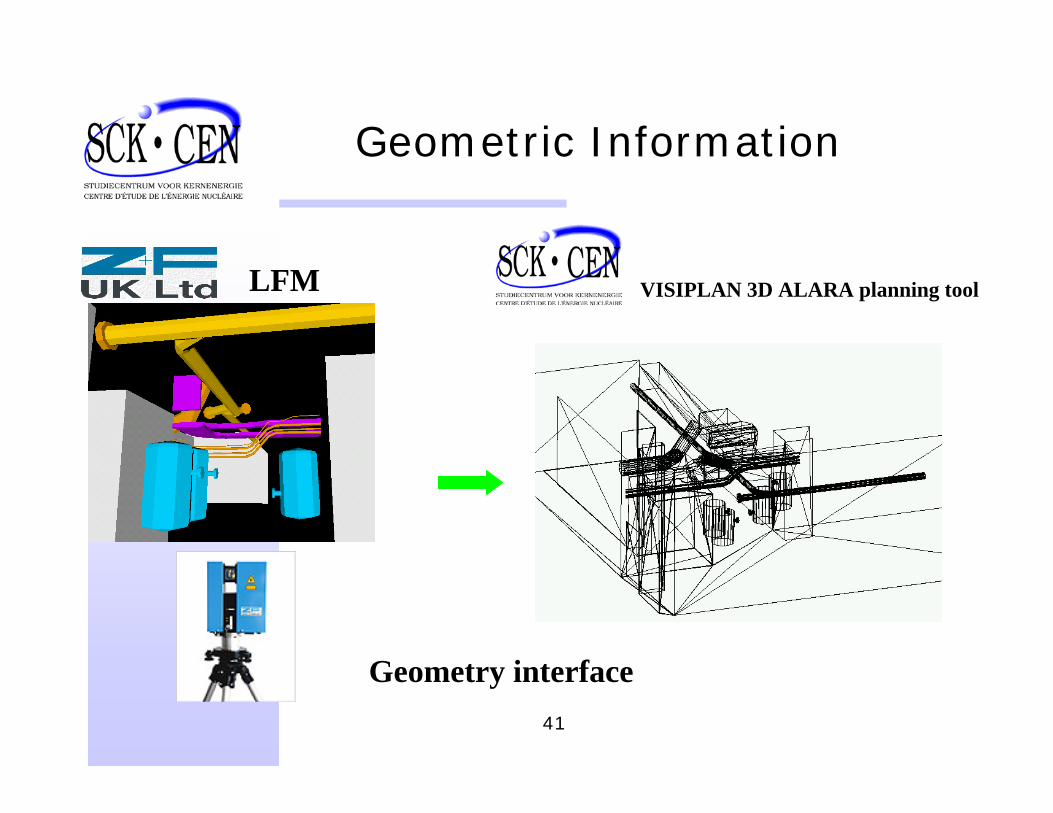
Geometric environment determinedusing the laser scanner and the
LFM tool of Z+F ltd UK (VRIMOR)
HesPI human motion simulationtool from UPM, Spain(VRIMOR)
ErgoDose from NNC ltd UKhuman motion simulation
tool (VRIMOR)
EDR gamma scanner fromCIEMAT, Spain(VRIMOR)
41
Geometric Information
LFM VISIPLAN 3D ALARA planning tool
Geometry interface
42
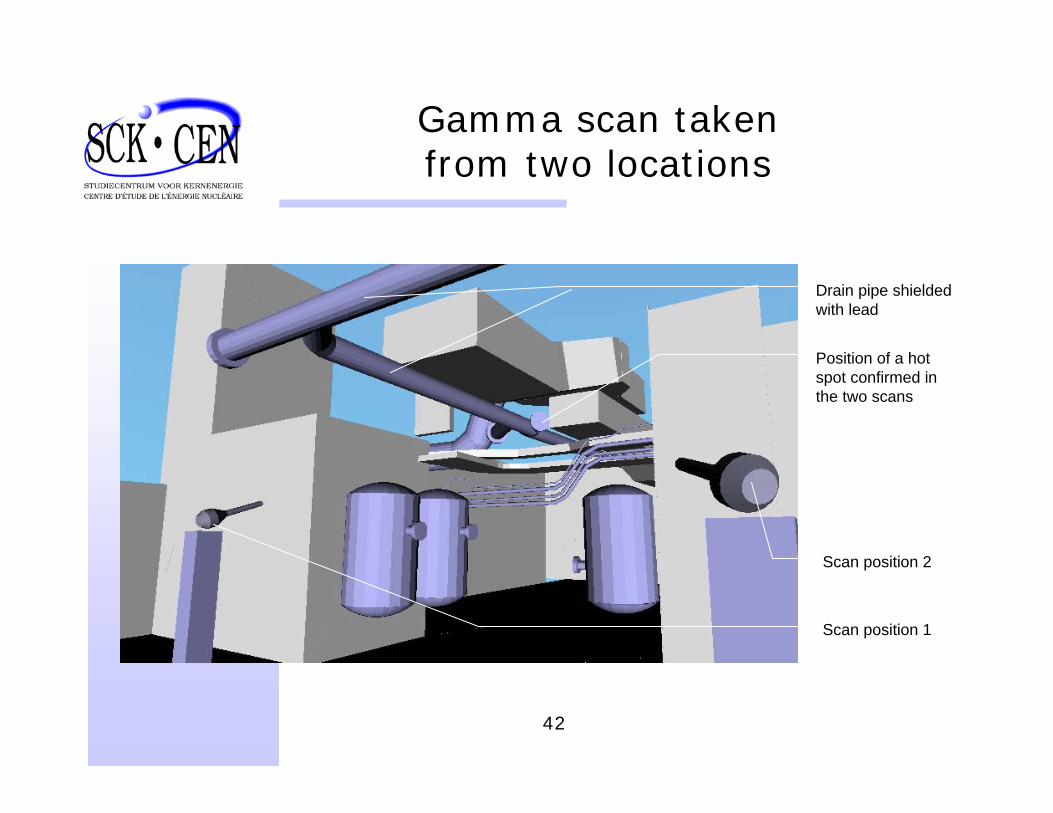
Scan position 1
Scan position 2
Drain pipe shieldedwith lead
Position of a hot spot confirmed in the two scans
Gamma scan takenfrom two locations
43
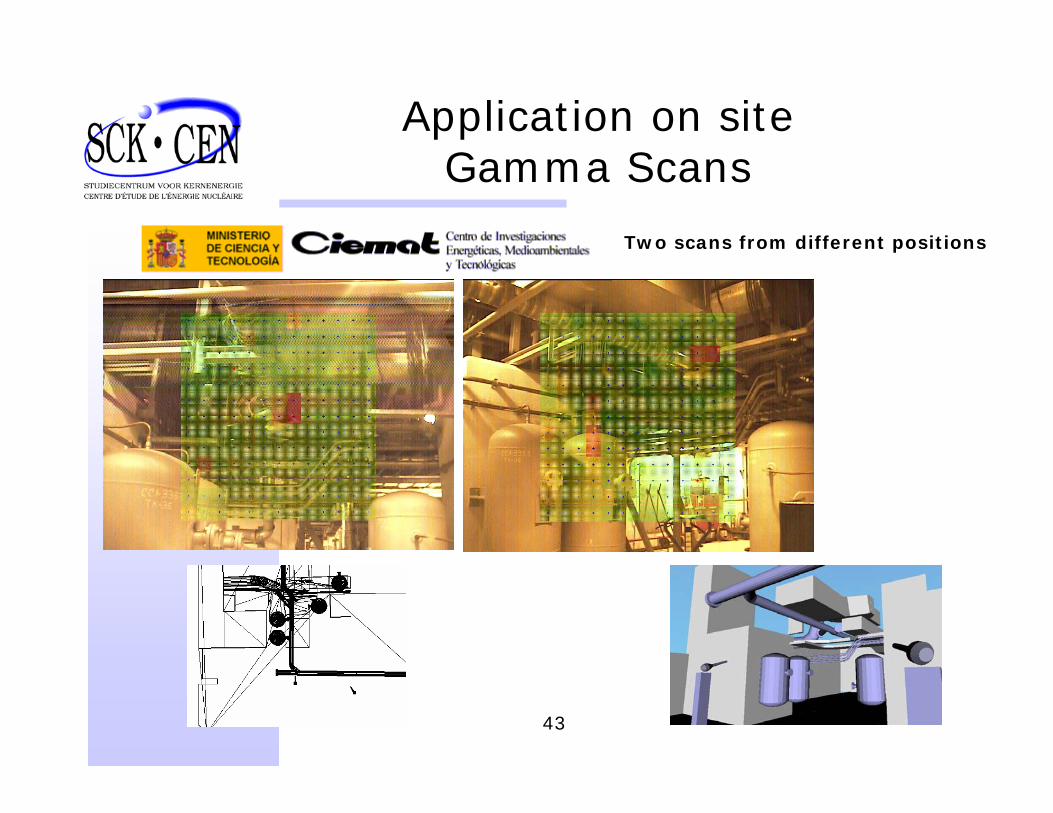
Application on siteGamma Scans
Two scans from different positions
44
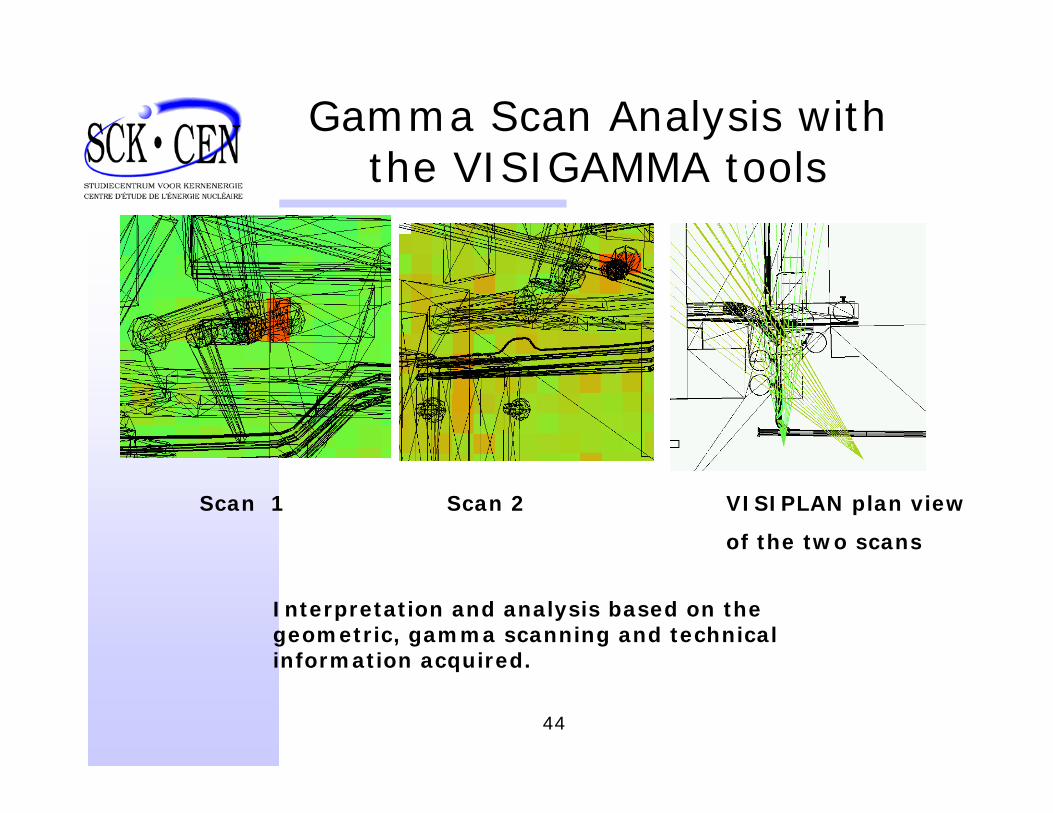
Gamma Scan Analysis with the VISIGAMMA tools
Scan 1 Scan 2 VISIPLAN plan view
of the two scans
Interpretation and analysis based on the geometric, gamma scanning and technical information acquired.
45
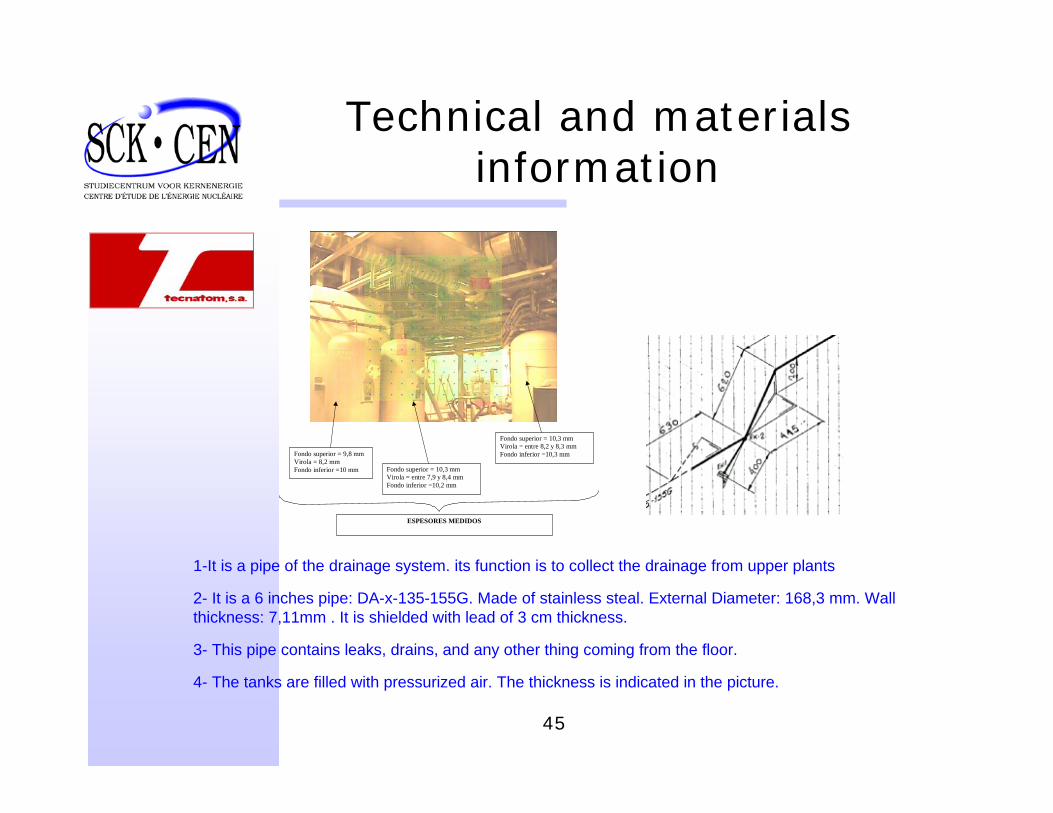
Technical and materials information
Fondo superior = 9,8 mmVirola = 8,2 mmFondo inferior =10 mm Fondo superior = 10,3 mm
Virola = entre 7,9 y 8,4 mmFondo inferior =10,2 mm
Fondo superior = 10,3 mmVirola = entre 8,2 y 8,3 mmFondo inferior =10,3 mm
ESPESORES MEDIDOS
1-It is a pipe of the drainage system. its function is to collect the drainage from upper plants
2- It is a 6 inches pipe: DA-x-135-155G. Made of stainless steal. External Diameter: 168,3 mm. Wallthickness: 7,11mm . It is shielded with lead of 3 cm thickness.
3- This pipe contains leaks, drains, and any other thing coming from the floor.
4- The tanks are filled with pressurized air. The thickness is indicated in the picture.
46
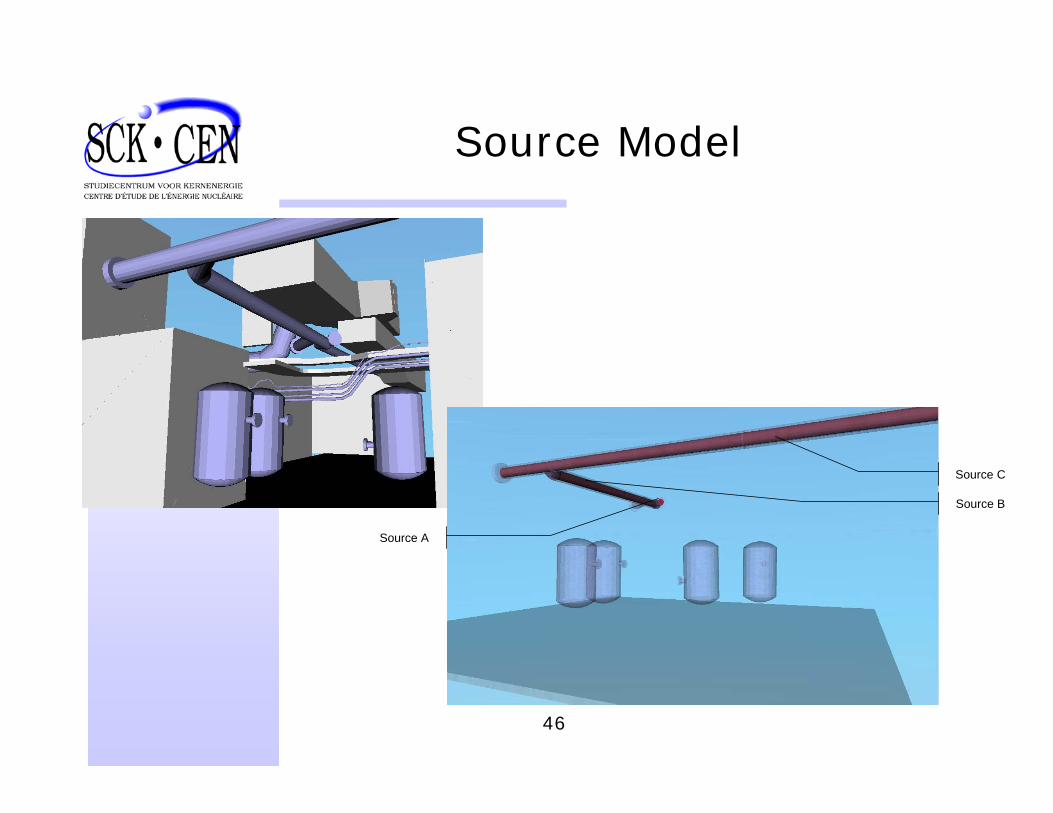
Source Model
Source A
Source B
Source C
47
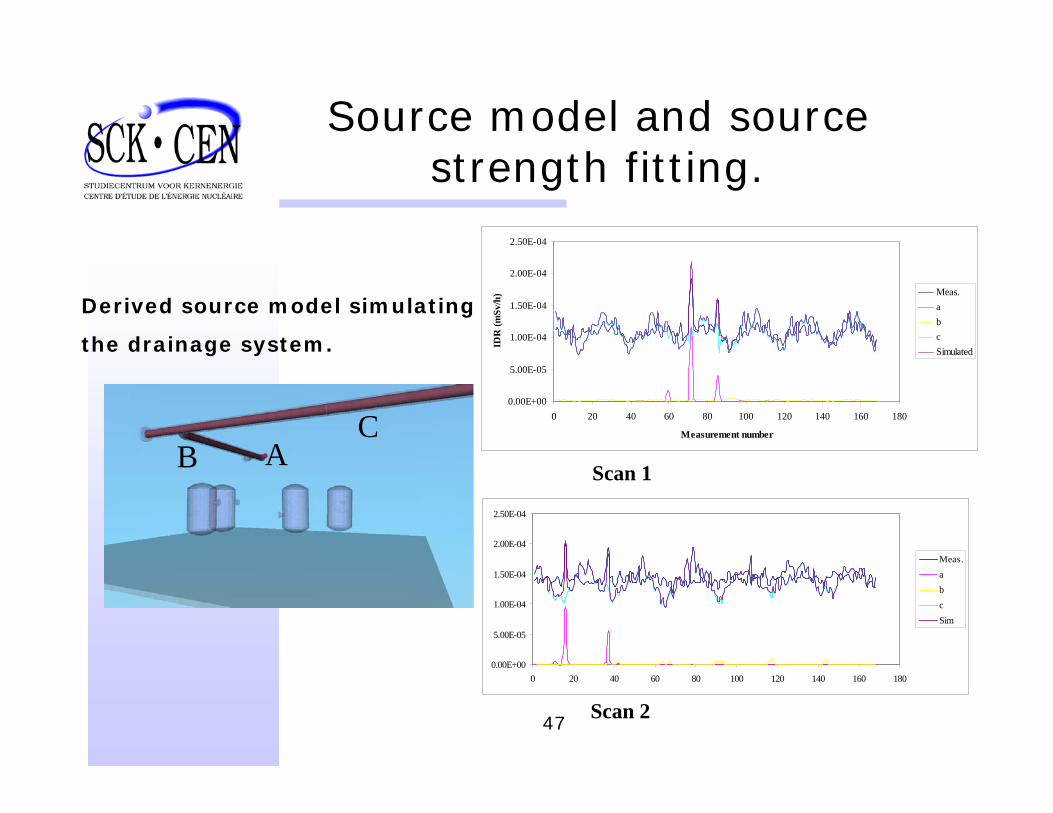
Source model and source strength fitting.
0.00E+00
5.00E-05
1.00E-04
1.50E-04
2.00E-04
2.50E-04
0 20 40 60 80 100 120 140 160 180
Measurement number
IDR
(mSv
/h) Meas.
abcSimulated
0.00E+00
5.00E-05
1.00E-04
1.50E-04
2.00E-04
2.50E-04
0 20 40 60 80 100 120 140 160 180
Meas.abcSim
Scan 1
Scan 2
Derived source model simulating
the drainage system.
ABC
48
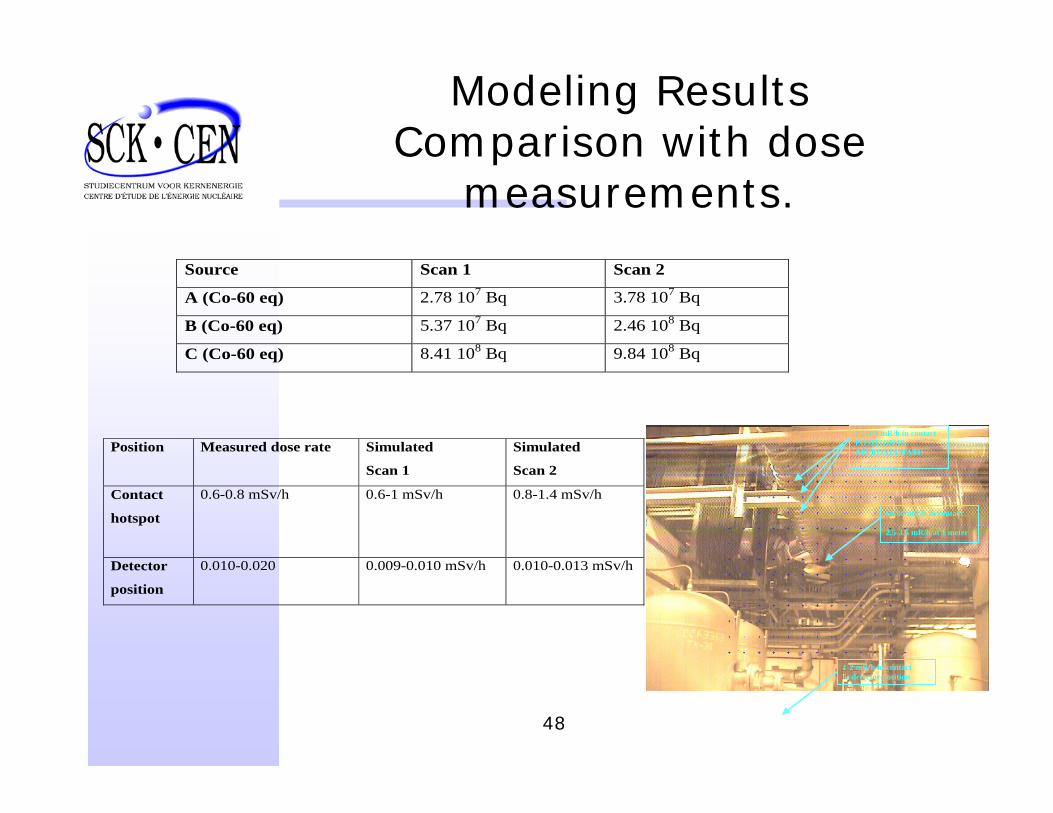
Modeling ResultsComparison with dose
measurements.
Source Scan 1 Scan 2
A (Co-60 eq) 2.78 107 Bq 3.78 107 Bq
B (Co-60 eq) 5.37 107 Bq 2.46 108 Bq
C (Co-60 eq) 8.41 108 Bq 9.84 108 Bq
Position Measured dose rate Simulated
Scan 1
Simulated
Scan 2
Contact
hotspot
0.6-0.8 mSv/h 0.6-1 mSv/h 0.8-1.4 mSv/h
Detector
position
0.010-0.020 0.009-0.010 mSv/h 0.010-0.013 mSv/h
2
60-80 mR/h in contact
2.5-3.5 mR/h at 1 meter
1.1-1.9 mR/h in contactPOSITION ISAPPROXIAMATE
1-2 mR/h in contactat detector position
49
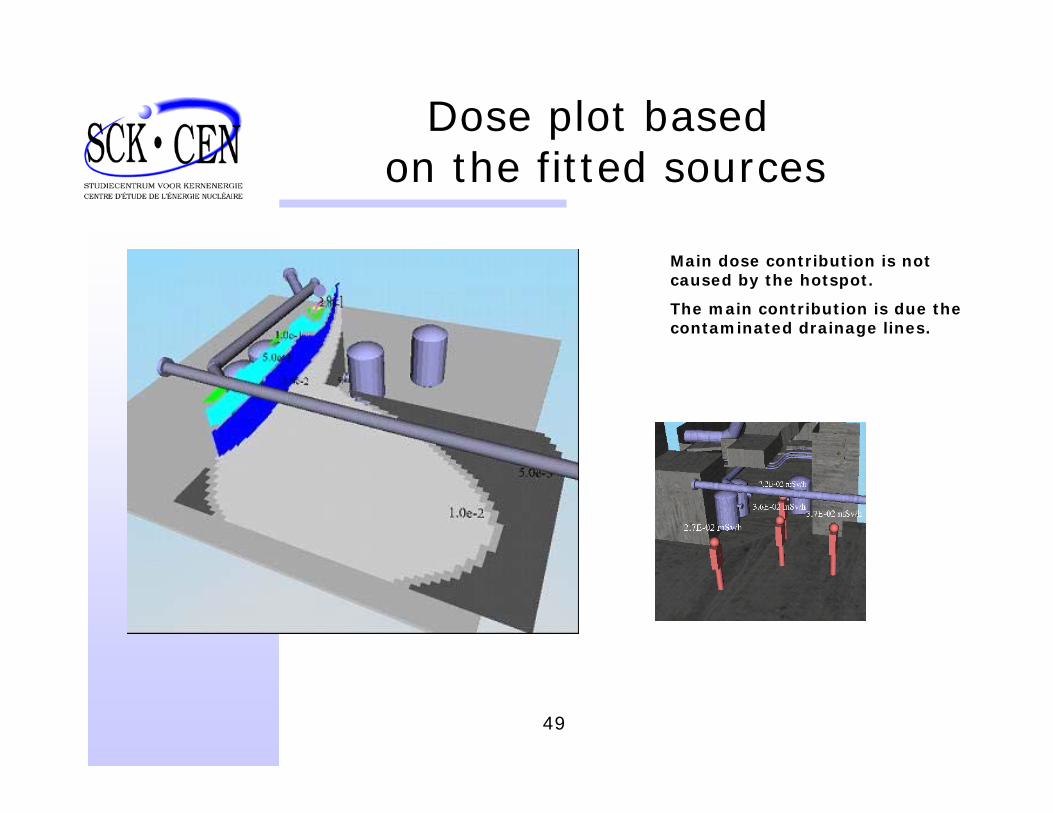
Dose plot basedon the fitted sources
Main dose contribution is not caused by the hotspot.
The main contribution is due the contaminated drainage lines.
50
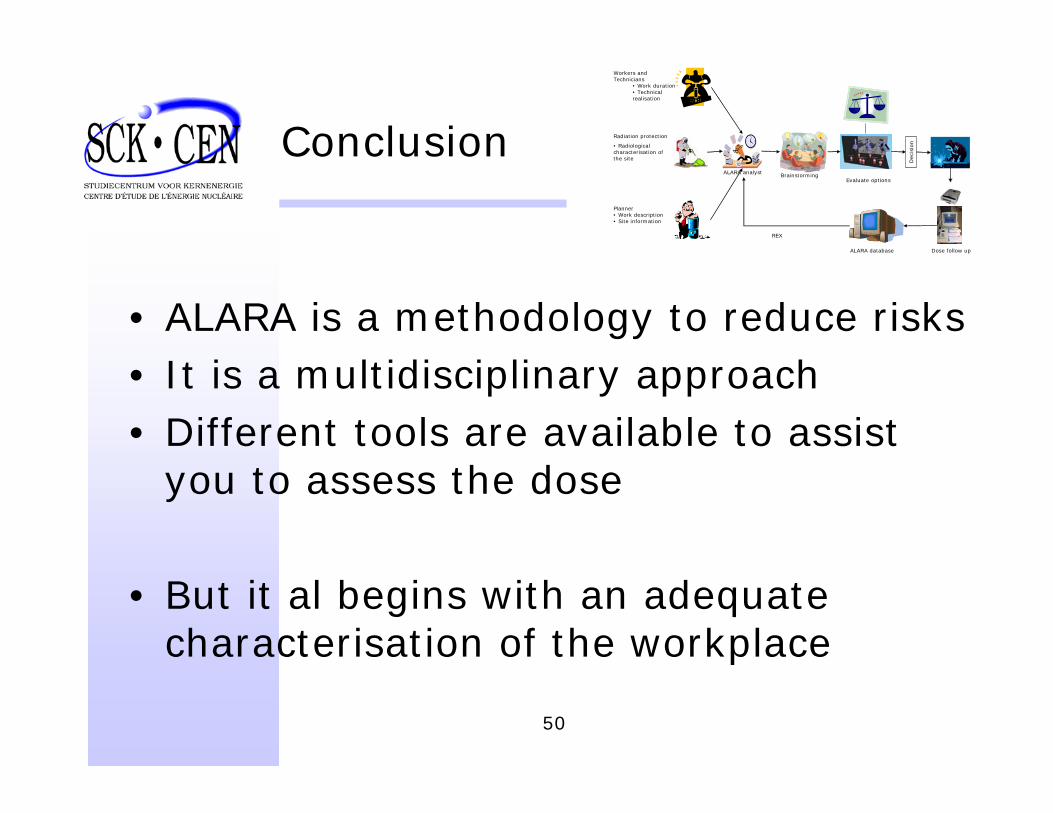
Conclusion
• ALARA is a methodology to reduce risks• It is a multidisciplinary approach• Different tools are available to assist
you to assess the dose
• But it al begins with an adequate characterisation of the workplace
Planner• Work description• Site information
Radiation protection
• Radiological characterisation of the site
Workers and Technicians
• Work duration• Technical realisation
ALARA analyst BrainstormingEvaluate options
Dec
isio
n
Dose follow upALARA database
REX


![BEAM DYNAMICS AND DIAGNOSTICS FOR THE HIGH ENERGY … · ENERGY BEAM TRANSPORT LINE OF MINERVA PROJECT AT SCK-CEN References: [1] D.Vandeplassche, “The MYRRHA linear accelerator”,](https://img.pdfslide.us/doc/110x75/5fcbee61137253359e69b09b/beam-dynamics-and-diagnostics-for-the-high-energy-energy-beam-transport-line-of.jpg)


![S 1.1 Zolzer.pptx [Read-Only] - SCK CEN](https://img.pdfslide.us/doc/110x75/6269447a94fbbb69965d3fb3/s-11-read-only-sck-cen.jpg)