Embed Size (px)
Citation preview
Examining the Use of a Visual Analytics System for
Sensemaking Tasks: Case Studies with Domain Experts
Youn-ah Kang and John Stasko, Senior Member, IEEE
Abstract—While the formal evaluation of systems in visual analytics is still relatively uncommon, particularly rare are case studies of prolonged system use by domain analysts working with their own data. Conducting case studies can be challenging, but it can be a particularly effective way to examine whether visual analytics systems are truly helping expert users to accomplish their goals. We studied the use of a visual analytics system for sensemaking tasks on documents by six analysts from a variety of domains. We describe their application of the system along with the benefits, issues, and problems that we uncovered. Findings from the studies identify features that visual analytics systems should emphasize as well as missing capabilities that should be addressed. These findings inform design implications for future systems.
Index Terms—Visual analytics, case study, qualitative evaluation.
1 INTRODUCTION
As visual analytics researchers, we ultimately hope that our technologies are making an impact and helping people gain value from their information. To do so, we need to evaluate such systems from multiple perspectives and reflect upon the findings [35,36]. Evaluation, however, is still not very common, probably because it is quite challenging to do [28]. While usability testing and controlled experiments remain crucial in the evaluation of visualization systems [8], particularly rare are actual case studies of prolonged visual analytics system use by analysts working in their domain with their own data.
Case studies can provide valuable findings and insights for visual analytics researchers. By detailing the use of a system, case studies yield a description of how a tool was used and where the users had problems. Until their particular challenges are understood, it also remains difficult to know how a visual analytic system helps expert users attain their goals. These findings are difficult to achieve through controlled lab studies.
The importance of case studies in information visualization has already been emphasized. Shneiderman and Plaisant [39] encouraged information visualization researchers to study users doing their own work in the process of achieving their goals. Perer and Shneiderman [26] also recognized the limitations of traditional controlled experiments in examining the process of exploratory data analysis.
Conducting case studies is challenging, however. First of all, it can be difficult to recruit appropriate people who are willing and able to use a particular system for their task on a regular basis. Case studies also often involve issues in the reliability, validity, and generalizability of results although these issues can be mitigated by scaling up the number of users. Nevertheless, it seems valuable to study domain experts working on complex problems over long time periods and learn how they employ systems. This paper examines extended field use of Jigsaw [40], a visual analytics system for helping analysts who work with large collections of documents. It complements an earlier comparative lab study of Jigsaw [20, 21] as well as descriptions of Jigsaw’s use in solving problems within the VAST Challenge [5,13,29]. In this paper, we profile six investigators who have been using Jigsaw in their own work, including three intelligence analysts, two academic researchers, and one business
analyst. The goals of this research include the following: To evaluate whether Jigsaw is helping analysts with their
tasks and problems To understand its applicability to different types of
documents and analyses To identify particularly useful features and capabilities of
the system as well as missing or problematic ones To reflect on usage to inform the design of next generation
tools for investigative analysis.
2 RELATED WORK
Komlodi, Sears, and Stanziola conducted a literature survey of about fifty user studies of information visualization systems [24] and found four main thematic areas of focus: controlled experiments comparing design elements, usability evaluations, controlled experiments comparing two or more tools, and case studies of tool use in realistic settings. Plaisant [28] believes that case studies are the least common type of studies. She argues that case studies describe how users do real tasks in their natural environment, demonstrating feasibility and in-context usefulness.
Shneiderman and Plaisant [39] also encouraged information visualization researchers to assess the efficacy of tools by documenting usage through ethnographically-oriented and longitudinal participant observation. They suggested a research method called Multi-dimensional In-depth Long-term Case (MILC) studies as a technique that seems well adapted to study creative activities that users engage in. Encouraging information visualization researchers to study users doing their own work in the process of achieving their goals, the paper lists lessons from ethnography methods used in HCI [16,17,31] including observations and interviews and suggests evaluation methodology guidelines for information visualization researchers.
Lam et al. provided an in-depth discussion of evaluation scenarios after conducting an extensive literature survey of information visualization publications [25]. While the scenarios they suggested distinguish different study goals and types of research questions, the authors recommend that case studies can be effectively used to study “if and how a visualization tool supports the generation of actionable and relevant knowledge in a domain.”
Despite of the significance of case studies in the field, there exist few evaluation projects based on case studies in visual analytics.
Chin et al. [9] conducted an observational case study with professional intelligence analysts in which participants worked on real-world scenarios, either as an individual analyst or as an investigative team. The researchers revealed various characteristics of the analytical processes of intelligence analysts, such as the
Youn-ah Kang is with Google Inc., e-mail: [email protected]. John Stasko is with School of Interactive Computing & GVU Center,
Georgia Institute of Technology, e-mail: [email protected].
Manuscript received 31 March 2012; accepted 1 August 2012; posted online14 October 2012; mailed on 5 October 2012. For information on obtaining reprints of this article, please send e-mail to: [email protected].
2869
1077-2626/12/$31.00 © 2012 IEEE Published by the IEEE Computer Society
IEEE TRANSACTIONS ON VISUALIZATION AND COMPUTER GRAPHICS, VOL. 18, NO. 12, DECEMBER 2012
investigative methodologies they apply, how they collect and triage information, and how they identify patterns and trends.
Gotz et al. [14] also recognized the lack of public studies examining analyst behavior and conducted a user study with a few analysts to explore the ways in which they gather and process information. Through interview, observations, and written notes by analysts, they report important factors surrounding analyst behavior in information gathering and results processing, such as how they keep record and what their investigative style is like.
Perer and Shneiderman [26] recognized the limitations of traditional controlled experiments in examining the process of exploratory data analysis and developed an evaluation methodology for studying the effectiveness of their system, SocialAction. Consisting of a long-term case study [39] and in-depth interviews, the evaluation confirmed the core value of SocialAction–integrating statistics with visualization–and further provided guidance for redesign of the tool.
Saraiya et al. conducted a longitudinal study with biologists and bioinformaticians using real-life microarray data [34], following their insight-based controlled study [33]. The goal of the study was to gain basic understanding into the visual analytic process such as how different visualization tools are used to gain insight into data, what process is followed by people to acquire needed insights, and how insight is synthesized over time. In the study, participants were requested to keep a diary of the analysis process, the insights gained, the visualization and interaction techniques that led to the insights, and the successes and frustrations they experienced with the software tools.
Seo et al. also employed a case study approach to evaluate the HCE 3.0 interface, using interviews and participatory observations [38]. Their goals were to understand users’ difficulties in learning the rank-by-feature framework and the HCE 3.0 interface so that they could improve the interface and their training methods for novice users. Through three case studies over eight weeks, the study demonstrated benefits of HCE 3.0 for knowledge discovery in research-level tasks, but yielded less guidance about improvements for the system.
A study by Bier et al. [3] assessed the suitability of their Entity Workspace System [2] in the context of design guidelines for collaborative intelligence analysis. The researchers modified their system based on five design guidelines and evaluated the system in both a laboratory study with intelligence analysts and a field study with an analysis team. Relying on analysts’ subjective feedback in conjunction with quantitative logging data, they confirmed the positive effects of the tool on collaboration and the usefulness of the design guidelines for collaborative analysis.
In our research, we focused on use of the Jigsaw system in particular. Other existing systems such as Analyst’s Notebook [18], Compendium [11,37], Sandbox [42], Entity Workspace [2], and Analysts Workspace [1] seek to assist analysts with similar document-related, sensemaking tasks.
3 METHODOLOGY
Jigsaw is not publicly available in general, but we distribute the system upon request. Approximately 150 people from a variety of domains including academics, government, law enforcement, intelligence, reporting, and fraud investigation have downloaded the system. However, we believe far fewer have used it extensively. We selected six analysts that we knew were using the system based on questions that they had sent to us about it in email. We asked if they would agree to tell us about their use of the system, and all agreed to conduct an interview with us and share their experiences.
The professionals include three intelligence analysts, two academic researchers, and one business analyst. They sought out Jigsaw after facing challenges in their own work and have been using Jigsaw for a range of 2-14 months. We conducted semi-structured interviews with each; two interviews were conducted face-to-face, and the other four were conducted over the phone.
Each interview lasted for about 45-60 minutes. While each was a semi-structured interview, we had a set of planned questions to make sure to cover important topics such as (1) What kind of tasks, data, and documents they used Jigsaw for, (2) To what extent and how Jigsaw helped their work compared to existing ways and methods, (3) What features were most/least useful, and (4) What barriers they encountered while using Jigsaw and how the tool can be improved. Sample questions include the following:
For which tasks have you used Jigsaw? What kinds of
documents are involved? What is the main purpose of using Jigsaw in analyzing
those documents? What do you want to accomplish? Before using Jigsaw, how did you perform the tasks? What
are advantages and disadvantages of the method? How do you typically work with Jigsaw and the documents? Which features do you use most? How does each of those
features assist your task? What barriers did you encounter while using Jigsaw? How
did you address the problem? How your usage has changed/evolved over time? What kind of features do you want to see in Jigsaw in the
future? While we took some notes during the interview sessions, all
conversations were audio-recorded for further analysis. We also collected several screenshots whenever possible. The interviews were transcribed and analyzed using a general qualitative analysis technique, borrowing techniques from grounded theory [7,41]. After skimming through the transcribed texts, we determined initial coding schemes (i.e., core themes). We then carefully examined the transcript to find data fitting each coding scheme. Since the interview guide already had core concepts and themes, we focused more on disentangling phenomena and relationships behind users’ experience with the tool. Once we went through the first round of analysis, we modified the coding schemes and repeated the process again. During the analysis, we also exchanged emails with participants as pertinent follow-up questions arose. Analysis was conducted by the first author as a component of her doctoral thesis [23].
4 CASE STUDIES
Throughout these studies, we found that the professionals have unique goals and consequently, different use cases of Jigsaw. This section describes each individual’s particular background, objectives, and how they used the system.
4.1 P1: Aerospace Engineering Researcher
P1 is an Aerospace Engineering researcher at our university working on aerospace systems design. She was examining two air traffic control-related initiatives–the Next Generation Air Transportation System (NextGen) by the United States and The Single European Sky ATM Research (SESAR) by the European Union (SESAR). The two programs consist of new concepts, capabilities, and implementation plans over the next decade, pursuing a more efficient air traffic management.
2870 IEEE TRANSACTIONS ON VISUALIZATION AND COMPUTER GRAPHICS, VOL. 18, NO. 12, DECEMBER 2012
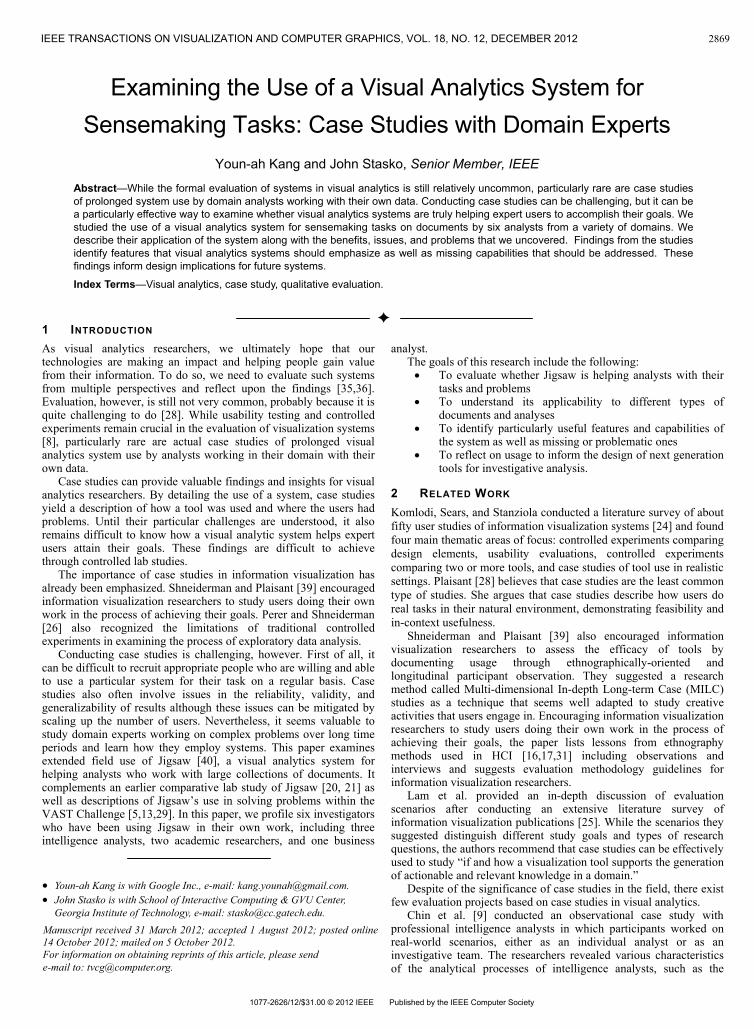
While the objectives of SESAR and NextGen are similar, a number of differences exist between the two initiatives. In her field, the need for harmonization between the two has been recognized, and she wanted to analyze to what extent the two initiatives are compatible with each other. Particularly, she wanted to compare similarities and differences between the two programs–if a concept or capability suggested in one program also appears in the other program, and if so, how each program describes the same concept. To do so, she needed to examine components, roadmaps, terminologies, and definitions in each program thoroughly. Each program has seven huge volumes of documentation, and each volume has dozens of documents in it. Each program has hundreds of Operational Improvements (OI) and enablers such as policy, technology, and procedures. Fig 1 illustrates one example of the many Operational Improvements in NextGen.
Her goal in this project was to create a mapping between the two programs by identifying similarities and relationships between operational improvements of each (Table 1).
Originally, she did the comparison manually using Microsoft Word and a search function. That is, she searched for descriptions of NextGen and identified keywords, and then she reviewed descriptions of SESAR containing matching keywords one by one, which was lengthy and cumbersome. Given the high number of descriptions and concepts, it became increasingly difficult to form a clear understanding of the underlying relationships and similarities between the two programs. At that point, she searched for a more analytically efficient way of reviewing the information and found Jigsaw. She had been using it for about 12 months when we interviewed her.
In order to import documents into Jigsaw, she modified the original document (Fig 1) into text files so that it could be readable. She created entity types including ‘Title,” “Initial Operational Capability (IOC) indicators,” “focuses,” “benefits,” as well as “the procedures, concepts and systems,” relevant to each operational improvement.
She performed analysis mainly using the Graph View and the List View of Jigsaw. In the Graph view, she searched for any OI of
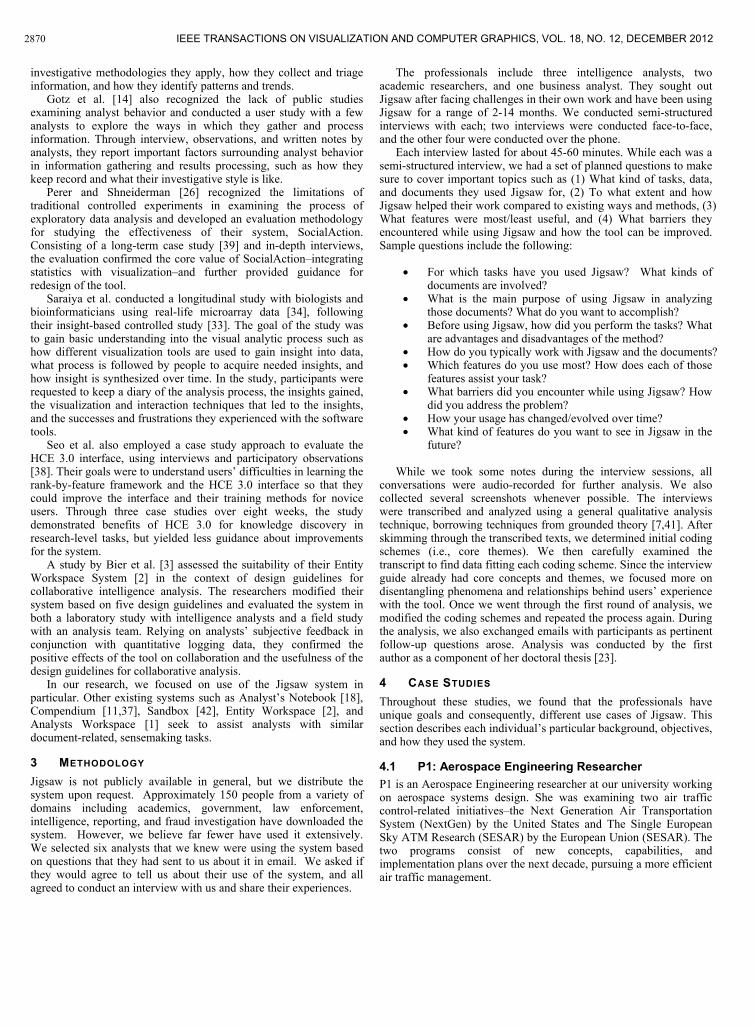
interest and the document associated with the OI appeared as a node. She then further expanded the node to reveal the different entities relevant to the document of interest. After filtering out all but the “Focus” entities and expanding all nodes, all connections between relevant documents are represented. An example of a Graph View representation resulting from querying one of the NextGen OI is shown in Fig 2.
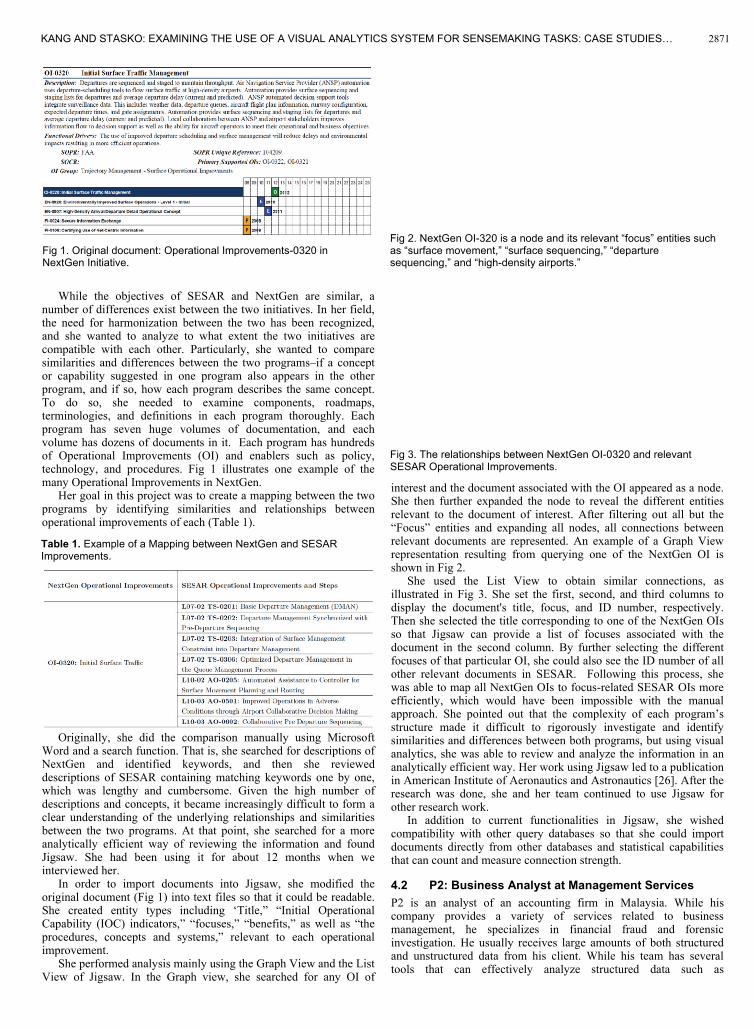
She used the List View to obtain similar connections, as illustrated in Fig 3. She set the first, second, and third columns to display the document's title, focus, and ID number, respectively. Then she selected the title corresponding to one of the NextGen OIs so that Jigsaw can provide a list of focuses associated with the document in the second column. By further selecting the different focuses of that particular OI, she could also see the ID number of all other relevant documents in SESAR. Following this process, she was able to map all NextGen OIs to focus-related SESAR OIs more efficiently, which would have been impossible with the manual approach. She pointed out that the complexity of each program’s structure made it difficult to rigorously investigate and identify similarities and differences between both programs, but using visual analytics, she was able to review and analyze the information in an analytically efficient way. Her work using Jigsaw led to a publication in American Institute of Aeronautics and Astronautics [26]. After the research was done, she and her team continued to use Jigsaw for other research work.
In addition to current functionalities in Jigsaw, she wished compatibility with other query databases so that she could import documents directly from other databases and statistical capabilities that can count and measure connection strength.
4.2 P2: Business Analyst at Management Services
P2 is an analyst of an accounting firm in Malaysia. While his company provides a variety of services related to business management, he specializes in financial fraud and forensic investigation. He usually receives large amounts of both structured and unstructured data from his client. While his team has several tools that can effectively analyze structured data such as
Fig 1. Original document: Operational Improvements-0320 in NextGen Initiative.
Table 1. Example of a Mapping between NextGen and SESAR Improvements.
Fig 2. NextGen OI-320 is a node and its relevant “focus” entities such as “surface movement,” “surface sequencing,” “departure sequencing,” and “high-density airports.”
Fig 3. The relationships between NextGen OI-0320 and relevant SESAR Operational Improvements.
2871KANG AND STASKO: EXAMINING THE USE OF A VISUAL ANALYTICS SYSTEM FOR SENSEMAKING TASKS: CASE STUDIES…
transactional data, they did not have an appropriate tool that can help analyze unstructured data such as emails or text files.
His main task is to examine unstructured data from financial databases of clients and to identify any linkages between people or companies relevant to financial fraud such as fictitious suppliers’ invoices (i.e., bloated expenses to minimise tax), systematic deletion of suppliers’ invoices, or fictitious customers’ invoices to boost revenue. Before using Jigsaw, he would put all of the text documents into an Excel database, search for specific keywords within the database, and start investigation by reading all the returned documents containing that keyword. Obviously, this process required manpower to make the database and make it searchable with appropriate keywords.
He had been using Jigsaw for about 14 months. First he converts all documents into text files and imports them into Jigsaw. Then he identifies entities such as organizations, people, dates, locations, description, and zip codes. He starts an investigation with the Wordtree View, in which he searches for names of interest, for example “ABC” company, simply to see the context of the person or company. Next he examines the connections more carefully in the List View to observe what documents link the two people/companies together and who is connected most. Once he sees a potential connection between an entity and a company, he searches for the company and further investigates if other entities are linked to the company. He sometimes uses the Document Cluster or Timeline View to check the amount of documents within a certain topic or time frame.
Through this repetitive process, he can reveal connections between entities and use it as evidence for financial fraud. Thus, Jigsaw provides support for his task by making it easier to find linkages between entities in emails. In one case involving 4.5 million transactions, his team identified approximately 100,000 transactions as fictitious supplier invoices over a period of 10 years using data mining software. They suspected "John Doe" as being the prime culprit, but they needed evidence for that. They asked the HR personnel to seize his notebook and cloned his hard disk drive. After indexing all the documents on his notebook, they imported about 100,000 emails from the past 10 years into Jigsaw to find the motivation for the fraud. After analyzing the documents, they finally found that the theft of funds occurred because the suspect needed to support his children's education costs overseas.
Because his data comes as different formats such as pdfs, docs, and emails, he wanted to be able to import documents directly into Jigsaw instead of having to convert them to .txt format manually (Jigsaw’s import of pdf and MS word files is sometimes problematic). Since he mainly looks for evidence, he also seeks the ability to statistically compute closeness or correlation between connections.
4.3 P3: PhD Candidate in Industrial and Systems Engineering
P3 is a PhD student at our university. Her research is about enterprise transformation, in which she tries build mathematical models of how firms can evolve over the years. In her previous research, she formulated mathematical models about company transformation, and now, she wants to validate the models by combining them with historical data of several companies. The company data, which includes 5,000+ company announcements and new articles of nine IT companies for 10 years, contains critical information about firms such as new product releases, executive/board changes, business expansion, strategic alliances, etc. By measuring how often those events have occurred in the past, she aims to combine the quantitative information with her model to see if the model is valid or not. That is, she is ultimately trying to transform qualitative information about the IT companies into a quantitative form that can be incorporated in her model. But she was in her initial stage of the research, and she first wanted to understand the documents and generate keywords based on the understanding for the next steps.
After actively searching for software, she decided to use Jigsaw for her research and used it for 2 months.
Again, her goal in using Jigsaw is to obtain an overview of the huge document collection and extract keywords from those documents. Her documents were stored in Excel spreadsheets, which is an appropriate format for Jigsaw. She added entity types such as event type, company name, capitalIQ, and date, so that she could understand key events of each company. While she tried all the system views, she ended up using two views: The List View (most frequently) and the Calendar View when she was focusing on a specific time period, e.g., if something is occurring in a certain period.
While Jigsaw helps her research primarily at the initial stage, she thinks that it is very helpful in making sense of the documents in a relatively short amount of time. For a more detailed analysis and the ultimate output, she is using other software such as NorthernLight and statistical tools in conjunction with Jigsaw:
Jigsaw is ... for understanding. If I need to talk to my advisor
about something, I’d go back to Jigsaw and import some documents, and then I can talk [about] what’s really going on in this company. For more formats, I need to do statistical analysis, and I have to use other software that have better output format. For this particular project, I’m using more than 5 software [tools].
One difficulty she encountered was working with entities because
the system did not identify those she really wanted. She did not find the people and organizations identified by the system very helpful and had to create her own lists. Because her purpose of using text analytics software was to finally create a statistical analysis instead of getting to know about the data in detail, she sought more functionality in terms of output such as a timeline table or word count results.
4.4 P4: Intelligence Analyst at a Police Department
P4 is an intelligence analyst at a police department in a city of close to 70,000 population. His work includes making sense of incident/crime reports everyday and discovering patterns, trends, and any top issues in the city. Particularly, he seeks to make better connections between individuals and other information collected in the incident reports. Because the amount of reports increases day by day, he has been trying to find ways to better analyze the narrative text data from the incident reports in their records management system.
Before using Jigsaw, he did not have any ways to systematically work with the information. Basically he could not do anything but read and remember. He read all the reports individually and tried to remember different connections between people, and then recognized names and locations that were outstanding. In order to know who is connected to whom, and in what documents, he printed a copy of the documents, put all the printed reports together, and tried to see the relationships.
When he discovered Jigsaw, he found it very helpful because he wanted to connect people, narrative text, subjects, and concepts in the same system. His goal in using Jigsaw was therefore to make sense of the crime reports and to find connections, patterns, trends, and associated names/places/other incidents. He had been using the system for 12 months when we spoke with him.
In order to work with Jigsaw, he reads in crime reports and puts them into an Excel spreadsheet, in which he adds labels for each column such as “Case number,” “Name,” “Person involved,” “Incident address,” “Home address,” “Report date,” and “Description.” Then he imports the spreadsheet into Jigsaw and starts the investigation. The number of documents (e.g., the number of rows in the spreadsheet) ranges from 600 to 40,000 crime reports, depending on the time frame the investigator is interested in, for example, 1 year or 2-3 months of crime incidents. He mainly uses the List View, Graph View, and Document View. In the List view, he normally employs several lists such as persons, addresses and
2872 IEEE TRANSACTIONS ON VISUALIZATION AND COMPUTER GRAPHICS, VOL. 18, NO. 12, DECEMBER 2012
crime types, and conducts a search on a person and examines what addresses and crimes they are connected with. He sorts the lists by connection strength to get a quick sense of relationships between persons, addresses, and/or crimes. He also likes the visual aspect of Graph View in that he can look at connections through link analysis. He generally starts with one individual and then expands out from that person to see what documents, individuals, and addresses that person is connected to. While many times he starts with one person, after expansion of entities, he starts looking at other individuals and their relationships. In the Document View, he takes the information from the List View–such as a suspect or victim, selects the person, and then reads all the crime reports that person has been involved in and looks for any patterns or trends related to that person, involving crimes. Sometimes he uses the Calendar View by selecting an individual in the List View. Then he finds a strong connection with another individual and proceeds to look at those two individuals together in the Calendar View, in order to identify when they are associated with each other, on what dates.
He has already experienced the utility of Jigsaw in his work by helping the police to arrest a criminal. The police were trying to find a criminal, and he searched for the name of another related person in the document collection and examined connections between the two, finally identifying an address where the criminal might be. He liked both visual and investigative support by Jigsaw:
I think Jigsaw’s strength is its visual support, and investigative
support. It would have been impossible without it...When I showed the results and connections to other colleagues, it was easy for them to understand how a certain person is connected to others, that is, providing the context.
One of the issues he encountered is determining the amount of
data to import. If he imports documents from the last two years, it would be easier for him to see long-term trends and links between associates. However, it will take significant time to import the documents and clean up the entities (i.e., manually fixing incorrect entity identification). If he imports documents of only several months, it will be faster to import and handle, but he will be able to see short-term trends only. Considering the trade-off, he must spend significant time considering the optimal point.
4.5 P5: Intelligence Analyst at a National Lab
P5 is an intelligence analyst at a national laboratory. His department receives a number of resumes for post-docs and researchers who are applying to the lab throughout a year. Among the applicants, he is interested in finding someone who has expertise in a specific area, and being an intelligence analyst, he utilizes his analysis skills in finding candidates. To identify who has the specialty the laboratory requires, he looks at not only the technology/specialization an applicant explicitly expressed, but also publications, co-authors and collaborators, and previous institutions of an applicant.
Before using Jigsaw, he performed the task using Analyst’s Notebook, which he felt was limited because he had to manually type in all the data in resumes to the Analyst’s Notebook and create connections:
I was having to do it one at a time and tying them together
manually, really. I mean I was using Analyst’s Notebook, but pretty much you have to put the data in by yourself. There’s not a lot of ways to pull in data, so it’s really a lot of work, especially when there’s a lot of resumes in our system.
When he was introduced to Jigsaw, he found that it might be a
good fit for his task–finding connections between people and technologies (specialties). Since then, he had been using the system for 7 months. He usually works with 10-12 resumes and creates entity types such as institutions, organizations, technologies (specific types of technologies), publications, co-publications, employment history, dates, and emails. Especially, he tries to find who is
connected with whom within a community. By investigating the connections, he ultimately seeks to find an expert in a specialized area, for example, an energy expert.
Working with resumes, he found the Document View really helpful. Interestingly, he uses the view for “identifying what views to use,” as well as for simply reading the documents. He first reads a couple of documents in Document View and determines which other views would be appropriate and effective for analyzing those documents. That is, by getting a brief overview of what each document looks like, he decides which views to utilize for investigation. Among other views, the List View helps him clearly visualize who is connected to what technology or organization. Particularly, the view is useful when an applicant does not explicitly mention a certain technology as specialization but still has background or experience relevant to the technology in the past. Using the List View, P5 could see possible connections and find a good candidate who is knowledgeable about a technology, which would have been much more difficult otherwise. He also often uses the Document Cluster View when he wants to see how the documents can be categorized. He then would select a specific document cluster to read some of the documents in that category.
He mentioned that entity identification and being able to focus on the inter-connectedness of ideas between people and technologies were especially beneficial. Due to these features of Jigsaw, the process of investigating resumes has become more efficient and effective, as it helps him bring connected people together that he might not have been able to see otherwise.
While entity identification is a benefit, it also seemed to be a barrier to him. Because Jigsaw does not always recognize all the entities as he wants, he has to go through the documents and clean up entities after the initial import.
4.6 P6: Intelligence Analyst at Air Force
P6 is an intelligence analyst at the Air Force. He was working on a project in which they examined the Research and Development Descriptive Summaries, which are budget documents for R&D programs in the Department of Defense [30]. It is a large document collection (>10,000) from 20+ agencies such as Air Force, Navy, DARPA, etc., and each document contains a one-page budget summary including description and justification.
By analyzing these documents, he sought to identify common themes, what programs are similar, what makes them similar, and who are working on similar topics. Because it was a large document collection, he had no idea of how they are related in the beginning. So he searched for a visual analytics tool that can help his analysis, and finally found Jigsaw.
He had been using Jigsaw for 14 months when we interviewed him, and his goal was to find related tools, topics, technology, and people working on a similar topic in the documents and to discover clusters of data that he might not notice. Instead of deeply analyzing the document collection, he wanted to highlight similarities and connections among the documents so that he could narrow down to specific entities to further investigate.
For this task, he first wanted to find entities that had a similar function. That is, he used Jigsaw for a similar tool search and a synonym search. For example, if tool A forecasts certain type of data, then he tried to find other similar tools and examine their functionalities. Whenever he found a tool of interest, he queried it in the Jigsaw control panel and read returned documents that contained the tool. He also did the same process for a verb that expresses specific functionality such as “predict.”
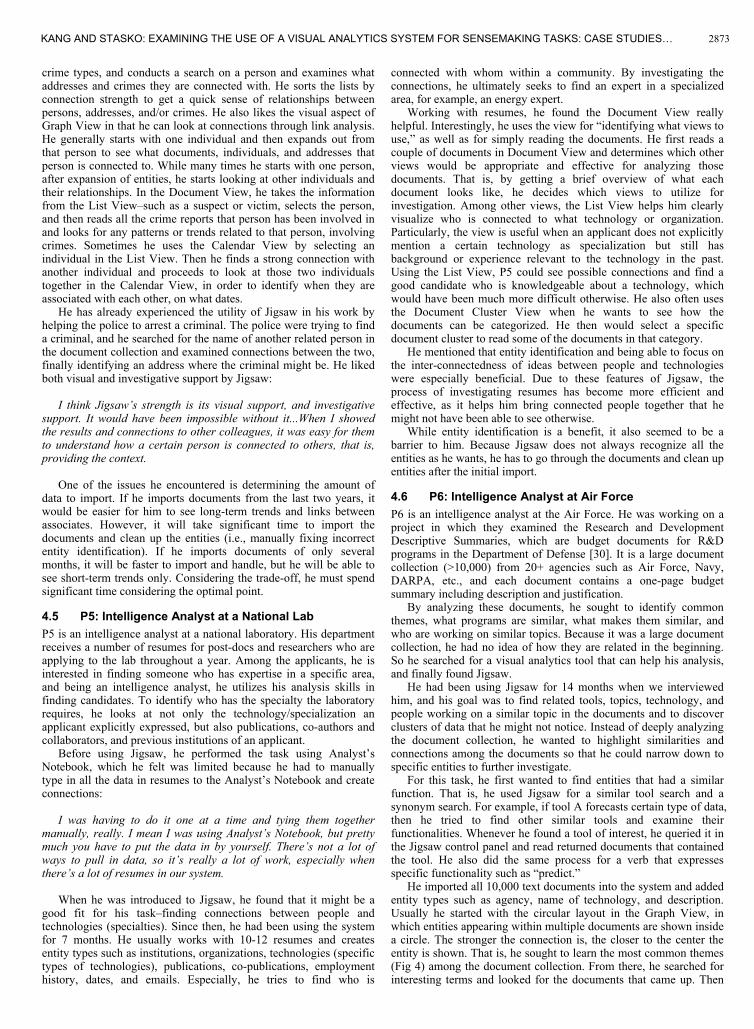
He imported all 10,000 text documents into the system and added entity types such as agency, name of technology, and description. Usually he started with the circular layout in the Graph View, in which entities appearing within multiple documents are shown inside a circle. The stronger the connection is, the closer to the center the entity is shown. That is, he sought to learn the most common themes (Fig 4) among the document collection. From there, he searched for interesting terms and looked for the documents that came up. Then
2873KANG AND STASKO: EXAMINING THE USE OF A VISUAL ANALYTICS SYSTEM FOR SENSEMAKING TASKS: CASE STUDIES…
he opened the List View to further explore the connections. Sometimes he would examine immediate clusters–a group of documents towards the center–in the circular layout in the Graph View and highlight those entities so that he could explore them in the List View. By doing this process repeatedly, he was able to find what he wanted.
With Jigsaw, he could effectively search for similar tools and technologies that required further investigation. Through the circular layout, he was able to easily identify where to start his investigation when he did not have a clue where to begin. Even when he had some idea of what he would investigate, Jigsaw helped by showing other interesting documents and keywords so that he could investigate further, which led to a better set of documents instantly. Once he got a set of documents of interest, then he could see important connections such as what are related topics, what kind of programs are related to the topics, and who are working on the programs. He emphasized that Jigsaw was particularly helpful when convincing people because the visualization itself drew other people’s attention to his work:
..and it was pretty. People who received the briefs with that
picture in there, they loved it. They said that the coolest picture was the Graph View in Jigsaw. That’s a sign [that] it’s a good analytic tool. But having that graphic that you are able to show the most central themes in this set of documents and say that’s because of this and this…It’s definitely nice to look at that stuff.
Visualization helps convince people. People pay attention a lot
more than if I just told them. It proves itself. In terms of problems, he pointed out that there was no way to
easily select a subset of data in Jigsaw. Because he had to select each document one by one, he found it difficult to look at a group of documents at a time. He also wanted some mathematical measures such as centrality between documents so that it can give a more objective sense.
5 FINDINGS AND DISCUSSION – HOW THEY USED
JIGSAW
Reflecting on our interviews and discussions with analysts, a number of common themes emerged. Ahead of time, we cared about how an interactive visual system for investigative analysis assisted document sensemaking in various domains, and what kind of issues emerged upon the use of a system. We also hoped to see if professionals used the tool in unexpected ways. We characterize four dimensions in this section.
5.1 Types of Tasks
While all individuals in the study were from different domains and had unique problems, we could classify their tasks into a few categories, described below.
Relationship/connection between entities: P2 (business analyst),
P4 (analyst at a national lab), and P5 (analyst at a police department) searched for a tool that could help them make connections and find complex relationships between entities that were not apparent simply by reading documents. They were investigating emails to detect financial fraud, crime reports to make linkages, and resumes to find a candidate with specific expertise, respectively. Rather than seeing the big picture and understanding the entire story, they did a more targeted investigation. For this type of task, it seemed that Jigsaw’s model of connection was sufficient and the analysts felt it highly useful and beneficial to their task.
Search/Comparison: P1 (Aerospace engineering researcher) and P6 (analyst at Air Force) used the visual analytics system to compare documents and search if the documents contain specific keywords. P1 explicitly compared two sets of documents, examining whether a set of documents contain similar concepts identified in the other set of documents. P6 tried to find if certain tools or technologies have similar functionalities within the document collection, using the system for a similar tool search and synonym search.
Understanding: P3 actively looked for a tool that can help her understand the huge collection of documents, and thus she used the system to attain a better, clear understanding of the documents. By “understanding,” we mean gaining an overview of the documents. She did not conduct a detailed analysis using the system. Instead, based on the overall understanding she gained from the system, she set the basis for a further analysis, which she performed using other software.
In addition to these three types of tasks, some of the analysts
found the system useful as a communication aid as well.
As a communication aid/shared understanding of data: P2, P4, and P6 commented that through the visualizations created by the system, they were able to effectively share findings and connections with colleagues. While they did not initially expect that effect, it seemed clear that the visualization system had a persuasive power and added value in communicating with others.
5.2 Learning the System
Jigsaw is a relatively complex system and has a number of features that may not be intuitive at first. All the professionals we interviewed had technical knowledge enough to learn and utilize the system. To learn about the system, every person watched the video tutorials available on the web [19] and gained a general idea of how the system works before they started using it. While most of the users also read the tutorial document and found the tutorial very helpful, they admitted that mostly they went through by themselves and interacted with the second author to ask questions and solve issues that arose.
A few of the analysts told us that they did not have any problems in learning to use Jigsaw and the system was pretty intuitive and easy to use. Still, many of the users seemed to encounter a learning curve. This was more about making sense of “how to better analyze my data using this tool,” rather than about learning how to use the system itself. Even after they became familiar with the system and its features, they tried to find the best way to analyze their own data among a number of views and ways to display the data in each view, thus “constructing a frame” [22]. They had questions such as “which views are most appropriate for my data and task?” or “what entity types do I want to put in this column?” Once they found the optimal approach in their own way, they seemed to settle down with it; their usage pattern did not change much.
Fig 4. Critical research areas identified by the circular layout in the Graph View.
2874 IEEE TRANSACTIONS ON VISUALIZATION AND COMPUTER GRAPHICS, VOL. 18, NO. 12, DECEMBER 2012
5.3 Unexpected Use of the System
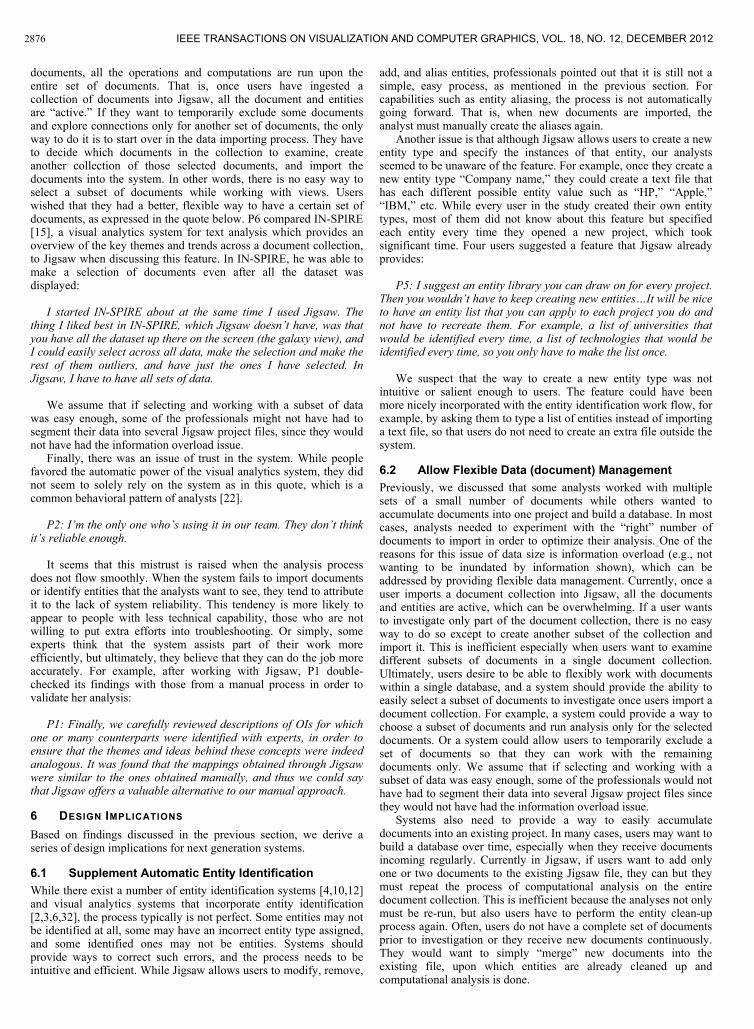
In the study, we recognized that the professionals sometimes used the system in unexpected ways, which may provide some insights for design. The first one is using the views for evidence/output generation, rather than for exploration. Jigsaw was originally designed for investigative analysis; it helps a person determine which document to read next. But often, people used it as a search tool with a visual aid; after they found specific connections by searching for a keyword, they created a representation of these connections. For example, in the case of P1, she wanted to create a mapping between two documents and used the List View to more effectively generate the mapping, which formerly was done manually (Fig 5). In these cases, it seemed that people missed the investigative power but instead used the system as a presentation aid.
One of Jigsaw’s goals is to help analysts with a large number of documents. In the study, however, we found a few experts using Jigsaw for a relatively small number of documents. In those cases, they worked with information-dense documents and did not want to be overwhelmed by the information shown in the system. Thus, they separated documents into several projects, making each project manageable. P5 said that he usually imported only about 10 documents into the system for his analysis:
Sometimes it’s as low as five. I tried a couple of hundred at first,
but it was really too much information. Now I try stick to under 10. For most of the time, I’ve done 12. I don’t like putting too much into one project because it becomes too complicated.
Some might say it’s too few [documents] to use Jigsaw, but it’s
not that easy. Resumes have condensed [content] in a few pages. You’re looking at, in addition to everywhere the person’s been, people who they’ve worked with. Typically you have a list of publications that have 5 or 6 names, a couple publishers per line. Using those ten documents to compare to another ten documents, it begins to become more complex. Ten documents...doesn’t sound [like] a lot, but it is quite a bit of information.
In contrast, we found some analysts using Jigsaw itself as a
database. Those people wanted to merge new incoming documents with an existing Jigsaw project and build a historical dataset so that later they can explore it in a single project file. Three professionals emphasized that they wanted to accumulate new reports to the
existing project so that they do not need to re-run all the computations and start over the entity clean-up process. Several users commented:
P4: Analysis is ongoing, it’s never done. I want to build on
previous data...I'm trying to figure out how much data should I import. The more data I import…I can see long-term trends and make long-term connections between associates better. But the issues would be time to import and clean up entities on a bigger set of data.
P3: I have about 30 Jigsaw projects. An issue is that 2000-3000
is the maximum for Jigsaw to handle. I mean, the processing time is acceptable for that amount. This is HP documents from 2009 to 2011. I can’t do it from 2002 to 2011 because it’s [going to] be more than 10,000. So I just do it like from 2002 to 2004, something like that. If it was doable, I’d definitely import them all at once.
This notion of “file management” or “project management” could
have an important design implication for analytics systems. We will discuss this matter more in detail in the next section.
5.4 Issues and Problems
Some issues and problems in using the system have been identified through the study, at various levels. Here, we want to highlight a few prominent issues.
One of the initial barriers in working with Jigsaw was technical issues in the preparation stage such as importing data into Jigsaw and identifying entities. Technically, Jigsaw can read in documents in a variety of file formats including text, html, pdf, Word, and Excel files. However, plain text files or Excel files are the most reliable type of file to import, and users are recommended to transform their documents into text or Excel files if possible. Because people often have documents as pdf or Word files with complex formatting and images, importing these files directly into Jigsaw is less reliable, and therefore, users need to put extra effort to convert their documents into plain text or Excel files. Identifying and working with entities is another similar issue. While Jigsaw provides automated entity identification via third party libraries, which attracts many users, it is not perfect and many false positives and negatives can occur. In order to fix incorrect entity identification, users have to manually choose each word to add, remove, or modify. Creating a new entity type is common because users have their own interest when working with documents. Actually, all of the professionals in the study created their own entity types applicable to all documents in the collection. Users also have to go through the process of entity aliasing, which creates aliases for entities that are identical but worded differently.
While this grounding process–both importing documents and cleaning up entities–does not seem to be a serious issue in terms of the analysis process, it turned out that most people considered it as one of the biggest difficulties in using Jigsaw. Without addressing these issues in the beginning, they are not even able to see their data properly displayed in the views. When they encounter any problem in the process, they typically needed to contact the developers and get instructions, which could be cumbersome and even daunting to someone without technical background. All the professionals in the study mentioned that the initial processing required a lot of time and effort. Once they undergo this stage, however, they became easily engaged in working with the views.
P5: One of the biggest difficulties that I encountered was entity
identification. When importing data, because a resume is not a type of data that Jigsaw is designed to read, I still have issues with entity identification. Well, I have to go through it one by one. Have to do a lot of cleaning after the initial importing of data.
Another issue that the analysts faced was that Jigsaw has very
limited filtering options and users are not able to easily select a subset of data in the views. Currently, once Jigsaw reads in
Fig 5. A mapping between two sets of documents created manually vs. by Jigsaw.
2875KANG AND STASKO: EXAMINING THE USE OF A VISUAL ANALYTICS SYSTEM FOR SENSEMAKING TASKS: CASE STUDIES…
documents, all the operations and computations are run upon the entire set of documents. That is, once users have ingested a collection of documents into Jigsaw, all the document and entities are “active.” If they want to temporarily exclude some documents and explore connections only for another set of documents, the only way to do it is to start over in the data importing process. They have to decide which documents in the collection to examine, create another collection of those selected documents, and import the documents into the system. In other words, there is no easy way to select a subset of documents while working with views. Users wished that they had a better, flexible way to have a certain set of documents, as expressed in the quote below. P6 compared IN-SPIRE [15], a visual analytics system for text analysis which provides an overview of the key themes and trends across a document collection, to Jigsaw when discussing this feature. In IN-SPIRE, he was able to make a selection of documents even after all the dataset was displayed:
I started IN-SPIRE about at the same time I used Jigsaw. The
thing I liked best in IN-SPIRE, which Jigsaw doesn’t have, was that you have all the dataset up there on the screen (the galaxy view), and I could easily select across all data, make the selection and make the rest of them outliers, and have just the ones I have selected. In Jigsaw, I have to have all sets of data.
We assume that if selecting and working with a subset of data
was easy enough, some of the professionals might not have had to segment their data into several Jigsaw project files, since they would not have had the information overload issue.
Finally, there was an issue of trust in the system. While people favored the automatic power of the visual analytics system, they did not seem to solely rely on the system as in this quote, which is a common behavioral pattern of analysts [22].
P2: I’m the only one who’s using it in our team. They don’t think
it’s reliable enough. It seems that this mistrust is raised when the analysis process
does not flow smoothly. When the system fails to import documents or identify entities that the analysts want to see, they tend to attribute it to the lack of system reliability. This tendency is more likely to appear to people with less technical capability, those who are not willing to put extra efforts into troubleshooting. Or simply, some experts think that the system assists part of their work more efficiently, but ultimately, they believe that they can do the job more accurately. For example, after working with Jigsaw, P1 double-checked its findings with those from a manual process in order to validate her analysis:
P1: Finally, we carefully reviewed descriptions of OIs for which
one or many counterparts were identified with experts, in order to ensure that the themes and ideas behind these concepts were indeed analogous. It was found that the mappings obtained through Jigsaw were similar to the ones obtained manually, and thus we could say that Jigsaw offers a valuable alternative to our manual approach.
6 DESIGN IMPLICATIONS
Based on findings discussed in the previous section, we derive a series of design implications for next generation systems.
6.1 Supplement Automatic Entity Identification
While there exist a number of entity identification systems [4,10,12] and visual analytics systems that incorporate entity identification [2,3,6,32], the process typically is not perfect. Some entities may not be identified at all, some may have an incorrect entity type assigned, and some identified ones may not be entities. Systems should provide ways to correct such errors, and the process needs to be intuitive and efficient. While Jigsaw allows users to modify, remove,
add, and alias entities, professionals pointed out that it is still not a simple, easy process, as mentioned in the previous section. For capabilities such as entity aliasing, the process is not automatically going forward. That is, when new documents are imported, the analyst must manually create the aliases again.
Another issue is that although Jigsaw allows users to create a new entity type and specify the instances of that entity, our analysts seemed to be unaware of the feature. For example, once they create a new entity type “Company name,” they could create a text file that has each different possible entity value such as “HP,” “Apple,” “IBM,” etc. While every user in the study created their own entity types, most of them did not know about this feature but specified each entity every time they opened a new project, which took significant time. Four users suggested a feature that Jigsaw already provides:
P5: I suggest an entity library you can draw on for every project.
Then you wouldn’t have to keep creating new entities…It will be nice to have an entity list that you can apply to each project you do and not have to recreate them. For example, a list of universities that would be identified every time, a list of technologies that would be identified every time, so you only have to make the list once.
We suspect that the way to create a new entity type was not
intuitive or salient enough to users. The feature could have been more nicely incorporated with the entity identification work flow, for example, by asking them to type a list of entities instead of importing a text file, so that users do not need to create an extra file outside the system.
6.2 Allow Flexible Data (document) Management
Previously, we discussed that some analysts worked with multiple sets of a small number of documents while others wanted to accumulate documents into one project and build a database. In most cases, analysts needed to experiment with the “right” number of documents to import in order to optimize their analysis. One of the reasons for this issue of data size is information overload (e.g., not wanting to be inundated by information shown), which can be addressed by providing flexible data management. Currently, once a user imports a document collection into Jigsaw, all the documents and entities are active, which can be overwhelming. If a user wants to investigate only part of the document collection, there is no easy way to do so except to create another subset of the collection and import it. This is inefficient especially when users want to examine different subsets of documents in a single document collection. Ultimately, users desire to be able to flexibly work with documents within a single database, and a system should provide the ability to easily select a subset of documents to investigate once users import a document collection. For example, a system could provide a way to choose a subset of documents and run analysis only for the selected documents. Or a system could allow users to temporarily exclude a set of documents so that they can work with the remaining documents only. We assume that if selecting and working with a subset of data was easy enough, some of the professionals would not have had to segment their data into several Jigsaw project files since they would not have had the information overload issue.
Systems also need to provide a way to easily accumulate documents into an existing project. In many cases, users may want to build a database over time, especially when they receive documents incoming regularly. Currently in Jigsaw, if users want to add only one or two documents to the existing Jigsaw file, they can but they must repeat the process of computational analysis on the entire document collection. This is inefficient because the analyses not only must be re-run, but also users have to perform the entity clean-up process again. Often, users do not have a complete set of documents prior to investigation or they receive new documents continuously. They would want to simply “merge” new documents into the existing file, upon which entities are already cleaned up and computational analysis is done.
2876 IEEE TRANSACTIONS ON VISUALIZATION AND COMPUTER GRAPHICS, VOL. 18, NO. 12, DECEMBER 2012
6.3 Empower with Numbers
Jigsaw was developed for unstructured text data and does not provide wide-ranging statistical analysis per se. For example, in order to show connection strength, the system uses colors (darkness) or list order. However, most of the analysts in the study strongly expressed that statistical functionality would be really desirable. Depending on the domain and task, analysts often need to convert results from investigative analysis into evidence, which is better supported with quantified information such as descriptive statistics or counts. In the study, several users wished to have statistical importance metrics such as degree centrality, betweenness, closeness, or others so that they could have more accurate metrics of the connections between entities and documents. Even for investigative analysis systems that deal with unstructured data such as text, it seems important to have simple statistics and measures.
6.4 Consider Allowing Visualization Modification
The professionals in this study wanted to have more control and flexibility over the visualizations. They sometimes wanted to be able to annotate, mark, and change the representations. Such changes may not be feasible or desirable from the point of view of the system, however. For example, the visualizations presented by a system may communicate analysis metrics or results computed about the data. Allowing the user to modify the visualization would be, in this case, inappropriate because it could make the visualization present the analysis data inaccurately. Conversely, allowing the analyst to simply highlight or augment the visualizations would not violate the fundamental data-to-representation mapping. Presently, Jigsaw allows no view augmentation. Should it? It is important that system designers and developers carefully consider the style of changes, if any, that viewers can make to a system’s visualizations.
6.5 Invest in Tutorial
Usually, visual analytics systems for investigative analysis tend to have a large number of features and interaction techniques, which makes it difficult to become familiar with a tool without any external aids such as one-on-one training or written instructions. In many cases, tutorials seem to be quite important and helpful for learning visual analytics systems. While some people may argue that users do not pay much attention to tutorials, all of the analysts we interviewed said that they put considerable time and effort in reading the tutorial document and watching video tutorials.
Another reason for the importance of a tutorial is intermittent use of a system. Many professionals pointed that they do not use the system on a regular basis. Instead, they used the system when they have enough time, when they receive new data, or when they need to prepare a brief. Consequently, they often forgot about some functions and operations and had to revisit tutorials. Thus, it is desirable to provide an intensive but still easy-to-understand tutorial. For example, breaking down the tutorial into subtopics with use-cases and examples would be really helpful, as the users commented:
P5: For learning, I mainly used the video tutorial. It was very
useful actually. They are good because they’re broken down into topics and you can pick what you need help with. I like it a lot.
P4: I wished [to have] a better tutorial though. I want to see
more examples about each view so that I can find the best way to analyze my own data.
6.6 Jigsaw-specific recommendations
The study helped identify issues and future work for Jigsaw:
Focus on useful views: While different users have different preferences of views, it was clear that the List View was most useful. We suggest that future development focus on improving the features and interface in the List View, as it will definitely benefit real world users. The Document View, the Document
Cluster View, and the Graph View were also used by several analysts. Multiple analysts mentioned that they did not find the Timeline useful, and the Scatterplot View was not even used at all. Those views may need significant changes or be removed.
Give them power to control: When working with their own data, users want to actively interact with the system because they have their own goals and expectations from the system. While Jigsaw is very good at “showing” documents and entities in different ways, professionals wanted to be able to annotate and manually alter visual representations.
7 CONCLUSION
In order to evaluate long-term, field use of Jigsaw, we conducted in-depth case studies with analysts from a variety of domains. We interviewed six investigators from the intelligence, academic, and law enforcement communities who had been using the system for a period of 2-14 months. We asked them about their use of Jigsaw, the types of data they were working on, and difficulties they encountered. Analysts used Jigsaw for finding relationships, comparing documents, getting an overview, and sharing analytical products with others. Their primary difficulties included importing data into Jigsaw, identifying entities in the preparation stage, and selecting a subset of data during data exploration.
The contributions of this work thus include: Identification of real-world cases of how an interactive
visual system for investigative analysis assisted document sensemaking in various domains and tasks;
Discussion of issues and findings that emerged upon the use of the visual analytic system;
Development of design recommendations for the system and future visual analytics tools.
A growing number of visual analytics systems are being
developed and used in practice. Assessing the utility and value of a system is essential for improving it, and we recommend the case study as a useful evaluation method. It helps to understand the types of tasks and problems a system can address and to identify strengths and weaknesses of a system in real world settings.
ACKNOWLEDGMENTS
We thank our six professionals for sharing their experience with Jigsaw. This work was supported by the National Science Foundation under awards IIS-0915788, CCF-0808863, and the VACCINE Center, a Department of Homeland Security’s Center of Excellence in Command, Control and Interoperability.
REFERENCES
[1] C. Andrews and C. North. Analyst’s Workspace: An Embodied Sensemaking Environment for Large, High Resolution Displays. To appear in IEEE VAST '12. http://scholar.lib.vt.edu/theses/available/etd-08232011-160350/
[2] E. Bier, E. Ishak, and E. Chi. Entity Workspace: an evidence file that aids memory, inference, and reading. Proceedings of the IEEE International Conference on Intelligence and Security Analysis, pp. 466–472, May 2006.
[3] E. Bier, S. Card, and J. Bodnar, Entity-based collaboration tools for intelligence analysis. Proceedings of IEEE VAST, pp. 99–106, Oct. 2008.
[4] Balie. http://balie.sourceforge.net/ (accessed 01 March 2012). [5] E. Braunstein, C. Görg, Z. Liu, and J. Stasko. Jigsaw to Save Vastopolis
- VAST 2011 Mini Challenge 3 Award: “Good Use of the Analytic Process”, Proceedings of IEEE VAST '11, Providence, RI, pp. 323-324, October 2011.
[6] A.R. Chappell, A.J. Cowell, D.A. Thurman, and J.R. Thomson. Supporting mutual understanding in a visual dialogue between analyst and computer. Proceedings of Human Factors and Ergonomic Society
2877KANG AND STASKO: EXAMINING THE USE OF A VISUAL ANALYTICS SYSTEM FOR SENSEMAKING TASKS: CASE STUDIES…
48th Annual Meeting (New Orleans, LA), Human Factors and Ergonomics Society: Santa Monica, CA, pp. 376–380, September 2004.
[7] K. Charmaz. Qualitative interviewing and grounded theory analysis. In Handbook of Interview Research: Context and Method, (J. F. Gubrium and J. A. Holstein, eds.), CA: Sage Publications, 2002.
[8] C. Chen and M. Czerwinski (Eds.) Introduction to the Special Issue on Empirical evaluation of information visualizations. International Journal of Human-Computer Studies, vol. 53, no. 5, pp. 631-635, 2000.
[9] G. Chin, O.A. Kuchar, and K.E. Wolf. Exploring the analytical processes of intelligence analysts. Proceedings of ACM CHI, pp. 11–20, April 2009.
[10] Cicero. Language Computer Corp. http://www.language computer.com/ (accessed 01 March 2012).
[11] Compendium. http://www.compendiuminstitute.org (accessed 11 July 2012).
[12] GATE – General Architecture for Text Engineering. http://gate.ac.uk/ (accessed 01 March 2012).
[13] C. Görg, Z. Liu, N. Parekh, K. Singhal, and J. Stasko. Jigsaw meets Blue Iguanodon - The VAST 2007 Contest, (Contest Paper), Proceedings of IEEE VAST '07, Sacramento, CA, pp. 235-236, October 2007.
[14] D. Gotz, M. X. Zhou, and Z. Wen. A study of information gathering and result processing in intelligence analysis. In IUI 2006 Workshop on IUI for Intelligence Analysis, 2006.
[15] E. Hetzler and A. Turner. Analysis experiences using information visualization. IEEE Computer Graphics and Applications, pp. 22-26, 2004.
[16] J. Hughes, V. King, T. Rodden, and H. Andersen. The role of ethnography in interactive systems design, ACM interactions, vol. 2, no. 2, pp. 56-65, April 1995.
[17] J. Hughes, J. O’Brien, T. Rodden, and M. Rouncefield. Design with ethnography: A presentation framework for design, Proc. of Design of Interaction Systems ’97, ACM Press, New York, pp. 147–159, 1997.
[18] i2 – Analyst's Notebook. http://www.i2group.com/us (accessed 11 July 2012).
[19] Jigsaw tutorial. http://www.cc.gatech.edu/gvu/ii/jigsaw/tutorial (accessed 11 March 2012).
[20] Y. Kang, C. Görg, and J. Stasko. The evaluation of visual analytics systems for investigative analysis: Deriving design principles from a case study. Proceedings of IEEE VAST, pp. 139–146, October 2009.
[21] Y. Kang, C. Görg, and J. Stasko. How Can Visual Analytics Assist Investigative Analysis? Design Implications from an Evaluation. IEEE Transactions on Visualization and Computer Graphics, vol. 17, no. 5, pp. 570-583, May 2011.
[22] Y. Kang and J. Stasko. Characterizing the Intelligence Analysis Process: Informing Visual Analytics Design through a Longitudinal Field Study. Proceedings of IEEE VAST '11, Providence, RI, pp. 21-30, October 2011.
[23] Y. Kang. Informing Design of Visual Analytics Systems for Intelligence Analysis: Understanding User, User Tasks, and Tool Usage, PhD Dissertation, School of Interactive Computing, Georgia Institute of Technology, 2012.
[24] A. Komlodi, A. Sears, and E. Stanziola. Information Visualization Evaluation Review. ISRC Tech. Report, Dept. of Information Systems, UMBC.UMBC-ISRC-2004-1.
[25] H. Lam, E. Bertini, P. Isenberg, C. Plaisant, and S. Carpendale. Empirical Studies in Information Visualization: Seven Scenarios. IEEE Transactions on Visualization and Computer Graphics, 2012. Appeared online: 30 November 2011.
[26] A. Perer and B. Shneiderman, Integrating statistics and visualization: case studies of gaining clarity during exploratory data analysis. Proceedings of ACM CHI, pp. 265–274, April 2008.
[27] O. J. Pinon, D. N. Mavris, and E. Garcia. A Visual Analytics Approach to the Qualitative Comparison of the SESAR and NextGen Efforts. 9th AIAA Aviation Technology Integration and Operations ATIO Conference, 2009.
[28] C. Plaisant. The challenge of information visualization evaluation. Proceedings of AVI, pp. 109–116, May 2004.
[29] C. Plaisant, G. Grinstein, J. Scholtz, M. Whiting, T. O'Connell, S. Laskowski, L. Chien, A. Tat, W. Wright, C. Görg, Z. Liu, N. Parekh, K. Singhal, and J. Stasko. Evaluating Visual Analytics at the 2007 VAST Symposium Contest, IEEE Computer Graphics and Applications, Vol. 28, no. 2, pp. 12-21, March 2008.
[30] Research and Development Descriptive Summaries (RDDS). http://www.dtic.mil/dtic/stresources/budgetNplanning/rdds_desc.html (accessed February 8, 2012).
[31] A. Rose, C. Plaisant, and B. Shneiderman. Using ethnographic methods in user interface re-engineering, Proceedings of DIS ‘95: Symposium on Designing Interactive Systems, ACM Press, New York, pp. 115–122, 1995.
[32] A. Sanfilippo, B. Baddeley, A.J. Cowell, M.L. Gregory, R. Hohimer, and S. Tratz. Building a human information discourse interface to uncover scenario content. Proceedings of the 2005 International Conference on Intelligence Analysis (McLean, VA), May 2005.
[33] P. Saraiya, C. North, and K. Duca. An evaluation of microarray visualization tools for biological insight. Proceedings of the Symposium on Information Visualization ‘04 (Los Alamitos, USA), pp. 1–8, 2004.
[34] P. Saraiya , C. North , V. Lam, and K.A. Duca. An Insight-Based Longitudinal Study of Visual Analytics, IEEE Transactions on Visualization and Computer Graphics, vol. 12, no. 6, pp. 1511-1522, November 2006.
[35] J. Scholtz. Beyond usability: Evaluation aspects of visual analytic environments. IEEE VAST, pp. 145–150, October 2006.
[36] J. Scholtz. Developing guidelines for assessing visual analytics environments. Information Visualization, vol. 10, no. 3, pp. 212–231, 2011.
[37] A. Selvin and S. B. Shum. Narrative, sensemaking, and improvisation in participatory hypermedia construction. CHI ‘08 Workshop on Sensemaking, Florence, Italy, 2008.
[38] J. Seo and B. Shneiderman. Knowledge discovery in high dimensional data: Case studies and a user survey for the rank-by feature framework. IEEE Transactions on Visualization and Computer Graphics, 12(3), pp. 311–322, 2006.
[39] B. Shneiderman and C. Plaisant. Strategies for evaluating information visualization tools: multi-dimensional in-depth long-term case studies. Proceedings of ACM BELIV, pp. 1–7, May 2006.
[40] J. Stasko, C. Görg, and Z. Liu. Jigsaw: supporting investigative analysis through interactive visualization. Information Visualization, vol. 7, no. 2, pp. 118–132, 2008.
[41] A. Strauss and J. Corbin. Basics of qualitative research: Grounded theory procedures and techniques. Sage Publications: Newbury Park, Calif, 1990.
[42] W. Wright, D. Schroh, P. Proulx, A. Skaburskis, and B. Cort. The Sandbox for analysis: concepts and methods. Proceedings of ACM CHI '06 (Montreal, Quebec), pp. 801–810, April 2006.
2878 IEEE TRANSACTIONS ON VISUALIZATION AND COMPUTER GRAPHICS, VOL. 18, NO. 12, DECEMBER 2012