Embed Size (px)
Citation preview
Applied Energy 185 (2017) 280–293
Contents lists available at ScienceDirect
Applied Energy
journal homepage: www.elsevier .com/ locate/apenergy
Examination of the optimal operation of building scale combined heatand power systems under disparate climate and GHG emissions rates
http://dx.doi.org/10.1016/j.apenergy.2016.09.1080306-2619/� 2016 Elsevier Ltd. All rights reserved.
⇑ Corresponding author.E-mail address: [email protected] (B. Howard).
B. Howard ⇑, V. ModiDepartment of Mechanical Engineering, Columbia University, 500 W 120th St, New York, NY 10027, United States
h i g h l i g h t s
� CHP attributable reductions, not viable by electric generation alone, are defined.� Simplified operating strategy heuristics are optimal under specific circumstances.� Phosphoric acid fuel cells yield the largest reductions except in the extremes.� Changes in baseline emissions affect the optimal system capacity and operating hours.
a r t i c l e i n f o
Article history:Received 18 April 2016Received in revised form 26 September2016Accepted 27 September 2016Available online 7 November 2016
Keywords:Building scale combined heat and powerGreenhouse gas emissionsControlled random searchMixed integer linear programming
a b s t r a c t
This work aims to elucidate notions concerning the ideal operation and greenhouse gas (GHG) emissionsbenefits of combined heat and power (CHP) systems by investigating how various metrics change as afunction of the GHG emissions from the underlying electricity source, building use type and climate.Additionally, a new term entitled ‘‘CHP Attributable” reductions is introduced to quantify the benefitsfrom the simultaneous use of thermal and electric energy, removing benefits achieved solely from fuelswitching and generating electricity more efficiently.The GHG emission benefits from implementing internal combustion engine, microturbines, and phos-
phoric acid (PA) fuel cell based CHP systems were evaluated through an optimization approach consid-ering energy demands of prototypical hospital, office, and residential buildings in varied climates. Toexplore the effect of electric GHG emissions rates, the ideal operation of the CHP systems was evaluatedunder three scenarios: ‘‘High” GHG emissions rates, ‘‘Low” GHG emissions rates, and ‘‘Current” GHGemissions rate for a specific location.The analysis finds that PA fuel cells achieve the highest GHG emission reductions in most cases consid-
ered, though there are exceptions. Common heuristics, such as electric load following and thermal loadfollowing, are the optimal operating strategy under specific conditions. The optimal CHP capacity andoperating hours both vary as a function of building type, climate and GHG emissions rates from grid elec-tricity. GHG emissions reductions can be as high as 49% considering a PA fuel cell for a prototypical hos-pital in Boulder, Colorado however, the ‘‘CHP attributable reductions are less than 10%.
� 2016 Elsevier Ltd. All rights reserved.
1. Introduction
Combined heat and power (CHP) systems are a type of dis-tributed generation technology where electricity and thermalenergy are produced and consumed. CHP systems are based onelectricity generation systems, such as internal combustion engi-nes, gas turbines and fuel cells. In a CHP arrangement, these sys-tems are equipped with heat recovery systems to allow thewaste heat to supply a nearby thermal demand.
Distributed generation systems, including those with CHP sys-tems, have been deemed advantageous for a variety of reasons.Major benefits potentially include the deferment of large invest-ments in the electric transmission and distribution infrastructure,increase in grid reliability and power quality if ideally located,and more efficient use of resources with the use of CHP configura-tions [1–4]. As more efficient use of resources results in green-house gas (GHG) emissions reductions, CHP systems have beenpromoted by many policymakers in the United States and Europe[5–8].
However, the geographic scales of use for CHP systems havebecome increasingly smaller. Original uses were in industrial or
Nomenclature
gel CHP nominal electrical efficiencyg CHP efficiencyX CHP electrical capacityf t CHP system fuel consumption in time step tdl efficiency degradation at load ldf efficiency degradation at load fpht ;p
lt piecewise linear power output of the CHP system in
time step tqt CHP system thermal output in time step tbe break-even GHG emissions rate for grid electricityeb GHG emissions coefficient for thermal energy produced
from an on-site boiler (g CO2e/kW h)eng GHG emissions coefficient for natural gas (g CO2e/kW h)gel CHP electrical efficiencyeg GHG emissions coefficient of electricity from the grid (g
CO2e/kW h)
eb GHG emissions coefficient for thermal energy producedfrom an on-site boiler (g CO2e/kW h)
Et electricity demand of the building in time step tHt thermal demand of the building in time step tet electrical energy produced by the CHP system and used
by the building in hour tht thermal energy produced by the CHP system and used
by the building in hour twt binary variable defining piecewise linear CHP power
outputlt operating status of the CHP system in hour tD search range in kW for controlled random search algo-
rithm/ probability of accepting a solution with poor objective
function for controlled random search
B. Howard, V. Modi / Applied Energy 185 (2017) 280–293 281
district energy systems that utilized waste heat to serve large ther-mal demand centers. More recently CHP systems have been imple-mented at the building level to meet local electricity, space heatingand water heating demands [9,10]. However with diminished sizecomes additional challenges.
At the building scale, the electric and thermal demands aremore variable over the year, as one can not leverage the smoothingthat occurs with the aggregation of building demands. Moreover,performance parameters diminish with size, potentially impactingthe GHG emissions benefits for buildings with lower energydemands [11]. In consequence determining the proper primemover, capacity, and operational strategy, i.e. the output of theCHP system in each time step, becomes increasing important andcomplex.
This has led to a large body of research analyzing the how tobest operate CHP system under various sets of conditions[12–16,5,17–28]. ‘‘Best” has been defined in many ways includingminimal cost, energy consumption, GHG emissions and exergy effi-ciency. The disparate conditions include climatic conditions,energy cost structures, CHP system characterizations, and GHGemissions from the baseline system. In this work we focus onCHP systems operated to minimize GHG emissions, thus we reviewa select set of papers that have evaluated the impacts on this crite-ria. Table 1 describes the scenarios explored in several studies onCHP systems, specifically highlighting the building use cases, cli-mate zone, CHP system type (prime mover), GHG emissions frombaseline scenarios, operating strategy, sizing strategy and resultingconclusions.
A range of building use cases, or building types, have been con-sidered from industrial, commercial, and residential. Howeverstudies considering the largest diversity of building types typicallyconsidered the effects in a single climate under fixed GHG emis-sions rates from grid electricity and thermal demands [17,25]. Con-versely Mago et al. [15] evaluated the performance of CHP systemsin various climates but only considered a single use case. Addition-ally both research teams used a simplified operating and sizingstrategies that do not result in the largest GHG emissions reduc-tions. Operating strategies vary from heuristics such as continuousoutput, electrical load following, thermal load following, and max-imum output. For the heuristics, the operating strategy is deter-mined without consideration of the demand. Optimal strategiesattempt to determine the best way to operate a system taking intoaccount the building demands and constraints on the CHP systemsthemselves. Each of these strategies from heuristics to optimal lin-ear, mixed-integer linear and nonlinear programs has been used to
estimate GHG emissions savings from CHP systems. Moreover,researchers have compared the optimal approaches to the heuris-tics, resulting in mixed findings. Ghadimi et al. [24] found thatthe optimal approach was well approximated by the electric loadfollowing heuristic. Yet Hueffed and Mago [17] have found thatneither the electric load following or a thermal load followingapproach could match the reductions in the optimal case. Lastlyvery few researchers in the studies reviewed search for the optimalsize of the CHP system. More commonly the system capacity isdetermined a priori.
In the studies reviewed, the GHG emissions reductions fromimplementing CHP systems ranged from 0–52%. With the manyand varied evaluations, it is difficult to discern how different fac-tors such as building type, climate, prime mover, and grid GHGemissions rates affect the GHG emissions benefits of CHP systems.
Another aspect not addressed in other studies is quantifying theadded benefit of the combined heat and power operation. Forexample Hueffed and Mago [29] consider arguably high values ofGHG emissions from grid electricity and find reductions up to52%. Given this high GHG emissions rate from grid electricity, itis unclear how much benefit comes from operating in combinedheat and power mode versus switching to a low carbon fuel andgenerating electricity at a higher efficiency.
The aim of this analysis is to clarify and unify statements madein previous works about CHP systems by determining how theoptimal operating strategy, operating hours, system capacity, andideal CHP system type change as a function of the GHG emissionsfrom the underlying electricity source considering a broad range ofbuilding types and climates. We seek to provide analysis that canbe generalized to allow for an easier understanding of how CHPsystems should be sized and operated to reduce GHG emissions.In addition, this work defines a new term, CHP attributable reduc-tions, that quantifies the amount of savings that are specificallydue to the simultaneous use of thermal and electrical energy pro-duced by a CHP system.
The analysis is performed by finding, through an optimal sizingand dispatch program, the CHP system that maximizes GHG emis-sions reductions for prototypical hospitals, office and residentialbuildings, of different sizes, in 16 climates, under ‘‘high” and ‘‘low”GHG emissions scenarios. The results of the optimization areexplored to draw general conclusions about the reduction poten-tial, ideal prime mover, CHP system capacities and operationalstrategies under the various scenarios. ‘‘CHP attributable” GHGemissions reductions are defined by considering the differencebetween two optimizations: one where the objective function
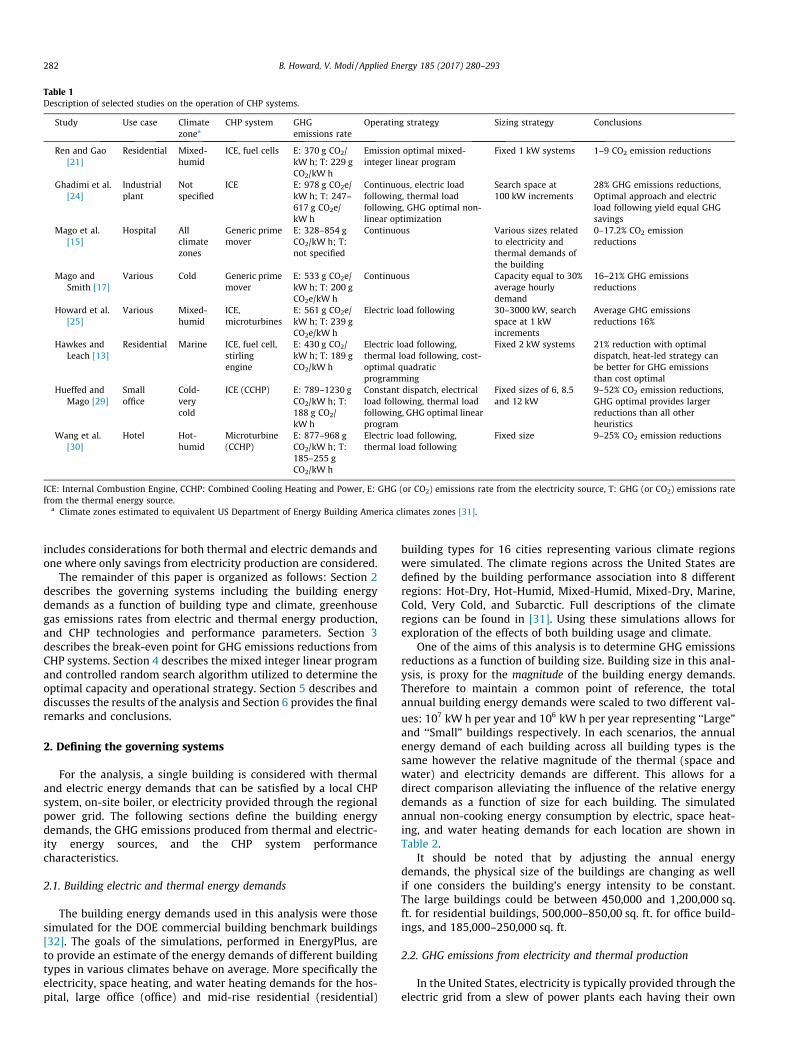
Table 1Description of selected studies on the operation of CHP systems.
Study Use case Climatezonea
CHP system GHGemissions rate
Operating strategy Sizing strategy Conclusions
Ren and Gao[21]
Residential Mixed-humid
ICE, fuel cells E: 370 g CO2/kW h; T: 229 gCO2/kW h
Emission optimal mixed-integer linear program
Fixed 1 kW systems 1–9 CO2 emission reductions
Ghadimi et al.[24]
Industrialplant
Notspecified
ICE E: 978 g CO2e/kW h; T: 247–617 g CO2e/kW h
Continuous, electric loadfollowing, thermal loadfollowing, GHG optimal non-linear optimization
Search space at100 kW increments
28% GHG emissions reductions,Optimal approach and electricload following yield equal GHGsavings
Mago et al.[15]
Hospital Allclimatezones
Generic primemover
E: 328–854 gCO2/kW h; T:not specified
Continuous Various sizes relatedto electricity andthermal demands ofthe building
0–17.2% CO2 emissionreductions
Mago andSmith [17]
Various Cold Generic primemover
E: 533 g CO2e/kW h; T: 200 gCO2e/kW h
Continuous Capacity equal to 30%average hourlydemand
16–21% GHG emissionsreductions
Howard et al.[25]
Various Mixed-humid
ICE,microturbines
E: 561 g CO2e/kW h; T: 239 gCO2e/kW h
Electric load following 30–3000 kW, searchspace at 1 kWincrements
Average GHG emissionsreductions 16%
Hawkes andLeach [13]
Residential Marine ICE, fuel cell,stirlingengine
E: 430 g CO2/kW h; T: 189 gCO2/kW h
Electric load following,thermal load following, cost-optimal quadraticprogramming
Fixed 2 kW systems 21% reduction with optimaldispatch, heat-led strategy canbe better for GHG emissionsthan cost optimal
Hueffed andMago [29]
Smalloffice
Cold-verycold
ICE (CCHP) E: 789–1230 gCO2/kW h; T:188 g CO2/kW h
Constant dispatch, electricalload following, thermal loadfollowing, GHG optimal linearprogram
Fixed sizes of 6, 8.5and 12 kW
9–52% CO2 emission reductions,GHG optimal provides largerreductions than all otherheuristics
Wang et al.[30]
Hotel Hot-humid
Microturbine(CCHP)
E: 877–968 gCO2/kW h; T:185–255 gCO2/kW h
Electric load following,thermal load following
Fixed size 9–25% CO2 emission reductions
ICE: Internal Combustion Engine, CCHP: Combined Cooling Heating and Power, E: GHG (or CO2) emissions rate from the electricity source, T: GHG (or CO2) emissions ratefrom the thermal energy source.
a Climate zones estimated to equivalent US Department of Energy Building America climates zones [31].
282 B. Howard, V. Modi / Applied Energy 185 (2017) 280–293
includes considerations for both thermal and electric demands andone where only savings from electricity production are considered.
The remainder of this paper is organized as follows: Section 2describes the governing systems including the building energydemands as a function of building type and climate, greenhousegas emissions rates from electric and thermal energy production,and CHP technologies and performance parameters. Section 3describes the break-even point for GHG emissions reductions fromCHP systems. Section 4 describes the mixed integer linear programand controlled random search algorithm utilized to determine theoptimal capacity and operational strategy. Section 5 describes anddiscusses the results of the analysis and Section 6 provides the finalremarks and conclusions.
2. Defining the governing systems
For the analysis, a single building is considered with thermaland electric energy demands that can be satisfied by a local CHPsystem, on-site boiler, or electricity provided through the regionalpower grid. The following sections define the building energydemands, the GHG emissions produced from thermal and electric-ity energy sources, and the CHP system performancecharacteristics.
2.1. Building electric and thermal energy demands
The building energy demands used in this analysis were thosesimulated for the DOE commercial building benchmark buildings[32]. The goals of the simulations, performed in EnergyPlus, areto provide an estimate of the energy demands of different buildingtypes in various climates behave on average. More specifically theelectricity, space heating, and water heating demands for the hos-pital, large office (office) and mid-rise residential (residential)
building types for 16 cities representing various climate regionswere simulated. The climate regions across the United States aredefined by the building performance association into 8 differentregions: Hot-Dry, Hot-Humid, Mixed-Humid, Mixed-Dry, Marine,Cold, Very Cold, and Subarctic. Full descriptions of the climateregions can be found in [31]. Using these simulations allows forexploration of the effects of both building usage and climate.
One of the aims of this analysis is to determine GHG emissionsreductions as a function of building size. Building size in this anal-ysis, is proxy for the magnitude of the building energy demands.Therefore to maintain a common point of reference, the totalannual building energy demands were scaled to two different val-ues: 107 kW h per year and 106 kW h per year representing ‘‘Large”and ‘‘Small” buildings respectively. In each scenarios, the annualenergy demand of each building across all building types is thesame however the relative magnitude of the thermal (space andwater) and electricity demands are different. This allows for adirect comparison alleviating the influence of the relative energydemands as a function of size for each building. The simulatedannual non-cooking energy consumption by electric, space heat-ing, and water heating demands for each location are shown inTable 2.
It should be noted that by adjusting the annual energydemands, the physical size of the buildings are changing as wellif one considers the building’s energy intensity to be constant.The large buildings could be between 450,000 and 1,200,000 sq.ft. for residential buildings, 500,000–850,00 sq. ft. for office build-ings, and 185,000–250,000 sq. ft.
2.2. GHG emissions from electricity and thermal production
In the United States, electricity is typically provided through theelectric grid from a slew of power plants each having their own
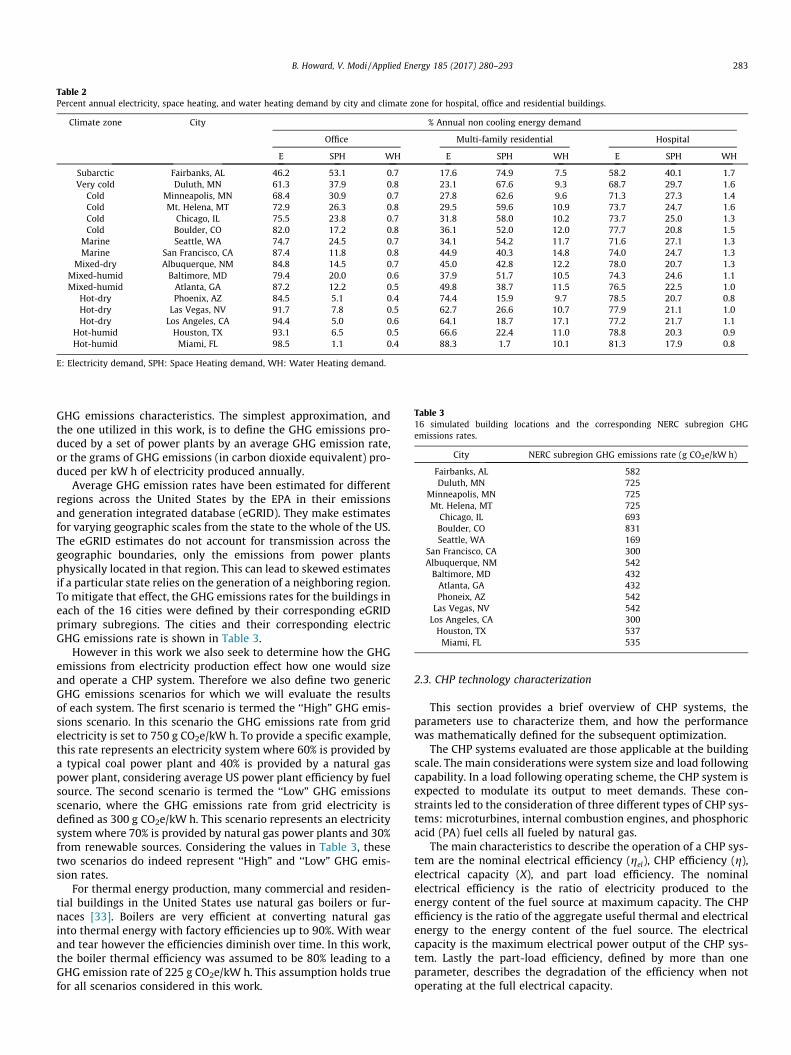
Table 2Percent annual electricity, space heating, and water heating demand by city and climate zone for hospital, office and residential buildings.
Climate zone City % Annual non cooling energy demand
Office Multi-family residential Hospital
E SPH WH E SPH WH E SPH WH
Subarctic Fairbanks, AL 46.2 53.1 0.7 17.6 74.9 7.5 58.2 40.1 1.7Very cold Duluth, MN 61.3 37.9 0.8 23.1 67.6 9.3 68.7 29.7 1.6
Cold Minneapolis, MN 68.4 30.9 0.7 27.8 62.6 9.6 71.3 27.3 1.4Cold Mt. Helena, MT 72.9 26.3 0.8 29.5 59.6 10.9 73.7 24.7 1.6Cold Chicago, IL 75.5 23.8 0.7 31.8 58.0 10.2 73.7 25.0 1.3Cold Boulder, CO 82.0 17.2 0.8 36.1 52.0 12.0 77.7 20.8 1.5
Marine Seattle, WA 74.7 24.5 0.7 34.1 54.2 11.7 71.6 27.1 1.3Marine San Francisco, CA 87.4 11.8 0.8 44.9 40.3 14.8 74.0 24.7 1.3
Mixed-dry Albuquerque, NM 84.8 14.5 0.7 45.0 42.8 12.2 78.0 20.7 1.3Mixed-humid Baltimore, MD 79.4 20.0 0.6 37.9 51.7 10.5 74.3 24.6 1.1Mixed-humid Atlanta, GA 87.2 12.2 0.5 49.8 38.7 11.5 76.5 22.5 1.0
Hot-dry Phoenix, AZ 84.5 5.1 0.4 74.4 15.9 9.7 78.5 20.7 0.8Hot-dry Las Vegas, NV 91.7 7.8 0.5 62.7 26.6 10.7 77.9 21.1 1.0Hot-dry Los Angeles, CA 94.4 5.0 0.6 64.1 18.7 17.1 77.2 21.7 1.1
Hot-humid Houston, TX 93.1 6.5 0.5 66.6 22.4 11.0 78.8 20.3 0.9Hot-humid Miami, FL 98.5 1.1 0.4 88.3 1.7 10.1 81.3 17.9 0.8
E: Electricity demand, SPH: Space Heating demand, WH: Water Heating demand.
Table 316 simulated building locations and the corresponding NERC subregion GHGemissions rates.
City NERC subregion GHG emissions rate (g CO2e/kW h)
Fairbanks, AL 582Duluth, MN 725
Minneapolis, MN 725Mt. Helena, MT 725
Chicago, IL 693Boulder, CO 831Seattle, WA 169
San Francisco, CA 300Albuquerque, NM 542Baltimore, MD 432Atlanta, GA 432Phoneix, AZ 542Las Vegas, NV 542Los Angeles, CA 300Houston, TX 537Miami, FL 535
B. Howard, V. Modi / Applied Energy 185 (2017) 280–293 283
GHG emissions characteristics. The simplest approximation, andthe one utilized in this work, is to define the GHG emissions pro-duced by a set of power plants by an average GHG emission rate,or the grams of GHG emissions (in carbon dioxide equivalent) pro-duced per kW h of electricity produced annually.
Average GHG emission rates have been estimated for differentregions across the United States by the EPA in their emissionsand generation integrated database (eGRID). They make estimatesfor varying geographic scales from the state to the whole of the US.The eGRID estimates do not account for transmission across thegeographic boundaries, only the emissions from power plantsphysically located in that region. This can lead to skewed estimatesif a particular state relies on the generation of a neighboring region.To mitigate that effect, the GHG emissions rates for the buildings ineach of the 16 cities were defined by their corresponding eGRIDprimary subregions. The cities and their corresponding electricGHG emissions rate is shown in Table 3.
However in this work we also seek to determine how the GHGemissions from electricity production effect how one would sizeand operate a CHP system. Therefore we also define two genericGHG emissions scenarios for which we will evaluate the resultsof each system. The first scenario is termed the ‘‘High” GHG emis-sions scenario. In this scenario the GHG emissions rate from gridelectricity is set to 750 g CO2e/kW h. To provide a specific example,this rate represents an electricity system where 60% is provided bya typical coal power plant and 40% is provided by a natural gaspower plant, considering average US power plant efficiency by fuelsource. The second scenario is termed the ‘‘Low” GHG emissionsscenario, where the GHG emissions rate from grid electricity isdefined as 300 g CO2e/kW h. This scenario represents an electricitysystem where 70% is provided by natural gas power plants and 30%from renewable sources. Considering the values in Table 3, thesetwo scenarios do indeed represent ‘‘High” and ‘‘Low” GHG emis-sion rates.
For thermal energy production, many commercial and residen-tial buildings in the United States use natural gas boilers or fur-naces [33]. Boilers are very efficient at converting natural gasinto thermal energy with factory efficiencies up to 90%. With wearand tear however the efficiencies diminish over time. In this work,the boiler thermal efficiency was assumed to be 80% leading to aGHG emission rate of 225 g CO2e/kW h. This assumption holds truefor all scenarios considered in this work.
2.3. CHP technology characterization
This section provides a brief overview of CHP systems, theparameters use to characterize them, and how the performancewas mathematically defined for the subsequent optimization.
The CHP systems evaluated are those applicable at the buildingscale. The main considerations were system size and load followingcapability. In a load following operating scheme, the CHP system isexpected to modulate its output to meet demands. These con-straints led to the consideration of three different types of CHP sys-tems: microturbines, internal combustion engines, and phosphoricacid (PA) fuel cells all fueled by natural gas.
The main characteristics to describe the operation of a CHP sys-tem are the nominal electrical efficiency (gel), CHP efficiency (g),electrical capacity (X), and part load efficiency. The nominalelectrical efficiency is the ratio of electricity produced to theenergy content of the fuel source at maximum capacity. The CHPefficiency is the ratio of the aggregate useful thermal and electricalenergy to the energy content of the fuel source. The electricalcapacity is the maximum electrical power output of the CHP sys-tem. Lastly the part-load efficiency, defined by more than oneparameter, describes the degradation of the efficiency when notoperating at the full electrical capacity.
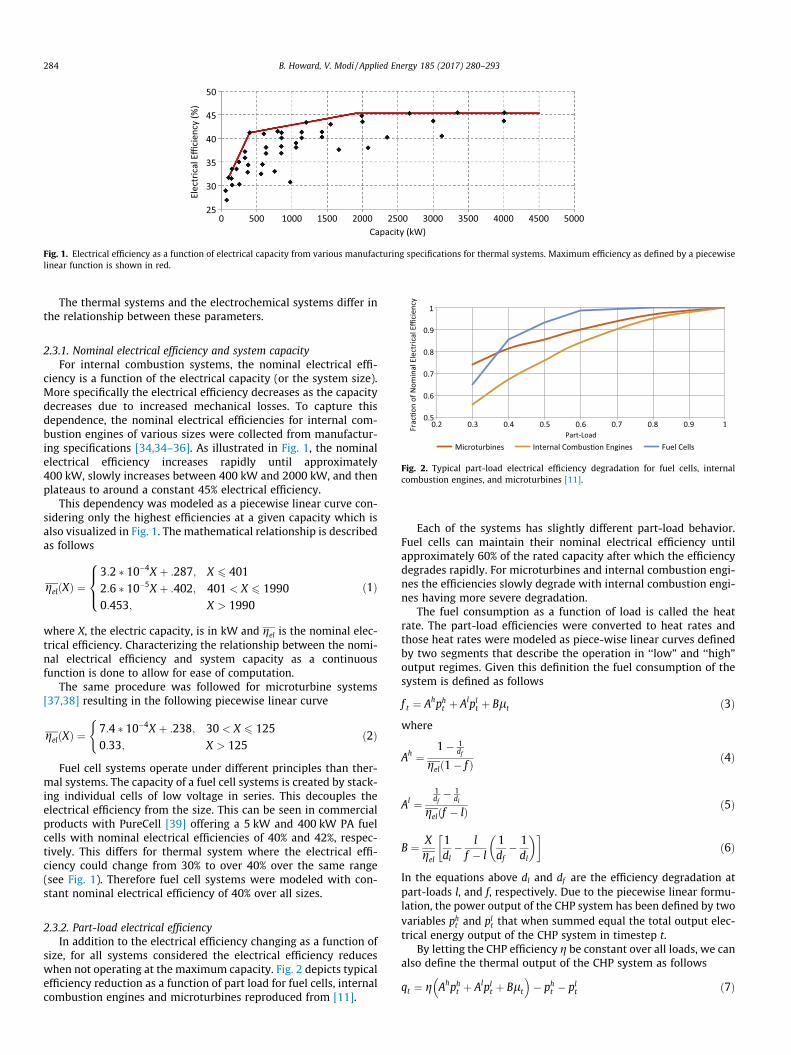
Fig. 1. Electrical efficiency as a function of electrical capacity from various manufacturing specifications for thermal systems. Maximum efficiency as defined by a piecewiselinear function is shown in red.
284 B. Howard, V. Modi / Applied Energy 185 (2017) 280–293
The thermal systems and the electrochemical systems differ inthe relationship between these parameters.
Fig. 2. Typical part-load electrical efficiency degradation for fuel cells, internalcombustion engines, and microturbines [11].
2.3.1. Nominal electrical efficiency and system capacityFor internal combustion systems, the nominal electrical effi-
ciency is a function of the electrical capacity (or the system size).More specifically the electrical efficiency decreases as the capacitydecreases due to increased mechanical losses. To capture thisdependence, the nominal electrical efficiencies for internal com-bustion engines of various sizes were collected from manufactur-ing specifications [34,34–36]. As illustrated in Fig. 1, the nominalelectrical efficiency increases rapidly until approximately400 kW, slowly increases between 400 kW and 2000 kW, and thenplateaus to around a constant 45% electrical efficiency.
This dependency was modeled as a piecewise linear curve con-sidering only the highest efficiencies at a given capacity which isalso visualized in Fig. 1. The mathematical relationship is describedas follows
gelðXÞ ¼3:2 � 10�4X þ :287; X 6 4012:6 � 10�5X þ :402; 401 < X 6 19900:453; X > 1990
8><>: ð1Þ
where X, the electric capacity, is in kW and gel is the nominal elec-trical efficiency. Characterizing the relationship between the nomi-nal electrical efficiency and system capacity as a continuousfunction is done to allow for ease of computation.
The same procedure was followed for microturbine systems[37,38] resulting in the following piecewise linear curve
gelðXÞ ¼7:4 � 10�4X þ :238; 30 < X 6 1250:33; X > 125
(ð2Þ
Fuel cell systems operate under different principles than ther-mal systems. The capacity of a fuel cell systems is created by stack-ing individual cells of low voltage in series. This decouples theelectrical efficiency from the size. This can be seen in commercialproducts with PureCell [39] offering a 5 kW and 400 kW PA fuelcells with nominal electrical efficiencies of 40% and 42%, respec-tively. This differs for thermal system where the electrical effi-ciency could change from 30% to over 40% over the same range(see Fig. 1). Therefore fuel cell systems were modeled with con-stant nominal electrical efficiency of 40% over all sizes.
2.3.2. Part-load electrical efficiencyIn addition to the electrical efficiency changing as a function of
size, for all systems considered the electrical efficiency reduceswhen not operating at the maximum capacity. Fig. 2 depicts typicalefficiency reduction as a function of part load for fuel cells, internalcombustion engines and microturbines reproduced from [11].
Each of the systems has slightly different part-load behavior.Fuel cells can maintain their nominal electrical efficiency untilapproximately 60% of the rated capacity after which the efficiencydegrades rapidly. For microturbines and internal combustion engi-nes the efficiencies slowly degrade with internal combustion engi-nes having more severe degradation.
The fuel consumption as a function of load is called the heatrate. The part-load efficiencies were converted to heat rates andthose heat rates were modeled as piece-wise linear curves definedby two segments that describe the operation in ‘‘low” and ‘‘high”output regimes. Given this definition the fuel consumption of thesystem is defined as follows
f t ¼ Ahpht þ Alpl
t þ Blt ð3Þwhere
Ah ¼1� 1
df
gelð1� f Þ ð4Þ
Al ¼1df� 1
dl
gelðf � lÞ ð5Þ
B ¼ Xgel
1dl
� lf � l
1df
� 1dl
� �� �ð6Þ
In the equations above dl and df are the efficiency degradation atpart-loads l, and f, respectively. Due to the piecewise linear formu-lation, the power output of the CHP system has been defined by twovariables ph
t and plt that when summed equal the total output elec-
trical energy output of the CHP system in timestep t.By letting the CHP efficiency g be constant over all loads, we can
also define the thermal output of the CHP system as follows
qt ¼ g Ahpht þ Alpl
t þ Blt
� �� ph
t � plt ð7Þ
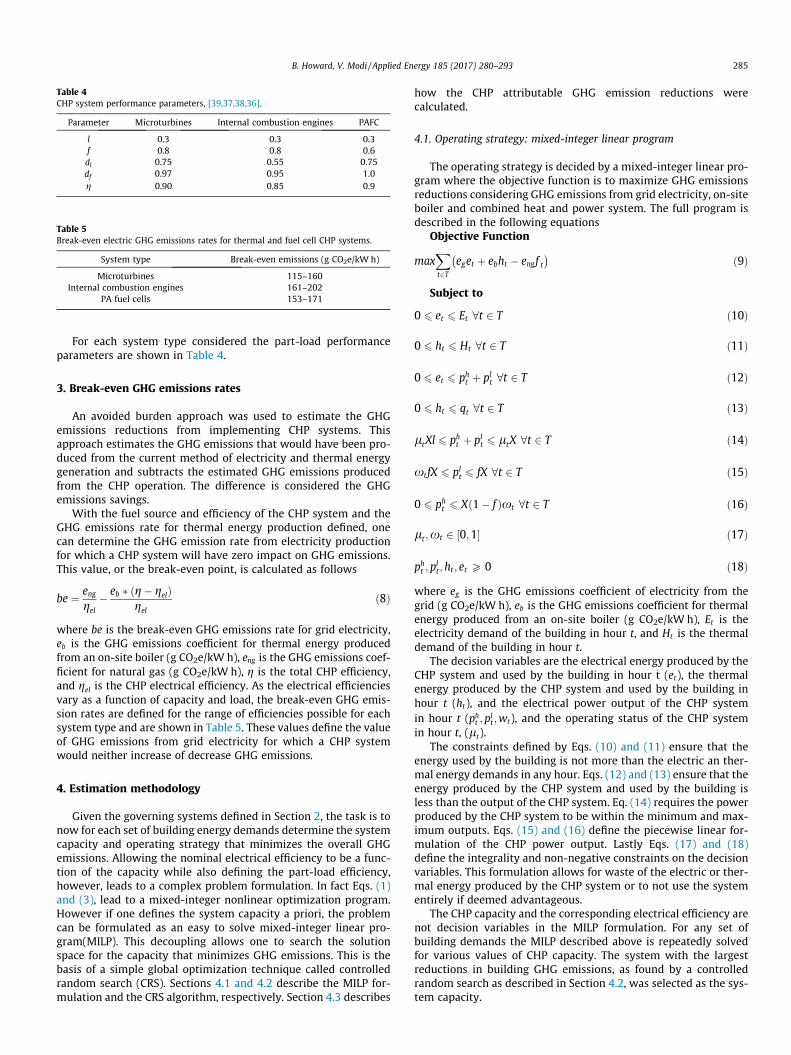
Table 4CHP system performance parameters, [39,37,38,36].
Parameter Microturbines Internal combustion engines PAFC
l 0.3 0.3 0.3f 0.8 0.8 0.6dl 0.75 0.55 0.75df 0.97 0.95 1.0g 0.90 0.85 0.9
Table 5Break-even electric GHG emissions rates for thermal and fuel cell CHP systems.
System type Break-even emissions (g CO2e/kW h)
Microturbines 115–160Internal combustion engines 161–202
PA fuel cells 153–171
B. Howard, V. Modi / Applied Energy 185 (2017) 280–293 285
For each system type considered the part-load performanceparameters are shown in Table 4.
3. Break-even GHG emissions rates
An avoided burden approach was used to estimate the GHGemissions reductions from implementing CHP systems. Thisapproach estimates the GHG emissions that would have been pro-duced from the current method of electricity and thermal energygeneration and subtracts the estimated GHG emissions producedfrom the CHP operation. The difference is considered the GHGemissions savings.
With the fuel source and efficiency of the CHP system and theGHG emissions rate for thermal energy production defined, onecan determine the GHG emission rate from electricity productionfor which a CHP system will have zero impact on GHG emissions.This value, or the break-even point, is calculated as follows
be ¼ enggel
� eb � ðg� gelÞgel
ð8Þ
where be is the break-even GHG emissions rate for grid electricity,eb is the GHG emissions coefficient for thermal energy producedfrom an on-site boiler (g CO2e/kW h), eng is the GHG emissions coef-ficient for natural gas (g CO2e/kW h), g is the total CHP efficiency,and gel is the CHP electrical efficiency. As the electrical efficienciesvary as a function of capacity and load, the break-even GHG emis-sion rates are defined for the range of efficiencies possible for eachsystem type and are shown in Table 5. These values define the valueof GHG emissions from grid electricity for which a CHP systemwould neither increase of decrease GHG emissions.
4. Estimation methodology
Given the governing systems defined in Section 2, the task is tonow for each set of building energy demands determine the systemcapacity and operating strategy that minimizes the overall GHGemissions. Allowing the nominal electrical efficiency to be a func-tion of the capacity while also defining the part-load efficiency,however, leads to a complex problem formulation. In fact Eqs. (1)and (3), lead to a mixed-integer nonlinear optimization program.However if one defines the system capacity a priori, the problemcan be formulated as an easy to solve mixed-integer linear pro-gram(MILP). This decoupling allows one to search the solutionspace for the capacity that minimizes GHG emissions. This is thebasis of a simple global optimization technique called controlledrandom search (CRS). Sections 4.1 and 4.2 describe the MILP for-mulation and the CRS algorithm, respectively. Section 4.3 describes
how the CHP attributable GHG emission reductions werecalculated.
4.1. Operating strategy: mixed-integer linear program
The operating strategy is decided by a mixed-integer linear pro-gram where the objective function is to maximize GHG emissionsreductions considering GHG emissions from grid electricity, on-siteboiler and combined heat and power system. The full program isdescribed in the following equations
Objective Function
maxXt2T
eget þ ebht � engf t� ð9Þ
Subject to
0 6 et 6 Et 8t 2 T ð10Þ
0 6 ht 6 Ht 8t 2 T ð11Þ
0 6 et 6 pht þ pl
t 8t 2 T ð12Þ
0 6 ht 6 qt 8t 2 T ð13Þ
ltXl 6 pht þ pl
t 6 ltX 8t 2 T ð14Þ
xt fX 6 plt 6 fX 8t 2 T ð15Þ
0 6 pht 6 Xð1� f Þxt 8t 2 T ð16Þ
lt ;xt 2 ½0;1� ð17Þ
pht ; p
lt; ht ; et P 0 ð18Þ
where eg is the GHG emissions coefficient of electricity from thegrid (g CO2e/kW h), eb is the GHG emissions coefficient for thermalenergy produced from an on-site boiler (g CO2e/kW h), Et is theelectricity demand of the building in hour t, and Ht is the thermaldemand of the building in hour t.
The decision variables are the electrical energy produced by theCHP system and used by the building in hour t (et), the thermalenergy produced by the CHP system and used by the building inhour t (ht), and the electrical power output of the CHP systemin hour t (ph
t ; plt ;wt), and the operating status of the CHP system
in hour t, (lt).The constraints defined by Eqs. (10) and (11) ensure that the
energy used by the building is not more than the electric an ther-mal energy demands in any hour. Eqs. (12) and (13) ensure that theenergy produced by the CHP system and used by the building isless than the output of the CHP system. Eq. (14) requires the powerproduced by the CHP system to be within the minimum and max-imum outputs. Eqs. (15) and (16) define the piecewise linear for-mulation of the CHP power output. Lastly Eqs. (17) and (18)define the integrality and non-negative constraints on the decisionvariables. This formulation allows for waste of the electric or ther-mal energy produced by the CHP system or to not use the systementirely if deemed advantageous.
The CHP capacity and the corresponding electrical efficiency arenot decision variables in the MILP formulation. For any set ofbuilding demands the MILP described above is repeatedly solvedfor various values of CHP capacity. The system with the largestreductions in building GHG emissions, as found by a controlledrandom search as described in Section 4.2, was selected as the sys-tem capacity.
286 B. Howard, V. Modi / Applied Energy 185 (2017) 280–293
4.2. Sizing strategy: controlled random search
In this section the MILP previously described is considered afunction,MILPðXÞ, that takes a system capacity as an input and out-puts the GHG emissions reductions. The CRS algorithm finds thecapacity that maximizes the GHG emissions reductions by system-atically searching the solution space. Initially a capacity is ran-domly selected from a uniform distribution over an interval of�D. The GHG emissions reductions the specified capacity are eval-uated and recorded. If the reductions are more than the previoussolution then a new capacity is selected from a uniform distribu-tion about the new capacity. If the reductions are less than the pre-vious solution, then the solution is discarded or accepted as a newsolution with a probability /. Accepting a sub-optimal solutionallows the algorithm to get out of local minima. This procedurewas repeated until the algorithm has not found a better solutionfor 20 iterations. The full controlled random search is defined byAlgorithm 1.
Algorithm 1. Controlled Random Search.
4.3. Defining CHP attributable GHG emissions reductions
One of the intentions of this work is to clarify the additionalbenefits of CHP systems by disaggregating the GHG emissionsreductions that can be achieved by electricity only systems. To thataim, once the CRS has found the capacity that minimizes GHGemissions, a second MILP program is run to calculate the GHGemissions reductions without using any of the waste heat. For thatMILP the objective function is changed to
maxXt2T
eget � engf t� ð19Þ
and Eqs. (11) and (13) are removed.
The ‘‘CHP Attributable” GHG emissions reductions are definedas the difference between the value of the objective function asdefined by Eqs. (9) and (19).
5. Results and discussion
The maximum GHG emissions reductions for the simulatedbuildings and CHP system types was estimated for different valuesof GHG emission rates from grid electricity. The following sectionsdescribe the effect on the hourly operation of the CHP system,building size for thermal systems, CHP system type, and climatefor differing values of GHG emissions rates from grid electricity.The CHP attributable reductions are calculated and discussed aswell. The section finishes by evaluating the GHG emissions reduc-tions for each simulated city considering the average GHG emis-sions reductions from local electricity production.
5.1. Optimal CHP systems under ‘‘High” and ‘‘Low” GHG emissionsscenarios
There are several changes in the optimal sizing, operation, andGHG emission reductions under the ‘‘High” and ‘‘Low” grid electric-ity GHG emissions rates. To introduce the changes, the findings fora large residential building in Baltimore, MD will first reviewed.
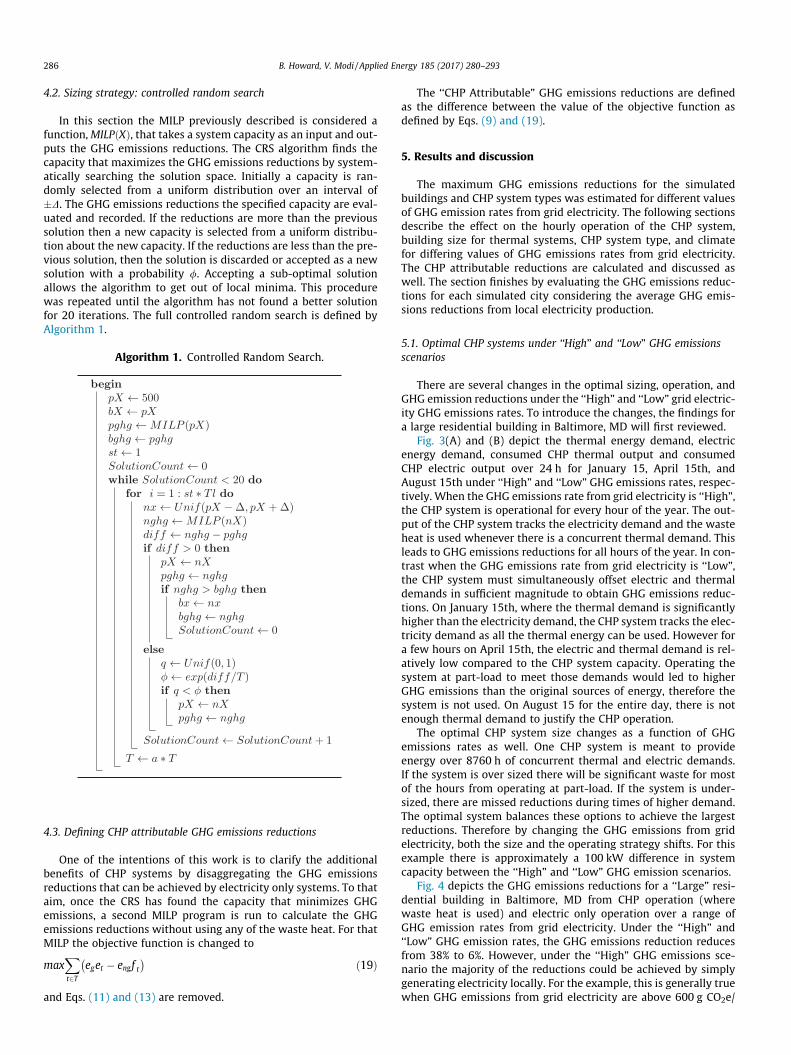
Fig. 3(A) and (B) depict the thermal energy demand, electricenergy demand, consumed CHP thermal output and consumedCHP electric output over 24 h for January 15, April 15th, andAugust 15th under ‘‘High” and ‘‘Low” GHG emissions rates, respec-tively. When the GHG emissions rate from grid electricity is ‘‘High”,the CHP system is operational for every hour of the year. The out-put of the CHP system tracks the electricity demand and the wasteheat is used whenever there is a concurrent thermal demand. Thisleads to GHG emissions reductions for all hours of the year. In con-trast when the GHG emissions rate from grid electricity is ‘‘Low”,the CHP system must simultaneously offset electric and thermaldemands in sufficient magnitude to obtain GHG emissions reduc-tions. On January 15th, where the thermal demand is significantlyhigher than the electricity demand, the CHP system tracks the elec-tricity demand as all the thermal energy can be used. However fora few hours on April 15th, the electric and thermal demand is rel-atively low compared to the CHP system capacity. Operating thesystem at part-load to meet those demands would led to higherGHG emissions than the original sources of energy, therefore thesystem is not used. On August 15 for the entire day, there is notenough thermal demand to justify the CHP operation.
The optimal CHP system size changes as a function of GHGemissions rates as well. One CHP system is meant to provideenergy over 8760 h of concurrent thermal and electric demands.If the system is over sized there will be significant waste for mostof the hours from operating at part-load. If the system is under-sized, there are missed reductions during times of higher demand.The optimal system balances these options to achieve the largestreductions. Therefore by changing the GHG emissions from gridelectricity, both the size and the operating strategy shifts. For thisexample there is approximately a 100 kW difference in systemcapacity between the ‘‘High” and ‘‘Low” GHG emission scenarios.
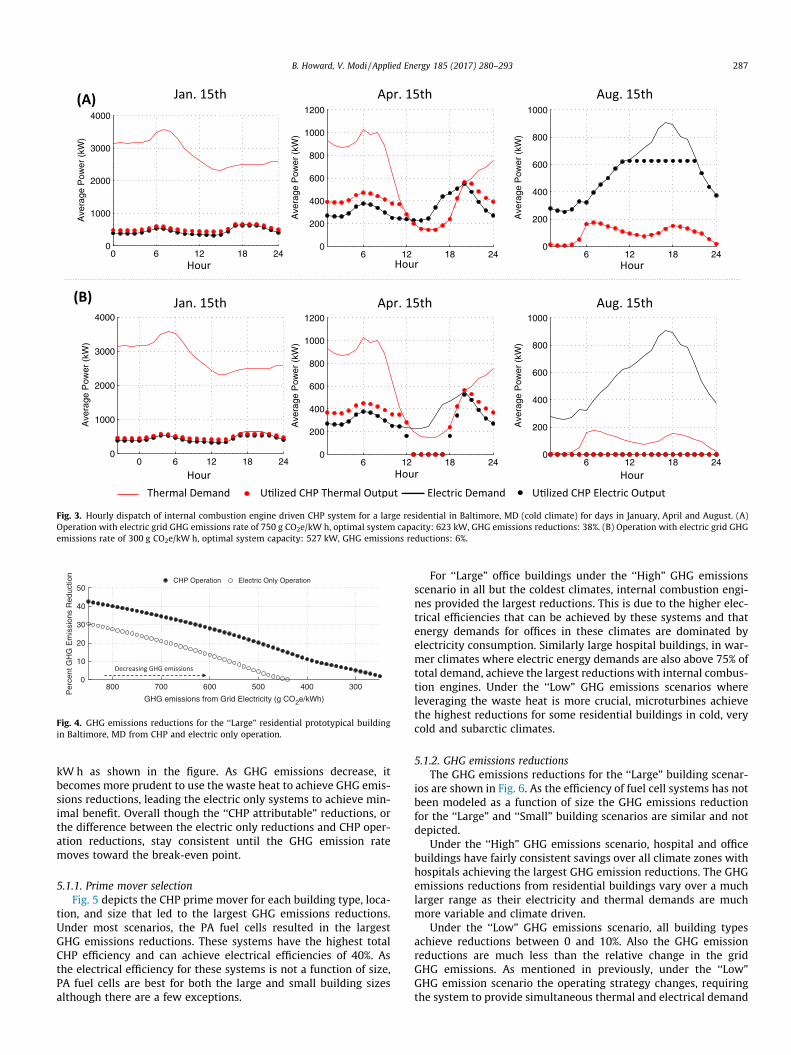
Fig. 4 depicts the GHG emissions reductions for a ‘‘Large” resi-dential building in Baltimore, MD from CHP operation (wherewaste heat is used) and electric only operation over a range ofGHG emission rates from grid electricity. Under the ‘‘High” and‘‘Low” GHG emission rates, the GHG emissions reduction reducesfrom 38% to 6%. However, under the ‘‘High” GHG emissions sce-nario the majority of the reductions could be achieved by simplygenerating electricity locally. For the example, this is generally truewhen GHG emissions from grid electricity are above 600 g CO2e/
0 6 12 18 240
1000
2000
3000
4000
Hour
Ave
rage
Pow
er (
kW)
0 6 12 18 240
1000
2000
3000
4000
Ave
rage
Pow
er (
kW)
6 12 18 240
200
400
600
800
1000
1200
Ave
rage
Pow
er (
kW)
6 12 18 240
200
400
600
800
1000
1200
Ave
rage
Pow
er (
kW)
6 12 18 240
200
400
600
800
1000
Ave
rage
Pow
er (
kW)
6 12 18 240
200
400
600
800
1000
Ave
rage
Pow
er (
kW)
Fig. 3. Hourly dispatch of internal combustion engine driven CHP system for a large residential in Baltimore, MD (cold climate) for days in January, April and August. (A)Operation with electric grid GHG emissions rate of 750 g CO2e/kW h, optimal system capacity: 623 kW, GHG emissions reductions: 38%. (B) Operation with electric grid GHGemissions rate of 300 g CO2e/kW h, optimal system capacity: 527 kW, GHG emissions reductions: 6%.
3004005006007008000
10
20
30
40
50
GHG emissions from Grid Electricity (g CO2e/kWh)
Per
cent
GH
G E
mis
sion
s R
educ
tion
CHP Operation Electric Only Operation
Fig. 4. GHG emissions reductions for the ‘‘Large” residential prototypical buildingin Baltimore, MD from CHP and electric only operation.
B. Howard, V. Modi / Applied Energy 185 (2017) 280–293 287
kW h as shown in the figure. As GHG emissions decrease, itbecomes more prudent to use the waste heat to achieve GHG emis-sions reductions, leading the electric only systems to achieve min-imal benefit. Overall though the ‘‘CHP attributable” reductions, orthe difference between the electric only reductions and CHP oper-ation reductions, stay consistent until the GHG emission ratemoves toward the break-even point.
5.1.1. Prime mover selectionFig. 5 depicts the CHP prime mover for each building type, loca-
tion, and size that led to the largest GHG emissions reductions.Under most scenarios, the PA fuel cells resulted in the largestGHG emissions reductions. These systems have the highest totalCHP efficiency and can achieve electrical efficiencies of 40%. Asthe electrical efficiency for these systems is not a function of size,PA fuel cells are best for both the large and small building sizesalthough there are a few exceptions.
For ‘‘Large” office buildings under the ‘‘High” GHG emissionsscenario in all but the coldest climates, internal combustion engi-nes provided the largest reductions. This is due to the higher elec-trical efficiencies that can be achieved by these systems and thatenergy demands for offices in these climates are dominated byelectricity consumption. Similarly large hospital buildings, in war-mer climates where electric energy demands are also above 75% oftotal demand, achieve the largest reductions with internal combus-tion engines. Under the ‘‘Low” GHG emissions scenarios whereleveraging the waste heat is more crucial, microturbines achievethe highest reductions for some residential buildings in cold, verycold and subarctic climates.
5.1.2. GHG emissions reductionsThe GHG emissions reductions for the ‘‘Large” building scenar-
ios are shown in Fig. 6. As the efficiency of fuel cell systems has notbeen modeled as a function of size the GHG emissions reductionfor the ‘‘Large” and ‘‘Small” building scenarios are similar and notdepicted.
Under the ‘‘High” GHG emissions scenario, hospital and officebuildings have fairly consistent savings over all climate zones withhospitals achieving the largest GHG emission reductions. The GHGemissions reductions from residential buildings vary over a muchlarger range as their electricity and thermal demands are muchmore variable and climate driven.
Under the ‘‘Low” GHG emissions scenario, all building typesachieve reductions between 0 and 10%. Also the GHG emissionreductions are much less than the relative change in the gridGHG emissions. As mentioned in previously, under the ‘‘Low”GHG emission scenario the operating strategy changes, requiringthe system to provide simultaneous thermal and electrical demand
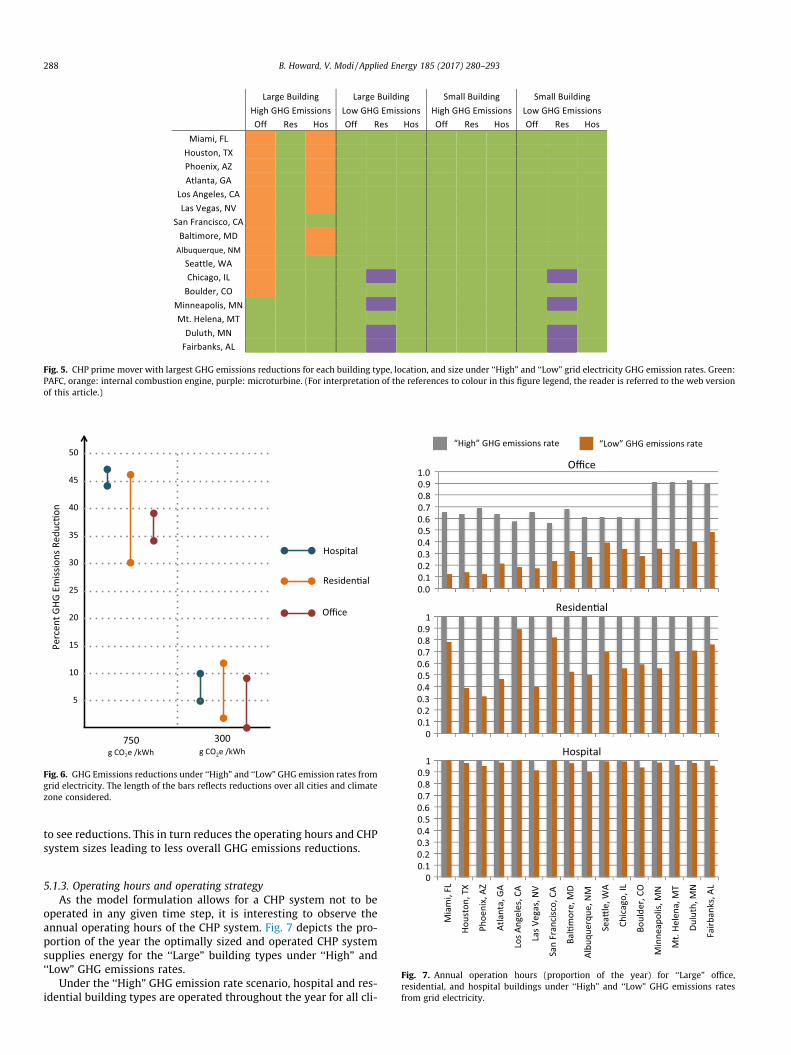
Fig. 5. CHP prime mover with largest GHG emissions reductions for each building type, location, and size under ‘‘High” and ‘‘Low” grid electricity GHG emission rates. Green:PAFC, orange: internal combustion engine, purple: microturbine. (For interpretation of the references to colour in this figure legend, the reader is referred to the web versionof this article.)
Fig. 6. GHG Emissions reductions under ‘‘High” and ‘‘Low” GHG emission rates fromgrid electricity. The length of the bars reflects reductions over all cities and climatezone considered.
288 B. Howard, V. Modi / Applied Energy 185 (2017) 280–293
to see reductions. This in turn reduces the operating hours and CHPsystem sizes leading to less overall GHG emissions reductions.
Fig. 7. Annual operation hours (proportion of the year) for ‘‘Large” office,residential, and hospital buildings under ‘‘High” and ‘‘Low” GHG emissions ratesfrom grid electricity.
5.1.3. Operating hours and operating strategyAs the model formulation allows for a CHP system not to be
operated in any given time step, it is interesting to observe theannual operating hours of the CHP system. Fig. 7 depicts the pro-portion of the year the optimally sized and operated CHP systemsupplies energy for the ‘‘Large” building types under ‘‘High” and‘‘Low” GHG emissions rates.
Under the ‘‘High” GHG emission rate scenario, hospital and res-idential building types are operated throughout the year for all cli-
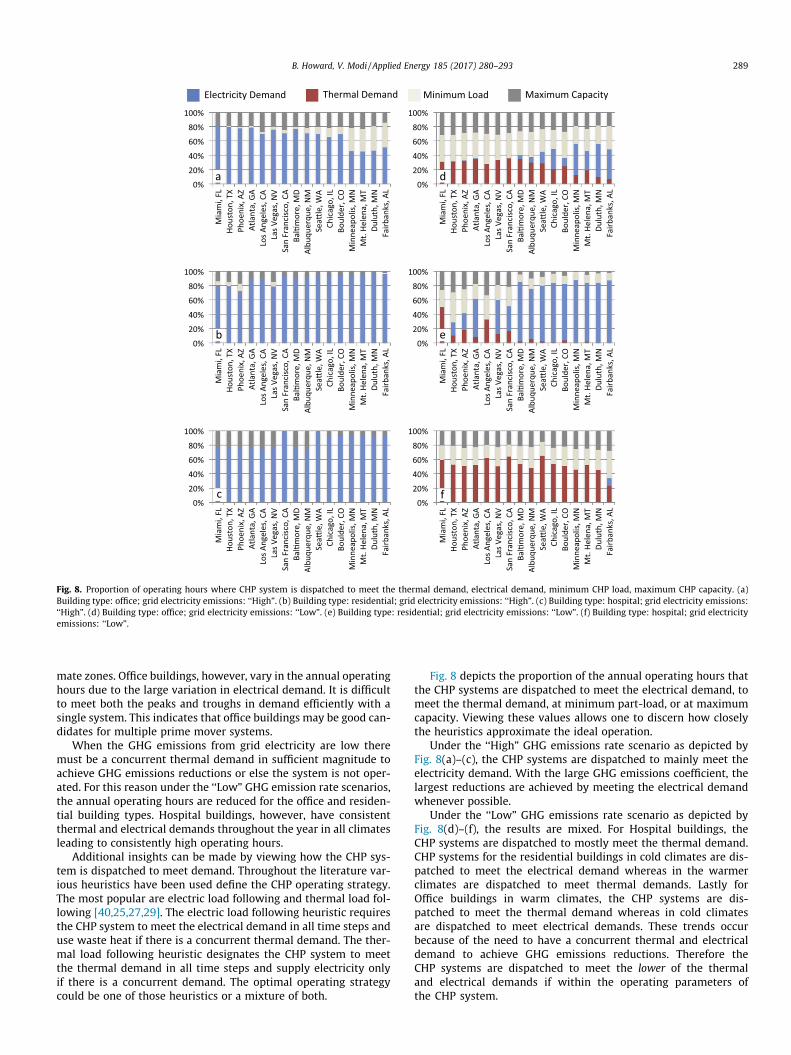
Fig. 8. Proportion of operating hours where CHP system is dispatched to meet the thermal demand, electrical demand, minimum CHP load, maximum CHP capacity. (a)Building type: office; grid electricity emissions: ‘‘High”. (b) Building type: residential; grid electricity emissions: ‘‘High”. (c) Building type: hospital; grid electricity emissions:‘‘High”. (d) Building type: office; grid electricity emissions: ‘‘Low”. (e) Building type: residential; grid electricity emissions: ‘‘Low”. (f) Building type: hospital; grid electricityemissions: ‘‘Low”.
B. Howard, V. Modi / Applied Energy 185 (2017) 280–293 289
mate zones. Office buildings, however, vary in the annual operatinghours due to the large variation in electrical demand. It is difficultto meet both the peaks and troughs in demand efficiently with asingle system. This indicates that office buildings may be good can-didates for multiple prime mover systems.
When the GHG emissions from grid electricity are low theremust be a concurrent thermal demand in sufficient magnitude toachieve GHG emissions reductions or else the system is not oper-ated. For this reason under the ‘‘Low” GHG emission rate scenarios,the annual operating hours are reduced for the office and residen-tial building types. Hospital buildings, however, have consistentthermal and electrical demands throughout the year in all climatesleading to consistently high operating hours.
Additional insights can be made by viewing how the CHP sys-tem is dispatched to meet demand. Throughout the literature var-ious heuristics have been used define the CHP operating strategy.The most popular are electric load following and thermal load fol-lowing [40,25,27,29]. The electric load following heuristic requiresthe CHP system to meet the electrical demand in all time steps anduse waste heat if there is a concurrent thermal demand. The ther-mal load following heuristic designates the CHP system to meetthe thermal demand in all time steps and supply electricity onlyif there is a concurrent demand. The optimal operating strategycould be one of those heuristics or a mixture of both.
Fig. 8 depicts the proportion of the annual operating hours thatthe CHP systems are dispatched to meet the electrical demand, tomeet the thermal demand, at minimum part-load, or at maximumcapacity. Viewing these values allows one to discern how closelythe heuristics approximate the ideal operation.
Under the ‘‘High” GHG emissions rate scenario as depicted byFig. 8(a)–(c), the CHP systems are dispatched to mainly meet theelectricity demand. With the large GHG emissions coefficient, thelargest reductions are achieved by meeting the electrical demandwhenever possible.
Under the ‘‘Low” GHG emissions rate scenario as depicted byFig. 8(d)–(f), the results are mixed. For Hospital buildings, theCHP systems are dispatched to mostly meet the thermal demand.CHP systems for the residential buildings in cold climates are dis-patched to meet the electrical demand whereas in the warmerclimates are dispatched to meet thermal demands. Lastly forOffice buildings in warm climates, the CHP systems are dis-patched to meet the thermal demand whereas in cold climatesare dispatched to meet electrical demands. These trends occurbecause of the need to have a concurrent thermal and electricaldemand to achieve GHG emissions reductions. Therefore theCHP systems are dispatched to meet the lower of the thermaland electrical demands if within the operating parameters ofthe CHP system.
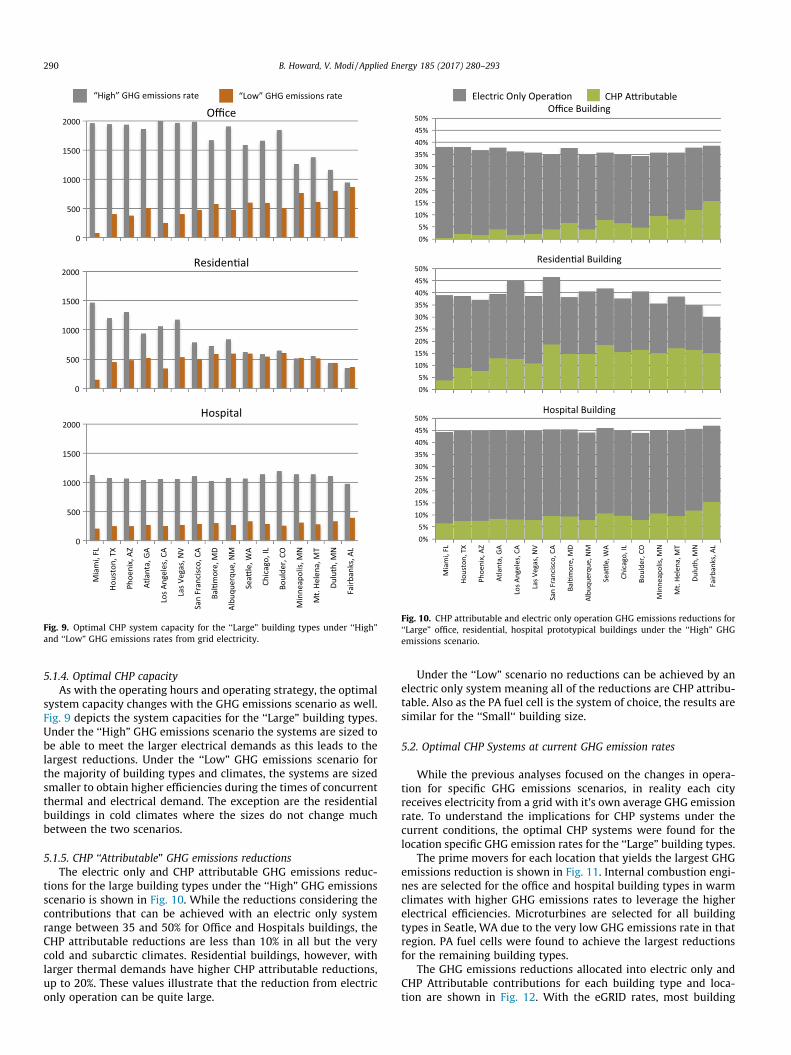
Fig. 10. CHP attributable and electric only operation GHG emissions reductions for‘‘Large” office, residential, hospital prototypical buildings under the ‘‘High” GHGemissions scenario.
Fig. 9. Optimal CHP system capacity for the ‘‘Large” building types under ‘‘High”and ‘‘Low” GHG emissions rates from grid electricity.
290 B. Howard, V. Modi / Applied Energy 185 (2017) 280–293
5.1.4. Optimal CHP capacityAs with the operating hours and operating strategy, the optimal
system capacity changes with the GHG emissions scenario as well.Fig. 9 depicts the system capacities for the ‘‘Large” building types.Under the ‘‘High” GHG emissions scenario the systems are sized tobe able to meet the larger electrical demands as this leads to thelargest reductions. Under the ‘‘Low” GHG emissions scenario forthe majority of building types and climates, the systems are sizedsmaller to obtain higher efficiencies during the times of concurrentthermal and electrical demand. The exception are the residentialbuildings in cold climates where the sizes do not change muchbetween the two scenarios.
5.1.5. CHP ‘‘Attributable” GHG emissions reductionsThe electric only and CHP attributable GHG emissions reduc-
tions for the large building types under the ‘‘High” GHG emissionsscenario is shown in Fig. 10. While the reductions considering thecontributions that can be achieved with an electric only systemrange between 35 and 50% for Office and Hospitals buildings, theCHP attributable reductions are less than 10% in all but the verycold and subarctic climates. Residential buildings, however, withlarger thermal demands have higher CHP attributable reductions,up to 20%. These values illustrate that the reduction from electriconly operation can be quite large.
Under the ‘‘Low” scenario no reductions can be achieved by anelectric only system meaning all of the reductions are CHP attribu-table. Also as the PA fuel cell is the system of choice, the results aresimilar for the ‘‘Small‘‘ building size.
5.2. Optimal CHP Systems at current GHG emission rates
While the previous analyses focused on the changes in opera-tion for specific GHG emissions scenarios, in reality each cityreceives electricity from a grid with it’s own average GHG emissionrate. To understand the implications for CHP systems under thecurrent conditions, the optimal CHP systems were found for thelocation specific GHG emission rates for the ‘‘Large” building types.
The prime movers for each location that yields the largest GHGemissions reduction is shown in Fig. 11. Internal combustion engi-nes are selected for the office and hospital building types in warmclimates with higher GHG emissions rates to leverage the higherelectrical efficiencies. Microturbines are selected for all buildingtypes in Seatle, WA due to the very low GHG emissions rate in thatregion. PA fuel cells were found to achieve the largest reductionsfor the remaining building types.
The GHG emissions reductions allocated into electric only andCHP Attributable contributions for each building type and loca-tion are shown in Fig. 12. With the eGRID rates, most building
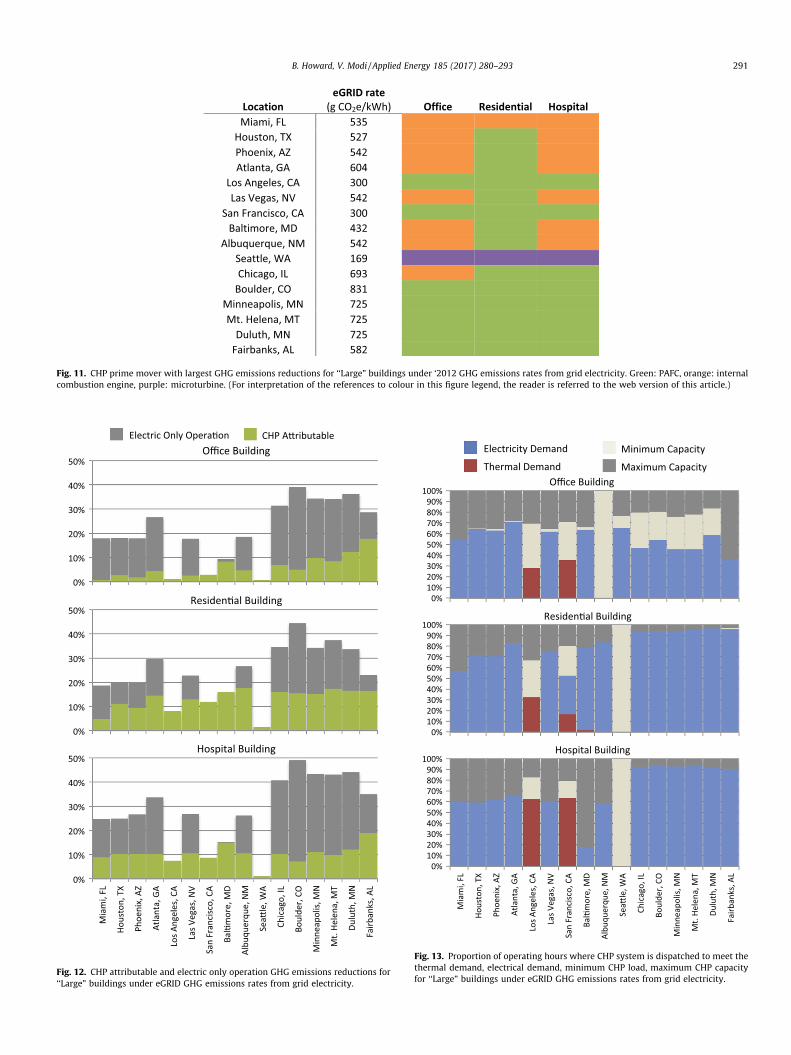
Fig. 11. CHP prime mover with largest GHG emissions reductions for ‘‘Large” buildings under ‘2012 GHG emissions rates from grid electricity. Green: PAFC, orange: internalcombustion engine, purple: microturbine. (For interpretation of the references to colour in this figure legend, the reader is referred to the web version of this article.)
Fig. 12. CHP attributable and electric only operation GHG emissions reductions for‘‘Large” buildings under eGRID GHG emissions rates from grid electricity.
Fig. 13. Proportion of operating hours where CHP system is dispatched to meet thethermal demand, electrical demand, minimum CHP load, maximum CHP capacityfor ‘‘Large” buildings under eGRID GHG emissions rates from grid electricity.
B. Howard, V. Modi / Applied Energy 185 (2017) 280–293 291
292 B. Howard, V. Modi / Applied Energy 185 (2017) 280–293
types in cold, very cold, and subarctic climates achieve reductionsabove 30% as these locations also have fairly high GHG emissionsrates. The CHP Attributable reductions, however, range between 5and 20%. The residential buildings in these locations consistentlyshow above 15% CHP attributable reductions. With GHG emis-sions rates close to the break-even point, all buildings in locatedin Seattle, WA achieve very little GHG emissions reductions, lessthan 2%.
Lastly for the majority of building types, an electric load follow-ing heuristic best approximates the optimal operating strategy asshown in Fig. 13. The exceptions are for Los Angeles and San Fran-cisco, CA where low GHG emissions rates and low thermaldemands result in a thermal load following heuristic.
6. Conclusions
The goals of the current work were to ascertain the effects ofbuilding type, building size, climate and current GHG emissionsfrom grid electricity on the GHG emission reductions possible fromnatural gas fueled building scale CHP systems. The reductions wereestimated for prototypical hospitals, office, and residential build-ings simulated in 16 different cities for microturbine, internal com-bustion engines, and phosphoric acid fuel cells. The results werealso explored to understand the changes in system sizing andoperation.
The analysis found that the fuel cell systems provided the lar-gest GHG emissions reduction for the majority of building typesin all climates under both ‘‘High” and ‘‘Low” GHG emissions ratesfrom grid electricity. The exceptions where for ‘‘Large” Office andHospital buildings in warm climates where the highest reductionswere achieved with internal combustion engines with higher elec-trical efficiencies. Microturbines were the system of choice for‘‘Large” and ‘‘Small” residential buildings in some cold, very coldand subarctic climates.
GHG emissions reductions for these prototypical buildings werebetween 30% and 47% under the ‘‘High” GHG emissions scenarioswith residential buildings exhibiting the most variability withcities and the corresponding climates. Under the ‘‘Low” GHG emis-sions scenario, GHG emissions reductions for the majority of build-ing types were less than 10%. Under ‘‘High” GHG emissionscenarios the majority of GHG emissions reduction come from gen-erating electricity more efficiently with a less carbon intensive fuel.This results in CHP Attributable reductions ranging between 1 and20%, with residential buildings representing the higher end of therange.
In viewing the resulting CHP operation, the analysis found thatthe annual operating hours for Office and Residential buildingsreduce under ‘‘Low” GHG emissions scenarios, as there must be aconcurrent thermal and electrical demand to achieve GHG emis-sions reductions. Hospitals have concurrent thermal and electricaldemands throughout the year therefore the operating hours do notdiminish under lower GHG emissions scenarios.
In terms of operating strategy, under ‘‘High” GHG emissionsscenarios, the optimal operating strategy is analogous to an electri-cal load following strategy, if operating. This is occurs due to theGHG emissions from grid electricity being higher than those pro-duced from the CHP system. Under ‘‘Low” GHG emissions scenar-ios, the operating strategies vary, overall attempting to meet thelower of thermal and electric demands in any hour, if operating.This results in a thermal load following strategy for hospitals andoffice buildings in warm climates. For residential buildings in coldclimates this leads to an electric load following strategy.
Considering current GHG emission rates for each location, thesame trends were observed. A mixture of prime movers providedthe largest GHG emissions reductions. Internal combustion engines
were favored in locations with both high GHG emissions and elec-trical demands. Microturbines were the prime mover of choice forSeattle, WA where the GHG emissions coefficient is relatively low.Buildings in cold climates with high GHG emission rates whereable to achieve GHG emissions reductions between 30 and 50%,however, the CHP attributable reductions where between 5 and20%. The optimal operating strategy could be approximated withan electric load following heuristic for all locations and buildingtypes except for in locations with the lowest GHG emissions rateswhere a thermal load following approach is favored.
References
[1] Tan Wen-Shan, Hassan Mohammad Yusri, Shah Majid Md, Rahman HasimahAbdul. Optimal distributed renewable generation planning: a review ofdifferent approaches. Renew Sustain Energy Rev 2013;18:626–45.
[2] Pepermans G, Driesen J, Haeseldonckx D, Belmans R, D’haeseleer W.Distributed generation: definition, benefits and issues. Energy Policy 2005;33(6):787–98.
[3] Chiradeja P, Ramakumar R. An approach to quantify the technical benefits ofdistributed generation. IEEE Trans Energy Convers 2004;19(4):764–73.
[4] Chicco Gianfranco, Mancarella Pierluigi. Distributed multi-generation: acomprehensive view. Renew Sustain Energy Rev 2009;13(3):535–51.
[5] Zhang Jian, Cho Heejin, Knizley Alta. Evaluation of financial incentives forcombined heat and power (chp) systems in U.S. regions. Renew Sustain EnergyRev 2016;59:738–62.
[6] Kelly Scott, Pollitt Michael. An assessment of the present and futureopportunities for combined heat and power with district heating (chp-dh) inthe United Kingdom. Energy Policy 2010;38(11):6936–45. Energy efficiencypolicies and strategies with regular papers.
[7] Lemar Jr Paul L. The potential impact of policies to promote combined heat andpower in {US} industry. Energy Policy 2001;29(14):1243–54. Scenarios for aclean energy future.
[8] Brown James E, Hendry Chris N, Harborne Paul. An emerging market in fuelcells? residential combined heat and power in four countries. Energy Policy2007;35(4):2173–86.
[9] Brown Kevin, Minett Simon. History of chp developments and current trends.Appl Energy 1996;53(1–2):11–22. Combined heat and power in energystrategy and practice.
[10] Hinnells Mark. Combined heat and power in industry and buildings. EnergyPolicy 2008;36(12):4522–6. Foresight sustainable energy management andthe built environment project.
[11] U.S. EPA. Catalog of CHP technologies. U.S. EPA; 2008. <http://www.epa.gov/chp/technologies.html>.
[12] Yun Kyungtae, Luck Rogelio, Mago Pedro, Smith Aaron. Analytic solutions foroptimal power generation unit operation in combined heating and powersystems. J Energy Resour Technol 2011;134.
[13] Hawkes AD, Leach MA. Cost-effective operating strategy for residential micro-combined heat and power. Energy 2007;32(5):711–23.
[14] Basrawi Firdaus, Ibrahim Thamir K, Habib Khairul, Yamada Takanobu. Effect ofoperation strategies on the economic and environmental performance of amicro gas turbine trigeneration system in a tropical region. Energy2016;97:262–72.
[15] Mago Pedro J, Luck Rogelio, Smith Amanda D. Environmental evaluation ofbase-loaded chp systems for different climate conditions in the us. Int JAmbient Energy 2011;32(4):203–14.
[16] Knizley Alta, Mago Pedro J. Evaluation of combined heat and power (chp)systems performance with dual power generation units for different buildingconfigurations. Int J Energy Res 2013;37(12):1529–38.
[17] Mago Pedro J, Smith Amanda D. Evaluation of the potential emissionsreductions from the use of chp systems in different commercial buildings.Build Environ 2012;53(0):74–82.
[18] Sundberg Gunnel, Henning Dag. Investments in combined heat and powerplants: influence of fuel price on cost minimised operation. Energy ConversManage 2002;43(5):639–50.
[19] Paepe Michel De, D’Herdt Peter, Mertens David. Micro-chp systems forresidential applications. Energy Convers Manage 2006;47(18–19):3435–46.
[20] Pantaleo Antonio M, Camporeale Sergio, Shah Nilay. Natural gas–biomass dualfuelled microturbines: comparison of operating strategies in the italianresidential sector. Appl Therm Eng 2014;71(2):686–96. Special issue:{MICROGEN} III: promoting the transition to high efficiency distributedenergy systems.
[21] Ren Hongbo, Gao Weijun, Ruan Yingjun. Optimal sizing for residential chpsystem. Appl Therm Eng 2008;28(5–6):514–23.
[22] Ehyaei MA, Bahadori MN. Selection of micro turbines to meet electrical andthermal energy needs of residential buildings in Iran. Energy Build 2007;39(12):1227–34.
[23] Shaneb OA, Coates G, Taylor PC. Sizing of residential chp systems. Energy Build2011;43(8):1991–2001.
[24] Ghadimi P, Kara S, Kornfeld B. The optimal selection of on-site {CHP} systemsthrough integrated sizing and operational strategy. Appl Energy 2014;126(0):38–46.

B. Howard, V. Modi / Applied Energy 185 (2017) 280–293 293
[25] Howard Bianca, Saba Alexis, Gerrard Michael, Modi Vijay. Combined heat andpower’s potential to meet New York city’s sustainability goals. Energy Policy2014;65(0):444–54.
[26] Costa Antonio, Fichera Alberto. A mixed-integer linear programming (milp)model for the evaluation of chp system in the context of hospital structures.Appl Therm Eng 2014;71(2):921–9. Special issue: {MICROGEN} III: promotingthe transition to high efficiency distributed energy systems.
[27] Cho Woojin, Lee Kwan-Soo. A simple sizing method for combined heat andpower units. Energy 2014;65(0):123–33.
[28] Beihong Zhang, Weiding Long. An optimal sizing method for cogenerationplants. Energy Build 2006;38(3):189–95.
[29] Hueffed AK, Mago PJ. Influence of prime mover size and operational strategyon the performance of combined cooling, heating, and power systems underdifferent cost structures. Proc Inst Mech Eng, Part A: J Power Energy 2010;224.
[30] Wang Jiang-Jiang, Jing You-Yin, Zhang Chun-Fa, Zhai Zhiqiang (John).Performance comparison of combined cooling heating and power system indifferent operation modes. Appl Energy 2011;88(12):4621–31.
[31] Pacific Northwest National Laboratory and Oak Ridge National Laboratory.Guide to determining climate regions by county. Technical report; August2010.
[32] U.S. Department of Energy (US DOE). Commerical buildings initative:commerical reference building. U.S. Department of Energy (US DOE); 2011.
<http://www1.eere.energy.gov/buildings/commercialinitiative/referencebuildings.html>.
[33] Energy Information Administration. Commercial building energy consumptionsurvey. US Department of Energy; 2012.
[34] Ge jenbacher type 2 technical specifications. <http://site.ge-energy.com/prod_serv/products/recip_engines/en/downloads/ETS_E_T2_10_screen_August2010.pdf>.
[35] Ge jenbacher type 4 technical specifications. <http://site.ge-energy.com/prod_serv/products/recip_engines/en/type4.htm>.
[36] Ge jenbacher type 6 technical specifications. <https://www.ge-distributedpower.com/products/power-generation/up-to-5mw/jenbacher-type-6>.
[37] Catepillar gas generator set technical specifications. <http://www.cat.com/en_US/products/new/power-systems/electric-power-generation.html>.
[38] Capstone microturbine technical specifications. <http://www.capstoneturbine.com/_docs/Product%20Catalog_ENGLISH_LR.pdf>.
[39] Pure cell model 400 technical specifications. <http://www.doosanfuelcellamerica.com/energy/purecellmodel400system/>.
[40] Ren Hongbo, Gao Weijun. Economic and environmental evaluation of micro{CHP} systems with different operating modes for residential buildings inJapan. Energy Build 2010;42(6):853–61.