Embed Size (px)
Citation preview

TSINGHUA SCIENCE AND TECHNOLOGY IS SN l l 1 0 0 7 - 0 2 1 4 l l 0 6 / 2 0 l l p p 3 6 - 4 3 Volume 15, Number 1, February 2010
Exact Efficient Handling of Interrupted Illumination in Helical Cone-Beam Computed Tomography with Arbitrary Pitch*
Harald Schöndube1,2,**, Karl Stierstorfer2, Frédéric Noo1
1. Department of Radiology, University of Utah, Salt Lake City, UT 84132-2140, USA; 2. Siemens Healthcare, 91301 Forchheim, Germany
Abstract: We present a theoretically-exact and stable computed tomography (CT) reconstruction algorithm
that is capable of handling interrupted illumination and therefore of using all measured data at arbitrary pitch.
This algorithm is based on a differentiated backprojection (DBP) on M-lines. First, we discuss the problem of
interrupted illumination and how it affects the DBP. Then we show that it is possible to take advantage of
some properties of the DBP to compensate for the effects of interrupted illumination in a mathematically ex-
act way. From there, we have developed an efficient algorithm which we have successfully implemented.
We show encouraging preliminary results using both computer-simulated data and real data. Our results
show that our method is capable of achieving a substantial reduction of image noise when decreasing the
helix pitch compared with the maximum pitch case. We conclude that the proposed algorithm defines for the
first time a theoretically-exact and stable reconstruction method that is capable of beneficially using all
measured data at arbitrary pitch.
Key words: computed tomography (CT); theoretically-exact and stable image reconstruction; differentiated
backprojection; M-lines; redundant data
Introduction
In medical imaging applications of helical cone-beam computed tomography (CT), image reconstruction is currently performed using approximate methods; see, e.g., Ref. [1] for a recent review of these methods. Ap-proximate reconstruction methods are especially at-tractive because they allow using all measured data for a broad range of pitch values. However, due to the mathematical approximations that subtend them, they yield results that are generally distorted by cone-beam
artifacts, which tend to appear as low frequency errors when examining axial slices.
In contrast, theoretically-exact and stable (TES) re-construction algorithms do not employ approximations and yield results that are free of cone-beam artifacts[2-9]. However, they usually perform reconstruction using exclusively the data measured inside the Tam-Danielsson (TD) window[10,11], or more generally inside the -n window[12]. Consequently, the range of useful pitch factors for these algorithms is limited to the discrete values for which the TD window or -n window just fits within the detector area, as in these cases the amount of detector data measured outside the respective window (and therefore not used for recon-struction) is minimized. The pitch factor for which the TD window just fits within the detector is the largest one for which TES reconstruction is possible; we call it maximum pitch. As the topic of this paper is TES
Received: 2009-10-18; revised: 2009-12-28
* Supported by the US National Institutes of Health (NIH) (Nos. R01 EB007236 and R21 EB009168) and in part by the Siemens Healthcare
** To whom correspondence should be addressed. E-mail: [email protected]

Harald Schöndube et al. Exact Efficient Handling of Interrupted Illumination in Helical … 37
reconstruction, we assume in the following that the pitch is always smaller than or equal to maximum pitch.
In Ref. [13], we have introduced a TES method dubbed “M-line DBP-HT” that is capable of benefi-cially using all detector data at maximum pitch. The method operates by using a differentiated backprojec-tion (DBP) followed by an inverse Hilbert transform (HT) and is capable of processing redundant data by working on M-lines, which are lines connecting a source position with any point on the detector (“M-line” is an acronym for “measured line”). How-ever, this algorithm does not solve the problem of finding a TES algorithm that is able to process all de-tector data at arbitrary pitch, because interrupted illu-mination[12] appears for many locations in the field-of-view (FOV) when the pitch factor is smaller than maximum pitch, and this interrupted illumination prevents a successful application of the M-line DBP- HT method.
Here, we present a TES extension of the algorithm in Ref. [13] that is capable of handling the problem of interrupted illumination and is thus able to use all measured data at arbitrary pitch.
1 DBP-HT on M-lines
In this section, we review aspects of the data acquisi-tion geometry and of the M-line DBP-HT algorithm that are directly relevant for the presentation of our original contribution. The notation is exactly the same as that used in Ref. [13] where more extensive details can be found.
1.1 Data acquisition geometry
Let 0 0( ) [ cos( ), sin( ), ]a R R h describe the heli-cal source trajectory of radius 0R around the object
( )f x , where cone-beam (CT) measurements are taken using a conventional multi-row cylindrical detector at each source position start end[ , ] . The quantity h is equal to the helix pitch divided by 2 ; it is related to the pitch factor p through the equation
0 rows
2 Dp hR N w
(1)
where D is the source-to-detector distance, rowsN the number of detector rows, and w the physical height of each row. Axial positions on the detector are
specified by a coordinate w . The orthogonal projec-tion of the source onto the detector is at 0w , and the detector covers the range min max[ , ].w w w At maximum pitch (denoted by maxh or maxp , respec-tively), each voxel x is illuminated continuously and exclusively over the interval [ ( ), ( )]a bx x , i.e., inter-rupted illumination does not occur.
1.2 Algorithm
The reconstruction algorithm that we extend relies heavily on the DBP concept. The result of the DBP is not the object itself, but rather its Hilbert transform (HT) along an M-line. The HT is inverted using, e.g., the techniques in Refs. [4] and [14]. We denote the HT of ( )f x along the direction of the unit vector point-ing from ( )a towards x by ( )( , ).Hf x We use a data rebinning step in our implementation of the DBP; this significantly improves efficiency and noise prop-erties as we showed in Refs. [14] and [15]. The re-binning step converts the cone-beam data into pseudo parallel-beam data, also called “wedge data”, and is applied prior to differentiation.
The DBP-HT algorithm is based on the following equation[4]:
21( )( , ) (DBP{ , ( ), }2M MHf x x x
1DBP{ , ( ), })M x x (2) where DBP{ , , }i o x is a generic notation for the DBP over the interval [ , ]i o at ,x and where
1( ( ))a x and 2( ( ))a x denote those source positions where the projection of x just enters (or, respectively, leaves) the TD window on the detector. The exact ex-pression for DBP{ , , }i o x can be found in Ref. [13].
Relation 2 is valid for any voxel x inside the helix as long as x is illuminated over the whole backpro-jection interval. If we choose 1 2( ) ( ),Mx x only the non-redundant data from inside the TD win-dow is used for backprojection. On the other hand, if we choose 1 2[ ( ), ( )]M x x , the backprojection in-terval is extended beyond the boundaries of the TD window, and this allows involving the redundant data in the reconstruction process. In Ref. [13], we have shown that this property of the DBP can be employed to efficaciously reduce image noise without signifi-cantly changing the spatial resolution. The reconstruc-tion procedure can be described as follows:

Tsinghua Science and Technology, February 2010, 15(1): 36-43 38
(1) Partition the desired volume V into a stack of surfaces of M-lines; do this using M-lines that point towards the same fixed detector coordinate w for all surfaces.
(2) Perform reconstruction on the surfaces of M-lines by first applying Eq. (2), and then a finite HT inversion.
(3) Interpolate to a Cartesian grid. (4) Repeat the above steps three times using each
time a different value for the coordinate w that de-fines the M-line surfaces; namely 0,w minw w and max.w w
(5) Average the results obtained for the three values of .w Let ( )V w represent the reconstruction of V
obtained by employing M-lines pointing towards the detector locations of coordinate .w When using sur-faces of M-lines pointing towards the central row of the rebinned detector, i.e., towards 0w (see Fig. 1),
M 1 2[ ( ), ( )]x x holds and we get a first recon-struction result (0)V that does not use any redundant data. On the other hand, when we use surfaces of M-lines pointing towards the upper or lower edge of the rebinned detector, i.e., towards maxw w and
minw w respectively (see again Fig. 1), we obtain two reconstructions, min( )V w and max( )V w , that involve together all measured data. These two recon-structions are noisier than (0),V but the average
* *min max( (0) ( ) ( ))/3V V V w V w has better noise
properties than (0)V and represents the final result.
Fig. 1 Three different kinds of M-line surfaces used for the M-line DBP-HT. The curved thick black lines on the detec-tor denote the boundaries of the TD window, the shaded area corresponds to the amount of data used in reconstructing the respective surface.
2 Interrupted Illumination
The term “interrupted illumination” describes the fact that under certain circumstances a voxel x inside the FOV may be illuminated over several disjunct parts of the source trajectory, i.e., the cone-beam (CB) projec-tion of the voxel x may enter (respectively leave) the area detector more than once when varying from
to . In this paper, we assume that no lateral data truncation occurs, i.e., the object is always strictly contained within the FOV. As a consequence, interrupted illumination can only occur at the top or bottom of the detector, as the projection of x cannot enter nor leave the detector area through the lateral boundaries.
Figure 2 shows an example of how the projection of a voxel x travels over the area of the detector when varying . In this example interrupted illumination occurs and can clearly be recognized: at ( ),a x the
projection of the voxel enters the detector for the first time. From 1( )o x to 1( ),i x the projection of the voxel is outside the detector area again, i.e., interrupted
Fig. 2 Exemplary path of the projection of a voxel x over the detector (gray) when varying . The projec-tion path is plotted in black, the dashed curves indicate the boundaries of the TD window.
a i1 o1
2
b i2 o2
1
(a) M-line surface pointing to the center of the rebinned detector
(b) M-line surface pointing tothe top of the rebinned detec-tor
(c) M-line surface pointing tothe bottom of the rebinned detector

Harald Schöndube et al. Exact Efficient Handling of Interrupted Illumination in Helical … 39
illumination occurs over that interval. At 1( )x and 2 ( ),x the projection of the voxel enters (respectively
leaves) the TD window. Between 2 ( )o x and 2 ( )i x , a second interruption in illumination can be observed, before the projection finally leaves the detector area completely at ( ).b x
Note that interrupted illumination cannot occur between 1( )x and 2 ( ).x Due to geometrical considerations and the definition of the TD window, the projection of any voxel inside the FOV enters (re-spectively leaves) the TD window only once. It is thus impossible for the projection to leave the detector area inside the interval 1 2[ ( ), ( )]x x , since we assume that the projection of any voxel within the FOV cannot travel over the lateral boundaries of the detector. This observation has an important consequence for the M-line DBP-HT algorithm. Since the backprojection interval for M-lines that point into the TD window is limited to 1 2[ ( ), ( )]x x , i.e., to data within the TD window, the M-lines for (0)V are not affected by interrupted illumination. Thus, for any pitch value, reconstruction (0)V is always exact.
The situation is different for the surfaces of M-lines pointing towards the upper and lower edges of the de-tector, which form the basis of reconstructions
max( )V w and min( )V w , respectively. These surfaces include voxels that are affected by interrupted illumi-nation in an amount that increases with decreasing pitch. For illustration, Fig. 3 shows which voxels on the M-line surface pointing to the top of the detector are affected by interrupted illumination for pitch fac-tors 0 5p and 0 75p .
(a) p=0.5 (b) p=0.75
Fig. 3 Regions inside the FOV on the M-line surface pointing to the top detector row which are affected (white) or not affected (gray) by interrupted illumination
3 Compensating for Interrupted Illumination
As discussed in the previous section, only those M-line
surfaces used by the M-line DBP-HT that point to the upper or lower edge of the detector are affected by in-terrupted illumination, whereas the central surfaces, and therefore reconstruction (0)V , are not affected by interrupted illumination. This observation suggests that it may be possible to compensate the interrupted illumination by using (0)V to obtain all information that is missing on the outer surfaces.
To explain our approach, it is necessary to remember the general DBP relation[4]:
DBP{ , , } ( )( , ) ( )( , )i o o ix Hf x Hf x (3) Equation 2 follows from Eq. (3) by recognizing that
1( )x and 2 ( )x are the endpoints of the -line through x and therefore 1( )( , ( ))Hf x x
2( )( , ( ))Hf x x . Now consider Eq. (2) in the case when the M-lines
point to the upper end of the detector (i.e., 1( ) ( )M a x x ) and when interrupted illumination
occurs. Let 1( )o x and 1( )i x be the locations where this interrupted illumination begins and ends (see again Fig. 2). Then each of the two terms on the right hand side of Eq. (2) can be written as the sum of three terms, the first and third of which can be computed directly from the data, but not the second one:
2 1DBP{ , ( ), } DBP{ , ( ), }M M ox x x x
1 1DBP{ ( ), ( ), }o ix x x 1 2DBP{ ( ), ( ), }i x x x (4)
1 1DBP{ ( ) } DBP{ ( ) }M M ox x x x 1 1DBP{ ( ), ( ), }o ix x x
1 1DBP{ ( ), ( ), }i x x x (5) We move this second term onto the left hand side of Eq. (2) and moreover use Eq. (3) to replace it by a differ-ence of Hilbert transforms, namely
1 1DBP{ ( ), ( ), }=o ix x x
1 1( )( , ( )) ( )( , ( ))i oHf x x Hf x x (6)
This manipulation leads to the following fundamental result of this paper:
( )( , ( , ))MHf x x
1 1( )( , ( )) ( )( , ( ))i oHf x x Hf x x
1 1 21 (DBP{ , ( ), } DBP{ ( ), ( ), }2 M o ix x x x x
1 1 1DBP{ , ( ), } DBP{ ( ), ( ), })M o ix x x x x (7) On the left hand side of this formula we have two
unknown quantities, 1( )( , ( ))iHf x x and 1( )( , ( ))oHf x x , but fortunately it is possible to compute both directly from reconstruction (0)V . To do so, it is necessary to

Tsinghua Science and Technology, February 2010, 15(1): 36-43
40
determine the values of 1( )i x and 1( )o x for all .x However, due to the rotational symmetry of the back-projection geometry, 1( )o Mx and 1( )i Mx are only dependent on the location of the point x on the M-line surface and on the detector row the surface points to; particularly, they do not depend on the z location of the surface itself. It is thus possible to eas-ily tabulate these values. The values of 1( )o x and
1( )i x can then be obtained by simply adding .M By applying the concept described above, we get the
following extended backprojection formula: ( )( , ( , ))MHf x x
1 1 21 (DBP{ , ( ), } DBP{ ( ), ( ), }2 M o ix x x x x
1 1 1DBP{ , ( ), } DBP{ ( ), ( ), })M o ix x x x x
1 1( )( , ( )) ( )( , ( ))i oHf x x Hf x x (8) where the value of the correction terms, ( )( ,Hf x
1( ))i x and 1( )( , ( ))oHf x x , is obtained by first cre-ating the values onto the involved M-lines using inter-polation from (0)V and then performing a forward Hilbert transform along those lines.
The formula in 8 intrinsically defines the extended M-line DBP-HT method. The extension can be de-scribed in words as follows:
(1) Partition the desired volume V into three stacks of M-line surfaces and perform the DBP over all available data as with the original M-line DBP-HT.
(2) Perform the inverse HT on the M-line surfaces pointing inside the TD window and interpolate the re-sult to form reconstruction (0)V .
(3) For all points in the stack of M-line surfaces pointing to the top detector row, compute ( )( ,Hf x
1( ))i x and 1( )( , ( ))oHf x x from (0)V , then add those values to the backprojection result to compensate for the interrupted illumination.
(4) Proceed analogously for the stack of M-line sur-faces pointing to the lower edge of the detector.
(5) Perform the inverse HT on the outer M-line sur-faces, and interpolate to obtain reconstructions
max( )V w and min( )V w (6) Average the three results to obtain *
min max( (0) ( ) ( )) 3V V V w V w .
4 Results
We have successfully implemented our idea and ob-tained encouraging results. These results involve both
computer-simulated data and real data. All reconstruc-tions were performed on a grid of 512 512 square pixels of side 1 mm. The computer simulations used the same geometric parameters as the experiment with real data.
4.1 Experiment with computer-simulated data
For this experiment, we used the FORBILD thorax phantom[16]. The top row of Fig. 4 shows the backpro- jection on a surface of M-lines pointing to the upper
Fig. 4 Reconstructions of the FORBILD thorax at pitch factor p=0.5 on an M-line surface pointing to the top detector row, window=[ 250 HU, 250 HU]
(a) Backprojection resultwithout correction for inter-rupted illumination beforeperforming the inverse HT
(b) Backprojection result without correction for inter-rupted illumination after per-forming the inverse HT
(e) Backprojection result aftercorrection for interruptedillumination before perform-ing the inverse HT
(f) Backprojection result after correction for interrupted illumination and after per-forming the inverse HT
(c) Compensation values 1( )( ( ))iHf x x
(d) Compensation values 1( )( ( ))oHf x x
Harald Schöndube et al. Exact Efficient Handling of Interrupted Illumination in Helical …
41
edge of the detector before (left) and after (right) per-forming the inverse HT. The impact from interrupted illumination is clearly visible. The values ( )( ,Hf x
1( ))i x and 1( )( , ( ))oHf x x that compensate for the interrupted illumination according to Eq. (8) and are computed from reconstruction (0)V are displayed in the middle row of that figure, while the final result, obtained by adding the correction terms, is shown in the bottom row, again before and after performing the inverse HT.
To demonstrate stability to noise, Fig. 5 shows again the results on the same surface as above before and after compensating for the interrupted illumination, but with Poisson noise corresponding to 200 000 photons per ray added to the simulated data before starting the reconstruction process.
Fig. 5 Reconstructions of the FORBILD thorax at pitch factor p=0.5 on an M-line surface pointing to the top de-tector row with Poisson noise corresponding to 200.000 photons per ray added to the simulated data, win-dow=[ 250 HU, 250 HU]
4.2 Experiment with real data
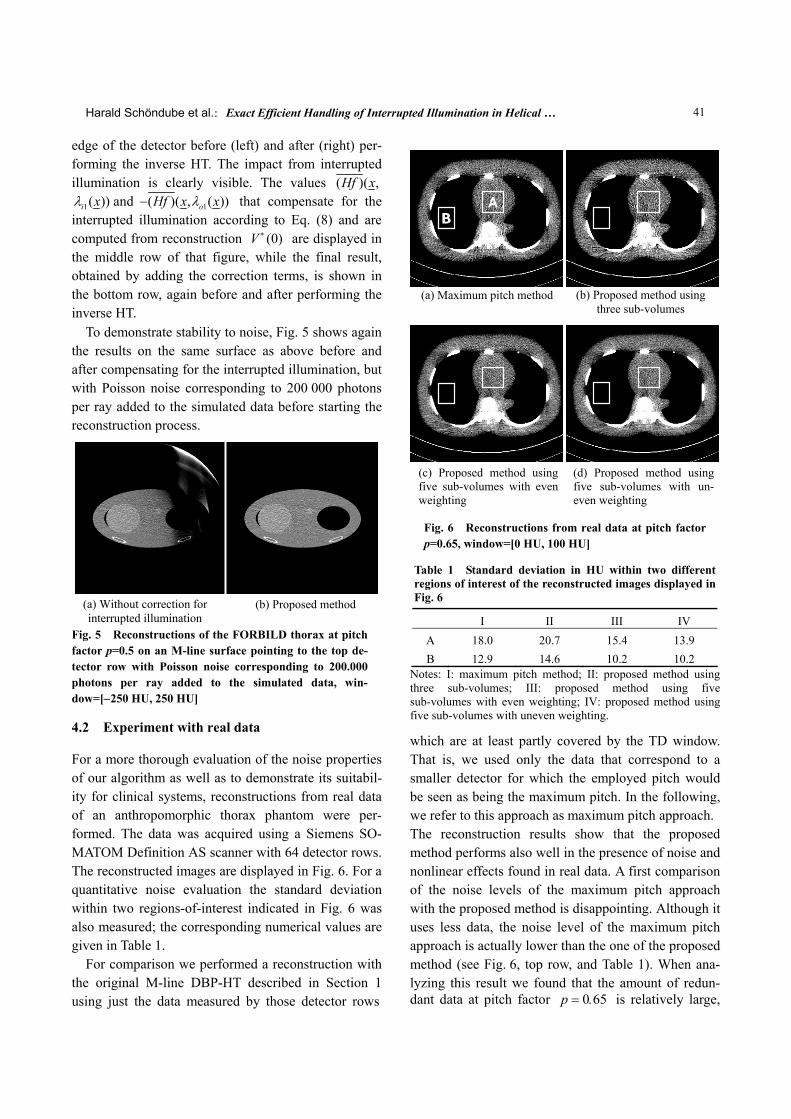
For a more thorough evaluation of the noise properties of our algorithm as well as to demonstrate its suitabil-ity for clinical systems, reconstructions from real data of an anthropomorphic thorax phantom were per-formed. The data was acquired using a Siemens SO-MATOM Definition AS scanner with 64 detector rows. The reconstructed images are displayed in Fig. 6. For a quantitative noise evaluation the standard deviation within two regions-of-interest indicated in Fig. 6 was also measured; the corresponding numerical values are given in Table 1.
For comparison we performed a reconstruction with the original M-line DBP-HT described in Section 1 using just the data measured by those detector rows
A
B
Fig. 6 Reconstructions from real data at pitch factor p=0.65, window=[0 HU, 100 HU]
Table 1 Standard deviation in HU within two different regions of interest of the reconstructed images displayed in Fig. 6
I II III IV A 18.0 20.7 15.4 13.9 B 12.9 14.6 10.2 10.2
Notes: I: maximum pitch method; II: proposed method using three sub-volumes; III: proposed method using five sub-volumes with even weighting; IV: proposed method using five sub-volumes with uneven weighting.
which are at least partly covered by the TD window. That is, we used only the data that correspond to a smaller detector for which the employed pitch would be seen as being the maximum pitch. In the following, we refer to this approach as maximum pitch approach. The reconstruction results show that the proposed method performs also well in the presence of noise and nonlinear effects found in real data. A first comparison of the noise levels of the maximum pitch approach with the proposed method is disappointing. Although it uses less data, the noise level of the maximum pitch approach is actually lower than the one of the proposed method (see Fig. 6, top row, and Table 1). When ana-lyzing this result we found that the amount of redun-dant data at pitch factor 0 65p is relatively large,
(a) Without correction for interrupted illumination
(b) Proposed method
(a) Maximum pitch method (b) Proposed method using three sub-volumes
(c) Proposed method using five sub-volumes with even weighting
(d) Proposed method using five sub-volumes with un-even weighting

Tsinghua Science and Technology, February 2010, 15(1): 36-43 42
and is thus likely to be too large to be handled by using an average of three volumes. In a next step, we thus repeated the reconstruction using five volumes, namely the three volumes used in the original M-line DBP-HT (i.e., surf 0w , surf minw w and surf maxw w ) and the two volumes, TDmin( )V w and TDmax( )V w , obtained from surfaces of M-lines that point towards the detec-tor rows that just touch the top and the bottom of the TD window, respectively. The latter two volumes are the same as those used in the maximum pitch approach and are thus not affected by interrupted illumination. The reconstruction obtained by averaging the five volumes shows a noise level that is considerably lower than the one of the maximum pitch approach (see Fig. 6, bottom left). To further reduce the noise level, we used an approach that was suggested in Ref. [17]. Instead of just averaging we computed a weighted sum of the five sub-volumes, using a weight of 1/9 for
min( )V w and max( )V w , of 2/9 for TDmin( )V w and
TDmax( )V w and of 3/9 for (0)V . The result is dis-played on the bottom right of Fig. 6 and shows some further noise reduction as desired. However, none of the methods performs equally well in all parts of the image, and the total amount of noise reduction between the maximum pitch approach and the proposed method is still somewhat smaller than the one that could be achieved using an approximate algorithm.
5 Discussion and Conclusions
In this paper, we presented an algorithm that allows exact handling of interrupted illumination in the con-text of the M-line DBP-HT method. This algorithm defines for the first time a TES reconstruction method that uses all measured data at arbitrary pitch.
Our way of using (0)V to handle interrupted il-lumination is not unique. For example, we could have extended the detector by a number of rows using for-ward projection through (0)V . Yet we believe that this process would be less efficient than the method proposed here because it would require backprojection on the segments of interrupted illumination in addition to the forward projection. Our approach involves only straightforward Hilbert integrations, once 1( )i x and
1( )o x are known for all x . Moreover, due to the rotational symmetry of the backprojection geometry,
these values can easily be obtained from pre-computed and stored data.
The method presented in this chapter shows a good image quality for reconstructions from both simulated and real CT data as well as stability to noise and non-linear effects. A considerable noise reduction over the maximum pitch approach was demonstrated to be fea-sible provided more than three volumes are involved. And further gains were shown to be achievable by us-ing different weights for the volumes. However, the optimal way of combining the volumes has probably not yet been found, since the amount of noise reduc-tion is somewhat lower than what one would expect from approximate algorithms. Further studies of alter-native (e.g., voxel-based) weighting schemes appear necessary.
References
[1] Kunze H. Iterative Rekonstruktion in der Medizinischen Bildverarbeitung [Dissertation]. Erlangen, Germany: Uni-versity of Erlangen-Nürnberg, Germany, 2007. (in Ger-man).
[2] Katsevich A I. Analysis of an exact inversion algorithm for spiral cone-beam CT. Phys. Med. Biol., 2002, 47: 2583-2597.
[3] Zou Y, Pan X. Exact image reconstruction on -line from minimum data in helical cone-beam CT. Phys. Med. Biol., 2004, 49: 941-959.
[4] Pack J D, Noo F, Clackdoyle R. Cone-beam reconstruction using the backprojection of locally filtered projections. IEEE Trans. Med. Imag., 2005, 24(1): 70-85.
[5] Bontus C, Köhler T, Proksa R. A quasiexact reconstruction algorithm for helical CT using a 3- acquisition. Med. Phys., 2003, 30(9): 2493-2502.
[6] Katsevich A. On two versions of a 3 algorithm for spiral CT. Phys. Med. Biol., 2004, 49(11): 2129-2143.
[7] Bontus C, Köhler T, Proksa R. EnPiT: Filtered back-projection algorithm for helical CT using an n- ac-quisition. IEEE Trans. Med. Imag., 2005, 24(8): 977-986.
[8] Katsevich A. 3 algorithms for helical computer tomogra-phy. Adv. Appl. Math., 2006, 36: 213-250.
[9] Ye Y, Zhao S, Yu H, et al. A general exact reconstruction for cone-beam CT via backprojection-filtration. IEEE Trans. Med. Imag., 2005, 24(9): 1190-1198.
[10] Tam K C, Samarasekera S, Sauer F. Exact cone-beam CT with a spiral scan. Phys. Med. Biol., 1998, 43: 1015-1024.
[11] Danielsson P E, Edholm P, Eriksson J, et al. Towards exact reconstruction for helical cone-beam scanning of long ob-jects: A new detector arrangement and a new completeness

Harald Schöndube et al. Exact Efficient Handling of Interrupted Illumination in Helical … 43
condition. In: Proceedings of 1997 Meeting on Fully 3D Image Reconstruction in Radiology and Nuclear Medicine. Pittsburgh, PA, USA, 1997: 141-144.
[12] Proksa R, Köhler T, Grass M, et al. The n- method for helical cone-beam CT. IEEE Trans. Med. Imag., 2000, 19(9): 848-863.
[13] Schöndube H, Stierstorfer K, Noo F. Accurate helical cone-beam CT reconstruction with redundant data. Phys. Med. Biol., 2009, 54(15): 4625-4644.
[14] Schöndube H, Stierstorfer K, Dennerlein F, et al. Towards an efficient two-step Hilbert algorithm for helical cone- beam CT. In: Proceedings of 2007 Meeting on Fully 3D Image Reconstruction in Radiology and Nuclear Medicine.
Lindau, Germany, 2007: 120-123. [15] Schöndube H, Stierstorfer K, Dennerlein F, et al. Com-
parative evaluation of two analytical methods for helical cone-beam tomography. In: Proceedings of IEEE Nuclear Science Symposium Conference. Hilton, Hawaii, USA, 2007, 6: 4467-4471.
[16] Phantoms group results. http://www.imp.uni-erlangen.de/ forbild/english/results/index.htm, 2009.
[17] Köhler T, Bontus C, Proksa R. BPF reconstruction for helical CT using all data. In: Proceedings of IEEE Nuclear Science Symposium Conference. Dresden, Germany, 2008: 4154-4156.