Embed Size (px)
Citation preview

Ex-Post Project Evaluation 2015: Package II-2 (Egypt, Armenia, Pakistan)
December 2016
JAPAN INTERNATIONAL COOPERATION AGENCY
EV JR 16-24
Octavia Japan, CO., LTD.

Disclaimer
This report compiles the result of the ex-post evaluations. These are conducted by external evaluators to ensure objectivity, and the views and recommendations herein do not necessarily reflect the official views and opinions of JICA. JICA is not responsible for the accuracy of English translation, and the Japanese version shall prevail in the event of any inconsistency with the English version. Minor amendments may be made when the contents of this report is posted on JICA’s website.
Comments by JICA and/or the Borrower (including the Executing Agency) may be added at the end of the evaluation report when the views held by them differ from those of the external evaluator. No part of this report may be copied or reprinted without the consent of JICA.

1
Arab Republic of Egypt
FY2015 Ex-Post Evaluation of Japanese ODA Loan
“Borg El Arab International Airport Modernization Project”
External Evaluator: Kenichi Inazawa, Octavia Japan Co., Ltd.
0. Summary
This project constructed and expanded the passenger and cargo terminal buildings and the
connected facilities for Borg El Arab Airport near Alexandria, the second largest city in Egypt,
in order to respond to increasing demand for air traffic and to improve the quality of services.
With regard to relevance, the government of Egypt has indicated its intention to develop
infrastructures to cope with an increasing air traffic demand in the Fifth Five-year Social
Development Plan and the Strategic Framework for Economic and Social Development. While
it was expected, before the start of this project, that the number of passengers that this airport
would be capable of accommodating would increase, further expansion of this airport was
planned at the time of the ex-post evaluation. The project is also in line with the assistance
policy of the Japanese Government. Thus, relevance is high. As for efficiency, the project cost
was slightly higher than the initial plan because the locations of the passenger and cargo
terminals, as well as the associated facilities, were reviewed and changed during the detailed
design after the start of this project. The project period was also slightly longer than the initial
plan due to a change in design of the passenger terminal. Thus, the efficiency is fair. Since the
start of this project, as the number of Egyptian workers migrating to gulf countries has been
increasing, the numbers of passengers and flights departing from and arriving at the airport have
been accordingly more than the initial targets. Considering that both beneficiary survey and
interviews confirmed by and large positive impacts on the airport’s services and local economy,
effectiveness and impact are high. Additionally, no particular problems were observed in the
institutional, technical or financial aspects of the operation and maintenance of this project; thus
sustainability of the effects realized through this project is high.
In light of the above, this project is evaluated to be highly satisfactory.

2
1. Project Description
Project location1 Passenger terminal constructed by this project
1.1 Background
In Alexandria2, which forms the north western edge of the Nile Delta3 in the northern Egypt,
there are El Nouzha Airport and Borg El Arab Airport. Before the start of this project, the
numbers of passengers at both airports had increased by an annual average of 7.3% from 1993
until 2002. There was an increasingly strong demand from the business and industry sector in
and around Alexandria and the surrounding area to increase the capacity of the airports so that
they could transport goods from nearby airports. However, passenger terminals were old at El
Nouzha Airport and its short airstrip could not accommodate large aircraft. Moreover, the
airport was surrounded by residential buildings and the area is a swampland under sea level,
which makes it structurally difficult to expand. Thus, it was presumed that this airport would not
be able to respond to the increasing air traffic demands in the future. Cargo aircraft were not
landing at the airport and cargo volume was not significant, either. Thus, there was a need to
increase the capacity of the passenger and cargo terminals at Borg El Arab Airport, thereby
responding to the increase in domestic and international air traffic demands.
1.2 Project Outline
The objective of this project is to respond to increasing demand for air traffic and improve
services at Borg El Arab Airport (located in Alexandria, the second largest city of Egypt) by
1 Made by external evaluator 2 The population of Alexandria Governorate is about 4.5 million (2015 data, source: the National Institute of Population and Social Security Research, Central Agency for Public Mobilization and Statistics (hereafter referred to as “CAPMAS”). 3 One of the largest deltas in the world, which is about 240km long in the east-west direction, has fertile soil. The total population of Egypt is about 91.5 million, of which roughly half reside on the delta; thus population concentration is high.

3
building the passenger and cargo terminal buildings and related facilities, thereby contributing
to the economic development of the governorate.
Loan Approved Amount/
Disbursed Amount 5,732 million yen / 5,718 million yen
Exchange of Notes Date/
Loan Agreement Signing Date March 2005 / March 2005
Terms and Conditions
Interest rate: 1.5%
Repayment period: 25 years (grace period: seven years)
Procurement condition: General Untied
Borrower /
Executing Agency(ies)
The Government of the Arab Republic of Egypt /
Egyptian Airports Company (hereafter referred to as
“EAC”)
Final Disbursement Date September 2013
Main Contractor
(Over one billion yen)
Besix SA-Orascom Construction Industries Joint Venture
(Egypt)
Main Consultant
(Over 100 million yen)
Japan Airport Consultants, Inc. (Japan) / Engineering
Consultants Group S.A. (ECG) (Egypt)/
Netherlands Airport Consultants B.V. (NACO) (Holland)
Feasibility Studies, etc. F/S (The Government of Egypt, September 1999)
Related Projects
[ODA Loan Project] “Borg El Arab International Airport
Expansion Project” (following project, loan agreement
signed in February 2016)
2. Outline of the Evaluation Study
2.1 External Evaluator
Kenichi Inazawa, Octavia Japan Co., Ltd.
2.2 Duration of Evaluation Study

4
Duration of the Study: September 2015 – October 2016
Duration of the Field Study: January 2 – January 15, 2016; and
March 28 – April 1, 2016
2.3 Constraints during the Evaluation Study
None.
3. Results of the Evaluation (Overall Rating: A4)
3.1 Relevance (Rating: ③5)
3.1.1 Relevance to the Development Plan of Egypt
Before the start of this project, the government of Egypt formulated the Fifth Five-year Social
Development Plan (2002-2007), which referred to this project and indicated its direction for
developing infrastructure in response to an increasing demand for air traffic. Building on the
five-year plan, the Ministry of Civil Aviation (hereafter referred to as “MOCA”) developed a list
of airport development projects including improvement of the air control system and aircrafts
owned by Egypt Air.
At the time of the ex-post evaluation, the government of Egypt’s ten-year national strategy,
with target year 2022, is stipulated in the Strategic Framework for Economic and Social
Development formulated in November 2011. In this strategy, development of transportation and
social infrastructure is listed as one of the goals. Additionally, the executing agency of this
project, EAC under MOCA, develops/revises its Annual Airport Development Plan on a yearly
basis, thereby promoting rehabilitation and development of airports in the country.
It can be seen from the above that the development and promotion of the aviation sector
continue to be viewed as important in Egypt, both at the time of the appraisal as well as at the
time of the ex-post evaluation. Therefore, it can be said that this project is consistent with the
country’s policy, such as its national and sector plans.
3.1.2 Relevance to the Development Needs of Egypt
Before the start of this project, the number of passengers using the two airports had been
growing at an annual average rate of 7.3% between 1993 and 2002. Additionally, there was an
increasing demand from the businesses and industries in the governorate and the surrounding
4 A: Highly satisfactory, B: Satisfactory, C: Partially satisfactory, D: Unsatisfactory 5 ③: High, ②: Fair, ①: Low

5
areas that the airports should be expanded so that they could transport goods domestically and
internationally via air from the nearest airports. On the other hand, passenger terminals at El
Nouzha Airport were becoming old and its airstrip was too short for large aircraft to land.
Moreover, the airport was surrounded by residential buildings the area is a swampland under sea
level, which makes it structurally difficult to expand. Thus, it was presumed that this airport
would not be able to respond to the increasing air traffic demands in the future. Cargo aircraft
were not landing at the airport and cargo volume was not significant, either. Therefore, there
was an urgent need to expand the capacity of passenger and cargo terminals at Borg El Arab
Airport, thereby responding to the increase in domestic and international air traffic demands.
At the time of the ex-post evaluation, the number of passengers, especially for international
flights, is on the increase at Borg El Arab Airport6. The majority are Egyptians migrating to the
gulf countries for work. In 2014, the number of airport passengers already reached more than
2.3 million; the airport faces a need to assure capacity by further expanding the passenger
terminal building. The government of Egypt is anticipating that the number of passengers will
continue to increase due to the demand from Low Cost Carriers (hereafter referred to as “LCC”).
Thus, a request for a succeeding ODA loan project was forwarded to the Japanese government
and its loan agreement was signed in February 20167. It is planned that the new terminal
building will be built in the future.
Therefore, it can be judged that this project is consistent with the development needs of the
country both at the time of the ex-ante evaluation and at the ex-post evaluation.
3.1.3 Relevance to Japan’s ODA Policy
Japan’s Country Assistance Programs for Egypt, formulated by the Japanese Ministry of
Foreign Affairs in June 2000, identified the following priority areas: (1) economic / social
infrastructure development and promotion of industry; (2) countermeasures against poverty; (3)
human resources development, improvement of education; (4) environmental conservation and
improvement of the living environment; and (5) promote triangular cooperation (south-south
cooperation). Additionally, the Japan International Cooperation Agency (hereafter referred to as
“JICA”) developed the Country Cooperation Strategy and Program for Egypt in March 2005,
which stated: “As Japan imports crude oil from the Middle East, its stability is crucial. For that,
economic infrastructure as well as social supports for the vulnerable and regional development
6 It will be elaborated on in Section 3.3.1 Quantitative Effects (Operation and Effect Indicators) under Effectiveness. 7 It is expected to be completed after 2020.

6
are key, because the region faces problems such as a high unemployment rate among the youth
and income disparities.”
This project contributes to regional development through building economic and social
infrastructures in Egypt and is in line with the development assistance policy of Japan.
Thus, this project has been highly relevant to the development plan and development needs
of Egypt, as well as to Japan’s ODA policy. Therefore, its relevance is high.
Source: EAC
Figure 1: Locations of Project Sites
3.2 Efficiency (Rating: ②)
3.2.1 Project Outputs
In this project, passenger and cargo terminal buildings were constructed and aprons,
taxiways and associated facilities were developed in order to respond to the increasing air traffic
Photo 1: Passenger terminal building
Photo 2: Inside the passenger terminal building

7
demand at Borg El Arab Airport. Table 1 shows the planned and actual outputs of this project.
Table 1: Planned and Actual Outputs of This Project Plan at the Time of Appraisal (2005) Actual at the Time of Ex-Post Evaluation (2016)
1) Construction of passenger terminal building: floor area of 20,840 m2, capable of accommodating approx. one million passengers per year
The plan was changed: floor area was increased (to 24,277 m2), capable of accommodating approx. one million passengers per year
2) Construction of Cargo Terminal Building: floor area of 890 m2, capable of accommodating approx. 4,000 ton per year
The plan was changed: floor area was increased (to 1,990 m2), capable of handling approx. 10,000 ton per year
3) Development of Apron and Taxiway: 1,494m x 23m
The plan was changed: length of the extension was reduced (923m x 23m)
4) Development of Associated Facilities (roads, parking space, power supply facilities, water and sewage facilities)
As planned, however additional outputs were three passenger boarding bridges and one elevator for transit passengers.
5) Consulting Services (detail design, preparation of tendering documents, assistance for tendering and contracting, construction supervision, environmental monitoring and institutional strengthening)
As planned, however additional outputs were training courses in Japan on “Airport Management Training” and “Detailed Design for the Succeeding Project.” In addition, an airport control tower was constructed in the premises with the fund of the Egyptian side.
Source: Document provided by JICA (the plan at the time of the appraisal) and answers to the questionnaires (actual at the time of the ex-post evaluation)
As shown in Table 1, there are discrepancies between the outputs planned at the time of the
appraisal and the actual outputs of this project. Explanations of the discrepancies of each output
are as follows:
1) Construction of Passenger Terminal Building
The floor area was increased for the passenger terminal building mainly because of the
following reasons: designs and layouts were changed in order to make security inspection of the
hand luggage and maintenance works smooth; an inline baggage security system was introduced,
in which security inspection of check-in baggage is done after the flight check-in, in order to
simplify the process; and there were additional outputs such as large-scale air conditioner,
power supply facilities, water and sewage pipes.

8
2) Construction of Cargo Terminal Building
The floor area of the cargo terminal building was increased mainly because it was
suggested at the time of detailed design after the start of the project that expanding the cargo
handling area would smoothen the process of loading and unloading. As a result of this
expansion, the cargo handling capacity also increased from 4,000 ton to 10,000 ton.
3) Development of Apron and Taxiway
The extension of the apron and taxiway was reduced in length because what was initially
part of this project was excluded as a result of the design review following the discussion with
the Ministry of Defense (MOD), which created a minor change in the location.
4) Development of Associated Facilities (roads, parking lots, power supply facilities, and water
and sewage facilities)
This component was implemented as planned. In order to improve services for passengers,
passenger boarding bridges (in three places) and an elevator (one set) for transit passengers were
installed as additional outputs.
5) Consulting Services
This component was implemented as planned. EAC expressed its interests in sending
airport staff to Japan for training related to the airport and “Airport Management Training8” was
implemented as an additional output. Additionally, “Detailed Design for the Succeeding Project
(Phase II)” was also implemented as an additional output.
3.2.2 Project Inputs
3.2.2.1 Project Cost
The total project cost was planned to be 8,575 million yen (of which 5,732 million was to
be covered by ODA loan) at the time of the appraisal. The actual cost, excluding that of the
additional outputs, was 12,649 million yen (of which 5,718 million was covered by ODA loan),
which was higher than planned (148% of the plan)9. The reasons include: construction sites of
the passenger and cargo terminal buildings as well as the associated facilities were reviewed at
8 Sixty participants from Borg El Arab Airport participated in the training in Japan, at venues such as Narita Airport. Both basic and advanced courses were given, covering operational aspects like airport management and flight operation as well as maintenance of airport facilities. 9 Regarding the additional outputs shown in Table 1, 44 million yen was required for 1) airport management training (approx. 500,000 USD converted at the exchange rate during the project implementation of 1USD = approx. 88JPY); about 183 million yen (approx. 2 million USD converted at the exchange rate during the project implementation of 1USD = approx.91USD) was required for 2) three passenger boarding bridges, one elevator for transit passengers and detailed design for the second phase. The total cost for 1) and 2) was about 227 million yen. Including these additional outputs, the total project cost is about 12,876 million yen. Apart from this, the Egyptian side planned and constructed a control tower, fuel station and airport access roads, etc (outside this project) using its own fund.

9
the time of detailed design conducted after the start of the project; grounds at some construction
sites turned out to have a significant difference in height, thus additional cost was required for
the leveling work; and the floor areas for the passenger and cargo terminal buildings were
increased.
3.2.2.2 Project Period
At the time of the appraisal, the project period was planned to be four years and 10 months
(58 months) from March 2005 to December 2009. In reality, the actual project period was five
years and seven months (67 months) from March 2005 to September 2010, which was longer
than planned (116% of the plan). Table 2 shows the initial plans and actual periods required for
each project component. The main reason for the delay in “4) Construction” was the design
change for the passenger terminal building, which required additional period. As a result,
designs for the associated facilities, such as power supply, water and sewage, also had to be
changed.
Table 2: Initial Planned and Actual Project Periods
Initial Plan
(at Appraisal in 2005)
Actual
(at Ex-Post Evaluation in 2016)
The Entire Project March 2005 – December
2009 (58 months)
March 2005 – September 2010
(67 months) 1) Selection of Consultants March 2005 – January 2006 May 2005 – November 2005
2) Design and Qualification
Screening February 2006 – February
2007 December 2005 – November 2006
3) Tendering Process March 2007 – February 2008
December 2006 –
August 2007
4) Construction March 2008 – December 2009
September 2007 – September 2010
[Additional Outputs10] 1) Airport Management Training May 2009 – December 2013
2) Additional Construction and
Design works for Phase II October 2012 – July 2013
Source: JICA document, answers to the questionnaires
10 In this evaluation study, additional outputs that were not planned at the time of the appraisal were not taken into account for the evaluation of efficiency.

10
This project constructed passenger and cargo terminal buildings, an apron, taxiway and
associated facilities in order to respond to the increasing air traffic demand. At the time of the
detailed design, which was conducted after the start of the project, locations for the passenger
and cargo terminals as well as other facilities were reviewed. As a result, the project cost
exceeded the initial plan. The project period was also longer than the plan because the designs
of the passenger terminal building took time. Considering that the airport is handling more
passengers than initially expected, which will be elaborated on in Section 3.3.1 Quantitative
Effects under Effectiveness, it is fair to say that the increase in the inputs (i.e., project cost and
period) were in accordance with the increase in the project outputs.
3.2.3 Results of Calculations of Internal Rates of Return (Reference only)
Financial Internal Rate of Return (FIRR)
FIRR was recalculated using the same conditions assumed at the time of the appraisal, by
taking the landing fees, parking fees, airport usage fees and rental revenues as benefits, with the
expenses required for this project (project cost) and maintenance expenses as costs, with a
project life of 20 years. The result is 2.09%, which increased from the FIRR 0.5% at the time of
the appraisal. The reasons include: though the project cost was higher than the initial estimate,
the number of domestic and international passengers has dramatically increased (the initial
estimate of approx. 1.000 million → approx. 2.495 million in 2014), and airport usage fee per
head increased between 2014 and 2015 (about 1.5 times higher than the previous year).
Economic Internal Rate of Return (EIRR)
EIRR was recalculated using the same conditions assumed at the time of the appraisal, by
taking reduction in travel time, economic effects associated with the increase in the numbers of
passengers and cargos, departures and arrivals, and contributions to the tourism industry as
benefits, the expenses required for this project (project cost) and maintenance expenses as costs,
with the project life of 20 years11. The result is 3.12%, which is lower than the rate assumed at
the time of appraisal, 16.9%. One reason is because of the increase in project cost. In addition, it
was estimated that large benefits would be attained by contribution to the tourism industry.
However, the economic downturn following the Egyptian revolution in 2011 hit the tourism
industry hard and did not yield the benefits taken into account in the EIRR calculation at the
time of appraisal. 11 The expenses are exclusive of tax.

11
Both the project cost and project period exceeded the plan. Therefore, the efficiency of the
project is fair.
3.3 Effectiveness12 (Rating: ③)
3.3.1 Quantitative Effects (Operation and Effect Indicators)
This project constructed passenger and cargo terminal buildings, an apron, taxiway and
associated facilities in order to respond to the increasing air traffic demand in the Alexandria
Governorate and to improve services. Table 3 shows the baselines, targets and actuals indicating
the quantitative effects.
Table 3: Data on Quantitative Effects of This Project (Figures in brackets are that of El Nouzha Airport at the time of Ex-Post Evaluation.)
Indicator
At Appraisal At Ex-Post Evaluation13
2002
2014 (Five Years After
Completion)
2005 2010 2012 2013 2014
Baseline Note* Target
Year of L/A
Signing
Year of Complet
ion
Two Years After
Completion
Three Years After
Completion
Four Years After
Completion
1) No. of International Passengers (thousand/yr)
350 840 233 [689]
707 [887]
1,833 [0]
2,118 [0]
2,358 [0]
2) No. of Domestic Passengers (thousand/yr)
90 150 0.6 [40]
3 [85]
127 [44]
133 [36]
137 [25]
3) Cargo Volume (thousand ton/yr)
2 4 N/A [N/A]
5.4 [0]
2.3 [0]
4.9 [0]
6.6 [0]
4) International departures and arrivals (thousand/yr)
4 8 2.3 [6.8]
6.7 [8.6]
17.9 [0]
20.6 [0]
21.0 [0]
12 The sub-rating for effectiveness is to be put with the consideration of impact. 13 Date for 2011 could not be obtained.

12
5) Domestic departures and arrivals (thousand/yr)
2 1 Note**
0.057 [1.5]
0.13 [1.8]
2.9 [7.3]
2.6 [6.6]
3.1 [5.0]
6) No. of Foreign Guests Who Stay Overnight (thousand/yr)
150 360 No of Hotels (Upper) / No of Rooms (Lower) Note*** N/A 80 45 45 45 N/A 7,590 4,252 4,282 4,282
Source: Document provided by JICA (at the time of the appraisal), answers to the questionnaires, and the Ministry of Tourism of Egypt (at the time of the ex-post evaluation). Note*: The baselines are the sums of Borg El Arab Airport and El Nouzha Airport (however, the cargo volume shows only that of El Nouzha Airport). Note**: It was aimed for domestic departures and arrivals to reduce from 2 to 1 thousand. This is because the number of passengers per aircraft was expected to increase as a result of the introduction of large aircraft. Note***: Although the actuals for “6) No of Foreign Guests Who Stay Overnight” could not be obtained, the total number of hotels and rooms existing in Alexandria could be obtained. Following are major points about each indicator:
1) The number of international passengers significantly increased to 2,358 thousand per
year in 2014 (four years after the project completion)14 as compared to the target of 840
thousand, five years after the project completion. This is because Egyptian workers migrating to
neighboring countries using Borg El Arab Airport (approx. 80-90%) and religion-related
travelers associated with Hajj and Umrah15 pilgrimage and Ramadan (approx. 5-10%) have been
increasing16. Behind that is (1) an increase in crude oil price, which accelerated the economic
growth of the gulf countries after the start of this project. Figure 2 shows the changes in nominal
GDP per capita of the two main countries in the Arabian Peninsula (Saudi Arabia and UAE) and
Egypt. GDP per capita of the two countries has been higher than that of Egypt since a few years
before the start of this project. There is possibility of existing background reason and factor why
Egyptian workers tend to migrate to the two countries for better incomes. Another reason is that
(2) LCC, which has been increasing its market share since 2008, began flying into this airport.
At this airport, it is assumed that an increasing number of people are travelling from the
Alexandria Governorate and surrounding areas to the gulf countries using LCC, which offers
lower fares. Alexandria is economically the second largest city in Egypt and one of the main
industrial cities. Geographically speaking, it is an important spot in the delta, located at the Nile
14 2014 was the most recent year for which data was available for all indicators. 15 Hajj is an Islamic pilgrimage and is one of the five pillars of Islam. It is one of the five major duties of Muslims. One must carry it out at least once in his/her lifetime. Umrah is also an Islamic pilgrimage however can be carried out any time during the year (there is no designated month for the pilgrimage). Destinations are either Mecca or Medina and the majority will head to Jeddah, being an air stoop, by air. 16 The evidence of proportions of the Egyptian migrant workers and the religious travelers were obtained during the interviews with EAC.

13
River estuary. Additionally, it is thought as one of the reasons that residents in the delta
(passengers) who used to fly from El Nouzha Airport and Cairo Airport before the completion
of this project began using Borg El Arab Airport, which is easier for them to access. In other
words, the airport is strategically located. Furthermore, it is also thought that the Egyptian
economy stagnated due to the Egyptian revolution in 2011 and more workers now use this
airport to go out of the country to earn foreign currency. In light of the above, this airport is
judged to be responding sufficiently to the air traffic demand of the area. As the number of
international passengers increased, “4) No. of International Departures and Arrivals” exceeded
the initial targets. At El Nouzha Airport, stopped operating international flights in 2011;
international flights became concentrated at Borg El Arab Airport. Thus, no international
passengers are observed at El Nouzha Airport at the time of the ex-post evaluation.
The actual figure for “2) No. of Domestic Passengers” is quite close to the initial target. On
the other hand, although “5) Domestic Departures and Arrivals” was aimed to be reduced from 2
to 1 thousand at the time of the appraisal, in reality it increased. This is because LCC and
inter-regional flights became popular for domestic flights and started arriving at this airport, for
which small or medium-sized17 aircraft are mainly used, despite the fact that the number of
passengers per aircraft was expected to increase with the introduction of large aircrafts.
Although “3) Cargo Volume” decreased due to the influence of the Egyptian revolution 17 They refer to aircrafts that cannot transport a large number of passengers at once.
Source: IMF (Reference) Figure 2: Changes in Nominal GDP per capita of UAE, Saudi Arabia and Egypt (Before the start of the project – Completion of the project)

14
(2011) after the completion of project, it has been increasing recently and is judged in line with
what was initially expected.
Data on “6) No. of Foreign Guests Who Stay Overnight” could not be obtained. On the
other hand, the overall number of hotels and hotel rooms in the Alexandria Governorate could
be obtained. The impacts of the Egyptian revolution and the deteriorated security situation in the
aftermath are thought to have affected the tourism industry. As a result, the number of hotels and
hotel rooms are either stagnating or decreasing. Thus, the same is presumed for the number of
foreigners who stay overnight. It can be said that the contribution of this project to the tourism
industry is not as significant as what was initially expected.
Concluding from the above, the increase in the number of passengers is prominent at Borg
El Arab Airport because it is strategically located and caters to the economy of Alexandria and
the Nile River estuary in the delta. Although it is thought that the number of international
tourists has been declining due to the political instability and the changes in the security
situations, increase in the number of passengers and flights based on the Egyptians who use this
airport to migrate for work is confirmed to exceed that decline. At the time of the ex-post
evaluation, LCC are intermittently requesting to start services on new routes. According to the
management of Borg El Arab Airport, new requests are not being accepted at the time of the
ex-post evaluation because the existing facilities will not be able to accommodate them. This
airport is clearly needed by those who use LCC with lower fares. Thus, the effect of this project
is judged to be significant.
3.3.2 Qualitative Effects
1) Improvement of Convenience and Comfortableness at Borg El Arab Airport
Photo 4: Cargo terminal building built by this project
Photo 3: In front of the check-in counter

15
In this evaluation study, Borg El Arab Airport users and local companies, including the
tourism industry, were interviewed for a survey using questionnaires. In total, 100 samples
(valid responses) were collected, of which 70 were from airport users18. Thirty samples were
drawn from (1) local companies that have been using Borg El Arab Airport since before the
completion of this project19; 18 samples from (2) passengers (airport users) who have been
using the airport since before the completion of this project20 and 52 samples from (3)
passengers (airport users) who began using the airport after the completion of this project21.
As shown in Figure 3, the level of satisfaction with this project is high among all categories,
(1), (2) and (3). Figure 4 is in relation to convenience (targeting (1) and (2)) and many
responded that it has “largely improved”. Many people pointed out that check-in and
hand-luggage inspection take less time now and that it has become easier to find routes to
boarding gates. Some also mentioned that facilities are now easier to use and more comfortable,
with more restaurants and shops. Compared to before the completion of this project, process
through boarding has improved and airport users can now use the facilities more comfortably.
Figure 5 is about punctuality of flight departures and arrivals (targeting (1) and (2)). More
people answered “Yes”, thus it can be presumed that the airport management is being improved.
Figure 6 is in relation to airport services (targeting (1) and (2)); more people said it has “largely
improved”, thus it can be considered that airport staff are providing better services as compared
to before the completion of this project. Figure 7 is regarding frequency of travel (targeting (2)
and (3)). While most people answered their travel frequency has “increased”, many of the
category (3) respondents said that it has “not increased”. This is presumably because passengers
who used to use El Nouzha Airport or Cairo Airport simply have switched to Borg El Arab
Airport and their frequency of travel remains unchanged. Therefore, it can be judged that this
18 Airport users polled were the ones who were at the airport on the date of the questionnaire-based interviews. Local companies were visited for the questionnaire-based interviews. In total, 100 people were purposively sampled. Since there were many male airport users and those working at local companies, the sampling target naturally became larger for male. (In regard to the passengers waiting for their flights at departure and arrival lobby areas, samples were drawn without considering gender proportion.) 19 The respondents were: (1) sex: 81% male, 19% female; (2) age: 17% in their 20s, 52% in their 30s, 17% in their 40s, 14% in their 50s; (3) occupation (industry): 40% tourism, 7% taxis, 3% restaurants, 3% real estates, 3% hotels, 7% banking, 13% aviation, 3% IT, 21% others. 20 The respondents were: (1) sex: 72% male, 22% female, 6% no indication; (2) age: 11% in their 20s, 39% in their 30s, 22% in their 40s, 11% in their 50s, 11% in their 60s, 6% no indication; (3) occupation (industry): 44% self-owned business; 39% private company employees, 9% unemployed, and 8% others. 21 The respondents were: (1) sex: 80% male, 10% female, 10% no indication; (2) age: 4% in their 20s, 44% in their 30s, 42% in their 40s, 4% in their 50s, 2% in their 60s, 4% no indication; (3) occupation (industry): 75% private company employees, 10% self-owned business, 15% others and unemployed. During the beneficiary survey, it was attempted to collect more samples from the passengers who have been using the airport since before the completion of this project however this was not successful (in other words, it is likely that more users have started using the airport after the completion of this project). Thus, the sample composition became 18 against 52.

16
project is indirectly contributing to the improvement of the airport operation, services and
comfortability.
Figure 3: Are you satisfied with this project?
Figure 4: Do you think that the convenience of Borg El Arab Airport improved from before
the completion of this project?
Figure 5: Do you think flight departures and arrivals are more punctual than before the
completion of this project?
Figure 6: Do you think airport services are better than before the completion of this
project?
Figure 7: Do you think you travel more often than before the completion of this project?

17
2) Improvement in Airport Management
Operation and maintenance staff of Borg El Arab Airport commented in the interviews:
“After the completion of the passenger terminal building, passengers became able to proceed
from check-in to boarding smoothly. The facilities in the cargo terminal building are easy to use
and loading/unloading is carried out smoothly without delays.” On the other hand, some
commented, “The number of passengers has been increasing every year. Given the scale of the
passenger terminal building developed by this project, congestion is becoming a problem for
certain hours. We often observe long queues in front of check-in counters. As there are only two
lanes for the baggage claim, it gets congested when many flights arrive at similar timings.” The
management of the airport and EAC headquarters commented in the interviews: “Many
domestic and international airlines have been requesting to launch new domestic and
international routes using this airport. While we welcome the great demand for air traffic,
considering the capacity of the existing facilities, we will not be able to accommodate
increasing number of passengers. Thus we are not giving approvals to any requests thus far. As
per the International Air Transport Association (IATA22) regulations, we are reviewing arrival
and departure times, such as trying to shift daytime flights to nighttime. In addition, we are
increasing the number of airport staff every year, thereby improving airport management. On
the other hand, we are really waiting for the expansion of the passenger terminal building (the
succeeding project), which will be a fundamental solution to the issue.” During the site visits
conducted as part of the field study, congestion was observed during some hours (particularly in
the morning) when flight arrivals and departures were concentrated. On the other hand, it was
also observed that the airport management was appropriate in handling commercial and cargo
flights.
With regard to “Airport Management Training”, described in Section 3.2.1 Project Outputs
under Efficiency, training participants were interviewed during the evaluation study23. They
commented, “We utilize what we learned from the training in our day-to-day work. For example,
we are using the knowledge in providing good customer service, operating airport facilities and
managing various facilities.” While it is observed that training provided under this project is
contributing to the operation and maintenance of the airport to a certain degree, the number of
passengers is on the increase. Thus, it is judged that efforts should continue to further improve
the airport services in the future. 22 Airlines and travel agents are the main members of the organization. 23 The airport employees interviewed include a manager of flight operation, a supervisor of the maintenance department and a manager of the customer service department.

18
As shown in Photo 6, it was witnessed during the field study that loads of baggage were left
on the floor near the baggage claim area inside the airport. The main problem is the drastic
increase in the number of passengers after the completion of the project, however according to
the airport, most of the luggage was either forgotten or abandoned by passengers24. According to
the management of the airport, there is a penalty for those who leave their luggage for more than
three days. Apart from this, it is considered that taking measures to remind passengers of their
belongings upon arrival is also worthwhile.
3.4 Impacts
3.4.1 Intended Impacts
3.4.1.1 Contribution to Local Economy and Social Development
1) Qualitative Effects
Targeting the same categories of people as the beneficiary survey described in Section 3.3.2
Qualitative Effects, an interview survey was conducted on tourism development and
improvement in functions as an international airport and development of local economy25.
Figures 9-11 summarize the results.
24 There is a designated store room near the baggage claim, however it is constantly full as luggage is left behind on a daily basis. Left-behind baggage includes suitcases, souvenirs and holy water purchased during pilgrimage. 25 The characteristics of the respondents are the same as those for the beneficiary survey described in Section 3.3.2 Qualitative Effects.
Photo 5: Boarding hall inside the passenger terminal building
Photo 6: Baggage left near the baggage claim area
19
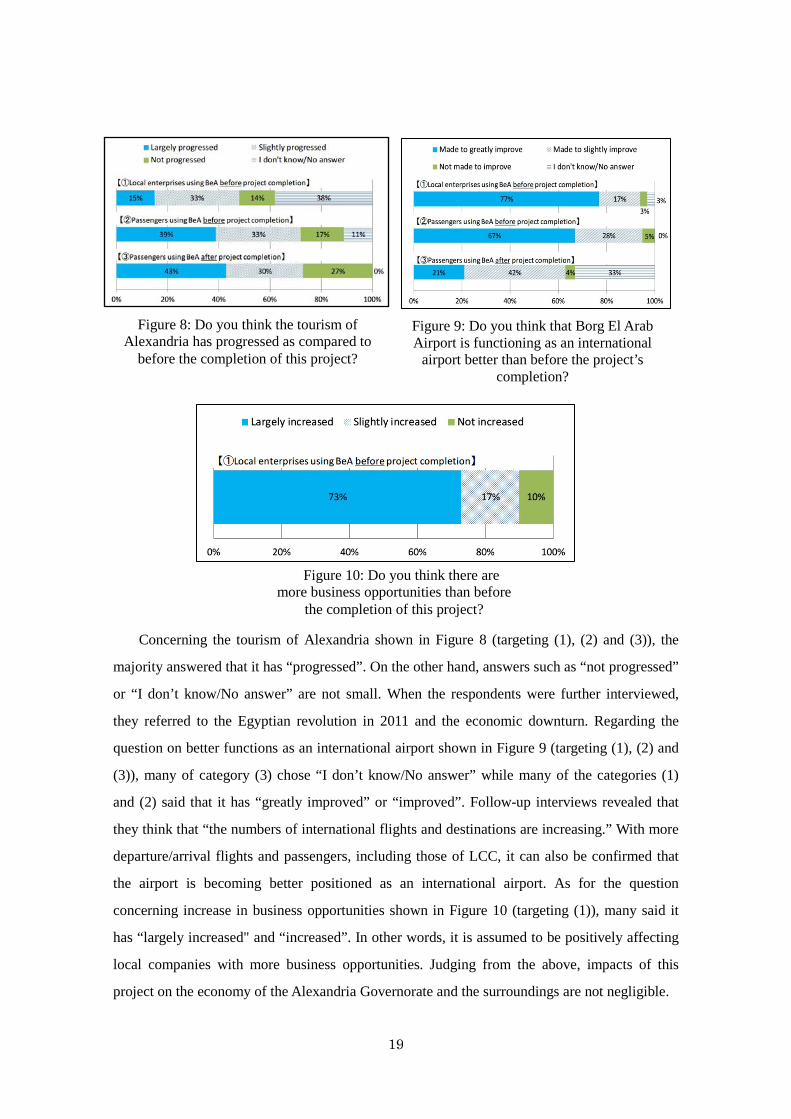
Concerning the tourism of Alexandria shown in Figure 8 (targeting (1), (2) and (3)), the
majority answered that it has “progressed”. On the other hand, answers such as “not progressed”
or “I don’t know/No answer” are not small. When the respondents were further interviewed,
they referred to the Egyptian revolution in 2011 and the economic downturn. Regarding the
question on better functions as an international airport shown in Figure 9 (targeting (1), (2) and
(3)), many of category (3) chose “I don’t know/No answer” while many of the categories (1)
and (2) said that it has “greatly improved” or “improved”. Follow-up interviews revealed that
they think that “the numbers of international flights and destinations are increasing.” With more
departure/arrival flights and passengers, including those of LCC, it can also be confirmed that
the airport is becoming better positioned as an international airport. As for the question
concerning increase in business opportunities shown in Figure 10 (targeting (1)), many said it
has “largely increased" and “increased”. In other words, it is assumed to be positively affecting
local companies with more business opportunities. Judging from the above, impacts of this
project on the economy of the Alexandria Governorate and the surroundings are not negligible.
Figure 8: Do you think the tourism of Alexandria has progressed as compared to
before the completion of this project?
Figure 9: Do you think that Borg El Arab Airport is functioning as an international
airport better than before the project’s completion?
Figure 10: Do you think there are more business opportunities than before
the completion of this project?

20
2) Quantitative Effects
Figure 11 shows changes in the GDP growth rate of Egypt as a whole from before the start
of this project until recently. There are no GDP data exclusively for the Alexandria
Governorate26. It is possible that the governorate’s GDP has been growing in a similar manner
to that of the country; however, it is not easy to prove that it was related to this project27. It is
judged that the economic stagnation after 2011 was caused by the political/economic/security
situations in the aftermath of the Egyptian revolution. On the other hand, companies in and
around Alexandria (hotels, banks and tourism industry) commented in interviews: “The
construction of the passenger terminal building at Borg El Arab Airport is a chance for the local
businesses. Alexandria has an increasing number of visitors and the number of international and
domestic conferences and events held in Alexandria is increasing. One can say that this airport
is one factor revitalizing the local economy. Although the country’s economy is stagnating, the
completion of this project has given the local business sector many possibilities. As many LCC
flights have begun using this airport, more people are travelling to the gulf countries, such as
Jeddah and Kuwait, with lower fares and it has become more affordable to migrate for work. In
that sense, the airport is creating opportunities for many people.” Based on such comments, it is
presumed that this project is directly and indirectly supporting economic and social
development in the Alexandria Governorate.
Source: World Bank
Figure 11: GDP Growth Rate of Egypt
26 It is because regional data is not sufficiently collected and managed in Egypt. 27 According to the management of CAPMAS and EAC, “There is little variation among the regions in terms of GDP growth rate. It is thought that the trends are almost the same for the Alexandria Governorate and the national average GDP growth rate.”

21
Figure 12 shows data on remittances from Egyptians working aboard. The amount has been
increasing since the start of this project. Since the Egyptian revolution in 2011, an increasing
number of people have been migrating to the gulf countries due to the economic downturn,
which it is assumed that the remittances to Egypt have been increasing. Data on the changes in
number of migrant workers could not be obtained; however, according to the most recent data
released by CAPMAS, there are about 2.7 million Egyptian migrant workers in the world, of
which roughly 1.9 million are in the gulf countries. In any case, considering that the amount of
remittances is on the increase after the completion of the project (September, 2011) as shown in
Figure 12, the number of Egyptians going to neighboring countries for work (80-90% of the
total airport users) using Borg El Arab Airport is expected to be sustained at the current 1.9
million level. It is thought that this project contributes to the supports for household incomes
and national economy through remittances.
Source: IECONOMICS
Figure 12: Remittances to Egypt 3.4.2 Other Impacts
3.4.2.1 Impacts on the Natural Environment
For this project, it was necessary to develop a report specifying construction methods,
whether or not environmental issues were foreseen and to get approval from the Egyptian
Environmental Affairs Agency (EIA). The approval for EIA was granted in October 2004,
before the start of the project.
The questionnaires, EAC interviews and site inspections confirmed that there was no
negative environmental impact after the completion of this project. No negative impacts in

22
terms of air pollution, water quality, noise/vibration or ecological systems were observed28.
With regard to the institutional arrangement concerning environmental monitoring, EAC’s
environmental department handles a wide range of tasks, from environmental screening for new
projects to waste management planning and implementation. In addition, MOCA, a supervising
body, conducts external monitoring by sending inspectors periodically. In case of problems,
immediate action will be taken. Since there have been no problems thus far after the completion
of the project, no measures have been taken based on the findings of environmental monitoring.
3.4.2.2 Land Acquisition and Resettlement
It was confirmed through questionnaires and EAC interviews that there were no cases of
land acquisition or resettlement in this project, because it was an upgrading of the existing
airport.
This project has largely achieved its objectives. Therefore, the effectiveness and impact of
the project are high.
3.5 Sustainability (Rating: ③)
3.5.1 Institutional Aspects of Operation and Maintenance
The executing agency of this project is EAC, and its Borg El Arab Airport branch carries
out the operation and maintenance of the airport. At the time of the ex-post evaluation, there
were 321 staff members at the branch, of which 75 were in the operation department which
operates passenger aircrafts, while 136 are in the maintenance department which maintains the
airport’s overall facilities29. A wide range of tasks are carried out, including operation and
maintenance of airstrip lights, boarding bridges and other machines and equipment inside the
airport, operation of IT infrastructure networks, management of each floor inside the airport
(e.g., check-in desks, baggage claim, passport control and departure/arrival halls). It was
confirmed through the questionnaires and interviews with EAC and airport branch staff during
the evaluation study that the numbers of staff are sufficient both for the operation and
maintenance departments. Given the recent increase in passenger numbers, EAC is making
efforts by recruiting new staff, so that the airport services will not be compromised due to staff
shortage. Therefore, it is thought that there are no particular problems in the institutional aspects 28 Around Borg El Arab Airport there are no residential areas or commercial facilities and there has been no case of
noise/vibration or health hazards. 29 Data as of the end of 2015 (source: EAC).

23
of the operation and maintenance of this project.
3.5.2 Technical Aspects of Operation and Maintenance
A number of training courses are offered to EAC employees. For example, EAC gives
training courses on “Airport Management”, “Aviation Radio Maintenance” and “Electric
Machines (Basics and Advanced)”. Other government institutions (e.g., the Ministry of
Environment) give training on “Environmental Monitoring Inspection”, “Feasibility Study for
Environmental Projects” and “Environmental Management of Dangerous Substances and
Wastes”. In addition, international organizations offered training courses on “Airstrip Light
Management”, “Airport Security System” and “Building Monitoring and System” recently
(after 2010 or the completion of the project). On-the-job training (OJT) is also provided. When
new staff are recruited, OJT will be given, whereby maintenance technologies and skills are
shared. It was also confirmed through interviews that participants in JICA’s “Airport
Management Training” (additional output) described in Section 3.2.1 Project Outputs under
Efficiency shared the knowledge and experience gained through their training with other staff,
while using it as a vehicle for work motivation and improving work quality. Additionally, at this
airport, maintenance works are carried out based on the operation and maintenance manual that
the contractor of this project provided. Safety procedures and maintenance related to aircraft
operation are in line with the standards set by the International Commercial Airlines
Organization (ICAO). Thus, no major problems are observed in the technical aspects of the
operation and maintenance of this project.
3.5.3 Financial Aspects of Operation and Maintenance
Table 4 shows the operation and maintenance costs of Borg El Arab Airport. Table 5 is the
income statement of EAC and Table 6 is its balance sheet.
Table 4: Operation and Maintenance Costs of Borg El Arab Airport (Last three years)
(Unit: Thousand LE) Item 2013 2014 2015
Operation Cost
Salaries 14,123 14,226 15,582 Electricity 2,926 3,287 4,909
Water Utility 192 103 239 Cleaning 2,213 2,933 2,504
Maintenance Cost 1,738 6,600 12,929 Source: EAC

24
Table 5: Financial Revenue and Expenditure Statement Sheet of EAC (Unit: Thousand LE)
Item End of June 2013
End of June 2014
End of June 2015
Operational Profit
1,449,725 1,454,678 2,017,960
Operational Cost (585,112) (616,438) (930,502) Profit from Sales 864,613 838,240 1,087,458
Other Profit 201,928 173,813 334,413 Other Costs (679,180) (686,662) (819,079) Current Net
Income 387,361 325,391 602,792 Source: EAC
Table 6: Balance Sheet of EAC
(Unit: Thousand LE) Item End of June
2013 End of June
2014 End of June
2015 Fixed Assets 5,422,360 6,223,815 6,235,819
Current Assets 1,871,389 2,143,448 2,973,096 Assets 7,293,749 8,367,263 9,208,915 Fixed
Liabilities 2,928,949 2,034,654 2,207,694
Current Liabilities
2,150,949 2,629,733 2,629,852
Shareholders’ Equity 2,213,851 3,702,876 4,371,369
Liabilities and Equity 7,293,749 8,367,263 9,208,915
Source: EAC
The operation cost shown in Table 4 is more or less on the increase. This is because the
number of passengers has been increasing at Borg El Arab Airport and so necessary budgets
have been allocated. Regarding the maintenance costs, while not much cost was caused because
the facilities and equipment developed by this project were covered by warranty until mid-2014
(guarantee period was two years), needed maintenance budgets (12,929 thousand LE shown in
Table 4) were allocated starting from mid-2014, when the warranty period ended30. EAC and
the management of the airport commented in the interviews: “Every year we are able to allocate
sufficient budgets. With more users, we think it is important that necessary budgets are duly
allocated.” Thus, it is reasonable to think that appropriate operation and maintenance costs have
been expended. Concerning the income statement shown in Table 5, the current net income has
been positive every year. Additionally, the balance sheet shown in Table 6 shows that equity has
30 Operation and maintenance is carried out using internal funds. The questionnaires and interviews confirmed that
the central government and other institutions (such as international organizations) do not provide subsidies to this project’s operation and maintenance organization.

25
been increasing; hence there is no financial concern for the near future. Therefore, it can be
judged that the EAC is in a good financial situation and that there are no major concerns in the
financial aspects of the operation or maintenance of this project.
3.5.4 Current Status of Operation and Maintenance
There are no major problems in terms of the operation and maintenance status of the
facilities developed by this project. Maintenance works for the facilities developed by this
project (passenger and cargo terminal buildings, apron and taxiway) are carried out during the
daytime, when few flights are operated. EAC develops an annual operation and maintenance
plan, based on which Borg El Arab Airport branch implements the operation and maintenance
tasks. In addition, spare parts are procured smoothly and there is no problem with the ways in
which they are stored31.
No major problems have been observed in the institutional, technical or financial aspects of
the operation and maintenance system. Therefore, the sustainability of the project’s effects is
high.
4. Conclusion, Lessons Learned and Recommendations
4.1 Conclusion
This project constructed and expanded the passenger and cargo terminal buildings and the
connected facilities for Borg El Arab Airport near Alexandria, the second largest city in Egypt,
in order to respond to increasing demand for air traffic and to improve the quality of services.
With regard to relevance, the government of Egypt has indicated its intention to develop
infrastructures to cope with an increasing air traffic demand in the Fifth Five-year Social
Development Plan and the Strategic Framework for Economic and Social Development. While
it was expected, before the start of this project, that the number of passengers that this airport
would be capable of accommodating would increase, further expansion of this airport was
planned at the time of the ex-post evaluation. The project is also in line with the assistance
policy of the Japanese Government. Thus, relevance is high. As for efficiency, the project cost
was slightly higher than the initial plan because the locations of the passenger and cargo
terminals, as well as the associated facilities, were reviewed and changed during the detailed
31 Most of the spare parts can be procured domestically. When they need to be procured internationally, they can be procured within three months. Spare parts are kept in a store inside the airport.

26
design after the start of this project. The project period was also slightly longer than the initial
plan due to a change in design of the passenger terminal. Thus, the efficiency is fair. Since the
start of this project, as the number of Egyptian workers migrating to gulf countries has been
increasing, the numbers of passengers and flights departing from and arriving at the airport have
been accordingly more than the initial targets. Considering that both beneficiary survey and
interviews confirmed by and large positive impacts on the airport’s services and local economy,
effectiveness and impact are high. Additionally, no particular problems were observed in the
institutional, technical or financial aspects of the operation and maintenance of this project; thus
sustainability of the effects realized through this project is high.
In light of the above, this project is evaluated to be highly satisfactory.
4.2 Recommendations
4.2.1 Recommendations to the Executing Agency
Considering that the number of passengers is on the increase at Borg El Arab Airport, it is
recommended that the EAC continue to make efforts toward smooth airport operation and
improve airport services. Given the loads of luggage left behind at the baggage claim area, it is
considered necessary to take measures to remind passengers arriving at the airport to be aware
of their belongings.
4.2.2 Recommendations to JICA
None.
4.3 Lessons Learned
Contribution to Improved Airport Service through Training, Considering the Introduction of
Training at the Time of Project Formulation
In this project, “Airport Management Training” was conducted as an additional output and
many employees working at Borg El Arab Airport participated in the training. It is thought that
such training is contributing to some extent to the improved airport services for the flight check
in, passenger guiding and hand luggage inspection, which are day-to-day operation and
maintenance works. Considering that the numbers of flight departures/arrivals and passengers
have been drastically increasing at the time of the ex-post evaluation, it is fair to say that such
training was essential for ensuring and strengthening airport services. The experiences of the
training participants can be fundamental for the implementation of the following airport

27
expansion project; thus it was insightful to have planned for such training during the project
formulation. Therefore, it is suggested that JICA and the partner country consider supports
regarding building capacities to provide improved airport services through implementation of
the training as needed when formulating similar projects in the future.

28
Comparison of the Original and Actual Scope of the Project
Item Plan Actual
1.Project
Outputs
1) Construction of Passenger Terminal Building: floor area of 20,840m2, capable of accommodating approx. one million passengers per year
The plan was changed: floor area was increased (to 24,277 m2), capable of accommodating approx. one million passengers per year
2) Construction of Cargo Terminal Building: floor area of 890 m2, capable of accommodating approx. 4,000 ton per year
The plan was changed: floor area was increased (to 1,990 m2), capable of handling approx. 10,000 ton per year
3) Development of Apron and Taxiway: 1,494m x 23m
The plan was changed: length of the extension was reduced (923m x 23m)
4) Development of Associated Facilities (roads, parking space, power supply facilities, water and sewage facilities)
As planned, however additional outputs were three passenger boarding bridges and one elevator for transit passengers.
5) Consulting Services (detailed design, preparation of tendering documents, assistance for tendering and contracting, construction supervision, environmental monitoring and institutional strengthening)
As planned, however additional outputs were training courses in Japan on “airport management and components” and “detailed design for the second project, succeeding to this project.” In addition, an airport control tower was constructed in the premises with the fund of the Egyptian side.
2.Project Period
March 2005 – December 2009 (58 months)
March 2005 – September 2010 (67 months)
*Exclude additional outputs
3.Project Cost
Amount Paid in
Foreign
Currency
5,732 million yen
5,712 million yen

29
Amount Paid in
Local Currency
Total
Japanese ODA
Loan Portion
Exchange Rate
2,843 million yen
8,575 million yen
5,732 million yen 1USD=110JPY, 1LE=17.7JPY
(As of March 2005)
7,164 million yen
Expense in USD: 289 million yen
12,876 million yen
5,718 million yen 1USD=98.46JPY, 1LE=16.95JPY
(Average during the project’s implementation. Source:
International Financial Statistics, IMF)
*Includes additional outputs

1
Republic of Armenia
FY2015 Ex-Post Evaluation of Japanese ODA Loan
“Yerevan Combined Cycle Co-Generation Power Plant Project”
External Evaluator: Kenichi Inazawa, Octavia Japan Co., Ltd.
0. Summary
This project constructed a new combined cycle co-generation power plant (hereafter referred
to as “CCPP”) in a suburb of the capital Yerevan, with a view to enhancing the power supply
capacity. This project is consistent with power sector development policies in Armenia, such as
the “Integrated Financial Rehabilitation Plan for Public Utilities” (2003-2007) and the “Main
Direction for Developing the Energy Sector in the Period up to 2036” (2015). Before the start of
the project, the Yerevan Thermal Power Plant, which had been operational since early 1960s,
was aging, and there was a need to construct new power facilities in order to stabilize the power
supply. At the time of the ex-post evaluation, the Armenian government plans to develop and
attract investments for new power sources; and thus this project is consistent with the
development needs of the country. Additionally, given that this project is also harmonized with
the assistance policy of Japan, the relevance of this project is high. The actual project costs fell
within the planned budget, as did the project period; the efficiency is also therefore high. With
regard to the project effectiveness, the maximum output, capacity factor (power generation),
availability factor, auxiliary power ratio, forced outage hours and frequency by cause, as well as
net generation, either met or exceeded the initial expectations, on the whole. On the other hand,
the maximum heat output per hour, plant capacity factor (heat supply portion), gross thermal
efficiency and heat supply did not reach the initial targets, mainly due to the shutdown of the
Nairit Chemical Plant. Therefore, the effectiveness and impact are fair. Since no particular
problems are observed in the institutional, technical and financial aspects of operation and
maintenance, the sustainability of the effects of this project is high.
In light of the above, this project is evaluated to be highly satisfactory.

2
1. Project Description
Project Location Yerevan Combined Cycle Co-Generation Power Plant
1.1 Background
In Armenia, since many of the power generation facilities were deteriorated with decreasing
reliability of the power facilities and supply capacity, there was a need to increase the capacity
of the power supply and to address the issue of power shortages by developing new power
supply facilities. Yerevan Thermal Power Plant, located in a suburb of the capital Yerevan,
began its operation in the 1960s as a co-generation thermal power plant using natural gas as fuel.
The plant was becoming old and operating with a significantly decreased power supply capacity.
Since the capital Yerevan roughly accounts for one third of the national population1 and about
half of the country’s demand for power, there was a need to develop new power generation
facilities near Yerevan, as the area of highest demand, thereby stabilizing the power supply in
and around the city.
1.2 Project Outline
The objective of this project is to increase the country’s power supply capacity by
constructing a new CCPP near the capital, Yerevan, thereby contributing to the alleviation of
future electricity shortages and to sustainable economic growth.
Loan Approved Amount/
Disbursed Amount 26,409 million yen / 26,399 million yen
Exchange of Notes Date/
Loan Agreement Signing Date March, 2005 / March, 2005
1 Approximately 3.2 million (2004 data; Source: International Monetary Fund)

3
Terms and Conditions
Interest rate: 0.75%
Repayment Period: 40 years (Grace Period: 10 years)
Conditions for Procurement: General Untied
Borrower /
Executing Agency(ies)
The Government of the Republic of Armenia / Yerevan Thermal Power Plant Closed Joint Stock
Company (hereafter referred to as “YTPP”)
Final Disbursement Date July, 2013
Main Contractor
(Over one billion yen)
Mitsui & Co., Ltd. (Japan) / GS Engineering and
Construction Corporation (South Korea)
Main Consultant
(Over 100 million yen)
Tokyo Electric Power Services Co., Ltd. (Japan)
Feasibility Studies, etc. F/S (January, 2003)
Related Projects
【ODA Loan Projects】
・ “Electricity Transmission and Distribution Project2”
(The loan agreement was signed in 1999)
2. Outline of the Evaluation Study
2.1 External Evaluator
Kenichi Inazawa, Octavia Japan Co., Ltd.
2.2 Duration of Evaluation Study
Duration of the Study: September, 2015 – October, 2016
Duration of the Field Study: January 16 – January 30, 2016; and
April 2 – April 8, 2016
3. Results of the Evaluation (Overall Rating: A3)
3.1 Relevance (Rating: ③4)
3.1.1 Relevance to the Development Plan of Armenia
2 It was co-financed by the World Bank and aimed to develop electricity transmission and distribution networks in all parts of Armenia, to stabilize electricity power and improve reliability, and to strengthen the management capacity of the power transmission and distribution company. 3 A: Highly satisfactory, B: Satisfactory, C: Partially satisfactory, D: Unsatisfactory 4 ③: High, ② Fair, ① Low

4
Before the start of this project, the government of Armenia had formulated a national plan for
public services entitled “The Integrated Financial Rehabilitation Plan for the Public Sector”
(2003-2007), which prioritized energy security and planned the construction of new power
generation facilities. The plan stated that this project would be given priority and executed as a
national project from the perspective of energy security.
At the time of the ex-post evaluation, the government of Armenia has formulated the
document “Long-Term Development Program/Plan for Energy Sector through 2036” (2015),
which has set out the future direction of the power sector and highlighted the importance of
energy security - increasing power supply by importing more natural gas.
Based on the above, the development of the power sector formed an important part of
Armenia’s national development plan at the time of the appraisal as well as at the time of
ex-post evaluation. Therefore, this project has been consistent with the country’s policy.
3.1.2 Relevance to the Development Needs of Armenia
Before the start of this project, many of the power generation facilities in Armenia had been
in operation for more than 30 years. Power supply capacity and the reliability of the facilities
were markedly decreasing. There was therefore a need to promote the development of new
power generation facilities, thereby increasing the power supply capacity and alleviating power
shortages. In particular, Yerevan Thermal Power Plant, a co-generation thermal power plant
using natural gas as fuel, which had 550MW capacity when it began operating in the 1960s, had
become outdated. Due to aging power generation unit, its maximum capacity was only 85MW
before the start of this project. It was therefore predicted that demand for power would not be
met by the existing generation facilities in the future. In particular, there was a need to construct
new power facilities and stabilize power supply to the capital Yerevan, which roughly accounts
for one third of the national population and about half of the country’s demand for power. Heat
supply was managed in accordance with the operation status of the largest energy-consuming
entity Nairit Chemical Plant (accounting for more than 90% of the heat supply)5; and it was
projected that the heat supply would not meet future demand. Thus, there was a need to
construct the combined heat and power facilities to replace the existing power plant which was
expected to stop operation in the future.
5 Located near YTPP, this large chemical factory mainly produces synthetic rubbers such as latex and chloroprene. It was a state-owned company during the era of the former Soviet Union and later became a private company, having been acquired by a Russian corporation. At the time of the appraisal, products from this factory were sold domestically and internationally, including Russia and Ukraine.

5
It has been confirmed at the time of the ex-post evaluation that this project is contributing to
the stabilization of power supply within the country and is exporting electricity to neighboring
countries, as a result of the construction of the 220MW CCPP, with lower environmental impact
and more heat efficiency under this project6. Out of the net power generation of the entire
country in 20157 (7,798.19GWh/year), 1,594.6GWh/year (roughly 20%), was supplied by this
project. Apart from this thermal plant, there are a Hrazdan CCPP No.58 and a Hrazdan TPP9.
The latter is more than 40 years old, and will cease operation in 2017 due to deterioration. The
government of Armenia is therefore planning to develop new power sources at the time of this
ex-post evaluation, and as a way of strengthening and stabilizing the country’s power facilities,
CCPP construction is under consideration at a site adjacent to this project.
Based on the above, securing a stable electricity supply remains a priority for Armenia at the
time of this ex-post evaluation, and this project continues to be important. Therefore, this
project is consistent with the development needs of the country at the time of both the appraisal
and the ex-post evaluation.
3.1.3 Relevance to Japan’s ODA Policy
Based on the ODA Charter approved by the Cabinet in 1992 and the “Medium-Term Policy
on Official Development Assistance” formulated in the same year, JICA developed the
“Strategy for Overseas Economic Cooperation Operations”, laying out the overall direction of
ODA loans and priority regions and sectors. In this strategy the following were identified as
priority sectors: (1) strengthening of the economic structure for sustainable growth and the
removal of impediments to this growth (appropriate macroeconomic management,
strengthening of the economic infrastructure, improved economic infrastructure); (2) poverty
alleviation and mitigation of regional disparities; (3) environmental conservation including
disaster prevention and disaster management; and (4) human resources development and
institution building.
6 This will be explained further in Section 3.4.1.1 Alleviation of Future Power Shortage under Impacts. The main power sources of Armenia are nuclear, thermal and hydro power. Total installed capacity by source is: nuclear power approximately 400MW (one place); thermal power 1,500MW (three places); and hydro power 1,880MW (11 places) at the time of the ex-post evaluation. 7 Net power generation is the total gross power generation produced minus the electricity consumed within the plant. 8 The approximate capacity is 285MW, and net generation is 638GWh/year (2015). It began operation in 2012. 9 The capacity is roughly 810MW and net generation is approximately 547GWh/year (2015). It began operation in 1969.

6
This project supports Armenia in its aim to stabilize power supply and promote economic
growth by developing power infrastructures. Since it is in line with priority above, it can be said
that this project was consistent with Japan’s ODA policy.
In light of the above, this project has been highly relevant to the development policies and
development needs of Armenia, as well as to Japan’s ODA policy. Therefore, its relevance is
high.
3.2 Efficiency (Rating: ③)
3.2.1 Project Outputs
This project constructed a CCPP with a power generation capacity of 205MW level of
electricity and heat supply capacity of 103 Gcal/h on a vacant plot of land adjacent to the
existing Yerevan Thermal Power Plant in southern Yerevan10. Table 1 shows the planned and
actual outputs of this project. The project outputs were achieved as per the initial plan.
Table 1: Planned and Actual Outputs of the Project Plan at the Time of Appraisal
(2005) Actual at the Time of Ex-Post
Evaluation (2016) 1) Construction of a combined cycle co-generation power plant (gas turbine power generation facility, steam turbine generation facility, heat recovery steam generator (HRSG), associated facilities and spare parts)
1) – 4) were implemented as planned.
2) Renovation of the existing related facilities (cooling, circulation water pump and pipes, chemical shop, outdoor switching station, heat pipes, pipes for water for industry and extinguishing fires) 3) Related civil engineering and construction works (including leveling of the project site) 4) Consulting services (detailed design, preparing documents for pre-qualification, bidding and contracting, assisting procurement, construction supervision, quality evaluation, assisting operation and maintenance, supporting environmental monitoring, technology transfers and human resource development for the facility operation and maintenance)
Source: Documents provided by JICA, answers to the questionnaire and site inspections (actual at the time of the ex-post evaluation)
10 It was confirmed through interviews with YTPP and site inspections that the existing power generation facility and the heat facility (two units) at Yerevan Thermal Power Plant ceased operation in 2010 and 2013, after the completion of this project.

7
3.2.2 Project Inputs
3.2.2.1 Project Cost
The project cost was planned to be 21,224 million yen at the time of the appraisal (of which
Japanese ODA Loan was 15,918 million yen). In principle, efficiency is evaluated by comparing the
actual expenditure with the initial plan. However, since the loan agreement for this project was
amended in May 2008 (with the provision of an additional loan)11 as a result of the extreme inflation
of prices affected by world markets, and cause of the cost increase was not related to prolonged
procurement process as the procurement was generally smooth. Therefore the actual cost was
compared with the revised project cost after the time of loan agreement amendment. The planned
project cost after the revision was 38,444 million yen (of which Japanese ODA Loan was 26,409
million yen).
The actual cost was 33,720 million yen as compared with the revised planned cost (38,444 million
yen), approximately 88% of the plan. (It was lower than the plan mainly due to fluctuations in
exchange rates12). The reasons for the additional loan provision are explained below. Due to the trend of increasing demand for construction worldwide and an influx of capital into the
market, price of steel materials increased globally on and after the project launched (2005). In
addition to the price increase in steel materials, demand for power generation mainly in emerging
nations increased, and demand for construction of thermal power generation plants increased since
demand for higher quality gas turbines (the main part of a cogeneration thermal power plant)
11 The conditions of the additional loan were the same as those applied at the time of the exchange of notes in March 2005: an interest rate of 0.75%, repayment period of 40 years (of which the grace period is 10 years) and general untied terms. 12 During the project implementation, Japanese yen appreciated against the US dollar and the Armenian dram (AMD).
Photo 1: Inside the Yerevan CCPP
Photo 2: Central Control Room

8
markedly increased, and the construction and installation price increased by 160% and the price (US
dollar-based) of the whole plant construction of this project including gas turbines and other related
facilities increased by 200%, as compared with 2004 (before the start of the project13). Under such
circumstances, the contract amount as in September 2007 for the plant construction was significantly
higher than the initial expectation14; this contract amount was not particularly high and quite
appropriate considering the market price at that time. However, it was difficult for the government of
Armenia to come up with the funds to cover the differences in cost within such a short period of
time15. As the imbalance between domestic power supply and demand was becoming urgent, the
Armenian government requested an additional loan from the Japanese government with a view to
preventing further price inflation, in view of the time constraints. As such situations were difficult to
predict or avoid, it is judged that the decision to extend the additional loan was appropriate.
3.2.2.2 Project Period
At the time of the appraisal, the project period was planned to be six years and seven months
(79 months), from March 2005 to September 2011. However, after the amendment of the loan
agreement (the extension of the additional loan), the project period was changed to seven years
and three months (87 months) from March 2005 to May 2012. As a consequence, this ex-post
evaluation compares the actual period with the updated plan. The actual project period was
seven years and two years (86 months) from March 2005 to April 2012, which is approximately
99% of the plan.
3.2.3 Results of Calculations of Internal Rates of Return (Reference only)
Financial Internal Rates of Return (FIRR)
FIRR was recalculated using the same conditions as at the time of the appraisal: taking
electricity revenue as a profit and the construction cost and maintenance expenses of this project
as costs, and assuming a project life of 30 years. The result was 16.08%, which is higher than
13.4% calculated at the time of the appraisal. This is because income from electricity sales was
higher than expected at the time of the appraisal16, increasing the profits.
13 The source is documents provided by JICA. 14 The contract amount was 24,538 million yen, which was significantly higher than 14,361 million yen, the initial budget for the main construction (the planned amount). 15 There was also self-supporting effort by the government of Armenia, such as supplementing for increased costs related to the spare parts of gas turbines, with their own budgets. (The source is documents provided by JICA.) 16 At the time of the appraisal: 15.69AMD/kWh, at the time of the ex-post evaluation: 27.82AMD/kWh, which is an increase in the electricity wholesale price by about 177%.

9
In light of the above, both the project costs and project period were within the plan. Therefore,
the efficiency of the project is high.
3.3 Effectiveness17 (Rating: ②)
3.3.1 Quantitative Effects (Operation and Effect Indicators)
This project constructed a CCPP with a power generation capacity of 205MW level and heat
supply capacity of 103Gcal/h, with a view to increasing the capacity of the power supply. Table
2 shows the targets and actual figures indicating the quantitative effects of this project18.
17 Sub-rating for Effectiveness is to be put with the consideration of impact. 18 The target was for the year of project completion. Although the project completion was 2012, actual data was not available for that year. This ex-post evaluation therefore compares it with the actual figure, one year after the project completion (2013).

10
Table 2: Baselines, Targets and Actual Figures Indicating Quantitative Effects
Indicator
Target Actual 2011
At the time of project
completion
2013 One year after
project completion
2014 Two years after
project completion
2015 Three years after
project completion
【Operational Indicators】 1) Maximum
Output 205MW* 220MW 220MW 220MW
2) Maximum heat output per hour
103Gcal/h 0 0 0
3) Capacity factor (power generation)
70.0% 85.0% or higher 80.6% 88.8%
4) Capacity factor (heat supply)
50.0% 0 0 0
5) Availability factor 86.7% 90.0% or higher 82.9% 91.2%
6) Auxiliary power ratio 2.8% 3.1% 3.1% 3.1%
7) Gross thermal efficiency (power generation + heat supply)
68.0% 49.0% or higher** 49.3%** 49.3%**
8) Forced outage hours by cause
Human error: 0 hour/year
Machine failure: 0 hour/year
Periodic inspection: 1,160
hours/year
Human error: 0 hour/year
Machine failure: 0 hour/year
Periodic inspection: 240
hours/year
Human error: 0 hour/year
Machine failure: 0 hour/year
Periodic inspection: 1,089
hours/year
Human error: 0 hour/year
Machine failure: 0 hour/year
Periodic inspection: 240
hours/year 9) Forced
outage frequency by cause
Human error: 0 times/year
Machine failure: 0 times/year
Periodic inspection: Once/year
Human error: 0 times/year
Machine failure: 0 times/year
Periodic inspection: Once/year
Human error: 0 times/year
Machine failure: 0 times/year
Periodic inspection: Once/year
Human error: 0 times/year
Machine failure: 0 times/year
Periodic inspection: Once/year
【Effective Indicators】 1) Net
generation 1,222GWh/year 1,764GWh/ year 1,398GWh/ year 1,594GWh/ year
2) Heat supply 451,100Gcal/ year 0 0 0 Source: Documents provided by JICA (targets at the time of the appraisal), answers to the questionnaire and YTPP’s
responses (at the time of the ex-post evaluation) Note*: Average of 220MW during winter when power demand is high, and 190MW during summer when the demand
is low. Note**: Data is only for power generation.

11
Regarding the indicators shown in Table 2, the status at the time of the ex-post evaluation was
confirmed using the questionnaire and interviews with YTPP. The status of the operational
indicators is as follows:
1) The targeted maximum output (205MW) was calculated by taking an average of 220MW for
the winter when power demand is high and 190MW for the summer when the demand is low.
By implementing this plant, maximum output was made sure of 220MW, as per initial
expectation.
2) The maximum heat output per hour19 is “zero”, since the heat is not being supplied from the
start of operation of this project (April 2010) to the time of ex-post evaluation. The main reason
is that the operation of the Nairit Chemical Plant unexpectedly stopped in early 2010 due to
financial problems, and there was no longer a demand for heat. Though YTPP expected that
more than 90% of the heat would be supplied solely to the Nairit Chemical Plant before the start
of this project, YTPP is not in a position to supply heat because of the factory’s shutdown
3) The capacity factor (power generation)20 is higher than initially expected.
4) The capacity factor (heat supply) is “zero”, as heat has not been supplied for the reasons
stated above21.
5) The availability factor22 is generally as initially expected. It is slightly low in 2014 since a
major periodic maintenance (C Periodic Inspection)23, which is held every four years, described
later in this report, was conducted that year.
6) The auxiliary power ratio24 indicates the status of performance maintained by the generation
plant. The ratio is generally as per the initial expectation.
7) The gross thermal efficiency25 indicates the status of performance maintained and energy
saving levels. Due to the absence of heat supply, the actual figure is slightly lower than the
target; however, the gross thermal efficiency for the power generation alone was generally as
per the initial expectation26.
19 “Heat” supplied by this plant is high, on average 295°C. At the time of the appraisal, it was expected that heat would be supplied through the pipeline from this plant for the purpose of manufacturing chemical products. 20 This is calculated by dividing power generated in a year by (rated output x number of hours in a year) x 100. 21 According to YTPP, they can begin supplying heat immediately if there is a demand for heat. 22 (Hours of operation in a year divided by the number of hours in a year) x100. 23 YTPP classifies the major maintenance inspection held once in four years as C Periodic Inspection. 24 (Power consumed inside the plant in a year divided by the net generation) x 100. 25 (Yearly net generation x 860) divided by (yearly fuel consumption x combustion calorific value) x 100. 26 According to YTPP, if there is a demand for heat supply, the gross thermal efficiency (power generation plus heat supply) would account for more than 70%.

12
8) and 9) The forced outage hours and frequency (by cause) are generally as initially expected.
Due to the regular periodic inspections in 2013 and 2015 (A and B Periodic Inspections, which
will be described below), the operation stopped for 240 hours (ten days in total) each time. In
2014, there was an outage of 1,089 hours due to the major periodic inspection held every four
years (C Periodic Inspection). The C Periodic Inspection required a long time, because the main
units such as gas turbines are dismantled and checked. Under the A and B Periodic Inspections
held in 2013 and 2015, the functions of the main and control equipment are checked and
repaired as needed, together with related facilities. As per the initial expectation, there has been
no case of human error or machine failure since the completion of this project.
With regard to the effect indicators: 1) The net generation has exceeded the initial expectation. The actual figure for 2014 is lower
than other years because of the major periodic inspection (C Periodic Inspection), which
reduced the operation hours of power generation unit.
2) There is no actual figure for the heat supply because no heat is being supplied from the start
of this project to the time of the ex-post evaluation, as explained above.
3.3.2 Qualitative Effects (Other Effects)
Reduction of Environmental Impact
At the time of the appraisal, it was expected that the construction of the latest and
environmentally friendly model of CCPP would minimize the environmental burden on areas
such as the capital, Yerevan. As a result of construction of the latest CCPP, the old existing
power plant ceased operation. Since sulfer content is removed from natural gas during
Photo 4: Heat Supplying Pipe Photo 3: Gas Turbine Generation Facility

13
processing, CCPP which uses natural gas has less impact on environment with no emissions of
sulfur oxides, dust and soot. Comparing latest model of CCPP with the conventional thermal
plant, the CCPP of this project has more advantage considering adopted measures of low NOx
type burner and implemented proper burning management27. Therefore, it is thought that this
project has contributed to reduce negative impacts on the environment around the city.
27 For example, the amount of NOx emission on the latest CCPP is below the half, comparing with that of the conventional thermal plant.

14
3.4 Impacts
3.4.1 Intended Impacts
3.4.1.1 Alleviation of Future Power Shortage
At the time of the appraisal, it was expected that this project would address the issue of
insufficient reserve capacity and predicted future power shortages. Table 3 shows the changes in
net generation, imports and exports of power and domestic power consumption of Armenia
between the start of this project and the time of the ex-post evaluation.
Table 3: Changes in Net Generation*, Imports and Exports of Power
and Domestic Power Consumption** (Units: GWh/year)
2005 2006 2007 2008 2009 2010 1) Net Generation 5,943 5,602 5,572 5,779 5,341 6,183 2) Power Imports 320 352 409 338 266 246 3) Power Exports 1,045 608 313 360 366 1,061 4) Domestic Power
Consumption 5,032 5,117 5,443 5,543 5,090 5,219
2011 2012 2013 2014 2015 1) Net Generation 7,105 7,667 7,381 7,389 7,433 2) Power Imports 189 79 137 191 160 3) Power Exports 1,383 1,578 1,226 1,236 1,339 4) Domestic Power
Consumption 5,637 5,924 6,077 6,142 6,050
Source: The Ministry of Energy and Natural Resources Note*: Net generation is the total gross power generation minus the electricity consumed within the plant. Note**: The sum of net generation and the balance of power imports and exports does not match the domestic power consumption due to the loss in transmission which occurs before electricity is actually consumed.
1) Net generation has generally increased over the past 10 years. As previously shown in
Table 2, net generation by this project was 1,594GWh in 2015, accounting for about 20% of the
total net generation for the entire country which is 7,433GWh/year shown in Table 3. Without
this project, it is likely that the demand for 4) domestic power consumption would not have
been met; this project can therefore be said to have had a high level of contribution towards
stabilizing power supply. Regarding 2) power imports, although Armenia temporarily relies on
neighboring countries for electricity using the international transmission line temporarily, this
has followed a decreasing trend. This is because domestic power generation and net generation
have been increasing every year, and the country is moving towards realizing a stable power
supply throughout the year. On the other hand, 3) power exports have been following an
increasing trend in general, since Armenia has been increasing its power exports every year in

15
return for its imports of natural gas from Russia (via Georgia) and Iran (barter trade28). For
reference purposes, Armenia’s natural gas imports are shown in Table 4, and these have been
following an increasing trend. The government of Armenia has taken a decision to significantly
increase natural gas imports from Iran after 201929. It is therefore expected that power exports
to Iran will also increase in the near future. Therefore, it is presumed that the role of this project
will be even more important, given that it accounts for roughly 20% of the country’s net power
generation.
Table 4: Origin and Volume of Armenia’s Natural Gas Imports
(Units: million m³/year) Origin of Imports
2011 2012 2013 2014
Russia* 1,609 1,967 1,956 2,062 Iran 460 488 405 389 Total 2,069 2,455 2,361 2,451
Source: The Public Service Regulatory Commission (PSRC) Note*: This is imported via a neighboring country, Georgia, because Armenia does not share a border with Russia. It is imported from Russia using an international gas pipeline.
3.4.1.2 Contribution to Sustainable Growth of the Economy
Table 5 shows the Gross Domestic Product (GDP) between the start of this project and the
present. It has been gradually increasing, except for 2008-2009 when it was affected by the
global financial crisis. It is thought that this project has contributed to stabilizing Armenia’s
power supply and achieving energy security by increasing the power supply through increased
natural gas imports, while playing a role in supporting the nation’s economy.
The Public Services Regulatory Commission (hereafter referred to as “PSRC”), an economic
and industrial body which regulates electricity tariffs in Armenia, commented in an interview:
“Had this project not been implemented, the electricity tariff could have been higher than the
current level30. It shows that CCPP enables relatively low-cost power generation, and that it is
contributing to an improvement in people’s livelihoods and economic revitalization. In addition,
28 In principle, Armenia exports approximately 3kWh of electricity in exchange for 1 m³ import of natural gas. 29 At the time of the ex-post evaluation, imports of natural gas from Iran were about 390 million m³/year or less. However, a decision has been taken to markedly increase it to about 1,160 million m³/year in 2019 (Source: YTPP interviews) 30 As reference information, a decision was made about surge of electricity tariff in June 2015 and demonstration by citizen of Yerevan immediately occurred against the surge. The tariff increased up to 48.78AMD/kWh after August 2015, from the previous 41.82AMD/kWh. However, it was confirmed through interviews that, had the electricity generation with low costs like this project not realized, the tariff would have exceeded the level more than 48.78AMD/kWh. In other words, it is thought that there is possibility of anxiety against the tariff, which would become bigger among the citizens.

16
Iran has a large population and economic base31 with overflowing demand for power, and
electricity exports are expected to grow further in the future.” With this comment, it is thought
that the contribution of this project to the country’s economy and social stability is not small.
Table 5: Gross Domestic Product (GDP) of Armenia
(Units: 1 billion USD) 2005 2006 2007 2008 2009 4.90 6.38 9.21 11.66 8.65 2010 2011 2012 2013 2014 9.26 10.14 9.96 10.43 10.88
Source: The World Bank.
3.4.2 Other Impacts
3.4.2.1 Impacts on the Natural Environment
At the time of the appraisal, it was expected that this project would require a two-phase
Environmental Impact Assessment (EIA). The first phase was approval by the Ministry of
Environmental Protection, which was obtained in September 2003. The second phase was
approval by the same ministry in September 2008, before the start of the main construction. It
was confirmed through the interviews with YTPP and the EIA documentation that there were no
particular problems or delay concerning the approval process.
In addition, it was confirmed through the questionnaire, interviews with YTPP and site
inspections that there were no air pollution, water pollution, noise, vibration or negative impacts
on the eco-system32.
Environmental monitoring is the responsibility of the production technology division of YTPP.
In case of a problem, immediate action will be taken to address the matter. However, as there
have not been any negative environmental impacts or problems since the completion of this
project, no measures have been taken as a result of their monitoring.
3.4.2.2 Land Acquisition and Resettlement
Land had already been secured for the construction (about 20ha) before the start of this
project. It had been a vacant plot owned by Yerevan city authorities, which was transferred to
YTPP with facilitation from the Armenian government. As it was an empty plot, no resettlement
31 The population is 78.5 million (Source: State of World Population 2014). GDP was 402.7 billion USD (source: IMF estimate, 2014) 32 There are no residential areas or commercial facilities around this project, and there has been no case of air pollution, noise, vibration or negative impacts on health.

17
was required. It was confirmed through interviews with YTPP that no financial compensation
was needed and that this proceeded smoothly.
3.4.2.3 Other Positive or Negative Impacts
Table 6 shows the per-kWh electricity wholesale prices and electricity tariffs of this project
and other thermal plants at the time of the ex-post evaluation.
Table 6: Advantages of This Project Compared to Other Thermal Plants in Armenia
Thermal Plan At the Time of the Ex-Post Evaluation
Electricity Wholesale Price
Electricity Tariff
①This Project *The operation began in 2010. 27.825AMD/kWh
48.78AMD/kWh ②Hrazdan CCPP No.5 **The operation began in 2012. 35.00AMD/kWh
③Hrazdan TPP **The operation began in 1969. 44.445AMD/kWh
Source: YTPP Remark: One Armenian dram (AMD) = 0.247 Japanese yen (exchange rate as in late January 2016)
The electricity wholesale price is the unit price at which each plant sells electricity to the
electricity networks of Armenia (hereafter referred to as “ENA”), while the electricity tariff is
applicable to end consumers (normal households). Difference caused by subtracting each plant’s
electricity wholesale price from the electricity tariff gives ENA’s revenue. The plant operation
performance is generally high for ①This project and ②Hrazdan CCPP No.5. Both plants are
operating power generation facilities with high thermal efficiency; however, according to YTPP,
this project is generating power for a lower cost, because the technical standards for operation
and maintenance are high. By contrast, ③Hrazdan TPP began operation more than 40 years ago,
and it has disadvantages in terms of its deterioration and operation due to its high maintenance
cost and wholesale price. In view of this situation, it is presumed that this project is profitable
for ENA and that it is contributing to stabilizing power distribution in this country.
With regard to the operation and effect indicators (quantitative effect indicators), maximum
output, capacity factor (power generation), availability factor, auxiliary power ratio, forced
outage hours and frequency by cause as well as net generation either met or exceeded the initial
expectations. However, maximum heat output per hour, plant capacity factor (heat supply
portion), gross thermal efficiency (power generation + heat supply portion) and heat supply did
not reach the initial targets, mainly due to the shutdown of Nairit Chemical Plant. While net

18
generation, electricity exports and domestic power consumption have been generally increasing
over the past ten years, and it is thought that this project’s contribution has not been small. In
light of the above, this project has to some extent achieved its objectives. Therefore, the
effectiveness and impact of the project are fair.
3.5 Sustainability (Rating: ③)
3.5.1 Institutional Aspects of Operation and Maintenance
The executing agency at the time of the ex-post evaluation is YTPP. YTPP is an organization
fully owned by the government of Armenia and supervised by the Ministry of Energy and
Natural Resources. In addition to supervising projects conducted by YTPP, the ministry appoints
the president and organizes board meetings.
YTPP has about 450 employees in total. The department responsible for this project operates
and maintains the facilities, working directly for the president. There are four divisions in this
department (Operation Division, Automatic Control Supervision Division, Central Repair
Division, and Water and Sewage Treatment System Division). At the time of the ex-post
evaluation, the department has 67 employees in total. It was confirmed through field inspections
and interviews with YTPP’s executive staff that the number of employees is sufficient, and that
each division is suitably staffed with appropriate personnel.
In light of the above, it is judged that no problems are observed in the institutional aspect of
the operation and maintenance.
3.5.2 Technical Aspects of Operation and Maintenance
At YTPP, staff training was conducted as necessary during the implementation of this project.
Four people attended the “Gas Turbine / Thermal Power Generation Technology Training”
organized by JICA in 2011. In addition, four people attended the “Water Cooling Tower /
Thermal Power Generation Facilities Training” in the same year, and two attended the “Training
in Analysis and Management of Chemical Systems for Thermal Power Generation” in 2012,
organized by an European training institute. Furthermore, after the completion of the project,
two people attended the “Training in Consultant Selection, Recruitment and Preparation of
International Financial Reports” organized by the International Training Center (ITC) of the
International Labour Organization (ILO) in 2014, and two people took the World Bank’s
“Training in Financial Management and Disbursement Procedure” in 2015.

19
Many experienced staff are engaged in this project. It was confirmed through the field
inspections that well-experienced staff are assigned to appropriate positions. Almost all staff
members are university graduates or more highly educated. Competitive entrance exams are
conducted and thorough on-the-job training, are also provided for newly recruited staff. Based
on the above, operation and maintenance technical standards are assessed as being secured33.
It was confirmed through the site inspections that operation and maintenance manuals are
distributed to each department and are being used appropriately.
In light of the above, it is judged that the technical standards of operation and maintenance
are sufficient and that there are no problems.
3.5.3 Financial Aspects of Operation and Maintenance
Table 7 shows the operation and maintenance costs of this project.
Table 7: Operation and Maintenance Costs of this Project
(Units: thousand AMD) 2012 2013 2014 2015
10,600,000 9,900,000 19,900,000 10,800,000 Source: YTPP
Except for 2014, the costs have been at a similar level each year. The 2014 cost was higher
than that in other years because of the major maintenance mentioned above (C Periodic
Inspection), which is held every four years, and which required 10 billion AMD (about 2.4
billion yen). According to YTPP, “Sufficient budgets are allocated to operation and maintenance
every year. The necessary funds for the C Periodic Inspection are also disbursed without any
problems. There is no operation and maintenance problem caused by shortage of funds. Since
there has not been any case of breakage or failure associated with this project, almost the same
level of funding is provided every year.” Based on these comments, it is thought that there are
no particular problems with the financial aspects of operation and maintenance.
For reference, Table 8 gives YTPP’s income statements for the last three years, and Table 9
gives YTPP’s balance sheet for the last three years.
33 All operation and maintenance staff take examinations every two years in which their working knowledge is regularly checked. There is a system whereby if a person fails this exam, another exam will be given three months later, and the person will be dismissed if s/he fails again.

20
(Reference) Table 8: YTPP’s Income Statements (Units: thousand AMD)
Item 2012 2013 2014 ① Operating income (revenue from selling electricity, etc.)
54,852,441 55,343,815 64,409,966
② Operating expenses (56,705,089) (60,101,520) (65,440,741) ③ =①+② (1,852,648) (4,757,705) (1,030,775) ④ Selling and general
administrative expenses (521,942) (490,066) (827,114)
⑤Total Balance (③+④) (2,374,590) (5,247,771) (1,857,889) ⑥Other income 99,816 16,483 359,421 ⑦Other expenses (620,977) (786,254) (1,329,210) ⑧=⑤+⑥+⑦ (2,895,751) (6,017,542) (2,827,678) ⑨Financial expenses (997,671) (1,027,427) (1,535,994) ⑩Non-operating income (interest and currency exchange profit, etc.)
2,218,746 23,596,441 4,372,302
⑪Pre-tax profit (⑧+⑨+
⑩) (1,674,676) 16,551,472 8,630
Source: YTPP Note: The figures in brackets are negative numbers.
(Reference) Table 9: YTPP’s Balance Sheet (Units: thousand AMD)
Item 2012 2013 2014 ① Fixed assets 151,880,246 155,619,283 160,717,026 ② Current assets 14,501,809 19,208,932 26,569,903 ③ Total Assets (①+②) 166,382,055 174,828,215 187,286,929 ④ Fixed liabilities 137,999,274 120,433,583 126,699,809 ⑤ Current liabilities 16,246,460 23,364,365 34,134,065 ⑥ Shareholders’ equity 12,136,321 31,030,267 26,453,055 ⑦ Total Liabilities and
equity (④+⑤+⑥)
166,382,055 174,828,215 187,286,929
Source: YTPP
From Table 8 it can be seen that the operational costs have been slightly higher than the
operational income; however, the difference is not significant. After 2013, pre-tax profit became
positive. One factor is that the non-operating income (interest and currency exchange revenue,
etc.) was large that year. The pre-tax profit was positive in 2014; however, it was similarly
affected by the non-operating income. In any case, there has not been a situation in which
securing the operation and maintenance costs shown in Table 7 were of concern. With regard to
Table 9, it can be seen that shareholders’ equity increased in 2013 and 2014 compared with
2012. In addition, according to YTPP, as natural gas imports from Iran increase in the future,
power generated in Armenia will steadily increase, which will increase the availability factor

21
and thus YTPP’s profits are also expected to increase. It is therefore predicted that the financial
situation will improve further in the near future, following this ex-post evaluation.
Based on the above, it is judged that there are no major concerns with the financial aspects of
operation and maintenance of this project.
3.5.4 Current Status of Operation and Maintenance
The operational status of the gas turbine power generation facility, steam turbine power
generation facility, HRSG and associated facilities is good. Since the completion of the project,
there have been no cases of breakage or failure.
YTPP formulates a maintenance plan every year and carries out operation and maintenance
tasks based on this plan. The tasks are categorized into periodic works and daily maintenance
works. The periodic maintenance works are carried out every year, and a major piece of
maintenance work (C Periodic Inspection) is also conducted once in every four years, for which
a huge budget (about 2.4 billion yen) is required. For daily maintenance, maintenance works for
the power facilities are conducted by different teams (every half a year, every three months,
every month, every week or every day). In addition, spare parts are procured and secured in an
appropriate manner. There is no problem with the procurement system, nor are there any delays
in delivery.
In light of the above, no major problems have been observed in the institutional, technical or
financial aspects of the operation and maintenance system. Therefore, the sustainability of the
effects of the project is high.
4. Conclusion, Lessons Learned and Recommendations
4.1 Conclusion
This project constructed CCPP in a suburb of the capital Yerevan, with a view to enhancing
the power supply capacity. This project is consistent with power sector development policies in
Armenia, such as the “Integrated Financial Rehabilitation Plan for Public Utilities” (2003-2007)
and the “Main Direction for Developing the Energy Sector in the Period up to 2036” (2015).
Before the start of the project, the Yerevan Thermal Power Plant, which had been operational
since early 1960s, was aging, and there was a need to construct new power facilities in order to
stabilize the power supply. At the time of the ex-post evaluation, the Armenian government

22
plans to develop and attract investments for new power sources; and thus this project is
consistent with the development needs of the country. Additionally, given that this project is also
harmonized with the assistance policy of Japan, the relevance of this project is high. The actual
project costs fell within the planned budget, as did the project period; the efficiency is also
therefore high. With regard to the project effectiveness, the maximum output, capacity factor
(power generation), availability factor, auxiliary power ratio, forced outage hours and frequency
by cause, as well as net generation, either met or exceeded the initial expectations, on the whole.
On the other hand, the maximum heat output per hour, plant capacity factor (heat supply
portion), gross thermal efficiency and heat supply did not reach the initial targets, mainly due to
the shutdown of the Nairit Chemical Plant. Therefore, the effectiveness and impact are fair.
Since no particular problems are observed in the institutional, technical and financial aspects of
operation and maintenance, the sustainability of the effects of this project is high.
In light of the above, this project is evaluated to be highly satisfactory.
4.2 Recommendations
4.2.1 Recommendations to the Executing Agency
It is recommended that the Armenian side (the Ministry of Energy and Natural Resources)
discuss actions to be taken in the future regarding the demand for heat supply. At the time of this
ex-post evaluation, there is some discussion regarding the resumption of operation of Nairit
Chemical Plant. It is recommended that the Ministry of Energy and Natural Resources continue
its discussion of the realization of heat supply from this project for Nairit Chemical Plant at its
resumption of operation and explore other possibilities of the effective utilization of waste heat
in the future.
4.2.2 Recommendations to JICA
None
4.3 Lessons Learned
Contribution to Smooth Project Implementation through Training Opportunities and OJT
YTPP has promoted and maintained the project smoothly, throughout the overall
implementation, and operation and maintenance following the completion, and no problems are
foreseen for future maintenance. In addition to offering ample training opportunities and OJT,
YTPP has a system in which employees are periodically tested in order to maintain and improve

23
their maintenance abilities, (and) thus the organization is always staffed with capable personnel.
These are the factors that have led the project to success. For the formulation of future similar
projects, it is important that JICA and the executing agencies study issues related to capacity
development of staffs, and formulate systems that will allow the project to train and retain the
human resources necessary to sustain the project’s effects, such as offering training
opportunities to staff and introducing periodic examinations as needed.

24
Comparison of the Original and Actual Scope of the Project
Item Plan Actual 1. Project Outputs
1) Construction of a combined cycle co-generation power plant (gas turbine power generation facility, steam turbine generation facility, waste-heat recovery boiler, associated facilities and spare parts)
1) – 4) were implemented as planned.
2) Reconditioning of the existing related facilities (cooling, circulation water pump and pipes, chemical shop, outdoor switching station, heat pipes, pipes for water for industry and extinguishing fires)
3) Related civil engineering and construction works (including leveling of the project site)
4) Consulting service (detailed design, preparing documents for qualification, bidding and contracting, assisting procurement, construction supervision, quality evaluation, assisting operation and maintenance, supporting environmental monitoring, technology transfers and human resource development for the facility operation and maintenance)
2. Project Period
March, 2005 – May, 2012 (87 months)
March, 2005 – April, 2012 (86 months)
3. Project Cost Amount Paid in Foreign Currency Amount Paid in Local currency Total Japanese ODA Loan Portion Exchange Rate
28,725 million yen
9,719 million yen
38,444 million yen
26,409 million yen
1 USD=108 JPY 1AMD=0.326JPY
(As in February 2008)
27,318 million yen
6,402 million yen (Approx. 24,910 million dram)
33,720 million yen
26,399 million yen
1 USD=98.46JPY 1AMD=0.257JPY
(Average during the project’s implementation (2005-2013).

25
Source: International Financial Statistics, IMF)

1
Islamic Republic of Pakistan FY 2015 Ex-Post Evaluation of Japanese ODA Loan
“Load Dispatch System Upgrade Project” External Evaluator: Hisae Takahashi, Octavia Japan, Co., Ltd.
0. Summary This project was conducted to make the power network1 more efficient and reliable by
modernizing and upgrading the load dispatch system2 and the related facilities in Pakistan. It is consistent with the development policy of Pakistan, which has focused on power sector reform that contributed to economic growth, and the country’s needs to develop an efficient and reliable power network both at the time of appraisal and ex-post evaluation. It is also consistent with the Japanese policy of assistance to Pakistan as of the appraisal. Hence the relevance of this project is high. Though the project cost was within the plan, the project period significantly exceeded the plan for various reasons, such as the delay in the bidding and contract process, the characteristics of the project whereby the new equipment was installed while continuing the operation of existing facilities and equipment, issues of the implementing structure, worsened security and natural disasters, etc. Thus, the efficiency of the project is fair. Thanks to the project, the number of faulty communication reports from load dispatch systems, average restoration time from transmission line failures and the transmission loss rate were reduced, which meant the reliability and stability of the power network were improved. Since impacts such as cost reduction due to efficient power system operation as well as improvement of transparency in the power system were also confirmed, the effectiveness and impact of the project are high. On the other hand, minor issues in National Transmission and Dispatch Company (NTDC)3, the institution in charge of maintenance, remain in terms of institutional and technical aspects and the current O&M condition. Accordingly, the sustainability of the project effect is fair. In light of the above, this project is evaluated to be satisfactory.
1 It is a general term expressing an inclusive system from generation to consumption of power, namely organic links of all factors from power plants to transmission lines, substations, distribution lines and then reaching users. 2 The system supplies stable power to avoid affecting the frequency and voltage by adjusting the power generation depending on the seasons, climatic conditions and time. The system is also tasked with minimizing the scope and time of power failure, particularly caused by thunder, etc., by monitoring and controlling substations and power plants. 3 NTDC is the only system operator in Pakistan. It receives wheeling charges from the Central Power Purchasing Agency Guarantee Limited. (CPPA) and plays the role of conveyancing power to a transmission and distribution network of local power distribution companies through their power grid system. NTDC has also conducted projects to develop transmission facilities as power resource development by power generation companies has progressed.

2
1. Project Description
Project location Power control system display
1.1 Background In Pakistan which has focused on accelerating economic growth and reducing poverty, power
demand4 has soared alongside rising economic growth. Accordingly, the government addressed the efficient combination of a mass thermal power generation centered on Independent Power Producer (IPP) and the hydroelectric power generation of an inexpensive unit price while executing power sector reform. Also, most of the thermal power generation plants are mainly located in central and southern areas, as opposed to hydroelectric power generation sites in northern Pakistan, which requires efficient and stable operation via mostly a 500/220 kV power grid system. NTDC manages and operates the 500/220 kV power grid system and the national power generation facility, and the National Power Control Center5 (NPCC) of NTDC plays the main role of operation for power control system. NPCC started its operation in 1990 and had a load dispatch system with a remote monitoring function. However, amid rapid technological innovation, power system expansion and the emergence of IPP, the implementation of stable and smooth power system operation was disrupted, both functionally and in terms of capacity. With this in mind, the project replaced a NPCC data processing system, newly installed remote terminal units (RTUs) in power stations and substations and developed a telecommunication system for efficient and stable power system operation in Pakistan.
1.2 Project Outline
The objective of this project is to make the NTDC power network more efficient and reliable by modernizing and upgrading the load dispatch system of NPCC and related facilities, thereby contributing to the socioeconomic development of Pakistan.
4 The annual average power demand grew by 4% and over during the periods from 1998 through 2003. (Source: documents provided by JICA) 5 NPCC is a department of NTDC and based on data from each power plant, they monitor the whole power system and conduct demand control and connection works.

3
Loan Approved Amount/ Disbursed Amount 3,839 million yen / 3,123 million yen
Exchange of Notes Date/ Loan Agreement Signing Date August, 2005 / August, 2005
Terms and Conditions
Interest Rate 1.3% Repayment Period
(Grace Period) 30 year
(10 year) Conditions for Procurement: General Untied
Borrower / Executing Agency
The President of the Islamic Republic of Pakistan / National Transmission and Dispatch Company Limited (NTDC)
Final Disbursement Date February, 2013 Main Contractor
(Over 1 billion yen) Alstom Grid Sas (France) / Viscas Corporation (Japan) / Areva T&D (Pakistan) (JV)
Main Consultant (Over 100 million yen) -
Feasibility Studies, etc. “Feasibility Study” WAPDA, 1994 “Feasibility Study (Review) ” NTDC, 2002
Related Projects
(Technical Assistance) “The Project for Improvement of Training Capacity on Grid System Operation and Maintenance” (2011 – 2014) (ODA Loan) “Dadu-Khuzdar Transmission System Project” (December, 2006) “Punjab Transmission Lines and Grid Stations Project” (I) (May, 2008) “National Transmission Lines and Grid Stations Strengthening” (March, 2010) (World Bank) “Power Sector Reform” (2014-2016)
2. Outline of the Evaluation Study 2.1 External Evaluator
Hisae Takahashi, Octavia Japan, Co., Ltd.
2.2 Duration of Evaluation Study This ex-post evaluation was conducted with the following schedule:
Duration of the Study: September, 2015 – January, 2017 Duration of the Field Study: January 10 – January 22, 2016, July 17 – July 22, 2016
2.3 Constraints during the Evaluation Study
Taking over certificate (TOC) for procured equipment was issued by executing agency on September 2014. Besides, the project outputs were largely produced as planned and have also generated an effect as noted below. However, the project remained incomplete at the time of the

4
ex-post evaluation for the following reasons: 1) Three out of all RTUs installed had not been connected to Supervisory Control and Data Acquisition (SCADA) and not yet operated. Part of the telecommunication system has not been effectively operated due to technical issues. 2) Based on the punch list (a list with which the contractor confirms and resolves troubles affecting equipment or telecommunication system), any troubles including the above, are being followed up by the contractor. Accordingly, mandatory reliability run test which should be conducted after responding the punch list, has not been completed and the defect liability period remains valid. 3) Based on the appraisal documents, the completion date is defined as the end of the defect liability period. Under such circumstances, having observed project output even though the project is yet to complete by definition, the impact, normally confirmed as the medium and long term effects after project completion, was analyzed taking effects across the ages and intended impacts into consideration, though in definition the project is taken as incomplete.
3.Results of the Evaluation (Overall Rating: B6) 3.1 Relevance (Rating: ③7)
3.1.1 Relevance to the Development Plan of Pakistan “Ten Year Perspective Development Plan” (2001 – 2010), a development policy at the time
of appraisal, showed the power sector developing strategy, particularly focusing on developing and upgrading the power grid and reducing system losses. In concrete terms, the investment plan for new facilities and equipment also included developing a power grid striving to expand the equipment capacity and reduce transmission/distribution loss8.
“Vision 2025” (2014), a mid- to long term development plan at the time of the ex-post evaluation, set out to become an upper-middle income country by 2025 and showed seven pillars in key development areas to support growth and development. Key areas included “energy, food and water security”, reflecting the objectives to supply stable and reliable power, increase access to power, lower the power unit price by reducing the distribution loss rate, increasing the energy self-sufficiency rate and promoting efficient power demand management, etc. Furthermore, the “National Power Policy”, which was formulated in 2013, emphasized improving power demand-supply gaps, lowering unit price for generating power and reducing the transmission and distribution loss rate and so on by 2017.
As noted above, from the time of appraisal through to the time of ex-post evaluation, the development policy and plan in Pakistan have emphasized securing and improving a stable energy supply by developing and upgrading the power grid and by reducing the transmission and distribution loss rate. The project was intended to ensure the efficiency and stability of
6 A: Highly satisfactory, B: Satisfactory, C: Partially satisfactory, D: Unsatisfactory 7 ③: High, ②: Fair, ①: Low 8 Source: document provided by JICA

5
power system operation in Pakistan. Accordingly, the project has been relevant to the development plan for Pakistan at the both time of appraisal and ex-post evaluation.
3.1.2 Relevance to the Development Needs of Pakistan
At the time of appraisal, the country addressed issues of how to efficiently combine mass thermal power generation and hydroelectric power generation of an inexpensive unit price to respond a rapid increase in power demand with the economic growth. However, thermal power generation plants are mostly located in central and southern areas, whereas hydroelectric power generation sites are located in northern Pakistan, which requires the 500/220 kV power grid system to operate effectively and reliably. Also the NPCC, which mainly controls the 500/220 kV power grid system and power plants, is prone to frequent telecommunication and equipment failures due to system deterioration, which disrupt stable and smooth power system operation. Accordingly, fundamental modernization and improvement of related facilities were urgently necessary9.
The capacity of power plants and power demand in Pakistan have increased, even since the appraisal, and the maximum demand/power plant capacity rate peaked at 97% at the time of the ex-post evaluation, meaning the increase of actual capacity to meet the demand would be needed (See Table 1). Moreover, at the time of the ex-post evaluation, power interchange between central and southern areas and northern area continued, requiring not only sufficient power capacities but also system operation for a prompt response to system failure to ensure a stable power supply in Pakistan. Accordingly, the needs to upgrade the load dispatch system with a remote monitoring function for the transmission system, install RTU and upgrade the telecommunication system implemented in this project were confirmed.
Table 1 Peak Demand and Installed Capacity of Power Generation in Pakistan
2004 2011 2012 2013 2014 2015 Peak Demand (MW) 11,078 18,860 18,940 18,827 21,017 22,083 Installed Capacity (MW) 15,819 20,986 20,499 20,850 22,753 22,745 Peak demand / Installed Capacity (%) 70 90 92 90 92 97
Source: documents provided by NPCC
3.1.3 Relevance to Japan’s ODA Policy
Japan’s “Country Assistance Program for Pakistan” (February, 2005) emphasized “development of a healthy market economy” as one of the priority areas and underlined the importance of “upgrading and developing economic infrastructure to support the revitalization of the healthy market economy and poverty reduction”. JICA’s “Country Assistance Strategy for Pakistan” (March, 2005) stressed that economic development was contingent on ensuring a
9 Source: documents provided by JICA

6
reliable power supply, both qualitatively and quantitatively and indicated its positive support for the power sector. In addition, developing the transmission system was also underlined as a priority area for assistance, given the critical role of the public sector in the power sector. JICA’s “Medium–Term Strategy for Overseas Economic Cooperation Operations” (April, 2005) also designated the development of a healthy market economy as a priority area for support in Pakistan. Furthermore, as a project targeting efficient and reliable power system operation for contributing the social and economic development in Pakistan, its consistency with Japan’s priority assistance area in Pakistan is confirmed.
3.1.4 Relevance to Appropriateness of Project Planning and Approach
In the project, NPCC, one of the NTDC departments, almost solely played the role as Project Implementing Unit (PIU). The equipment procured in the project widely includes RTU, telecommunication systems, a telephone network and a central processing system including SCADA, etc. While the NPCC only oversees operation and maintenance (O&M) for the central processing system, O&M for RTU, telecommunication system and telephone network is under the responsibility of the NTDC telecommunication department. Since the NPCC staff lack technical knowledge and experiences of RTU and telecommunication system, cooperation with the NTDC telecommunication department was necessary to procure and install equipment. However the involvement of telecommunication department was limited in the project even at the stage of installing equipment. This hindered the smooth project implementation and was one of the factors delaying it, as described in “3.2.2.2 Project Period”.
Issues of implementing structure for smooth project activities remain, given the situation
including the lack of scrutiny concerning demarcation of the responsibilities and roles among related departments for equipment at the planning stage. However, the project has been highly relevant to the country’s development plan and development needs, as well as Japan’s ODA policy. Accordingly, its relevance is high.
3.2 Efficiency (Rating: ②)
3.2.1 Project Outputs Table 2 shows the project outputs (planned and actual). While the actual output was basically
as planned, the number of installed RTUs increased considerably from the planned. The major output changes and reasons are as follows:
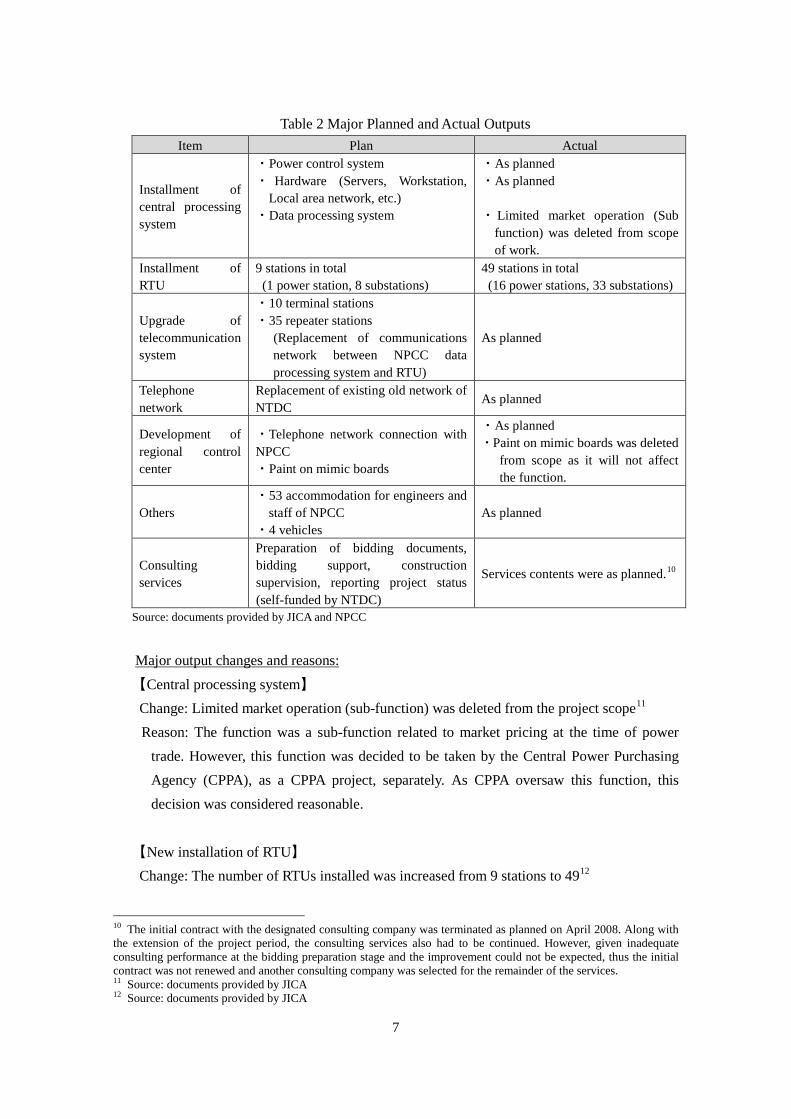
7
Table 2 Major Planned and Actual Outputs Item Plan Actual
Installment of central processing system
・Power control system ・ Hardware (Servers, Workstation,
Local area network, etc.) ・Data processing system
・As planned ・As planned ・ Limited market operation (Sub
function) was deleted from scope of work.
Installment of RTU
9 stations in total (1 power station, 8 substations)
49 stations in total (16 power stations, 33 substations)
Upgrade of telecommunication system
・10 terminal stations ・35 repeater stations
(Replacement of communications network between NPCC data processing system and RTU)
As planned
Telephone network
Replacement of existing old network of NTDC
As planned
Development of regional control center
・Telephone network connection with NPCC ・Paint on mimic boards
・As planned ・Paint on mimic boards was deleted
from scope as it will not affect the function.
Others ・53 accommodation for engineers and
staff of NPCC ・4 vehicles
As planned
Consulting services
Preparation of bidding documents, bidding support, construction supervision, reporting project status (self-funded by NTDC)
Services contents were as planned.10
Source: documents provided by JICA and NPCC
Major output changes and reasons: 【Central processing system】
Change: Limited market operation (sub-function) was deleted from the project scope11 Reason: The function was a sub-function related to market pricing at the time of power
trade. However, this function was decided to be taken by the Central Power Purchasing Agency (CPPA), as a CPPA project, separately. As CPPA oversaw this function, this decision was considered reasonable.
【New installation of RTU】
Change: The number of RTUs installed was increased from 9 stations to 4912
10 The initial contract with the designated consulting company was terminated as planned on April 2008. Along with the extension of the project period, the consulting services also had to be continued. However, given inadequate consulting performance at the bidding preparation stage and the improvement could not be expected, thus the initial contract was not renewed and another consulting company was selected for the remainder of the services. 11 Source: documents provided by JICA 12 Source: documents provided by JICA

8
Reason: At the time of appraisal, the plan was to install new RTUs in 9 power station/substations, while the existing RTUs were to be utilized in the remaining station/substations. However, via the detailed survey results for installing equipment (2008), the consultant found that the old and new RTUs were incompatible and the old RTUs were insufficient as a means of securing proper spare capacity for data which is expected to increase in the future. In case RTUs were incompatible, the data recorded at each station may not be transferred to central processing system properly. Furthermore, if the back-up capacity was not sufficient, it was assumed to be difficult to collect and transfer the data which would be soon increased. It means that the understating the real time situation of each facility and power network would be highly disturbed. Therefore, needs to change the specification of the existing RTUs was raised. Meanwhile, the costs of upgrading the existing RTU far exceeded those of installing new RTUs. With efficiency in mind, the project decided to increase the number of new RTUs installed. This change was made by the executing agency, NTDC, following discussion with consultants and JICA experts concerning the functions, compatibilities and efficiencies of both existing and new RTUs. Based on a request from NTDC, JICA officially approved this output change. Thus this change is considered as reasonable for generating the effectiveness of the project.
RTU installed Telecommunication system installed
(Rawat substation) (Substation in Islamabad University)
3.2.2 Project Inputs 3.2.2.1 Project Cost
The actual total project cost was 5,343 million yen (3,513 million yen from Japanese ODA loan) while the planned cost was 5,720 million yen (3,839 million yen from Japanese ODA loan), meaning the total project cost was lower than the planned figure (93% of the original plan). Although the number of RTUs newly installed significantly increased, the major

9
reasons for remaining within the budget were exchange rate fluctuations13, tax exemptions on the procured equipment and unused contingency funds14.
3.2.2.2 Project Period
The project period planned at the time of appraisal was 42 months, August 2005 through January 2009 and the actual period was 126 months, August 2005 through January 201615; far longer than planned (300% of the planned period). Although it should be considered that RTU actual output increased significantly compared to the planned level (544% of the plan), for major outputs other than RTU, there were no significant changes and the ratio of planned to actual value for the project period of each output except RTUs significantly increased compared to the equivalent ratio for outputs (Table 3). Also the “selecting consultants” and the “bidding and contract process” periods before installing RTUs took longer than planned. The major reasons behind this delay were as below. Of the reasons, “Disasters and securities” were external factors; unpredictable as well as inevitable. Furthermore, other external factors such as exceeding planned cost, caused by inflation and fluctuation of the exchange rate, and the changes of the scope also affected the delay of the project. On the other hand, for each factor other than “Disasters and securities”, it could be possible for taking measures by carefully assessing the risks which may cause the delay of the project in the survey at the planning stage.
Table 3: The Ratio of Actual to Plan for Outputs and Project Periods
Output ratio to plan Ratio of project period to plan Data processing system 100% 333% RTU 544% 333% Telecommunication system 100% 425% Telephone network 100% 255%
Average ratio to plan 211% 337% Source: prepared based on the documents provided by JICA and NPCC Note: The project period is defined from the time of L/A signing to the end of the defect liability period.
Table 3 calculated the average ratio to plan of the project period based on each item.
13 1 Pakistani rupee (Rs.) was 1.75 yen at the time of appraisal and the average rate between loan periods was Rs.1=1.35 yen. Furthermore, the procurement and installation of equipment has been continued even after the loan disbursement period. According to the executing agency, the average exchange rate from the commencement of procurement (March, 2010) to the completion of the installation (September 2014) was about Rs.1=0.94 yen. 14 Based on NPCC response to the questionnaire 15 The project period is defined from the time of L/A signing (project commencement) to the end of the defect liability period (project completion). However, as noted in “2.3 Constraints during the Evaluation Study”, the project remained incomplete at the time of the ex-post evaluation. Therefore, the time of project completion was set as the implementation month of field visit at the ex-post evaluation.

10
Major reasons of the project delay: 【Delay in bidding】
The bidding took for over four years, although the original plan was to complete it less than a year. NPCC as a PIU and its consultants did not get used to the bidding process for Japanese ODA loans and took a certain period of time for reviewing documents by executing agency, which meant more time than assumed was required for preparation and review of the bidding documents.
【External factors of disasters and securities】
Massive floods occurred twice in Pakistan during the project implementation. Across the Khyber Pakhtunkhwa, Punjab and Sindh Provinces were damaged by flooding in July 2010 and major roads were shut down, which also meant project activities had to be stopped for some time. In addition, the whole of southern Pakistan was damaged by flooding in August 2011, both of which were considered reasons for the six-month delay to the project16. Moreover, the Ministry of Home Affairs did not allow project activities to continue due to worsening security in Peshawar following intensified terrorist activities, which also delayed the project. Furthermore, a contracted foreign technical expert of the contractor was also restricted from traveling especially on and after April 2013 due to worsening security in Pakistan, which also delayed the project.
【Design (Setting the project period)】
The project sites were scattered around the country, and the introduction and installation of new equipment were planned while utilizing existing facilities and equipment. Under such circumstances, there was a comment that the procurement and installation period, originally planned as 1.5 years should have been around 3 years17. At the time of ex-post evaluation, it is difficult for the evaluator to conduct rigorous verification of the adequacy of project period, which was determined by mutual agreement based on the technical adequacy at the time of appraisal. However, the associated parties of Pakistan (the executing agencies, consultants) underlined that the assessment for setting the project period had been optimistic. Accordingly, it might be though that more careful discussion should be held in setting realistic project period on the grounds of technical matters and project features at the planning stage, but before appraisal.
【Implementation structure】
As shown in “3.1.4 Relevance to Appropriateness of Project Planning and Approach”,
16 Based on the interview to NPCC 17 Based on the interview to contracted consultants

11
NPCC, which is one department of NTDC, played the role of PIU in this project. However, most of the equipment procured should be operated and maintained by the NTDC telecommunication department, not by NPCC. NPCC staff lacked sufficient technical knowledge for the telecommunication system, while the involvement of NTDC telecommunication department in the project was initially limited. Such situation meant cooperation and coordination of installing equipment took time and hindered smooth project progress. Given the difficulties in operating load dispatch system by NPCC alone, it is obvious that the further involvement of the related department in this project, particularly the NTDC telecommunication department, was inevitable from the very start of operations.
【Delay in installation of equipment at the existing facilities】
The project involved installing equipment in the existing facilities. However, it was difficult to obtain the drawings of aging facilities, necessary for to installing the equipment. It took for consultants and contractors longer than planned to understand the site situation, which caused delay in delivery and installation of equipment.
【Issuing TOC before implementing a reliability run test】
In the project, TOC was issued by the consultant on the equipment procured in September 2014 upon substantial completion. Timing of issuance of TOC depends on the condition of contract, and usually it is issued after completing the reliability run test or when the defect reliability period ends, whereupon the balance of the contract amount should be paid to the contractor. According to NPCC and the consultants, the project issued TOC and released final payment before solving punch list items or conducting a reliability run test in line with condition of the contract, however, it might have affected the contractor’s performance and served as one of the factors to delay.
Based on the above, although the project cost was within the plan, the project period largely
exceeded the plan. Accordingly, efficiency of the project is fair. 3.3 Effectiveness18 (Rating: ③)
3.3.1 Quantitative Effects (Operation and Effect Indicators) (1) Operation Indicators: number of faulty reports of communication of load dispatch system, restoration time in transmission line failure.
Table 4 shows each baseline and target operation indicators, which were set at the time of appraisal and actual values. The number of reports of faulty communication in the load dispatch system declined from an average 450 times per day before implementing the project
18 Sub-rating for Effectiveness is to be put with consideration of Impact.

12
to 18 times per day at the time of the ex-post evaluation. Before the project implementation, frequent telecommunication and equipment failures were caused due to the dilapidated load dispatch system and insufficient capacity of the system. Thanks to new data processing system, RTUs as well as telecommunication system, the function of the system improved as such the number of faulty reports of communication shows a significant decrease though the target is not met as yet.
The actual average restoration time for transmission line failure was shortened to 10 minutes per unit for both 550 and 220kV transmission lines, both of which met their targeted average times of less than 45 minutes/time (550kV transmission line) and 34 minutes/time (220kV transmission line), respectively.
Before implementing the project, it took time to understand the situation and prepare a restoration plan because all the failure information (failure points, etc.) was obtained by phone from each facility (power station/substation). The installed RTUs under the project helped swiftly clarify failure situations, such as the range, power blackout and failure points, on the NPCC display board. Consequently, this shortened the time required to determine the restoration approach and the operation itself, accelerating efforts to resolve failure.
Table 4 Average Number of Faulty Reports of Communication and Average Restoration Time in
Transmission Line Failure
Baseline Target Actual 2004 2010 2014 2015
Baseline Year
1 Years After Completion
Completion Year of equipment
installation Note
1 Year After Completion of
equipment installation Note
Average number of faulty reports of communication (average number/day)
Apprx. 450 10 20 18
Average restoration time in 500kV transmission line failure (min/time) 45 Less than 45 10 10
Average restoration time in 220kV transmission line failure (min/time) 34 Less than 34 10 10
Source: documents provided by JICA and NPCC Note: The actual value of operation and effect indicators should be indicated at the time of project completion and onward. However, the project was incomplete at the time of the ex-post evaluation, despite completing equipment installation. Accordingly, the effectiveness of the ex-post evaluation was confirmed using actual data of the completed year of all equipment installations (2014) and the following year.
(2) Effect Indicators: Transmission loss rate19 The transmission loss rate declined from 7.6% before the project implementation, to 3.8%
at the time of the ex-post evaluation and the targeted rate (less than 7.6%) was achieved (See
19 Transmission loss shows energy wasted in transmission from the power supplier to the substation or each customer. Power generation = consumption + transmission loss. As the transmission voltage is higher, the transmission loss is lower. Also, as voltage declines alongside increased demand, there is a need to maintain the voltage in the system appropriately to decrease transmission loss.

13
Table 5). A newly installed load dispatch system enabled the power system to be monitored on a real-time basis while maintaining adequate voltage, which contributed to improve the transmission loss rate.
Table 5 Transmission Loss Rate (Unit: %)
Baseline Target Actual Actual 2004 2010 2014 2015
Baseline Year 1 Years After Completion
Completion Year of equipment installation
1 Year After Completion of
equipment installation Transmission
loss rate 7.6 Less than 7.6 5.0 3.8
Source: documents provided by JICA and executing agency
3.3.2 Qualitative Effects (Other effects) (1) Improving power system reliability The installation of a new system under the project helped improve power system reliability
by decreasing the average restoration time from failures mentioned above. NPCC had used a load dispatch system manufactured in 1985 until the project implementation. Although the system included a remote monitoring function for load dispatch throughout Pakistan, it was prone to telecommunication and equipment failures and it was unable to monitor the power grid regularly due to a lack of capacity along with expanding power system and model obsolescence. The new system installed in the project enables constant monitoring of load information (tide, voltage, etc.) transmitted promptly from each facility on NPCC display board. The NPCC dispatcher can understand the situation of each system on time, operate the power system and control the power flow quickly and on a timely basis as well as responding to faults, which eventually helped improve the power system reliability (See Table 6).
Table 6 Procedures for Responding to Transmission Line Failure
(Comparison between before and after the project implementation) Timing Before project implementation At the time of the ex-post evaluation
The event of failure Occurrence of transmission line fault ↓
Occurrence of transmission line fault ↓
Assessment of status Call to each facility and understand the status
Understand the status of the failure on a real-time basis with accurate information on a display board
↓
Development of the restoration plan,
restoration
Prepare a restoration plan based on information confirmed over the phone (including inaccurate information) and
conduct restoration
Prepare a restoration plan based on accurate information confirmed by the
system and conduct restoration
Time required Average time for restoration
45 minutes (500kV transmission line) 34 minutes (220kV transmission line)
Average time for restoration 10 minutes

14
Reliability Information with human intervention may be inaccurate, which makes the restoration
work less safe and reliable.
Accurate information via the system helps promote safer and more reliable
restoration work. Source: prepared based on the documents provided by JICA and the interview to NPCC
As shown above, while the planned effects were mostly achieved, additional power stations
and substations have been newly installed during or after the project implementation20. Further stable system operation is required in future for all the power stations and substations to connect the SCADA system. At the time of the ex-post evaluation, NTDC applied the new support to the Asian Development Bank to connect the SCADA system for power stations and substations which had not yet been connected, etc. Greater effects are expected in future by connecting these facilities to the SCADA system installed in this project21.
3.4 Impacts
3.4.1 Intended Impacts The project was expected to boost socioeconomic development by making power system
operation in Pakistan more efficient and stable. However, as indicated in “2.3 Constraints during the Evaluation Study”, it may not be possible to analyze the project impact at the time of the ex-post evaluation because the project should be completed after conducting a reliability run test and when the defect liability period ends22. Conversely, since the expected operation and effect indicators mostly achieved the target values, some degree of impact can be expected. Hence, based on interviews with executing agencies and consultants, the project impacts, their changes and prospects were analyzed.
(1) Ensuring transparency and stable operation of the power system with accurate information
Figure 1 shows changes in number of frequency variations which exceeded a specified range. The project completed the RTU installation to each facility in September 2014. Later, a certain time was required to connect RTU with SCADA and the connection progressed significantly in 2016, the year when the number of frequency variations exceeded a specified range declined to nearly zero. The frequency variation is determined by the balance of power generation and load (demand). When the frequency is significantly fluctuated, turbines for generator and part of the equipment cannot continue operation and a huge power blackout may occur due to power generation stopping23. The installations of SCADA to NPCC and RTU to power stations and substations made it possible to control the frequency by promptly
20 The number of facilities confirmed at the time of the ex-post evaluation is as follows; 17 IPP stations, 4 hydro power stations, 2 thermal power plants; 23 facilities in total. 21 Based on the interview with NPCC 22 Based on the interviews with NPCC and NTDC telecommunication department 23 In January 2015, significant variation was recorded as almost 300 times (Figure 1), which led to a huge power blackout throughout Pakistan.

15
understanding and analyzing the balance of each power generation from each facility, total power generation and load demand, which were formerly obtained over the phone from each facility before project implementation24.
According to the general manager of NPCC, obtaining accurate information and displaying
information promptly made it possible to understand the power system status, accurate demand-supply adjustment and related estimates. Accordingly, it is considered that the project implementation ensured the transparency of the power system (meaning adequate operation of the power system, based on real-time information.)
(2) Cost savings
NPCC managed 70 power stations at the time of the ex-post evaluation and generation costs varied among the individual power stations25. By upgrading the load dispatch system and related facilities, along with power demand, NPCC can start operation of power stations in order from those with lowest unit price for generating power when more power has to be generated and stop operation of power stations with the highest unit price for generating power when generation is reduced. The relevant figures can be determined instantly and effectively, which allows effective system operation and helps reduce power generation and system operation costs. For instance, the NTDC paid Rs. 930,634 million for fuel in 2013,
24 Based on an interview with NPCC 25 The required cost (fuel and O&M) for generating 1 kilowatt (kWh) is Rs. 0.79 at the cheapest power station and Rs. 31.8 at the most expensive power station.
Source: documents provided by NPCC
Figure 1: Changes in the Number of Frequency Variations Exceeding Specified Range

16
but after installing a new load dispatch system, Rs. 728,953 million in 201426, which equated to a cost reduction of 20%27.
3.4.2 Other impacts (1) Impacts on the Natural Environment
All the construction related to the project was equipment procurement and installation within the premises of the executing agency. No impact on the natural environment was also confirmed during interviews with the executing agencies.
(2) Land Acquisition and Resettlement
The project procured and installed equipment within the existing facility site. Thus, no land acquisition and resettlement took place as a result of implementing of the project.
As described above, number of faulty reports of communication of load dispatch system,
average restoration time in transmission line failure, and transmission loss rate were all reduced and more stable and reliable load dispatch system was confirmed. Thus, this project has largely achieved its objectives and its effectiveness and impact are high. 3.5 Sustainability (Rating: ②)
3.5.1 Institutional Aspects of Operation and Maintenance As shown in “2.3 Constraints during the Evaluation Study”, since the reliability run test had
not yet been conducted at the time of the ex-post evaluation, the contractor was continuously responsible for its operation and maintenance. NPCC and NTDC telecommunication department fully start O&M of the equipment on completion of the reliability run test. NPCC, the department overseeing O&M of the central processing system, has 385 staff in total, of whom 124 staff are technical experts. According to the NPCC General Manager, the required number of staff was properly secured. However, O&M of RTU, telecommunication system and telephone network are covered by 120 NTDC telecommunication department staff, 64 of whom are technical experts. According to the chief engineer of the telecommunication department, in order to address the shortage of technical experts, the recruiting process to employ 30 new technical experts has been almost completed, thus the issue is expected to be solved.
The main role of NPCC involves assessing data sent from each facility and operating demand and supply adjustment and system interconnection. Accordingly, technical expertise in the telecommunication system is not specifically required. Under such circumstances,
26 Source: questionnaire responses to NPCC 27 Installation of all equipment in the project was completed in 2014.

17
expertise of NPCC and NTDC telecommunication department are required to operate the load dispatch system. Some equipment is also installed inside a substation and thus, the cooperation with grid station operation (GSO) department of NTDC is also inevitable. However, due to the temporary absence (about 10 months) of the responsible manager of NTDC, who was supposed to manage the whole NTDC, some problems occurred such as a lack of coordination and collaboration among NTDC departments toward project completion. Since a board member (technical person) was assigned to manage and supervise the project toward project completion in 2015, periodic meetings have been held to discuss issues, based on which improvement of the coordination structure can be expected.
3.5.2 Technical Aspects of Operation and Maintenance
NTDC staff are supposed to have a proper technical transfer of O&M from the contractor during the project implementation. Accordingly, at the time of appraisal, technical ability was not considered problematic28. Although training was actually conducted in 2011, an interview with NPCC and NTDC telecommunication department revealed that most of the staff trained had been transferred or resigned. Accordingly, the technical knowledge and experiences of O&M transferred at training were not properly applied, meaning that refresher training should be required after completing a reliability run test to conduct O&M properly. According to the chief engineer of NTDC telecommunication department, the staff of the telecommunication department have abilities in terms of basic operation and maintenance of equipment procured but lack proper skills to fix and repair the equipment. For future adequate O&M, training for technical knowledge and experience in electronics devices and a technical expert with electronic engineering will be required in the NTDC telecommunication department 29 . Meanwhile, the contractor, conducting O&M of equipment at the time of ex-post evaluation, has continued On-the-Job Training for the NPCC and Telecommunication department of NTDC. Furthermore, Asian Development Bank is also examining the feasibility of providing technical assistance in terms of O&M capacity, which means improved technical capacity on O&M can be expected.
Although the O&M manual of equipment was distributed when procured, NTDC staff mentioned that the documents called as-build drawing which is required for O&M were kept by the consultant and not shared with NPCC and NTDC telecommunication department and that they requested the consultant to hand them over promptly.
28 Source: documents provided by JICA 29 According to the board member (technical person) of NTDC assigned to manage and supervise the project toward completion, for proper O&M, technical computer system skills to recover the system failure for NTDC and technical O&M skills for accessories of Power Line Communication (PLC) for NTDC are required.

18
3.5.3 Financial Aspects of Operation and Maintenance The net earnings of NTDC showed a surplus for the past few years and sales also increased
every year. At the time of appraisal, power selling charges arrears by distribution companies caused a decline in sales revenue and an operating profit. At the time of ex-post evaluation, however, electricity charges paid by users to distribution companies were credited to the account in trust and the equivalent charges for transmission power were paid to NTDC through CPPA from that account. Furthermore, the adequate price was set by the National Electric Power Regulatory Authority taking oil prices into consideration, which allows NTDC to secure a stable income. Accordingly, NTDC is less prone to serious issues for O&M from a financial perspective.
Table 7 NTDC Income and Expenditure
(Unit: Rs. Million) Item 2012 2013 2014
Sales 868,459 894,923 1,016,965 Cost of electricity 850,442 878,088 997,128 Sub total 18,017 16,835 19,837 Operating expenses Note 1 18,543 14,771 12,683 Operating profit/loss -526 2,064 7,154
Other income 3,588 96,860 Note 2 1,609 Finance cost 2,769 749 1,365 Profit before tax 293 98,175 7,398 Taxation 90 38,751 57 Net profit after tax for the period 203 59,424 7,341
Source: documents provided by NTDC finance department Note 1:Operating expenses in 2013 and 2014 decreased. Since part of the provision for doubtful debt estimated
in 2012 was reversed in 2013 and the loss of transmission line was decreased in 2014, the operating expenses decreased compared to previous year.
Note 2:As accumulated provision for doubtful debts was reversed in 2013; other income in 2013 exceeded the levels in 2012 and 2014.
At the time of ex-post evaluation, the contractor was conducting O&M of installed equipment in the project, thus the O&M cost was not covered by the NTDC budget. NTDC will secure an O&M budget once the reliability run test is completed. According to NTDC, the O&M cost required for equipment procured under the telecommunication department is estimated at approximately Rs. 51.4 million annually, which is affordable for NTDC’s general budget. It was also explained that the needed O&M cost for equipment installed in NPCC can be also secured, however, the accurate amount is not calculated. Hence, before the reliability run test is completed, it is deemed desirable for NTDC to estimate the accurate O&M cost, including for equipment under NPCC.
As described above, since the O&M cost required can be manageable by the executing agency, there is no concern over sustainability in terms of financial aspects for O&M.

19
3.5.4 Current Status of Operation and Maintenance
As of the ex-post evaluation, since the contractor is working on solving punch list items, O&M is performed by the contractor. Once all items in the punch list have been responded to, a reliability run test will be conducted for six months and following a one-year defect liability period, the project will finally be defined as completed30. Subsequently, O&M will be handed over to NTDC.
The utilization condition of major equipment at the time of ex-post evaluation is summarized as below. According to the NPCC general manager and chief engineer of the telecommunication department, about 80-90% of all major procured equipment is operating.
Table 8 Condition of Utilization of Equipment
Equipment Condition of utilization Central processing
system Good.
RTU 3 out of 49 installed RTUs have issues and are not connected to the system. The contractor is working on this issue toward conducting the reliability run test.
Telecommunication system
Due to communication failures, utilization at the time of ex-post evaluation was about 88%. The contractor is in the process of confirming the reasons.
Telephone network
Configuration issues have occurred in Private Automatic Branch Exchange (PABX), which the consultant is trying to fix. Thus, the utilization rate remains at about 60% at the time of ex-post evaluation.
Development of regional control
center
The utilization rate for telephone network connections between the regional control center and NPCC is 93%.
Source: interviews with NPPC and telecommunication department
A reliability run test was initially scheduled in July 2014. However, this was yet to be conducted at the time of ex-post evaluation for various reasons; issues of installed equipment connection to the system, telecommunication system errors, restrictions on travel to Pakistan for foreign experts of contractors who is in charge of confirming the issues, also differences in understanding of the contract contents between NTDC and the consultant, a consequent lack of clarity over the role of each department responsible for equipment after the installation, moreover, a lack of coordination among departments in NTDC, etc. During the period of after the first field survey till the second field survey of the ex-post evaluation, a revised schedule for the remaining tasks was prepared, based on which some work was
30 According to the executing agency, the project will be competed in March 2017.

20
performed and a certain level of progress was confirmed. Prompt action for full-scale operation of installed equipment is expected toward reliability run test.
In the light of above, some minor problems have been observed in terms of institutional and technical aspect. Therefore sustainability of the project effects is fair.
4. Conclusion, Lessons Learned and Recommendations 4.1 Conclusion
This project was conducted to make the power network more efficient and reliable by modernizing and upgrading the load dispatch system and the related facilities in Pakistan. It is consistent with the development policy of Pakistan, which has focused on power sector reform that contributed to economic growth, and the country’s needs to develop an efficient and reliable power network both at the time of appraisal and ex-post evaluation. It is also consistent with Japanese policy of assistance to Pakistan as of the appraisal. Hence the relevance of this project is high. Though the project cost was within the plan, the project period significantly exceeded the plan for various reasons, such as the delay in the bidding and contract process, the characteristics of the project whereby the new equipment was installed while continuing the operation of existing facilities and equipment, issues of the implementing structure, worsened security and natural disasters, etc. Thus, the efficiency of the project is fair. Thanks to the project, the number of faulty communication reports from load dispatch systems, average restoration time from transmission line failures and the transmission loss rate were reduced, which meant the reliability and stability of the power network were improved. Since impacts such as cost reduction due to efficient power system operation as well as improvement of transparency in the power system were also confirmed, the effectiveness and impact of the project are high. On the other hand, minor issues in NTDC, the institution in charge of maintenance, remain in terms of institutional and technical aspects and the current O&M condition. Accordingly, the sustainability of the project effect is fair.
In light of the above, this project is evaluated to be satisfactory.
4.2 Recommendations 4.2.1 Recommendations to the Executing Agency
・The operation of a load dispatch system requires cooperation and coordination among
related departments in NTDC. During the project implementation, coordination between NPCC, which played the main role as PIU and the telecommunication department, responsible for overseeing the major O&M telecommunication system was not properly made. Therefore, the role and responsibilities remain unclear, which delays necessary work before the start of reliability run test. In NTDC, a board member in charge of managing and

21
supervising the works towards the completion of this project was assigned in 2015, since then regular meetings to discuss the necessary actions have commenced. NTDC needs to continue this meeting with related departments and clarify each role, including the consultant / contractor, through cooperation and coordination, to facilitate smooth progress in the remaining activities toward project completion.
・A reliability run test for installed system is yet to complete in this project, thus NTDC
considers this project incomplete. Accordingly, NTDC needs to get the contractor to work on the items listed in the punch list, conduct the reliability run test immediately and complete equipment hand over to NTDC. In case of slow progress in solving punch list issues, one option could be to start the reliability run test before solving all the issues listed in the punch list with the purpose of detecting issues causing the errors.
・In the course of the project implementation, power stations and substations were newly
constructed. There are also hydroelectric and nuclear power generation plants as well as power plants operated by IPP; most of which have not yet been connected to the system. NTDC needs to prepare a plan to connect such power plants / substation to the system promptly, taking technical assistance into consideration, which is currently examined by the Asian Development Bank. To do so, the further utilization of the installed system can be expected.
・Following the defect liability period, meaning after project completion, the following actions
are required for proper O&M; 1) NTDC needs to work on securing a budget for O&M of the installed equipment including the system managed by NPCC based on an accurate estimated cost, which needs to be calculated with the cooperation of the consultant and contractor, and 2) NTDC needs to prepare refresher training for staff working for O&M to improve and compensate for the lack of the technical O&M capacity.
4.2.2 Recommendations to JICA
・ Due to the lack of coordination in NTDC, the consultant and contractor still do not fully understand the responsible departments of NTDC when they need employer’s confirmation, which disturbed some work up to the point of ex-post evaluation. JICA has monitored the project regularly for promoting the progress from the commencement of the project and participated in monthly meetings of NTDC commenced about a year ago before the ex-post evaluation. JICA is recommended to continue to monitor the progress of the project through participating in meetings, if needed, and to boost the progress.
4.3 Lessons Learned Examine the implementing structure with clear role and responsibility of each stakeholder
In this project, NPCC plays almost solely the role of PIU, which hinders the smooth project
22
implementation and was one of the reasons behind the delay. Not only NPCC, NTDC telecommunication department, which oversees RTU and the telecommunication system, and GSO, responsible for overseeing the facility of grid station are engaged in the load dispatch system operation. Since NPCC staffs are not specialized in equipment and facilities operated and managed by other departments, a lack of technical capacity and less involvement of other departments in the early stage of the project delayed the project. In case the facility or equipment are operated and maintained by several departments as in this project, the executing agency and JICA need to clarify the responsibilities of each department for O&M at the planning stage and role of PIU should be assigned to the institution/department which had highest level of involvement in O&M equipment. Also, it is important that project implementation structure duly involve relevant departments responsible for to be developed facilities and installed equipment in the decision-making process from the beginning of project preparation stage. Prior arrangements to install new equipment in existing facilities In this project, equipment was newly installed in existing facilities. According to the executing
agency, drawings of the existing facilities, required to install the new equipment, were difficult to obtain. Because of that it took longer time to understand the existing situation, before preparing to install the equipment and connect to SCADA systems properly. Therefore, when installing the equipment in existing facilities, the situation of existing facilities needs to be examined in detail, including obtaining drawings at the planning stage. In case sufficient information is not available before the project starts, it is desirable to plan necessary means to collect information to understand the existing situation and condition, and to set the project period considering the time required for such data collection.

23
Comparison of the Original and Actual Scope of the Project
Item Plan Actual
1. Project Outputs Installment of central
processing system ・Power system control ・Hardware
(Servers, Workstation, Local area network, etc.)
・Data processing system
・As planned ・As planned ・Limited Market Operation (Sub function) was deleted from scope of work
Installment of RTU ・9 stations in total (1 power station, 8 substations)
・49 stations in total (16 power stations, 33 substations)
Upgrade of telecommunication system
・10 terminal stations ・35 repeater stations (Replacement of communications network between NPCC data processing system and RTU)
・As planned ・As planned (Existing 500/220/132 kV line was replaced by Optical ground wire (OPGW))
Telephone network Replacement of existing old network of NTDC
・As planned
Development of regional control center
・Telephone network connection with NPCC ・Paint on mimic boards
・As planned ・ Paint on mimic boards was deleted from scope of work
Accommodations 53 accommodations for engineers and staffs of NPCC
・As planned
Vehicles 4 vehicles ・As planned Consulting services Preparation of bidding
documents, bidding support, construction management, reporting project status (self-funded by NTDC)
・As planned
2. Project Period August 2005 -January 2009 (42 months)
August 2005 -January 2016 (126 months)
3. Project Cost Amount Paid in
Foreign Currency Amount Paid in Local
Currency Total Japanese ODA Loan
Portion Exchange Rate
4,131 million yen 1,589 million yen
(908 million Pakistan Rupee) 5,720 million yen
3,839 million yen
1 Pakistan Rupee = 1.75 yen (As of February 2005)
4,235 million yen 1,108 million yen
(821 million Pakistan Rupee) 5,343 million yen 3,513 million yen
1 Pakistan Rupee=1.35 yen (Average between August, 2005
and February, 2013)