Embed Size (px)
Citation preview

Albany, New York | Barcelona, Spain | Bangalore, India | awstruepower.com | +1 877-899-3463
©2011 AWS Truepower, LLC
Michael C. Brower, PhD Chief Technical Officer Jose Vidal, MSc Consulting Services Europe & Latin America Manager Philippe Beaucage, PhD Senior Research Scientist
EWEA Resource Assessment Workshop 2013
Evaluation of four numerical wind flow models

Albany, New York | Barcelona, Spain | Bangalore, India | awstruepower.com | +1 877-899-3463
©2011 AWS Truepower, LLC
Why Do Wind Flow Modeling? • Allows extrapolation from a few points
to an entire wind farm
• Allows optimization of the plant layout
• Doing it well is essential for accurate energy production estimates

Albany, New York | Barcelona, Spain | Bangalore, India | awstruepower.com | +1 877-899-3463
©2011 AWS Truepower, LLC
Key Challenges in Wind Flow Modeling
• Spatial resolution must be ~50 m or better over a domain ~25 km or larger
• Must simulate a wide range of wind conditions
• Should simulate all relevant physical processes – but which are relevant?
• More advanced models require much more computer time than simpler models - but are they worth the cost?

Albany, New York | Barcelona, Spain | Bangalore, India | awstruepower.com | +1 877-899-3463
©2011 AWS Truepower, LLC
Jackson-Hunt* • Fast, linearized, steady-state N-S
solver (e.g., WASP)
• Assumes terrain is a small perturbation on a constant background wind field
• Infers the regional wind climate based on point measurements
• Reverses process to extrapolate to other points
• Includes obstacle, surface roughness modules
*Jackson, P.S. and J.C.R. Hunt (1975). "Turbulent Wind Flow over Low Hill". Quart. J. R. Met. Soc., vol. 101, pp. 929-955.
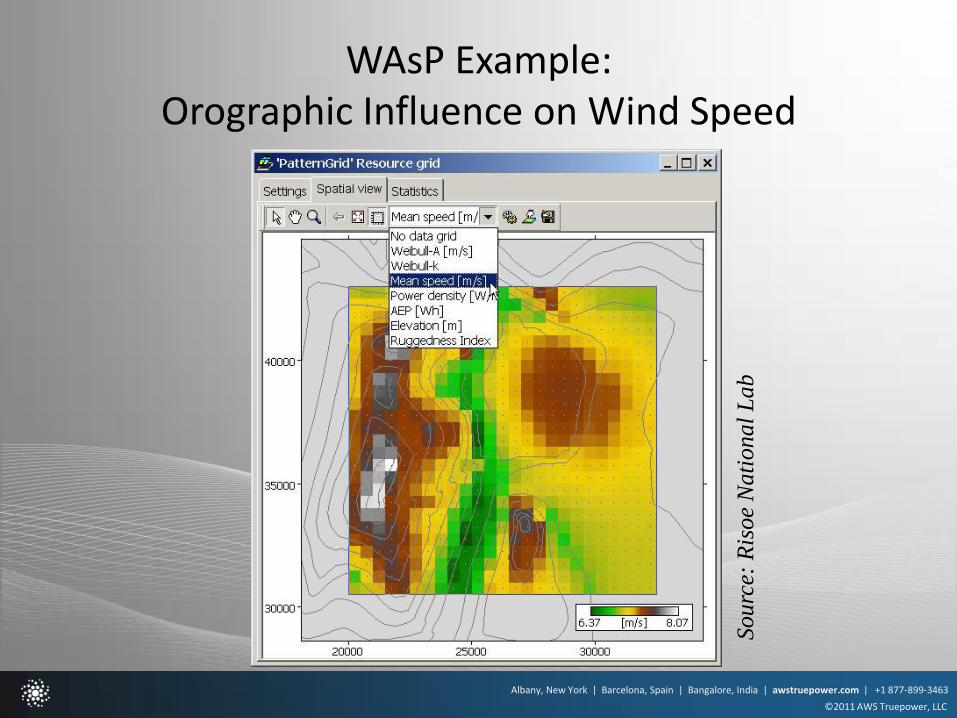
Source: Risoe National Lab
Albany, New York | Barcelona, Spain | Bangalore, India | awstruepower.com | +1 877-899-3463
©2011 AWS Truepower, LLC
WAsP Example: Orographic Influence on Wind Speed
Sourc
e: R
isoe
Nati
onal
Lab
Albany, New York | Barcelona, Spain | Bangalore, India | awstruepower.com | +1 877-899-3463
©2011 AWS Truepower, LLC
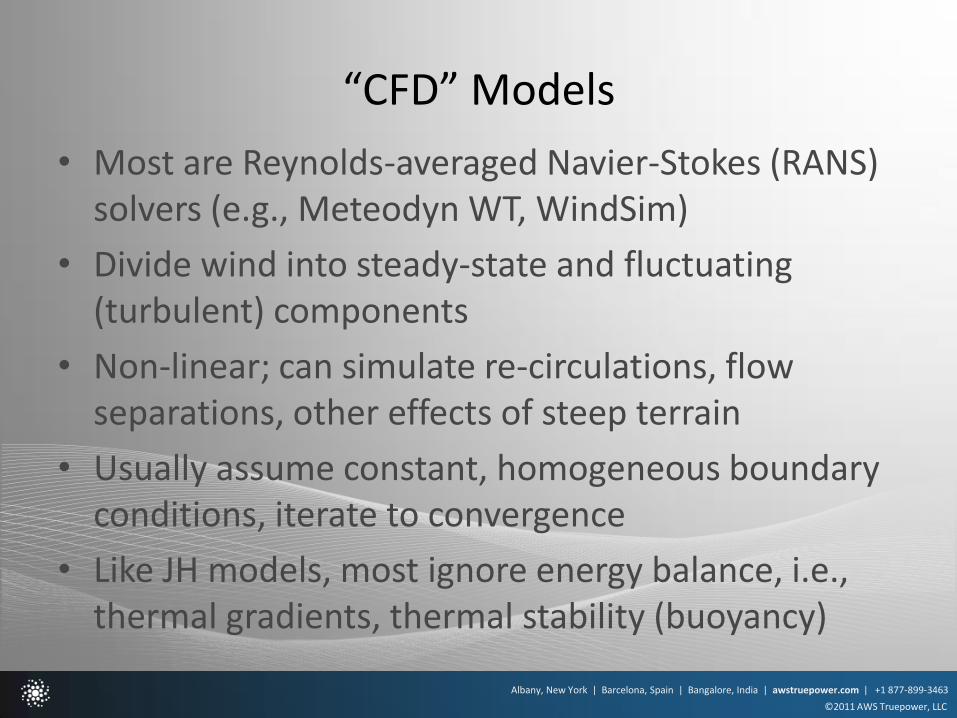
“CFD” Models
• Most are Reynolds-averaged Navier-Stokes (RANS) solvers (e.g., Meteodyn WT, WindSim)
• Divide wind into steady-state and fluctuating (turbulent) components
• Non-linear; can simulate re-circulations, flow separations, other effects of steep terrain
• Usually assume constant, homogeneous boundary conditions, iterate to convergence
• Like JH models, most ignore energy balance, i.e., thermal gradients, thermal stability (buoyancy)

Albany, New York | Barcelona, Spain | Bangalore, India | awstruepower.com | +1 877-899-3463
©2011 AWS Truepower, LLC
RANS-CFD Example: Recirculation Behind a Ridge
Source: WindSim, Vector AS

Albany, New York | Barcelona, Spain | Bangalore, India | awstruepower.com | +1 877-899-3463
©2011 AWS Truepower, LLC
• Full time-varying 3D physical model of the atmosphere. Examples: WRF, MASS, KAMM, ARPS…
• Solve all the primitive equations, including energy balance, surface exchanges, and phase transitions, with turbulence parameterization
• Require 100-1000x as much computer time as linear models; usually done on a high-performance computing cluster
• Can be coupled with linear models to improve resolution, reduce runtime
• Current research: Coupled large eddy simulations to resolve the larger scales of turbulence
Numerical Weather Prediction (NWP) Models

Albany, New York | Barcelona, Spain | Bangalore, India | awstruepower.com | +1 877-899-3463
©2011 AWS Truepower, LLC
NWP Example: Gravity Wave
Albany, New York | Barcelona, Spain | Bangalore, India | awstruepower.com | +1 877-899-3463
©2011 AWS Truepower, LLC
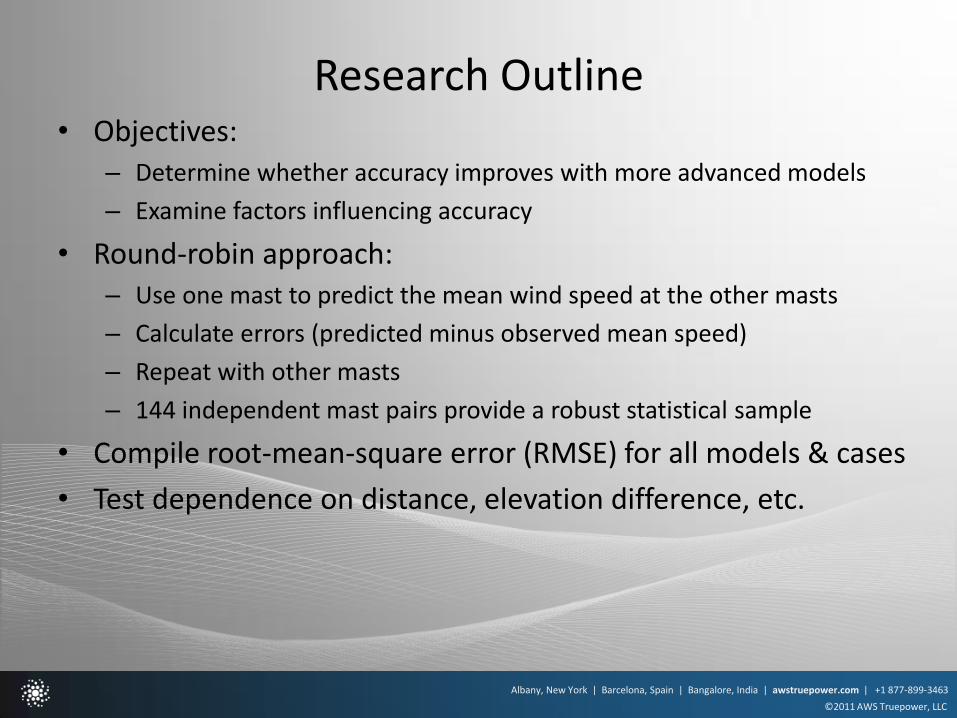
Research Outline • Objectives:
– Determine whether accuracy improves with more advanced models
– Examine factors influencing accuracy
• Round-robin approach: – Use one mast to predict the mean wind speed at the other masts
– Calculate errors (predicted minus observed mean speed)
– Repeat with other masts
– 144 independent mast pairs provide a robust statistical sample
• Compile root-mean-square error (RMSE) for all models & cases
• Test dependence on distance, elevation difference, etc.
Albany, New York | Barcelona, Spain | Bangalore, India | awstruepower.com | +1 877-899-3463
©2011 AWS Truepower, LLC
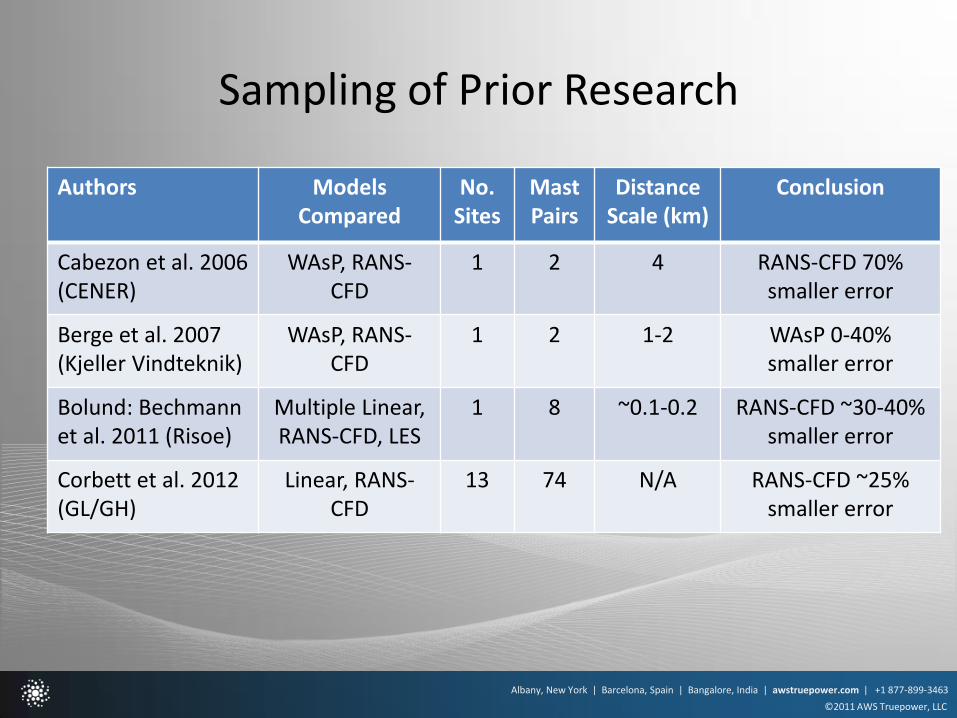
Sampling of Prior Research
Authors Models Compared
No. Sites
Mast Pairs
Distance Scale (km)
Conclusion
Cabezon et al. 2006 (CENER)
WAsP, RANS-CFD
1 2 4 RANS-CFD 70% smaller error
Berge et al. 2007 (Kjeller Vindteknik)
WAsP, RANS-CFD
1 2 1-2 WAsP 0-40% smaller error
Bolund: Bechmann et al. 2011 (Risoe)
Multiple Linear, RANS-CFD, LES
1 8 ~0.1-0.2 RANS-CFD ~30-40% smaller error
Corbett et al. 2012 (GL/GH)
Linear, RANS-CFD
13 74 N/A RANS-CFD ~25% smaller error
Albany, New York | Barcelona, Spain | Bangalore, India | awstruepower.com | +1 877-899-3463
©2011 AWS Truepower, LLC
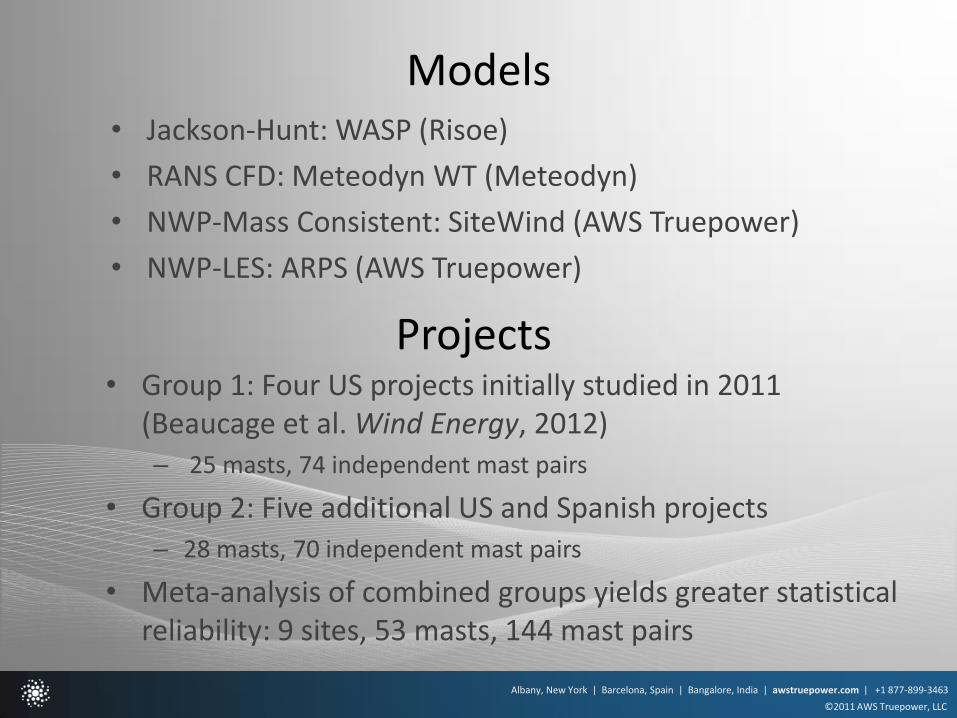
Models • Jackson-Hunt: WASP (Risoe)
• RANS CFD: Meteodyn WT (Meteodyn)
• NWP-Mass Consistent: SiteWind (AWS Truepower)
• NWP-LES: ARPS (AWS Truepower)
Projects • Group 1: Four US projects initially studied in 2011
(Beaucage et al. Wind Energy, 2012) – 25 masts, 74 independent mast pairs
• Group 2: Five additional US and Spanish projects – 28 masts, 70 independent mast pairs
• Meta-analysis of combined groups yields greater statistical reliability: 9 sites, 53 masts, 144 mast pairs

Albany, New York | Barcelona, Spain | Bangalore, India | awstruepower.com | +1 877-899-3463
©2011 AWS Truepower, LLC
Case Projects
Project Group Terrain Land Cover No.
Masts
1 1 Simple Grass, some
trees 8
2 1 Moderate Grass, shrubs 6
3 1 Complex coastal
Mostly forest 3
4 1 Complex Forest 8
5 2 Complex Grass, shrubs 3
6 2 Moderate Grass, trees 5
7 2 Moderate Grass, trees 6
8 2 Simple Grass 7
9 2 Simple Grass, shrubs 7

Albany, New York | Barcelona, Spain | Bangalore, India | awstruepower.com | +1 877-899-3463
©2011 AWS Truepower, LLC
0.0
0.2
0.4
0.6
0.8
1.0
1.2
1.4
P1 P2 P3 P4 P5 P6 P7 P8 P9 All
RM
SE (
m/s
)
Project ID
RMSE by Project
JH
RANS
NWP-MC
NWP-LES
Group 1 Group 2

Albany, New York | Barcelona, Spain | Bangalore, India | awstruepower.com | +1 877-899-3463
©2011 AWS Truepower, LLC
0.0
0.1
0.2
0.3
0.4
0.5
0.6
0.7
0.8
All Group 1 Group 2
RM
SE (
m/s
)
Group
By Group
JH
RANS
NWP-MC
NWP-LES

Albany, New York | Barcelona, Spain | Bangalore, India | awstruepower.com | +1 877-899-3463
©2011 AWS Truepower, LLC
0.0
0.1
0.2
0.3
0.4
0.5
0.6
0.7
0.8
0.9
Simple Moderate Complex
RM
SE (
m/s
)
Terrain Complexity
Terrain Complexity
JH
RANS
NWP-MC

Albany, New York | Barcelona, Spain | Bangalore, India | awstruepower.com | +1 877-899-3463
©2011 AWS Truepower, LLC
0.0
0.2
0.4
0.6
0.8
1.0
1.2
Low Moderate High
RM
SE (
m/s
)
Tree Cover
By Tree Cover
JH
RANS
NWP-MC

Albany, New York | Barcelona, Spain | Bangalore, India | awstruepower.com | +1 877-899-3463
©2011 AWS Truepower, LLC
0.0
0.2
0.4
0.6
0.8
1.0
1.2
0 2 4 6 8 10 12 14
RM
SE (
m/s
)
Distance (km)
By Distance
JH
RANS-CFD
NWP-MC
NWP model dominates Microscale model
dominates

Albany, New York | Barcelona, Spain | Bangalore, India | awstruepower.com | +1 877-899-3463
©2011 AWS Truepower, LLC
Conclusions
• Absolute and relative performance vary greatly from site to site
• For this sample of projects • Complex, forested terrain produce a large (4-5 x) increase in errors for
all models
• At short distance scales, all three models perform about the same; RANS CFD may have a small edge
• As distances increase, NWP-based models perform better, suggesting importance of thermal gradients
• NWP-LES models show promise
• Meta-analyses of multiple sites should be pursued, as they yield insights not available to detailed experiments at single sites