Embed Size (px)
DESCRIPTION
http://cmimarseille.org/_src/EW2_wk1/EW2_wk1_JordanFinalReport.pdf
Citation preview
JORDAN WATER DEMAND MANAGEMENT STUDY
December, 2011
Prepared for the Ministry of Water and Irrigation of Jordan (MWI), supported and funded by
the French Development Agency (AFD / FDA)
i
About this report
This report is the synthesis of a series of reports on aspects of water demand management,
which were prepared for the Jordanian Ministry of Water and Irrigation under a funding
scheme of the French Development Agency by consultants from ATEEC and QUASIR between
July, 2010 and November 2011.
The five reports provide detailed and in‐depth information on the considered topics and are
available at the Ministry of Water and Irrigation and the French Development Agency:
Diagnostic report – compiles information on the current water situation, its future trends
and an assessment of impacts from selected programs in Jordanian water demand
management
Valuation report – comprises calculations and explanations about the values of water in
Jordan’s different sectors of water demand
Intermediary report – describes potential scenarios of water demand development until
2025
Scenario Impact Analysis – gives an overview on the major consequences under the
developed scenarios.
Pre‐conditions for Successful Implementation – comments on the results from the scenario
impact analyses in the framework of Jordan's Water Strategy and Action Plan.
www.quasir.de
ii
Context of the study
The Declaration of the Euro‐Mediterranean Ministerial Conference on Water, adopted by
Ministers and Heads of Delegations participating in the Euro‐Mediterranean Conference on
Water held in Jordan on 22 December 2008 has launched the preparation of a strategy for
water in the Mediterranean. One of the two focuses of this strategy is “the balance between
the quantity of water used and the quantity of water available, including mitigating and
preventing the consequences of droughts and water scarcity”.
In this context, the French Development Agency (AFD) and Blue Plan have proposed, within
the framework of the new Marseille Centre for Mediterranean Integration, to launch a
regional programme on water demand management (WDM), whose main objective is to
make the concept of WDM more operational for decision makers by: 1) building on existing
projects in agriculture optimisation, 2) bringing economic analysis into national strategies
and 3) organising share of experience between high level decision makers.
This Programme is complementary to other regional initiatives related to water demand
management in Mediterranean that provide training and capacity building. It is based on
pilot studies that illustrate how this cost‐effectiveness approach can be a tool for water
decision makers. The present “JORDAN WATER DEMAND MANAGEMENT STUDY” is one of these
case‐studies on Middle Eastern, North African and Balkan Mediterranean countries.
The study was conducted under the auspices and guidance of H.E. Maysoun Zoubi, Secretary
General of the Ministry of Water and Irrigation, with direct supervision from Eng. Ali Subah.
The Steering Committee chaired by Eng. Ali Subah (MWI consisted of Serge Perrin (AFD),
Qais Owais and Nayef Seder (JVA), Khair Hadidi (WAJ), Tobias El‐Fahem (BGR) and Johannes
Stork (MWI‐CIM). Information and data were provided by the MWI, WAJ, JVA, the
Department of Statistics (DoS), other relevant Ministries and the University of Jordan (UoJ).
The scenario development relied on a series of “Story & Simulation (SAS)” workshops hosted
by the MWI between October 2010 and April 2011.
Additional, extensive support was provided by:
MWI – Nisreen Haddad and her team from the Water Demand Management Unit at the MWI
WAJ ‐ F. Al‐Azzam, A. Ulimat, J. Hijazi and B.Saleh
JVA ‐ Y. Hassan and F. Ejeilat
AFD – Frédéric Maurel and Lise Breuil
iii
Table of contents
Context of the study ...................................................................................... ii
Table of contents .......................................................................................... iii
Tables and Figures ........................................................................................ iv
List of Abbreviations ...................................................................................... v
Key findings ................................................................................................... 1
Introduction ................................................................................................... 4
Chapter 1: Prospective water demands of Jordan ......................................... 6
Chapter 2: Water demand by sectors ..........................................................12
Chapter 3: Water resources .........................................................................26
Chapter 4: Economic considerations ............................................................32
Conclusion ...................................................................................................41
References ...................................................................................................42
Appendix 1: Water Demand ............................................................................................. 43
Appendix 2: Water Supply ................................................................................................ 47
Appendix 3: Water Demand Scenarios ............................................................................. 50
Appendix 4: Water Values ................................................................................................ 59
Appendix 5: Cost Benefit Analyses of WDM measures .................................................... 65
Appendix 6: Strategies, policies and legislations ............................................................. 71
iv
Tables and Figures
Table 1: Current cost estimates for WDM measures in Jordan ............................................... 32
Figure 1: Total Water Demand "Aspiration ................................................................................ 8
Figure 2: Total Water Demand "Trend" ..................................................................................... 9
Figure 3: Water re‐allocation from agriculture to municipal water use,
"Trend" scenario (a) ................................................................................................. 11
Figure 4: Water Use 2009 and 2025 ......................................................................................... 12
Figure 5: Balance of Municipal Water Use ............................................................................... 13
Figure 6 Industrial water use 2001 ‐ 2008 ............................................................................... 15
Figure 7: Recorded Irrigation Water Use ................................................................................. 17
Figure 8: Water Allocation in the Jordan Valley ....................................................................... 21
Figure 9: Remaining freshwater for agriculture ....................................................................... 22
Figure 10: Development of treated wastewater from municipal water use ........................... 23
Figure 11: Availability of water for agriculture ........................................................................ 24
Figure 12: Planned Water Supply 2010 – 2025 ........................................................................ 26
Figure 13: Comparison of expected water supply and water demand .................................... 31
Figure 14: Costs of water gains from WDM programs "Green Code",
"Awareness" and "Institutions & policies" .............................................................. 33
Figure 15: Costs of water gains from water network rehabilitation
(reduction of physical NRW) .................................................................................... 34
Figure 16: Cost and benefits of intended WDM measures in irrigation .................................. 36
Figure 17: Costs and benefits of water transfer from agriculture to municipal water use ..... 37
v
List of Abbreviations
AWC Aqaba Water Company
CRW Crop Water Requirement
DOS Department of Statistics
HPC Higher Population Council
IDARA Project “Instituting Water Demand Management In Jordan”
IRR Internal rate of return, estimated rate of interest of an investment
JVA Jordan Valley Authority
Lcd liters per capita and day
MCM Million Cubic Meter
MWI Ministry of Water and Irrigation
NGWA Northern Governorates Water Administration (legal predecessor of Al‐
Yarmouk Water Company LLC (YWC) until mid‐2010)
NPV Net present value, value of a timeline of costs, benefits or the
difference between both discounted to their present value.
NRW Non Revenue Water (cf. UFW, water loss)
NWMP National Water Master Plan (MWI, 2004)
NWS National Water Strategy ("Water for life", MWI 2009)
OS Operation Surplus
PMU Performance Management Unit (MWI)
UFW Unaccounted‐ for Water (cf. NRW, water loss)
UNSNA United Nations System of National Accounts
WAJ Water Authority of Jordan
WDM Water Demand Management
WDMU Water Demand Management Unit at the MWI
YWC Al‐Yarmouk Water Company LLC (cf. NGWA)
1
Key findings
The Ministry of Water and Irrigation (MWI), supported by the French Development Agency,
commissioned a consortium of Jordanian and international experts with a series of
consecutive analyses and workshops on water demand management. The objective was to
evaluate potential impacts of current water demand management (WDM) options under
different assumptions about the development of frame conditions.
The conclusive interpretation of the findings allow for the following statements and
recommendations:
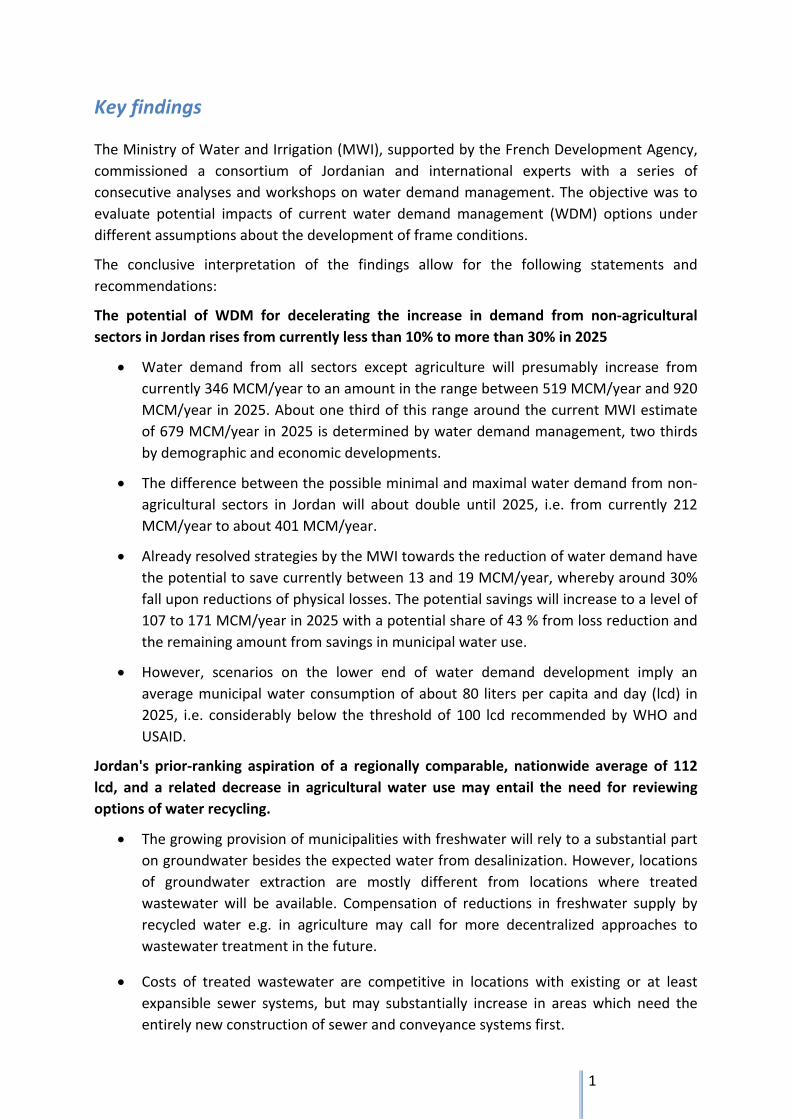
The potential of WDM for decelerating the increase in demand from non‐agricultural
sectors in Jordan rises from currently less than 10% to more than 30% in 2025
Water demand from all sectors except agriculture will presumably increase from
currently 346 MCM/year to an amount in the range between 519 MCM/year and 920
MCM/year in 2025. About one third of this range around the current MWI estimate
of 679 MCM/year in 2025 is determined by water demand management, two thirds
by demographic and economic developments.
The difference between the possible minimal and maximal water demand from non‐
agricultural sectors in Jordan will about double until 2025, i.e. from currently 212
MCM/year to about 401 MCM/year.
Already resolved strategies by the MWI towards the reduction of water demand have
the potential to save currently between 13 and 19 MCM/year, whereby around 30%
fall upon reductions of physical losses. The potential savings will increase to a level of
107 to 171 MCM/year in 2025 with a potential share of 43 % from loss reduction and
the remaining amount from savings in municipal water use.
However, scenarios on the lower end of water demand development imply an
average municipal water consumption of about 80 liters per capita and day (lcd) in
2025, i.e. considerably below the threshold of 100 lcd recommended by WHO and
USAID.
Jordan's prior‐ranking aspiration of a regionally comparable, nationwide average of 112
lcd, and a related decrease in agricultural water use may entail the need for reviewing
options of water recycling.
The growing provision of municipalities with freshwater will rely to a substantial part
on groundwater besides the expected water from desalinization. However, locations
of groundwater extraction are mostly different from locations where treated
wastewater will be available. Compensation of reductions in freshwater supply by
recycled water e.g. in agriculture may call for more decentralized approaches to
wastewater treatment in the future.
Costs of treated wastewater are competitive in locations with existing or at least
expansible sewer systems, but may substantially increase in areas which need the
entirely new construction of sewer and conveyance systems first.
2
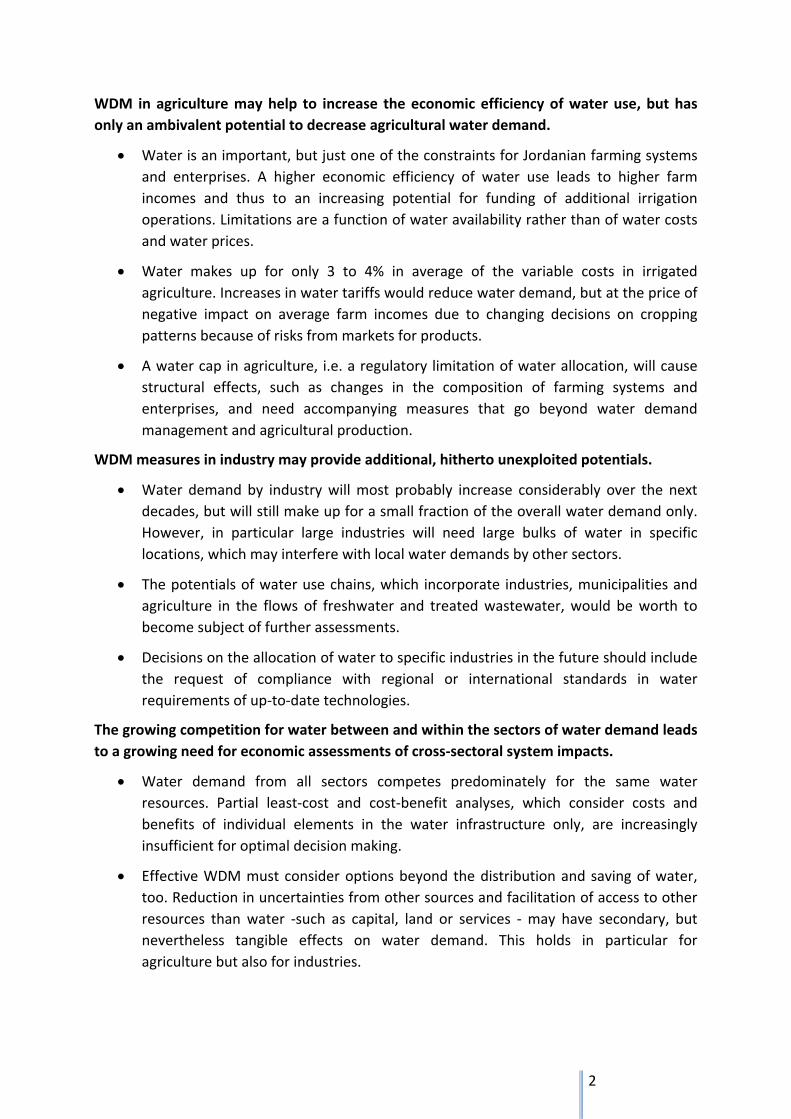
WDM in agriculture may help to increase the economic efficiency of water use, but has
only an ambivalent potential to decrease agricultural water demand.
Water is an important, but just one of the constraints for Jordanian farming systems
and enterprises. A higher economic efficiency of water use leads to higher farm
incomes and thus to an increasing potential for funding of additional irrigation
operations. Limitations are a function of water availability rather than of water costs
and water prices.
Water makes up for only 3 to 4% in average of the variable costs in irrigated
agriculture. Increases in water tariffs would reduce water demand, but at the price of
negative impact on average farm incomes due to changing decisions on cropping
patterns because of risks from markets for products.
A water cap in agriculture, i.e. a regulatory limitation of water allocation, will cause
structural effects, such as changes in the composition of farming systems and
enterprises, and need accompanying measures that go beyond water demand
management and agricultural production.
WDM measures in industry may provide additional, hitherto unexploited potentials.
Water demand by industry will most probably increase considerably over the next
decades, but will still make up for a small fraction of the overall water demand only.
However, in particular large industries will need large bulks of water in specific
locations, which may interfere with local water demands by other sectors.
The potentials of water use chains, which incorporate industries, municipalities and
agriculture in the flows of freshwater and treated wastewater, would be worth to
become subject of further assessments.
Decisions on the allocation of water to specific industries in the future should include
the request of compliance with regional or international standards in water
requirements of up‐to‐date technologies.
The growing competition for water between and within the sectors of water demand leads
to a growing need for economic assessments of cross‐sectoral system impacts.
Water demand from all sectors competes predominately for the same water
resources. Partial least‐cost and cost‐benefit analyses, which consider costs and
benefits of individual elements in the water infrastructure only, are increasingly
insufficient for optimal decision making.
Effective WDM must consider options beyond the distribution and saving of water,
too. Reduction in uncertainties from other sources and facilitation of access to other
resources than water ‐such as capital, land or services ‐ may have secondary, but
nevertheless tangible effects on water demand. This holds in particular for
agriculture but also for industries.
3
The findings recommend the following five focal points for an efficient WDM policy:
Coordinate water demand policies with Jordan's overall goals and sectorial
objectives. Gains in the economic efficiency of water use may – and do often ‐stand
against development goals and economic efficiencies of other resources and in other
sectors. This requires (1) the reduction of overlaps in mandates and the improvement
of cooperation between water authorities as well as between ministries and (2)
quantified social and economic assessments of policies with regard to the overall
goals rather than with regard to water economics alone. The Ministry of Water and
Irrigation, Ministry of Municipalities, Ministry of Agriculture, and Ministry of
Environment should formulate a joint policy.
Prioritize the stability of a continuous water supply. A low risk in water supply in
times of water demand reduces water use by the insurance rate, i.e. water stocked or
overused in order to minimize risks from sudden interruption of supply. This holds for
over‐irrigation in agriculture as well as for excessive stocking of water from water
tankers by resident households. Possible actions in this regard range from recharge
of the groundwater aquifers as "natural buffer capacities", other decentralized water
storage capacities and the continued reclamation of wastewater up to the respective
planning of storage elements in the intended mega‐projects.
Support resident households in their efforts for water savings and water recycling.
Potential gains from water demand management result mostly from lower expansion
rates of water use per capita. Increasing benefits from water use without
proportional increases in water consumption, e.g. by measures from Jordan's "green
code", requires investments which may not be shouldered by families or property
owners alone. The same holds for installations in urban rainwater harvesting,
greywater use and sewerage.
Address the question on water for agriculture from the focus of rural area
development. Decisions on water distribution and caps in water for irrigation must
take into account (1) the specific functions of land use systems, (2) the economic and
operational fundamentals of the different types of farming systems, (3) the desired
objectives towards modernization and structural adjustments in the agricultural
sector and (4) the livelihood and environmental structures that Jordan wants to
preserve. The central technical challenges and opportunities are the control of
groundwater over‐abstraction and the continuous expansion of water recycling.
Develop the Water Information System (WIS) into a Water Management
Information System (MIS). The Jordanian water administrations and utilities already
run extensive systems of data collection and partial analyses. The resulting data and
information bases are fragmented and scattered in several sub‐units of the
authorities and the MWI, which is an obstacle with regard to quick and reliable
information for the Ministry's decision makers. There is an urgent need for
consolidation and transformation into a Management Information System with
defined workflows and specifications that include economic performance indicators.
4
Introduction
Jordan’s economic opportunities, social necessities and aspirations entail a significant
growth in water demand over the last decades and will continue to do so in the future. This
coincides with a situation where the exploitation of renewable natural water resources
already exceeds a sustainable level and the reclamation of non‐conventional water
resources requires considerable investments. The resulting increase in water costs and
values amplifies the role of economic reflections in decision making on water resource
management as well as on the allocation and use of water in the different sectors of water
consumption.
Jordan’s water management in the past has been dominated by the necessity to supply
water. Initial approaches to the management of water demand focused in particular on
agriculture in the Jordan Valley through operations on water‐distribution by the Jordan
Valley Authority (JVA). Water demand management (WDM) in other sectors than agriculture
gained momentum with the establishment of a Water Demand Management Unit (WDMU)
at the Ministry of Water and Irrigation (MWI) in 2002. More recent activities of the Unit
include the USAID‐funded IDARA project (2007‐2011), which supported the build‐up of
institutional capacities, and a close cooperation with Jordan’s private utilities in planning and
prognoses of future water requirements.
The MWI defined WDM as one of the pillars in its strategy of a “rational water resources
management consistent with overall national socio‐economic development objectives”.
Tentative milestones of this strategy formulation are Jordan’s National Water Master Plan
(NWMP, 2004) and its National Water Strategy 2008‐2022 (“Water for Life”, NWS, 2009),
which are subject to continuous updates and enhancements. This indicates that WDM in
Jordan intends to go beyond the economic pricing of water and partial criteria of water use
efficiency, such as water productivities in different sectors of water consumption.
The present study inserts itself into the development of an efficient strategy by contributing
analyses and projections about the framework, results and economic consequences of
options in Water Demand Management. It builds on information from the broad data bases
provided by the MWI, JVA, Water Authority of Jordan (WAJ), Department of Statistics (DOS),
Water and Environmental Research and Study Centre (WERSC, University of Jordan) and
other Jordanian organizations, current research results on water in Jordan as well as on the
results from four workshops and numerous interviews with Jordanian professionals from
different fields of expertise.
The main objectives of the study were
to bring economic analysis into Jordan water policy and help prioritizing actions
according to their cost‐effectiveness
to propose a cost‐effectiveness analysis of these different actions, and to
5
enhance ownership of the activities proposed under the Jordan National Water
Strategy by ensuring the involvement of key stakeholders and authorities.
Work steps towards the fulfillment of these objectives included:
A review and analysis of current water politics and the status of water resources
an assessment of future trends in water resources, available water supply, water
demand, water pollution and of the impact from selected existing WDM programs in
Jordan,
the calculation of economic values of water in the different sectors of water demand,
the workshop‐based development and impact assessment of alternative scenarios on
the development of water demand in Jordan and
the identification of pre‐conditions for the successful implementation of each
scenario.
This report summarizes and integrates information from the more detailed reports on each
of the work steps.
6
Chapter 1: Prospective water demands of Jordan
Jordan's water requirements started to exceed its natural water resources already in the
1970s (1). The Jordanian government undertook substantial efforts over the last decades to
alleviate this deficit through the mobilization of additional water resources, which included
surface water, water recycling, desalination and extractions from non‐renewable aquifers.
However, the gap between sustainable water supply and water consumption still increases
until today. Demographic and economic growth as well as the intended developments in
mining and new energies will magnify the
speed of growth in water demand.
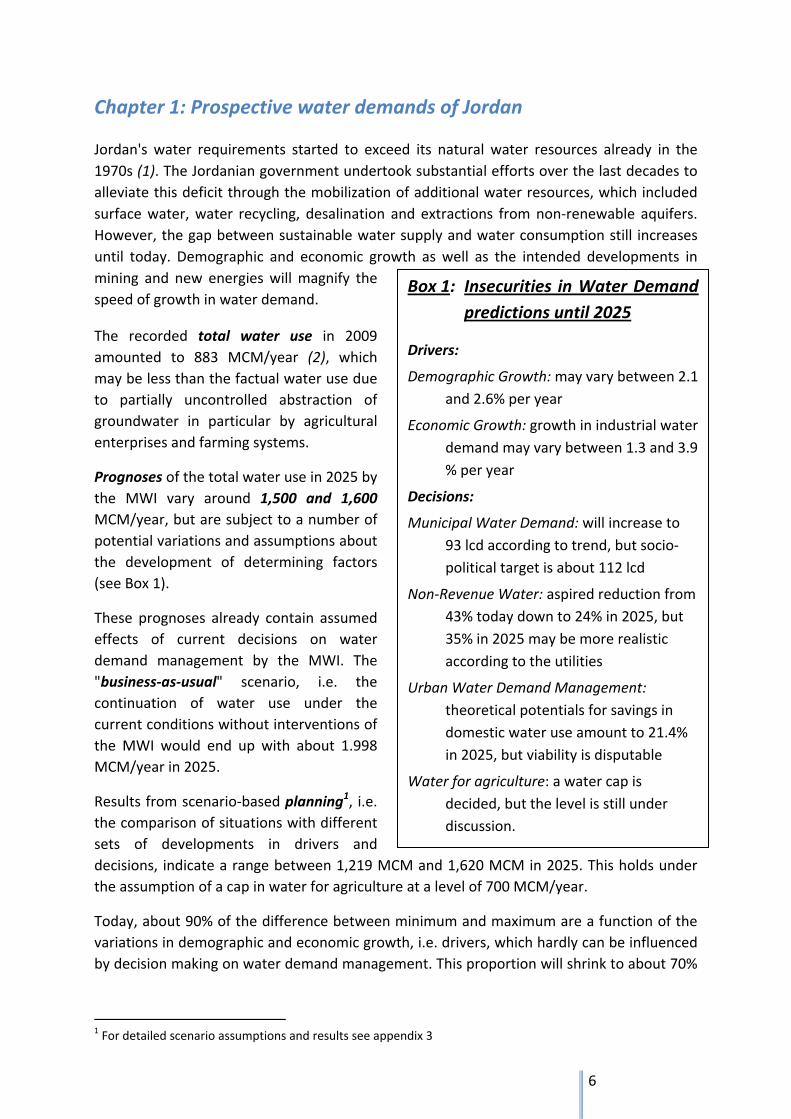
The recorded total water use in 2009
amounted to 883 MCM/year (2), which
may be less than the factual water use due
to partially uncontrolled abstraction of
groundwater in particular by agricultural
enterprises and farming systems.
Prognoses of the total water use in 2025 by
the MWI vary around 1,500 and 1,600
MCM/year, but are subject to a number of
potential variations and assumptions about
the development of determining factors
(see Box 1).
These prognoses already contain assumed
effects of current decisions on water
demand management by the MWI. The
"business‐as‐usual" scenario, i.e. the
continuation of water use under the
current conditions without interventions of
the MWI would end up with about 1.998
MCM/year in 2025.
Results from scenario‐based planning1, i.e.
the comparison of situations with different
sets of developments in drivers and
decisions, indicate a range between 1,219 MCM and 1,620 MCM in 2025. This holds under
the assumption of a cap in water for agriculture at a level of 700 MCM/year.
Today, about 90% of the difference between minimum and maximum are a function of the
variations in demographic and economic growth, i.e. drivers, which hardly can be influenced
by decision making on water demand management. This proportion will shrink to about 70%
1 For detailed scenario assumptions and results see appendix 3
Box 1: Insecurities in Water Demand
predictions until 2025
Drivers:
Demographic Growth: may vary between 2.1
and 2.6% per year
Economic Growth: growth in industrial water
demand may vary between 1.3 and 3.9
% per year
Decisions:
Municipal Water Demand: will increase to
93 lcd according to trend, but socio‐
political target is about 112 lcd
Non‐Revenue Water: aspired reduction from
43% today down to 24% in 2025, but
35% in 2025 may be more realistic
according to the utilities
Urban Water Demand Management:
theoretical potentials for savings in
domestic water use amount to 21.4%
in 2025, but viability is disputable
Water for agriculture: a water cap is
decided, but the level is still under
discussion.
7
until 2025. The remaining 30%, which equal about 120 MCM in 2025, depend on water
demand management and the development of water use per capita.
The considered components of this water demand management include the success in
reducing water losses (NRW) and in the implementation of water saving measures in
municipal water use, which includes domestic water use as well as water for tourism,
commerce, education, health, governmental offices, worship and other urban infrastructure.
1.1 Aspiration – 112 lcd in average nationwide
The current domestic water use in Jordan is, with a national average of about 70 lcd,
considerably lower than the 100 lcd, which were proposed by the WHO as the lower bound
of an optimal water access (3). The factual, nationwide average municipal water demand,
which includes besides domestic water also water for commerce, education, health,
governmental offices, worship and other urban infrastructure, is estimated to be up to 112
lcd. Variances within the country range from 102 lcd in Karak up to 138 lcd in Amman.
Jordan's water strategy (4) formulates the goal to increase the nationwide municipal water
supply to a nationwide average of 120 lcd in 2022. However, the current planning by the
MWI calculates with the mentioned 112 lcd (without water losses), but aspires to achieve
this goal already in the immediate future. This is still below the regional target value of 120
to 150 l/c/d but marks a substantial improvement to the past.
Water demand management measures, which are supposed to alleviate the sharply
growing water demand under this scenario, are the reduction of water losses (NRW) and the
implementation of household water
saving measures. Both approaches are
still in the stage of planning and early
implementation, so there is still
insecurity about the size of their factual
success in the future.
A comparison between scenario (a),
where NRW reduction achieves only a
level of 35% and water savings in
households have nearly no effects, and
the scenario (b), where NRW reduction
succeeds in achieving the intended level
of 24% and water saving measures allow
for a reduction of domestic water needs
by 21.4%, indicates that
The difference in total water demand
between both scenarios would
Box 2: Non‐Revenue Water
NRW, which is called Unaccounted‐for
Water (UFW) in the National Water Master
Plan, consists out of:
Administrative losses: this water is part of
the water use, but does not yield
revenues for the utility.
Physical losses: Losses due to leakages and
other inefficiencies in conveyance
systems.
The working assumption of the MWI
assumes an equal share of both types of
losses in the current 43% NRW in municipal
water supply. Assumed reductions in the
scenario calculations consider physical losses
only.
8
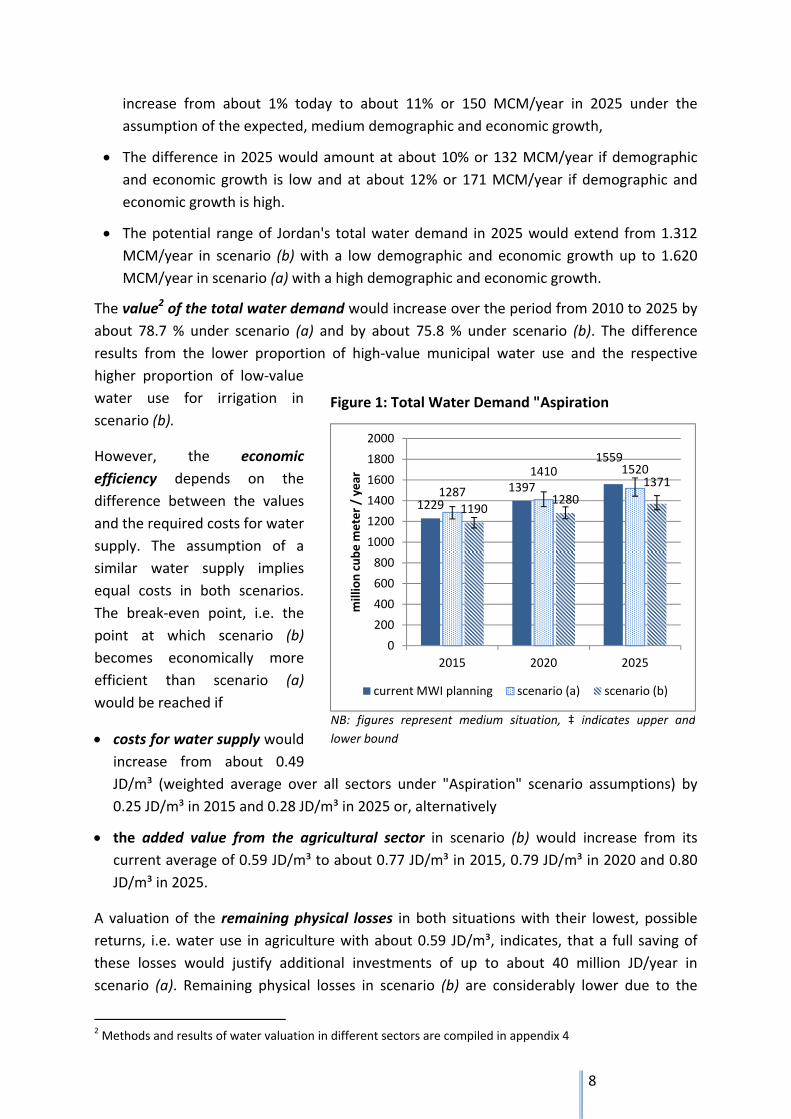
increase from about 1% today to about 11% or 150 MCM/year in 2025 under the
assumption of the expected, medium demographic and economic growth,
The difference in 2025 would amount at about 10% or 132 MCM/year if demographic
and economic growth is low and at about 12% or 171 MCM/year if demographic and
economic growth is high.
The potential range of Jordan's total water demand in 2025 would extend from 1.312
MCM/year in scenario (b) with a low demographic and economic growth up to 1.620
MCM/year in scenario (a) with a high demographic and economic growth.
The value2 of the total water demand would increase over the period from 2010 to 2025 by
about 78.7 % under scenario (a) and by about 75.8 % under scenario (b). The difference
results from the lower proportion of high‐value municipal water use and the respective
higher proportion of low‐value
water use for irrigation in
scenario (b).
However, the economic
efficiency depends on the
difference between the values
and the required costs for water
supply. The assumption of a
similar water supply implies
equal costs in both scenarios.
The break‐even point, i.e. the
point at which scenario (b)
becomes economically more
efficient than scenario (a)
would be reached if
costs for water supply would
increase from about 0.49
JD/m³ (weighted average over all sectors under "Aspiration" scenario assumptions) by
0.25 JD/m³ in 2015 and 0.28 JD/m³ in 2025 or, alternatively
the added value from the agricultural sector in scenario (b) would increase from its
current average of 0.59 JD/m³ to about 0.77 JD/m³ in 2015, 0.79 JD/m³ in 2020 and 0.80
JD/m³ in 2025.
A valuation of the remaining physical losses in both situations with their lowest, possible
returns, i.e. water use in agriculture with about 0.59 JD/m³, indicates, that a full saving of
these losses would justify additional investments of up to about 40 million JD/year in
scenario (a). Remaining physical losses in scenario (b) are considerably lower due to the
2 Methods and results of water valuation in different sectors are compiled in appendix 4
Figure 1: Total Water Demand "Aspiration
NB: figures represent medium situation, ‡ indicates upper and
lower bound
1229
1397
1559
1287
1410 1520
11901280
1371
0
200
400
600
800
1000
1200
1400
1600
1800
2000
2015 2020 2025
million cube m
eter / year
current MWI planning scenario (a) scenario (b)
9
assumed higher efficiency in NRW reduction and would justify additional investments of 14
million JD/year in 2025.
1.2 Trend – continuation of past developments in water demand
A continuation of the trends over the last decades would lead to a nationwide average of 88
lcd of domestic water use in 2025 plus an additional 5 lcd for other municipal water
demands. The differences in municipal water demand within the country would vary
between 68 lcd in the governorate of Ajloun and about 110 lcd in Amman and Aqaba,
whereby the population in all governorates except for these both would receive less than
100 lcd in 2025. т‡
The calculations of the both scenarios (a) and (b) under trend assumptions indicate that
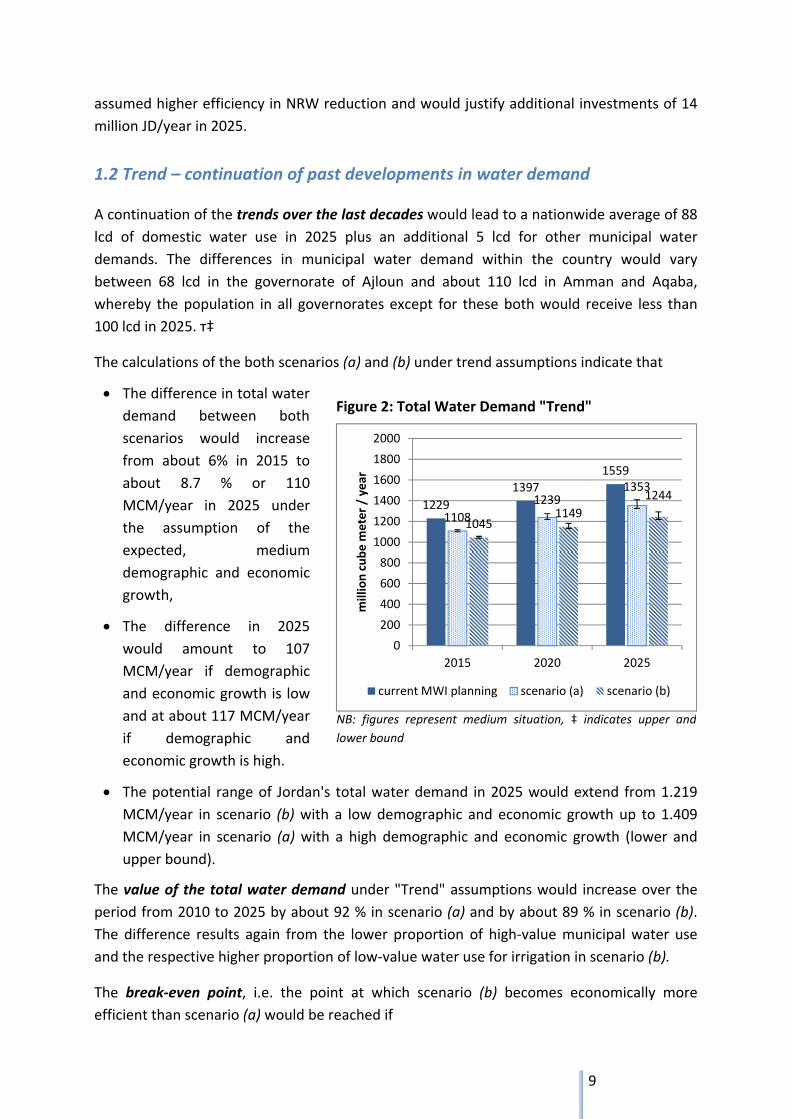
The difference in total water
demand between both
scenarios would increase
from about 6% in 2015 to
about 8.7 % or 110
MCM/year in 2025 under
the assumption of the
expected, medium
demographic and economic
growth,
The difference in 2025
would amount to 107
MCM/year if demographic
and economic growth is low
and at about 117 MCM/year
if demographic and
economic growth is high.
The potential range of Jordan's total water demand in 2025 would extend from 1.219
MCM/year in scenario (b) with a low demographic and economic growth up to 1.409
MCM/year in scenario (a) with a high demographic and economic growth (lower and
upper bound).
The value of the total water demand under "Trend" assumptions would increase over the
period from 2010 to 2025 by about 92 % in scenario (a) and by about 89 % in scenario (b).
The difference results again from the lower proportion of high‐value municipal water use
and the respective higher proportion of low‐value water use for irrigation in scenario (b).
The break‐even point, i.e. the point at which scenario (b) becomes economically more
efficient than scenario (a) would be reached if
Figure 2: Total Water Demand "Trend"
NB: figures represent medium situation, ‡ indicates upper and
lower bound
1229
1397
1559
1108
12391353
10451149
1244
0
200
400
600
800
1000
1200
1400
1600
1800
2000
2015 2020 2025
million cube m
eter / year
current MWI planning scenario (a) scenario (b)
10
costs for water supply would increase from the currently about 0.43 JD/m³ (weighted
average over all sectors under "Trend" assumptions) by 0.19 JD/m³ in 2015 and 0.21
JD/m³ in 2025 or, alternatively
the added value from the agricultural sector in scenario (b) would increase from its
current average of 0.59 JD/m³ to about 0.68 JD/m³ in 2015, 0.70 JD/m³ in 2020 and 0.72
JD/m³ in 2025.
A valuation of the remaining physical losses in both situations with their lowest, possible
returns, i.e. water use in agriculture with about 0.59 JD/m³, indicates, that a full saving of
these losses would justify additional investments of up to about 25.7 million JD/year in
scenario (a). Remaining physical losses in scenario (b) are considerably lower due to the
assumed higher efficiency in NRW reduction and would justify additional investments of 11
million JD/year in 2025.
1.3 Major differences between "Aspiration" and "Trend"
Increasing the municipal water use of Jordanians from trend extrapolations to a regionally
comparable level of 112 lcd would require an additional amount of 180 MCM of water in
2015 and of 167 MCM in 2025. This holds under the assumption of medium developments in
demography and economy.
Low growth in demography and economy would decrease the additionally required water to
124 MCM in 2015 and 118 MCM in 2025. High growth in both drivers would increase the
additionally required water to 224 MCM in 2015 and 211 MCM in 2025. The decreasing
difference between 2015 and 2025 is in all cases due to the steady increase of daily water
use under "Trend" assumptions over the observed period.
Changes in demographic and economic developments have considerably stronger effects on
the total water demand under "Aspiration" assumptions than under "Trend" assumptions.
Consequences for planning under "Aspiration" assumptions include the necessity for a more
diligent consideration of contingency plans for potential disproportionate increases in water
requirements as well as the related higher investment costs in water supply and storage
infrastructure.
Investments in water savings under "Trend" assumptions become already cost‐effective at a
lower level of increases in water costs or with lower increases in water use efficiency in
agriculture. This effect originates from the higher value of municipal water compared to
water for agriculture and the higher proportion of the former in the total water use under
"Aspiration" assumptions. It is correct from an economic point of view, but disregards the
fact that the value of water for municipal purposes is, amongst others, a function of water
costs. This emphasizes the difference between financial budget calculations of the
government, which may come to different results, and economic evaluations, which focus on
the value added of the whole national economy only.
11
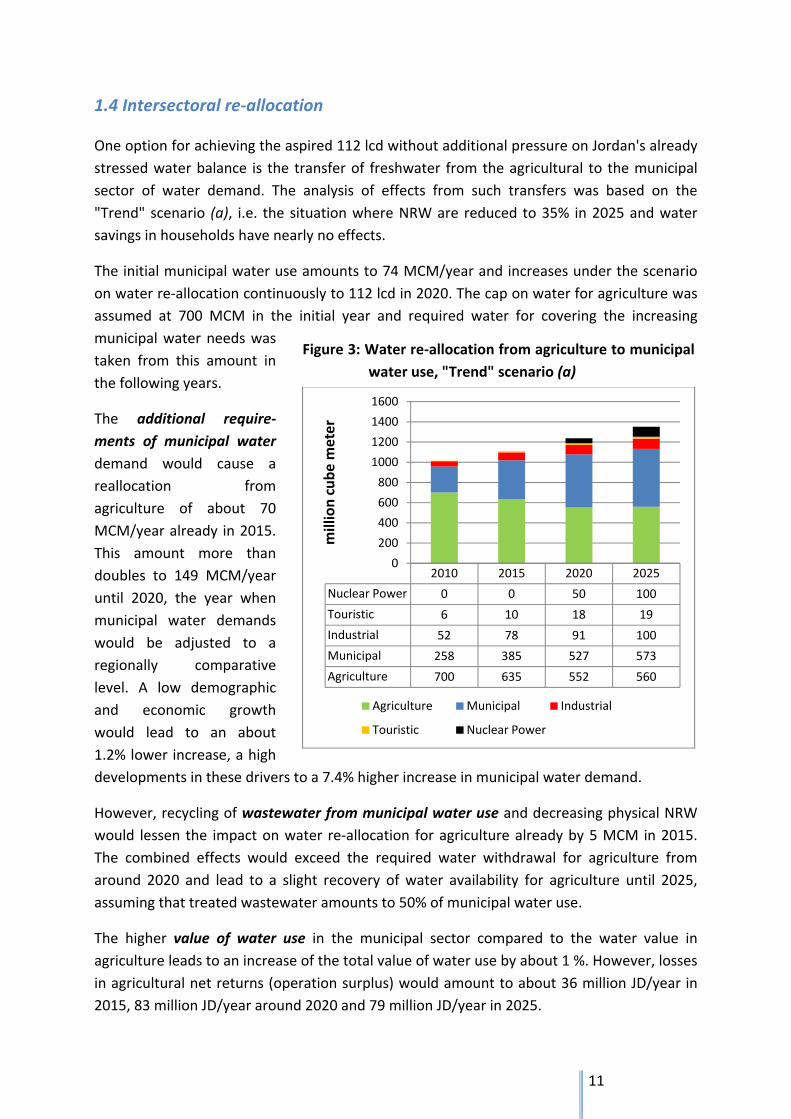
1.4 Intersectoral re‐allocation
One option for achieving the aspired 112 lcd without additional pressure on Jordan's already
stressed water balance is the transfer of freshwater from the agricultural to the municipal
sector of water demand. The analysis of effects from such transfers was based on the
"Trend" scenario (a), i.e. the situation where NRW are reduced to 35% in 2025 and water
savings in households have nearly no effects.
The initial municipal water use amounts to 74 MCM/year and increases under the scenario
on water re‐allocation continuously to 112 lcd in 2020. The cap on water for agriculture was
assumed at 700 MCM in the initial year and required water for covering the increasing
municipal water needs was
taken from this amount in
the following years.
The additional require‐
ments of municipal water
demand would cause a
reallocation from
agriculture of about 70
MCM/year already in 2015.
This amount more than
doubles to 149 MCM/year
until 2020, the year when
municipal water demands
would be adjusted to a
regionally comparative
level. A low demographic
and economic growth
would lead to an about
1.2% lower increase, a high
developments in these drivers to a 7.4% higher increase in municipal water demand.
However, recycling of wastewater from municipal water use and decreasing physical NRW
would lessen the impact on water re‐allocation for agriculture already by 5 MCM in 2015.
The combined effects would exceed the required water withdrawal for agriculture from
around 2020 and lead to a slight recovery of water availability for agriculture until 2025,
assuming that treated wastewater amounts to 50% of municipal water use.
The higher value of water use in the municipal sector compared to the water value in
agriculture leads to an increase of the total value of water use by about 1 %. However, losses
in agricultural net returns (operation surplus) would amount to about 36 million JD/year in
2015, 83 million JD/year around 2020 and 79 million JD/year in 2025.
2010 2015 2020 2025
Nuclear Power 0 0 50 100
Touristic 6 10 18 19
Industrial 52 78 91 100
Municipal 258 385 527 573
Agriculture 700 635 552 560
0
200
400
600
800
1000
1200
1400
1600
million cube m
eter
Agriculture Municipal Industrial
Touristic Nuclear Power
Figure 3: Water re‐allocation from agriculture to municipal
water use, "Trend" scenario (a)
12
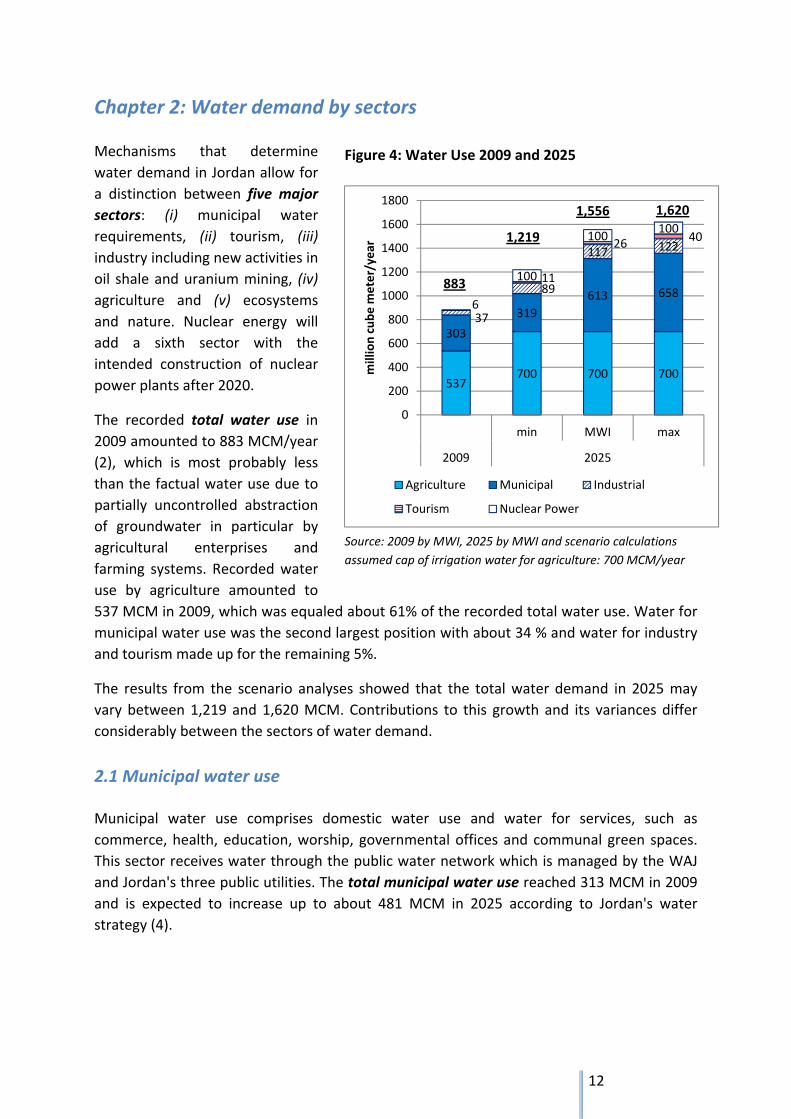
Chapter 2: Water demand by sectors
Mechanisms that determine
water demand in Jordan allow for
a distinction between five major
sectors: (i) municipal water
requirements, (ii) tourism, (iii)
industry including new activities in
oil shale and uranium mining, (iv)
agriculture and (v) ecosystems
and nature. Nuclear energy will
add a sixth sector with the
intended construction of nuclear
power plants after 2020.
The recorded total water use in
2009 amounted to 883 MCM/year
(2), which is most probably less
than the factual water use due to
partially uncontrolled abstraction
of groundwater in particular by
agricultural enterprises and
farming systems. Recorded water
use by agriculture amounted to
537 MCM in 2009, which was equaled about 61% of the recorded total water use. Water for
municipal water use was the second largest position with about 34 % and water for industry
and tourism made up for the remaining 5%.
The results from the scenario analyses showed that the total water demand in 2025 may
vary between 1,219 and 1,620 MCM. Contributions to this growth and its variances differ
considerably between the sectors of water demand.
2.1 Municipal water use
Municipal water use comprises domestic water use and water for services, such as
commerce, health, education, worship, governmental offices and communal green spaces.
This sector receives water through the public water network which is managed by the WAJ
and Jordan's three public utilities. The total municipal water use reached 313 MCM in 2009
and is expected to increase up to about 481 MCM in 2025 according to Jordan's water
strategy (4).
Figure 4: Water Use 2009 and 2025
537700 700 700
303
319
613 658
37
89
117 122
6
11
2640
100
100100
0
200
400
600
800
1000
1200
1400
1600
1800
min MWI max
2009 2025
million cube m
eter/year
Agriculture Municipal Industrial
Tourism Nuclear Power
883
1,219
1,556 1,620
Source: 2009 by MWI, 2025 by MWI and scenario calculations
assumed cap of irrigation water for agriculture: 700 MCM/year
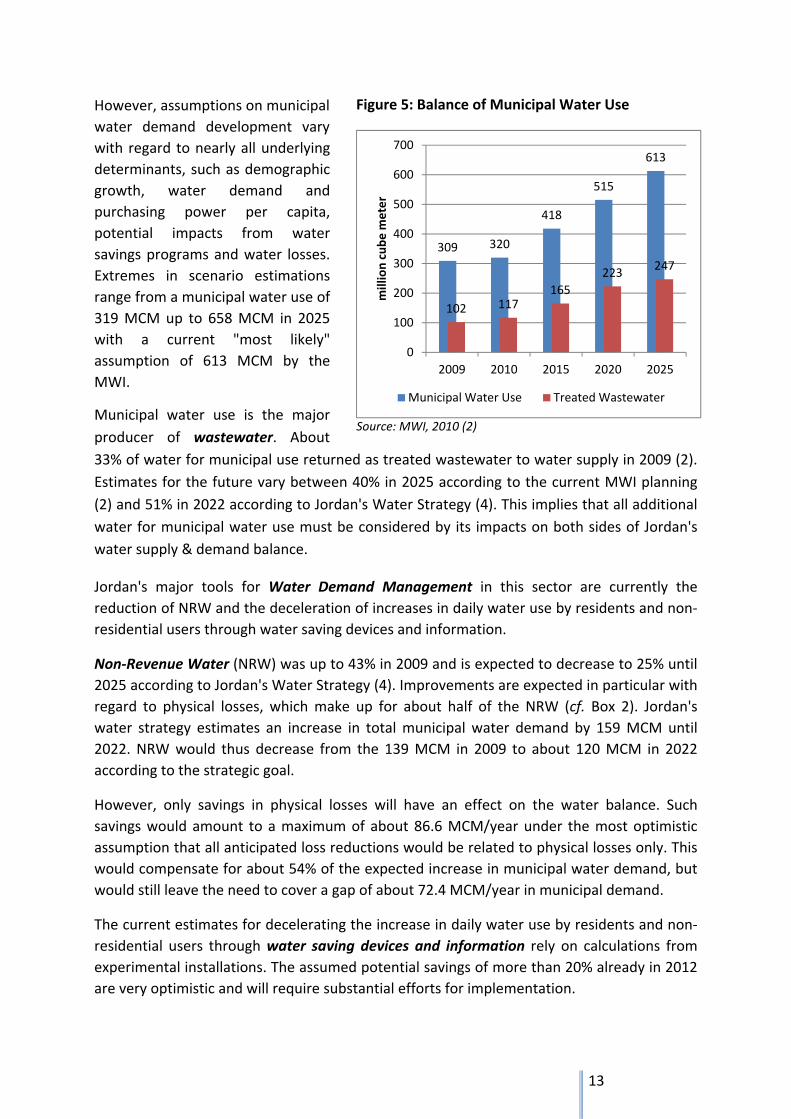
13
However, assumptions on municipal
water demand development vary
with regard to nearly all underlying
determinants, such as demographic
growth, water demand and
purchasing power per capita,
potential impacts from water
savings programs and water losses.
Extremes in scenario estimations
range from a municipal water use of
319 MCM up to 658 MCM in 2025
with a current "most likely"
assumption of 613 MCM by the
MWI.
Municipal water use is the major
producer of wastewater. About
33% of water for municipal use returned as treated wastewater to water supply in 2009 (2).
Estimates for the future vary between 40% in 2025 according to the current MWI planning
(2) and 51% in 2022 according to Jordan's Water Strategy (4). This implies that all additional
water for municipal water use must be considered by its impacts on both sides of Jordan's
water supply & demand balance.
Jordan's major tools for Water Demand Management in this sector are currently the
reduction of NRW and the deceleration of increases in daily water use by residents and non‐
residential users through water saving devices and information.
Non‐Revenue Water (NRW) was up to 43% in 2009 and is expected to decrease to 25% until
2025 according to Jordan's Water Strategy (4). Improvements are expected in particular with
regard to physical losses, which make up for about half of the NRW (cf. Box 2). Jordan's
water strategy estimates an increase in total municipal water demand by 159 MCM until
2022. NRW would thus decrease from the 139 MCM in 2009 to about 120 MCM in 2022
according to the strategic goal.
However, only savings in physical losses will have an effect on the water balance. Such
savings would amount to a maximum of about 86.6 MCM/year under the most optimistic
assumption that all anticipated loss reductions would be related to physical losses only. This
would compensate for about 54% of the expected increase in municipal water demand, but
would still leave the need to cover a gap of about 72.4 MCM/year in municipal demand.
The current estimates for decelerating the increase in daily water use by residents and non‐
residential users through water saving devices and information rely on calculations from
experimental installations. The assumed potential savings of more than 20% already in 2012
are very optimistic and will require substantial efforts for implementation.
Source: MWI, 2010 (2)
309 320
418
515
613
102 117165
223247
0
100
200
300
400
500
600
700
2009 2010 2015 2020 2025million cube m
eter
Municipal Water Use Treated Wastewater
Figure 5: Balance of Municipal Water Use
14
However, the minimum water use in the municipal sector of 319 MCM in 2025 relies on the
assumption that municipal water use does not grow faster than its trend in the past and that
all of these expected water savings can be achieved. The average water supply would then
amount to 69 liters per capita and day only, which is in the area of the current water
provision level and articulately below regionally comparable standards.
The costs of water supply via public networks vary between 0.50 JD/m³ and 0.61 JD/m³.
However, the apportionment of these costs on billed water only increases the costs per m³
to a range from 0.8 and 0.9 JD/m³ in Amman, Aqaba, and the northern regions and up to
1.20 JD/m³ in the rest of Jordan. Current
average water tariffs for residential
customers cover with 0.42 JD/m³ only a
part of the full costs. Non‐residents, e.g.
commerce and offices, pay 1 JD/m³.
Wastewater discharge adds to both tariffs
with another 0.39 JD/m³ and 0.59 JD/m³,
respectively.
Costs of water provision will increase in
the future due to the additionally required
water from new investment projects, such
as the Disi water conveyance, water
network rehabilitation, Jordan Read Sea
Conveyance or its alternative, the Red‐Sea‐
Dead‐Sea Project. As an example,
estimated costs of Disi water supply are up
to about 0.8 JD/m³. Adding distribution
cost and accounting for NRW at the
current level would bring the costs of
delivering Disi water to customers up to
around 1.5 JD/m³.
The value of water3 for municipal water
users depends on the current costs for water provision and the opportunity costs of a
potential use of this water by another client. This implies for the comparison with other
sectors that an increase in water costs increases the value of municipal water value, but
decreases the net value of water in other sectors. Current water values range from 1.36
JD/m³ in Amman to 1.61 JD/m³ in the northern regions with a nationwide average of 1.49
JD/m³.
3 On methods and results for water valuation see appendix 4
Box 3: Definitions
Water demand = requested water for
(monetary and non‐monetary) beneficial
use
Water requirement = water required for
sustaining living standards (households),
operations (industry, tourism,
agriculture) and functionality (e.g.
nature, agriculture)
Water use = water demand covered by water
supply
Water consumption = water use minus return
flows
Water supply = water provision from developed
water resources
Water allocation = determined amount of
water supply for a specific purpose or
region
15
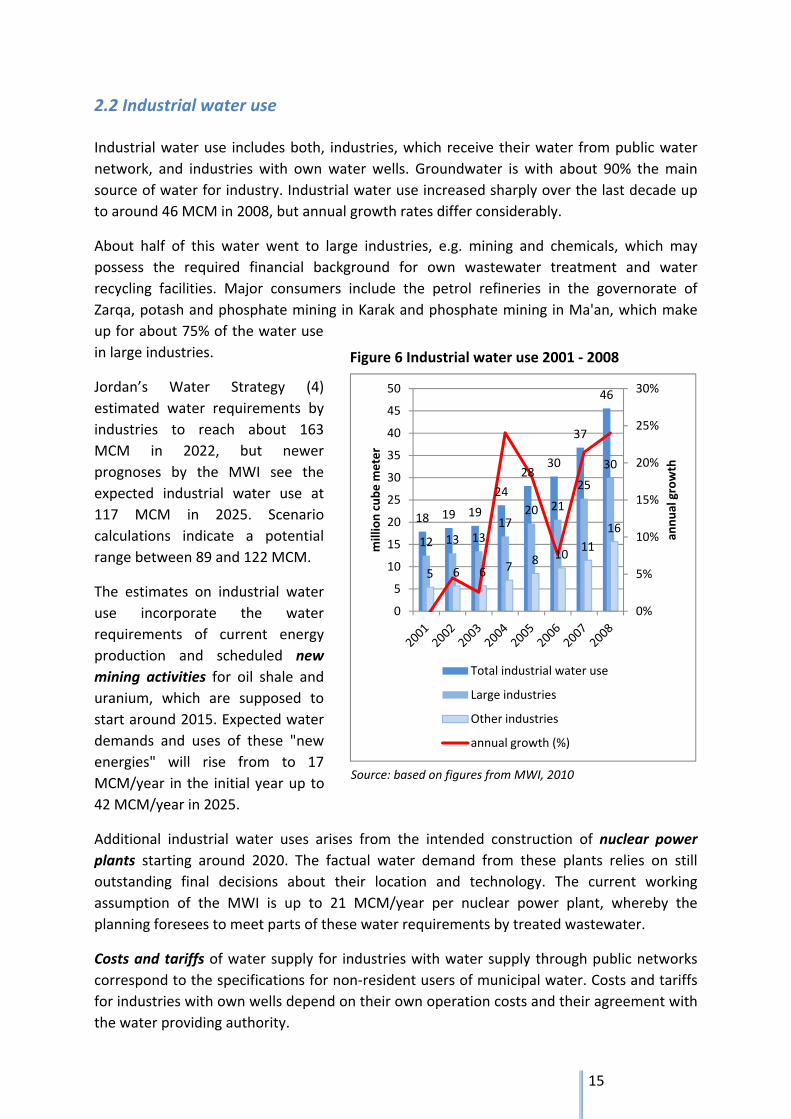
2.2 Industrial water use
Industrial water use includes both, industries, which receive their water from public water
network, and industries with own water wells. Groundwater is with about 90% the main
source of water for industry. Industrial water use increased sharply over the last decade up
to around 46 MCM in 2008, but annual growth rates differ considerably.
About half of this water went to large industries, e.g. mining and chemicals, which may
possess the required financial background for own wastewater treatment and water
recycling facilities. Major consumers include the petrol refineries in the governorate of
Zarqa, potash and phosphate mining in Karak and phosphate mining in Ma'an, which make
up for about 75% of the water use
in large industries.
Jordan’s Water Strategy (4)
estimated water requirements by
industries to reach about 163
MCM in 2022, but newer
prognoses by the MWI see the
expected industrial water use at
117 MCM in 2025. Scenario
calculations indicate a potential
range between 89 and 122 MCM.
The estimates on industrial water
use incorporate the water
requirements of current energy
production and scheduled new
mining activities for oil shale and
uranium, which are supposed to
start around 2015. Expected water
demands and uses of these "new
energies" will rise from to 17
MCM/year in the initial year up to
42 MCM/year in 2025.
Additional industrial water uses arises from the intended construction of nuclear power
plants starting around 2020. The factual water demand from these plants relies on still
outstanding final decisions about their location and technology. The current working
assumption of the MWI is up to 21 MCM/year per nuclear power plant, whereby the
planning foresees to meet parts of these water requirements by treated wastewater.
Costs and tariffs of water supply for industries with water supply through public networks
correspond to the specifications for non‐resident users of municipal water. Costs and tariffs
for industries with own wells depend on their own operation costs and their agreement with
the water providing authority.
Figure 6 Industrial water use 2001 ‐ 2008
Source: based on figures from MWI, 2010
18 19 19
24
2830
37
46
12 13 1317
20 21
25
30
5 6 6 7 8 1011
16
0%
5%
10%
15%
20%
25%
30%
0
5
10
15
20
25
30
35
40
45
50
annual growth
million cube m
eter
Total industrial water use
Large industries
Other industries
annual growth (%)
16
Applied and foreseen Water Demand Management tools for the industrial sector focus on
wastewater treatment, i.e. the reduction of water consumption instead of water use. All
major industries and mines are supposed to be connected or equipped with wastewater
treatment plants until 2022, which would make up for 45 to 61 MCM/year of treated
wastewater under the assumption of a recycling rate of 50%.
However, Jordan's Water Strategy (4) foresees only 27 MCM of treated wastewater for
industrial use in 2022, which would leave some leeway for water chain management, i.e. the
use of recycled water from industries in agriculture or for environmental purposes. Recycling
of water from Nuclear Power Plants for use in other sectors is currently not regarded as an
option.
Water values vary highly between industries and are naturally lowest in sectors with high
water demands. Industrial sectors with the lowest profits per m³ in the inflation‐adjusted 6‐
year average were mining and quarrying, chemicals and food products, which are
simultaneously the largest industrial water consumers. Their weighted operation surplus, i.e.
the approximate pre‐tax profit income4, amounted from 38 up to 46 JD/m³. Sectors on the
upper end of profits per m³ include oil, gas, coke and petroleum products with 680 up to
more than 5.574 JD/m³, but consume less than 2% of the total water for industries.
The total operation surplus of Jordan’s industries, amounted to about 2.48 billion JD in 2008,
which corresponded to an average operation surplus of about 55 JD/m³. This was well below
the 6‐year average of about 78 JD/m³.
2.3 Water use by tourism
Water use by tourism includes water for hotels, restaurants and other tourist services and
facilities. Water to this sector is supplied by WAJ and the utilities via the domestic water
network and is considered administratively as part of the municipal water supply. Touristic
water use reached around 10 MCM in 2007 and is expected to reach 29 MCM by year 2025
(NWS, 2009). Scenario calculations set the range for 2025 between 11 and 40 MCM.
The majority of water use in tourism arises in the three touristic centers Amman, Aqaba and
the hotel resorts along the eastern shore of the Dead Sea. Applied and foreseen Water
Demand Management tools comprise amongst others greywater and water recycling.
International studies show that water saving techniques allow for a decrease of water use in
hotels by about 20% without affecting standards or clients' satisfaction. However, these
studies were conducted in countries with moderate climates and experiences in Jordan are
still outstanding.
4 The operation surplus represents the difference between the gross value added including producer subsidies minus (1) the consumption of fixed capital, (2) compensation for employees and (3) indirect taxes (definition according to the United Nations System of National Accounts, UNSNA)
17
A complete separation of water demands by tourism from transport and commercial
services for the local population is difficult. Hotels and restaurants consumed about 7.8
MCM in 2007, which corresponded to an operation surplus of about 38 JD/m³. Water values
in other sectors where distinctly higher and ranged from 66 JD/m3 in food and beverages
sales up to 303 JD/m3 for the repair of personnel and household equipment (cf. appendix 4).
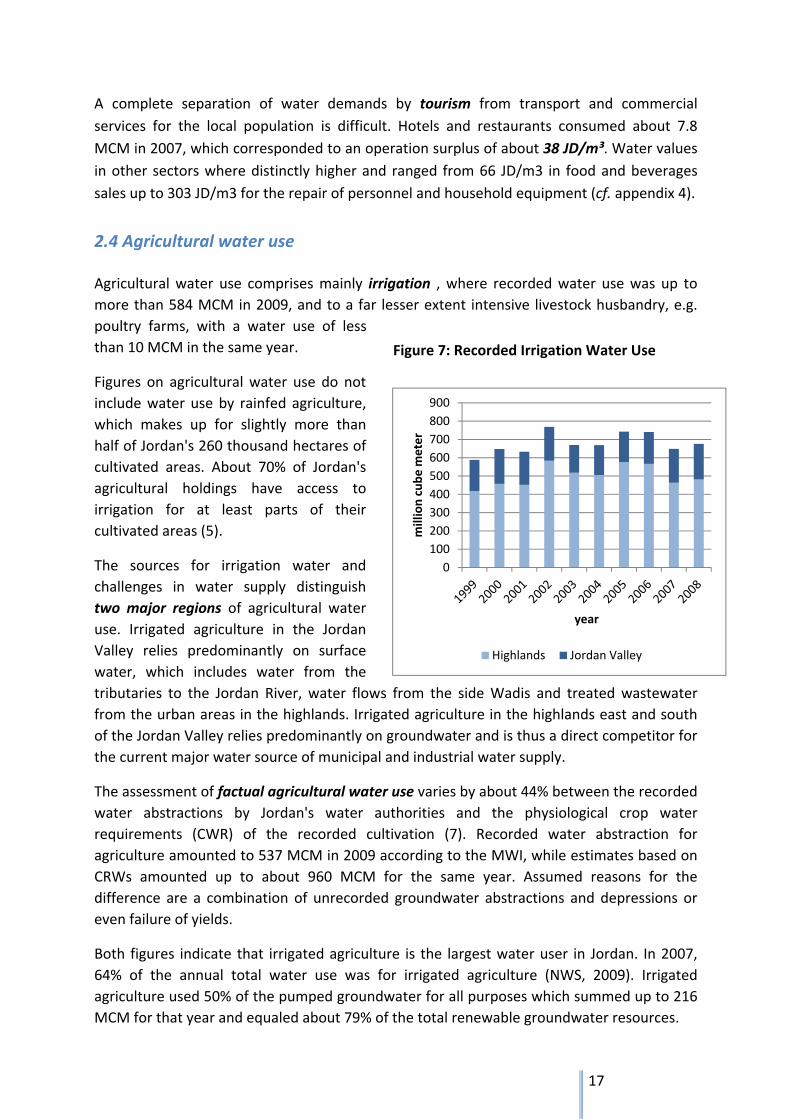
2.4 Agricultural water use
Agricultural water use comprises mainly irrigation , where recorded water use was up to
more than 584 MCM in 2009, and to a far lesser extent intensive livestock husbandry, e.g.
poultry farms, with a water use of less
than 10 MCM in the same year.
Figures on agricultural water use do not
include water use by rainfed agriculture,
which makes up for slightly more than
half of Jordan's 260 thousand hectares of
cultivated areas. About 70% of Jordan's
agricultural holdings have access to
irrigation for at least parts of their
cultivated areas (5).
The sources for irrigation water and
challenges in water supply distinguish
two major regions of agricultural water
use. Irrigated agriculture in the Jordan
Valley relies predominantly on surface
water, which includes water from the
tributaries to the Jordan River, water flows from the side Wadis and treated wastewater
from the urban areas in the highlands. Irrigated agriculture in the highlands east and south
of the Jordan Valley relies predominantly on groundwater and is thus a direct competitor for
the current major water source of municipal and industrial water supply.
The assessment of factual agricultural water use varies by about 44% between the recorded
water abstractions by Jordan's water authorities and the physiological crop water
requirements (CWR) of the recorded cultivation (7). Recorded water abstraction for
agriculture amounted to 537 MCM in 2009 according to the MWI, while estimates based on
CRWs amounted up to about 960 MCM for the same year. Assumed reasons for the
difference are a combination of unrecorded groundwater abstractions and depressions or
even failure of yields.
Both figures indicate that irrigated agriculture is the largest water user in Jordan. In 2007,
64% of the annual total water use was for irrigated agriculture (NWS, 2009). Irrigated
agriculture used 50% of the pumped groundwater for all purposes which summed up to 216
MCM for that year and equaled about 79% of the total renewable groundwater resources.
Source: based on figures from MWI, 2010
0
100
200
300
400
500
600
700
800
900million cube m
eter
year
Highlands Jordan Valley
Figure 7: Recorded Irrigation Water Use
18
Agricultural production contributes only about 3.6% to Jordan's GDP and employs 2% of its
labor force, but 30% of Jordan's population lives in rural areas. Arguments for water supply
to agriculture do thus not only rely on production values but also on functions of agriculture
in the preservation and development of rural systems and areas.
The Jordanian government decided to approach future water allocation to agriculture by a
combined strategy of control of hitherto unrecorded groundwater abstractions and a
simultaneous cap of water for this sector. The intended level of the cap is still under
discussion. Current ideas range between 700 and 1,000 MCM/year, which would put the
water allocation somewhere between half and the upper limit of the estimated physiological
water demand for the current cropping pattern on Jordan's cultivated areas. Most of the
increased control of groundwater wells and the water cap will affect agriculture in the
highlands, which use currently about 70% of the recorded total irrigation water.
Applied and foreseen Water Demand Management tools in agriculture focus in particular
on increases in irrigation efficiency, water tariffing and water caps. Increases in water
efficiency include technical as well as managerial improvements, e.g. the promotion of water
users associations and participatory irrigation management (PIM). The evaluation of first
experiences with PIM in the Jordan Valley yielded promising results with regard to cost
reduction in water supply and increases in economic water use efficiency. However, all
measures which focus on irrigation efficiency and water productivity promoted the
extension of the now even more profitable agricultural activities and increased rather than
decreased water demands.
The Jordan Valley Authority uses blocked tariffs with increasing prices for higher water
quotas already since the 1990s. The experience shows that this also did not lead to
decreases in water demand, which is a function of land tenureship, rental agreements,
resource endowment of different types of farming systems and the situation of alternative
incomes for farming families.
Water quotas and charges for over‐abstraction of wells in the highlands, as stipulated in the
Underground Water Control By‐Law no. 85 (2002) and its amendments (2003, 2004, 2007),
did not solve the problem of unsustainable groundwater withdrawal either.
Jordan's water strategy foresees a cap for water use in agriculture and an enforced control
of groundwater abstraction from currently private wells and boreholes. The consequences
and secondary effects of these measures will highly depend on the conditions of these
regulatory measures.
Costs of water for irrigation depend on the source of water and vary widely. The Jordan
Valley Authority (JVA) applies a block tariff structure and charges about 0,02 JD/m³ for water
from the pressurized irrigation water system, which covers approximately 40% percent of
the costs for operation and maintenance (O&M) and 10% of the full costs. However,
irrigation in the Jordan Valley also uses treated and blended wastewater, which would be of
less use otherwise without additional and expensive steps for purification.
19
Costs of water for irrigation in the highlands depend in the first place on the investments
and O&M costs for the private well operators. Tariffs by the water authorities are up to
0.025 JD/m³ for non‐licensed wells and increase stepwise with the amount of water
extraction. Owners of licensed wells pay this tariff only for over‐abstraction, i.e. above
150.000 m³/year.
Proportional variations in the value of water for agricultural production are on a similar
scale as for water in industry, but considerable lower in absolute terms. The operation
surplus in crop production ranged from 0.011 JD/m³ for some millet varieties up to nearly 4
JD/m³ for cucumbers in 2008. The average, weighted operation surplus per group of crops
amounted to 0.288 JD/m³ for field crops, 0.789 JD/m³ for vegetables and 0.149 JD/m³ for
fruit trees under the cropping pattern in 2008. The overall average operation surplus in crop
production amounted to 0.563 JD/m³ in 2008. However, these values are subject to changes
between the years due to the variations in prices for agricultural products as well as in
cropping patterns.
Livestock husbandry consumes less than 2% of the water for agricultural purposes but yields
much higher returns per m³. However, accessible data allowed for the calculation of the
Gross Value Added only, which ranged in 2009 from about 9 JD/m³ for laying hens up to 56
JD/m³ in hatcheries. The average Gross Value Added in Livestock production amounted to
18.06 JD/m³ in the year of reference.
2.4.1 Starting points for WDM in the agricultural sector
Agriculture is the only sector of water demand where an intra‐sectoral reallocation of water
is likely. But even in this sector reallocation of water would be restricted to exchanges within
a given location. A mere transfer of water to more water‐efficient crops would benefit
already specialized rich farmers, but discriminates against poorer farmers, who depend on
diversification in order to minimize risk and do not possess the required capacities, e.g.
capital, for the required adjustments of production and marketing structures.
Expectable consequences from an unidirectional focus on economic water use efficiency
alone would include in the first place:
a structural change in Jordanian farming systems towards larger enterprises and a
decline in smaller family farms and traditional farming and
an increase in agricultural water demand due to the improved economics of irrigation
water use in combination with farming enterprises, which possess the required
endowment in land and capital for enhancing their farming business.
Suitable policies and instruments to curtail agricultural water demand without undesired
consequences will depend on the identification of the specific functions of land use systems,
the economic and operational fundamentals of the different types of farming systems, the
desired objectives towards modernization and structural adjustments in the agricultural
sector and the livelihood and environmental structures that Jordan wants to preserve.
20
The central technical challenge is the improvement of farmers' access to irrigation
techniques and training under the simultaneous consideration of
an equitable provision of services to all farmers, which may require additional
adjustments in the economic frame conditions , e.g. access to capital, for farms with
low resource endowment and the respective harmonization in the planning of local
rural development,
the control of groundwater abstraction, which allows for its reduction to a
sustainable level, and
the further expansion of water recycling, i.e. treated wastewater use, which provides
the major alternative water resource.
Data for the required farming systems analyses, which have to include the socio‐economic
situation of concerned farming families, exist in part for the Jordan Valley, even if these data
from 2003 are somewhat outdated. Respective information on farming systems in the
highlands may be hidden in the extensive data bases of Jordan's agricultural surveys, but
would require a comprehensive re‐structuring and analysis of these data.
However, some known bottlenecks for farmers offer first suggestions for starting points of WDM
measures, which may have the double potential of improving the situation of farmers without
simultaneous incentives for more water use.
Timing of water supply: Gaps between the formation of water quantities and the need
for water in agriculture require storage facilities and an outflow management, which
correspond to water requirements in agriculture. A better balance of the management of
water storage systems with water needs in agriculture would improve water use
efficiency in agriculture even without changes in the current cropping patterns.
Groundwater for irrigation is basically available “on demand”. Water from treatment
facilities and other sources provide a more or less constant flow, which requires storage
until relevant irrigation periods. The implementation of storage facilities leads not only to
additional demands to capital for the investments but also requires additional space. The
latter may become a substantial factor in particular when those storage facilities are
placed on land of farming systems with comparatively low land endowment and/or high
potential returns per dunum.
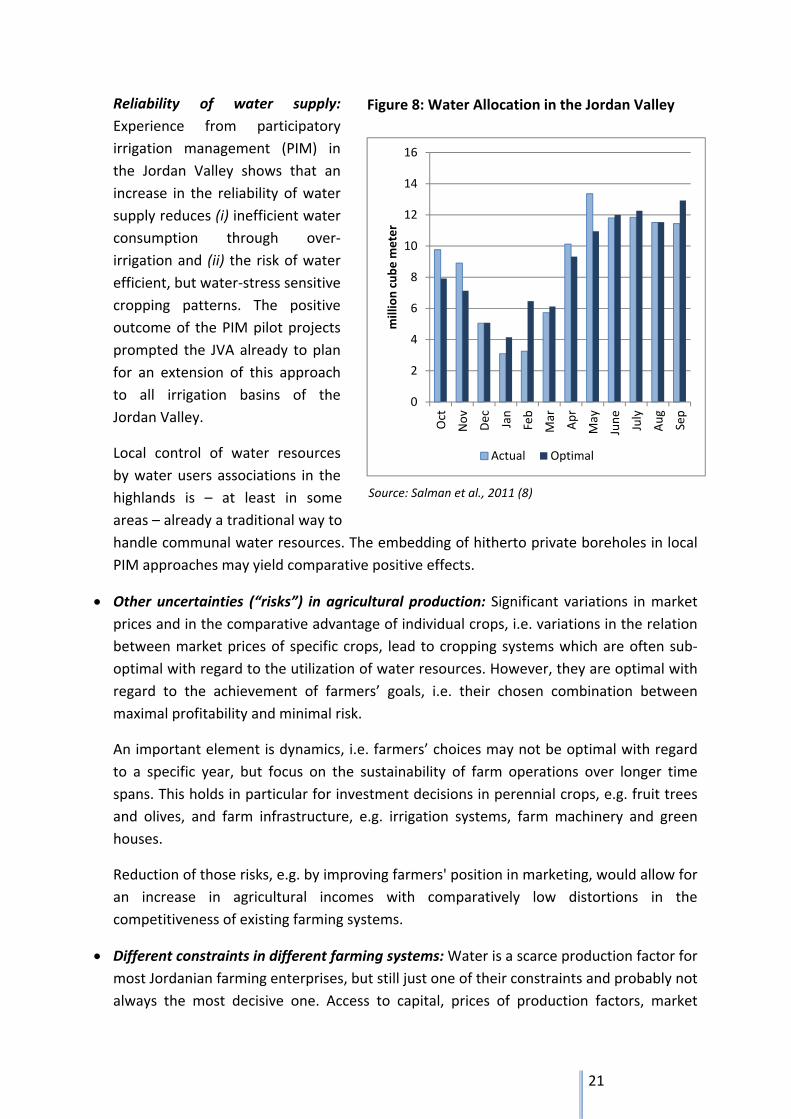
Central storage facilities for larger amounts of water are mostly available in the Jordan
Valley and adjacent side valley (wadis). Timing of water distribution via the conveyance
system connected to King Abdullah Canal (KAC) has to respond to a multitude of
combinations of farmers’ individual objectives, amongst which maximum profits and
minimal risk may be the most important. The comparison between JVA’s intra‐annual
water distribution, the optimal water distribution for attaining maximum profits and the
respective distribution for minimizing risk indicates the difficulty in managing centrally
stored water resources (cf. fig. 8).
21
Reliability of water supply:
Experience from participatory
irrigation management (PIM) in
the Jordan Valley shows that an
increase in the reliability of water
supply reduces (i) inefficient water
consumption through over‐
irrigation and (ii) the risk of water
efficient, but water‐stress sensitive
cropping patterns. The positive
outcome of the PIM pilot projects
prompted the JVA already to plan
for an extension of this approach
to all irrigation basins of the
Jordan Valley.
Local control of water resources
by water users associations in the
highlands is – at least in some
areas – already a traditional way to
handle communal water resources. The embedding of hitherto private boreholes in local
PIM approaches may yield comparative positive effects.
Other uncertainties (“risks”) in agricultural production: Significant variations in market
prices and in the comparative advantage of individual crops, i.e. variations in the relation
between market prices of specific crops, lead to cropping systems which are often sub‐
optimal with regard to the utilization of water resources. However, they are optimal with
regard to the achievement of farmers’ goals, i.e. their chosen combination between
maximal profitability and minimal risk.
An important element is dynamics, i.e. farmers’ choices may not be optimal with regard
to a specific year, but focus on the sustainability of farm operations over longer time
spans. This holds in particular for investment decisions in perennial crops, e.g. fruit trees
and olives, and farm infrastructure, e.g. irrigation systems, farm machinery and green
houses.
Reduction of those risks, e.g. by improving farmers' position in marketing, would allow for
an increase in agricultural incomes with comparatively low distortions in the
competitiveness of existing farming systems.
Different constraints in different farming systems: Water is a scarce production factor for
most Jordanian farming enterprises, but still just one of their constraints and probably not
always the most decisive one. Access to capital, prices of production factors, market
Source: Salman et al., 2011 (8)
Figure 8: Water Allocation in the Jordan Valley
0
2
4
6
8
10
12
14
16
Oct
Nov
Dec Jan
Feb
Mar
Apr
May
June
July
Aug
Sep
million cube m
eter
Actual Optimal
22
access and competition for resources of farming families by alternative employments in
off‐farm sectors often play an at least equally important role.
The consequences of changes in water availability and quality depend much more on the
interrelationships between these constraints in individual farming systems (i.e. systems
that determine farmers’ overall economic success and livelihood) than on agricultural
systems (i.e. cropping systems and the combination of agricultural uses of natural
resources).
The type, amount and complexity of required support for transforming existing farming
systems into sustainable enterprises under changed conditions in water supply depends
on their resource endowment and socio‐economic situation. The formulation of effective
policies for specific farming systems will require further investigations .
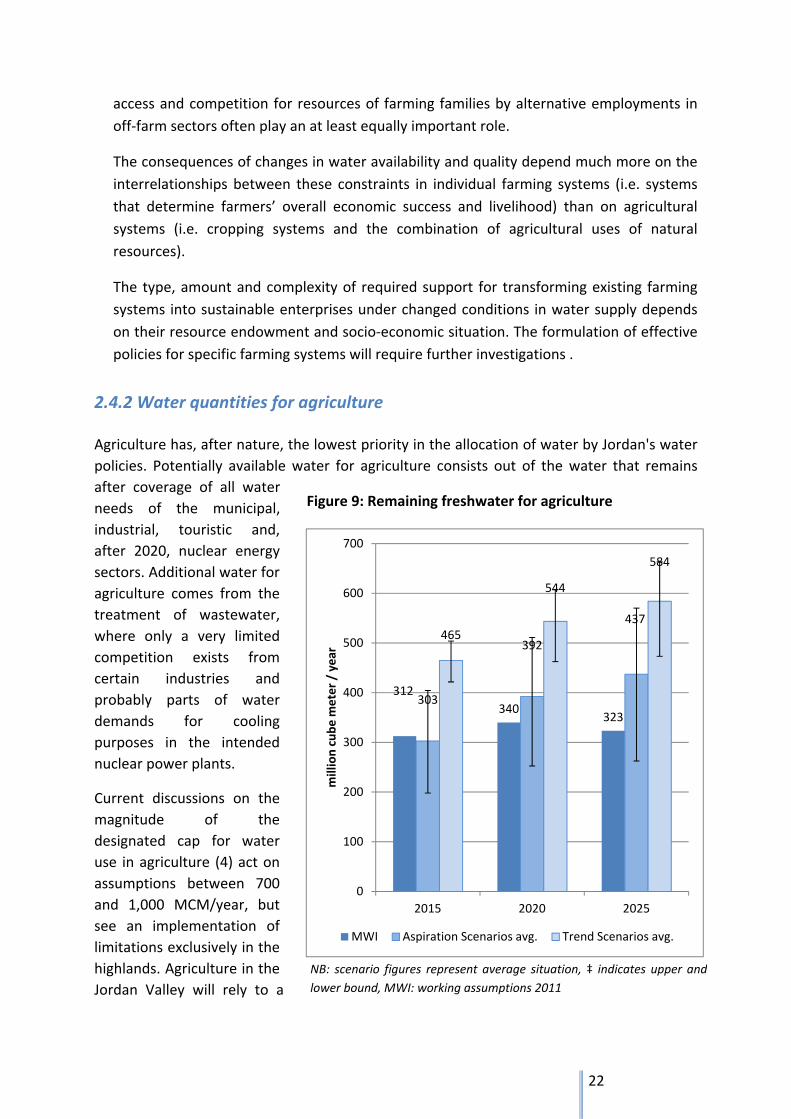
2.4.2 Water quantities for agriculture
Agriculture has, after nature, the lowest priority in the allocation of water by Jordan's water
policies. Potentially available water for agriculture consists out of the water that remains
after coverage of all water
needs of the municipal,
industrial, touristic and,
after 2020, nuclear energy
sectors. Additional water for
agriculture comes from the
treatment of wastewater,
where only a very limited
competition exists from
certain industries and
probably parts of water
demands for cooling
purposes in the intended
nuclear power plants.
Current discussions on the
magnitude of the
designated cap for water
use in agriculture (4) act on
assumptions between 700
and 1,000 MCM/year, but
see an implementation of
limitations exclusively in the
highlands. Agriculture in the
Jordan Valley will rely to a
NB: scenario figures represent average situation, ‡ indicates upper and
lower bound, MWI: working assumptions 2011
Figure 9: Remaining freshwater for agriculture
312
340323
303
392
437465
544
584
0
100
200
300
400
500
600
700
2015 2020 2025
million cube m
eter / year
MWI Aspiration Scenarios avg. Trend Scenarios avg.
23
growing extend on the provision with treated wastewater, which increasingly replaces
freshwater from the tributaries to the Jordan River. This freshwater will be diverted to an
increasing degree to the urban areas in the highland for municipal water supply.
The current calculations by the MWI assume that remaining amounts of freshwater, i.e.
annually available freshwater resources5 minus demands from all other sectors, will amount
to between 312 and 340 MCM/year in the period from 2015 to 2025. The estimations from
the scenario analyses indicate that this amount may vary between far less than 303 MCM in
2015 up to more than 600 MCM in 2025, depending on (i) the factual developments in
demographic and economic growth and (ii) the effects from loss reductions and water
savings.
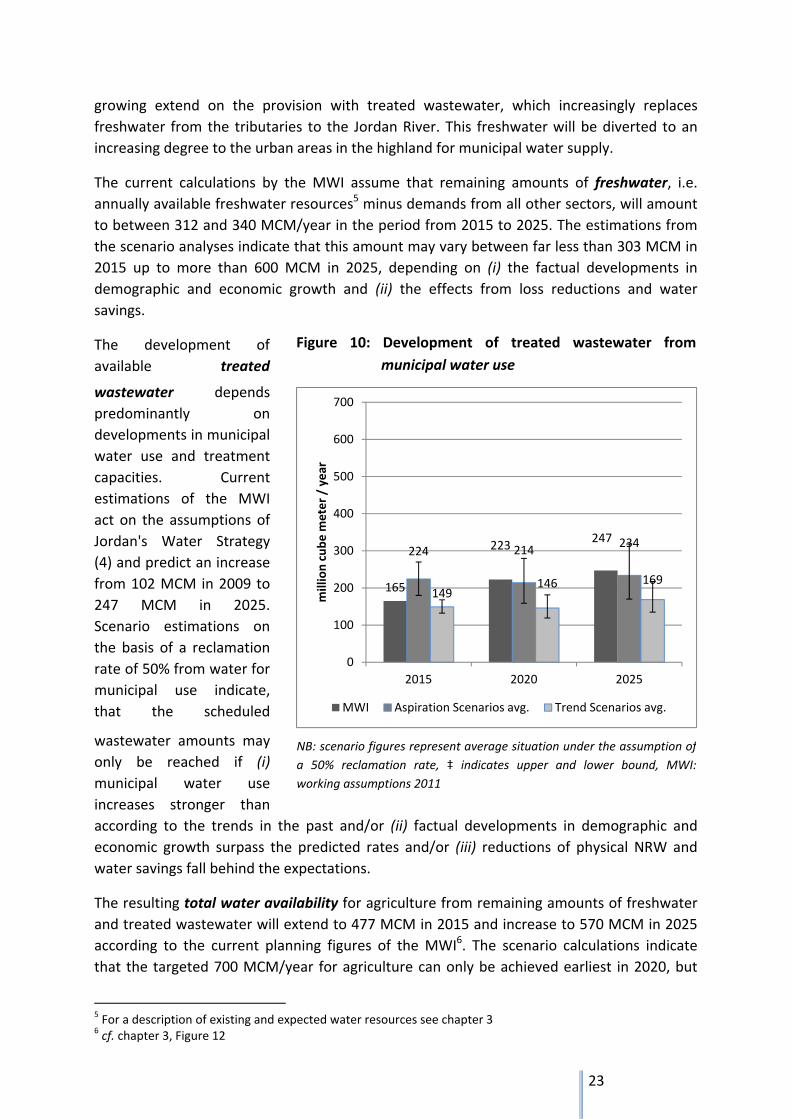
The development of
available treated
wastewater depends
predominantly on
developments in municipal
water use and treatment
capacities. Current
estimations of the MWI
act on the assumptions of
Jordan's Water Strategy
(4) and predict an increase
from 102 MCM in 2009 to
247 MCM in 2025.
Scenario estimations on
the basis of a reclamation
rate of 50% from water for
municipal use indicate,
that the scheduled
wastewater amounts may
only be reached if (i)
municipal water use
increases stronger than
according to the trends in the past and/or (ii) factual developments in demographic and
economic growth surpass the predicted rates and/or (iii) reductions of physical NRW and
water savings fall behind the expectations.
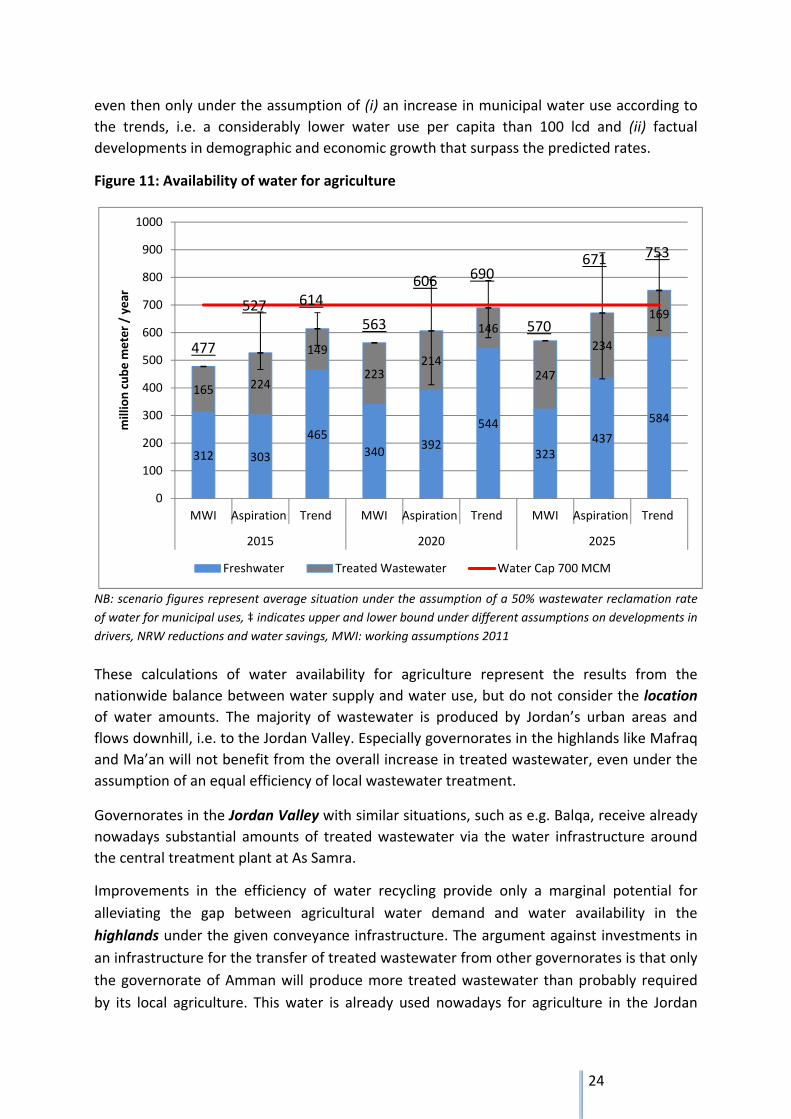
The resulting total water availability for agriculture from remaining amounts of freshwater
and treated wastewater will extend to 477 MCM in 2015 and increase to 570 MCM in 2025
according to the current planning figures of the MWI6. The scenario calculations indicate
that the targeted 700 MCM/year for agriculture can only be achieved earliest in 2020, but
5 For a description of existing and expected water resources see chapter 3 6 cf. chapter 3, Figure 12
NB: scenario figures represent average situation under the assumption of
a 50% reclamation rate, ‡ indicates upper and lower bound, MWI:
working assumptions 2011
165
223247
224 214234
149146 169
0
100
200
300
400
500
600
700
2015 2020 2025
million cube m
eter / year
MWI Aspiration Scenarios avg. Trend Scenarios avg.
Figure 10: Development of treated wastewater from
municipal water use
24
even then only under the assumption of (i) an increase in municipal water use according to
the trends, i.e. a considerably lower water use per capita than 100 lcd and (ii) factual
developments in demographic and economic growth that surpass the predicted rates.
Figure 11: Availability of water for agriculture
NB: scenario figures represent average situation under the assumption of a 50% wastewater reclamation rate
of water for municipal uses, ‡ indicates upper and lower bound under different assumptions on developments in
drivers, NRW reductions and water savings, MWI: working assumptions 2011
These calculations of water availability for agriculture represent the results from the
nationwide balance between water supply and water use, but do not consider the location
of water amounts. The majority of wastewater is produced by Jordan’s urban areas and
flows downhill, i.e. to the Jordan Valley. Especially governorates in the highlands like Mafraq
and Ma’an will not benefit from the overall increase in treated wastewater, even under the
assumption of an equal efficiency of local wastewater treatment.
Governorates in the Jordan Valley with similar situations, such as e.g. Balqa, receive already
nowadays substantial amounts of treated wastewater via the water infrastructure around
the central treatment plant at As Samra.
Improvements in the efficiency of water recycling provide only a marginal potential for
alleviating the gap between agricultural water demand and water availability in the
highlands under the given conveyance infrastructure. The argument against investments in
an infrastructure for the transfer of treated wastewater from other governorates is that only
the governorate of Amman will produce more treated wastewater than probably required
by its local agriculture. This water is already used nowadays for agriculture in the Jordan
312 303
465
340392
544
323437
584
165 224
149
223214
146
247
234
169
477
527 614
563
606 690
570
671 753
0
100
200
300
400
500
600
700
800
900
1000
MWI Aspiration Trend MWI Aspiration Trend MWI Aspiration Trend
2015 2020 2025
million cube m
eter / year
Freshwater Treated Wastewater Water Cap 700 MCM
25
Valley, which has the advantages of an already existing conveyance system and lower
conveyance costs due to the difference in altitude.
2.5 Water demand by Nature
The assessment of water requirements by nature focuses on the major natural reserves and
unique ecosystems in Jordan, whereby the Dead Sea takes a special position due to its cross‐
border location.
The deficit between the historical inflow and the current inflow to the Dead Sea amounts to
about 1.20 billion MCM/year, which led to a decline of its sea level by about 1 m per year
over the last decades. Jordan's part in this deficit consists mainly out of the diversion of
about 70 MCM/year from the Yarmouk River to King Abdulla Canal for domestic supply to
west Amman and for agricultural use in the Jordan Valley. One proposed solutions to restore
the Dead Sea level is the Red Sea Dead Sea Canal project, which is expected to bring about
850 million cubic meter of brine to the sea.
Other major natural areas endangered by water stress comprise the Al Azraq Oasis, Wadi
Mujib and Wadi Wala. Estimates of the total water demand for these areas amount to 55
MCM /year, but significant return flows of this water can be and are used by other sectors,
such as in the case of Wadi Mujib and Wadi Wala. This water demand is assumed to be the
minimum amount required to save these ecosystems and regarded as a long‐term constant.
Al Azraq oasis is a natural reserve in the eastern desert of Jordan. The oasis is one of the
most unique ecosystems in the region and an important home for migratory birds. The WAJ
put a stop to well digging and planned to pump up to 1.5 MCM /year from artesian wells to
the wetland reserve in order to preserve the remainders of the oasis. Water amounts
pumped in 2008 where up to slightly more than 700 thousand m³. A full restoration of the
oasis would require limiting of the abstraction to the safe yield of about 25 MCM/year.
Wadi Mujib is a gorge which enters the Dead Sea at 410 meters below sea level and a
regionally important sanctuary for biodiversity of flora and fauna. The current base flow is
up to 38 MCM/year and considered as adequate supply of the natural demand.
Wadi Wala, which is known in its lower reaches as Wadi Heidan, runs from its headwaters
south of Amman to its confluence with Wadi Mujib about 3 km from the Dead Sea. Wadi
Wala has a fairly stable base flow which covers its estimated water demand from nature of
about 6.6 MCM/year.
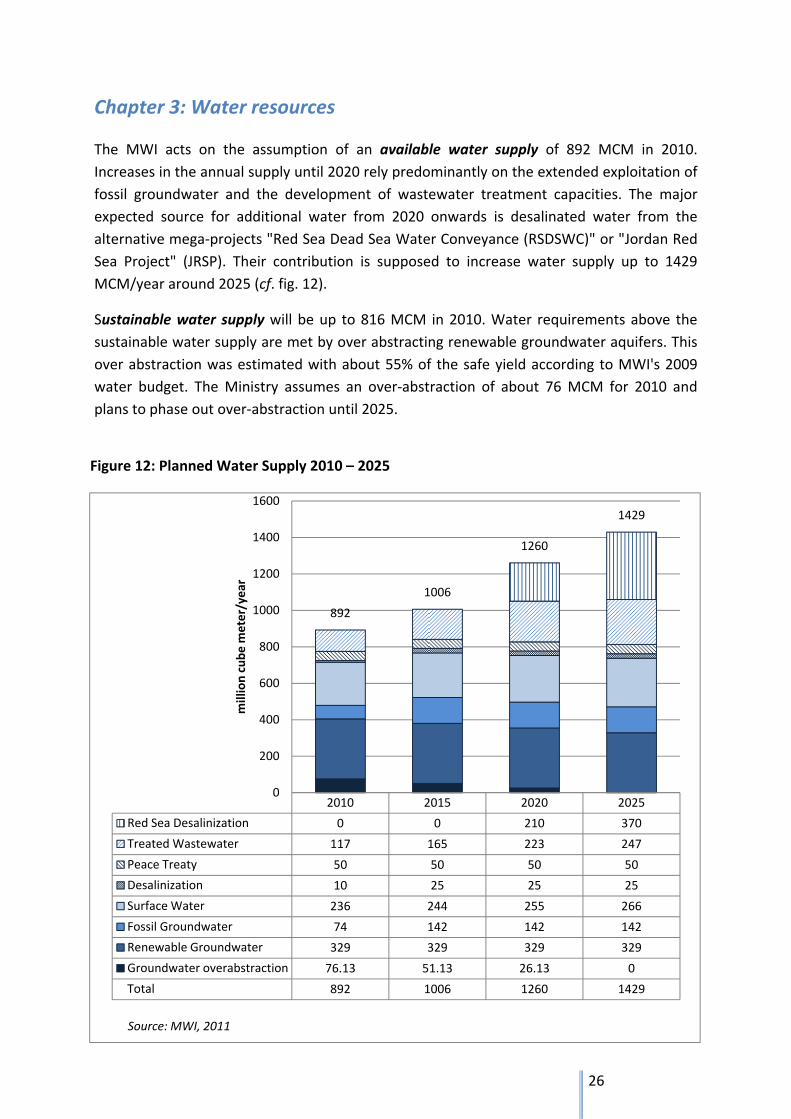
26
Chapter 3: Water resources
The MWI acts on the assumption of an available water supply of 892 MCM in 2010.
Increases in the annual supply until 2020 rely predominantly on the extended exploitation of
fossil groundwater and the development of wastewater treatment capacities. The major
expected source for additional water from 2020 onwards is desalinated water from the
alternative mega‐projects "Red Sea Dead Sea Water Conveyance (RSDSWC)" or "Jordan Red
Sea Project" (JRSP). Their contribution is supposed to increase water supply up to 1429
MCM/year around 2025 (cf. fig. 12).
Sustainable water supply will be up to 816 MCM in 2010. Water requirements above the
sustainable water supply are met by over abstracting renewable groundwater aquifers. This
over abstraction was estimated with about 55% of the safe yield according to MWI's 2009
water budget. The Ministry assumes an over‐abstraction of about 76 MCM for 2010 and
plans to phase out over‐abstraction until 2025.
Figure 12: Planned Water Supply 2010 – 2025
2010 2015 2020 2025
Red Sea Desalinization 0 0 210 370
Treated Wastewater 117 165 223 247
Peace Treaty 50 50 50 50
Desalinization 10 25 25 25
Surface Water 236 244 255 266
Fossil Groundwater 74 142 142 142
Renewable Groundwater 329 329 329 329
Groundwater overabstraction 76.13 51.13 26.13 0
Total 892 1006 1260 1429
892
1006
1260
1429
0
200
400
600
800
1000
1200
1400
1600
million cube m
eter/year
Source: MWI, 2011
27
Conventional fresh water resources in Jordan consist in their vast majority out of
groundwater and surface water, whereby groundwater is the main source for municipal
water supply, industry and irrigation in the highlands. The estimated safe yield of
groundwater amounts to 329 MCM/year from the twelve basins with renewable
groundwater. This includes the estimated 54 MCM/year of return flows from already
pumped water back to the aquifers. Basins with non‐renewable groundwater contribute
currently about 74 MCM per year, whereby estimates on potential safe yields from these
sources vary from 107 up to 143 MCM/year.
Developed surface water resources from the fifteen surface water basins were up to 289
MCM in 2009 and shall reach 266 MCM/year until 2025 according to the current planning of
the MWI. This falls short of the scheduled 365 MCM/year in 2022 as stated in Jordan's Water
Strategy (2009), but the inflows of surface water vary in any case significantly from year to
year. The estimated long term average sustainable extraction rate amounts to about 692
MCM/year, but this includes both, base flows and flood flows. Israel is obliged to deliver an
additional 50 MCM/year according to the peace treaty from 1994.
3.1 Water resource development
Overall expectations to additional contributions from the further exploitation of
conventional water resources until 2025 are up to about 121 MCM/year. This includes an
increase in water conveyance from the Disi aquifer from currently about 61 to 122
MCM/year, 25 MCM/year from new dams and another 30 MCM/year from an improved
performance of the joint Jordanian‐Syrian Al‐Wehda dam. Expected contributions from
urban rainwater harvesting amount to 5 MCM/year in 2025, whereby its full potential was
estimated to be about 100 MCM/year (CEC, 2010).
Most water from non‐conventional water resources will come from the treatment of
wastewater at least until 2020. Treated wastewater added 102 MCM to Jordan's water
balance in 2009 and estimations for 2010 are up to 117 MCM. Jordan's Water Strategy (4)
and the planning of the MWI act on the assumption that available water from wastewater
treatment will more than double until 2025 and reach 247 MCM in that year.
Water from local desalination adds currently about 10 MCM/year and is expected to reach
25 MCM/year from 2015 onwards. Planning of large‐scale desalinization is much more
ambitious with an expected contribution of about 210 MCM/year in 2020 and 370
MCM/year in 2025 from desalinization of Red Sea waters. However, the mentioned
alternative mega‐projects RSDSWC or JRSP are in their planning phase and at least some
financial aspects for their realization are still pending.
Increases in the efficiency of water conveyance and water use do not add to the available
water resources, but allow for a more targeted water allocation. Expected gains from
improved water use efficiency amount to 74.5 MCM/year and from improved water supply
efficiency to between 62 and 83 MCM/year 2025.
28
This listing of the estimated water resources in the future relies on assumptions about "most
likely" developments, but is already today subject to high annual and inter‐annual
variations. Reasons are the dependency of most natural water resources and their safe
yields on the magnitude and distribution of precipitations. Relatively safe estimations are
only possible for water from fossil, non‐renewable aquifers and seawater desalination, i.e.
water from the aforementioned mega‐projects.
The development of new water resources will require additional infrastructure and
technologies that exceed the costs of investments, operation and maintenance of the
existing water exploitation. The current full costs for water supply range from about 0.13
JD/m³ for treated wastewater from existing treatment plants and sewer systems, 0.15 JD/m³
for groundwater extraction in highland agriculture and 0.29 JD/m³ for surface water for
irrigation in the Jordan Valley up to about 0.51 JD/m³ for the supply of municipal water. The
estimate of the current average costs per m³ of water supply is up to about 0.35 JD.
Additional water for the future from increases in wastewater treatment may have to
calculate with considerably higher costs in particular in areas, which require the complete
new construction of infrastructure for wastewater collection and conveyance of effluents
from treatment plants.
Cost estimates for the conveyance of non‐renewable groundwater from the Disi aquifer to
Amman are up to slightly more than 0.80 JD/m³ and water from large‐scale desalinization of
Red Sea water may even be way above 1.50 JD/m³. This indicates that water for the future
will come in each case at higher costs. Current estimates act on the assumption of water
costs, which may more than double in the future.
However, the economic costs for the development of new water resources must be clearly
distinguished from reflections on funding and impacts on budgets. Questions on the
distribution of costs will have to consider, amongst others, elements like charges for
wastewater disposal by clients as well as potential grants from donors.
Hazards to water quality in Jordan comprise unsafe wastewater management, uncontrolled
disposal of industrial waste, leaching from unsanitary solid waste landfills, seepage from
agrochemicals and over‐abstraction from water resources. Existing action plans for the
preservation and improvement of water quality focus on (1) groundwater abstraction, (2)
the extension of access of households to sewer systems, (3) improvements in wastewater
treatment technologies and (4) the enforcement of wastewater treatment plants for all
industries (NWS, 2009).
Concerns about potential damages from agrochemicals to water quality did not make it on
the agenda yet. However, they may be expectable in the future if efforts towards increasing
water use efficiency in agriculture will lead to a more extensive use of fertilizers and
pesticides in the watersheds of the highlands.
29
3.2 Strategies, Policies and Legislations
The Jordanian government faced the growing water question on a national scale by
institutionalizing an adequate water administration. Milestones were the mandate of the
Water Authority of Jordan in 1988 and the creation of the Ministry of Water and Irrigation in
1992. First regulations followed for wastewater (regulation no. 54/1994) and drinking water
(regulation no. 67/1994) in 1994. The Jordan Valley Development Law no. 19 from 1988
defined rules for the development of water resources in the Valley for water use in all
sectors. Law no. 30 from 2001 amended this law under the same title.
Currently, there are around 19 ruling strategies, policy and legislation documents on the
water sector. The National Water Strategy (2009) and the National Water Master Plan (2004)
constitute the basis for the current planning, whereby the latter is subject to constant
amendments and adaptations by a standing working group at the MWI.
The list of strategies, policy and legislation documents is attached in appendix 6.
3.3 Climate Change
Estimations about effects from Climate Change indicate a slight increase of precipitations
until 2030, but a deterioration of climatic conditions after 2030. According to the report of
the International Panel on Climate Change (IPCC 2007), projected annual average ranges of
precipitation may decrease in Jordan and its surrounding countries by 10% to 20 % in the
long run. Climate Change Projections from regional climate models on the lower Jordan
River area, which covers all of Jordan north from the Dead Sea, indicate amongst others:
a slight increase of total precipitations until 2035, but a decrease by at least 15%
between 2031 and 2060,
a slight increase in consecutive dry day length,
a reduction in the number of heavy precipitation days, but an increase in the number
of very heavy precipitation days and
a temperature increase of between 1.5 and 2.5° C
source: Karlsruhe Institute of Technology, 2010
Further effects are the increase in the occurrence of extreme weather events and an intra‐
annual shift of dry seasons.
The impact of such changes on the replenishment of dams and aquifers as well as their
dynamics over the coming years is still subject of ongoing research. However, it highlights
the probability of potential downward corrections of safe yields from ground‐ and surface
water in the future and emphasizes the role of the intended mega‐projects in the mitigation
of uncertainties.
30
Impacts from Climate Change that go beyond changes in safe yields from surface and
groundwater resources will in particular affect rainfed agriculture and nature due to the
expected intra‐annual shift of precipitations. Regions of major concerns are the drier rainfed
agricultural areas in the governorates of Mafraq, Al‐Zarqa, Ma'an, Aqaba and parts of
Madaba.
Changing groundwater availability for irrigation due to Climate Change will affect in
particular agriculture in the Wadi Arabah region with its mix of rainfed and irrigated
agriculture. This highlights the potential role of surplus irrigation as part of the solution to
water constraints in agriculture (cf. Comprehensive Assessment of Water Management in
Agriculture, IWMI, 2007).
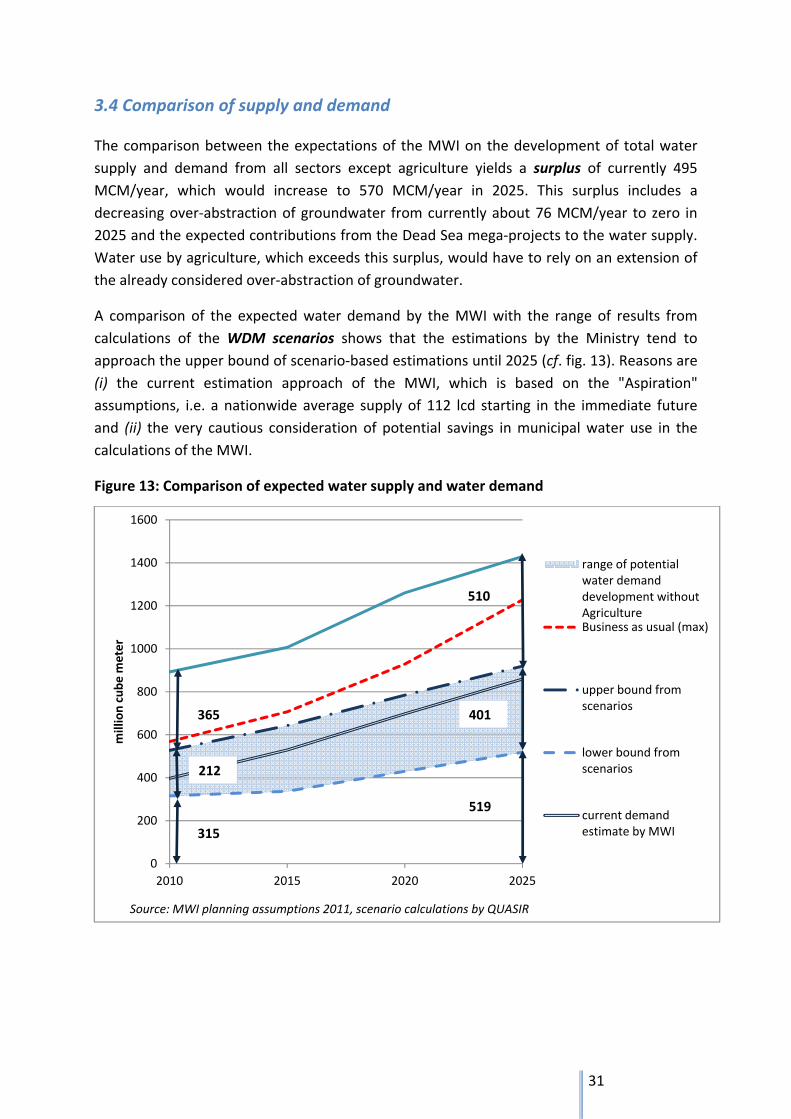
31
3.4 Comparison of supply and demand
The comparison between the expectations of the MWI on the development of total water
supply and demand from all sectors except agriculture yields a surplus of currently 495
MCM/year, which would increase to 570 MCM/year in 2025. This surplus includes a
decreasing over‐abstraction of groundwater from currently about 76 MCM/year to zero in
2025 and the expected contributions from the Dead Sea mega‐projects to the water supply.
Water use by agriculture, which exceeds this surplus, would have to rely on an extension of
the already considered over‐abstraction of groundwater.
A comparison of the expected water demand by the MWI with the range of results from
calculations of the WDM scenarios shows that the estimations by the Ministry tend to
approach the upper bound of scenario‐based estimations until 2025 (cf. fig. 13). Reasons are
(i) the current estimation approach of the MWI, which is based on the "Aspiration"
assumptions, i.e. a nationwide average supply of 112 lcd starting in the immediate future
and (ii) the very cautious consideration of potential savings in municipal water use in the
calculations of the MWI.
Figure 13: Comparison of expected water supply and water demand
0
200
400
600
800
1000
1200
1400
1600
2010 2015 2020 2025
million cube m
eter
Source: MWI planning assumptions 2011, scenario calculations by QUASIR
range of potential water demand development without AgricultureBusiness as usual (max)
upper bound from scenarios
lower bound from scenarios
current demand estimate by MWI
365
212
315
401
510
519
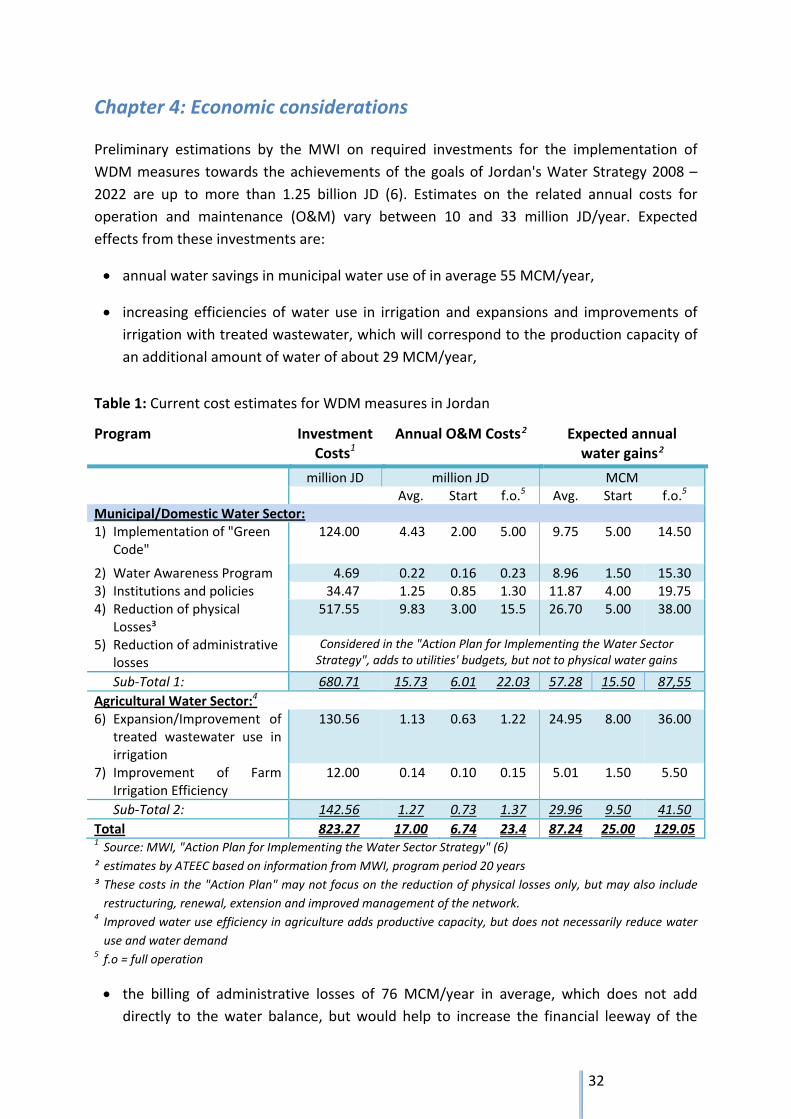
32
Chapter 4: Economic considerations
Preliminary estimations by the MWI on required investments for the implementation of
WDM measures towards the achievements of the goals of Jordan's Water Strategy 2008 –
2022 are up to more than 1.25 billion JD (6). Estimates on the related annual costs for
operation and maintenance (O&M) vary between 10 and 33 million JD/year. Expected
effects from these investments are:
annual water savings in municipal water use of in average 55 MCM/year,
increasing efficiencies of water use in irrigation and expansions and improvements of
irrigation with treated wastewater, which will correspond to the production capacity of
an additional amount of water of about 29 MCM/year,
Table 1: Current cost estimates for WDM measures in Jordan
Program Investment Costs1
Annual O&M Costs² Expected annual water gains²
million JD million JD MCM Avg. Start f.o.5 Avg. Start f.o.5 Municipal/Domestic Water Sector: 1) Implementation of "Green
Code" 124.00 4.43 2.00 5.00 9.75 5.00 14.50
2) Water Awareness Program 4.69 0.22 0.16 0.23 8.96 1.50 15.30 3) Institutions and policies 34.47 1.25 0.85 1.30 11.87 4.00 19.75 4) Reduction of physical
Losses³ 517.55 9.83 3.00 15.5 26.70 5.00 38.00
5) Reduction of administrative losses
Considered in the "Action Plan for Implementing the Water Sector Strategy", adds to utilities' budgets, but not to physical water gains
Sub‐Total 1: 680.71 15.73 6.01 22.03 57.28 15.50 87,55
Agricultural Water Sector:4 6) Expansion/Improvement of
treated wastewater use in irrigation
130.56 1.13 0.63 1.22 24.95 8.00 36.00
7) Improvement of Farm Irrigation Efficiency
12.00 0.14 0.10 0.15 5.01 1.50 5.50
Sub‐Total 2: 142.56 1.27 0.73 1.37 29.96 9.50 41.50
Total 823.27 17.00 6.74 23.4 87.24 25.00 129.05 1 Source: MWI, "Action Plan for Implementing the Water Sector Strategy" (6)
² estimates by ATEEC based on information from MWI, program period 20 years
³ These costs in the "Action Plan" may not focus on the reduction of physical losses only, but may also include
restructuring, renewal, extension and improved management of the network. 4 Improved water use efficiency in agriculture adds productive capacity, but does not necessarily reduce water
use and water demand 5 f.o = full operation
the billing of administrative losses of 76 MCM/year in average, which does not add
directly to the water balance, but would help to increase the financial leeway of the
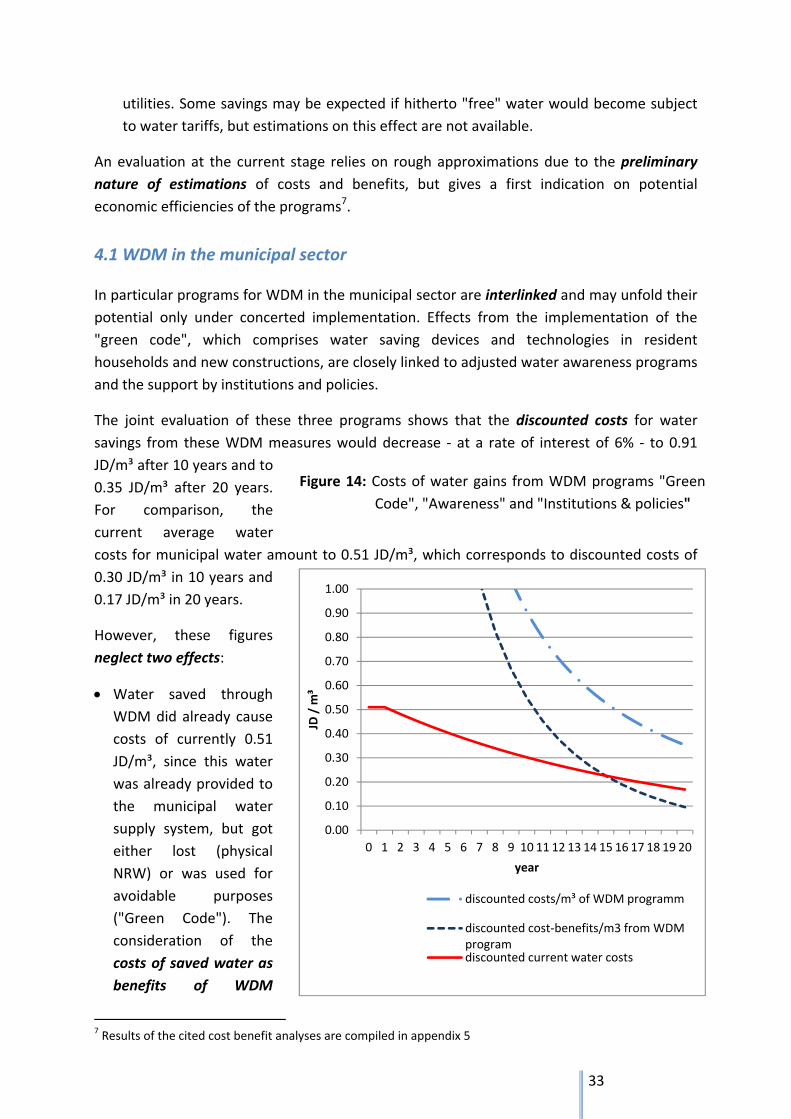
33
utilities. Some savings may be expected if hitherto "free" water would become subject
to water tariffs, but estimations on this effect are not available.
An evaluation at the current stage relies on rough approximations due to the preliminary
nature of estimations of costs and benefits, but gives a first indication on potential
economic efficiencies of the programs7.
4.1 WDM in the municipal sector
In particular programs for WDM in the municipal sector are interlinked and may unfold their
potential only under concerted implementation. Effects from the implementation of the
"green code", which comprises water saving devices and technologies in resident
households and new constructions, are closely linked to adjusted water awareness programs
and the support by institutions and policies.
The joint evaluation of these three programs shows that the discounted costs for water
savings from these WDM measures would decrease ‐ at a rate of interest of 6% ‐ to 0.91
JD/m³ after 10 years and to
0.35 JD/m³ after 20 years.
For comparison, the
current average water
costs for municipal water amount to 0.51 JD/m³, which corresponds to discounted costs of
0.30 JD/m³ in 10 years and
0.17 JD/m³ in 20 years.
However, these figures
neglect two effects:
Water saved through
WDM did already cause
costs of currently 0.51
JD/m³, since this water
was already provided to
the municipal water
supply system, but got
either lost (physical
NRW) or was used for
avoidable purposes
("Green Code"). The
consideration of the
costs of saved water as
benefits of WDM
7 Results of the cited cost benefit analyses are compiled in appendix 5
Figure 14: Costs of water gains from WDM programs "Green
Code", "Awareness" and "Institutions & policies"
0.00
0.10
0.20
0.30
0.40
0.50
0.60
0.70
0.80
0.90
1.00
0 1 2 3 4 5 6 7 8 9 10 11 12 13 14 15 16 17 18 19 20
JD / m
³
year
discounted costs/m³ of WDM programm
discounted cost‐benefits/m3 from WDM programdiscounted current water costs
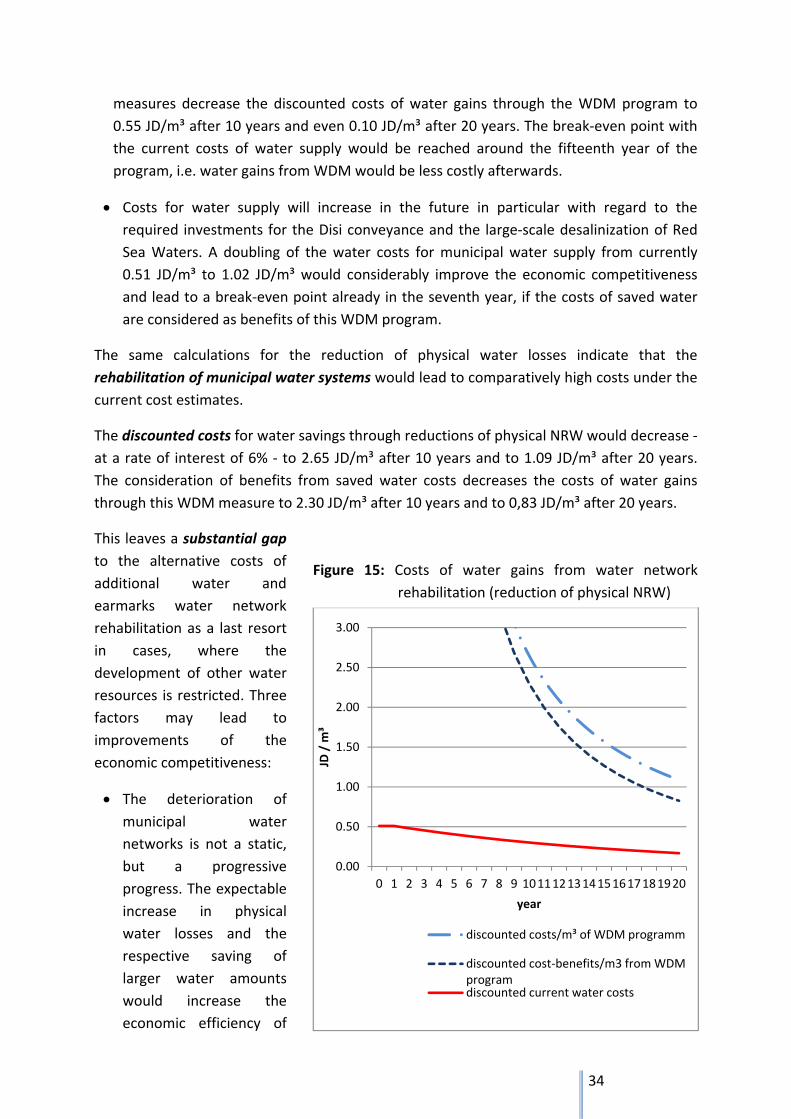
34
measures decrease the discounted costs of water gains through the WDM program to
0.55 JD/m³ after 10 years and even 0.10 JD/m³ after 20 years. The break‐even point with
the current costs of water supply would be reached around the fifteenth year of the
program, i.e. water gains from WDM would be less costly afterwards.
Costs for water supply will increase in the future in particular with regard to the
required investments for the Disi conveyance and the large‐scale desalinization of Red
Sea Waters. A doubling of the water costs for municipal water supply from currently
0.51 JD/m³ to 1.02 JD/m³ would considerably improve the economic competitiveness
and lead to a break‐even point already in the seventh year, if the costs of saved water
are considered as benefits of this WDM program.
The same calculations for the reduction of physical water losses indicate that the
rehabilitation of municipal water systems would lead to comparatively high costs under the
current cost estimates.
The discounted costs for water savings through reductions of physical NRW would decrease ‐
at a rate of interest of 6% ‐ to 2.65 JD/m³ after 10 years and to 1.09 JD/m³ after 20 years.
The consideration of benefits from saved water costs decreases the costs of water gains
through this WDM measure to 2.30 JD/m³ after 10 years and to 0,83 JD/m³ after 20 years.
This leaves a substantial gap
to the alternative costs of
additional water and
earmarks water network
rehabilitation as a last resort
in cases, where the
development of other water
resources is restricted. Three
factors may lead to
improvements of the
economic competitiveness:
The deterioration of
municipal water
networks is not a static,
but a progressive
progress. The expectable
increase in physical
water losses and the
respective saving of
larger water amounts
would increase the
economic efficiency of
0.00
0.50
1.00
1.50
2.00
2.50
3.00
0 1 2 3 4 5 6 7 8 9 1011121314151617181920
JD / m
³
year
discounted costs/m³ of WDM programm
discounted cost‐benefits/m3 from WDM programdiscounted current water costs
Figure 15: Costs of water gains from water network
rehabilitation (reduction of physical NRW)
35
rehabilitation measures, provided that the costs for the rehabilitation do not change.
The investment and O&M costs for network rehabilitation in the current calculations are
preliminary estimations and might be subject to considerable adjustments, if specific
elements of the intended network rehabilitation become subject to closer examinations
about possible cost minimization.
The current planning of investments in reductions of physical NRW represents the
maximum solution of. This implies that also the last and most expensive marginal
volumes of water would be saved. An alternative approach would be a stepwise
investment planning, which starts with the least costly measures for NRW reductions
and continues to add measures until a balance between costs for this WDM measure
and costs of alternative water reclamation is reached. This would most probably imply
the abandonment of a part of potential savings in terms of water volume, but
simultaneously improve the economic competitiveness of the investments in reducing
physical NRW.
A doubling of the water costs for municipal water supply from currently 0.51 JD/m³ to
1.02 JD/m³ would reduce the difference between those costs and costs for water from
the WDM program on loss reduction. The break‐even point would still not be reached
after 20 years, but the difference between both alternatives for water reclamation
would shrink from 0.49 JD/m³ to 0.23 JD/m³.
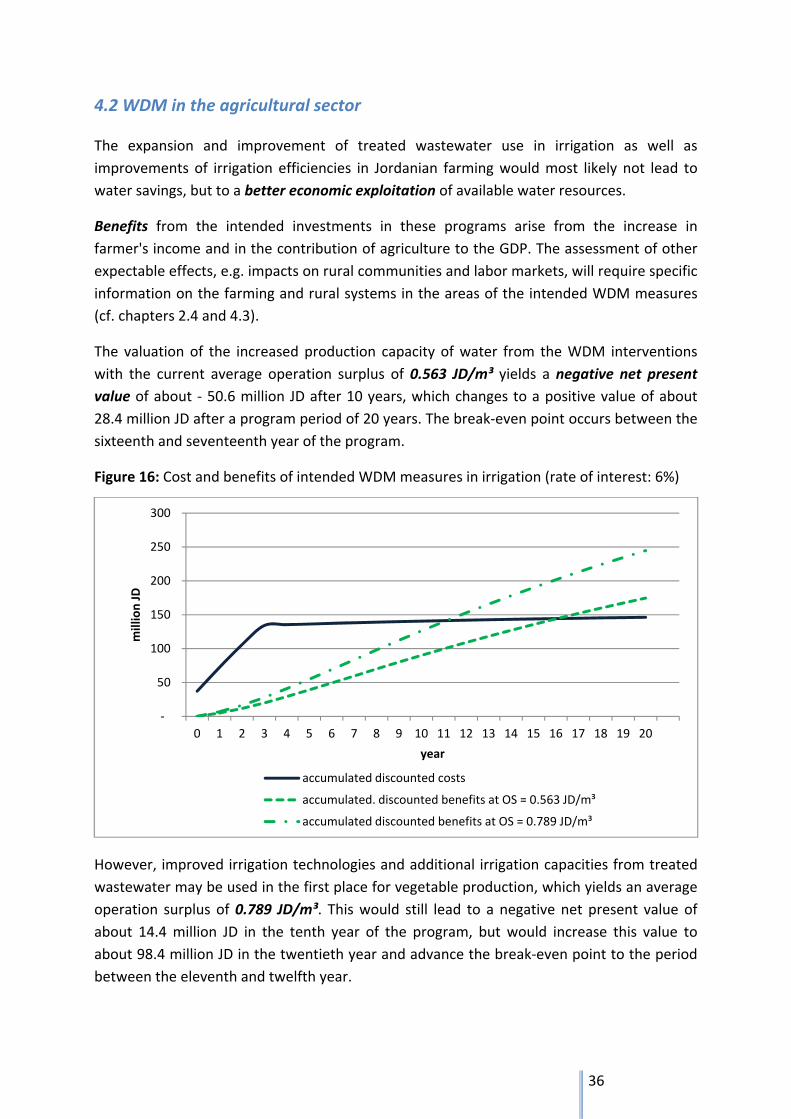
36
4.2 WDM in the agricultural sector
The expansion and improvement of treated wastewater use in irrigation as well as
improvements of irrigation efficiencies in Jordanian farming would most likely not lead to
water savings, but to a better economic exploitation of available water resources.
Benefits from the intended investments in these programs arise from the increase in
farmer's income and in the contribution of agriculture to the GDP. The assessment of other
expectable effects, e.g. impacts on rural communities and labor markets, will require specific
information on the farming and rural systems in the areas of the intended WDM measures
(cf. chapters 2.4 and 4.3).
The valuation of the increased production capacity of water from the WDM interventions
with the current average operation surplus of 0.563 JD/m³ yields a negative net present
value of about ‐ 50.6 million JD after 10 years, which changes to a positive value of about
28.4 million JD after a program period of 20 years. The break‐even point occurs between the
sixteenth and seventeenth year of the program.
Figure 16: Cost and benefits of intended WDM measures in irrigation (rate of interest: 6%)
However, improved irrigation technologies and additional irrigation capacities from treated
wastewater may be used in the first place for vegetable production, which yields an average
operation surplus of 0.789 JD/m³. This would still lead to a negative net present value of
about 14.4 million JD in the tenth year of the program, but would increase this value to
about 98.4 million JD in the twentieth year and advance the break‐even point to the period
between the eleventh and twelfth year.
‐
50
100
150
200
250
300
0 1 2 3 4 5 6 7 8 9 10 11 12 13 14 15 16 17 18 19 20
million JD
year
accumulated discounted costs
accumulated. discounted benefits at OS = 0.563 JD/m³
accumulated discounted benefits at OS = 0.789 JD/m³
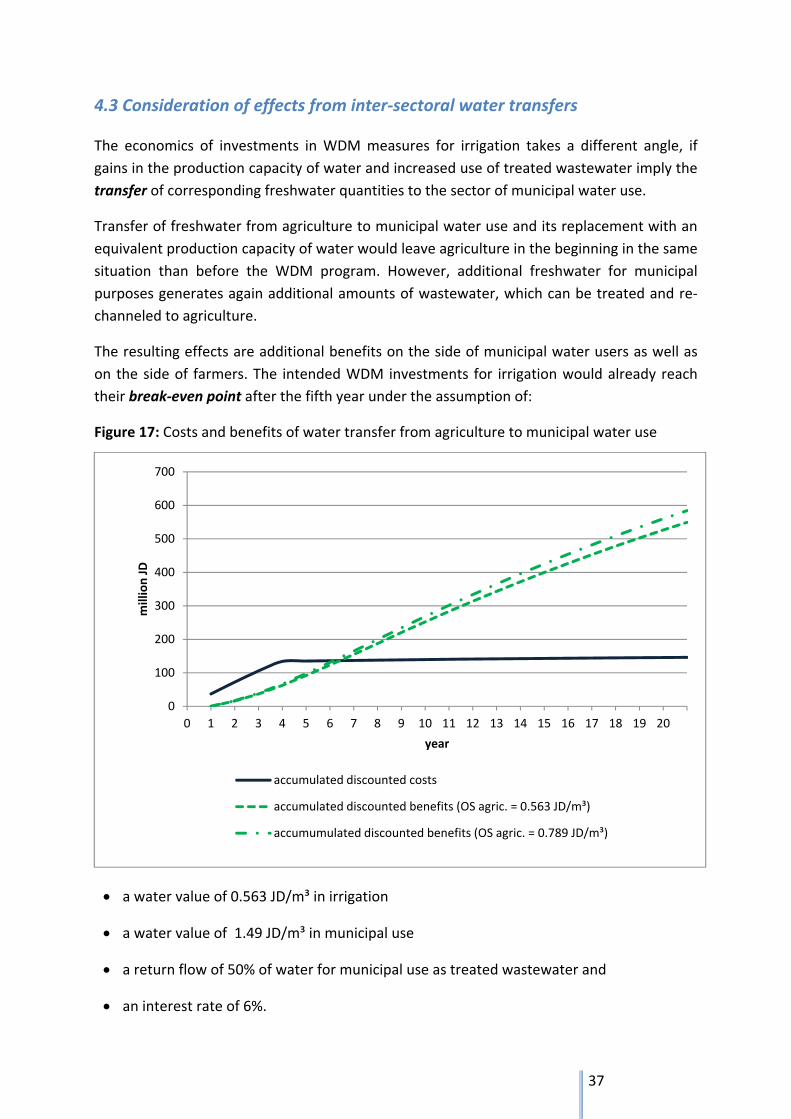
37
4.3 Consideration of effects from inter‐sectoral water transfers
The economics of investments in WDM measures for irrigation takes a different angle, if
gains in the production capacity of water and increased use of treated wastewater imply the
transfer of corresponding freshwater quantities to the sector of municipal water use.
Transfer of freshwater from agriculture to municipal water use and its replacement with an
equivalent production capacity of water would leave agriculture in the beginning in the same
situation than before the WDM program. However, additional freshwater for municipal
purposes generates again additional amounts of wastewater, which can be treated and re‐
channeled to agriculture.
The resulting effects are additional benefits on the side of municipal water users as well as
on the side of farmers. The intended WDM investments for irrigation would already reach
their break‐even point after the fifth year under the assumption of:
Figure 17: Costs and benefits of water transfer from agriculture to municipal water use
a water value of 0.563 JD/m³ in irrigation
a water value of 1.49 JD/m³ in municipal use
a return flow of 50% of water for municipal use as treated wastewater and
an interest rate of 6%.
0
100
200
300
400
500
600
700
0 1 2 3 4 5 6 7 8 9 10 11 12 13 14 15 16 17 18 19 20
million JD
year
accumulated discounted costs
accumulated discounted benefits (OS agric. = 0.563 JD/m³)
accumumulated discounted benefits (OS agric. = 0.789 JD/m³)
38
The net present value of the program would be up to about 142.8 million JD after 10 years
and reach about 403.1 million JD after a program period of 20 years. Discounted benefits for
farmers would amount to about 45 million JD after 10 years and 87.3 million JD after 20
years. Discounted benefits for municipal water users would add up to 238.4 million JD after
10 years and about 462.1 million JD after 20 years.
The same calculation with a water value of 0.789 JD/m³ in irrigation, i.e. the average
operation surplus of vegetables, does not change the break‐even point but leads to a higher
net present value of 160.9 million JD after 10 years and about 462.1 million JD after 20 years.
The beneficiaries of this increase would be farmers, who would achieve discounted benefits
of 63.1 million JD after 10 years and of 122.3 million JD after 20 years.
However, the stated costs for the concerned WDM measures do not consider potentially
required additional investments in the upgrade of conveyance systems for the transfer of
freshwater to urban areas and the additional costs for treatment and conveyance of the
return flows of wastewater. The incorporation of such additional costs may lead to certain
adjustments in the competitiveness of the scenario on intersectoral water transfer.
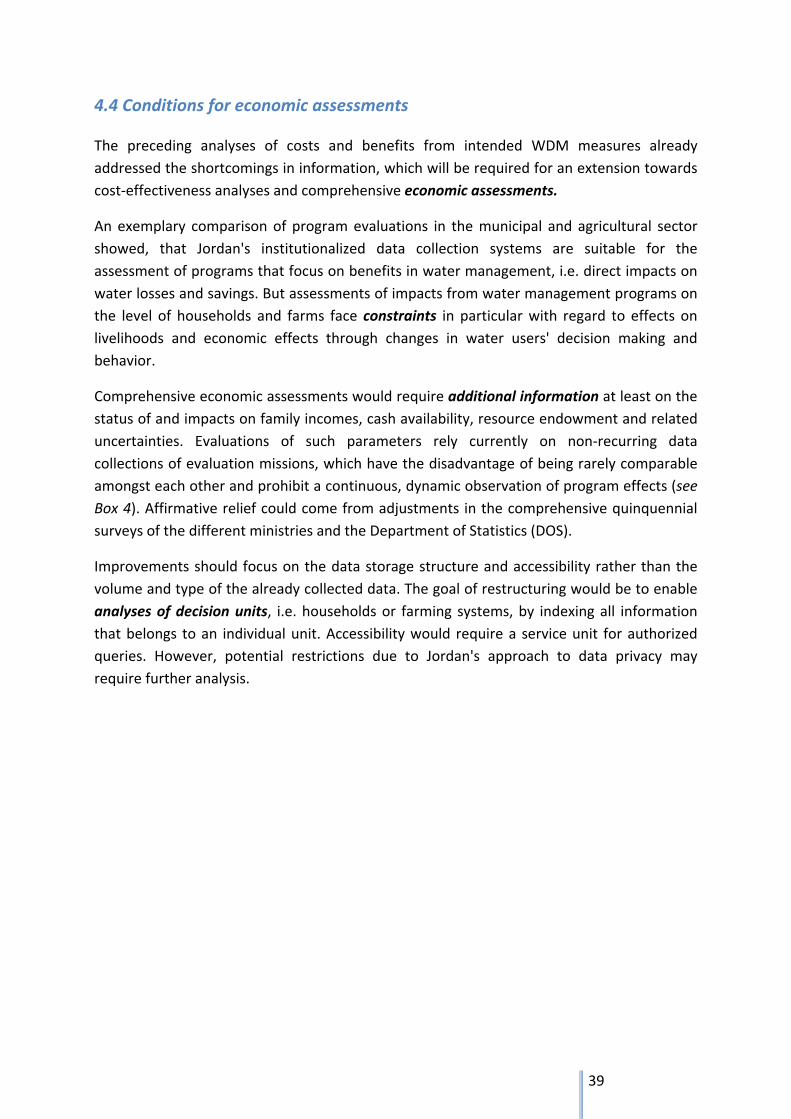
39
4.4 Conditions for economic assessments
The preceding analyses of costs and benefits from intended WDM measures already
addressed the shortcomings in information, which will be required for an extension towards
cost‐effectiveness analyses and comprehensive economic assessments.
An exemplary comparison of program evaluations in the municipal and agricultural sector
showed, that Jordan's institutionalized data collection systems are suitable for the
assessment of programs that focus on benefits in water management, i.e. direct impacts on
water losses and savings. But assessments of impacts from water management programs on
the level of households and farms face constraints in particular with regard to effects on
livelihoods and economic effects through changes in water users' decision making and
behavior.
Comprehensive economic assessments would require additional information at least on the
status of and impacts on family incomes, cash availability, resource endowment and related
uncertainties. Evaluations of such parameters rely currently on non‐recurring data
collections of evaluation missions, which have the disadvantage of being rarely comparable
amongst each other and prohibit a continuous, dynamic observation of program effects (see
Box 4). Affirmative relief could come from adjustments in the comprehensive quinquennial
surveys of the different ministries and the Department of Statistics (DOS).
Improvements should focus on the data storage structure and accessibility rather than the
volume and type of the already collected data. The goal of restructuring would be to enable
analyses of decision units, i.e. households or farming systems, by indexing all information
that belongs to an individual unit. Accessibility would require a service unit for authorized
queries. However, potential restrictions due to Jordan's approach to data privacy may
require further analysis.
40
Box 4: Examples of program assessments
Municipal water sector: The corporatization of water and sanitation services allows for a
direct qualitative and quantitative evaluation of its major benefits due to continuous data
collection on O&M costs, security of continuous water supply and development of NRW. The
results from the assessment of 5 projects under the corporatization program allowed for the
calculation of Net Present Values and Internal Rates of Return, which provide a basis for
objective comparisons between their individual efficiencies.
Example 1: Corporatization: Cost effectiveness analysis results
Corporatization Total water
saving (MCM)
Total saving
(M JD)
At 100% of saving At 50% of saving
NPV IRR NPV IRR
Amman Management
Contract 29.07 25.87 5.49 27.3% ‐1.15 4.8%
NGWA Managing
Consulting 1.36 1.21 ‐3.57 NA ‐4.02 NA
Aqaba Water Company 4.31 3.83 0.86 33% ‐0.33 ‐2.1%
Madaba PSP ‐0.39 ‐0.35 ‐1.19 NA ‐1.07 NA
Miyahuna Company 9.53 8.48 4.41 186.4% 1.22 79.8%
Source: Diagnostic Report of the Jordan Water Demand Management Study, ATEEC/QUASIR 2011 NA: Not applicable
Agricultural water sector: The analysis of Participatory Irrigation Management (PIM) via the
creation of Water Users Associations (WUA) in the Jordan Valley yielded a number of
positive indications on the impacts of the program, which led to the decision to expand this
approach to most areas of the Valley. However, quantitative data on benefits exist only on
reductions in O&M cost, while the majority of benefits may come from higher efficiencies in
the use of land and water by farmers. Required data for the quantification of these effects
may be hidden in the files of the last agricultural survey, but are difficult to access. Current
evaluations rely on case studies only. An assessment of the justifiable funding for the overall
program as well as comparisons with alternative lines of action is thus not possible yet.
Example 2: PIM: Model‐based impact estimations, case study from the southern Jordan
Valley
Indicators Unit Before PIM After PIM
Price elasticity % 1.3 1.7
Total cultivated area Ha 268.6 388.3
Crop intensity % 82 118
Total Revenue US$ 844,532 1,138,979
Source: Al‐Habbab & Al‐Absi (2003)
41
Conclusion
The value of water demand in Jordan still exceeds the costs of water provision, but does so
only by overpumping of groundwater resources. An adjustment between supply and
demands by the exploitation of new water resources will only be possible in the long term
run and lead to an articulate increase in water costs. Potential reductions in water demand
through WDM measures will not be sufficient to bridge the full gap in the meantime, but
would help to alleviate the pressure on Jordan's natural water resources.
Future challenges in the demand side of Jordan's already stressed water balance will
originate in particular from the development in domestic and municipal water use. Growth
in industrial water demand may actually be stronger in proportions, even if it stays far
behind in the absolute amount of water. A major lesson from the scenario analyses of water
demand is that all WDM measures need some years after their initiation until they unfold
their full effects. This emphasizes the necessity to translate already decided measures as
quick as possible into practice and to speed up the specification of conclusive WDM
programs for industries and – to a certain extent ‐ tourism.
WDM in agriculture has certainly the potential to increase economic water use efficiencies,
but does not necessarily lead to a decrease in agricultural water demand. Water is an
important, but just one among many constraints for Jordanian farming systems. The impacts
of a cap on water for agriculture will depend to a large extent on the frame conditions and
their adjustments for the individual types of farming systems. At this point Jordan will have
to decide, what kind of agricultural and rural structures are worthy of preservation and
which structural adjustments may be required for the sustainable development of the
agricultural sector.
42
References
(1) J.A. Allan (2002) The Middle East Water Question. I.B. Tauris Publishers, London, New York.
(2) MWI (2010): Aggregated file on water demand and supply 2008‐2025
(3) Howard G., Bartam J. (2003) Domestic Water Quantity, Service Level and Health. World Health
Organization, Geneva, Switzerland
(4) MWI (2009): Water for Life. Jordan's Water Strategy 2008‐2022. Rev. 10.270309
(5) Ministry of Agriculture / DOS (2007): Agricultural survey
(6) MWI (2009) Action Plan for Implementing the Water Sector Strategy. Available at:
www.mwi.gov.jo/sites/en‐us/Downloads/ActionPlan.pdf (last visited: Dec. 12, 2011)
Additional readings:
1. IDARA (Instituting Water Demand Management In Jordan). Second Year Progress Report,
October 2008‐September 2009
2. MWI/IDARA application of the Alliance Water Use Efficiency (AWE). Water Demand
Growth Forecast NGWA, Miyahuna, AWC. MWI, 2011.
3. O’Neill & Siegelbaum and The RICE Group. Hotel Water Conservation ‐ A Seattle
Demonstration. Seattle Public Utilities Resource Conservation Section, 2002.
4. Salman, A., Al‐Karablieh, E., and Haddadin, M., Limits of Pricing Policy in Curtailing
Household Water Consumption Under Scarcity Conditions, Water Policy, 2008, Vol. 10, P
295‐304.
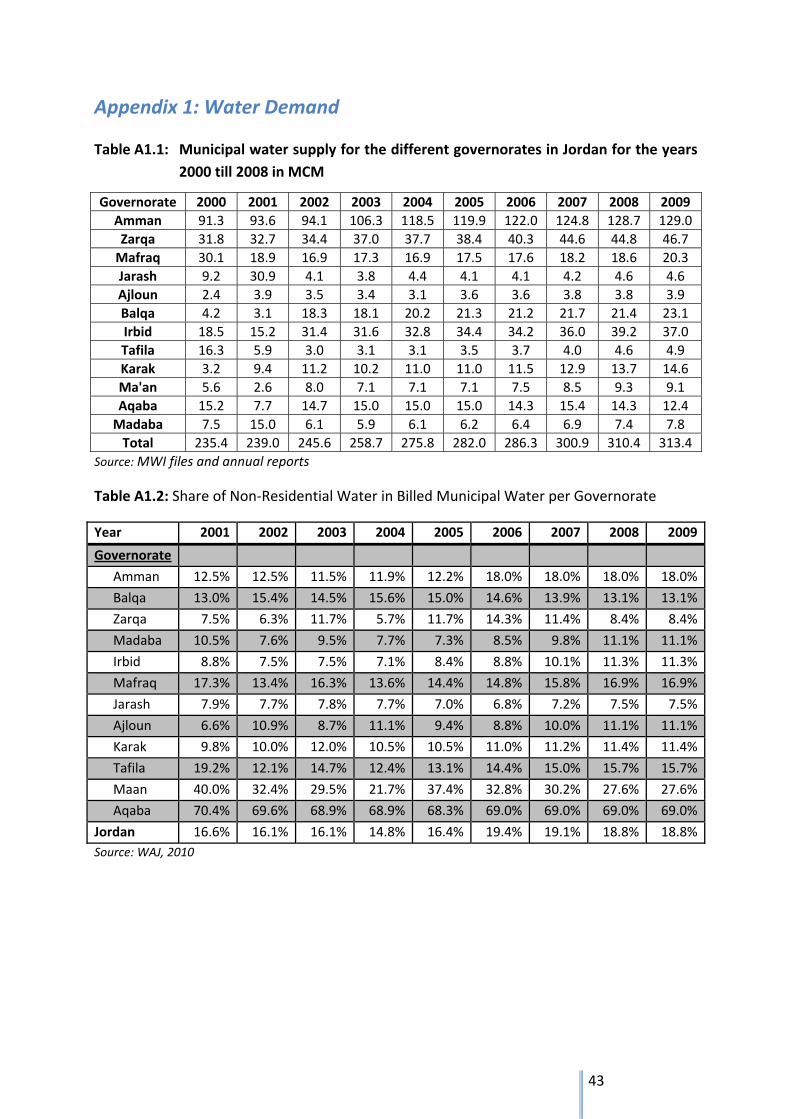
43
Appendix 1: Water Demand
Table A1.1: Municipal water supply for the different governorates in Jordan for the years
2000 till 2008 in MCM
Governorate 2000 2001 2002 2003 2004 2005 2006 2007 2008 2009
Amman 91.3 93.6 94.1 106.3 118.5 119.9 122.0 124.8 128.7 129.0
Zarqa 31.8 32.7 34.4 37.0 37.7 38.4 40.3 44.6 44.8 46.7
Mafraq 30.1 18.9 16.9 17.3 16.9 17.5 17.6 18.2 18.6 20.3
Jarash 9.2 30.9 4.1 3.8 4.4 4.1 4.1 4.2 4.6 4.6
Ajloun 2.4 3.9 3.5 3.4 3.1 3.6 3.6 3.8 3.8 3.9
Balqa 4.2 3.1 18.3 18.1 20.2 21.3 21.2 21.7 21.4 23.1
Irbid 18.5 15.2 31.4 31.6 32.8 34.4 34.2 36.0 39.2 37.0
Tafila 16.3 5.9 3.0 3.1 3.1 3.5 3.7 4.0 4.6 4.9
Karak 3.2 9.4 11.2 10.2 11.0 11.0 11.5 12.9 13.7 14.6
Ma'an 5.6 2.6 8.0 7.1 7.1 7.1 7.5 8.5 9.3 9.1
Aqaba 15.2 7.7 14.7 15.0 15.0 15.0 14.3 15.4 14.3 12.4
Madaba 7.5 15.0 6.1 5.9 6.1 6.2 6.4 6.9 7.4 7.8
Total 235.4 239.0 245.6 258.7 275.8 282.0 286.3 300.9 310.4 313.4
Source: MWI files and annual reports
Table A1.2: Share of Non‐Residential Water in Billed Municipal Water per Governorate
Year 2001 2002 2003 2004 2005 2006 2007 2008 2009
Governorate
Amman 12.5% 12.5% 11.5% 11.9% 12.2% 18.0% 18.0% 18.0% 18.0%
Balqa 13.0% 15.4% 14.5% 15.6% 15.0% 14.6% 13.9% 13.1% 13.1%
Zarqa 7.5% 6.3% 11.7% 5.7% 11.7% 14.3% 11.4% 8.4% 8.4%
Madaba 10.5% 7.6% 9.5% 7.7% 7.3% 8.5% 9.8% 11.1% 11.1%
Irbid 8.8% 7.5% 7.5% 7.1% 8.4% 8.8% 10.1% 11.3% 11.3%
Mafraq 17.3% 13.4% 16.3% 13.6% 14.4% 14.8% 15.8% 16.9% 16.9%
Jarash 7.9% 7.7% 7.8% 7.7% 7.0% 6.8% 7.2% 7.5% 7.5%
Ajloun 6.6% 10.9% 8.7% 11.1% 9.4% 8.8% 10.0% 11.1% 11.1%
Karak 9.8% 10.0% 12.0% 10.5% 10.5% 11.0% 11.2% 11.4% 11.4%
Tafila 19.2% 12.1% 14.7% 12.4% 13.1% 14.4% 15.0% 15.7% 15.7%
Maan 40.0% 32.4% 29.5% 21.7% 37.4% 32.8% 30.2% 27.6% 27.6%
Aqaba 70.4% 69.6% 68.9% 68.9% 68.3% 69.0% 69.0% 69.0% 69.0%
Jordan 16.6% 16.1% 16.1% 14.8% 16.4% 19.4% 19.1% 18.8% 18.8%
Source: WAJ, 2010
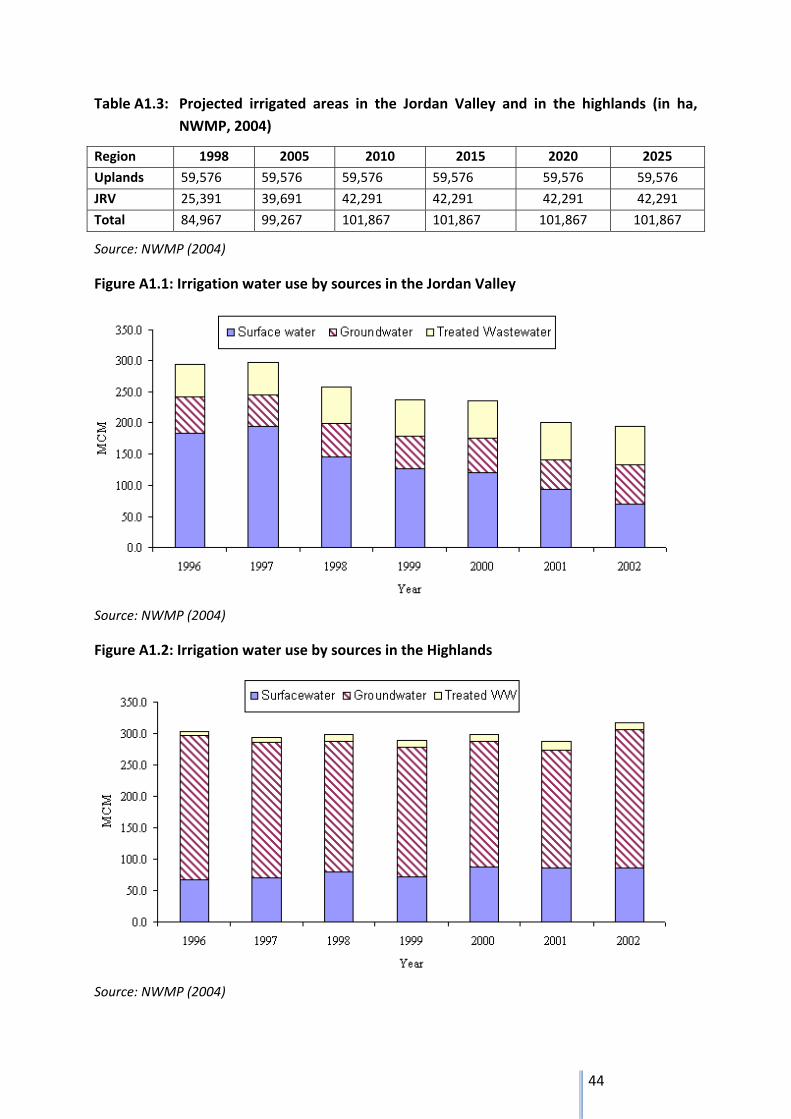
44
Table A1.3: Projected irrigated areas in the Jordan Valley and in the highlands (in ha,
NWMP, 2004)
Region 1998 2005 2010 2015 2020 2025
Uplands 59,576 59,576 59,576 59,576 59,576 59,576
JRV 25,391 39,691 42,291 42,291 42,291 42,291
Total 84,967 99,267 101,867 101,867 101,867 101,867
Source: NWMP (2004)
Figure A1.1: Irrigation water use by sources in the Jordan Valley
Source: NWMP (2004)
Figure A1.2: Irrigation water use by sources in the Highlands
Source: NWMP (2004)
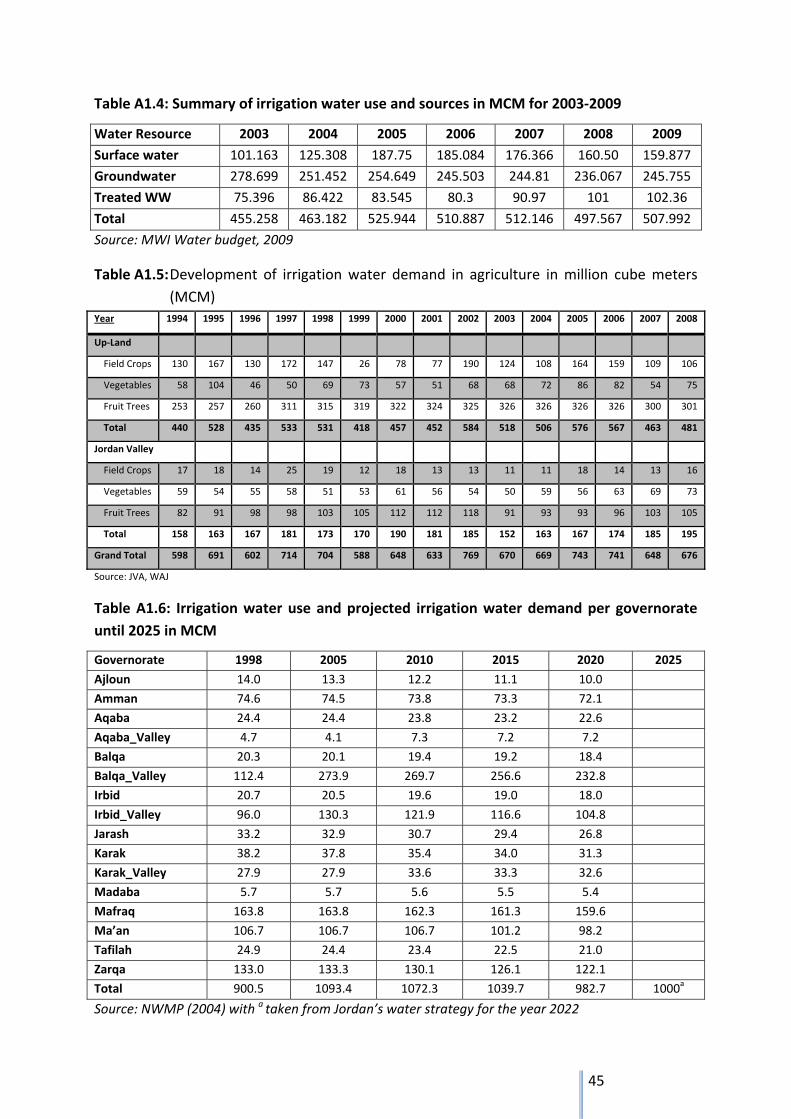
45
Table A1.4: Summary of irrigation water use and sources in MCM for 2003‐2009
Water Resource 2003 2004 2005 2006 2007 2008 2009
Surface water 101.163 125.308 187.75 185.084 176.366 160.50 159.877
Groundwater 278.699 251.452 254.649 245.503 244.81 236.067 245.755
Treated WW 75.396 86.422 83.545 80.3 90.97 101 102.36
Total 455.258 463.182 525.944 510.887 512.146 497.567 507.992
Source: MWI Water budget, 2009
Table A1.5: Development of irrigation water demand in agriculture in million cube meters
(MCM)
Year 1994 1995 1996 1997 1998 1999 2000 2001 2002 2003 2004 2005 2006 2007 2008
Up‐Land
Field Crops 130 167 130 172 147 26 78 77 190 124 108 164 159 109 106
Vegetables 58 104 46 50 69 73 57 51 68 68 72 86 82 54 75
Fruit Trees 253 257 260 311 315 319 322 324 325 326 326 326 326 300 301
Total 440 528 435 533 531 418 457 452 584 518 506 576 567 463 481
Jordan Valley
Field Crops 17 18 14 25 19 12 18 13 13 11 11 18 14 13 16
Vegetables 59 54 55 58 51 53 61 56 54 50 59 56 63 69 73
Fruit Trees 82 91 98 98 103 105 112 112 118 91 93 93 96 103 105
Total 158 163 167 181 173 170 190 181 185 152 163 167 174 185 195
Grand Total 598 691 602 714 704 588 648 633 769 670 669 743 741 648 676
Source: JVA, WAJ
Table A1.6: Irrigation water use and projected irrigation water demand per governorate
until 2025 in MCM
Governorate 1998 2005 2010 2015 2020 2025
Ajloun 14.0 13.3 12.2 11.1 10.0
Amman 74.6 74.5 73.8 73.3 72.1
Aqaba 24.4 24.4 23.8 23.2 22.6
Aqaba_Valley 4.7 4.1 7.3 7.2 7.2
Balqa 20.3 20.1 19.4 19.2 18.4
Balqa_Valley 112.4 273.9 269.7 256.6 232.8
Irbid 20.7 20.5 19.6 19.0 18.0
Irbid_Valley 96.0 130.3 121.9 116.6 104.8
Jarash 33.2 32.9 30.7 29.4 26.8
Karak 38.2 37.8 35.4 34.0 31.3
Karak_Valley 27.9 27.9 33.6 33.3 32.6
Madaba 5.7 5.7 5.6 5.5 5.4
Mafraq 163.8 163.8 162.3 161.3 159.6
Ma’an 106.7 106.7 106.7 101.2 98.2
Tafilah 24.9 24.4 23.4 22.5 21.0
Zarqa 133.0 133.3 130.1 126.1 122.1
Total 900.5 1093.4 1072.3 1039.7 982.7 1000a
Source: NWMP (2004) with a taken from Jordan’s water strategy for the year 2022
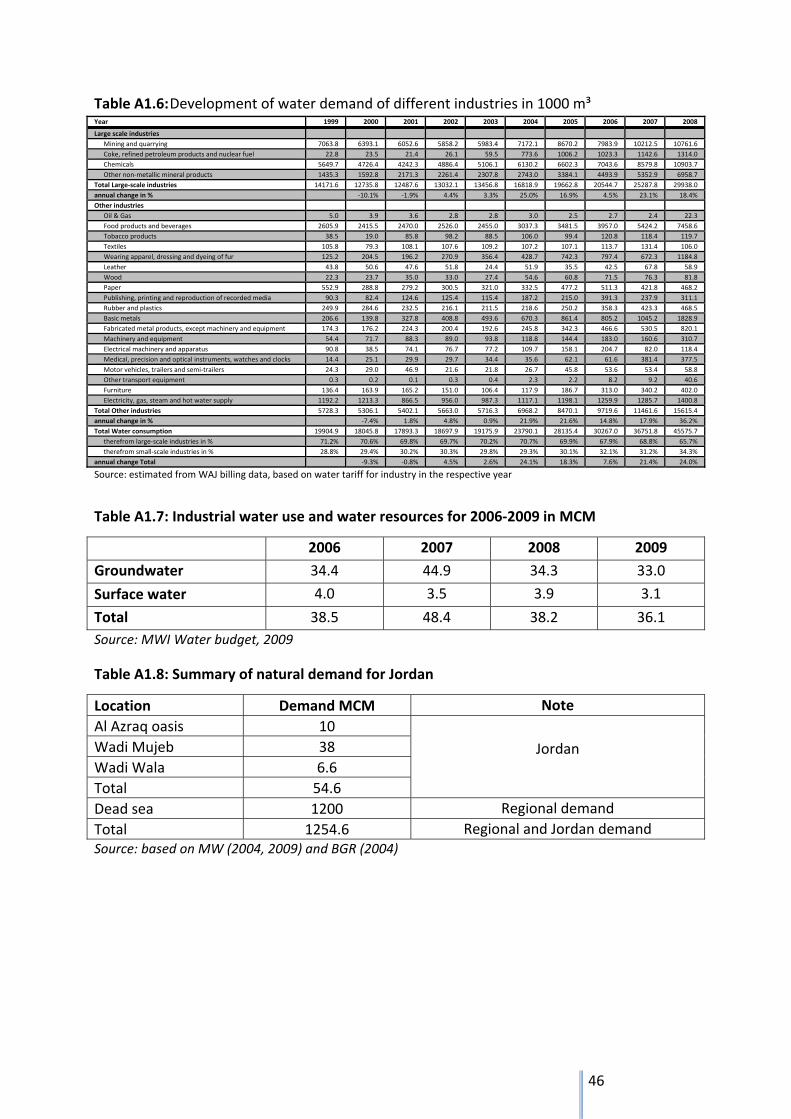
46
Table A1.6: Development of water demand of different industries in 1000 m³ Year 1999 2000 2001 2002 2003 2004 2005 2006 2007 2008
Large scale industries
Mining and quarrying 7063.8 6393.1 6052.6 5858.2 5983.4 7172.1 8670.2 7983.9 10212.5 10761.6
Coke, refined petroleum products and nuclear fuel 22.8 23.5 21.4 26.1 59.5 773.6 1006.2 1023.3 1142.6 1314.0
Chemicals 5649.7 4726.4 4242.3 4886.4 5106.1 6130.2 6602.3 7043.6 8579.8 10903.7
Other non‐metallic mineral products 1435.3 1592.8 2171.3 2261.4 2307.8 2743.0 3384.1 4493.9 5352.9 6958.7
Total Large‐scale industries 14171.6 12735.8 12487.6 13032.1 13456.8 16818.9 19662.8 20544.7 25287.8 29938.0
annual change in % ‐10.1% ‐1.9% 4.4% 3.3% 25.0% 16.9% 4.5% 23.1% 18.4%
Other industries
Oil & Gas 5.0 3.9 3.6 2.8 2.8 3.0 2.5 2.7 2.4 22.3
Food products and beverages 2605.9 2415.5 2470.0 2526.0 2455.0 3037.3 3481.5 3957.0 5424.2 7458.6
Tobacco products 38.5 19.0 85.8 98.2 88.5 106.0 99.4 120.8 118.4 119.7
Textiles 105.8 79.3 108.1 107.6 109.2 107.2 107.1 113.7 131.4 106.0
Wearing apparel, dressing and dyeing of fur 125.2 204.5 196.2 270.9 356.4 428.7 742.3 797.4 672.3 1184.8
Leather 43.8 50.6 47.6 51.8 24.4 51.9 35.5 42.5 67.8 58.9
Wood 22.3 23.7 35.0 33.0 27.4 54.6 60.8 71.5 76.3 81.8
Paper 552.9 288.8 279.2 300.5 321.0 332.5 477.2 511.3 421.8 468.2
Publishing, printing and reproduction of recorded media 90.3 82.4 124.6 125.4 115.4 187.2 215.0 391.3 237.9 311.1
Rubber and plastics 249.9 284.6 232.5 216.1 211.5 218.6 250.2 358.3 423.3 468.5
Basic metals 206.6 139.8 327.8 408.8 493.6 670.3 861.4 805.2 1045.2 1828.9
Fabricated metal products, except machinery and equipment 174.3 176.2 224.3 200.4 192.6 245.8 342.3 466.6 530.5 820.1
Machinery and equipment 54.4 71.7 88.3 89.0 93.8 118.8 144.4 183.0 160.6 310.7
Electrical machinery and apparatus 90.8 38.5 74.1 76.7 77.2 109.7 158.1 204.7 82.0 118.4
Medical, precision and optical instruments, watches and clocks 14.4 25.1 29.9 29.7 34.4 35.6 62.1 61.6 381.4 377.5
Motor vehicles, trailers and semi‐trailers 24.3 29.0 46.9 21.6 21.8 26.7 45.8 53.6 53.4 58.8
Other transport equipment 0.3 0.2 0.1 0.3 0.4 2.3 2.2 8.2 9.2 40.6
Furniture 136.4 163.9 165.2 151.0 106.4 117.9 186.7 313.0 340.2 402.0
Electricity, gas, steam and hot water supply 1192.2 1213.3 866.5 956.0 987.3 1117.1 1198.1 1259.9 1285.7 1400.8
Total Other industries 5728.3 5306.1 5402.1 5663.0 5716.3 6968.2 8470.1 9719.6 11461.6 15615.4
annual change in % ‐7.4% 1.8% 4.8% 0.9% 21.9% 21.6% 14.8% 17.9% 36.2%
Total Water consumption 19904.9 18045.8 17893.3 18697.9 19175.9 23790.1 28135.4 30267.0 36751.8 45575.7
therefrom large‐scale industries in % 71.2% 70.6% 69.8% 69.7% 70.2% 70.7% 69.9% 67.9% 68.8% 65.7%
therefrom small‐scale industries in % 28.8% 29.4% 30.2% 30.3% 29.8% 29.3% 30.1% 32.1% 31.2% 34.3%
annual change Total ‐9.3% ‐0.8% 4.5% 2.6% 24.1% 18.3% 7.6% 21.4% 24.0%
Source: estimated from WAJ billing data, based on water tariff for industry in the respective year
Table A1.7: Industrial water use and water resources for 2006‐2009 in MCM
2006 2007 2008 2009
Groundwater 34.4 44.9 34.3 33.0
Surface water 4.0 3.5 3.9 3.1
Total 38.5 48.4 38.2 36.1
Source: MWI Water budget, 2009
Table A1.8: Summary of natural demand for Jordan
Location Demand MCM Note
Al Azraq oasis 10
Jordan Wadi Mujeb 38
Wadi Wala 6.6
Total 54.6
Dead sea 1200 Regional demand
Total 1254.6 Regional and Jordan demand Source: based on MW (2004, 2009) and BGR (2004)
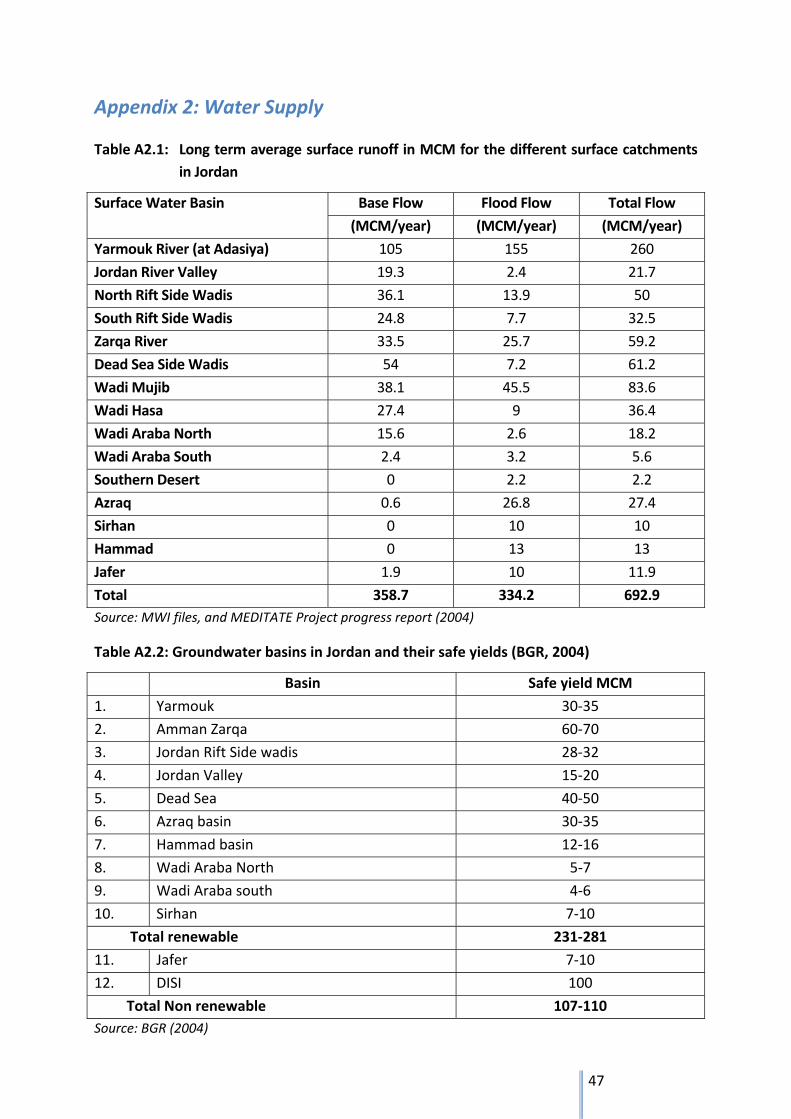
47
Appendix 2: Water Supply
Table A2.1: Long term average surface runoff in MCM for the different surface catchments
in Jordan
Surface Water Basin Base Flow Flood Flow Total Flow
(MCM/year) (MCM/year) (MCM/year)
Yarmouk River (at Adasiya) 105 155 260
Jordan River Valley 19.3 2.4 21.7
North Rift Side Wadis 36.1 13.9 50
South Rift Side Wadis 24.8 7.7 32.5
Zarqa River 33.5 25.7 59.2
Dead Sea Side Wadis 54 7.2 61.2
Wadi Mujib 38.1 45.5 83.6
Wadi Hasa 27.4 9 36.4
Wadi Araba North 15.6 2.6 18.2
Wadi Araba South 2.4 3.2 5.6
Southern Desert 0 2.2 2.2
Azraq 0.6 26.8 27.4
Sirhan 0 10 10
Hammad 0 13 13
Jafer 1.9 10 11.9
Total 358.7 334.2 692.9
Source: MWI files, and MEDITATE Project progress report (2004)
Table A2.2: Groundwater basins in Jordan and their safe yields (BGR, 2004)
Basin Safe yield MCM
1. Yarmouk 30‐35
2. Amman Zarqa 60‐70
3. Jordan Rift Side wadis 28‐32
4. Jordan Valley 15‐20
5. Dead Sea 40‐50
6. Azraq basin 30‐35
7. Hammad basin 12‐16
8. Wadi Araba North 5‐7
9. Wadi Araba south 4‐6
10. Sirhan 7‐10
Total renewable 231‐281
11. Jafer 7‐10
12. DISI 100
Total Non renewable 107‐110
Source: BGR (2004)
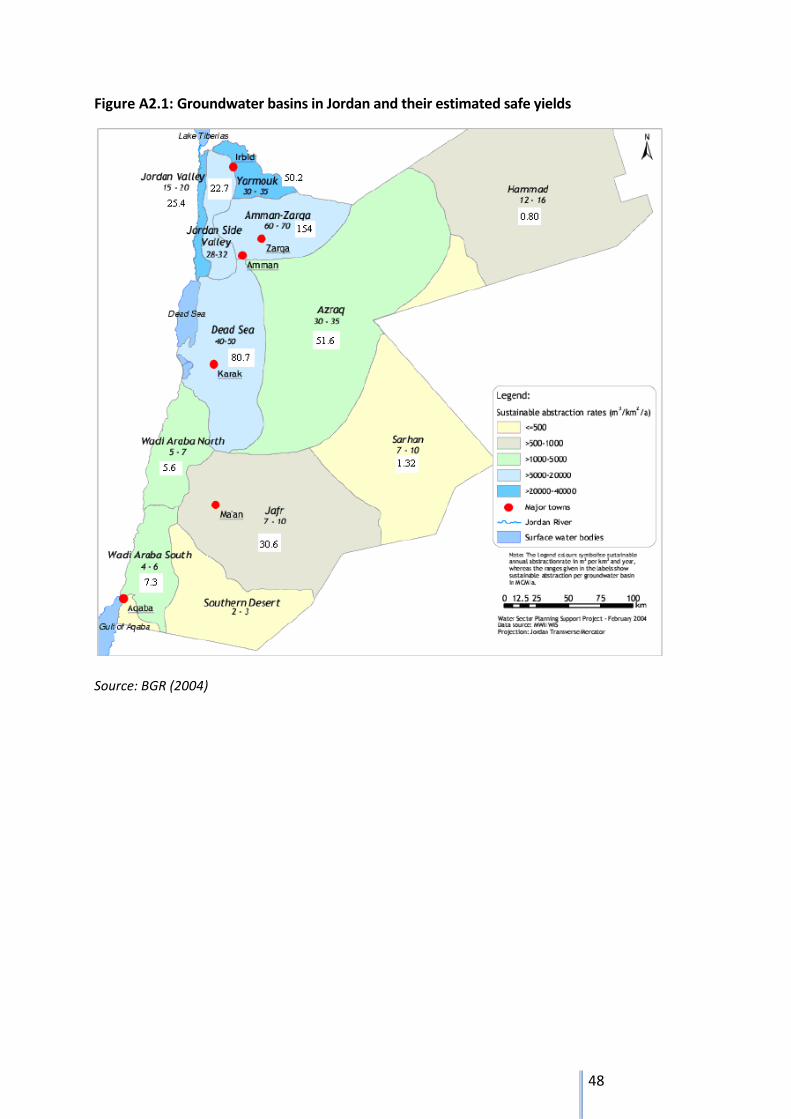
48
Figure A2.1: Groundwater basins in Jordan and their estimated safe yields
Source: BGR (2004)
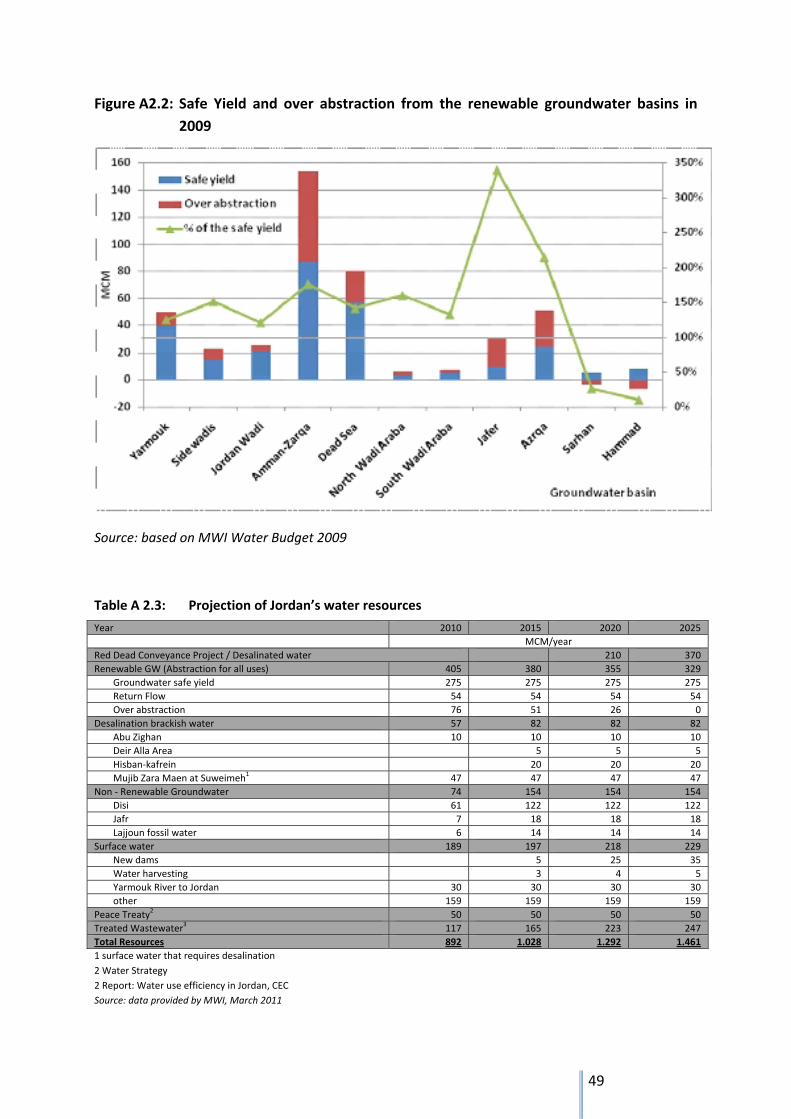
49
Figure A2.2: Safe Yield and over abstraction from the renewable groundwater basins in
2009
Source: based on MWI Water Budget 2009
Table A 2.3: Projection of Jordan’s water resources
Year 2010 2015 2020 2025
MCM/year
Red Dead Conveyance Project / Desalinated water 210 370
Renewable GW (Abstraction for all uses) 405 380 355 329
Groundwater safe yield 275 275 275 275
Return Flow 54 54 54 54
Over abstraction 76 51 26 0
Desalination brackish water 57 82 82 82
Abu Zighan 10 10 10 10
Deir Alla Area 5 5 5
Hisban‐kafrein 20 20 20
Mujib Zara Maen at Suweimeh1 47 47 47 47
Non ‐ Renewable Groundwater 74 154 154 154
Disi 61 122 122 122
Jafr 7 18 18 18
Lajjoun fossil water 6 14 14 14
Surface water 189 197 218 229
New dams 5 25 35
Water harvesting 3 4 5
Yarmouk River to Jordan 30 30 30 30
other 159 159 159 159
Peace Treaty2 50 50 50 50
Treated Wastewater3 117 165 223 247
Total Resources 892 1.028 1.292 1.461
1 surface water that requires desalination
2 Water Strategy
2 Report: Water use efficiency in Jordan, CEC
Source: data provided by MWI, March 2011
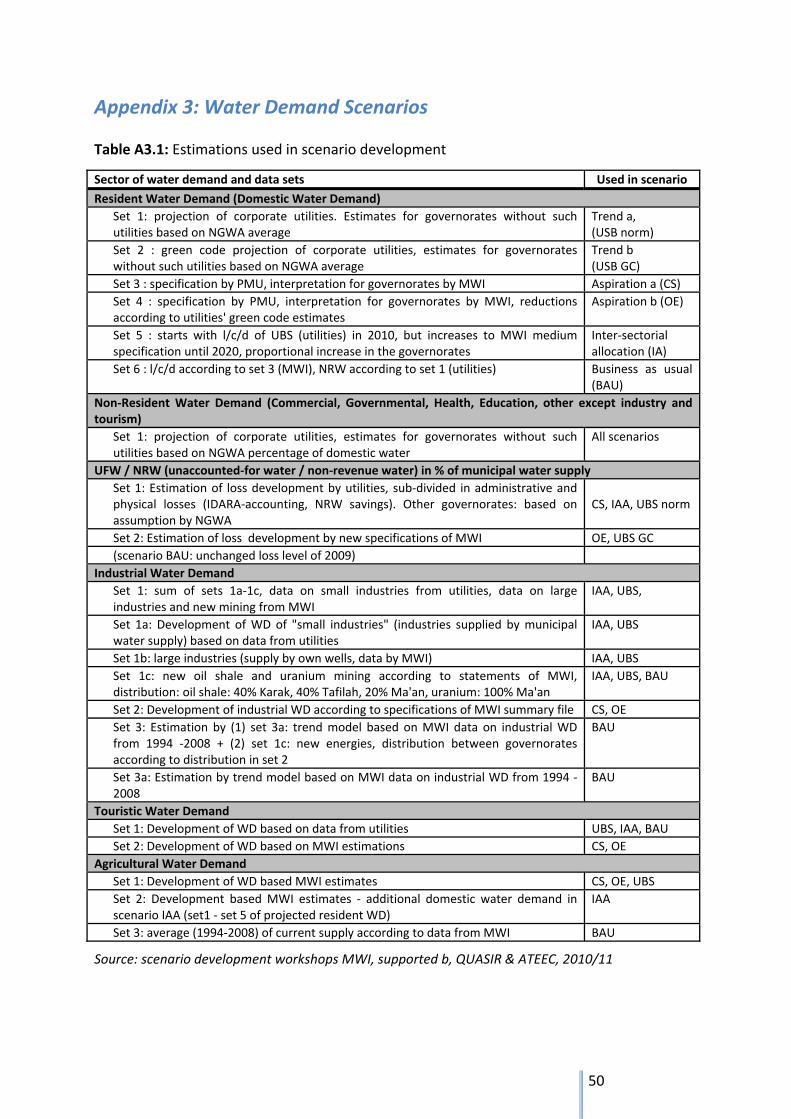
50
Appendix 3: Water Demand Scenarios
Table A3.1: Estimations used in scenario development
Sector of water demand and data sets Used in scenario
Resident Water Demand (Domestic Water Demand)
Set 1: projection of corporate utilities. Estimates for governorates without such utilities based on NGWA average
Trend a, (USB norm)
Set 2 : green code projection of corporate utilities, estimates for governorates without such utilities based on NGWA average
Trend b (USB GC)
Set 3 : specification by PMU, interpretation for governorates by MWI Aspiration a (CS)
Set 4 : specification by PMU, interpretation for governorates by MWI, reductions according to utilities' green code estimates
Aspiration b (OE)
Set 5 : starts with l/c/d of UBS (utilities) in 2010, but increases to MWI medium specification until 2020, proportional increase in the governorates
Inter‐sectorial allocation (IA)
Set 6 : l/c/d according to set 3 (MWI), NRW according to set 1 (utilities) Business as usual (BAU)
Non‐Resident Water Demand (Commercial, Governmental, Health, Education, other except industry and tourism)
Set 1: projection of corporate utilities, estimates for governorates without such utilities based on NGWA percentage of domestic water
All scenarios
UFW / NRW (unaccounted‐for water / non‐revenue water) in % of municipal water supply
Set 1: Estimation of loss development by utilities, sub‐divided in administrative and physical losses (IDARA‐accounting, NRW savings). Other governorates: based on assumption by NGWA
CS, IAA, UBS norm
Set 2: Estimation of loss development by new specifications of MWI OE, UBS GC
(scenario BAU: unchanged loss level of 2009)
Industrial Water Demand
Set 1: sum of sets 1a‐1c, data on small industries from utilities, data on large industries and new mining from MWI
IAA, UBS,
Set 1a: Development of WD of "small industries" (industries supplied by municipal water supply) based on data from utilities
IAA, UBS
Set 1b: large industries (supply by own wells, data by MWI) IAA, UBS
Set 1c: new oil shale and uranium mining according to statements of MWI, distribution: oil shale: 40% Karak, 40% Tafilah, 20% Ma'an, uranium: 100% Ma'an
IAA, UBS, BAU
Set 2: Development of industrial WD according to specifications of MWI summary file CS, OE
Set 3: Estimation by (1) set 3a: trend model based on MWI data on industrial WD from 1994 ‐2008 + (2) set 1c: new energies, distribution between governorates according to distribution in set 2
BAU
Set 3a: Estimation by trend model based on MWI data on industrial WD from 1994 ‐2008
BAU
Touristic Water Demand
Set 1: Development of WD based on data from utilities UBS, IAA, BAU
Set 2: Development of WD based on MWI estimations CS, OE
Agricultural Water Demand
Set 1: Development of WD based MWI estimates CS, OE, UBS
Set 2: Development based MWI estimates ‐ additional domestic water demand in scenario IAA (set1 ‐ set 5 of projected resident WD)
IAA
Set 3: average (1994‐2008) of current supply according to data from MWI BAU
Source: scenario development workshops MWI, supported b, QUASIR & ATEEC, 2010/11
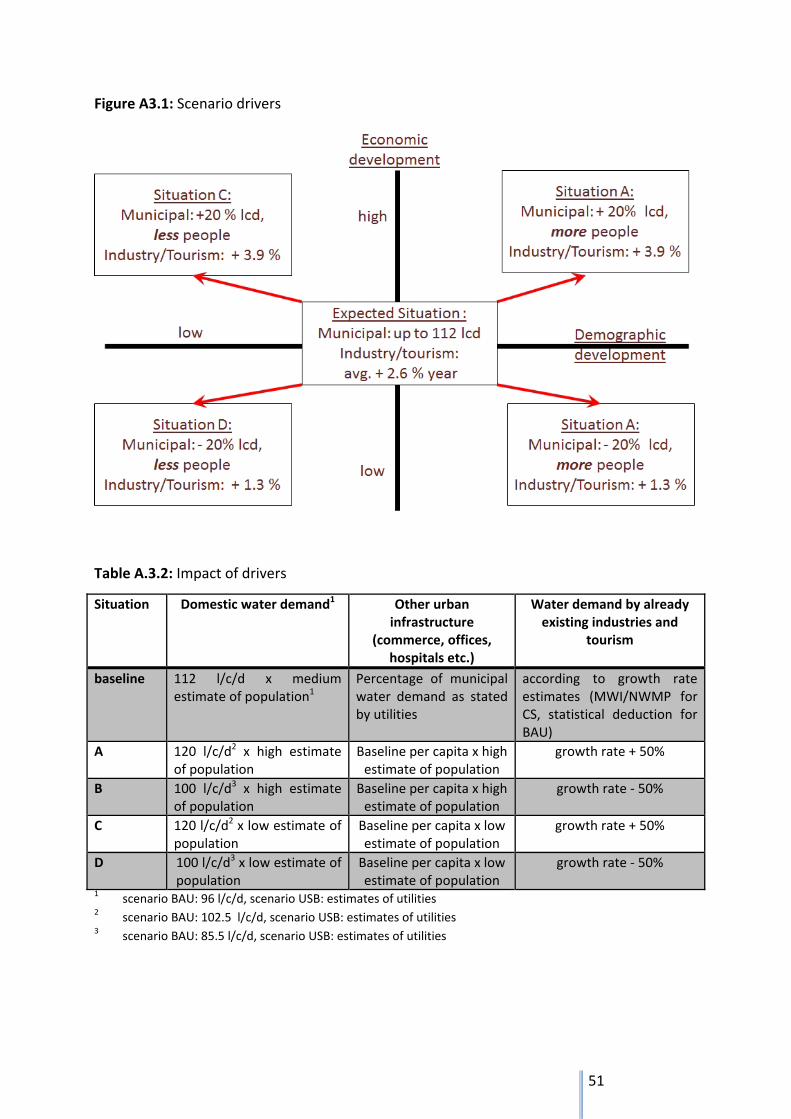
51
Figure A3.1: Scenario drivers
Table A.3.2: Impact of drivers
Situation Domestic water demand1 Other urban infrastructure
(commerce, offices, hospitals etc.)
Water demand by already existing industries and
tourism
baseline 112 l/c/d x medium estimate of population1
Percentage of municipal water demand as stated by utilities
according to growth rate estimates (MWI/NWMP for CS, statistical deduction for BAU)
A 120 l/c/d2 x high estimate of population
Baseline per capita x high estimate of population
growth rate + 50%
B 100 l/c/d3 x high estimate of population
Baseline per capita x high estimate of population
growth rate ‐ 50%
C 120 l/c/d2 x low estimate of population
Baseline per capita x low estimate of population
growth rate + 50%
D 100 l/c/d3 x low estimate of population
Baseline per capita x low estimate of population
growth rate ‐ 50%
1 scenario BAU: 96 l/c/d, scenario USB: estimates of utilities 2 scenario BAU: 102.5 l/c/d, scenario USB: estimates of utilities 3 scenario BAU: 85.5 l/c/d, scenario USB: estimates of utilities
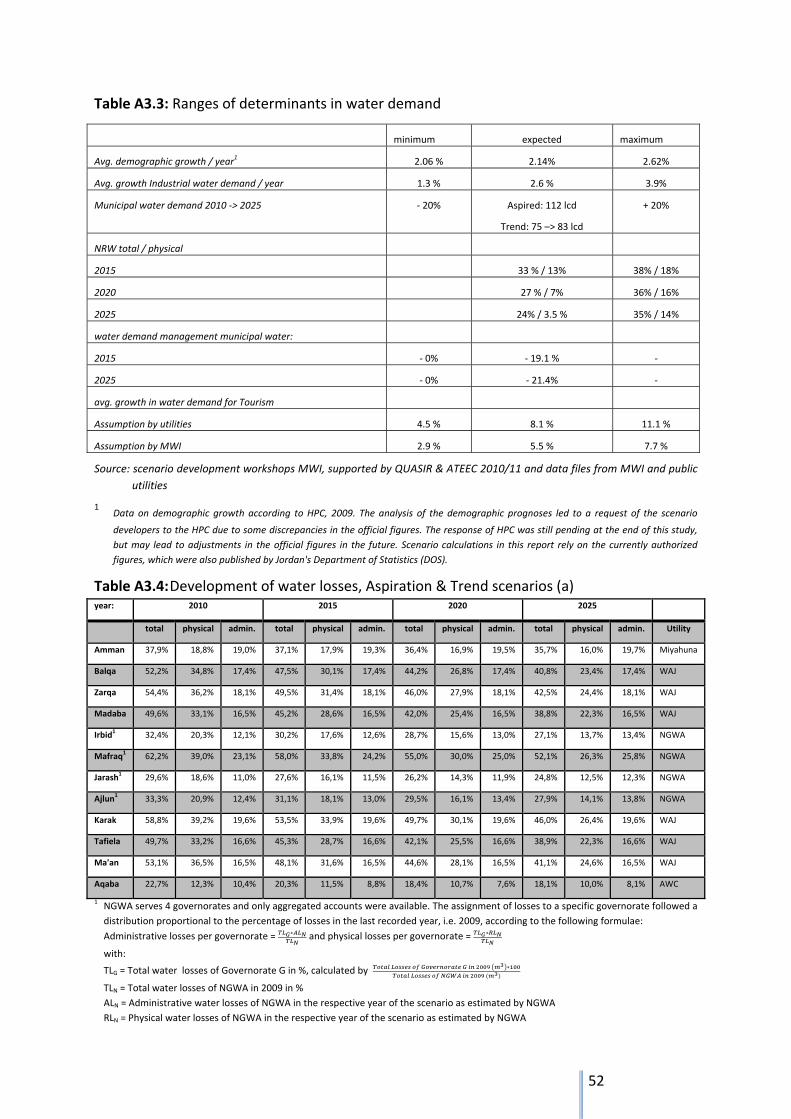
52
Table A3.3: Ranges of determinants in water demand
minimum expected maximum
Avg. demographic growth / year1 2.06 % 2.14% 2.62%
Avg. growth Industrial water demand / year 1.3 % 2.6 % 3.9%
Municipal water demand 2010 ‐> 2025 ‐ 20% Aspired: 112 lcd
Trend: 75 –> 83 lcd
+ 20%
NRW total / physical
2015 33 % / 13% 38% / 18%
2020 27 % / 7% 36% / 16%
2025 24% / 3.5 % 35% / 14%
water demand management municipal water:
2015 ‐ 0% ‐ 19.1 % ‐
2025 ‐ 0% ‐ 21.4% ‐
avg. growth in water demand for Tourism
Assumption by utilities 4.5 % 8.1 % 11.1 %
Assumption by MWI 2.9 % 5.5 % 7.7 %
Source: scenario development workshops MWI, supported by QUASIR & ATEEC 2010/11 and data files from MWI and public
utilities
1 Data on demographic growth according to HPC, 2009. The analysis of the demographic prognoses led to a request of the scenario
developers to the HPC due to some discrepancies in the official figures. The response of HPC was still pending at the end of this study,
but may lead to adjustments in the official figures in the future. Scenario calculations in this report rely on the currently authorized
figures, which were also published by Jordan's Department of Statistics (DOS).
Table A3.4: Development of water losses, Aspiration & Trend scenarios (a) year: 2010 2015 2020 2025
total physical admin. total physical admin. total physical admin. total physical admin. Utility
Amman 37,9% 18,8% 19,0% 37,1% 17,9% 19,3% 36,4% 16,9% 19,5% 35,7% 16,0% 19,7% Miyahuna
Balqa 52,2% 34,8% 17,4% 47,5% 30,1% 17,4% 44,2% 26,8% 17,4% 40,8% 23,4% 17,4% WAJ
Zarqa 54,4% 36,2% 18,1% 49,5% 31,4% 18,1% 46,0% 27,9% 18,1% 42,5% 24,4% 18,1% WAJ
Madaba 49,6% 33,1% 16,5% 45,2% 28,6% 16,5% 42,0% 25,4% 16,5% 38,8% 22,3% 16,5% WAJ
Irbid1 32,4% 20,3% 12,1% 30,2% 17,6% 12,6% 28,7% 15,6% 13,0% 27,1% 13,7% 13,4% NGWA
Mafraq1 62,2% 39,0% 23,1% 58,0% 33,8% 24,2% 55,0% 30,0% 25,0% 52,1% 26,3% 25,8% NGWA
Jarash1 29,6% 18,6% 11,0% 27,6% 16,1% 11,5% 26,2% 14,3% 11,9% 24,8% 12,5% 12,3% NGWA
Ajlun1 33,3% 20,9% 12,4% 31,1% 18,1% 13,0% 29,5% 16,1% 13,4% 27,9% 14,1% 13,8% NGWA
Karak 58,8% 39,2% 19,6% 53,5% 33,9% 19,6% 49,7% 30,1% 19,6% 46,0% 26,4% 19,6% WAJ
Tafiela 49,7% 33,2% 16,6% 45,3% 28,7% 16,6% 42,1% 25,5% 16,6% 38,9% 22,3% 16,6% WAJ
Ma'an 53,1% 36,5% 16,5% 48,1% 31,6% 16,5% 44,6% 28,1% 16,5% 41,1% 24,6% 16,5% WAJ
Aqaba 22,7% 12,3% 10,4% 20,3% 11,5% 8,8% 18,4% 10,7% 7,6% 18,1% 10,0% 8,1% AWC
1 NGWA serves 4 governorates and only aggregated accounts were available. The assignment of losses to a specific governorate followed a
distribution proportional to the percentage of losses in the last recorded year, i.e. 2009, according to the following formulae:
Administrative losses per governorate = ∗ and physical losses per governorate = ∗
with:
TLG = Total water losses of Governorate G in %, calculated by ∗
TLN = Total water losses of NGWA in 2009 in %
ALN = Administrative water losses of NGWA in the respective year of the scenario as estimated by NGWA
RLN = Physical water losses of NGWA in the respective year of the scenario as estimated by NGWA
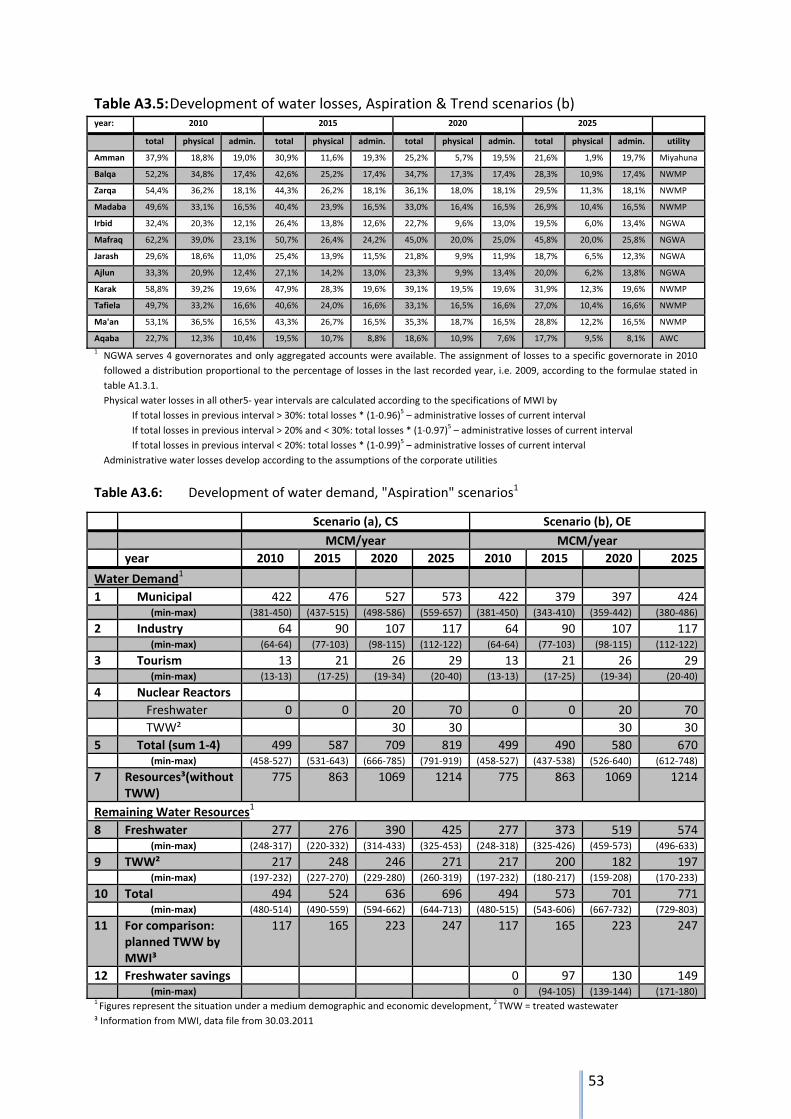
53
Table A3.5: Development of water losses, Aspiration & Trend scenarios (b) year: 2010 2015 2020 2025
total physical admin. total physical admin. total physical admin. total physical admin. utility
Amman 37,9% 18,8% 19,0% 30,9% 11,6% 19,3% 25,2% 5,7% 19,5% 21,6% 1,9% 19,7% Miyahuna
Balqa 52,2% 34,8% 17,4% 42,6% 25,2% 17,4% 34,7% 17,3% 17,4% 28,3% 10,9% 17,4% NWMP
Zarqa 54,4% 36,2% 18,1% 44,3% 26,2% 18,1% 36,1% 18,0% 18,1% 29,5% 11,3% 18,1% NWMP
Madaba 49,6% 33,1% 16,5% 40,4% 23,9% 16,5% 33,0% 16,4% 16,5% 26,9% 10,4% 16,5% NWMP
Irbid 32,4% 20,3% 12,1% 26,4% 13,8% 12,6% 22,7% 9,6% 13,0% 19,5% 6,0% 13,4% NGWA
Mafraq 62,2% 39,0% 23,1% 50,7% 26,4% 24,2% 45,0% 20,0% 25,0% 45,8% 20,0% 25,8% NGWA
Jarash 29,6% 18,6% 11,0% 25,4% 13,9% 11,5% 21,8% 9,9% 11,9% 18,7% 6,5% 12,3% NGWA
Ajlun 33,3% 20,9% 12,4% 27,1% 14,2% 13,0% 23,3% 9,9% 13,4% 20,0% 6,2% 13,8% NGWA
Karak 58,8% 39,2% 19,6% 47,9% 28,3% 19,6% 39,1% 19,5% 19,6% 31,9% 12,3% 19,6% NWMP
Tafiela 49,7% 33,2% 16,6% 40,6% 24,0% 16,6% 33,1% 16,5% 16,6% 27,0% 10,4% 16,6% NWMP
Ma'an 53,1% 36,5% 16,5% 43,3% 26,7% 16,5% 35,3% 18,7% 16,5% 28,8% 12,2% 16,5% NWMP
Aqaba 22,7% 12,3% 10,4% 19,5% 10,7% 8,8% 18,6% 10,9% 7,6% 17,7% 9,5% 8,1% AWC
1 NGWA serves 4 governorates and only aggregated accounts were available. The assignment of losses to a specific governorate in 2010
followed a distribution proportional to the percentage of losses in the last recorded year, i.e. 2009, according to the formulae stated in
table A1.3.1.
Physical water losses in all other5‐ year intervals are calculated according to the specifications of MWI by
If total losses in previous interval > 30%: total losses * (1‐0.96)5 – administrative losses of current interval
If total losses in previous interval > 20% and < 30%: total losses * (1‐0.97)5 – administrative losses of current interval
If total losses in previous interval < 20%: total losses * (1‐0.99)5 – administrative losses of current interval
Administrative water losses develop according to the assumptions of the corporate utilities
Table A3.6: Development of water demand, "Aspiration" scenarios1
Scenario (a), CS Scenario (b), OE
MCM/year MCM/year
year 2010 2015 2020 2025 2010 2015 2020 2025
Water Demand1
1 Municipal 422 476 527 573 422 379 397 424 (min‐max) (381‐450) (437‐515) (498‐586) (559‐657) (381‐450) (343‐410) (359‐442) (380‐486)
2 Industry 64 90 107 117 64 90 107 117 (min‐max) (64‐64) (77‐103) (98‐115) (112‐122) (64‐64) (77‐103) (98‐115) (112‐122)
3 Tourism 13 21 26 29 13 21 26 29 (min‐max) (13‐13) (17‐25) (19‐34) (20‐40) (13‐13) (17‐25) (19‐34) (20‐40)
4 Nuclear Reactors
Freshwater 0 0 20 70 0 0 20 70
TWW² 30 30 30 30
5 Total (sum 1‐4) 499 587 709 819 499 490 580 670 (min‐max) (458‐527) (531‐643) (666‐785) (791‐919) (458‐527) (437‐538) (526‐640) (612‐748)
7 Resources³(withoutTWW)
775 863 1069 1214 775 863 1069 1214
Remaining Water Resources1
8 Freshwater 277 276 390 425 277 373 519 574 (min‐max) (248‐317) (220‐332) (314‐433) (325‐453) (248‐318) (325‐426) (459‐573) (496‐633)
9 TWW² 217 248 246 271 217 200 182 197 (min‐max) (197‐232) (227‐270) (229‐280) (260‐319) (197‐232) (180‐217) (159‐208) (170‐233)
10 Total 494 524 636 696 494 573 701 771 (min‐max) (480‐514) (490‐559) (594‐662) (644‐713) (480‐515) (543‐606) (667‐732) (729‐803)
11 For comparison: planned TWW by MWI³
117 165 223 247 117 165 223 247
12 Freshwater savings 0 97 130 149 (min‐max) 0 (94‐105) (139‐144) (171‐180)1 Figures represent the situation under a medium demographic and economic development,
2 TWW = treated wastewater
³ Information from MWI, data file from 30.03.2011
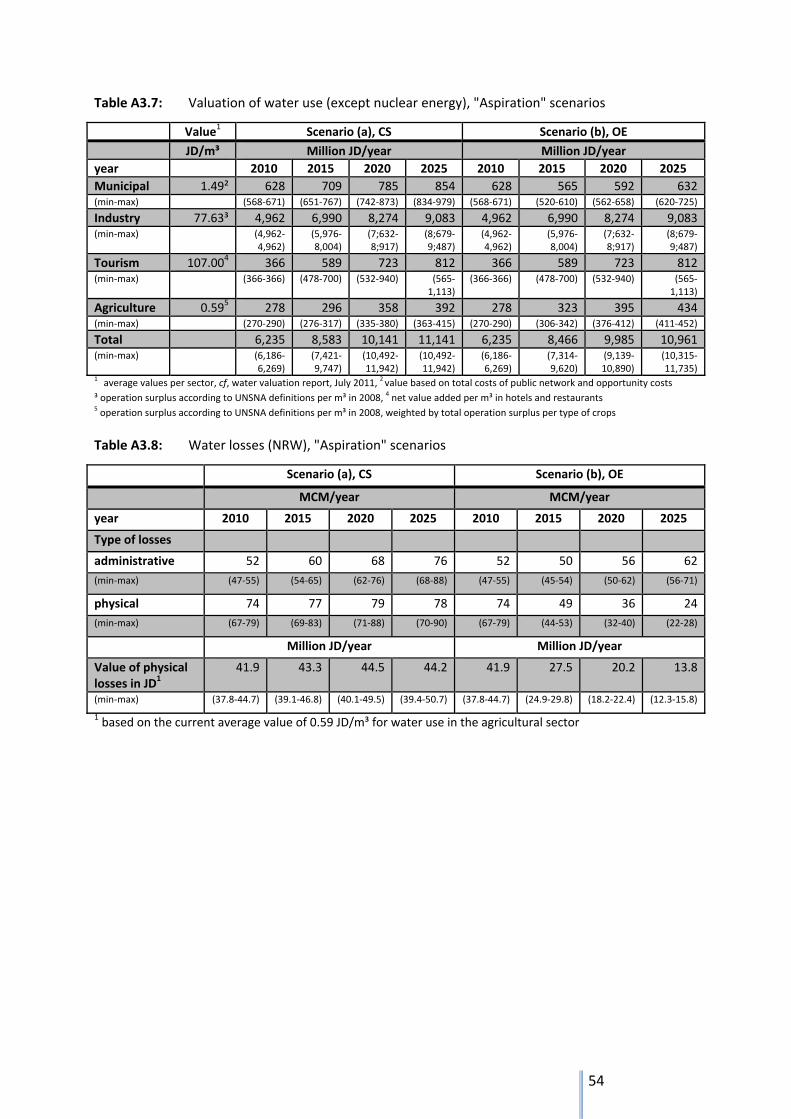
54
Table A3.7: Valuation of water use (except nuclear energy), "Aspiration" scenarios
Value1 Scenario (a), CS Scenario (b), OE
JD/m³ Million JD/year Million JD/year
year 2010 2015 2020 2025 2010 2015 2020 2025
Municipal 1.49² 628 709 785 854 628 565 592 632(min‐max) (568‐671) (651‐767) (742‐873) (834‐979) (568‐671) (520‐610) (562‐658) (620‐725)
Industry 77.63³ 4,962 6,990 8,274 9,083 4,962 6,990 8,274 9,083(min‐max) (4,962‐
4,962) (5,976‐8,004)
(7;632‐8;917)
(8;679‐9;487)
(4,962‐4,962)
(5,976‐8,004)
(7;632‐8;917)
(8;679‐9;487)
Tourism 107.004 366 589 723 812 366 589 723 812(min‐max) (366‐366) (478‐700) (532‐940) (565‐
1,113) (366‐366) (478‐700) (532‐940) (565‐
1,113)
Agriculture 0.595 278 296 358 392 278 323 395 434(min‐max) (270‐290) (276‐317) (335‐380) (363‐415) (270‐290) (306‐342) (376‐412) (411‐452)
Total 6,235 8,583 10,141 11,141 6,235 8,466 9,985 10,961(min‐max) (6,186‐
6,269) (7,421‐9,747)
(10,492‐11,942)
(10,492‐11,942)
(6,186‐6,269)
(7,314‐9,620)
(9,139‐10,890)
(10,315‐11,735)
1 average values per sector, cf, water valuation report, July 2011,
2 value based on total costs of public network and opportunity costs
³ operation surplus according to UNSNA definitions per m³ in 2008, 4 net value added per m³ in hotels and restaurants
5 operation surplus according to UNSNA definitions per m³ in 2008, weighted by total operation surplus per type of crops
Table A3.8: Water losses (NRW), "Aspiration" scenarios
Scenario (a), CS Scenario (b), OE
MCM/year MCM/year
year 2010 2015 2020 2025 2010 2015 2020 2025
Type of losses
administrative 52 60 68 76 52 50 56 62
(min‐max) (47‐55) (54‐65) (62‐76) (68‐88) (47‐55) (45‐54) (50‐62) (56‐71)
physical 74 77 79 78 74 49 36 24
(min‐max) (67‐79) (69‐83) (71‐88) (70‐90) (67‐79) (44‐53) (32‐40) (22‐28)
Million JD/year Million JD/year
Value of physical losses in JD1
41.9 43.3 44.5 44.2 41.9 27.5 20.2 13.8
(min‐max) (37.8‐44.7) (39.1‐46.8) (40.1‐49.5) (39.4‐50.7) (37.8‐44.7) (24.9‐29.8) (18.2‐22.4) (12.3‐15.8)
1 based on the current average value of 0.59 JD/m³ for water use in the agricultural sector
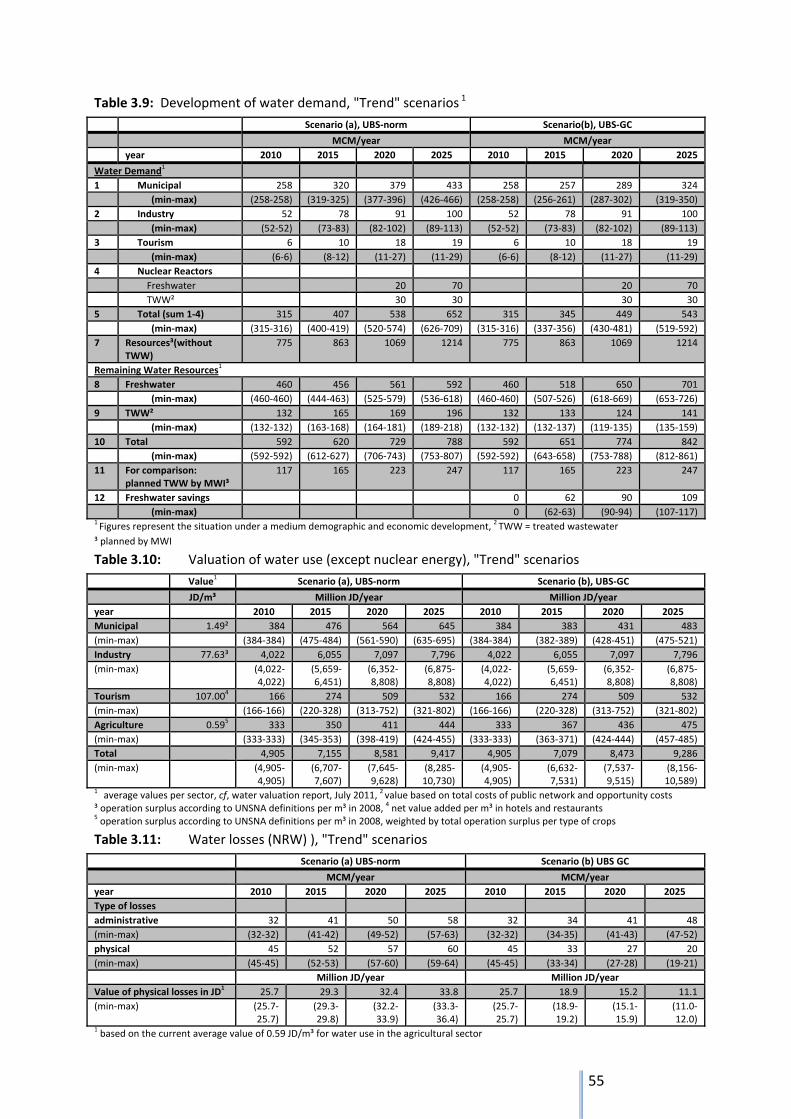
55
Table 3.9: Development of water demand, "Trend" scenarios 1
Scenario (a), UBS‐norm Scenario(b), UBS‐GC
MCM/year MCM/year
year 2010 2015 2020 2025 2010 2015 2020 2025
Water Demand1
1 Municipal 258 320 379 433 258 257 289 324
(min‐max) (258‐258) (319‐325) (377‐396) (426‐466) (258‐258) (256‐261) (287‐302) (319‐350)
2 Industry 52 78 91 100 52 78 91 100
(min‐max) (52‐52) (73‐83) (82‐102) (89‐113) (52‐52) (73‐83) (82‐102) (89‐113)
3 Tourism 6 10 18 19 6 10 18 19
(min‐max) (6‐6) (8‐12) (11‐27) (11‐29) (6‐6) (8‐12) (11‐27) (11‐29)
4 Nuclear Reactors
Freshwater 20 70 20 70
TWW² 30 30 30 30
5 Total (sum 1‐4) 315 407 538 652 315 345 449 543
(min‐max) (315‐316) (400‐419) (520‐574) (626‐709) (315‐316) (337‐356) (430‐481) (519‐592)
7 Resources³(without TWW)
775 863 1069 1214 775 863 1069 1214
Remaining Water Resources1
8 Freshwater 460 456 561 592 460 518 650 701
(min‐max) (460‐460) (444‐463) (525‐579) (536‐618) (460‐460) (507‐526) (618‐669) (653‐726)
9 TWW² 132 165 169 196 132 133 124 141
(min‐max) (132‐132) (163‐168) (164‐181) (189‐218) (132‐132) (132‐137) (119‐135) (135‐159)
10 Total 592 620 729 788 592 651 774 842
(min‐max) (592‐592) (612‐627) (706‐743) (753‐807) (592‐592) (643‐658) (753‐788) (812‐861)
11 For comparison: planned TWW by MWI³
117 165 223 247 117 165 223 247
12 Freshwater savings 0 62 90 109
(min‐max) 0 (62‐63) (90‐94) (107‐117)1 Figures represent the situation under a medium demographic and economic development,
2 TWW = treated wastewater
³ planned by MWI
Table 3.10: Valuation of water use (except nuclear energy), "Trend" scenarios
Value1 Scenario (a), UBS‐norm Scenario (b), UBS‐GC
JD/m³ Million JD/year Million JD/year
year 2010 2015 2020 2025 2010 2015 2020 2025
Municipal 1.49² 384 476 564 645 384 383 431 483
(min‐max) (384‐384) (475‐484) (561‐590) (635‐695) (384‐384) (382‐389) (428‐451) (475‐521)
Industry 77.63³ 4,022 6,055 7,097 7,796 4,022 6,055 7,097 7,796
(min‐max) (4,022‐4,022)
(5,659‐6,451)
(6,352‐8,808)
(6,875‐8,808)
(4,022‐4,022)
(5,659‐6,451)
(6,352‐8,808)
(6,875‐8,808)
Tourism 107.004 166 274 509 532 166 274 509 532
(min‐max) (166‐166) (220‐328) (313‐752) (321‐802) (166‐166) (220‐328) (313‐752) (321‐802)
Agriculture 0.595 333 350 411 444 333 367 436 475
(min‐max) (333‐333) (345‐353) (398‐419) (424‐455) (333‐333) (363‐371) (424‐444) (457‐485)
Total 4,905 7,155 8,581 9,417 4,905 7,079 8,473 9,286
(min‐max) (4,905‐4,905)
(6,707‐7,607)
(7,645‐9,628)
(8,285‐10,730)
(4,905‐4,905)
(6,632‐7,531)
(7,537‐9,515)
(8,156‐10,589)
1 average values per sector, cf, water valuation report, July 2011,
2 value based on total costs of public network and opportunity costs
³ operation surplus according to UNSNA definitions per m³ in 2008, 4 net value added per m³ in hotels and restaurants
5 operation surplus according to UNSNA definitions per m³ in 2008, weighted by total operation surplus per type of crops
Table 3.11: Water losses (NRW) ), "Trend" scenarios
Scenario (a) UBS‐norm Scenario (b) UBS GC
MCM/year MCM/year
year 2010 2015 2020 2025 2010 2015 2020 2025
Type of losses
administrative 32 41 50 58 32 34 41 48
(min‐max) (32‐32) (41‐42) (49‐52) (57‐63) (32‐32) (34‐35) (41‐43) (47‐52)
physical 45 52 57 60 45 33 27 20
(min‐max) (45‐45) (52‐53) (57‐60) (59‐64) (45‐45) (33‐34) (27‐28) (19‐21)
Million JD/year Million JD/year
Value of physical losses in JD1 25.7 29.3 32.4 33.8 25.7 18.9 15.2 11.1
(min‐max) (25.7‐25.7)
(29.3‐29.8)
(32.2‐33.9)
(33.3‐36.4)
(25.7‐25.7)
(18.9‐19.2)
(15.1‐15.9)
(11.0‐12.0)
1 based on the current average value of 0.59 JD/m³ for water use in the agricultural sector
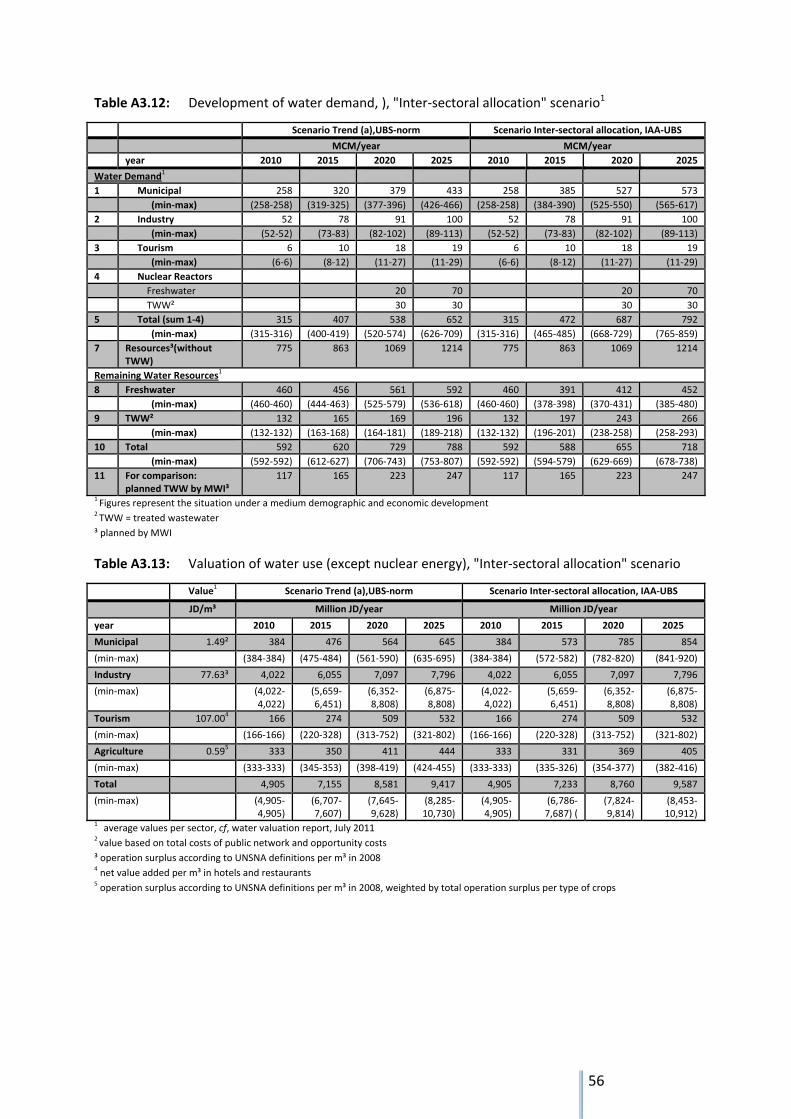
56
Table A3.12: Development of water demand, ), "Inter‐sectoral allocation" scenario1
Scenario Trend (a),UBS‐norm Scenario Inter‐sectoral allocation, IAA‐UBS
MCM/year MCM/year
year 2010 2015 2020 2025 2010 2015 2020 2025
Water Demand1
1 Municipal 258 320 379 433 258 385 527 573
(min‐max) (258‐258) (319‐325) (377‐396) (426‐466) (258‐258) (384‐390) (525‐550) (565‐617)
2 Industry 52 78 91 100 52 78 91 100
(min‐max) (52‐52) (73‐83) (82‐102) (89‐113) (52‐52) (73‐83) (82‐102) (89‐113)
3 Tourism 6 10 18 19 6 10 18 19
(min‐max) (6‐6) (8‐12) (11‐27) (11‐29) (6‐6) (8‐12) (11‐27) (11‐29)
4 Nuclear Reactors
Freshwater 20 70 20 70
TWW² 30 30 30 30
5 Total (sum 1‐4) 315 407 538 652 315 472 687 792
(min‐max) (315‐316) (400‐419) (520‐574) (626‐709) (315‐316) (465‐485) (668‐729) (765‐859)
7 Resources³(without TWW)
775 863 1069 1214 775 863 1069 1214
Remaining Water Resources1
8 Freshwater 460 456 561 592 460 391 412 452
(min‐max) (460‐460) (444‐463) (525‐579) (536‐618) (460‐460) (378‐398) (370‐431) (385‐480)
9 TWW² 132 165 169 196 132 197 243 266
(min‐max) (132‐132) (163‐168) (164‐181) (189‐218) (132‐132) (196‐201) (238‐258) (258‐293)
10 Total 592 620 729 788 592 588 655 718
(min‐max) (592‐592) (612‐627) (706‐743) (753‐807) (592‐592) (594‐579) (629‐669) (678‐738)
11 For comparison: planned TWW by MWI³
117 165 223 247 117 165 223 247
1 Figures represent the situation under a medium demographic and economic development
2 TWW = treated wastewater
³ planned by MWI
Table A3.13: Valuation of water use (except nuclear energy), "Inter‐sectoral allocation" scenario
Value1 Scenario Trend (a),UBS‐norm Scenario Inter‐sectoral allocation, IAA‐UBS
JD/m³ Million JD/year Million JD/year
year 2010 2015 2020 2025 2010 2015 2020 2025
Municipal 1.49² 384 476 564 645 384 573 785 854
(min‐max) (384‐384) (475‐484) (561‐590) (635‐695) (384‐384) (572‐582) (782‐820) (841‐920)
Industry 77.63³ 4,022 6,055 7,097 7,796 4,022 6,055 7,097 7,796
(min‐max) (4,022‐4,022)
(5,659‐6,451)
(6,352‐8,808)
(6,875‐8,808)
(4,022‐4,022)
(5,659‐6,451)
(6,352‐8,808)
(6,875‐8,808)
Tourism 107.004 166 274 509 532 166 274 509 532
(min‐max) (166‐166) (220‐328) (313‐752) (321‐802) (166‐166) (220‐328) (313‐752) (321‐802)
Agriculture 0.595 333 350 411 444 333 331 369 405
(min‐max) (333‐333) (345‐353) (398‐419) (424‐455) (333‐333) (335‐326) (354‐377) (382‐416)
Total 4,905 7,155 8,581 9,417 4,905 7,233 8,760 9,587
(min‐max) (4,905‐4,905)
(6,707‐7,607)
(7,645‐9,628)
(8,285‐10,730)
(4,905‐4,905)
(6,786‐7,687) (
(7,824‐9,814)
(8,453‐10,912)
1 average values per sector, cf, water valuation report, July 2011 2 value based on total costs of public network and opportunity costs
³ operation surplus according to UNSNA definitions per m³ in 2008 4 net value added per m³ in hotels and restaurants 5 operation surplus according to UNSNA definitions per m³ in 2008, weighted by total operation surplus per type of crops
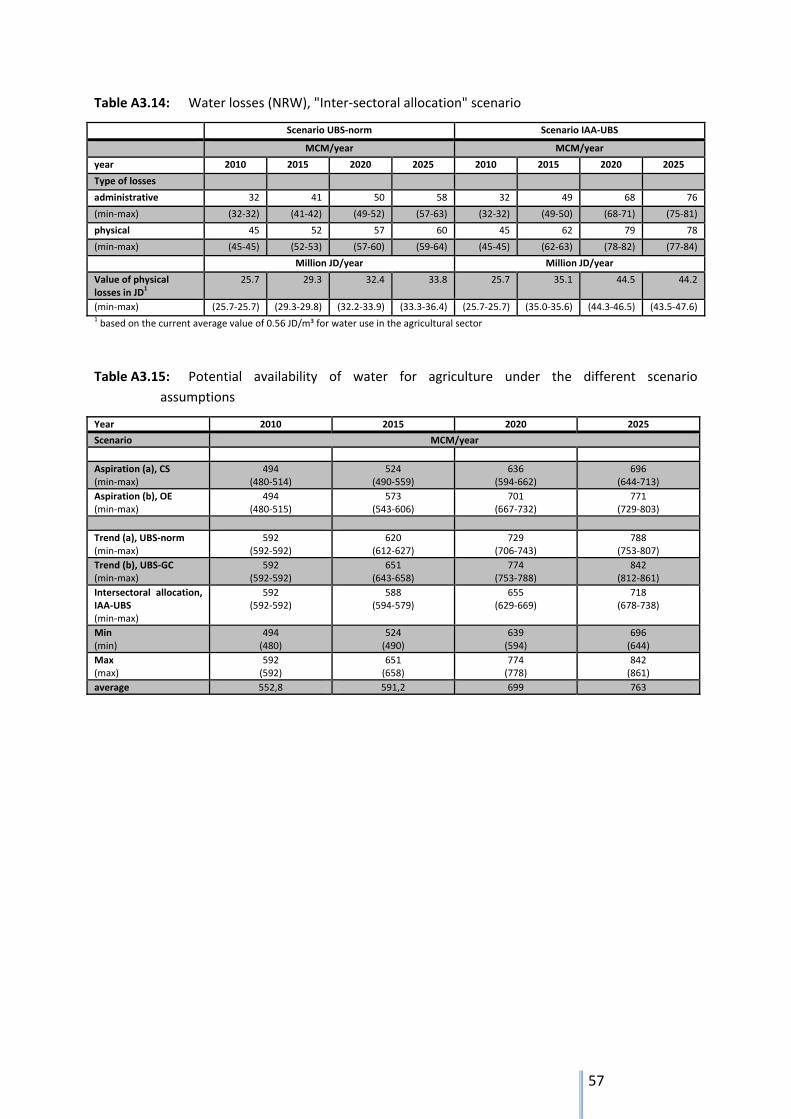
57
Table A3.14: Water losses (NRW), "Inter‐sectoral allocation" scenario
Scenario UBS‐norm Scenario IAA‐UBS
MCM/year MCM/year
year 2010 2015 2020 2025 2010 2015 2020 2025
Type of losses
administrative 32 41 50 58 32 49 68 76
(min‐max) (32‐32) (41‐42) (49‐52) (57‐63) (32‐32) (49‐50) (68‐71) (75‐81)
physical 45 52 57 60 45 62 79 78
(min‐max) (45‐45) (52‐53) (57‐60) (59‐64) (45‐45) (62‐63) (78‐82) (77‐84)
Million JD/year Million JD/year
Value of physical losses in JD
1
25.7 29.3 32.4 33.8 25.7 35.1 44.5 44.2
(min‐max) (25.7‐25.7) (29.3‐29.8) (32.2‐33.9) (33.3‐36.4) (25.7‐25.7) (35.0‐35.6) (44.3‐46.5) (43.5‐47.6)1 based on the current average value of 0.56 JD/m³ for water use in the agricultural sector
Table A3.15: Potential availability of water for agriculture under the different scenario
assumptions
Year 2010 2015 2020 2025
Scenario MCM/year
Aspiration (a), CS (min‐max)
494 (480‐514)
524(490‐559)
636(594‐662)
696 (644‐713)
Aspiration (b), OE (min‐max)
494 (480‐515)
573(543‐606)
701(667‐732)
771 (729‐803)
Trend (a), UBS‐norm (min‐max)
592 (592‐592)
620(612‐627)
729(706‐743)
788 (753‐807)
Trend (b), UBS‐GC (min‐max)
592 (592‐592)
651(643‐658)
774(753‐788)
842 (812‐861)
Intersectoral allocation, IAA‐UBS (min‐max)
592 (592‐592)
588(594‐579)
655(629‐669)
718 (678‐738)
Min (min)
494 (480)
524(490)
639(594)
696 (644)
Max (max)
592 (592)
651(658)
774(778)
842 (861)
average 552,8 591,2 699 763
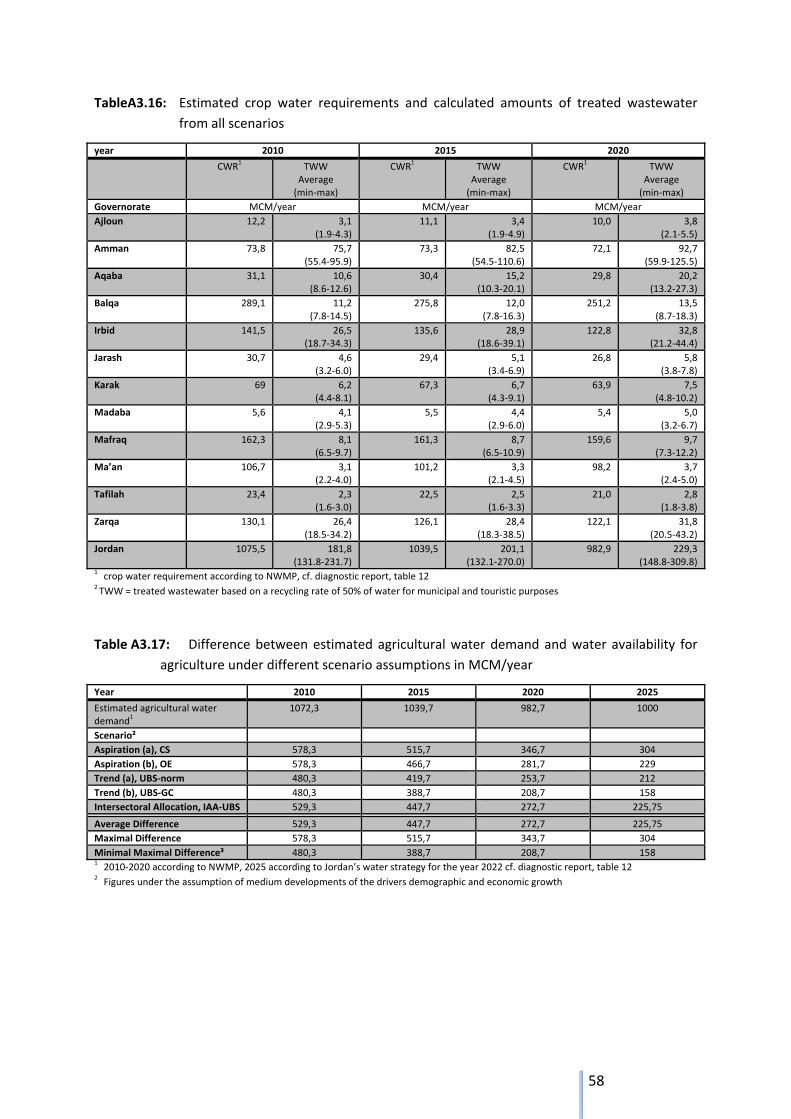
58
TableA3.16: Estimated crop water requirements and calculated amounts of treated wastewater
from all scenarios
year 2010 2015 2020
CWR1
TWWAverage (min‐max)
CWR1
TWWAverage (min‐max)
CWR1 TWW
Average (min‐max)
Governorate MCM/year MCM/year MCM/year
Ajloun 12,2 3,1(1.9‐4.3)
11,1 3,4(1.9‐4.9)
10,0 3,8(2.1‐5.5)
Amman 73,8 75,7(55.4‐95.9)
73,3 82,5(54.5‐110.6)
72,1 92,7(59.9‐125.5)
Aqaba 31,1 10,6(8.6‐12.6)
30,4 15,2(10.3‐20.1)
29,8 20,2(13.2‐27.3)
Balqa 289,1 11,2(7.8‐14.5)
275,8 12,0(7.8‐16.3)
251,2 13,5(8.7‐18.3)
Irbid 141,5 26,5(18.7‐34.3)
135,6 28,9(18.6‐39.1)
122,8 32,8(21.2‐44.4)
Jarash 30,7 4,6(3.2‐6.0)
29,4 5,1(3.4‐6.9)
26,8 5,8(3.8‐7.8)
Karak 69 6,2(4.4‐8.1)
67,3 6,7(4.3‐9.1)
63,9 7,5(4.8‐10.2)
Madaba 5,6 4,1(2.9‐5.3)
5,5 4,4(2.9‐6.0)
5,4 5,0(3.2‐6.7)
Mafraq 162,3 8,1(6.5‐9.7)
161,3 8,7(6.5‐10.9)
159,6 9,7(7.3‐12.2)
Ma’an 106,7 3,1(2.2‐4.0)
101,2 3,3(2.1‐4.5)
98,2 3,7(2.4‐5.0)
Tafilah 23,4 2,3(1.6‐3.0)
22,5 2,5(1.6‐3.3)
21,0 2,8(1.8‐3.8)
Zarqa 130,1 26,4(18.5‐34.2)
126,1 28,4(18.3‐38.5)
122,1 31,8(20.5‐43.2)
Jordan 1075,5 181,8(131.8‐231.7)
1039,5 201,1(132.1‐270.0)
982,9 229,3(148.8‐309.8)
1 crop water requirement according to NWMP, cf. diagnostic report, table 12 2 TWW = treated wastewater based on a recycling rate of 50% of water for municipal and touristic purposes
Table A3.17: Difference between estimated agricultural water demand and water availability for
agriculture under different scenario assumptions in MCM/year
Year 2010 2015 2020 2025
Estimated agricultural water demand
1
1072,3 1039,7 982,7 1000
Scenario²
Aspiration (a), CS 578,3 515,7 346,7 304
Aspiration (b), OE 578,3 466,7 281,7 229
Trend (a), UBS‐norm 480,3 419,7 253,7 212
Trend (b), UBS‐GC 480,3 388,7 208,7 158
Intersectoral Allocation, IAA‐UBS 529,3 447,7 272,7 225,75
Average Difference 529,3 447,7 272,7 225,75
Maximal Difference 578,3 515,7 343,7 304
Minimal Maximal Difference³ 480,3 388,7 208,7 1581 2010‐2020 according to NWMP, 2025 according to Jordan’s water strategy for the year 2022 cf. diagnostic report, table 12 2 Figures under the assumption of medium developments of the drivers demographic and economic growth
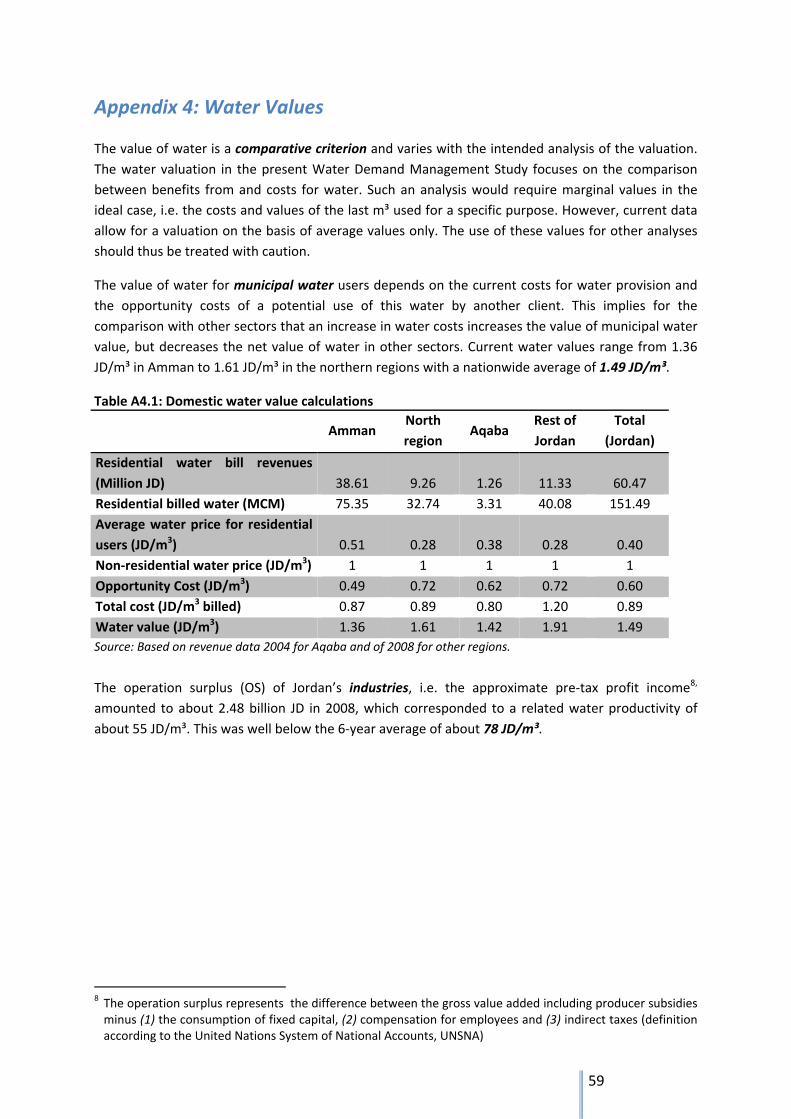
59
Appendix 4: Water Values
The value of water is a comparative criterion and varies with the intended analysis of the valuation.
The water valuation in the present Water Demand Management Study focuses on the comparison
between benefits from and costs for water. Such an analysis would require marginal values in the
ideal case, i.e. the costs and values of the last m³ used for a specific purpose. However, current data
allow for a valuation on the basis of average values only. The use of these values for other analyses
should thus be treated with caution.
The value of water for municipal water users depends on the current costs for water provision and
the opportunity costs of a potential use of this water by another client. This implies for the
comparison with other sectors that an increase in water costs increases the value of municipal water
value, but decreases the net value of water in other sectors. Current water values range from 1.36
JD/m³ in Amman to 1.61 JD/m³ in the northern regions with a nationwide average of 1.49 JD/m³.
Table A4.1: Domestic water value calculations
Amman
North
region Aqaba
Rest of
Jordan
Total
(Jordan)
Residential water bill revenues
(Million JD) 38.61 9.26 1.26 11.33 60.47
Residential billed water (MCM) 75.35 32.74 3.31 40.08 151.49
Average water price for residential
users (JD/m3) 0.51 0.28 0.38 0.28 0.40
Non‐residential water price (JD/m3) 1 1 1 1 1
Opportunity Cost (JD/m3) 0.49 0.72 0.62 0.72 0.60
Total cost (JD/m3 billed) 0.87 0.89 0.80 1.20 0.89
Water value (JD/m3) 1.36 1.61 1.42 1.91 1.49
Source: Based on revenue data 2004 for Aqaba and of 2008 for other regions.
The operation surplus (OS) of Jordan’s industries, i.e. the approximate pre‐tax profit income8,
amounted to about 2.48 billion JD in 2008, which corresponded to a related water productivity of
about 55 JD/m³. This was well below the 6‐year average of about 78 JD/m³.
8 The operation surplus represents the difference between the gross value added including producer subsidies minus (1) the consumption of fixed capital, (2) compensation for employees and (3) indirect taxes (definition according to the United Nations System of National Accounts, UNSNA)
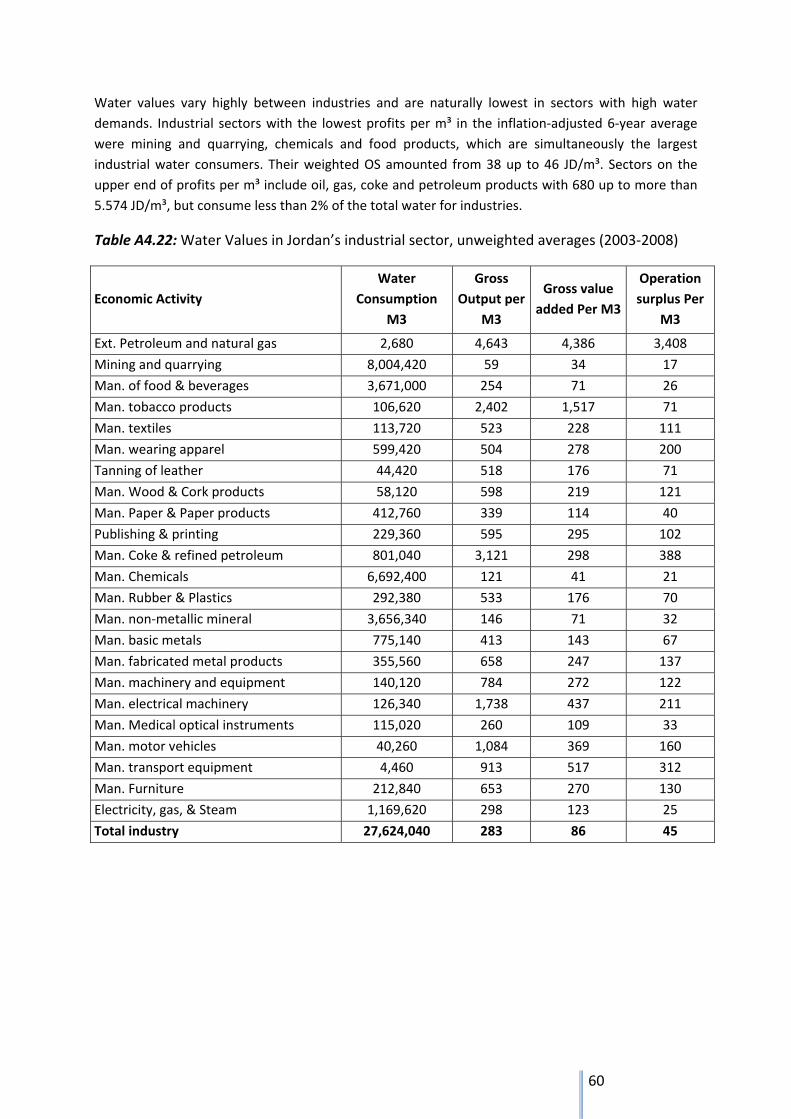
60
Water values vary highly between industries and are naturally lowest in sectors with high water
demands. Industrial sectors with the lowest profits per m³ in the inflation‐adjusted 6‐year average
were mining and quarrying, chemicals and food products, which are simultaneously the largest
industrial water consumers. Their weighted OS amounted from 38 up to 46 JD/m³. Sectors on the
upper end of profits per m³ include oil, gas, coke and petroleum products with 680 up to more than
5.574 JD/m³, but consume less than 2% of the total water for industries.
Table A4.22: Water Values in Jordan’s industrial sector, unweighted averages (2003‐2008)
Economic Activity
Water
Consumption
M3
Gross
Output per
M3
Gross value
added Per M3
Operation
surplus Per
M3
Ext. Petroleum and natural gas 2,680 4,643 4,386 3,408
Mining and quarrying 8,004,420 59 34 17
Man. of food & beverages 3,671,000 254 71 26
Man. tobacco products 106,620 2,402 1,517 71
Man. textiles 113,720 523 228 111
Man. wearing apparel 599,420 504 278 200
Tanning of leather 44,420 518 176 71
Man. Wood & Cork products 58,120 598 219 121
Man. Paper & Paper products 412,760 339 114 40
Publishing & printing 229,360 595 295 102
Man. Coke & refined petroleum 801,040 3,121 298 388
Man. Chemicals 6,692,400 121 41 21
Man. Rubber & Plastics 292,380 533 176 70
Man. non‐metallic mineral 3,656,340 146 71 32
Man. basic metals 775,140 413 143 67
Man. fabricated metal products 355,560 658 247 137
Man. machinery and equipment 140,120 784 272 122
Man. electrical machinery 126,340 1,738 437 211
Man. Medical optical instruments 115,020 260 109 33
Man. motor vehicles 40,260 1,084 369 160
Man. transport equipment 4,460 913 517 312
Man. Furniture 212,840 653 270 130
Electricity, gas, & Steam 1,169,620 298 123 25
Total industry 27,624,040 283 86 45
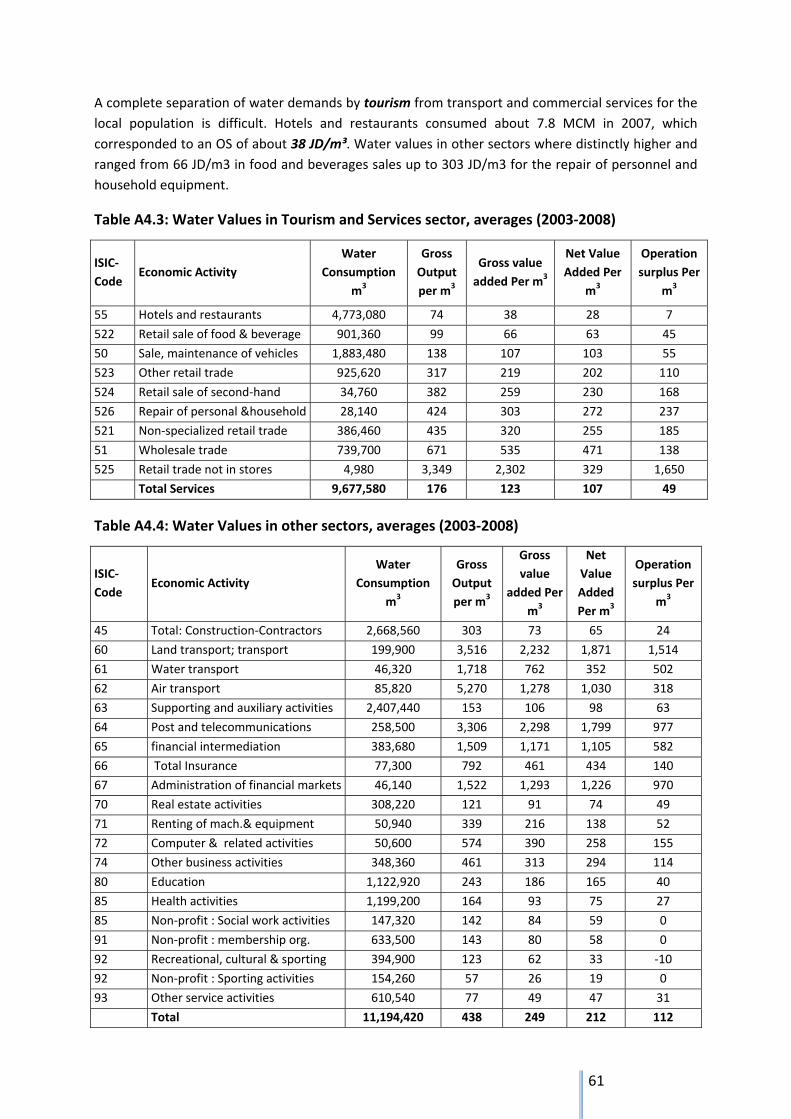
61
A complete separation of water demands by tourism from transport and commercial services for the
local population is difficult. Hotels and restaurants consumed about 7.8 MCM in 2007, which
corresponded to an OS of about 38 JD/m³. Water values in other sectors where distinctly higher and
ranged from 66 JD/m3 in food and beverages sales up to 303 JD/m3 for the repair of personnel and
household equipment.
Table A4.3: Water Values in Tourism and Services sector, averages (2003‐2008)
ISIC‐
Code Economic Activity
Water
Consumption
m3
Gross
Output
per m3
Gross value
added Per m3
Net Value
Added Per
m3
Operation
surplus Per
m3
55 Hotels and restaurants 4,773,080 74 38 28 7
522 Retail sale of food & beverage 901,360 99 66 63 45
50 Sale, maintenance of vehicles 1,883,480 138 107 103 55
523 Other retail trade 925,620 317 219 202 110
524 Retail sale of second‐hand 34,760 382 259 230 168
526 Repair of personal &household 28,140 424 303 272 237
521 Non‐specialized retail trade 386,460 435 320 255 185
51 Wholesale trade 739,700 671 535 471 138
525 Retail trade not in stores 4,980 3,349 2,302 329 1,650
Total Services 9,677,580 176 123 107 49
Table A4.4: Water Values in other sectors, averages (2003‐2008)
ISIC‐
Code Economic Activity
Water
Consumption
m3
Gross
Output
per m3
Gross
value
added Per
m3
Net
Value
Added
Per m3
Operation
surplus Per
m3
45 Total: Construction‐Contractors 2,668,560 303 73 65 24
60 Land transport; transport 199,900 3,516 2,232 1,871 1,514
61 Water transport 46,320 1,718 762 352 502
62 Air transport 85,820 5,270 1,278 1,030 318
63 Supporting and auxiliary activities 2,407,440 153 106 98 63
64 Post and telecommunications 258,500 3,306 2,298 1,799 977
65 financial intermediation 383,680 1,509 1,171 1,105 582
66 Total Insurance 77,300 792 461 434 140
67 Administration of financial markets 46,140 1,522 1,293 1,226 970
70 Real estate activities 308,220 121 91 74 49
71 Renting of mach.& equipment 50,940 339 216 138 52
72 Computer & related activities 50,600 574 390 258 155
74 Other business activities 348,360 461 313 294 114
80 Education 1,122,920 243 186 165 40
85 Health activities 1,199,200 164 93 75 27
85 Non‐profit : Social work activities 147,320 142 84 59 0
91 Non‐profit : membership org. 633,500 143 80 58 0
92 Recreational, cultural & sporting 394,900 123 62 33 ‐10
92 Non‐profit : Sporting activities 154,260 57 26 19 0
93 Other service activities 610,540 77 49 47 31
Total 11,194,420 438 249 212 112
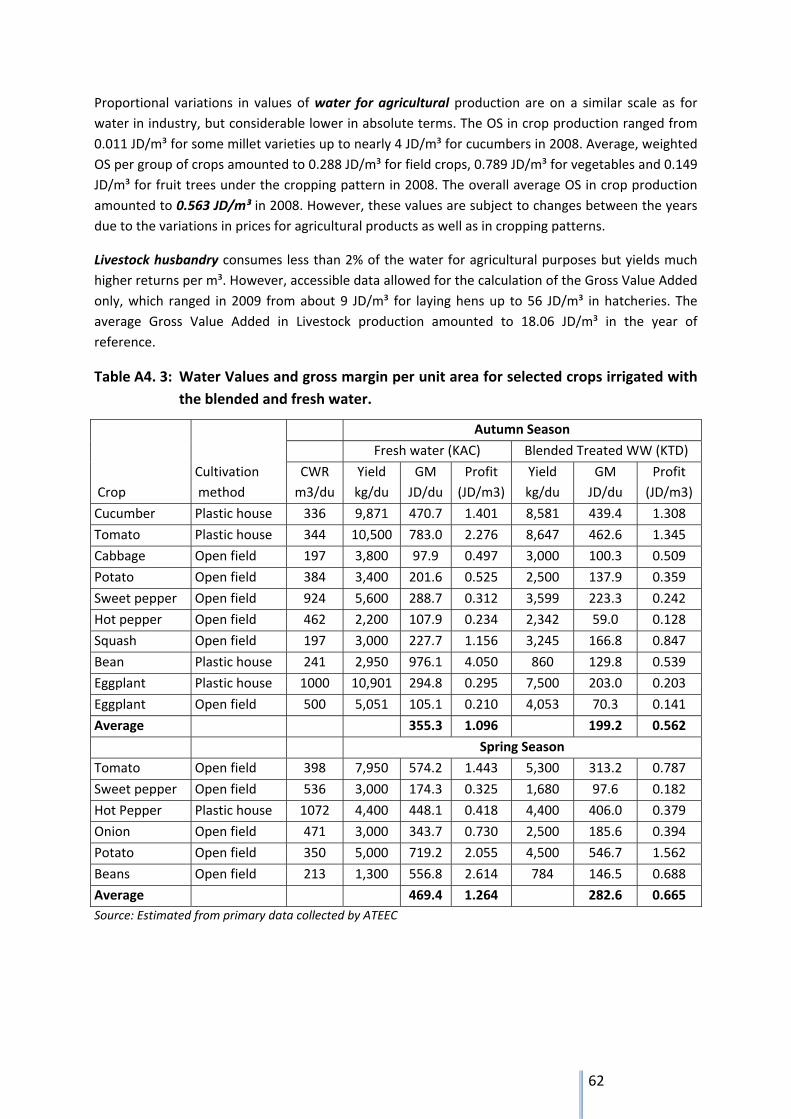
62
Proportional variations in values of water for agricultural production are on a similar scale as for
water in industry, but considerable lower in absolute terms. The OS in crop production ranged from
0.011 JD/m³ for some millet varieties up to nearly 4 JD/m³ for cucumbers in 2008. Average, weighted
OS per group of crops amounted to 0.288 JD/m³ for field crops, 0.789 JD/m³ for vegetables and 0.149
JD/m³ for fruit trees under the cropping pattern in 2008. The overall average OS in crop production
amounted to 0.563 JD/m³ in 2008. However, these values are subject to changes between the years
due to the variations in prices for agricultural products as well as in cropping patterns.
Livestock husbandry consumes less than 2% of the water for agricultural purposes but yields much
higher returns per m³. However, accessible data allowed for the calculation of the Gross Value Added
only, which ranged in 2009 from about 9 JD/m³ for laying hens up to 56 JD/m³ in hatcheries. The
average Gross Value Added in Livestock production amounted to 18.06 JD/m³ in the year of
reference.
Table A4. 3: Water Values and gross margin per unit area for selected crops irrigated with
the blended and fresh water.
Crop
Cultivation
method
Autumn Season
Fresh water (KAC) Blended Treated WW (KTD)
CWR
m3/du
Yield
kg/du
GM
JD/du
Profit
(JD/m3)
Yield
kg/du
GM
JD/du
Profit
(JD/m3)
Cucumber Plastic house 336 9,871 470.7 1.401 8,581 439.4 1.308
Tomato Plastic house 344 10,500 783.0 2.276 8,647 462.6 1.345
Cabbage Open field 197 3,800 97.9 0.497 3,000 100.3 0.509
Potato Open field 384 3,400 201.6 0.525 2,500 137.9 0.359
Sweet pepper Open field 924 5,600 288.7 0.312 3,599 223.3 0.242
Hot pepper Open field 462 2,200 107.9 0.234 2,342 59.0 0.128
Squash Open field 197 3,000 227.7 1.156 3,245 166.8 0.847
Bean Plastic house 241 2,950 976.1 4.050 860 129.8 0.539
Eggplant Plastic house 1000 10,901 294.8 0.295 7,500 203.0 0.203
Eggplant Open field 500 5,051 105.1 0.210 4,053 70.3 0.141
Average 355.3 1.096 199.2 0.562
Spring Season
Tomato Open field 398 7,950 574.2 1.443 5,300 313.2 0.787
Sweet pepper Open field 536 3,000 174.3 0.325 1,680 97.6 0.182
Hot Pepper Plastic house 1072 4,400 448.1 0.418 4,400 406.0 0.379
Onion Open field 471 3,000 343.7 0.730 2,500 185.6 0.394
Potato Open field 350 5,000 719.2 2.055 4,500 546.7 1.562
Beans Open field 213 1,300 556.8 2.614 784 146.5 0.688
Average 469.4 1.264 282.6 0.665
Source: Estimated from primary data collected by ATEEC
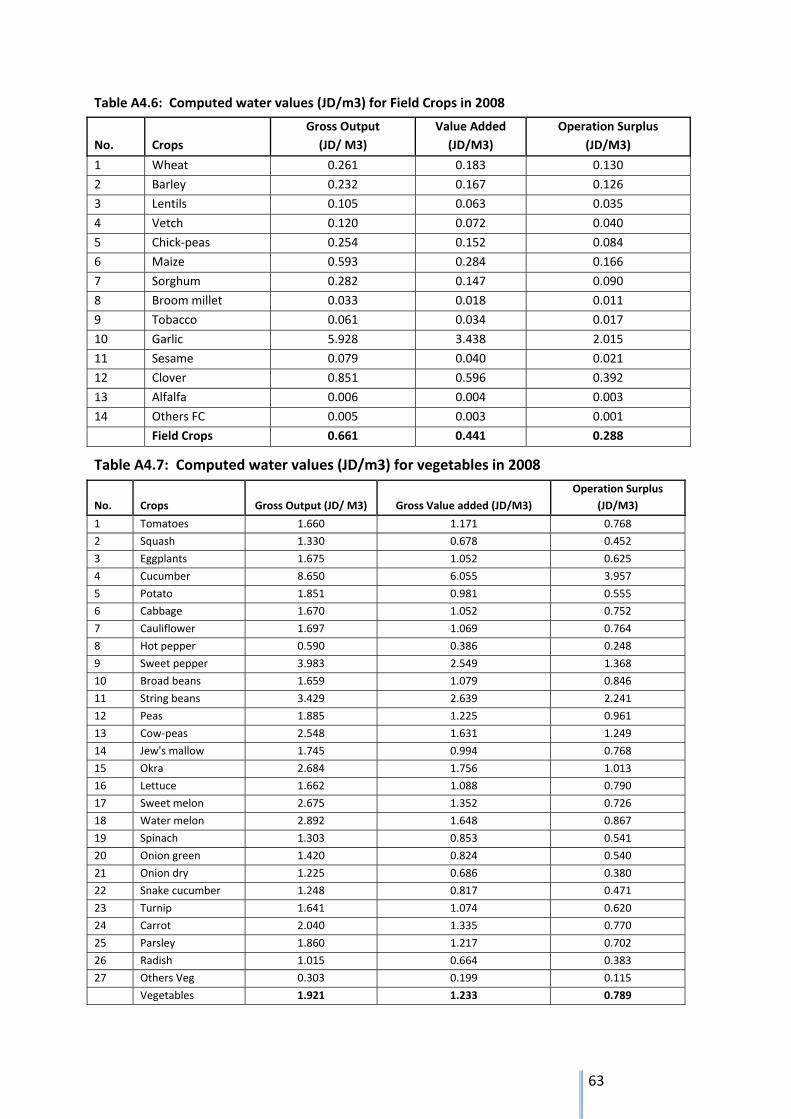
63
Table A4.6: Computed water values (JD/m3) for Field Crops in 2008
No. Crops
Gross Output
(JD/ M3)
Value Added
(JD/M3)
Operation Surplus
(JD/M3)
1 Wheat 0.261 0.183 0.130
2 Barley 0.232 0.167 0.126
3 Lentils 0.105 0.063 0.035
4 Vetch 0.120 0.072 0.040
5 Chick‐peas 0.254 0.152 0.084
6 Maize 0.593 0.284 0.166
7 Sorghum 0.282 0.147 0.090
8 Broom millet 0.033 0.018 0.011
9 Tobacco 0.061 0.034 0.017
10 Garlic 5.928 3.438 2.015
11 Sesame 0.079 0.040 0.021
12 Clover 0.851 0.596 0.392
13 Alfalfa 0.006 0.004 0.003
14 Others FC 0.005 0.003 0.001
Field Crops 0.661 0.441 0.288
Table A4.7: Computed water values (JD/m3) for vegetables in 2008
No. Crops Gross Output (JD/ M3) Gross Value added (JD/M3)
Operation Surplus
(JD/M3)
1 Tomatoes 1.660 1.171 0.768
2 Squash 1.330 0.678 0.452
3 Eggplants 1.675 1.052 0.625
4 Cucumber 8.650 6.055 3.957
5 Potato 1.851 0.981 0.555
6 Cabbage 1.670 1.052 0.752
7 Cauliflower 1.697 1.069 0.764
8 Hot pepper 0.590 0.386 0.248
9 Sweet pepper 3.983 2.549 1.368
10 Broad beans 1.659 1.079 0.846
11 String beans 3.429 2.639 2.241
12 Peas 1.885 1.225 0.961
13 Cow‐peas 2.548 1.631 1.249
14 Jew's mallow 1.745 0.994 0.768
15 Okra 2.684 1.756 1.013
16 Lettuce 1.662 1.088 0.790
17 Sweet melon 2.675 1.352 0.726
18 Water melon 2.892 1.648 0.867
19 Spinach 1.303 0.853 0.541
20 Onion green 1.420 0.824 0.540
21 Onion dry 1.225 0.686 0.380
22 Snake cucumber 1.248 0.817 0.471
23 Turnip 1.641 1.074 0.620
24 Carrot 2.040 1.335 0.770
25 Parsley 1.860 1.217 0.702
26 Radish 1.015 0.664 0.383
27 Others Veg 0.303 0.199 0.115
Vegetables 1.921 1.233 0.789
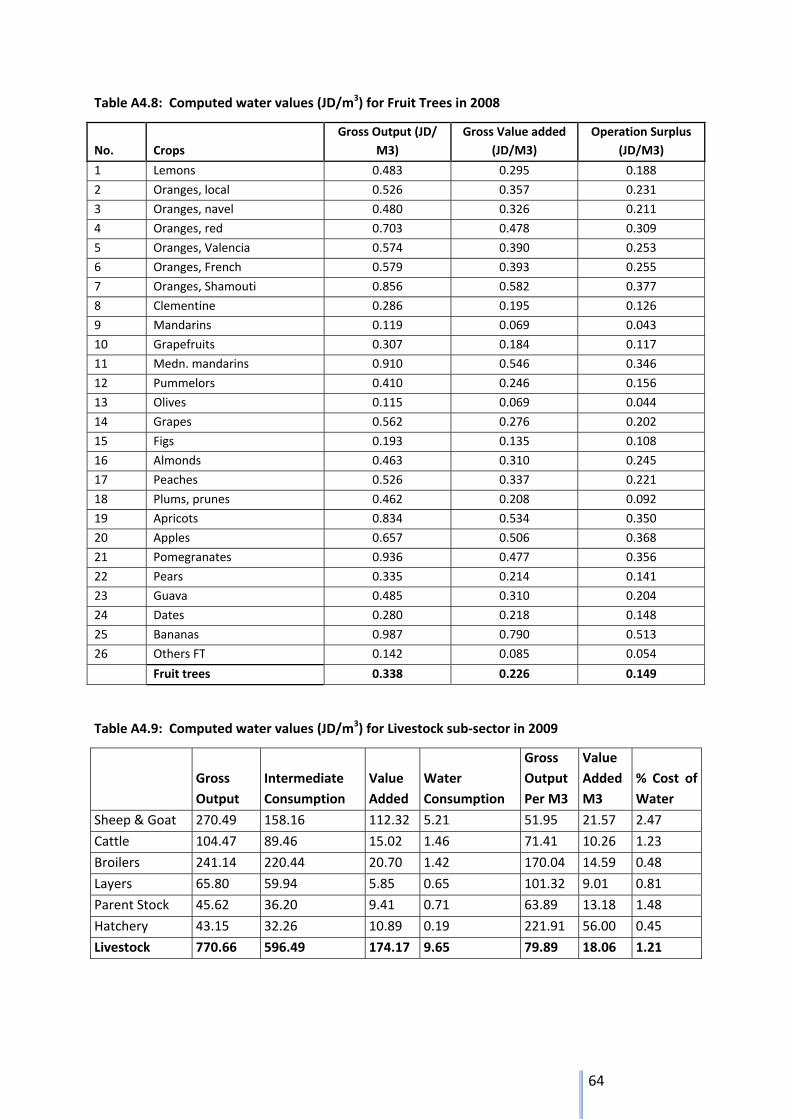
64
Table A4.8: Computed water values (JD/m3) for Fruit Trees in 2008
No. Crops
Gross Output (JD/
M3)
Gross Value added
(JD/M3)
Operation Surplus
(JD/M3)
1 Lemons 0.483 0.295 0.188
2 Oranges, local 0.526 0.357 0.231
3 Oranges, navel 0.480 0.326 0.211
4 Oranges, red 0.703 0.478 0.309
5 Oranges, Valencia 0.574 0.390 0.253
6 Oranges, French 0.579 0.393 0.255
7 Oranges, Shamouti 0.856 0.582 0.377
8 Clementine 0.286 0.195 0.126
9 Mandarins 0.119 0.069 0.043
10 Grapefruits 0.307 0.184 0.117
11 Medn. mandarins 0.910 0.546 0.346
12 Pummelors 0.410 0.246 0.156
13 Olives 0.115 0.069 0.044
14 Grapes 0.562 0.276 0.202
15 Figs 0.193 0.135 0.108
16 Almonds 0.463 0.310 0.245
17 Peaches 0.526 0.337 0.221
18 Plums, prunes 0.462 0.208 0.092
19 Apricots 0.834 0.534 0.350
20 Apples 0.657 0.506 0.368
21 Pomegranates 0.936 0.477 0.356
22 Pears 0.335 0.214 0.141
23 Guava 0.485 0.310 0.204
24 Dates 0.280 0.218 0.148
25 Bananas 0.987 0.790 0.513
26 Others FT 0.142 0.085 0.054
Fruit trees 0.338 0.226 0.149
Table A4.9: Computed water values (JD/m3) for Livestock sub‐sector in 2009
Gross
Output
Intermediate
Consumption
Value
Added
Water
Consumption
Gross
Output
Per M3
Value
Added
M3
% Cost of
Water
Sheep & Goat 270.49 158.16 112.32 5.21 51.95 21.57 2.47
Cattle 104.47 89.46 15.02 1.46 71.41 10.26 1.23
Broilers 241.14 220.44 20.70 1.42 170.04 14.59 0.48
Layers 65.80 59.94 5.85 0.65 101.32 9.01 0.81
Parent Stock 45.62 36.20 9.41 0.71 63.89 13.18 1.48
Hatchery 43.15 32.26 10.89 0.19 221.91 56.00 0.45
Livestock 770.66 596.49 174.17 9.65 79.89 18.06 1.21
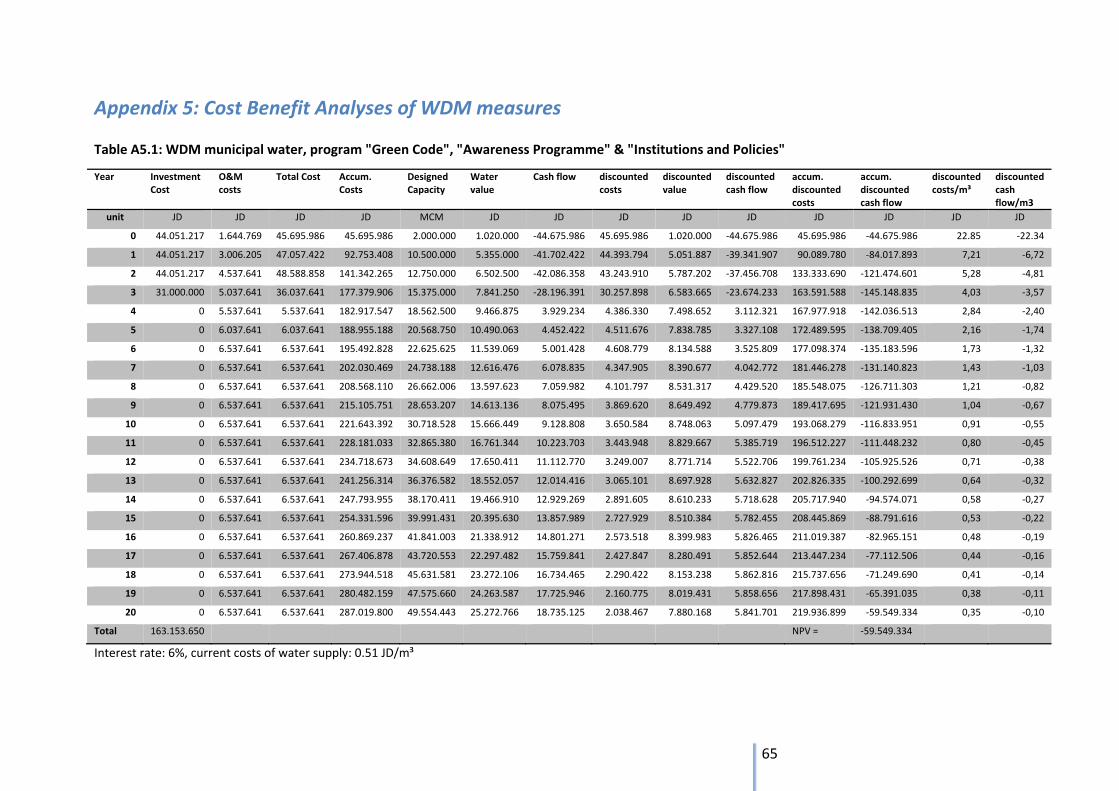
65
Appendix 5: Cost Benefit Analyses of WDM measures
Table A5.1: WDM municipal water, program "Green Code", "Awareness Programme" & "Institutions and Policies"
Year Investment Cost
O&M costs
Total Cost Accum. Costs
Designed Capacity
Water value
Cash flow discounted costs
discounted value
discounted cash flow
accum. discounted costs
accum. discounted cash flow
discounted costs/m³
discounted cash flow/m3
unit JD JD JD JD MCM JD JD JD JD JD JD JD JD JD
0 44.051.217 1.644.769 45.695.986 45.695.986 2.000.000 1.020.000 ‐44.675.986 45.695.986 1.020.000 ‐44.675.986 45.695.986 ‐44.675.986 22.85 ‐22.34
1 44.051.217 3.006.205 47.057.422 92.753.408 10.500.000 5.355.000 ‐41.702.422 44.393.794 5.051.887 ‐39.341.907 90.089.780 ‐84.017.893 7,21 ‐6,72
2 44.051.217 4.537.641 48.588.858 141.342.265 12.750.000 6.502.500 ‐42.086.358 43.243.910 5.787.202 ‐37.456.708 133.333.690 ‐121.474.601 5,28 ‐4,81
3 31.000.000 5.037.641 36.037.641 177.379.906 15.375.000 7.841.250 ‐28.196.391 30.257.898 6.583.665 ‐23.674.233 163.591.588 ‐145.148.835 4,03 ‐3,57
4 0 5.537.641 5.537.641 182.917.547 18.562.500 9.466.875 3.929.234 4.386.330 7.498.652 3.112.321 167.977.918 ‐142.036.513 2,84 ‐2,40
5 0 6.037.641 6.037.641 188.955.188 20.568.750 10.490.063 4.452.422 4.511.676 7.838.785 3.327.108 172.489.595 ‐138.709.405 2,16 ‐1,74
6 0 6.537.641 6.537.641 195.492.828 22.625.625 11.539.069 5.001.428 4.608.779 8.134.588 3.525.809 177.098.374 ‐135.183.596 1,73 ‐1,32
7 0 6.537.641 6.537.641 202.030.469 24.738.188 12.616.476 6.078.835 4.347.905 8.390.677 4.042.772 181.446.278 ‐131.140.823 1,43 ‐1,03
8 0 6.537.641 6.537.641 208.568.110 26.662.006 13.597.623 7.059.982 4.101.797 8.531.317 4.429.520 185.548.075 ‐126.711.303 1,21 ‐0,82
9 0 6.537.641 6.537.641 215.105.751 28.653.207 14.613.136 8.075.495 3.869.620 8.649.492 4.779.873 189.417.695 ‐121.931.430 1,04 ‐0,67
10 0 6.537.641 6.537.641 221.643.392 30.718.528 15.666.449 9.128.808 3.650.584 8.748.063 5.097.479 193.068.279 ‐116.833.951 0,91 ‐0,55
11 0 6.537.641 6.537.641 228.181.033 32.865.380 16.761.344 10.223.703 3.443.948 8.829.667 5.385.719 196.512.227 ‐111.448.232 0,80 ‐0,45
12 0 6.537.641 6.537.641 234.718.673 34.608.649 17.650.411 11.112.770 3.249.007 8.771.714 5.522.706 199.761.234 ‐105.925.526 0,71 ‐0,38
13 0 6.537.641 6.537.641 241.256.314 36.376.582 18.552.057 12.014.416 3.065.101 8.697.928 5.632.827 202.826.335 ‐100.292.699 0,64 ‐0,32
14 0 6.537.641 6.537.641 247.793.955 38.170.411 19.466.910 12.929.269 2.891.605 8.610.233 5.718.628 205.717.940 ‐94.574.071 0,58 ‐0,27
15 0 6.537.641 6.537.641 254.331.596 39.991.431 20.395.630 13.857.989 2.727.929 8.510.384 5.782.455 208.445.869 ‐88.791.616 0,53 ‐0,22
16 0 6.537.641 6.537.641 260.869.237 41.841.003 21.338.912 14.801.271 2.573.518 8.399.983 5.826.465 211.019.387 ‐82.965.151 0,48 ‐0,19
17 0 6.537.641 6.537.641 267.406.878 43.720.553 22.297.482 15.759.841 2.427.847 8.280.491 5.852.644 213.447.234 ‐77.112.506 0,44 ‐0,16
18 0 6.537.641 6.537.641 273.944.518 45.631.581 23.272.106 16.734.465 2.290.422 8.153.238 5.862.816 215.737.656 ‐71.249.690 0,41 ‐0,14
19 0 6.537.641 6.537.641 280.482.159 47.575.660 24.263.587 17.725.946 2.160.775 8.019.431 5.858.656 217.898.431 ‐65.391.035 0,38 ‐0,11
20 0 6.537.641 6.537.641 287.019.800 49.554.443 25.272.766 18.735.125 2.038.467 7.880.168 5.841.701 219.936.899 ‐59.549.334 0,35 ‐0,10
Total 163.153.650 NPV = ‐59.549.334
Interest rate: 6%, current costs of water supply: 0.51 JD/m³
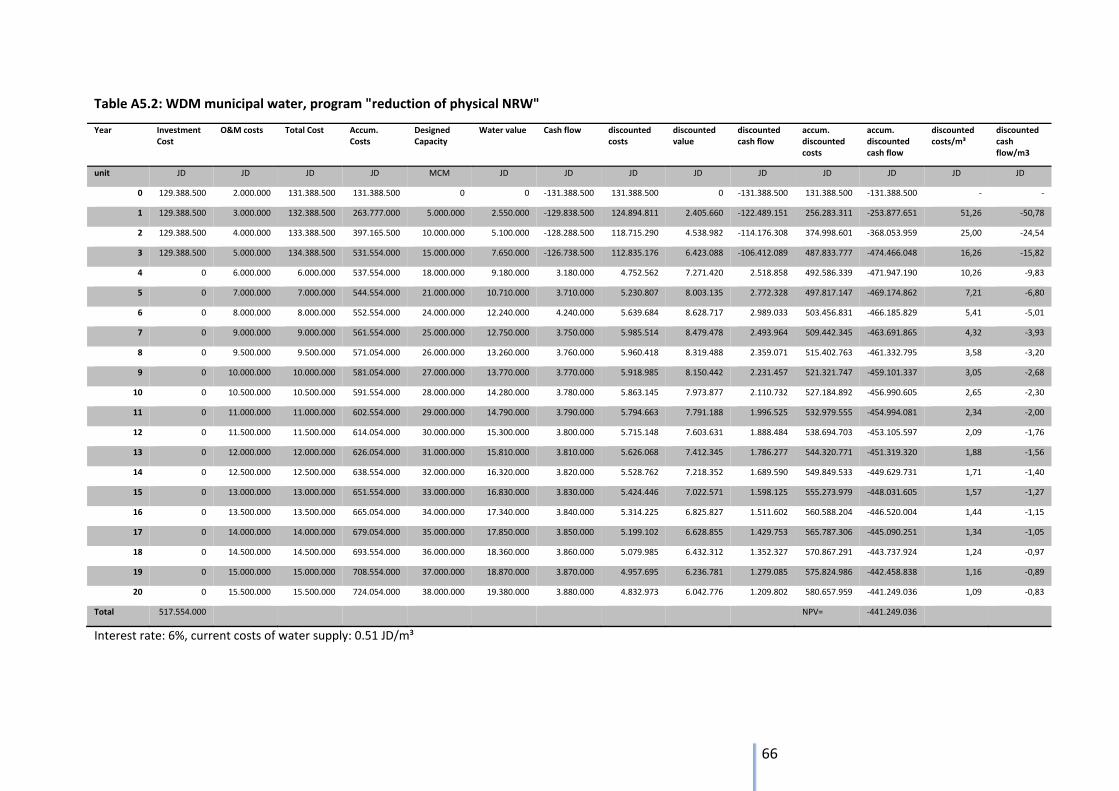
66
Table A5.2: WDM municipal water, program "reduction of physical NRW"
Year Investment Cost
O&M costs Total Cost Accum. Costs
Designed Capacity
Water value Cash flow discounted costs
discounted value
discounted cash flow
accum. discounted costs
accum. discounted cash flow
discounted costs/m³
discounted cash flow/m3
unit JD JD JD JD MCM JD JD JD JD JD JD JD JD JD
0 129.388.500 2.000.000 131.388.500 131.388.500 0 0 ‐131.388.500 131.388.500 0 ‐131.388.500 131.388.500 ‐131.388.500 ‐ ‐
1 129.388.500 3.000.000 132.388.500 263.777.000 5.000.000 2.550.000 ‐129.838.500 124.894.811 2.405.660 ‐122.489.151 256.283.311 ‐253.877.651 51,26 ‐50,78
2 129.388.500 4.000.000 133.388.500 397.165.500 10.000.000 5.100.000 ‐128.288.500 118.715.290 4.538.982 ‐114.176.308 374.998.601 ‐368.053.959 25,00 ‐24,54
3 129.388.500 5.000.000 134.388.500 531.554.000 15.000.000 7.650.000 ‐126.738.500 112.835.176 6.423.088 ‐106.412.089 487.833.777 ‐474.466.048 16,26 ‐15,82
4 0 6.000.000 6.000.000 537.554.000 18.000.000 9.180.000 3.180.000 4.752.562 7.271.420 2.518.858 492.586.339 ‐471.947.190 10,26 ‐9,83
5 0 7.000.000 7.000.000 544.554.000 21.000.000 10.710.000 3.710.000 5.230.807 8.003.135 2.772.328 497.817.147 ‐469.174.862 7,21 ‐6,80
6 0 8.000.000 8.000.000 552.554.000 24.000.000 12.240.000 4.240.000 5.639.684 8.628.717 2.989.033 503.456.831 ‐466.185.829 5,41 ‐5,01
7 0 9.000.000 9.000.000 561.554.000 25.000.000 12.750.000 3.750.000 5.985.514 8.479.478 2.493.964 509.442.345 ‐463.691.865 4,32 ‐3,93
8 0 9.500.000 9.500.000 571.054.000 26.000.000 13.260.000 3.760.000 5.960.418 8.319.488 2.359.071 515.402.763 ‐461.332.795 3,58 ‐3,20
9 0 10.000.000 10.000.000 581.054.000 27.000.000 13.770.000 3.770.000 5.918.985 8.150.442 2.231.457 521.321.747 ‐459.101.337 3,05 ‐2,68
10 0 10.500.000 10.500.000 591.554.000 28.000.000 14.280.000 3.780.000 5.863.145 7.973.877 2.110.732 527.184.892 ‐456.990.605 2,65 ‐2,30
11 0 11.000.000 11.000.000 602.554.000 29.000.000 14.790.000 3.790.000 5.794.663 7.791.188 1.996.525 532.979.555 ‐454.994.081 2,34 ‐2,00
12 0 11.500.000 11.500.000 614.054.000 30.000.000 15.300.000 3.800.000 5.715.148 7.603.631 1.888.484 538.694.703 ‐453.105.597 2,09 ‐1,76
13 0 12.000.000 12.000.000 626.054.000 31.000.000 15.810.000 3.810.000 5.626.068 7.412.345 1.786.277 544.320.771 ‐451.319.320 1,88 ‐1,56
14 0 12.500.000 12.500.000 638.554.000 32.000.000 16.320.000 3.820.000 5.528.762 7.218.352 1.689.590 549.849.533 ‐449.629.731 1,71 ‐1,40
15 0 13.000.000 13.000.000 651.554.000 33.000.000 16.830.000 3.830.000 5.424.446 7.022.571 1.598.125 555.273.979 ‐448.031.605 1,57 ‐1,27
16 0 13.500.000 13.500.000 665.054.000 34.000.000 17.340.000 3.840.000 5.314.225 6.825.827 1.511.602 560.588.204 ‐446.520.004 1,44 ‐1,15
17 0 14.000.000 14.000.000 679.054.000 35.000.000 17.850.000 3.850.000 5.199.102 6.628.855 1.429.753 565.787.306 ‐445.090.251 1,34 ‐1,05
18 0 14.500.000 14.500.000 693.554.000 36.000.000 18.360.000 3.860.000 5.079.985 6.432.312 1.352.327 570.867.291 ‐443.737.924 1,24 ‐0,97
19 0 15.000.000 15.000.000 708.554.000 37.000.000 18.870.000 3.870.000 4.957.695 6.236.781 1.279.085 575.824.986 ‐442.458.838 1,16 ‐0,89
20 0 15.500.000 15.500.000 724.054.000 38.000.000 19.380.000 3.880.000 4.832.973 6.042.776 1.209.802 580.657.959 ‐441.249.036 1,09 ‐0,83
Total 517.554.000 NPV= ‐441.249.036
Interest rate: 6%, current costs of water supply: 0.51 JD/m³
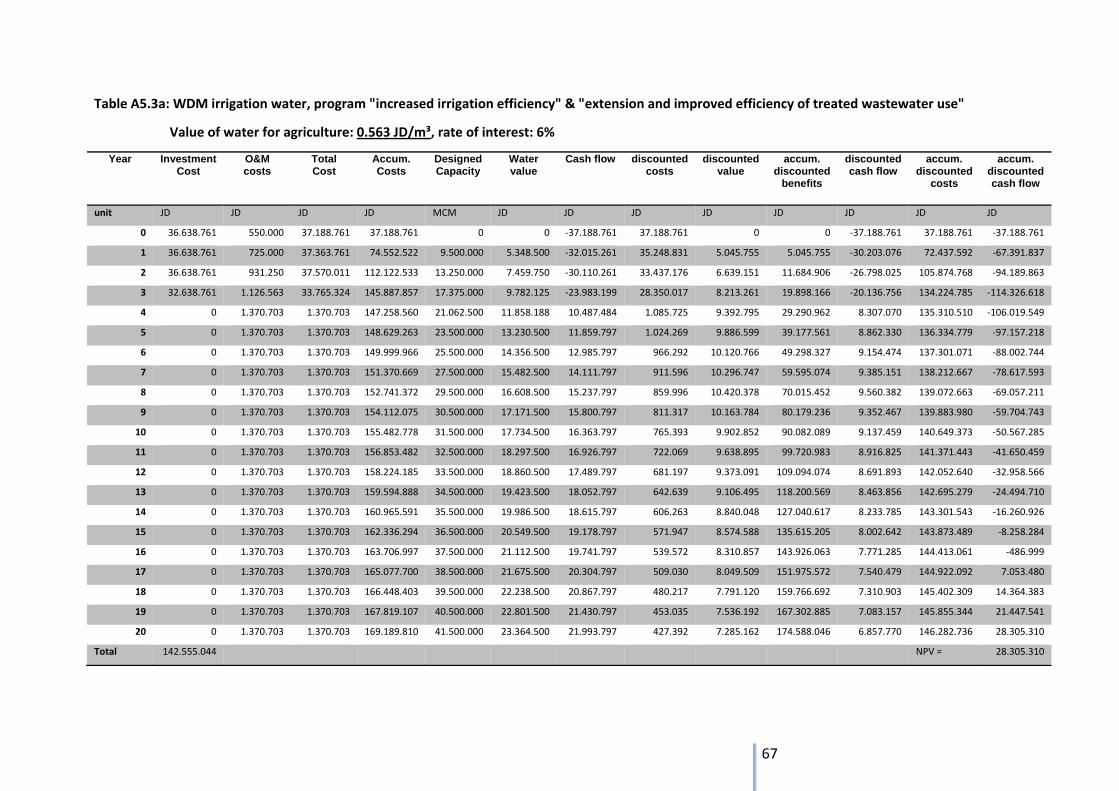
67
Table A5.3a: WDM irrigation water, program "increased irrigation efficiency" & "extension and improved efficiency of treated wastewater use"
Value of water for agriculture: 0.563 JD/m³, rate of interest: 6%
Year Investment Cost
O&M costs
Total Cost
Accum. Costs
Designed Capacity
Water value
Cash flow discounted costs
discounted value
accum. discounted
benefits
discounted cash flow
accum. discounted
costs
accum. discounted cash flow
unit JD JD JD JD MCM JD JD JD JD JD JD JD JD
0 36.638.761 550.000 37.188.761 37.188.761 0 0 ‐37.188.761 37.188.761 0 0 ‐37.188.761 37.188.761 ‐37.188.761
1 36.638.761 725.000 37.363.761 74.552.522 9.500.000 5.348.500 ‐32.015.261 35.248.831 5.045.755 5.045.755 ‐30.203.076 72.437.592 ‐67.391.837
2 36.638.761 931.250 37.570.011 112.122.533 13.250.000 7.459.750 ‐30.110.261 33.437.176 6.639.151 11.684.906 ‐26.798.025 105.874.768 ‐94.189.863
3 32.638.761 1.126.563 33.765.324 145.887.857 17.375.000 9.782.125 ‐23.983.199 28.350.017 8.213.261 19.898.166 ‐20.136.756 134.224.785 ‐114.326.618
4 0 1.370.703 1.370.703 147.258.560 21.062.500 11.858.188 10.487.484 1.085.725 9.392.795 29.290.962 8.307.070 135.310.510 ‐106.019.549
5 0 1.370.703 1.370.703 148.629.263 23.500.000 13.230.500 11.859.797 1.024.269 9.886.599 39.177.561 8.862.330 136.334.779 ‐97.157.218
6 0 1.370.703 1.370.703 149.999.966 25.500.000 14.356.500 12.985.797 966.292 10.120.766 49.298.327 9.154.474 137.301.071 ‐88.002.744
7 0 1.370.703 1.370.703 151.370.669 27.500.000 15.482.500 14.111.797 911.596 10.296.747 59.595.074 9.385.151 138.212.667 ‐78.617.593
8 0 1.370.703 1.370.703 152.741.372 29.500.000 16.608.500 15.237.797 859.996 10.420.378 70.015.452 9.560.382 139.072.663 ‐69.057.211
9 0 1.370.703 1.370.703 154.112.075 30.500.000 17.171.500 15.800.797 811.317 10.163.784 80.179.236 9.352.467 139.883.980 ‐59.704.743
10 0 1.370.703 1.370.703 155.482.778 31.500.000 17.734.500 16.363.797 765.393 9.902.852 90.082.089 9.137.459 140.649.373 ‐50.567.285
11 0 1.370.703 1.370.703 156.853.482 32.500.000 18.297.500 16.926.797 722.069 9.638.895 99.720.983 8.916.825 141.371.443 ‐41.650.459
12 0 1.370.703 1.370.703 158.224.185 33.500.000 18.860.500 17.489.797 681.197 9.373.091 109.094.074 8.691.893 142.052.640 ‐32.958.566
13 0 1.370.703 1.370.703 159.594.888 34.500.000 19.423.500 18.052.797 642.639 9.106.495 118.200.569 8.463.856 142.695.279 ‐24.494.710
14 0 1.370.703 1.370.703 160.965.591 35.500.000 19.986.500 18.615.797 606.263 8.840.048 127.040.617 8.233.785 143.301.543 ‐16.260.926
15 0 1.370.703 1.370.703 162.336.294 36.500.000 20.549.500 19.178.797 571.947 8.574.588 135.615.205 8.002.642 143.873.489 ‐8.258.284
16 0 1.370.703 1.370.703 163.706.997 37.500.000 21.112.500 19.741.797 539.572 8.310.857 143.926.063 7.771.285 144.413.061 ‐486.999
17 0 1.370.703 1.370.703 165.077.700 38.500.000 21.675.500 20.304.797 509.030 8.049.509 151.975.572 7.540.479 144.922.092 7.053.480
18 0 1.370.703 1.370.703 166.448.403 39.500.000 22.238.500 20.867.797 480.217 7.791.120 159.766.692 7.310.903 145.402.309 14.364.383
19 0 1.370.703 1.370.703 167.819.107 40.500.000 22.801.500 21.430.797 453.035 7.536.192 167.302.885 7.083.157 145.855.344 21.447.541
20 0 1.370.703 1.370.703 169.189.810 41.500.000 23.364.500 21.993.797 427.392 7.285.162 174.588.046 6.857.770 146.282.736 28.305.310
Total 142.555.044 NPV = 28.305.310

68
Table A5.3b: WDM irrigation water, program "increased irrigation efficiency" & "extension and improved efficiency of treated wastewater use"
Value of water for agriculture: 0.789 JD/m³, rate of interest: 6%
Year Investment Cost
O&M costs
Total Cost
Accum. Costs
Designed Capacity
Water value
Cash flow discounted costs
discounted value
accum. discounted
benefits
discounted cash flow
accum. discounted
costs
accum. discounted cash flow
unit JD JD JD JD MCM JD JD JD JD JD JD JD JD
0 36.638.761 550.000 37.188.761 37.188.761 0 0 ‐37.188.761 37.188.761 0 0 ‐37.188.761 37.188.761 ‐37.188.761
1 36.638.761 725.000 37.363.761 74.552.522 9.500.000 7.495.500 ‐29.868.261 35.248.831 7.071.226 7.071.226 ‐28.177.605 72.437.592 ‐65.366.366
2 36.638.761 931.250 37.570.011 112.122.533 13.250.000 10.454.250 ‐27.115.761 33.437.176 9.304.245 16.375.472 ‐24.132.931 105.874.768 ‐89.499.296
3 32.638.761 1.126.563 33.765.324 145.887.857 17.375.000 13.708.875 ‐20.056.449 28.350.017 11.510.236 27.885.707 ‐16.839.781 134.224.785 ‐106.339.077
4 0 1.370.703 1.370.703 147.258.560 21.062.500 16.618.313 15.247.609 1.085.725 13.163.260 41.048.968 12.077.535 135.310.510 ‐94.261.543
5 0 1.370.703 1.370.703 148.629.263 23.500.000 18.541.500 17.170.797 1.024.269 13.855.287 54.904.255 12.831.018 136.334.779 ‐81.430.524
6 0 1.370.703 1.370.703 149.999.966 25.500.000 20.119.500 18.748.797 966.292 14.183.454 69.087.709 13.217.162 137.301.071 ‐68.213.362
7 0 1.370.703 1.370.703 151.370.669 27.500.000 21.697.500 20.326.797 911.596 14.430.077 83.517.785 13.518.481 138.212.667 ‐54.694.881
8 0 1.370.703 1.370.703 152.741.372 29.500.000 23.275.500 21.904.797 859.996 14.603.337 98.121.122 13.743.341 139.072.663 ‐40.951.541
9 0 1.370.703 1.370.703 154.112.075 30.500.000 24.064.500 22.693.797 811.317 14.243.741 112.364.862 13.432.424 139.883.980 ‐27.519.117
10 0 1.370.703 1.370.703 155.482.778 31.500.000 24.853.500 23.482.797 765.393 13.878.065 126.242.927 13.112.671 140.649.373 ‐14.406.446
11 0 1.370.703 1.370.703 156.853.482 32.500.000 25.642.500 24.271.797 722.069 13.508.149 139.751.076 12.786.080 141.371.443 ‐1.620.366
12 0 1.370.703 1.370.703 158.224.185 33.500.000 26.431.500 25.060.797 681.197 13.135.646 152.886.722 12.454.448 142.052.640 10.834.082
13 0 1.370.703 1.370.703 159.594.888 34.500.000 27.220.500 25.849.797 642.639 12.762.033 165.648.755 12.119.393 142.695.279 22.953.475
14 0 1.370.703 1.370.703 160.965.591 35.500.000 28.009.500 26.638.797 606.263 12.388.629 178.037.383 11.782.366 143.301.543 34.735.841
15 0 1.370.703 1.370.703 162.336.294 36.500.000 28.798.500 27.427.797 571.947 12.016.608 190.053.991 11.444.661 143.873.489 46.180.502
16 0 1.370.703 1.370.703 163.706.997 37.500.000 29.587.500 28.216.797 539.572 11.647.009 201.701.001 11.107.437 144.413.061 57.287.939
17 0 1.370.703 1.370.703 165.077.700 38.500.000 30.376.500 29.005.797 509.030 11.280.751 212.981.752 10.771.721 144.922.092 68.059.660
18 0 1.370.703 1.370.703 166.448.403 39.500.000 31.165.500 29.794.797 480.217 10.918.639 223.900.391 10.438.422 145.402.309 78.498.082
19 0 1.370.703 1.370.703 167.819.107 40.500.000 31.954.500 30.583.797 453.035 10.561.378 234.461.769 10.108.343 145.855.344 88.606.425
20 0 1.370.703 1.370.703 169.189.810 41.500.000 32.743.500 31.372.797 427.392 10.209.578 244.671.347 9.782.186 146.282.736 98.388.611
Total 142.555.044 NPV = 98.388.611
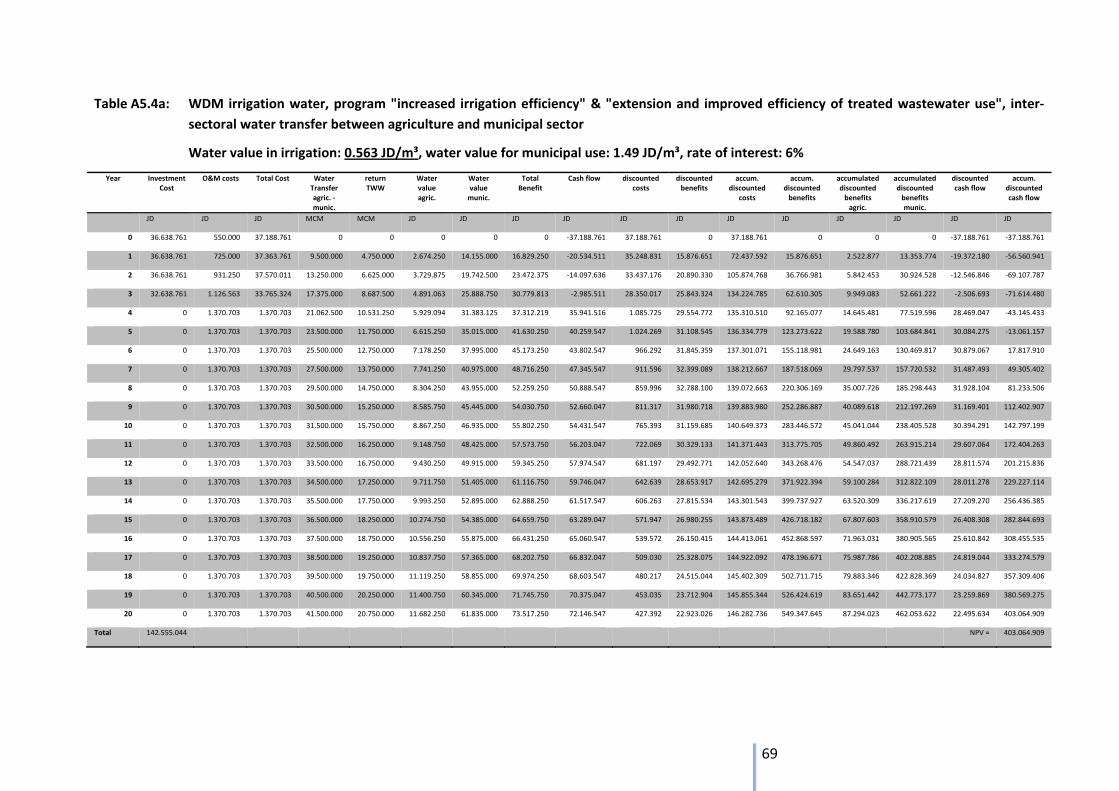
69
Table A5.4a: WDM irrigation water, program "increased irrigation efficiency" & "extension and improved efficiency of treated wastewater use", inter‐
sectoral water transfer between agriculture and municipal sector
Water value in irrigation: 0.563 JD/m³, water value for municipal use: 1.49 JD/m³, rate of interest: 6%
Year Investment Cost
O&M costs Total Cost Water Transfer agric. ‐ munic.
return TWW
Water value agric.
Water value munic.
Total Benefit
Cash flow discounted costs
discounted benefits
accum. discounted
costs
accum. discounted benefits
accumulated discounted benefits agric.
accumulated discounted benefits munic.
discounted cash flow
accum. discounted cash flow
JD JD JD MCM MCM JD JD JD JD JD JD JD JD JD JD JD JD
0 36.638.761 550.000 37.188.761 0 0 0 0 0 ‐37.188.761 37.188.761 0 37.188.761 0 0 0 ‐37.188.761 ‐37.188.761
1 36.638.761 725.000 37.363.761 9.500.000 4.750.000 2.674.250 14.155.000 16.829.250 ‐20.534.511 35.248.831 15.876.651 72.437.592 15.876.651 2.522.877 13.353.774 ‐19.372.180 ‐56.560.941
2 36.638.761 931.250 37.570.011 13.250.000 6.625.000 3.729.875 19.742.500 23.472.375 ‐14.097.636 33.437.176 20.890.330 105.874.768 36.766.981 5.842.453 30.924.528 ‐12.546.846 ‐69.107.787
3 32.638.761 1.126.563 33.765.324 17.375.000 8.687.500 4.891.063 25.888.750 30.779.813 ‐2.985.511 28.350.017 25.843.324 134.224.785 62.610.305 9.949.083 52.661.222 ‐2.506.693 ‐71.614.480
4 0 1.370.703 1.370.703 21.062.500 10.531.250 5.929.094 31.383.125 37.312.219 35.941.516 1.085.725 29.554.772 135.310.510 92.165.077 14.645.481 77.519.596 28.469.047 ‐43.145.433
5 0 1.370.703 1.370.703 23.500.000 11.750.000 6.615.250 35.015.000 41.630.250 40.259.547 1.024.269 31.108.545 136.334.779 123.273.622 19.588.780 103.684.841 30.084.275 ‐13.061.157
6 0 1.370.703 1.370.703 25.500.000 12.750.000 7.178.250 37.995.000 45.173.250 43.802.547 966.292 31.845.359 137.301.071 155.118.981 24.649.163 130.469.817 30.879.067 17.817.910
7 0 1.370.703 1.370.703 27.500.000 13.750.000 7.741.250 40.975.000 48.716.250 47.345.547 911.596 32.399.089 138.212.667 187.518.069 29.797.537 157.720.532 31.487.493 49.305.402
8 0 1.370.703 1.370.703 29.500.000 14.750.000 8.304.250 43.955.000 52.259.250 50.888.547 859.996 32.788.100 139.072.663 220.306.169 35.007.726 185.298.443 31.928.104 81.233.506
9 0 1.370.703 1.370.703 30.500.000 15.250.000 8.585.750 45.445.000 54.030.750 52.660.047 811.317 31.980.718 139.883.980 252.286.887 40.089.618 212.197.269 31.169.401 112.402.907
10 0 1.370.703 1.370.703 31.500.000 15.750.000 8.867.250 46.935.000 55.802.250 54.431.547 765.393 31.159.685 140.649.373 283.446.572 45.041.044 238.405.528 30.394.291 142.797.199
11 0 1.370.703 1.370.703 32.500.000 16.250.000 9.148.750 48.425.000 57.573.750 56.203.047 722.069 30.329.133 141.371.443 313.775.705 49.860.492 263.915.214 29.607.064 172.404.263
12 0 1.370.703 1.370.703 33.500.000 16.750.000 9.430.250 49.915.000 59.345.250 57.974.547 681.197 29.492.771 142.052.640 343.268.476 54.547.037 288.721.439 28.811.574 201.215.836
13 0 1.370.703 1.370.703 34.500.000 17.250.000 9.711.750 51.405.000 61.116.750 59.746.047 642.639 28.653.917 142.695.279 371.922.394 59.100.284 312.822.109 28.011.278 229.227.114
14 0 1.370.703 1.370.703 35.500.000 17.750.000 9.993.250 52.895.000 62.888.250 61.517.547 606.263 27.815.534 143.301.543 399.737.927 63.520.309 336.217.619 27.209.270 256.436.385
15 0 1.370.703 1.370.703 36.500.000 18.250.000 10.274.750 54.385.000 64.659.750 63.289.047 571.947 26.980.255 143.873.489 426.718.182 67.807.603 358.910.579 26.408.308 282.844.693
16 0 1.370.703 1.370.703 37.500.000 18.750.000 10.556.250 55.875.000 66.431.250 65.060.547 539.572 26.150.415 144.413.061 452.868.597 71.963.031 380.905.565 25.610.842 308.455.535
17 0 1.370.703 1.370.703 38.500.000 19.250.000 10.837.750 57.365.000 68.202.750 66.832.047 509.030 25.328.075 144.922.092 478.196.671 75.987.786 402.208.885 24.819.044 333.274.579
18 0 1.370.703 1.370.703 39.500.000 19.750.000 11.119.250 58.855.000 69.974.250 68.603.547 480.217 24.515.044 145.402.309 502.711.715 79.883.346 422.828.369 24.034.827 357.309.406
19 0 1.370.703 1.370.703 40.500.000 20.250.000 11.400.750 60.345.000 71.745.750 70.375.047 453.035 23.712.904 145.855.344 526.424.619 83.651.442 442.773.177 23.259.869 380.569.275
20 0 1.370.703 1.370.703 41.500.000 20.750.000 11.682.250 61.835.000 73.517.250 72.146.547 427.392 22.923.026 146.282.736 549.347.645 87.294.023 462.053.622 22.495.634 403.064.909
Total 142.555.044 NPV = 403.064.909
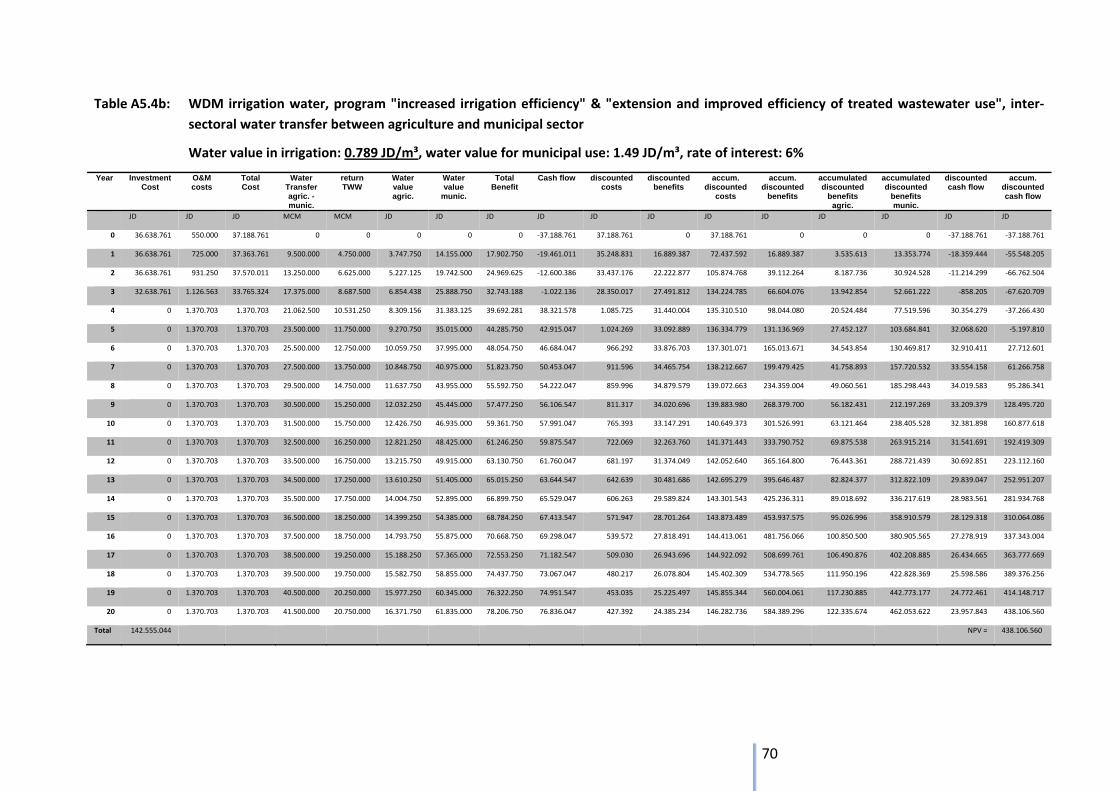
70
Table A5.4b: WDM irrigation water, program "increased irrigation efficiency" & "extension and improved efficiency of treated wastewater use", inter‐
sectoral water transfer between agriculture and municipal sector
Water value in irrigation: 0.789 JD/m³, water value for municipal use: 1.49 JD/m³, rate of interest: 6%
Year Investment Cost
O&M costs
Total Cost
Water Transfer agric. - munic.
return TWW
Water value agric.
Water value
munic.
Total Benefit
Cash flow discounted costs
discounted benefits
accum. discounted
costs
accum. discounted
benefits
accumulated discounted
benefits agric.
accumulated discounted
benefits munic.
discounted cash flow
accum. discounted cash flow
JD JD JD MCM MCM JD JD JD JD JD JD JD JD JD JD JD JD
0 36.638.761 550.000 37.188.761 0 0 0 0 0 ‐37.188.761 37.188.761 0 37.188.761 0 0 0 ‐37.188.761 ‐37.188.761
1 36.638.761 725.000 37.363.761 9.500.000 4.750.000 3.747.750 14.155.000 17.902.750 ‐19.461.011 35.248.831 16.889.387 72.437.592 16.889.387 3.535.613 13.353.774 ‐18.359.444 ‐55.548.205
2 36.638.761 931.250 37.570.011 13.250.000 6.625.000 5.227.125 19.742.500 24.969.625 ‐12.600.386 33.437.176 22.222.877 105.874.768 39.112.264 8.187.736 30.924.528 ‐11.214.299 ‐66.762.504
3 32.638.761 1.126.563 33.765.324 17.375.000 8.687.500 6.854.438 25.888.750 32.743.188 ‐1.022.136 28.350.017 27.491.812 134.224.785 66.604.076 13.942.854 52.661.222 ‐858.205 ‐67.620.709
4 0 1.370.703 1.370.703 21.062.500 10.531.250 8.309.156 31.383.125 39.692.281 38.321.578 1.085.725 31.440.004 135.310.510 98.044.080 20.524.484 77.519.596 30.354.279 ‐37.266.430
5 0 1.370.703 1.370.703 23.500.000 11.750.000 9.270.750 35.015.000 44.285.750 42.915.047 1.024.269 33.092.889 136.334.779 131.136.969 27.452.127 103.684.841 32.068.620 ‐5.197.810
6 0 1.370.703 1.370.703 25.500.000 12.750.000 10.059.750 37.995.000 48.054.750 46.684.047 966.292 33.876.703 137.301.071 165.013.671 34.543.854 130.469.817 32.910.411 27.712.601
7 0 1.370.703 1.370.703 27.500.000 13.750.000 10.848.750 40.975.000 51.823.750 50.453.047 911.596 34.465.754 138.212.667 199.479.425 41.758.893 157.720.532 33.554.158 61.266.758
8 0 1.370.703 1.370.703 29.500.000 14.750.000 11.637.750 43.955.000 55.592.750 54.222.047 859.996 34.879.579 139.072.663 234.359.004 49.060.561 185.298.443 34.019.583 95.286.341
9 0 1.370.703 1.370.703 30.500.000 15.250.000 12.032.250 45.445.000 57.477.250 56.106.547 811.317 34.020.696 139.883.980 268.379.700 56.182.431 212.197.269 33.209.379 128.495.720
10 0 1.370.703 1.370.703 31.500.000 15.750.000 12.426.750 46.935.000 59.361.750 57.991.047 765.393 33.147.291 140.649.373 301.526.991 63.121.464 238.405.528 32.381.898 160.877.618
11 0 1.370.703 1.370.703 32.500.000 16.250.000 12.821.250 48.425.000 61.246.250 59.875.547 722.069 32.263.760 141.371.443 333.790.752 69.875.538 263.915.214 31.541.691 192.419.309
12 0 1.370.703 1.370.703 33.500.000 16.750.000 13.215.750 49.915.000 63.130.750 61.760.047 681.197 31.374.049 142.052.640 365.164.800 76.443.361 288.721.439 30.692.851 223.112.160
13 0 1.370.703 1.370.703 34.500.000 17.250.000 13.610.250 51.405.000 65.015.250 63.644.547 642.639 30.481.686 142.695.279 395.646.487 82.824.377 312.822.109 29.839.047 252.951.207
14 0 1.370.703 1.370.703 35.500.000 17.750.000 14.004.750 52.895.000 66.899.750 65.529.047 606.263 29.589.824 143.301.543 425.236.311 89.018.692 336.217.619 28.983.561 281.934.768
15 0 1.370.703 1.370.703 36.500.000 18.250.000 14.399.250 54.385.000 68.784.250 67.413.547 571.947 28.701.264 143.873.489 453.937.575 95.026.996 358.910.579 28.129.318 310.064.086
16 0 1.370.703 1.370.703 37.500.000 18.750.000 14.793.750 55.875.000 70.668.750 69.298.047 539.572 27.818.491 144.413.061 481.756.066 100.850.500 380.905.565 27.278.919 337.343.004
17 0 1.370.703 1.370.703 38.500.000 19.250.000 15.188.250 57.365.000 72.553.250 71.182.547 509.030 26.943.696 144.922.092 508.699.761 106.490.876 402.208.885 26.434.665 363.777.669
18 0 1.370.703 1.370.703 39.500.000 19.750.000 15.582.750 58.855.000 74.437.750 73.067.047 480.217 26.078.804 145.402.309 534.778.565 111.950.196 422.828.369 25.598.586 389.376.256
19 0 1.370.703 1.370.703 40.500.000 20.250.000 15.977.250 60.345.000 76.322.250 74.951.547 453.035 25.225.497 145.855.344 560.004.061 117.230.885 442.773.177 24.772.461 414.148.717
20 0 1.370.703 1.370.703 41.500.000 20.750.000 16.371.750 61.835.000 78.206.750 76.836.047 427.392 24.385.234 146.282.736 584.389.296 122.335.674 462.053.622 23.957.843 438.106.560
Total 142.555.044 NPV = 438.106.560
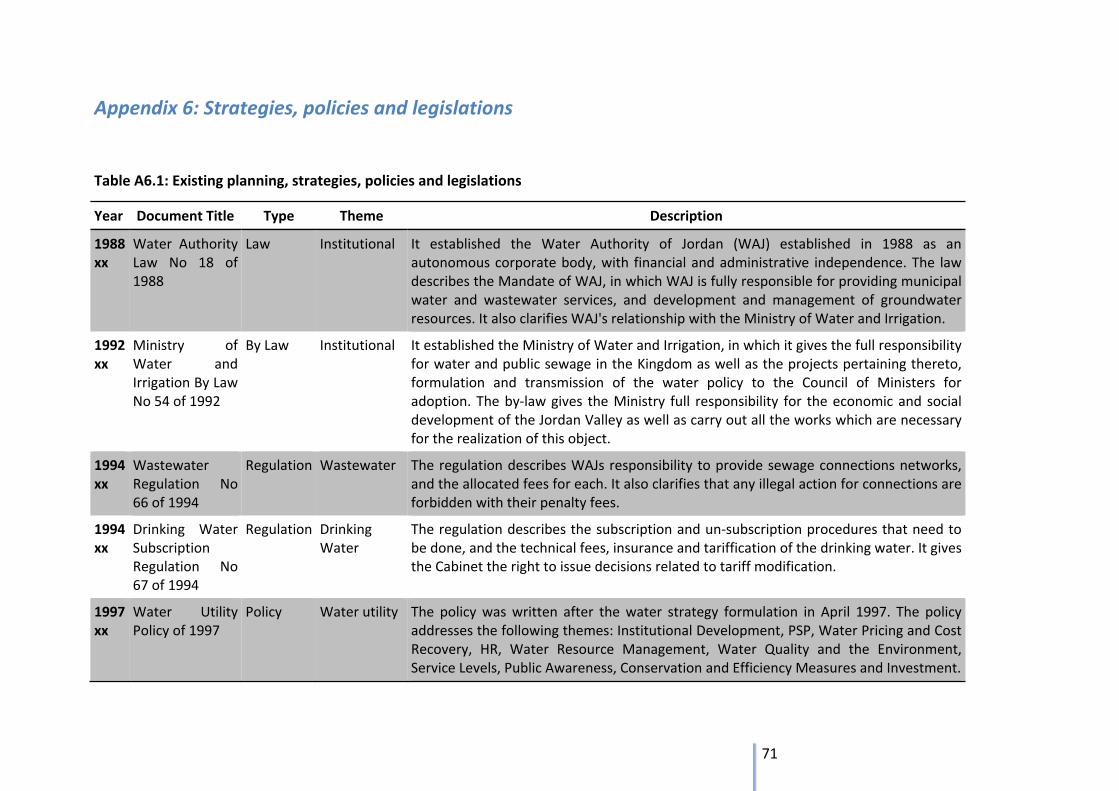
71
Appendix 6: Strategies, policies and legislations
Table A6.1: Existing planning, strategies, policies and legislations
Year Document Title Type Theme Description
1988 xx
Water Authority Law No 18 of 1988
Law Institutional It established the Water Authority of Jordan (WAJ) established in 1988 as an autonomous corporate body, with financial and administrative independence. The law describes the Mandate of WAJ, in which WAJ is fully responsible for providing municipal water and wastewater services, and development and management of groundwater resources. It also clarifies WAJ's relationship with the Ministry of Water and Irrigation.
1992 xx
Ministry of Water and Irrigation By Law No 54 of 1992
By Law Institutional It established the Ministry of Water and Irrigation, in which it gives the full responsibility for water and public sewage in the Kingdom as well as the projects pertaining thereto, formulation and transmission of the water policy to the Council of Ministers for adoption. The by‐law gives the Ministry full responsibility for the economic and social development of the Jordan Valley as well as carry out all the works which are necessary for the realization of this object.
1994 xx
Wastewater Regulation No 66 of 1994
Regulation Wastewater The regulation describes WAJs responsibility to provide sewage connections networks, and the allocated fees for each. It also clarifies that any illegal action for connections are forbidden with their penalty fees.
1994 xx
Drinking Water Subscription Regulation No 67 of 1994
Regulation Drinking Water
The regulation describes the subscription and un‐subscription procedures that need to be done, and the technical fees, insurance and tariffication of the drinking water. It gives the Cabinet the right to issue decisions related to tariff modification.
1997 xx
Water Utility Policy of 1997
Policy Water utility The policy was written after the water strategy formulation in April 1997. The policy addresses the following themes: Institutional Development, PSP, Water Pricing and Cost Recovery, HR, Water Resource Management, Water Quality and the Environment, Service Levels, Public Awareness, Conservation and Efficiency Measures and Investment.
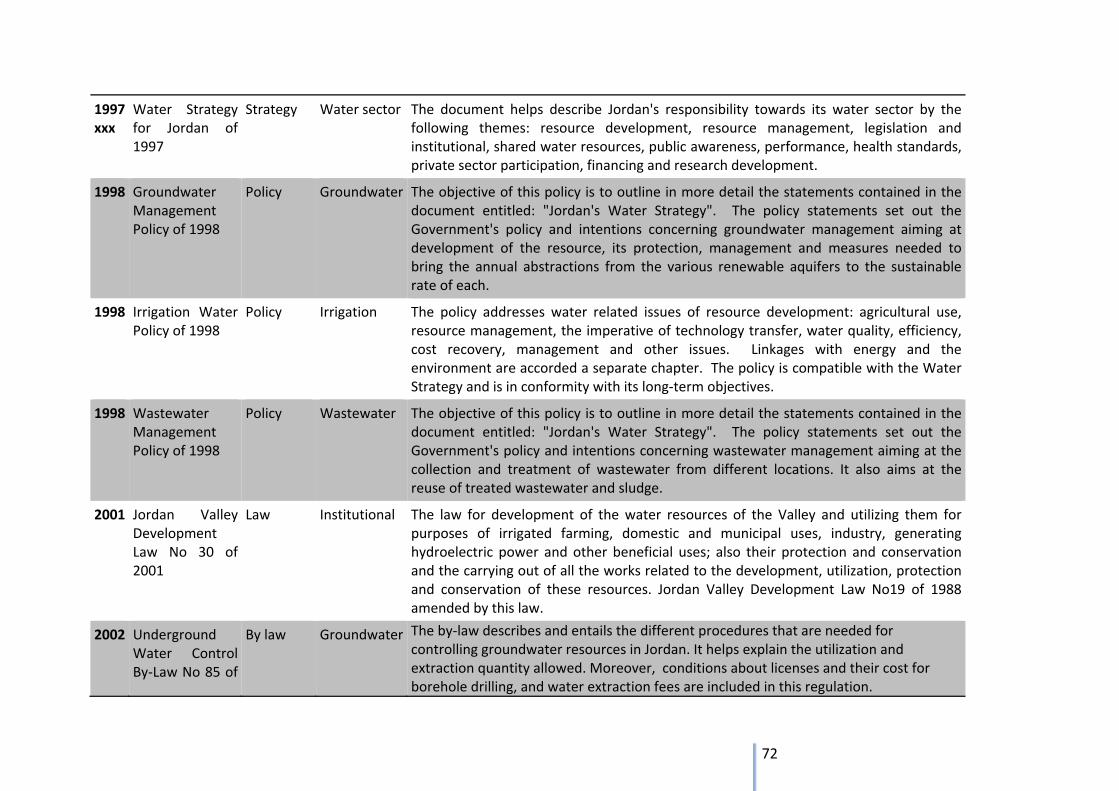
72
1997 xxx
Water Strategy for Jordan of 1997
Strategy Water sector The document helps describe Jordan's responsibility towards its water sector by the following themes: resource development, resource management, legislation and institutional, shared water resources, public awareness, performance, health standards, private sector participation, financing and research development.
1998 Groundwater Management Policy of 1998
Policy Groundwater The objective of this policy is to outline in more detail the statements contained in the document entitled: "Jordan's Water Strategy". The policy statements set out the Government's policy and intentions concerning groundwater management aiming at development of the resource, its protection, management and measures needed to bring the annual abstractions from the various renewable aquifers to the sustainable rate of each.
1998 Irrigation Water Policy of 1998
Policy Irrigation The policy addresses water related issues of resource development: agricultural use, resource management, the imperative of technology transfer, water quality, efficiency, cost recovery, management and other issues. Linkages with energy and the environment are accorded a separate chapter. The policy is compatible with the Water Strategy and is in conformity with its long‐term objectives.
1998 Wastewater Management Policy of 1998
Policy Wastewater The objective of this policy is to outline in more detail the statements contained in the document entitled: "Jordan's Water Strategy". The policy statements set out the Government's policy and intentions concerning wastewater management aiming at the collection and treatment of wastewater from different locations. It also aims at the reuse of treated wastewater and sludge.
2001 Jordan Valley Development Law No 30 of 2001
Law Institutional The law for development of the water resources of the Valley and utilizing them for purposes of irrigated farming, domestic and municipal uses, industry, generating hydroelectric power and other beneficial uses; also their protection and conservation and the carrying out of all the works related to the development, utilization, protection and conservation of these resources. Jordan Valley Development Law No19 of 1988 amended by this law.
2002 Underground Water Control By‐Law No 85 of
By law Groundwater The by‐law describes and entails the different procedures that are needed for controlling groundwater resources in Jordan. It helps explain the utilization and extraction quantity allowed. Moreover, conditions about licenses and their cost for borehole drilling, and water extraction fees are included in this regulation.
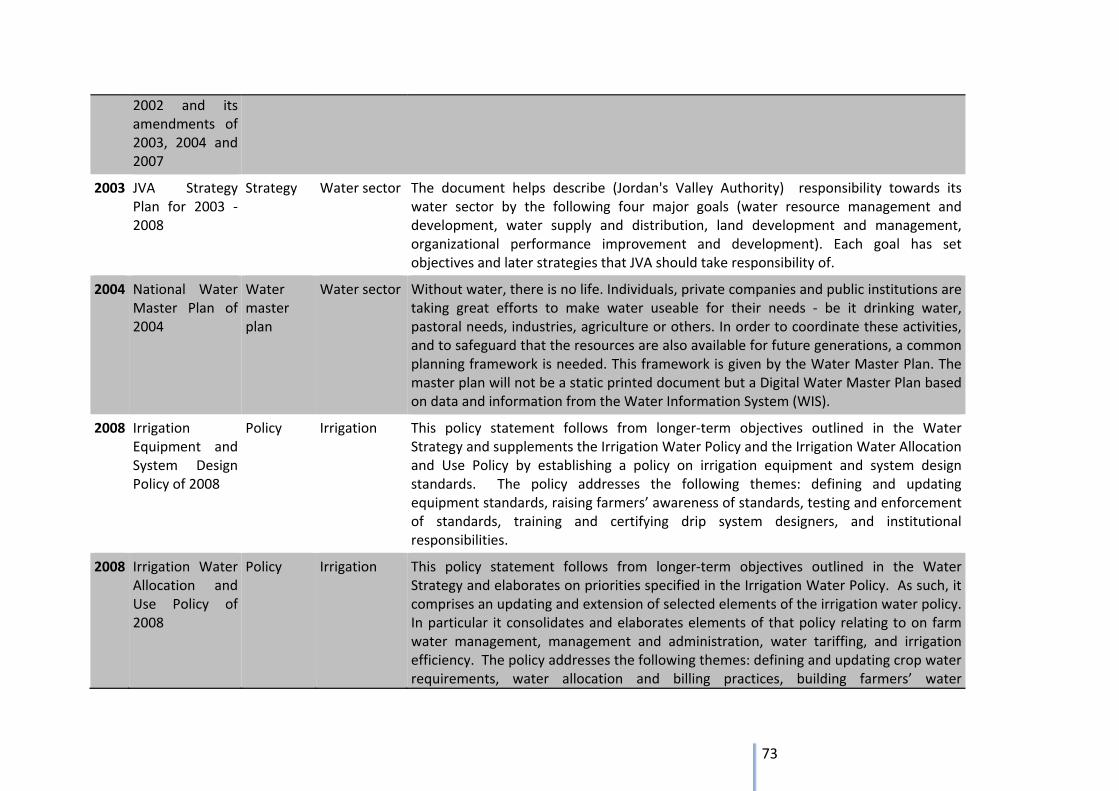
73
2002 and its amendments of 2003, 2004 and 2007
2003 JVA Strategy Plan for 2003 ‐ 2008
Strategy Water sector The document helps describe (Jordan's Valley Authority) responsibility towards its water sector by the following four major goals (water resource management and development, water supply and distribution, land development and management, organizational performance improvement and development). Each goal has set objectives and later strategies that JVA should take responsibility of.
2004 National Water Master Plan of 2004
Water master plan
Water sector Without water, there is no life. Individuals, private companies and public institutions are taking great efforts to make water useable for their needs ‐ be it drinking water, pastoral needs, industries, agriculture or others. In order to coordinate these activities, and to safeguard that the resources are also available for future generations, a common planning framework is needed. This framework is given by the Water Master Plan. The master plan will not be a static printed document but a Digital Water Master Plan based on data and information from the Water Information System (WIS).
2008 Irrigation Equipment and System Design Policy of 2008
Policy Irrigation This policy statement follows from longer‐term objectives outlined in the Water Strategy and supplements the Irrigation Water Policy and the Irrigation Water Allocation and Use Policy by establishing a policy on irrigation equipment and system design standards. The policy addresses the following themes: defining and updating equipment standards, raising farmers’ awareness of standards, testing and enforcement of standards, training and certifying drip system designers, and institutional responsibilities.
2008 Irrigation Water Allocation and Use Policy of 2008
Policy Irrigation This policy statement follows from longer‐term objectives outlined in the Water Strategy and elaborates on priorities specified in the Irrigation Water Policy. As such, it comprises an updating and extension of selected elements of the irrigation water policy. In particular it consolidates and elaborates elements of that policy relating to on farm water management, management and administration, water tariffing, and irrigation efficiency. The policy addresses the following themes: defining and updating crop water requirements, water allocation and billing practices, building farmers’ water
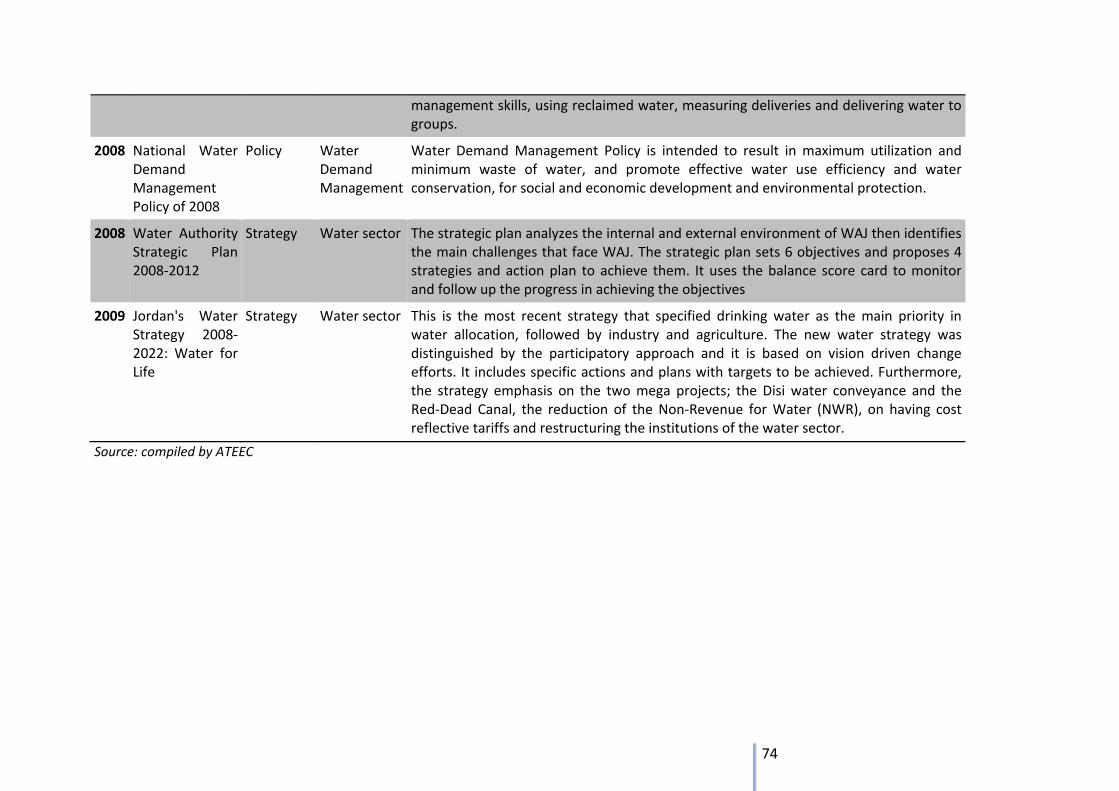
74
management skills, using reclaimed water, measuring deliveries and delivering water to groups.
2008 National Water Demand Management Policy of 2008
Policy Water Demand Management
Water Demand Management Policy is intended to result in maximum utilization and minimum waste of water, and promote effective water use efficiency and water conservation, for social and economic development and environmental protection.
2008 Water Authority Strategic Plan 2008‐2012
Strategy Water sector The strategic plan analyzes the internal and external environment of WAJ then identifies the main challenges that face WAJ. The strategic plan sets 6 objectives and proposes 4 strategies and action plan to achieve them. It uses the balance score card to monitor and follow up the progress in achieving the objectives
2009 Jordan's Water Strategy 2008‐2022: Water for Life
Strategy Water sector This is the most recent strategy that specified drinking water as the main priority in water allocation, followed by industry and agriculture. The new water strategy was distinguished by the participatory approach and it is based on vision driven change efforts. It includes specific actions and plans with targets to be achieved. Furthermore, the strategy emphasis on the two mega projects; the Disi water conveyance and the Red‐Dead Canal, the reduction of the Non‐Revenue for Water (NWR), on having cost reflective tariffs and restructuring the institutions of the water sector.
Source: compiled by ATEEC

75


