Embed Size (px)
Citation preview

Evolving Care in GI Cancers:
Is it Personal?
Alan P. Venook, MD University of California, SF

PERSONALIZED MEDICINE
PERSONALIZED MEDICINE:
Treat the PERSON, not the PATIENT
IMPLICATION:
The approach to each patient MAY differ

• GIST: mesenchymal tumors of the GI tract
• About 95% of GISTs stain + for KIT or DOG1
• KIT expression feature of the tumor and is not
necessarily due to a mutation in KIT
• Other, less GIST-specific markers include
CD34, smooth muscle actin, desmin, and
S100 protein
GISTs are most commonly initiated through
mutations in the KIT gene (75-80% of all GISTs)
GISTs that are KIT-negative often contain a PDGFRA
mutation
GISTs that are KIT-Negative and PDGFRA-negative
are called ‘wild type’ (WT)
Range of KIT+
staining in GIST
PDGFRA = platelet derived growth factor alpha
Gastrointestinal stromal tumor (GIST)
1. Rubin BP et al. Lancet. 2007;369:1731-1741. 2. Demetri GD et al. J Natl Compr Canc Netw. 2010;8:S1-S41. 3. Lasota J and Miettinen M. Histopathology. 2008;53:245-266. 4. Heinrich MC et al. Science. 2003;299:708-710. 5. Novelli M, et al. Histopathology 2010;57(2):259-270

Common mutations in GIST
Mutation Frequency Distribution
KIT
Exon 11 67% All sites
Exon 9 10% Small bowel, colon
Exons 13 & 17 2% All sites
Exon 8 Rare Small bowel
PDGFRA
Exon 18 6% All sites
Exon 12 1% All sites
Exon 14 <1% Stomach
GIST location does not
predict type of mutation
Corless CL et al. Annu Rev Pathol. 2008;3:557-586.
Wild type = 12 -15 %

Phase III trials for advanced GIST:
genotype vs PFS (All Doses)
Heinrich et al. J Clin Onc
2008, 26(33):5360-7 Debiec-Rychter et al. Eur J Cancer
2006, 42(8):1093-103
Exon 11 (n=283)
WT (n=67)
Exon 9 (n=32)
Exon 11 (n=248) WT (n=52)
Exon 9 (n=58)
EORTC/ISG/AGITG SWOG S0033

18FDG-PET response: GIST
Pretreatment 1 month post-treatment
Courtesy of Dr. A.D. Van den Abbeele.
Target: c-KIT
Agent: imatinib
Biomarker: PET

PERSONALIZED MEDICINE
PERSONALIZED MEDICINE:
Treat the PERSON, not the PATIENT
IMPLICATION:
The approach to each patient DOES differ

Domchek, et al, JCO, 2011
PERSONALIZED THERAPY ?

Colon cancer: PERSONALIZED
• Preventive measures
Screen patients at-risk
• Cure patients who are curable
• Use therapies when necessary
– Avoid excessive toxicities
• No wasted opportunities
• Life-style adjustments

CRC: HOW ARE WE DOING ?
1. Jemal A et al. CA: Cancer J Clin. 2011;61:69-90. Copyright ©2011 by John Wiley & Sons, Inc. Reproduced
with permission of John Wiley & Sons, Inc.; 2. Siegel R et al. CA: Cancer J Clin. 2013;63:11-30.
Worldwide Developed Developing
GIST = 5000 / year

Colon Cancer DECISIONS:
FOR EACH PATIENT
• GOAL: Cure / Palliation
• Stage II: adjuvant therapy YES / NO
• Resect primary: YES / NO
• FOLFOX / FOLFIRI / FOLFOXIRI / CAPE
• Biologic: BEVACIZUMAB / EGFR AB
• Treatment Holiday: YES / NO
• Maintenance therapy: YES / NO

Stage Extent of tumor
5-year survival
Mucosa
Muscularis mucosa
Submucosa
Muscularis propria
Serosa
Fat
Lymph nodes
A No deeper
than submucosa
> 90%
B1 Not through bowel wall
80–85%
B2 Through
bowel wall
70–75%
C1 Not through bowel wall: lymph node metastases
50–65%
C2 Through
bowel wall: lymph node metastases
25–45%
D Distant
metastases
< 5%
Adapted from Skarin. Slide Atlas of Diagnostic Oncology. Gower Medical Publishing; 1997:Fig 5.98.
Staging of Colorectal Cancer

CRC Stage at Diagnosis
13% Stage I
27% Stage II
38% Stage III
22% Stage IV
www.ccalliance.org.

MOSAIC: Overall survival w/ 8 year follow-up
André T et al. JCO 2009;27:3109-3116

QUASAR
Overall Survival – Stage II (N=2963)
QUASAR, Lancet, 2007
RR=0.84
P=0.05
QUick And
Simple
And Reliable

Sargent, D. et al. J Clin Oncol; 2009
ACCENT: Pooled analysis stage II colon cancer


MOSAIC: Peripheral neuropathy at 4 years
André T et al. JCO 2009;27:3109-3116

On balance…
• Side effects
• Acute & long
term
• Inconvenience
• COST
• $$$ & opportunity
• Delay
recurrence
• Reduce
recurrence
IMPROVE CURABILITY

ASSIGN % BENEFIT
“ADJUVANT ON-LINE”
WWW.ADJUVANTONLINE.COM
– SEER Database 1988 – 1997
– Colon cancer specific survival
– No information on use of chemotherapy
Stage II Colon Cancer :
Improving Outcomes / Making Decisions
–Refine stage
–Better / different chemotherapy
– Incorporate biologics
–Lifestyle

Stage II Colon Cancer:
Refining Stage
Nodal sampling
Minimal node count
Nodal analysis
Sentinel node
Prognostic factors
Single mutations
Multi-gene signature
GENERAL
PERSONAL

Colorectal Cancer, 2007
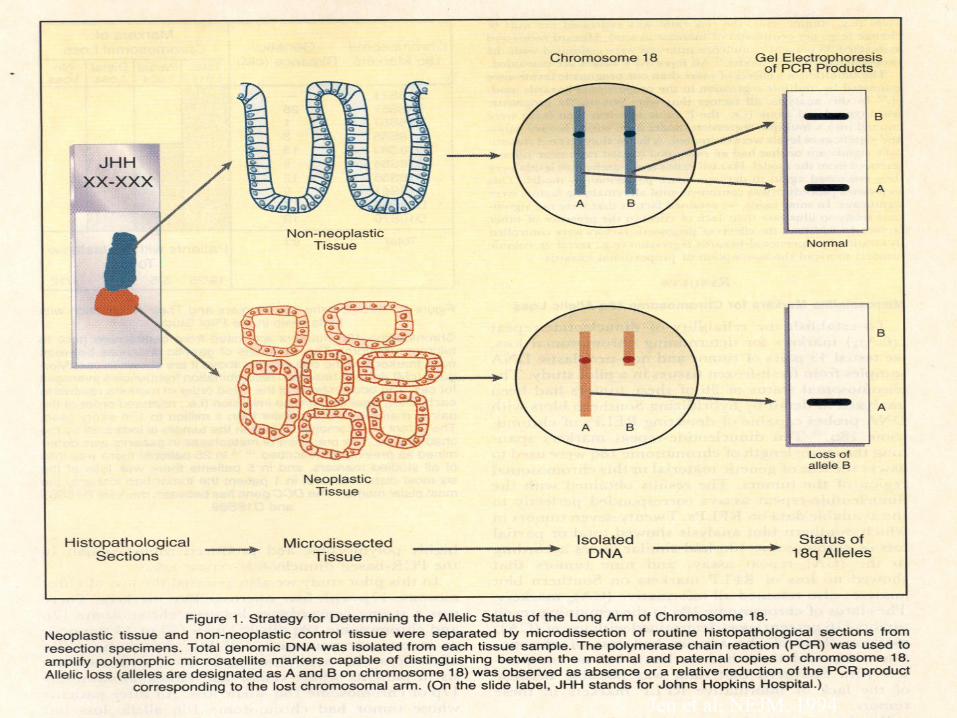
Jen et al, NEJM, 1994

18Q deletion & outcome in untreated colorectal
cancer
18Q +
18Q
-
Jen, et al. NEJM,
1994

Mismatch Repair Deficiency (MMR-D): Subgroup of Colon Cancer
PCR on tumor DNA for MSI (microsatellite instability)
IHC for MMR protein status
MLH1+
MSH2+ MLH1-
MSH2-
MMR-D = MSI-H

Copyright © American Society of Clinical Oncology
Sargent, et al. JCO, 2010
DFS by MMR status
untreated treated
dMMR = MSI-
H
N = 15% sporadic cancers N = 15% sporadic cancers

Clinical and Molecular Features: MSI tumors
N = 15% sporadic cancers
• Loss of MLH1 most common genetic finding
(>90%)
• Clinical Correlations:
– Right sided, Female, Early stage
• Pathology:
– Poorly diff, Signet-ring, Lymph infiltration
• Prognosis: superior to MSS
Survival decrement with 5FU-based RX

E5202: Risk stratify stage II patients
Low-Risk Patients MSS or MSI-L with
retention of 18q alleles MSI-H
Arm A: mFOLFOX6 q2w × 12
Arm B: mFOLFOX6 + bevacizumab* q2w × 12
Arm C: Observation only
High-Risk Patients MSS/18q LOH or MSI-L/18q LOH
are RANDOMIZED
MSI-L = low-level microsatellite instability MSI-H = high-level microsatellite instability *Bevacizumab continued for an additional 6 months
Stratify: Disease stage (IIA or IIB) Microsatellite stability (stable vs MSI) 18q LOH
C-08 / AVANT:
Bevacizumab -
no benefit
RISK-
STRATIFICATION:
RESULTS
EXPECTED 2017

Colon Cancer Prognostic Testing
Guanylyl Cyclase C
Nodal analysis
Oncotype Dx Colon®
Coloprint®

31
Real-time RT-PCR for RNA Quantification from
Fixed Paraffin-Embedded Tumor Tissue
Strand Displacement
and Cleavage of Probe
Polymerization
Polymerization
Completed
R Q
R
Q
R Q
Forward
Primer
Reverse
Primer
Probe
Reporter Quencher
Cronin et al. Am J Pathol. 2004;164:35-42.

Colon Cancer Technical Feasibility
Development Studies
Surgery Alone
NSABP C-01/C-02 (n=270)
Cleveland Clinic (n = 765)
Selection of Final Gene List & Algorithm
Development Studies
Surgery + 5FU/LV
NSABP C-04 (n=308)
NSABP C-06 (n=508)
Clinical Validation Study – Stage II Colon Cancer
QUASAR (n=1,436)
Test Prognosis and Treatment Benefit
Development and Validation of a Multi-Gene
RT-PCR Colon Cancer Assay
Standardization and Validation of Analytical Methods

12-Gene Oncotype DX Colon Cancer Recurrence Score
CELL CYCLE Ki-67
C-MYC MYBL2
ATP5E GPX1 PGK1 UBB
VDAC2
GADD45B
Recurrence Score
STROMAL FAP
INHBA BGN
Reference Genes
O’Connell et al. 2010 JCO 28:3937 Kerr et al., ASCO 2009, #4000
RS = 0.15 x Stromal Group - 0.30 x Cell Cycle Group + 0.15 x GADD45B

QUASAR Results: Recurrence Score, T Stage, and
MMR Deficiency are Key Independent Predictors
of Recurrence in Stage II Colon Cancer
0%
5%
10%
15%
20%
25%
30%
35%
40%
45%
0 10 20 30 40 50 60 70
Recurrence Score
Ris
k o
f re
cu
rren
ce
at
3 y
ea
rs
MMR deficient (11%)
T4 stage (13%)
T3 and MMR proficient (76%)

Contribution of RS to Prediction of Recurrence Risk Beyond Clinical and Pathologic Covariates
Variable HR
HR
95% CI
P
value
MMR (deficient vs intact) 0.70 (0.42,1.17) 0.17
T Stage (T4 vs T3) 0.93 (0.44,1.97) 0.85
Number of Nodes Examined (<12 vs>=12) 1.14 (0.81,1.60) 0.46
Tumor Grade (high vs low) 0.78 (0.51,1.18) 0.24
LVI (present vs not) 1.39 (0.85,2.26) 0.19
RS per 25 units 1.68 (1.18,2.38) 0.004
Pre-specified Multivariable Cox Regression of RS + covariates on RF (n=656, 95% of all pts)
• RS significantly associated w/ recurrence risk (p=0.004) after MMR, T stage, # nodes examined, grade and LVI were included in the model
Venook et al, JCO, 2013

High-risk stage II: DFS, RFS, OS, and post–disease-free
survival
Tournigand C et al. JCO 2012;30:3353-3360

Colon Cancer DECISIONS:
FOR EACH PATIENT
• GOAL: Cure / Palliation
• Stage II: adjuvant therapy YES / NO
• Resect primary: YES / NO
• FOLFOX / FOLFIRI / FOLFOXIRI / CAPE
• Biologic: BEVACIZUMAB / EGFR AB
• Treatment Holiday: YES / NO
• Maintenance therapy: YES / NO

GOAL OF TREATMENT:
CURATIVE OR PALLIATIVE


Biomarkers in Colorectal Cancer:
Tumor Behavior
• Neoadjuvant chemotherapy response
• Imaging
• Chemoradiation:
• Prognosis for rectal cancer
Assess Tumor Biology :
Lack of Response = POOR Prognosis
(determines GOALS of therapy)


0
5
10
15
20
25
30
1980 1985 1990 1995 2000 2005
OS
(m
on
ths
)
Median OS
Stage IV CRC: 2010 1980 1985 1990 1995 2000 2005
5-FU Irinotecan
Capecitabine
Oxaliplatin
Cetuximab
Bevacizumab
Best supportive care (BSC)
Panitumumab
Year
OS impacted by: SURGERY
RFA / EBRT /
CYBERKNIFE
RADIO-EMBOLIZATION

Singlets, Doublets, Triplets
Quartets, Quintets
Oxaliplatin Holidays
Maintenance Bevacizumab
MAXIMIZE BENEFIT !!
MINIMIZE RISK !!

What is a biomarker?
• “Any measurable diagnostic indicator that is used to assess the risk or presence of disease” Gutman and Kessler. Nat Rev Cancer. 2006;6(7).
• AKA “in vitro diagnostic” www.fda.gov
• Includes tests for: – Future risk – Screening – Diagnosis – Prognosis – Staging – Monitoring response – Optimizing treatment outcomes

Not sure what to do?
www.responsegenetics.com
2013
FOUNDATION ONE™
236 GENES
47 INTRONS
(19 GENES IN
REARRANGEMENTS)
WHAT IS ACTIONABLE ?

Gerlinger et al, NEJM, 2012 Gerlinger et al, N Engl J Med, 2012
Substantial heterogeneity:
primary v. metastasis
Across metastatic sites
Within metastatic sites

Potential Predictive Markers for CRC: Tumor or blood
Drug Marker
Fluoropyrimidines TS, DPD*, TP, MSI, MTHFR
expression/polymorphisms
Irinotecan UGT polymorphisms*, MSI, transporter
polymorphisms
Oxaliplatin ERCC1, GST P1, XPD expression, transporter
polymorphisms
EGFR Antibodies gene amplification/polymorphism, KRAS
mutation, BRAF mutation, ligand expression,
PTEN expression, VEGF levels
VEGF inhibitors VEGF polymorphisms, ICAM
polymorphisms/levels, E-selectin levels, HIF1,
Glut-1, VEGFr gene expression
General Circulating tumor cells
KRAS

KRAS As a Biomarker for Panitumumab
Response in Metastatic CRC
• PFS log HR significantly different depending on KRAS status (P<0.0001) • Percentage decrease in target lesion greater in patients with wild-type KRAS
receiving panitumumab
Patients With Mutant KRAS
Mean
(weeks)
Stratified log-rank test: P<0.0001
115/124 (93)
Patients With Wild-Type KRAS
1.0
0.9
Pro
po
rtio
n E
ve
nt
Fre
e
0.8
0.7
0.6
0.5
0.4
0.3
0.2
0.1
0 0 2 4 6 8 10
Events/N (%) Median
(weeks)
Pmab + BSC BSC alone
114/119 (96)
12.3
7.3
19.0
9.3
HR: 0.45 (95% CI, 0.34-0.59)
12 14 16 18 20 22 24 26 28 30 32 34 36 38 40 42 44 46 48 50 52
Weeks
Pro
po
rtio
n E
ve
nt
Fre
e
1.0
0.9
0.8
0.7
0.6
0.5
0.4
0.3
0.2
0.1 0
0 2 4 6 8 10 12 14 16 18 20 22 24 26 28 30 32 34 36 38 40 42 44 46 48 50
Weeks
Pmab + BSC BSC alone Mean
(weeks)
76/84 (90)
Events/N (%) Median
(weeks)
95/100 (95)
7.4
7.3
9.9
10.2
HR: 0.99 (95% CI, 0.73-1.36)
52
Amado RG et al. J Clin Oncol. 2008;26:1626-1634.

Colon Cancer: Many Diseases?
KRAS Wild Type KRAS mutant
MSI-High MSS
+ EGFR Agents - EGFR Agents
? No 5FU
50-60% 40-50%
15-20% 80-85%
• ~80% of CRC patients have FAP genetics
• ~20% have different (MSI/HNPCC) genetics
– HNPCC patients do not benefit from 5-FU and may actually be harmed ?

BRAF Mutations in CRC
• BRAF is primary effector of KRAS signaling
• BRAF mutations:
– Occur most frequently in exon 15 (V600E)
– Found in 4% to 14% of patients with CRC
– Mutually exclusive with KRAS mutations
Raf
MEK
Erk
P
P P
P
Tumor cell
proliferation
and survival
EGF
Tumor Cell
Ras
Di Nicolantonio F et al. J Clin Oncol. 2008;26:5705-5712; Yarden Y, Sliwkowski MV. Nat Rev Mol Cell Biol.
2001;2:127-137; Artale S et al. J Clin Oncol. 2008;26:4217-4219.

Clinical efficacy in KRAS wild-type tumors by BRAF mutation status
KRAS wt/BRAF wt
(n=566)
KRAS wt/BRAF mt
(n=59)
FOLFIRI
(n= 289)
Cetuximab
+FOLFIRI
(n= 277)
FOLFIRI
(n=33)
Cetuximab
+FOLFIRI
(n=26)
Median OS mo
[95% CI]
21.6
[20.0–24.9]
25.1
[22.5–28.7]
10.3
[8.4–14.9]
14.1
[8.5–18.5]
HR [95% CI]
p-valuea
0.830 [0.687–1.004]
0.0549
0.908 [0.507–1.624]
0.7440
Median PFS mo
[95% CI]
8.8
[7.6–9.4]
10.9
[9.4–11.8]
5.6
[3.5–8.1]
8.0
[3.6–9.1]
HR [95% CI]
p-valuea
0.679 [0.533–0.864]
0.0016
0.934 [0.425–2.056]
0.8656
OR rate (%)
[95% CI]
42.6
[36.8–48.5]
61.0
[55.0–66.8]
15.2
[5.1–31.9]
19.2
[6.6–39.4]
p-valueb <0.0001 0.9136
CI, confidence interval; OR, best overall response; OS, overall survival; PFS, progression-free survival; mo, months; mt, mutant; wt, wild-type
aStratified log-rank test; bCochran-Mantel-Haenszel test
Van Cutsem E, et al. N Engl J
Med 2009;360:1408-17
Median OS 23 mo
Median OS 12 mo

Precision Medicine: Colorectal Cancer
Biomarkers 2013
• ABCG2 34 G>A – Oxaliplatin efficacy (<5%)
• UGT1A1*28 - Irinotecan toxicity (10%)
• KRAS mut - EGFR Ab inactivity (40%)
• Codon 12 v. other
• BRAF V600E mt - Poor prognosis (5-10%)
• Circulating VEGF-A - Bevacizumab
• Not prospectively validated
WHAT NOT TO USE
PROGNOSIS

Colorectal cancer: Moving ahead
• Look backwards: learn from prior trials
• Enrich populations
• Targeting mutations
• New Drugs
• Molecular staging

54
Mutations in KRAS, NRAS, and
BRAF Distribution and
Prognostic Significance
BRAF mutation All patients
Any mutation
KRAS mutation
KRAS WT
All WT
Mutation status:
0
6
12
Media
n P
FS
(mo) Arm A Arm B
0
6
12
18
Media
n O
S (m
o)
57 340
268 815
367 289
45 366
297 815
362 292
0
10
20
30
40
2-y
ear
OS
(%)
N
Prognostic effect of mutational status
“All-WT”
n = 581 (44%)
KRAS-MT
n = 565 (43%)
NRAS-MT
n = 50 (4%)
BRAF-MT
n = 102 (8%)
Total
N = 1316 (81%)
554
11 39
102
Population N Arm A Arm B
ITT 1630 815 815
Assessed for mutations 1316 648 668
– KRAS mutation
– NRAS mutation
– BRAF mutation
565 (43%)
50 (4%)
102 (8%)
268
18
57
297
32
45
KRAS WT 729 (55%) 367 362
KRAS/NRAS/BRAF WT
“All WT” 581 (44%) 289 292
Maughan TS et al. ASCO 2010 Annual Meeting. Abstract 3502.

PRIME: FOLFOX +/- PMAB RAS and BRAF Ascertainment
Panitumumab +
FOLFOX4
FOLFOX4
Alone Total
All randomized patients – n (%) 593 590 1183
Total RAS ascertainment 531 (90) 529 (90) 1060 (90)*
Total BRAF ascertainment 310 (52) 309 (52) 619 (52)†
Total RAS/BRAF ascertainment 524 (88) 523 (89) 1047 (89)‡
DOUILLARD et al, N ENGL J MED, 2013

Exploratory OS Analysis of the Wild-Type RAS
Subgroup Excluding Mutant Codon 59 Alleles
Events n (%)
Median months (95% CI)
Panitumumab + FOLFOX4
123 / 253 (49)
26.0 (21.9 – NE)
FOLFOX4 alone 148/ 252 (59)
20.2 (17.7 – 23.1)
Hazard Ratio = 0.77 (95% CI: 0.60 – 0.98)
Log-rank p-value = 0.032

Colorectal cancer: Moving ahead
• Look backwards: learn from prior trials
• Enrich populations
• Targeting mutations
• New Drugs
• Molecular staging

Targeted therapy in melanoma:
Flaherty et al NEJM 2010.
vemurafenib (PLX4032)

21 pts with V600E mutation
20/21 prior rx for metastatic disease
Median PFS = 3.7 months
PR = 1
PK lower than in melanoma cohort
PLX4032 in metastatic colorectal cancer patients w/
BRAF mutant tumors Kopetz et al, ASCO, 2010
BRAF INHIBITOR:
NO ACTIVITY AS
MONOTHERAPY

Oncogenic mutations in melanoma – fork in the road
RAS
NRAS Mutated
10-15%
BRAF
Mutated
50-60%
PTEN
Lost
10-30%
AKT
Overexpressed
43-60%
Receptors
c-KIT Mutated
~20% of Acral &
Mucosal Melanoma
MEK
ERK
PI3K
↑GROWTH ↑INVASION ↓APOPTOSIS
KIT inhibitors Imatinib
Nilotinib
Dasatinib BRAF inhibitors PLX4032
GSK2118436
MEK inhibitors GSK1120212
GDC0973
AZD6244
ERK inhibitors
PI3K inhibitors BKM120
GSK2126458
AKT inhibitors MK2206
GSK2141795

Phase I/II GSK2118436 +
GSK1120212
• Restricted to melanoma patients
• 2118436:
– ATP-competitive inhibition of BRAF kinase
• 1120212:
– MEK1/2 activation and kinase activity
Amended to include colorectal cancer patients

Primary invading colostomy: PD after FOLFOX / cetux

Primary invading colostomy:
post 2 months BRAF /MEK inh
2 MONTHS
50.7% reduction by
RECIST

Colon cancer: PERSONALIZED
• Preventive measures
Screen patients at-risk
• Cure patients who are curable
• Use therapies when necessary
– Avoid excessive toxicities
• No wasted opportunities
• Life-style adjustments

Stage III Colon Cancer:
IFL v. FU/LV
Similar DFS and OS
as 5-FU/LV alone
Greater toxicity
Neutropenia Febrile
neutropenia
Death during
treatment
43%
4% 2.8%
5%
1% 1% 0
10
20
30
40
50
Pati
en
ts (
%)
P < .00001
P < .0005 P < .008
5-FU/LV + irinotecan
5-FU/LV alone
Saltz LB, et al. JCO, 2007

Lifestyle questions: FINDINGS
DECREASES risk of recurrence
• EXERCISE
• ASA
• NON-Western diet
DECREASES RISK OF DEATH
• ASA
INCREASES RISK OF RECURRENCE
• SWEETENED BEVERAGES

Barriers Potential Improvement Strategies
Lack of access to health care Home use FOBT cards and instructions
Lack of a healthcare practitioner’s recommendation for screening
One-on-one discussions with a HCP regarding the importance of screening for CRC
Differences in physician (colonoscopy) and patient (FOBT) screening preferences
Mailed appointment reminders to patients who are due for screening
Demographics: low levels of educational achievement and income
Involvement of patient navigators to assist patients in managing referrals, navigating the health care system, and facilitating follow-up
Personal barriers: fear and embarrassment
CRC Screening Barriers and
Strategies to Improve Screening Rates
ACS. Colon Cancer Facts & Figures website. 2011-2013. Accessed June 12, 2012.

CRC Screening Prevalence
• Fecal occult blood test within the past year or sigmoidoscopy or colonoscopy
within the past 10 years. Screening and diagnosis exams combined.
ACS. Colon Cancer Facts & Figures website. 2011-2013. Accessed June 12, 2012.

DELAWARE
SIZE = 2489 SQ MILES
POPULATION = 917,092
SACRAMENTO
SIZE = 995 SQ MILE
POP = 1,420,000

Colorectal cancer: Looking ahead DELAWARE EXPERIENCE
• STATE / INSURERS / PHYSICIANS
• Guarantee colonoscopy / care regardless
of insurance status
• Nurse navigators
• Community outreach
Grubbs, JCO, 2013

Colorectal cancer: Looking ahead DELAWARE EXPERIENCE
• Screening (population, >50): 57% to 74%
• (AA, > 50) 48% 74%
• Colon cancers stage at diagnosis:
– Advanced 79% to 40%; local 16% to 50%
• Incidence (per 100000): all, 58 to 45
• AA, 67 to 45
• Mortality: decrease 41%
Grubbs, JCO, 2013

PERSONALIZED MEDICINE
PERSONALIZED MEDICINE:
Treat the PERSON, not the PATIENT
IMPLICATION:
The approach to each patient will differ

CALGB/SWOG # 80405
Untreated
advanced
or mCRC
N =1142
Bevacizumab
followed by
FOLFOX or FOLFIRI
q 2 wks
Cetuximab
followed by
FOLFOX or FOLFIRI
q 2 wks
Screen
for
eligibility
Send
tumor
tissue
block to
SWOG
PCO
Randomize
Patients
w/
Wild type
K-ras
tumor
Register
Patient
open: 9/05
Reached accrual: 1/12
Goal = 2289
Expected 30.5 mo
Patients enrolled:
N = 2335 (total)
1178 (final endpt)
RESULTS: ASCO 2014 ?

C80405: Potential Information N = 1178
• Clinical: Bevacizumab v. Cetuximab
FOLFOX v. FOLFIRI
• Correlates: • Right-sided v. left-sided
• Male v. female
• NED v. Primary refractory
• Patterns of metastases
PERSONALIZED MEDICINE?
Leverage tissue / outcomes
Mutational analysis all tumors
MODEL COLON CANCER ?