Embed Size (px)
Citation preview
EVOLUTIONARY INFERENCE:Some basics of phylogeneticanalyses.
Ana Rojas MendozaCNIO-Madrid-Spain.Alfonso Valencia’s lab.

Aims of this talk:• 1.To introduce relevant concepts of
evolution to practice phylogeneticinference from molecular data.
• 2.To introduce some of the most useful methods and computer programmes to practice phylogenetic inference.
•
• 3.To show some examples I’ve worked in.

11--Concepts of Molecular EvolutionConcepts of Molecular Evolution
• Homology vs Analogy.• Homology vs similarity.• Ortologous vs Paralogous genes.• Species tree vs genes tree.• Molecular clock. • Allele mutation vs allele substitution.• Rates of allele substitution.• Neutral theory of evolution.
SOME BASICS

• Homologue: the same organ under every variety of form and function (true or essential correspondence).
• Analogy: superficial or misleading similarity.
Owen’s definition of homology
Richard Owen, 1843
SOME BASICS

1.Concepts of Molecular Evolution1.Concepts of Molecular Evolution
• Homology vs Analogy.• Homology vs similarity.• Ortologous vs Paralogous genes.• Species tree vs genes tree.• Molecular clock. • Allele mutation vs allele substitution.• Rates of allele substitution.• Neutral theory of evolution.
SOME BASICS

Similarity ≠ Homology• Similarity: mathematical concept
. Homology: biological conceptCommon Ancestry!!!
SOME BASICS

1.Concepts of Molecular Evolution1.Concepts of Molecular Evolution
• Homology vs Analogy.• Homology vs similarity.• Ortologous vs Paralogous genes.• Species tree vs genes tree.• Molecular clock. • Allele mutation vs allele substitution.• Rates of allele substitution.• Neutral theory of evolution.
SOME BASICS

Homologous genes
• Orthologous genesDerived from a process of new
species formation (speciation)
• Paralogous genesDerived from an original gene
duplication process in a single biological species
SOME BASICS

A
A A
AB
Duplication
Species1 Species2
A
Orthologs
Orthologs
Paralogs
Homologs
Homologous genesSOME BASICS

HOMOLOGS/ORTHOLOGS/PARALOGS
Recent duplication Ras subfamily
Group of orthologsand in-paralogs
Rab subfamilyGroup of ortholgs
Both familiesare paralogs
between each other!
SOME BASICS

1.Concepts of Molecular Evolution1.Concepts of Molecular Evolution
• Homology vs Analogy.• Homology vs similarity.• Ortologous vs Paralogous genes.• Species tree vs genes tree.• Molecular clock .• Allele mutation vs allele substitution.• Rates of allele substitution.• Neutral theory of evolution.
SOME BASICS

• Paralogous genes ofGlobin
• a, b, d (Glob), Myo y Leghaemoglobin, each originatedby duplication from anancestral gene
SpeciesSpecies treestrees vsvs Gene Gene treestrees
Orthologous genes ofCytochromeEach one is present in a biologicalspecies
SOME BASICS

Species trees and Gene trees
We often assume that gene trees give us species trees
a
b
c
A
B
D
Gene tree Species tree
SOME BASICS

1.Concepts of Molecular Evolution1.Concepts of Molecular Evolution
• Homology vs Analogy.• Homology vs similarity.• Ortologous vs Paralogous genes.• Species tree vs genes tree.• Molecular clock.• Allele mutation vs allele substitution.• Rates of allele substitution.• Neutral theory of evolution.
SOME BASICS

Is there a molecular clock?
• The idea of a molecular clock was initially suggested by Zuckerkandl and Pauling in 1962.
• They noted that rates of amino acid replacements in animal haemoglobins were roughly proportional to time - as judged against the fossil record.
SOME BASICS

The molecular clock for alpha-globin:Each point represents the number of substitutions separating each
animal from humans
0
20
40
60
80
1000
100
200
300
400
500
Time to common ancestor (millions of years)
nu
mb
er
of
sub
stit
uti
on
s
cow
platypuschicken
carp
shark
SOME BASICS

1.Concepts of Molecular Evolution1.Concepts of Molecular Evolution
• Homology vs Analogy.• Homology vs similarity.• Ortologous vs Paralogous genes.• Species tree vs genes tree.• Molecular clock .• Allele mutation vs allele substitution.• Rates of allele substitution.• Neutral theory of evolution.
SOME BASICS

Mutation=
Individual
Fixation=
Population
SOME BASICSALLELE MUTATION VS. FIXATION

1.Concepts of Molecular Evolution1.Concepts of Molecular Evolution
• Homology vs Analogy.• Homology vs similarity.• Ortologous vs Paralogous genes.• Species tree vs genes tree.• Molecular clock .• Allele mutation vs allele substitution.• Rates of allele substitution.• Neutral theory of evolution.
SOME BASICS

Rates of amino acid replacement in different proteins
Protein Rate (mean replacements per siteper 10 9 years)
Fibrinopeptides 8.3Insulin C 2.4Ribonuclease 2.1Haemoglobins 1.0Cytochrome C 0.3Histone H4 0.01
• Evolutionary rates depends on functionalconstraints of proteins
SOME BASICS

NucleotideNucleotide substitutionsubstitution raterate ((rr)): # substitutions per site per year
r =K/(2T) Ancestral sequence
Seq 1 Seq 2
TK= number of substitutions
per site betweenhomologous sequences.
T=Time of divergence.
SUBSTITUTION OR FIXATION RATES IN ESTIMATION
SOME BASICS

1.Concepts of Molecular Evolution1.Concepts of Molecular Evolution
• Homology vs Analogy.• Homology vs similarity.• Ortologous vs Paralogous genes.• Species tree vs genes tree.• Molecular clock. • Allele mutation vs allele substitution.• Rates of allele substitution.• Neutral theory of evolution.• Homoplasy.
SOME BASICS

Neutral theory of evolution• At molecular level, the most frequent change are
those involving fixation in populations of neutral selective variants (Kimura, 1968).
– Allelic variants are functionally equivalent.
– Neutralism does not deny adaptive evolution.
• Fixation of new allelic variants occur at a constant rate, it is equal to mutation rate and independent of population parameters.
– 2 N m x 1/2 N = m
SOME BASICS

There is no universal clock• The initial proposal saw the clock as a Poisson
process with a constant rate• Now known to be more complex - differences in
rates occur for:
– different sites in a molecule– different genes– different base position (synonimous-nonsynonymous)
– different regions of genomes– different genomes in the same cell– different taxonomic groups for the same gene
• Molecular Clocks Not Exactly Swiss
SOME BASICS

2.Concepts of 2.Concepts of PhylogeneticPhylogeneticSystematicsSystematics
• What is Phylogenetic systematics?• Cladogram and Phylogram.• Monophyletic, Paraphyletic and
Polyphyletic groups.• Rooted vs Unrooted trees.• Ingroup and Outgroup.• Character states and evolution.• Homoplasy.
SOME BASICS

• Sees homology as evidence of common ancestry
• Uses tree diagrams to portray relationships based upon recency of common ancestry
• Monophyletic groups (clades) - contain species which are more closely related to each other than to any outside of the group
Phylogenetic systematics
SOME BASICS
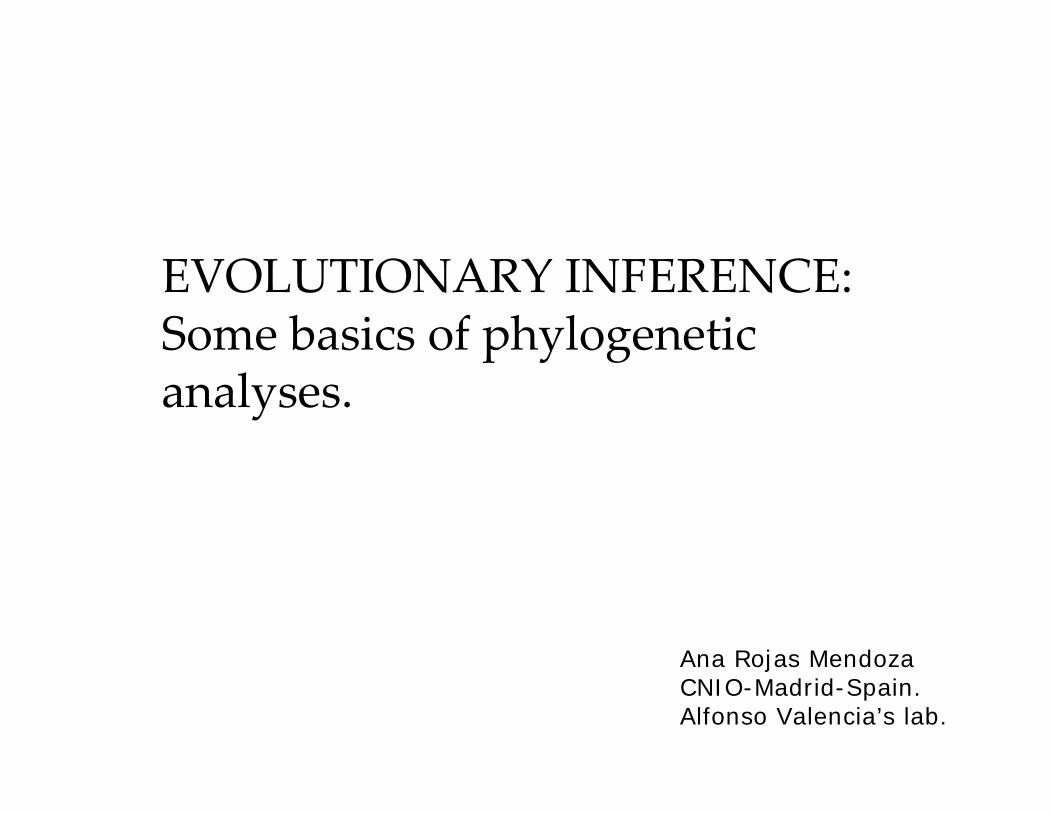
Phylogenetic Trees
A B C D E F G H I J
ROOTROOT
polytomypolytomy
terminal terminal branchesbranches
interior interior branchesbranches
nodenode 11 nodenode 22
LEAVESLEAVES
A CLADOGRAM
SOME BASICS

2.Concepts of 2.Concepts of PhylogeneticPhylogeneticSystematicsSystematics
• What is Phylogenetic systematics?• Cladogram and Phylogram.• Monophyletic, Paraphyletic and
Polyphyletic groups.• Rooted vs Unrooted trees.• Ingroup and Outgroup.• Character states and evolution.• Homoplasy.
SOME BASICS

Bacterium 1
Bacterium 3
Bacterium 2
Eukaryote 1
Eukaryote 4
Eukaryote 3
Eukaryote 2
Bacterium 1
Bacterium 3Bacterium 2
Eukaryote 1
Eukaryote 4Eukaryote 3
Eukaryote 2
Phylograms show branch order and branch lengths
Cladograms and phylograms
Cladograms show branching order -branch lengths are meaningless
SOME BASICS

2.Concepts of 2.Concepts of PhylogeneticPhylogeneticSystematicsSystematics
• What is Phylogenetic systematics?• Cladogram and Phylogram.• Monophyletic, Paraphyletic and
Polyphyletic groups.• Rooted vs Unrooted trees.• Ingroup and Outgroup.• Character states and evolution.• Homoplasy.
SOME BASICS

Trees - Rooted and Unrooted
ROOTA
B
C
D E
F
GH
I
J
A B C D E F GH I J
ROOT
A B C D E F G H I J
ROOT
SOME BASICS

Rooted by outgroup
Rooting using an outgroup
archaea
archaea
archaea
eukaryote
eukaryote
eukaryote
eukaryote
bacteria Outgroup
root
eukaryoteeukaryote
eukaryoteeukaryote
Unrooted tree
archaea
archaea
archaea
Monophyletic Ingroup
MonophyleticIngroup
SOME BASICS

2.Concepts of 2.Concepts of PhylogeneticPhylogeneticSystematicsSystematics
• What is Phylogenetic systematics?• Cladogram and Phylogram• Monophyletic, Paraphyletic and
Polyphyletic groups.• Rooted vs Unrooted trees.• Ingroup and Outgroup.• Character states and evolution.• Homoplasy.
SOME BASICS

Types of characters
• Morphological (characteristics of physical attributes).
• Behavioral.
• Ecological (nest type, host plant, prey type).
• Distributional (geographical).
• Physiological/chemical .
• Molecular.
Character:A descriptor that can have different manifestations in
different species. (character states)
SOME BASICS
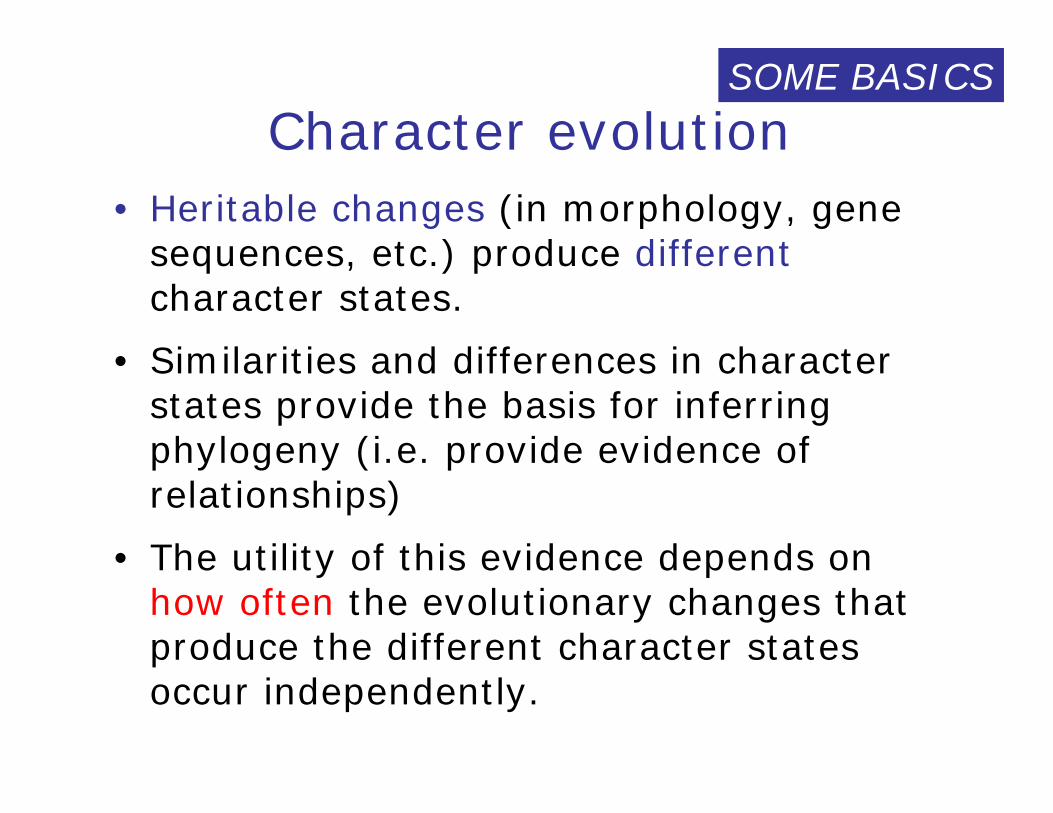
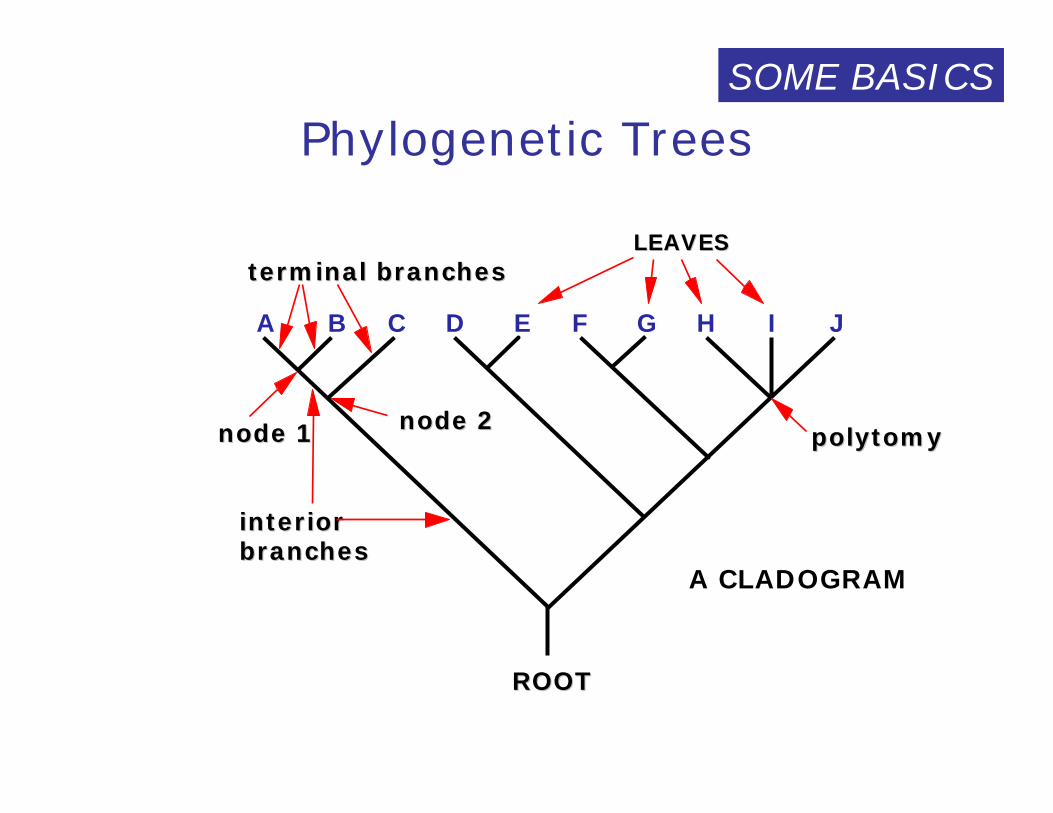
Character evolution• Heritable changes (in morphology, gene
sequences, etc.) produce different character states.
• Similarities and differences in character states provide the basis for inferring phylogeny (i.e. provide evidence of relationships)
• The utility of this evidence depends on how often the evolutionary changes that produce the different character states occur independently.
SOME BASICS

• Molecular data are genetic data: Vp= Vg+Ve
• Molecular data led us to study a huge amount of characters.
• Any kind of homoplastic similarity vanishing at time more characters are considered.
• Indels, duplications and chromosomicrearrangements are rare events with strong weight of homology.
• Molecular data offers a common measure for evolutionary divergence.
Why to use molecular data?
SOME BASICS

Small subunit ribosomal RNA
18S or 16S rRNA
SOME BASICS

Molecular characters
1. Protein variation (1950s-present)
Historically, first molecular characters
a. Isozyme/allozyme variation
· Used mostly at population level, sometimes
Phylogenetic.
· Misses lots of underlying variation
b. Amino acid sequencing (1960s, Fitch, etc.)
· Globin genes
· Technically difficult
SOME BASICS

Molecular characters
2. DNA (1970s)
· Has dominated molecular phylogenetics since.
. Impact of polymerase chain reaction (PCR).
a. DNA-DNA hybridization (1970s-80s; rare now)
· Famous studies in birds (Sibley and Ahlquist) made somebig changes (birds infamous for lack of allozyme variation)
· Not character-based; data are pairwise comparisonsbetween OTUs (suitable only for distance analysis)
· Advantage of looking at entire genome (single copy DNA anyway)
SOME BASICS

Some Common Phylogenetic Methods
Treebuildingmethod Optimality
Criteria
Cluster Algorithms
ParsimonyMaximumLikelihood
Bayesian Inference
MinimumEvolution
Least Square
UPGMANJ
Sites(nucleotides,
aa)Distances
Types of Data
SOME BASICS

2.Concepts of 2.Concepts of PhylogeneticPhylogeneticSystematicsSystematics
• What is Phylogenetic systematics?• Cladogram and Phylogram• Monophyletic, Paraphyletic and
Polyphyletic groups.• Rooted vs Unrooted trees.• Ingroup and Outgroup.• Character states and evolution.• Homoplasy.
SOME BASICS
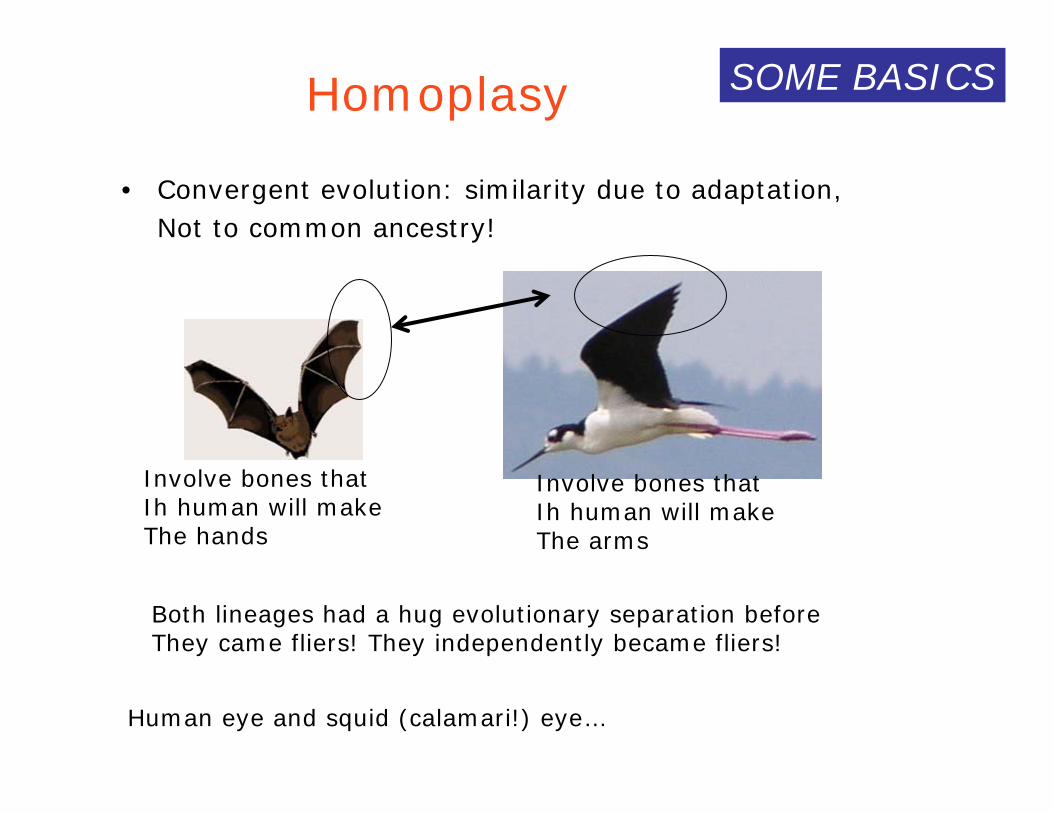
Homoplasy
• Convergent evolution: similarity due to adaptation,Not to common ancestry!
SOME BASICS
Involve bones thatIh human will makeThe hands
Involve bones thatIh human will makeThe arms
Both lineages had a hug evolutionary separation beforeThey came fliers! They independently became fliers!
Human eye and squid (calamari!) eye…

PHYLOGENETIC ANALYSIS
Trees: cladograms- represents only the branching order of nodesphylograms-represents branching order and branch length(number of sequence changes between nodes)
Distance: number of substitutions that have taken place along a bran
Tree construction: algorithmic: uses an algorithm to construct a tree form data(NJ,UPGM: distance methods) Fast, one tree ONLY.
tree-searching: builds many trees and then uses a criterion to decide whichis the best tree. (Character based)
Parsimony: several trees. The most likely scenario involves the feweschanges?
ML: seeks for tree that maximizes the likelihood of observing data.
Bayesian: seeks from several trees with the greatest likelihoods given the data.
REMINDER!!!

PHYLOGENETICS DANCING!

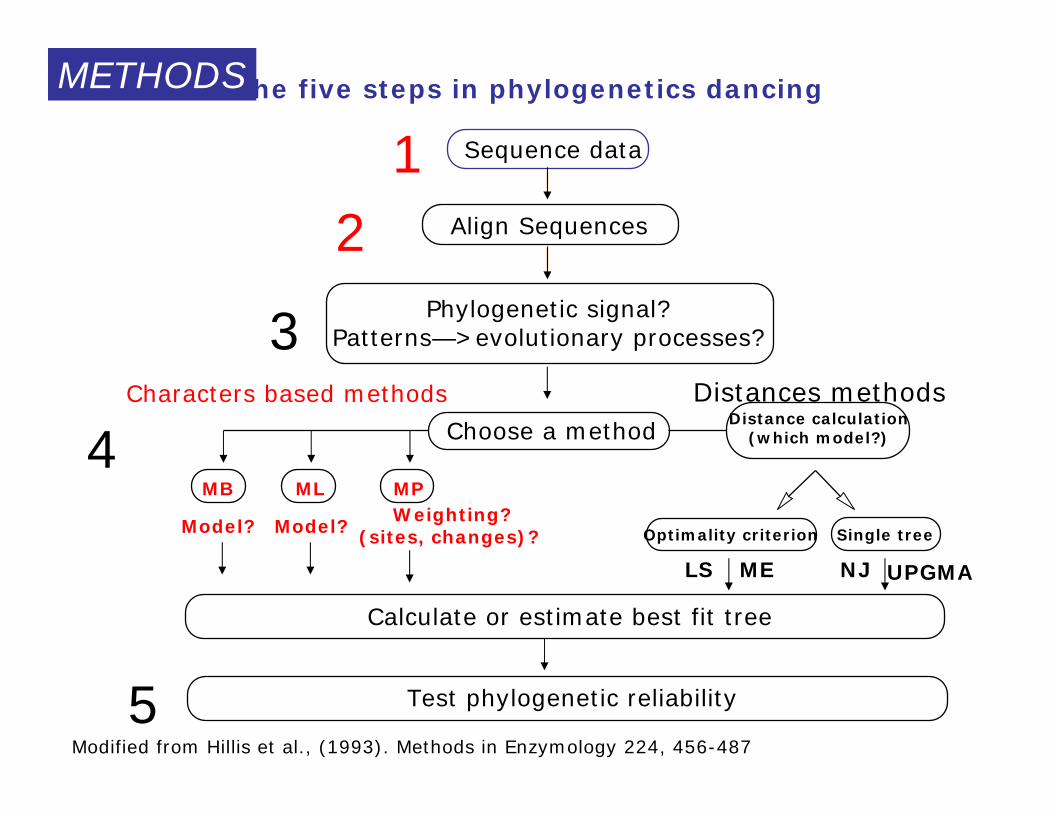
The five steps in phylogenetics dancing
Modified from Hillis et al., (1993). Methods in Enzymology 224, 456-487
12
3
4
5
Sequence data
Align Sequences
Phylogenetic signal?Patterns—>evolutionary processes?
Test phylogenetic reliability
Distance methods
Choose a method
MB ML
Characters based methods
Single treeOptimality criterion
Calculate or estimate best fit tree
LS ME NJ
Distance calculation(which model?)
Model?
MP
Wheighting?(sites, changes)?
Model?
UPGMA

QUERYQUERYSEQUENCESEQUENCE
Sequences Sequences retrievalretrieval
Related proteinsRelated proteins(alignment)(alignment)
rabrab (M. (M. musculusmusculus))
rabrab (C. (C. eleganselegans))
rabrab (H. (H. sapiens)sapiens)
rasras (H. (H. sapiens)sapiens)
rasras (M. (M. musculusmusculus))
rasras (C. (C. eleganselegans))
ras2 (H. sapiens)ras2 (H. sapiens)
HomologousHomologoussequencessequences
Function?Function?
by F, Abascal
SEARCHING DB

The five steps in phylogenetics dancing
Modified from Hillis et al., (1993). Methods in Enzymology 224, 456-487
12
3
4
5
Sequence data
Align Sequences
Phylogenetic signal?Patterns—>evolutionary processes?
Test phylogenetic reliability
Distances methodsChoose a method
MB ML
Characters based methods
Single treeOptimality criterion
Calculate or estimate best fit tree
LS ME NJ
Distance calculation(which model?)
Model?
MPWeighting?
(sites, changes)?Model?
UPGMA
SEARCHING DB

SEARCHING THE DATABASES
SearchingSearching : FASTA: FASTA(Lipman & Pearson, 1985, Pearson & Lipman 1988)
Basic Local Alignment Search Tool (BLAST)Basic Local Alignment Search Tool (BLAST)AltschulAltschul, S.F., , S.F., GishGish W., Miller W., Myers E.W., and W., Miller W., Myers E.W., and LipmanLipman D.J.D.J.J. J. MolMol. Biol. (1990) 215:403. Biol. (1990) 215:403--10.10.
PairwisePairwise
ProfileProfile
PSI-BLAST:
Iterative search
USE of point position specific matrices.
Use the matrix to search again!
Altschul, S.F., Madden T.L., Schaffer A.A., Zhanng J., Zhang Z., Miller W., and Lipman D.JNucleid Acids Research (1997) v.25, n.17 3389-3402
SEARCHING DB

WHY SEARCHING THE DATABASES?WeWe wantwant toto obtainobtain allall thethe sequencessequences relatedrelated toto ourour queryquery!!
OKAY, OKAY, butbut whichwhich kindkind ofof sequencessequences??
AmAm I I lookinglooking forfor distantdistant homologshomologs??
AmAm I I lookinglooking forfor clearclear orthologsorthologs?? FASTA, BLAST
PSI-BLAST
HowHow manymany sequencessequences shouldshould I use?I use? WellWell dependsdepends::RuleRule ofof thethe thumbthumb::
GetGet a a representativerepresentative setset ofof youryour sequencessequences,,removeremove redundancyredundancy atat letslets saysay 80%!80%!
SEARCHING DB

The five steps in phylogenetics dancing
Modified from Hillis et al., (1993). Methods in Enzymology 224, 456-487
12
3
4
5
Sequence data
Align Sequences
Phylogenetic signal?Patterns—>evolutionary processes?
Test phylogenetic reliability
Distances methodsChoose a method
MB ML
Characters based methods
Single treeOptimality criterion
Calculate or estimate best fit tree
LS ME NJ
Distance calculation(which model?)
Model?
MP
Weighting?(sites, changes)?
Model?
UPGMA
ALIGNING DB

ALIGNING THE SEQUENCESWeWe wantwant toto alignalign allall thethe sequencessequences obtainedobtained viavia searchingsearching thethedatabasesdatabases..
AlignmentAlignment qualityquality isis CRUCIALCRUCIAL==> > badbad alignment=badalignment=bad treetree!!!!!!!!
METHODS:METHODS:
GreedyGreedy approachesapproaches: : ProgressiveProgressive alignmentalignment ((FengFeng & & DoolittleDoolittle, , 19871987--96)96)
PILEUP,PILEUP, ClustalWClustalW ((improvedimproved thethe ProgressiveProgressive alignmentalignment)) .... Too Too greedygreedy! ! poorpoor whenwhen %id%id <30%<30%
••ThenThen thethe real real improvementsimprovements: :
TT--COFFEECOFFEE ((NotredameNotredame et al, 2000): et al, 2000): incorporatesincorporates local local andandglobal global informationinformation!!
ProbConProbCons(Dos(Do, CB, et al, 2005): , CB, et al, 2005): likelike TT--CoffeeCoffee withwithprobabilisticprobabilistic estimationsestimations!!
ALIGNING DB

WHAT CAN I LEARN FROM MY ALIGNMENT?WHAT CAN I LEARN FROM MY ALIGNMENT?
Correlated mutationsTree-determinant conserv
ALIGNING DB

H(n) = p(x1, x2,...., xn)log p(x1, x2,...,xn)p(xi)
i=1
n
∏x1,x2,...,xn∑Relative entropy cut,del Sol, Valencia 2002
Del Sol, Pazos, Valencia JMB 03
Mutational behaviourPazos Valencia, 2001
Pazos, Valencia 2003
Romero, Valencia 04
Casari, Sander, Valencia Nature Str. Biol. 95
ALIGNING DB

The five steps in phylogenetics dancing
Modified from Hillis et al., (1993). Methods in Enzymology 224, 456-487
12
3
4
5
Sequence data
Align Sequences
Phylogenetic signal?Patterns—>evolutionary processes?
Test phylogenetic reliability
Distance methodsChoose a method
MB ML
Characters based methods
Single treeOptimality criterion
Calculate or estimate best fit tree
LS ME NJ
Distance calculation(which model?)
Model?
MPWheighting?
(sites, changes)?Model?
UPGMA
METHODS

• Distance Estimates attempt to estimate the mean number of changes per site since 2 species (sequences) split from each other.
• Simply counting the number of differences (pdistance) may underestimate the amount of change - especially if the sequences are very dissimilar - because of multiple hits.
• We therefore use a model which includes parameters which reflect how we think sequences may have evolved.
Distance MethodsMETHODS

Transitions: changes between Pyrsor purs.
Tranversions: changes betweenPyrs AND purs (2X more frequent*)
AAGGTTTGCCTA||||||||||||TTCCAAACGGAT
Inversion: 180 rotation ds-DNA (more than 2 bases)
AAGGCAAACCTA||||||||||||TTCCGTTTGGAT
C G
T A
Pyr Pur

(from Fundamentals of Molecular Evolution, Wen-Hsiung Li and Dan Graur, 1991)
12 mutationsacumulated
Only 3 detected!

1 2 obs real substitution:
A A A A 0 0 no
A A A C 1 1 simple
A C A G 1 2 coincidence
A A A C G 1 2 multiple
A C A C 0 2 paralell
A C A G C 0 3 convergent
A A A C A 0 2 reverse
Distances: observed and real
METHODS
Obs might be <<<< Real changes!
ancestral

Distance calculations
• SEQ1 ACGTACGTAA• SEQ2 ACGTTCGTAT• SEQ3 TCCATCGTAA
Similarity Distance(1-2) 80% 1-0.8=0.2(1-3) 60% 1-0.6=0.4(2-3) 60% 1-0.6=0.4
00.40.4S300.2S2
0S1S3S2S1

• Saturation is due to multiple changes at the same site subsequent to lineage splitting.
• Most data will contain some fast evolving sites which are potentially saturated (e.g. in proteins often position 3).
• In severe cases the data becomes essentially random and all information about relationships can be lost
Saturation in sequence data:
METHODS

Multiple changes at a single site -hidden changes
C AC G T A
1 2 3
1
Seq 1
Seq 2
Number of changes
Seq 1 AGCGAGSeq 2 GCGGAC
METHODS

time
Observed
Substitution numbers
METHODS

The simplest model is that of Jukes & Cantor:
dxy = -(3/4) Ln (1-4/3 D)• dxy = distance between sequence x and sequence y expressed as
the number of changes per site.
• (note dxy = r/n where r is number of replacements and n is the totalnumber of sites. This assumes all sites can vary and when unvaried sites are present in two sequences it will underestimate the amount of change which has occurred at variable sites).
• D = is the observed proportion of nucleotides which differ between two sequences (fractional dissimilarity).
• Ln = natural log function to correct for superimposed substitutions.
• The 3/4 and 4/3 terms reflect that there are four types of nucleotides and three ways in which a second nucleotide may not match a first - with all types of change being equally likely (i.e. unrelated sequences should be 25% identical by chance alone).
METHODS

The natural logarithm Ln is used to correct for superimposed changes at the
same site• If two sequences are 95% identica, they are different at 5% or
0.05 (D) of sites thus: – dxy = -3/4 Ln (1-4/3 0.05) = 0.0517
• Note that the observed dissimilarity 0.05 increases only slightly to an estimated 0.0517 - this makes sense because in two very similar sequences one would expect very few changes to have been superimposed at the same site in the short time since the sequences diverged apart
• However, if two sequences are only 50% identical they are different at 50% or 0.50 (D) of sites thus:
– dxy = -3/4 ln (1-4/3 0.5) = 0.824• For dissimilar sequences, which may diverged apart a long time
ago, the use of Ln infers that a much larger number of superimposed changes have occurred at the same site
METHODS
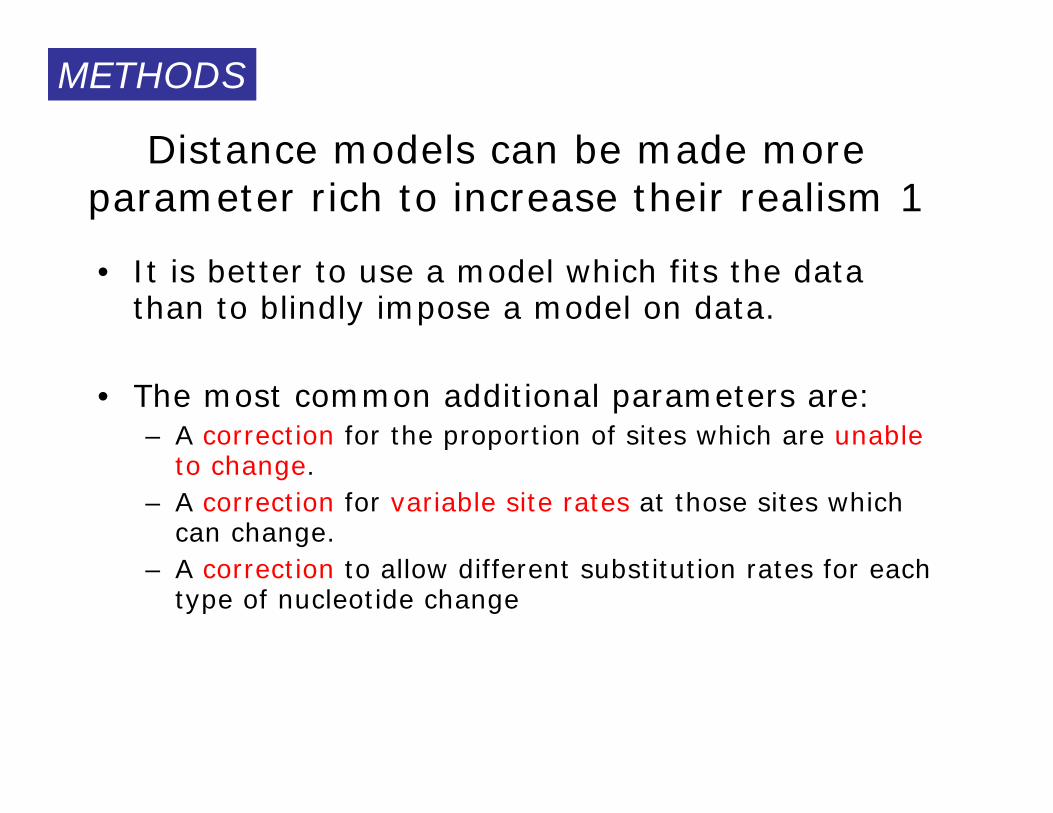
Distance models can be made more parameter rich to increase their realism 1
• It is better to use a model which fits the data than to blindly impose a model on data.
• The most common additional parameters are:– A correction for the proportion of sites which are unable
to change.– A correction for variable site rates at those sites which
can change. – A correction to allow different substitution rates for each
type of nucleotide change
METHODS

A gamma distribution can be used to model site rate
heterogeneity
METHODS

• Fast - suitable for analysing data sets which are too large for ML.
• A large number of models are available with many parameters -improves estimation of distances.
• Use ML to test the fit of model to data.
Distances: advantages:
METHODS

Obtaining a tree using pairwisedistances
Additive distances:• If we could determine exactly the true
evolutionary distance implied by a given amount of observed sequence change, between each pair of taxaunder study, these distances would have the useful property of tree additivity
METHODS

A perfectly additive tree
A B C DA - 0.4 0.4 0.8B 0.4 - 0.6 1.0C 0.4 0.6 - 0.8D 0.8 1.0 0.8 -
A
B
C
D
0.1
0.10.3
0.6
0.2
The branch lengths in the matrix and the tree path lengths match perfectly - there is a single unique
additive tree
METHODS

Distance estimates may not make an additive tree
Thermus
Deinococc
ruber
Bacillus
Aquifex
0.0560.017
0.145
0.079
0.057
0.119
0.217
Jukes-Cantor distance matrixProportion of sites assumed to be invariable = 0.56;identical sites removed proportionally to base frequencies estimated from constant sites only
1 2 4 5 61 ruber -2 Aquifex 0.38745 -4 Deinococc 0.22455 0.47540 -5 Thermus 0.13415 0.27313 0.23615 -6 Bacillus 0.27111 0.33595 0.28017 0.28846 -
Aquifex > Bacillus (0.335)
Aquifex > Thermus(0.33)
Thermus > Deinococcus(0.218)
Some path lengths are longer and others shorter than appear in the matrix
METHODS

Obtaining a tree using pairwisedistances
• Stochastic errors will cause deviation of the estimated distances from perfect tree additivityeven when evolution proceeds exactly according to the distance model used.
• Poor estimates obtained using an inappropriate model will compound the problem.
• How can we identify the tree which best fits the experimental data from the many possible trees.
METHODS

Obtaining a tree using pairwise distances• We have uncertain data that we want to fit to a
tree and find the optimal value for the adjustable parameters (branching pattern and branch lengths).
• Use statistics to evaluate the fit of tree to the data (goodness of fit measures)– Fitch Margoliash method - a least squares method
– Minimum evolution method - minimises length of tree
• Note that neighbor joining while fast does notevaluate the fit of the data to the tree.
METHODS

• Minimises the weighted squared deviation of the tree path length distances from the distance estimates.
Fitch Margoliash Method 1968:
METHODS

Thermus
Deinococc
ruber
Bacillus
Aquifex
0.0590.006
0.148
0.077
0.051
0.129
0.207
Deinococc
Thermusruber
Bacillus
Aquifex
0.139
0.0230.0580.076
0.0400.132
0.204
Optimality criterion = distance (weighted least squares with power=2)Score of best tree(s) found = 0.12243 (average %SD = 11.663)Tree # 1 2Wtd. S.S. 0.13817 0.12243APSD 12.391 11.663
Tree 2 - best
Tree 1
Fitch Margoliash Method 1968:METHODS
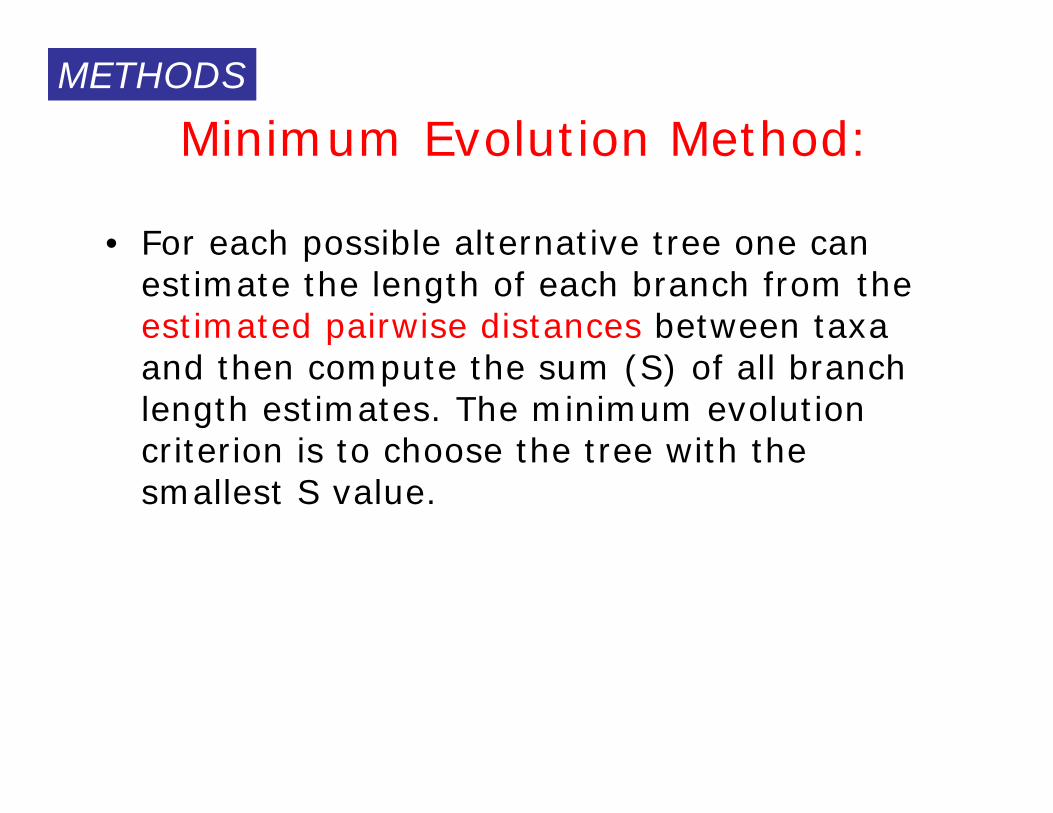
Minimum Evolution Method:
• For each possible alternative tree one can estimate the length of each branch from the estimated pairwise distances between taxaand then compute the sum (S) of all branch length estimates. The minimum evolution criterion is to choose the tree with the smallest S value.
METHODS

Tree 2
Tree 1 - best
Minimum Evolution
Optimality criterion = distance (minimum evolution)Score of best tree(s) found = 0.68998
Tree # 1 2ME-score 0.68998 0.69163
Thermus
Deinococc
ruber
Bacillus
Aquifex
0.0560.017
0.145
0.079
0.057
0.119
0.217
Deinococc
Thermusruber
Bacillus
Aquifex
0.152
0.0120.0530.081
0.0580.119
0.217
METHODS

Neighbor joining method
•The neighbor joining method is a greedy heuristic which joins at each step, the two closest sub-trees that are not already joined.•It is based on the minimum evolution principle.•One of the important concepts in the NJ method is neighbors, which are defined as two taxa that are connected by a single node in an unrooted tree
A B
Node 1
METHODS

PAM Spinach Rice Mosquito Monkey Human Spinach 0.0 84.9 105.6 90.8 86.3 Rice 84.9 0.0 117.8 122.4 122.6 Mosquito 105.6 117.8 0.0 84.7 80.8 Monkey 90.8 122.4 84.7 0.0 3.3 Human 86.3 122.6 80.8 3.3 0.0
What is required for the Neighbour joining method?
Distance matrix
Distance MatrixMETHODS

PAM distance 3.3 (Human - Monkey) is the minimum. So we'll join Human and Monkey to MonHum and we'll calculate the new distances.
Mon-Hum
MonkeyHumanSpinachMosquito Rice
First StepMETHODS

After we have joined two species in a subtree we have to compute the distances from every other node to the new subtree. We do this with a simple average of distances:Dist[Spinach, MonHum]
= (Dist[Spinach, Monkey] + Dist[Spinach, Human])/2 = (90.8 + 86.3)/2 = 88.55
Mon-Hum
MonkeyHumanSpinach
Calculation of New DistancesMETHODS

PAM SpinRice MosMonHum Spinach 0.0 108.7 MosMonHum 108.7 0.0
HumanMosquito
Mon-Hum
MonkeySpinachRice
Mos-(Mon-Hum)Spin-Rice
(Spin-Rice)-(Mos-(Mon-Hum))
Last JoiningMETHODS

Human
Monkey
MosquitoRice
Spinach
Unrooted Neighbor-Joining Tree
METHODS
The five steps in phylogenetics dancing
Modified from Hillis et al., (1993). Methods in Enzymology 224, 456-487
12
3
4
5
Sequence data
Align Sequences
Phylogenetic signal?Patterns—>evolutionary processes?
Test phylogenetic reliability
Distances methodsChoose a method
MB ML
Characters based methods
Single treeOptimality criterion
Calculate or estimate best fit tree
LS ME NJ
Distance calculation(which model?)
Model?
MPWeighting?
(sites, changes)? Model?
UPGMA
METHODS

ML: comparison with other methods.
• ML is similar to many other methods in many ways
• In many ways it is fundamentally different.
• ML assumes a model of sequence evolution (so does Maximum Parsimony and so do distance matrix methods).
• ML attempts to answer the question: What is the probability that I would observe these data (a multiple sequence alignment), given a particular model of evolution (a tree and a process).
METHODS

Maximum Likelihood - goal
• To estimate the probability that we would observe a particular dataset, given a phylogenetic tree and some notion of how the evolutionary process worked over time.
– P(D/H)
Probability of given
a b c db a e fc e a gd c f a
⎧
⎨ ⎪ ⎪
⎩
⎪ ⎪
⎫
⎬ ⎪ ⎪
⎭
⎪ ⎪
π = a ,c,g,t[ ]
METHODS

The model
• The two parts of the model are the tree and the process (the model).
• The model is composed of the composition and the substitution process -rate of change from one character state to another character state.
a b c db a e fc e a gd c f a
⎧
⎨ ⎪ ⎪
⎩
⎪ ⎪
⎫
⎬ ⎪ ⎪
⎭
⎪ ⎪
π = a ,c,g,t[ ]+Model =
METHODS

Does changing a model affect the outcome?
There are different modelsJukes and Cantor (JC69):
All base compositions equal (0.25 each), rate of change from one base to another is the same
Kimura 2-Parameter (K2P):All base compositions equal (0.25 each), different substitution rate for transitions and transversions).
Hasegawa-Kishino-Yano (HKY):Like the K2P, but with base composition free to vary.
General Time Reversible (GTR):Base composition free to vary, all possible substitutions can differ.
All these models can be extended to accommodate invariable sitesand site-to-site rate variation.
METHODS

Strengths of ML• Does not try to make an observation of sequence change and
then a correction for superimposed substitutions. There is no need to ‘correct’ for anything, the models take care of superimposed substitutions.
• Accurate branch lengths.
• Each site has a likelihood.
• If the model is correct, we should retrieve the correct tree*.
• You can use a model that fits the data.
• ML uses all the data (no selection of sites based on informativeness, all sites are informative).
• ML can not only tell you about the phylogeny of the sequences, but also the process of evolution that led to the observations of today’s sequences.
*If we have long-enough sequences and a sophisticated-enough model.
METHODS

Weaknesses of ML
• Can be inconsistent if we use models that are not accurate.
• Model might not be sophisticated enough (you can ‘max-out’ on models).
• Very computationally-intensive. Might not be possible to examine all models (substitution matrices, tree topologies, etc.).
METHODS

Parsimony Analysis
• Given a set of characters, such as aligned sequences, parsimony analysis works by determining the fit(number of steps) of each character on a given tree
• The sum over all characters is called Tree Length– Most parsimonious trees (MPTs) have the minimum tree length needed to explain the observed distributions of all the characters
METHODS

Results of parsimony analysis
• One or more most parsimonious trees.
• Hypotheses of character evolution associated with each tree (where and how changes have occurred).
• Branch lengths (amounts of change associated with branches).
• Various tree and character statistics describing the fit between tree and data.
• Suboptimal trees – optional.
METHODS

Parsimony - advantages
• is a simple method - easily understood operation.
• does not seem to depend on an explicit model of evolution.
• gives both trees and associated hypotheses of character Evolution.
• should give reliable results if the data is well structured and homoplasy is either rare or widely (randomly) distributed on the tree.
METHODS

Parsimony - disadvantages• May give misleading results if homoplasy is common or concentrated in particular parts of the tree, e.g:
- thermophilic convergence- base composition biases- long branch attraction
• Underestimates branch lengths.
• Model of evolution is implicit - behaviour of method not well Understood.
• Parsimony often justified on purely philosophical grounds –we must prefer simplest hypotheses - particularly by Morphologists.
• For most molecular systematists this is uncompelling
METHODS

Parsimony can be inconsistent• Felsenstein (1978) developed a simple model phylogeny including four taxaand a mixture of short and long branches.• Under this model parsimony will give the wrong tree
• With more data the certainty that parsimony will give the wrongtree increases ‐ so that parsimony is statistically inconsistent.
• Advocates of parsimony initially responded by claiming that Felsenstein’sresult showed only that his model was unrealistic.
• tis now recognised that the long‐branch attraction (in the Felsenstein Zone) is one of the most serious problems in phylogenetic inference
Long branches are attracted but the similarity is homoplastic
METHODS
A
DC
B
p
q q
pq
A
B
C
D
Rates orbranch lenghtsp>>>q
Wrong!

Bayesian Inference of Phylogeny
• Clustering methods; UPGMA, NJ• Parsimony: minimization of cost• Statistical approaches
–Maximum Likelihood–Bayesian Inference
METHODS

Statistical methods• Maximum likelihood
– Standard statistical approach– Philosophy widely accepted– Computationally difficult, especially for confidence intervals
• Bayesian inference– Old but marginal statistical approach until recently
– Philosophy controversial (subjective probability)– Computationally efficient numerical solutions to difficult, high‐dimensional problems
METHODS

Infer relationships among three species:
Outgroup:
METHODS

Three possible trees (topologies):
A
B
C
METHODS

Bayes’ ruleMETHODS

Bayes’ theorem
∫=
θθθθθθ
dXlpXlpXf
)|()()|()()|(
Posteriordistribution
Prior distribution
Likelihood function
Pr [TreePr [Tree//Data] Data] == ((Pr [Tree] Pr [Tree] xx Pr [DataPr [Data//Tree])Tree]) / / Pr [Data]Pr [Data]))
Unconditional probab.
METHODS

A B C
Prior probabilitydistributionp
robab
ility 1.0
Posterior probabilitydistributionp
robab
ility 1.0
Data (observations)
METHODS

Model: tree and branch lengths
θ Parameters
topology (branching order)
)(τ
branch lengths )( iv
A
B
3vC
D2v
1v4v5v
(expected amount of change per site or character)
),( vτθ =
METHODS

Data
X The dataTaxon Characters
A ACG TTA TTA AAT TGT CCT CTT TTC AGA
B ACG TGT TTC GAT CGT CCT CTT TTC AGA
C ACG TGT TTA GAC CGA CCT CGG TTA AGG
D ACA GGA TTA GAT CGT CCG CTT TTC AGA
METHODS

Markov Chain Monte Carlo (MCMC)
parameter space
pro
bab
ility
)|()( θθ Xlp
θ
METHODS

Model parameters 1
A
B
topology General Time Reversiblesubstitution model
)(τ
⎟⎟⎟⎟⎟
⎠
⎞
⎜⎜⎜⎜⎜
⎝
⎛
−−
−−
=
GTGCTCATA
GTTCGCAGA
CTTCGGACA
ATTAGGACC
rrrrrrrrrrrr
Q
ππππππππππππ
3vC
D
2v
1v4v5v
branch lengths )( iv
METHODS

Model parameters 2
Gamma-shaped rate variation across sites
METHODS

METHODS

burn-in
stationary phase sampled with thinning(rapid mixing essential)
METHODS

Majority rule consensus tree from an MCMC run(insect 18S data, GTR + G)
Frequencies represent the posterior probability of the clades
Probability of clade being true given data and model
METHODS
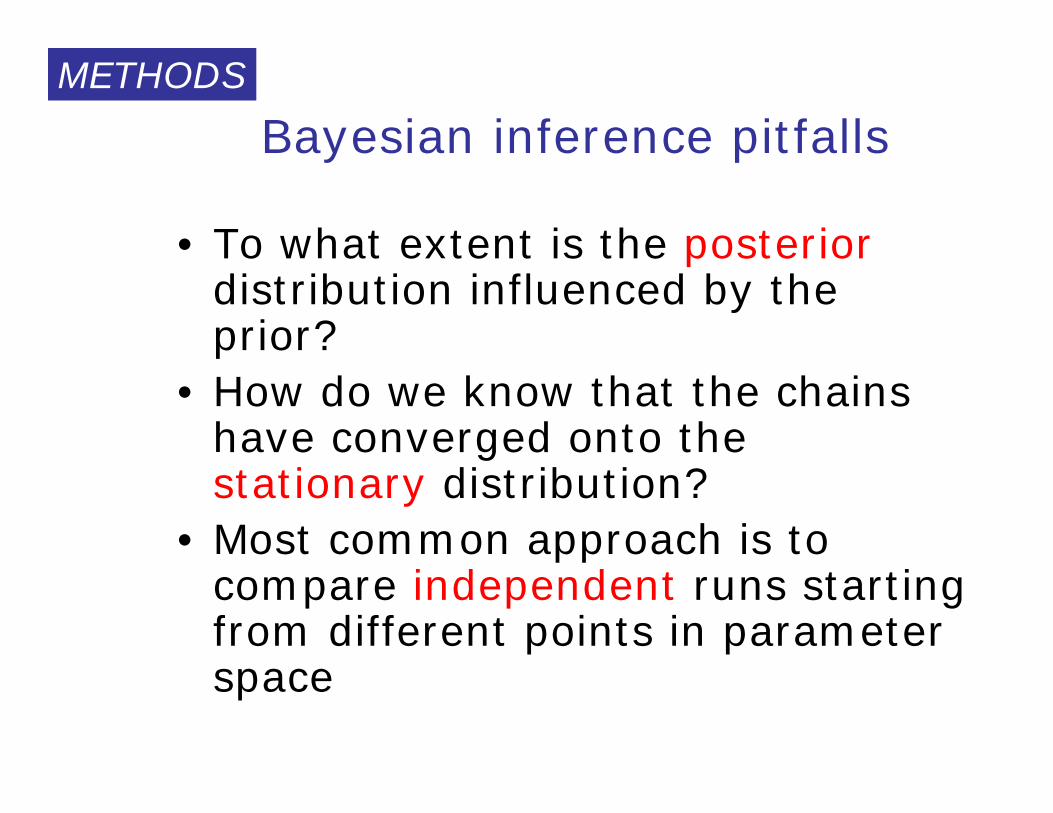
Bayesian inference pitfalls
• To what extent is the posteriordistribution influenced by the prior?
• How do we know that the chains have converged onto the stationary distribution?
• Most common approach is to compare independent runs starting from different points in parameter space
METHODS

PROGRAMS:ML:PAUP: http://paup.csit.fsu.edu/about.html David Swofford. (U-L,M,W)
UNIX,MAC,WindowsPAML: http://abacus.gene.ucl.ac.uk/software/paml.html Ziheng Yang (U-L,M)PHYLIP: http://evolution.genetics.washington.edu/phylip.html Joe FelsensteinMOLPHY: Jun Adachi and Massami Hasegawa (Pascal)PASSML: Pietro Lio (Hidden Markov) (U)
MB:BAMBE: http://www.mathcs.duq.edu/larget/bambe.html Donald Simon & B. Larget UNIX, WindowsMac5: http://www.agapow.net/software/mac5/ Paul-Michael Agapow
UNIX,Windows,MAC
OTHERS!
Check out the list of Joe Felsenstein!
http://evolution.genetics.washington.edu/phylip/software.html
MEGA2: http://www.megasoftware.net/ Kumar et al. DOS/Windows
PROGRAMS

PROGRAMS

PHYLIP
http://evolution.genetics.washington.edu/phylip.htmlDNA
DNAPARS. Estimates phylogenies by theparsimony method using nucleic acid sequences.
DNAMOVE. Interactive construction ofphylogenies from nucleic acid sequences, withtheir evaluation by parsimony and compatibility
DNAPENNY. Finds all most parsimoniousphylogenies for nucleic acid sequences by branch-and-bound search.
DNACOMP. Estimates phylogenies from nucleicacid sequence data using the compatibilitycriterion,
DNAINVAR. For nucleic acid sequence data onfour species, computes Lake's and Cavender'sphylogenetic invariants,
DNAML. Estimates phylogenies from nucleotidesequences by maximum likelihood.
DNAMLK. Same as DNAML but assumes a molecular clock.
DNADIST. Computes four different distancesbetween species from nucleic acid sequences.
Proteins
PROTPARS. Estimatesphylogenies from proteinsequences using the parsimonymethod.
PROTDIST. Computes a distance measure for proteinsequences
Restriction
RESTML. Estimation ofphylogenies by maximumlikelihood usingrestriction sites data
FITCH. Estimates phylogenies from distancematrix data under the "additive tree model".
KITSCH. Estimates phylogenies fromdistance matrix data under the "ultrametric" model.
NEIGHBOR. An implementation of Saitouand Nei's "Neighbor Joining Method," and ofthe UPGMA (Average Linkage clustering) method.
Continuous
CONTML. Estimates phylogenies fromgene frequency data by maximumlikelihood.
GENDIST. Computes one of threedifferent genetic distance formulas fromgene frequency data.
Discrete characters
MIX. Wagner parsimony method andCamin-Sokal parsimony method,
MOVE. Interactive construction ofphylogenies from discrete characterEvaluates parsimony and compatibilitycriteria.
PENNY. Finds all most parsimoniousphylogenies
DOLLOP. Estimates phylogenies by theDollo or polymorphism parsimony criteria.
DOLMOVE. Interactive DOLLOP.
DOLPENNY. branch-and-bound method
CLIQUE. Finds the largest clique ofmutually compatible characters,
SEQBOOT. Reads in a data set, andproduces multiple data sets from it by bootstrap resampling..
CONSENSE. Computes consensus trees by the majority-rule consensus tree method,
.....
.....
PROGRAMS

PROGRAMS

TOOL: MR. BAYES
Model for aa replacement: Jones.Number of markov chains: 4Number of generations: >900.000Number ot trees generated: 1 tree each 100 generations.Only trees generated after likelihood convergence are sampled(usually I discard 20% of the initial trees).
Based on concept of posterior probabilities: probabilities that are estimated, based on some models (prior expectations), after learning something about the data (Mau et al., 1999).The user postulates a model of evolution, and the program searches for the best trees consistent with both the model, and the data (aln)Method: Metropolis-coupled Markov Chain Monte Carlo: is a set of independentsearches that ocassionally exchanges information.
PROGRAMS

Execute a file of specific format!
http://morphbank.ebc.uu.se/mrbayes3/info.php John Huelsenbeck & FredrikRonquist.
Linusx, windows, mac…
PROGRAMS

PROGRAMS

THE PROBLEM OF THE EUKARYA LINEAGE
DOMAIN SHUFFLING
REMARKS

WHAT TO DO THEN?
DOMAIN ANALYSES
CHECK CONSISTENCY BETWEEN DOMAIN DISTRIBUTIONAND PHYLOGENETIC DISTRIBUTION
CHECK IF SHUFFLING IS RECENT OR OLD…
REMARKS

PAAD ?
PAAD
? CARD
CARD
CARD CARD
NAC
NALP2
MATER
CARD4
NOD2
NAIP
COS1.5
CLAN
NACHT LRR’S
LRR’S
LRR’S
LRR’S
LRR’SNACHT
NACHT
NACHT
NACHT
?
CARD
LRR’S
LRR’S
LRR’S
NACHT
NACHT
NACHT
?
BIR BIRBIR BIR
DOMAIN ARCHITECTURESREMARKS

NB-arcTIR
PAAD
NACHT LIKE*
NB-arc
NACHT SPRY
NACHT LRR
PAAD NACHT LRR
NACHT LRR
PAAD NACHT LRR
Bacteria (anabaena)
PLANTS
FUNGI INVERT
Mm FuguHs
NACHT LRRCARDNACHT LRRCARD NACHT LRRCARD
8
NB-arc WD
CARD
NACHT DISTRIBUTION: POSSIBLE SCENARIO
REMARKS

SOME PRACTICAL EXAMPLES
•DESCRIPTION OF NEW SPECIESErwinia toletana sp. nov.
•PLACEMENT OF NEW ISOLATED GENESOcurrence of serin proteases in sponge andjellyfish
SOME EXAMPLES

•DESCRIPTION OF NEW SPECIES
Data: Bacterial species isolated from wild trees’ knots (Olives, oleander…)
total of 81 bacterial strains!
(Rojas et al, 2004 IJESM)
Goal: to obtain a natural antagonist of P. savastanoi.
SOME EXAMPLES

What to do?:
•Choose an universal conserved marker: i.e. 16SRNA, Extract similar sequencesBuild phylogenetic trees
The problem: Resemble phenotypically to several…
Gene sequencing:16SRNA, 23SRNA, gnd, mdh
WHY THESE GENES? ?????????
SOME EXAMPLES
(Rojas et al, 2004 IJESM)

METHOD FOR 16SRNAFrom 81 sequences only the longest retained (61)
stand-alone blasted against a filtered EMBL DB
A total of 19,184 sequences retained (from 80,807 initial sequences). .
The 2 most similar are retained to phylogenetic tree reconstructio
81
61
Parsimony Maximum likelihood BioNJ 1000 boostrap
CONSENSUS!
SOME EXAMPLES
(Rojas et al, 2004 IJESM)

SOME EXAMPLES
(Rojas et al, 2004 IJESM)

SOME EXAMPLES
(Rojas et al, 2004 IJESM)

•PLACEMENT OF NEW ISOLATED GENESOcurrence of serin proteases in sponge andjellyfish
(Rojas & Doolittle, 2002, JME)
Data: SP are absent in plants, and protists and in fungiare restricted to Streptomyces. However, there arehundreds in animals!
Goal: Confirm the existence of serin proteases in early-divergent phyla, cnidaria and porifera.Where they come from?
SOME EXAMPLES

(Rojas & Doolittle, 2002, JME)

*
*
*
SOME EXAMPLES
(Rojas & Doolittle, 2002, JME)

SOME EXAMPLES
DIGESTIVE
NON DIGESTIVE
(Rojas & Doolittle, 2002, JME)

SOME EXAMPLES
DIGESTIVE
NON DIGESTIVE
(Rojas & Doolittle, 2002, JME)

SOME EXAMPLESWHICH ONE IS THE REAL ONE?WHAT IS THE ORIGIN OF THE CHYMOTRYPSIN FAMILY?
ADDITIONAL INFORMATION:
•Sponge has a D189 diagnostic for trypsin (Hannenshalli & Russell, 2000)Jelly has N189.
•Codon for Serine at the active site:sponge signature for trypsin: TCTjelly: AGT,AGC
•When blasted against NR:sponge 48% with arthropod trypsinjelly 36% with RAT elastase
Disulfide bonds:sponge 5 disulfide bonds and cys match with chymotrypsin-elastase (first tree)
Jelly has digestive system with organs, sponge are loose cells.
(Rojas & Doolittle, 2002, JME)

SOME EXAMPLES
DIGESTIVE(Rojas & Doolittle, 2002, JME)

WHY THE FUNGAL ONES CLADE WITH ANIMALS?
H.G.T!
SCENARIO1
Plants andall fungi-exceptStreptomyceslost it!
Fungi should bemore similar to jelly and sponge
SCENARIO1
then Plants andall fungi never had it.They appeared whendigestion was invented.Fungi have thembecause HGT in both directions.
Plants
FungiAnimalsInvert
AnimalsVert
SOME EXAMPLES
(Rojas & Doolittle, 2002, JME)

THANK YOU!!
Acknowledgements:
Frederik Ronquist for slides I borrowed