Embed Size (px)
Citation preview

Evolutionary Computation and Evolutionary Computation and Complex NetworksComplex Networks
Jing Liu
http://see.xidian.edu.cn/faculty/liujing
Xidian University, China
Hefei, China 5 June 2014
Outline
Evolutionary Computation
Complex Networks
11
22
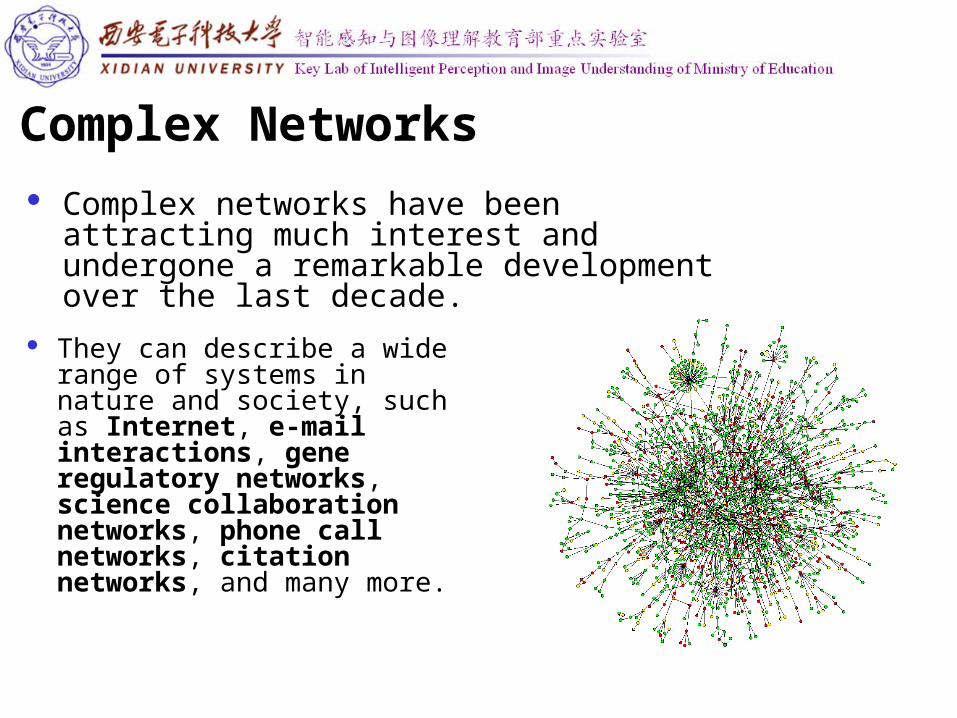
Complex Networks Complex networks have been attracting much
interest and undergone a remarkable development over the last decade.
They can describe a wide range of systems in nature and society, such as Internet, e-mail interactions, gene regulatory networks, science collaboration networks, phone call networks, citation networks, and many more.
Most of the work in complex networks has concentrated on two aspects:
Properties found in real-world networks----“What do real-world networks look like?” The available work in this aspect has focused on a small number of properties that appear to be common to many networks. These properties can be expected to affect the functioning of networked systems in a fundamental way.
Models to build understanding about the emergence of
these properties---- “How can we generate synthetic, but realistic looking networks?”
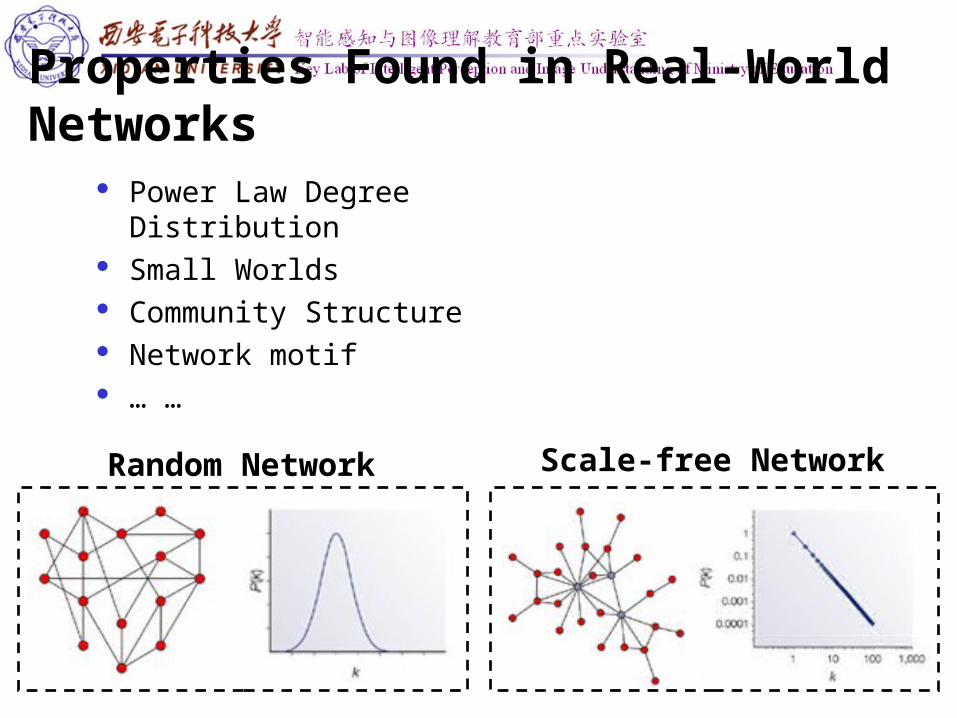
Properties Found in Real-World Networks Power Law Degree Distribution Small Worlds Community Structure Network motif … …
Random Network Scale-free Network
Evolutionary Algorithms Evolutionary algorithms (EAs) are a kind of stochastic global
optimization methods inspired by the biological mechanism of evolution and heredity, and have been successfully used to solve various problems.
Population Fitness function Evolutionary operators Selection mechanism
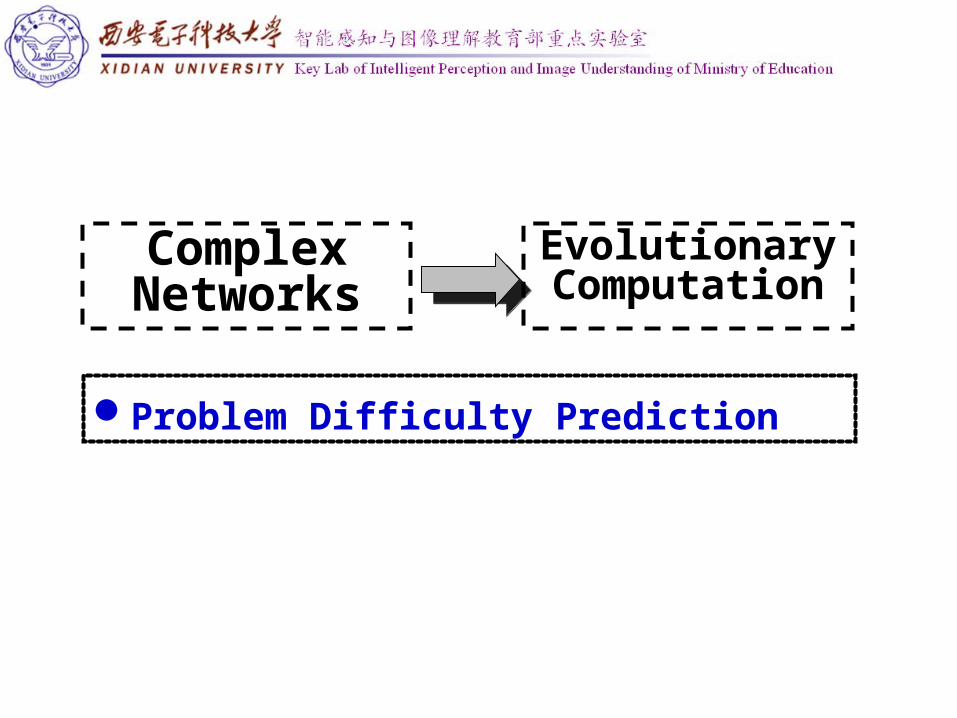
Evolutionary Computation
Complex Networks
Problem Difficulty Prediction
Problem Difficulty Prediction
Objective: To characterize which fitness function are easy for a
given evolutionary algorithm and which are not.
Condition: Predict the performance without actually running the
algorithms.
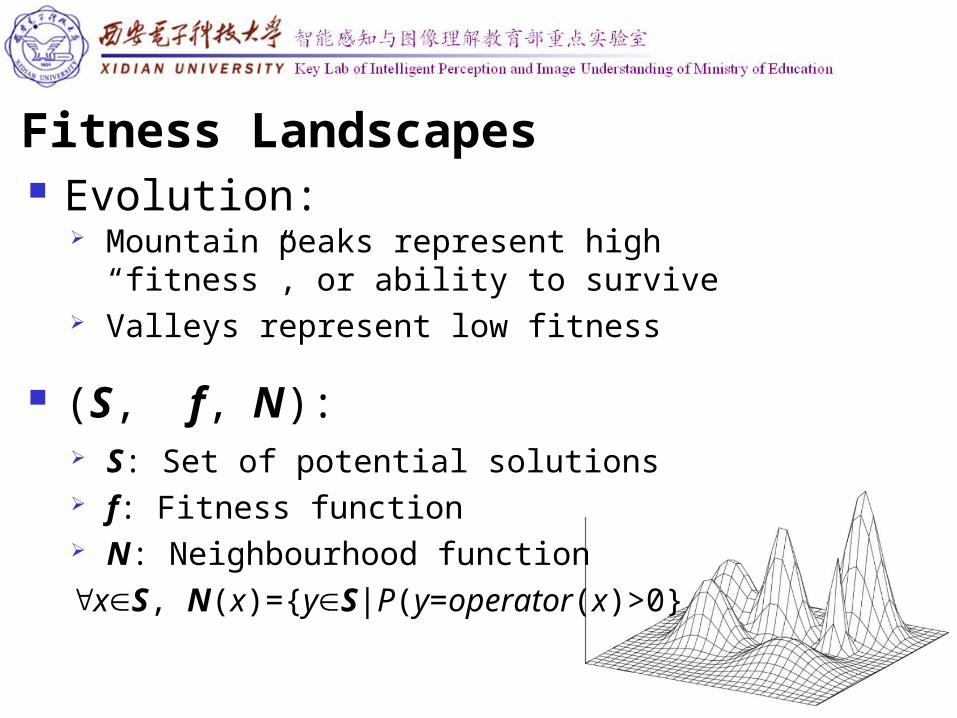
Mountain peaks represent high “fitness”, or ability to survive
Valleys represent low fitness
Fitness Landscapes Evolution:
(S, f, N): S: Set of potential solutions f: Fitness function N: Neighbourhood function
xS, N(x)={yS|P(y=operator(x)>0}

Fitness Distance Correlation
Given a set F={f1, f2, …, fn} of n individual fitnesses and a corresponding set D={d1, d2, …, dn} of the n distances to the nearest global maximum
FD
F D
cFDC
s s=
( )( )1
1 n
FD i ii
c f f d dn =
= - -åWhere cFD is the covariance of F and D, and sF, sD, and are the standard deviations and means of F and D, respectively.
f d
T. Jones and S. Forrest, Fitness distance correlation as a measure of problem difficulty for genetic algorithms, Proceedings of the 6th International Conference on Genetic Algorithms, 1995.


Motif Difficulty
Complex Networks
Global features: small-world, clustering, scale-free, etc.
Local feature: a network motif is a connected sub-graphs occurring in complex networks at numbers that are significantly higher than those in random networks.
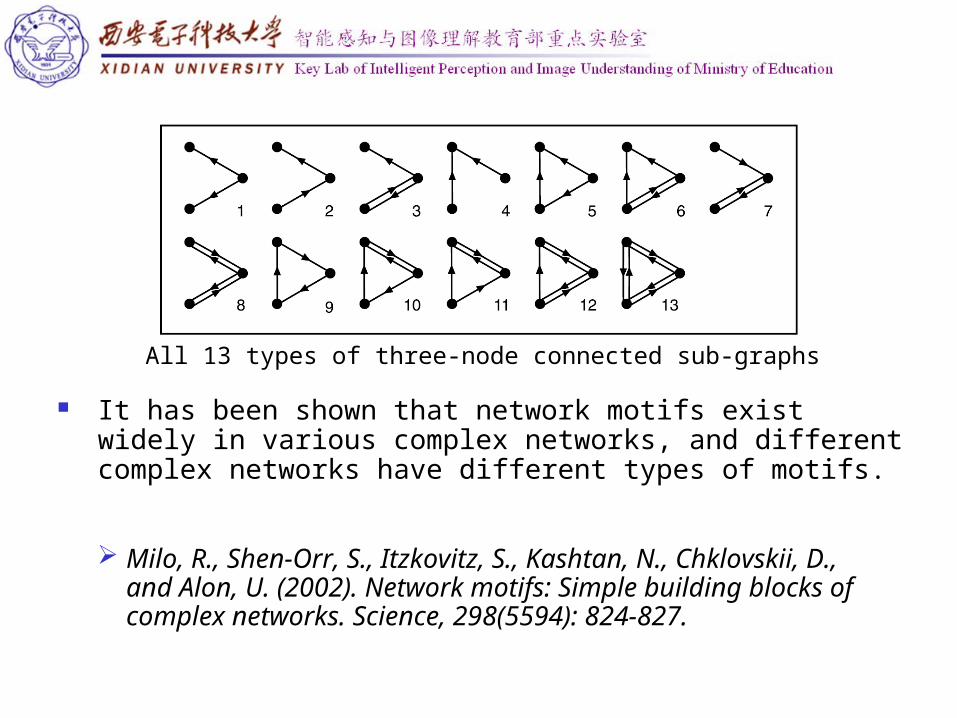
It has been shown that network motifs exist widely in various complex networks, and different complex networks have different types of motifs.
All 13 types of three-node connected sub-graphs
Milo, R., Shen-Orr, S., Itzkovitz, S., Kashtan, N., Chklovskii, D., and Alon, U. (2002). Network motifs: Simple building blocks of complex networks. Science, 298(5594): 824-827.
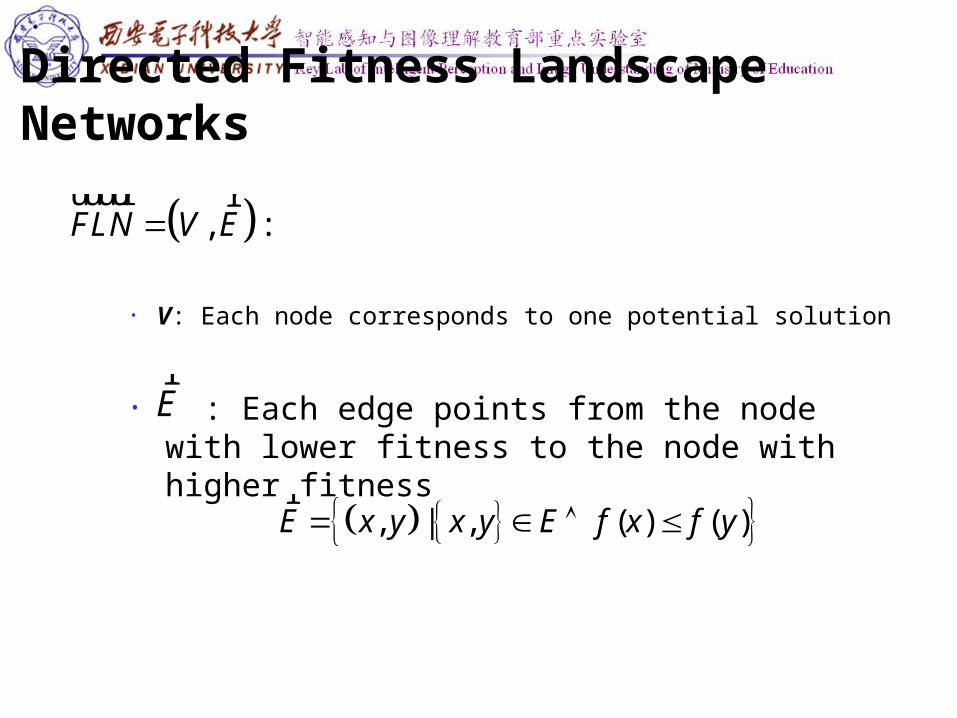
• : Each edge points from the node with lower fitness to the node with higher fitness
Directed Fitness Landscape Networks
Er
, :FLN V Euuuur r
• V: Each node corresponds to one potential solution
, | , ( ) ( )E x y x y E f x f y r

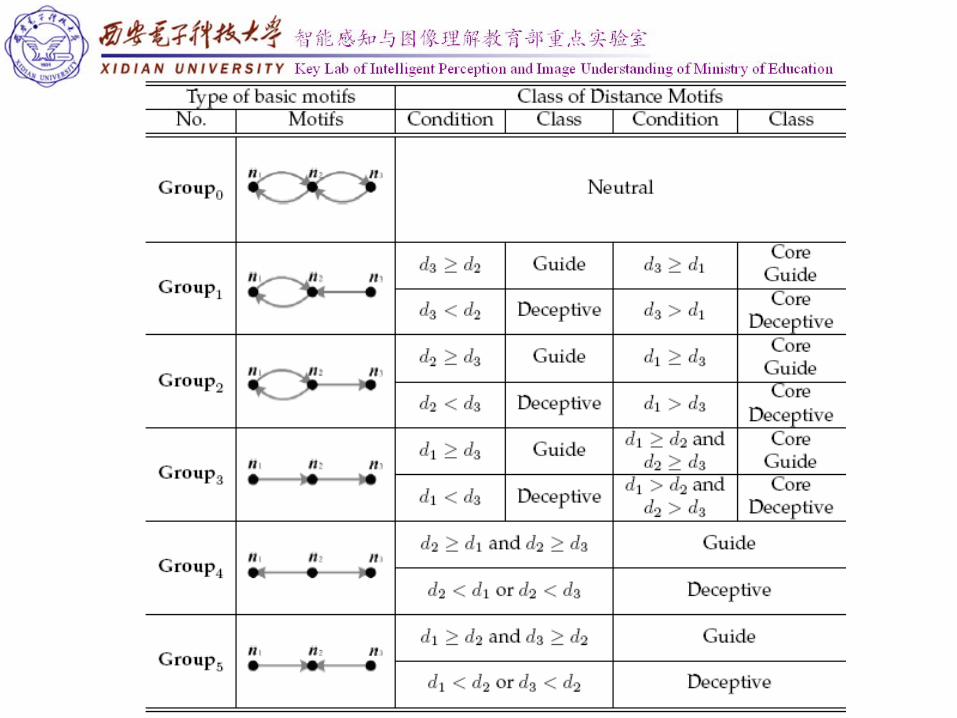
Basic Motifs
Group0 Group1Group2
Group3 Group4 Group5
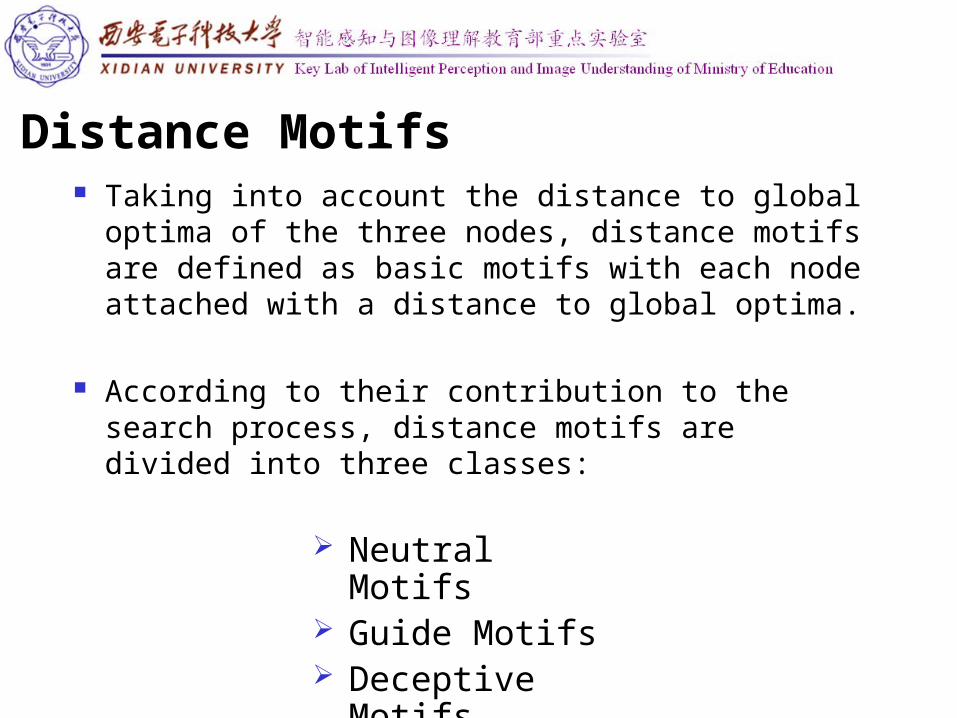
Distance Motifs Taking into account the distance to global optima of
the three nodes, distance motifs are defined as basic motifs with each node attached with a distance to global optima.
According to their contribution to the search process, distance motifs are divided into three classes:
Neutral Motifs Guide Motifs Deceptive Motifs
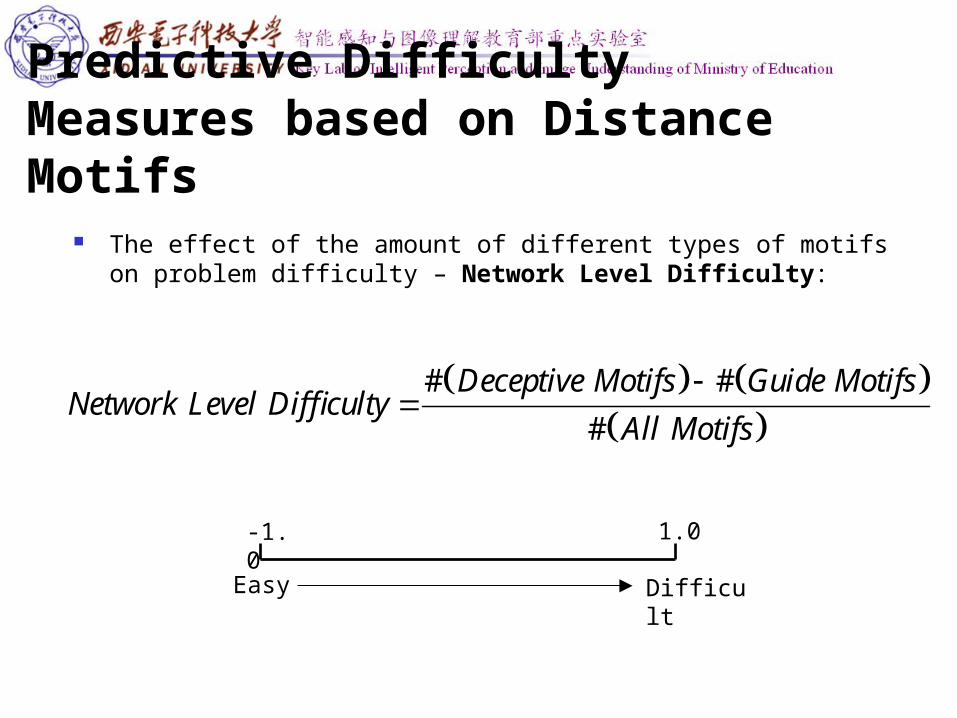
Predictive Difficulty Measures based on Distance Motifs
The effect of the amount of different types of motifs on problem difficulty – Network Level Difficulty:
# #
#
Deceptive Motifs Guide MotifsNetwork Level Difficulty
All Motifs
-1.0 1.0
Easy Difficult
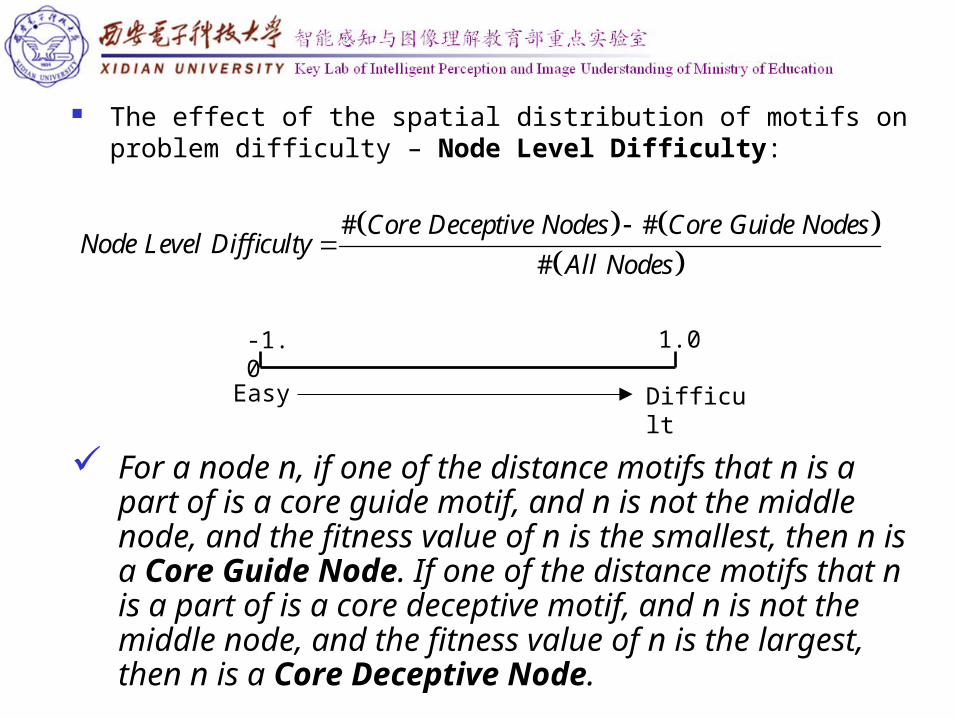
The effect of the spatial distribution of motifs on problem difficulty – Node Level Difficulty:
# #
#
Core Deceptive Nodes Core Guide NodesNode Level Difficulty
All Nodes
For a node n, if one of the distance motifs that n is a part of is a core guide motif, and n is not the middle node, and the fitness value of n is the smallest, then n is a Core Guide Node. If one of the distance motifs that n is a part of is a core deceptive motif, and n is not the middle node, and the fitness value of n is the largest, then n is a Core Deceptive Node.
-1.0 1.0
Easy Difficult
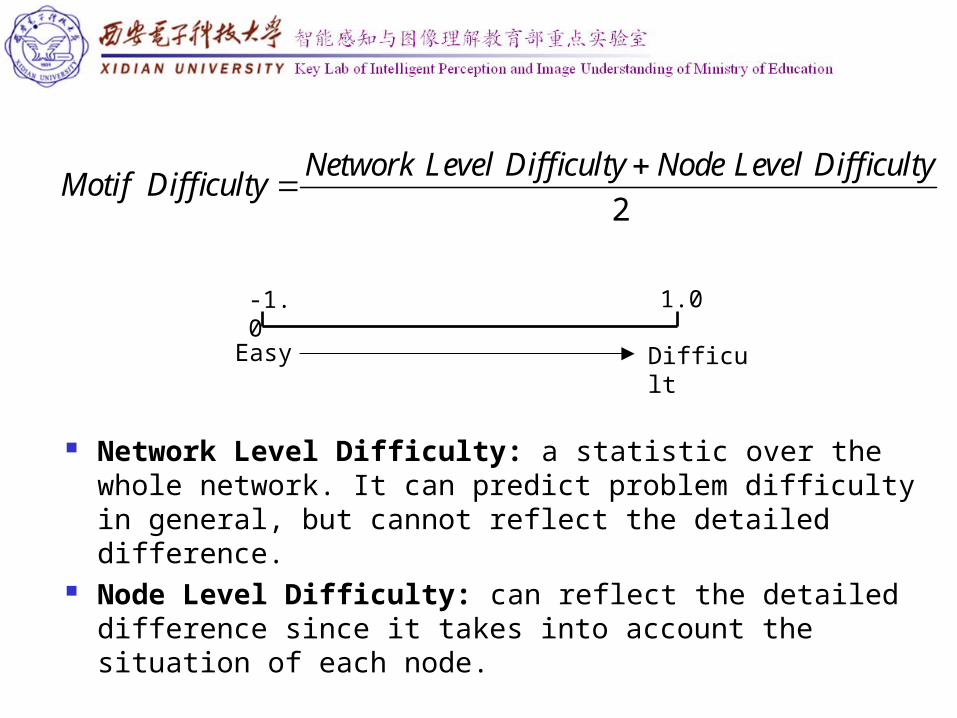
2
Network Level Difficulty Node Level DifficultyMotif Difficulty
Network Level Difficulty: a statistic over the whole network. It can predict problem difficulty in general, but cannot reflect the detailed difference.
Node Level Difficulty: can reflect the detailed difference since it takes into account the situation of each node.
-1.0 1.0
Easy Difficult
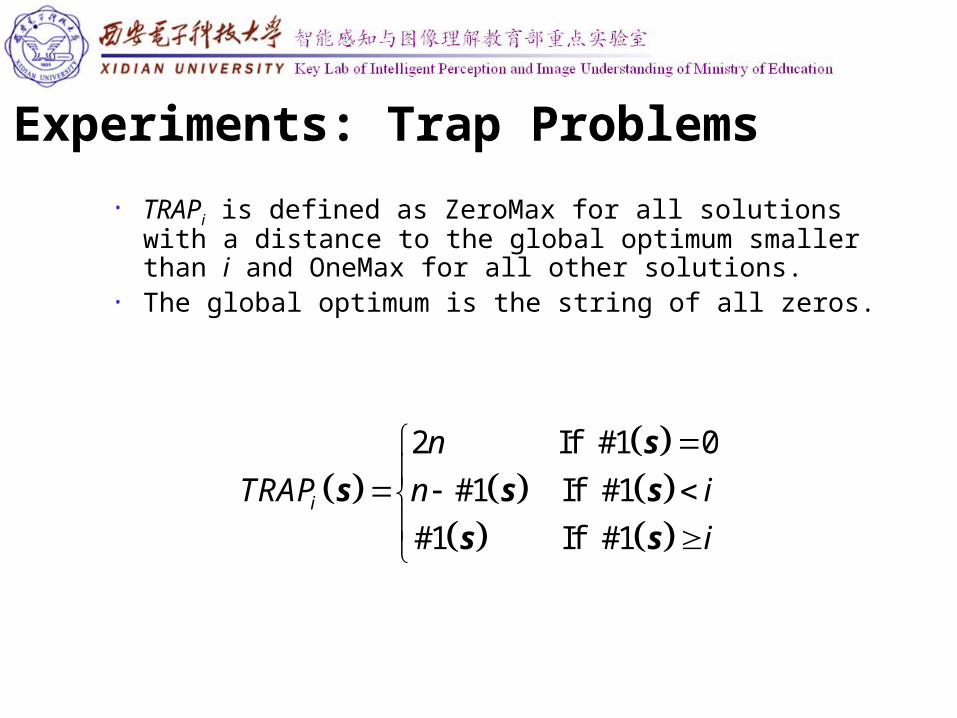
Experiments: Trap Problems
2 If #1 0
#1 If #1
#1 If #1i
n
TRAP n i
i
s
s s s
s s
• TRAPi is defined as ZeroMax for all solutions with a distance to the global optimum smaller than i and OneMax for all other solutions.
• The global optimum is the string of all zeros.
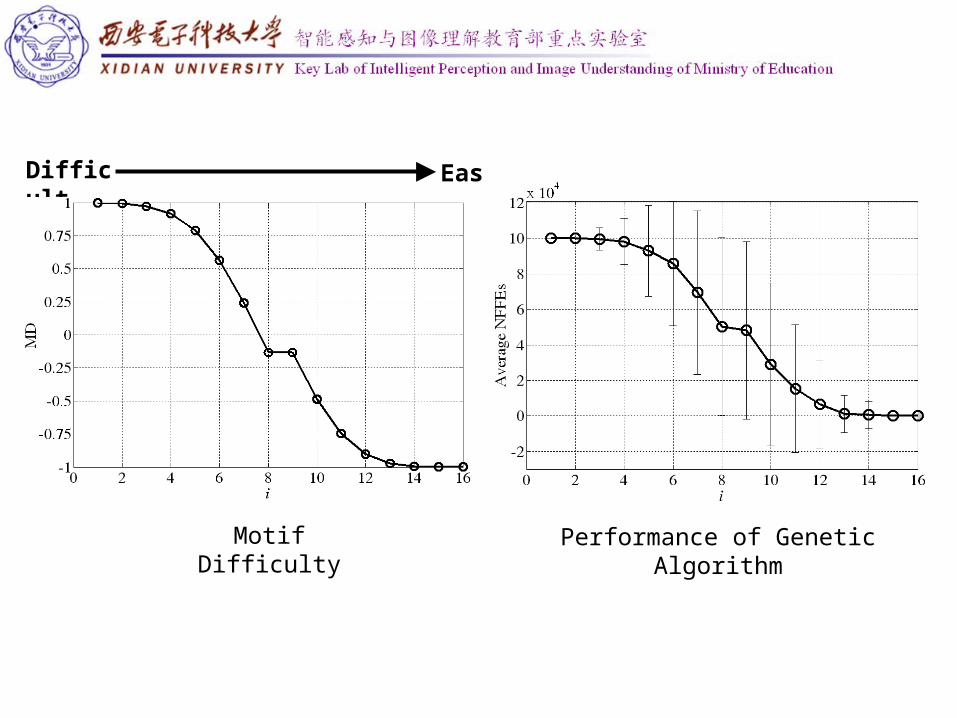
Difficult Easy
Motif Difficulty
Performance of Genetic Algorithm
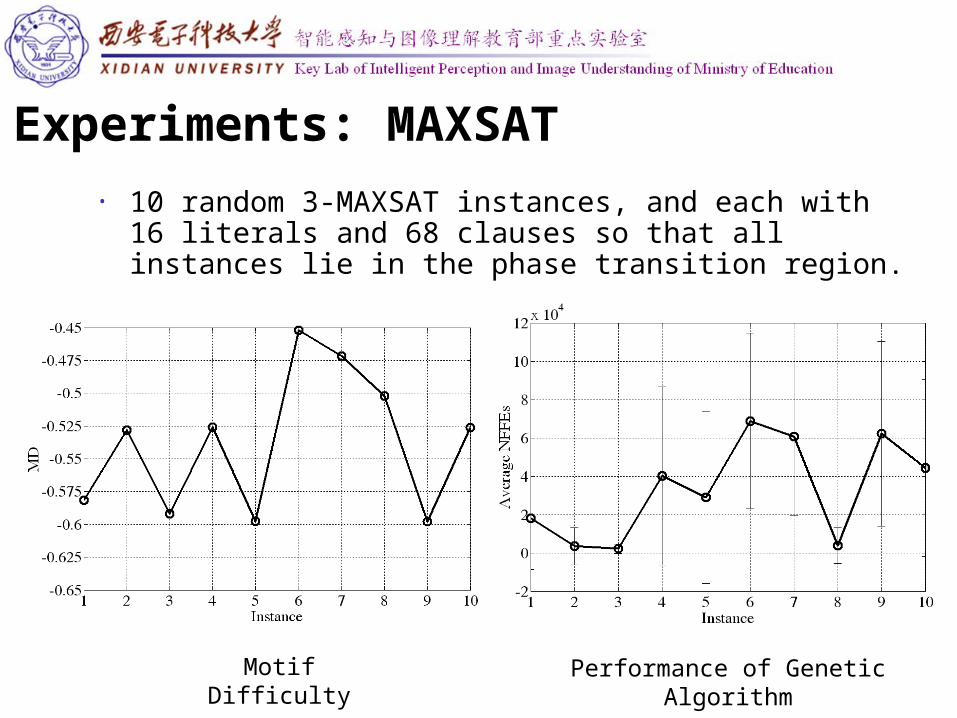
• 10 random 3-MAXSAT instances, and each with 16 literals and 68 clauses so that all instances lie in the phase transition region.
Motif Difficulty
Performance of Genetic Algorithm
Experiments: MAXSAT
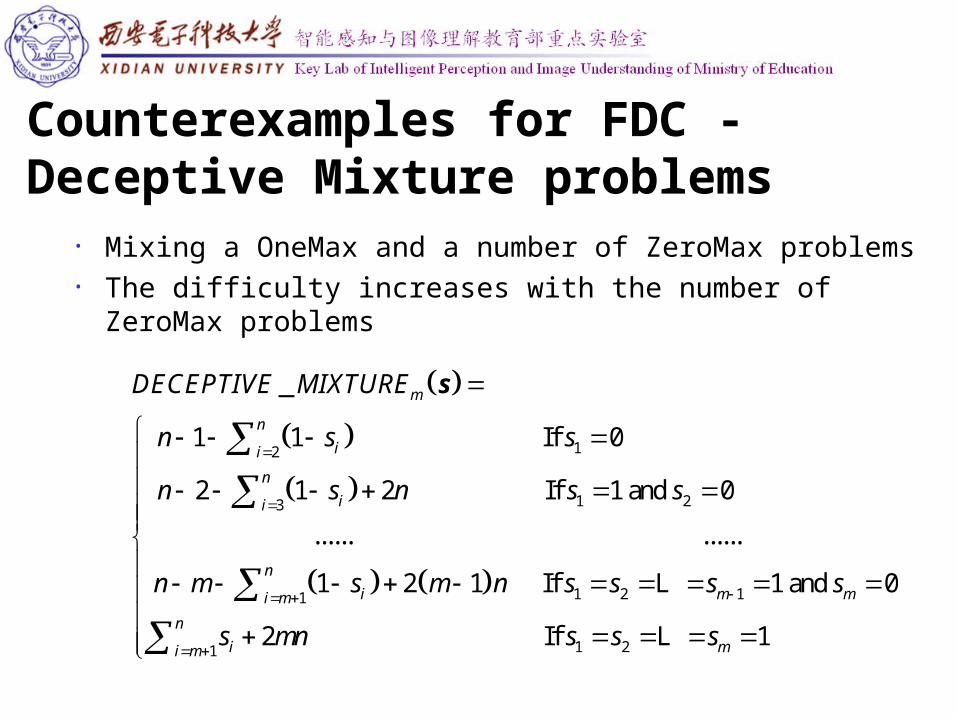
Counterexamples for FDC - Deceptive Mixture problems
• Mixing a OneMax and a number of ZeroMax problems• The difficulty increases with the number of ZeroMax problems
12
1 23
1
_
1 1 If 0
2 1 2 If 1 and 0
...... ......
1
m
n
ii
n
ii
n
ii m
DECEPTIVE MIXTURE
n s s
n s n s s
n m s
s
1 2 1
1 21
2 1 If 1 and 0
2 If 1
m m
n
i mi m
m n s s s s
s mn s s s
L
L
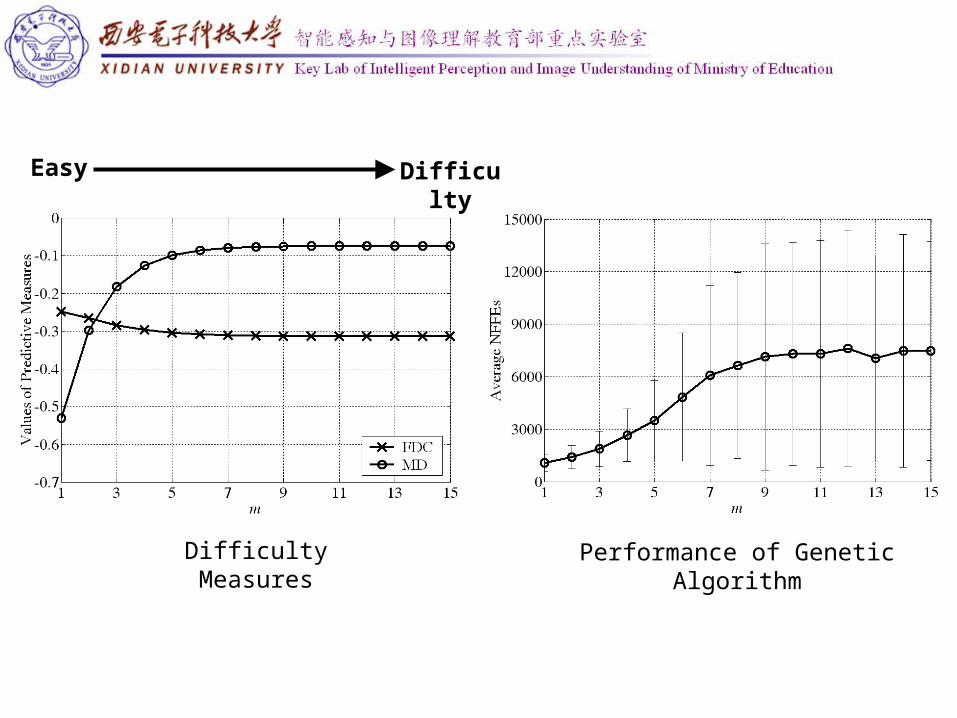
Easy Difficulty
Difficulty Measures Performance of Genetic Algorithm
Motif Difficulty: For More Details
Jing Liu, Hussein A. Abbass, David G. Green, and Weicai. Zhong, “Motif difficulty (MD): a predictive measure of problem difficulty for evolutionary algorithms using network motifs,” Evolutionary Computation Journal (MIT), 2012, 20(3): 321-347.
Complex Networks
Evolutionary Computation
Community Detection from Signed Social Networks
Network Robustness Optimization
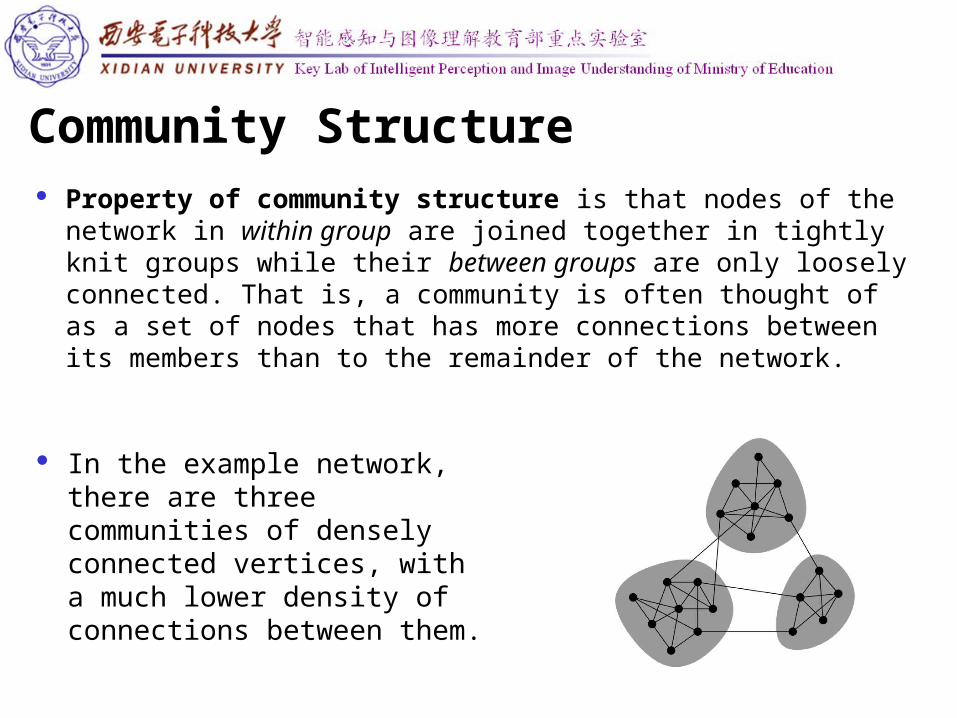
Property of community structure is that nodes of the network in within group are joined together in tightly knit groups while their between groups are only loosely connected. That is, a community is often thought of as a set of nodes that has more connections between its members than to the remainder of the network.
Community Structure
In the example network, there are three communities of densely connected vertices, with a much lower density of connections between them.
Communities in a social network might represent real social groupings, perhaps by interest or background.
Communities in a citation network might represent related papers on a single topic.
Communities in a metabolic network might represent cycles and other functional groupings.
Communities on the web might represent pages on related topics.
Therefore, being able to identify these communities could help us to understand and exploit these networks more effectively.
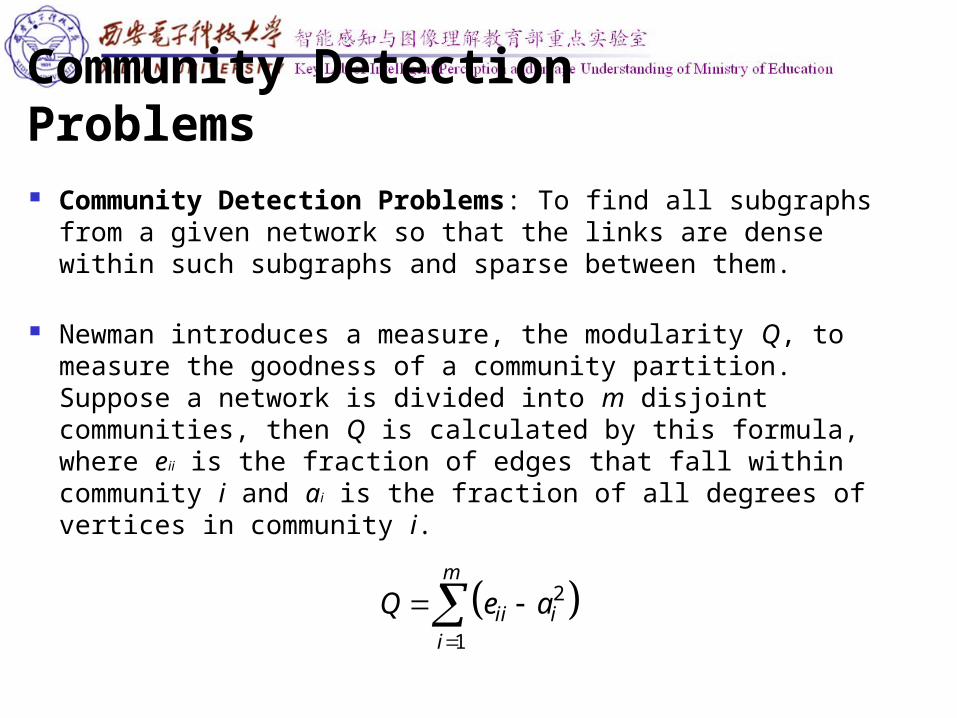
Community Detection Problems: To find all subgraphs from a given network so that the links are dense within such subgraphs and sparse between them.
Newman introduces a measure, the modularity Q, to measure the goodness of a community partition. Suppose a network is divided into m disjoint communities, then Q is calculated by this formula, where eii is the fraction of edges that fall within community i and ai is the fraction of all degrees of vertices in community i.
Community Detection Problems
2
1
m
ii ii
Q e a
Basically, Q measures the deviation between the chance for edges among communities to be generated due to the community structure and the chance for the edges to be generated randomly.
In practice, the values of Q greater than about 0.3 appear to indicate significant community structure, and the values of Q for real-world networks typically fall in the range from about 0.3 to 0.7. Higher values are rare.
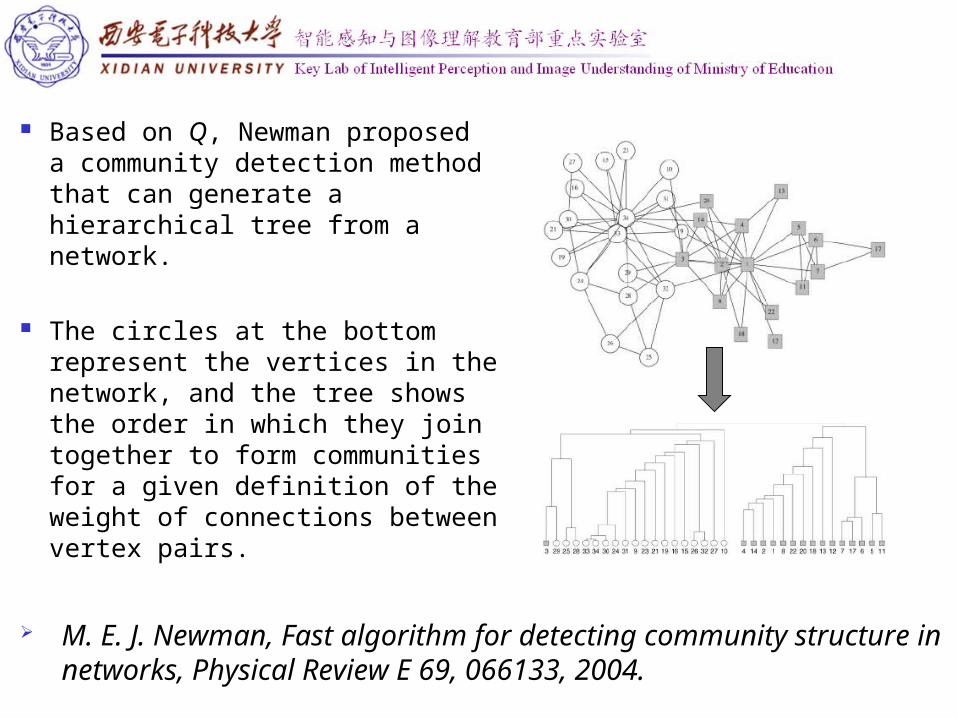
M. E. J. Newman, Fast algorithm for detecting community structure in networks, Physical Review E 69, 066133, 2004.
Based on Q, Newman proposed a community detection method that can generate a hierarchical tree from a network.
The circles at the bottom represent the vertices in the network, and the tree shows the order in which they join together to form communities for a given definition of the weight of connections between vertex pairs.
Community Detection from Signed Social Networks
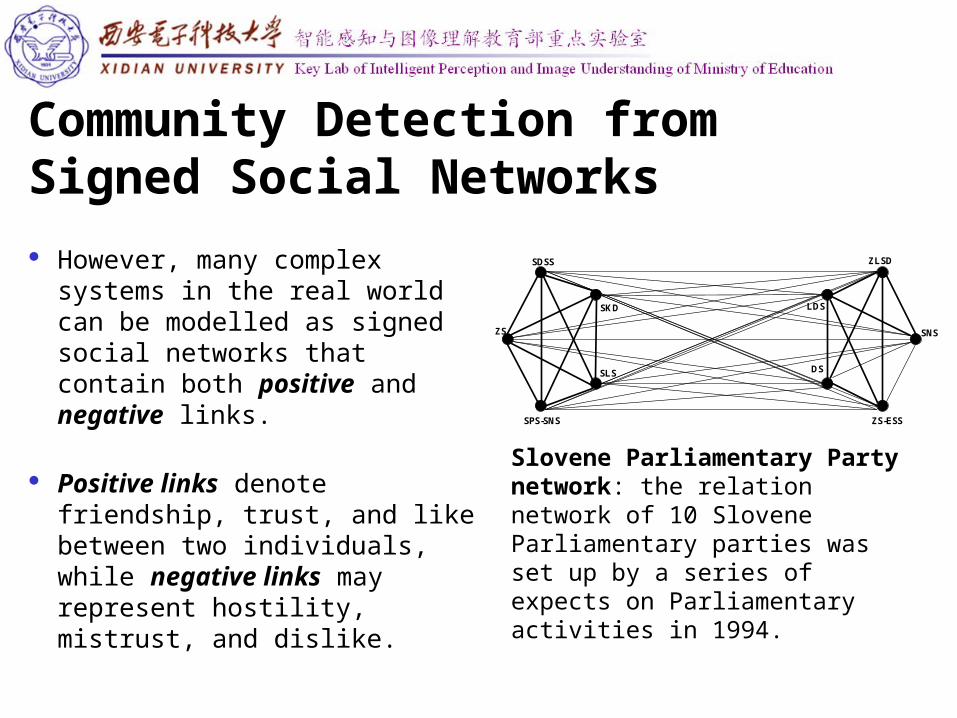
However, many complex systems in the real world can be modelled as signed social networks that contain both positive and negative links.
Positive links denote friendship, trust, and like between two individuals, while negative links may represent hostility, mistrust, and dislike.
SKD
ZS
SPS-SNS
SLS
SDSS
SNS
ZS-ESS
LDS
DS
ZLSD
Slovene Parliamentary Party network: the relation network of 10 Slovene Parliamentary parties was set up by a series of expects on Parliamentary activities in 1994.
Signed network communities are defined not only by the density of links but also by the signs of links. They are defined as the groups of nodes within which the positive links are dense and between which negative links are also dense.
The challenge of mining signed network communities lies in the fact that it is natural to have some negative links within groups and, at the same time, some positive links between groups.
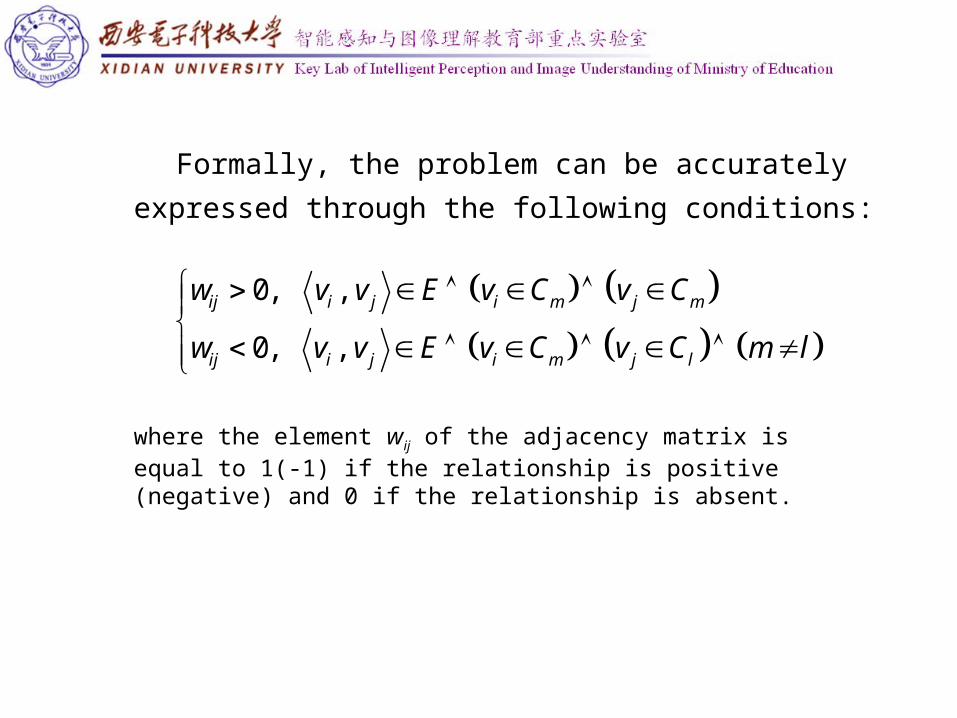
Formally, the problem can be accurately expressed
through the following conditions:
0, ,
0, ,
ij i j i m j m
ij i j i m j l
w v v E v C v C
w v v E v C v C m l
where the element wij of the adjacency matrix is equal to 1(-1) if the relationship is positive (negative) and 0 if the relationship is absent.
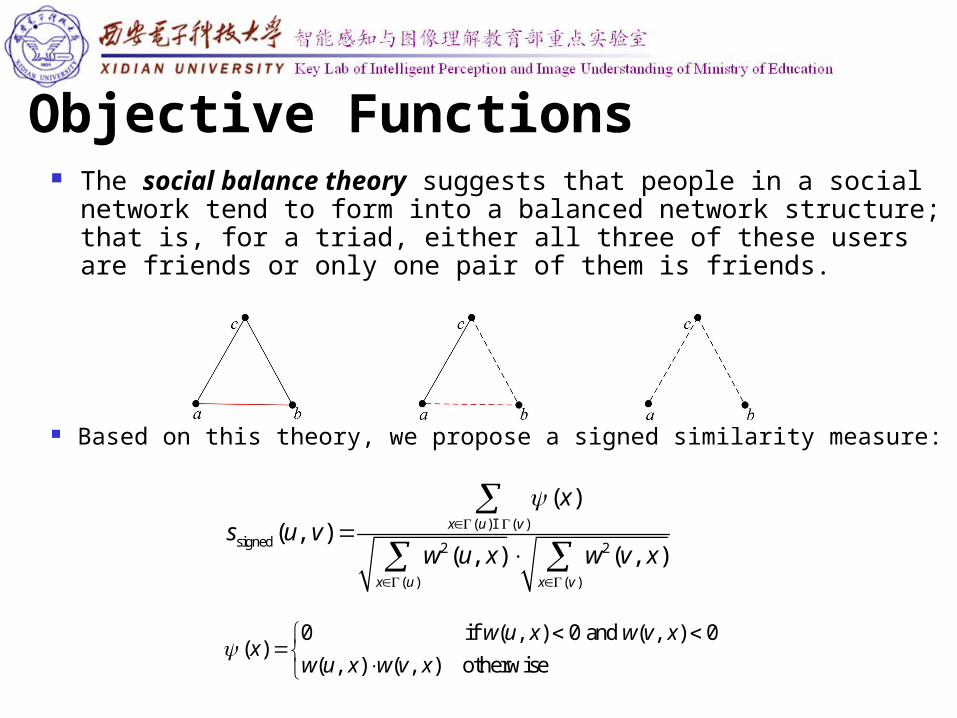
Objective Functions
Based on this theory, we propose a signed similarity measure:
The social balance theory suggests that people in a social network tend to form into a balanced network structure; that is, for a triad, either all three of these users are friends or only one pair of them is friends.
( ) ( )signed 2 2
( ) ( )
( )
( , )( , ) ( , )
x u v
x u x v
x
s u vw u x w v x
I
0 if ( , ) 0 and ( , ) 0( )
( , ) ( , ) otherwise
w u x w v xx
w u x w v x
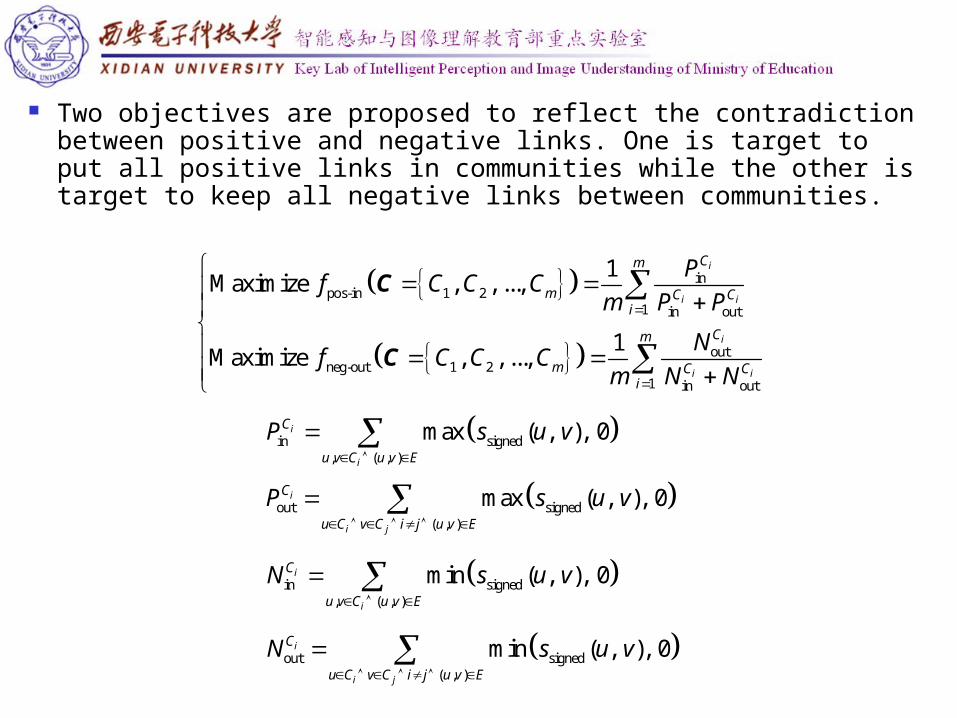
Two objectives are proposed to reflect the contradiction between positive and negative links. One is target to put all positive links in communities while the other is target to keep all negative links between communities.
inpos-in 1 2
1 in out
outneg-out 1 2
1 in out
1Maximize , , ...,
1Maximize , , ...,
i
i i
i
i i
Cm
m C Ci
Cm
m C Ci
Pf C C C
m P P
Nf C C C
m N N
C
C
in signed, ( , )
max ( , ), 0i
i
C
u v C u v E
P s u v
out signed( , )
max ( , ), 0i
i j
C
u C v C i j u v E
P s u v
in signed, ( , )
min ( , ), 0i
i
C
u v C u v E
N s u v
out signed( , )
min ( , ), 0i
i j
C
u C v C i j u v E
N s u v

Direct and Indirect Combined Representation
Character String Coding: R={r1, r2, ..., rn}, where ri is the identifier of node i, which can be represented by an integer number. As for the pair of nodes i and j in R, if ri=rj, nodes i and j are in the same community; otherwise, they are in different ones.
A direct representation is the natural representation, and can be evaluated easily
An indirect representation is not complete in itself, and a decoder which transforms the solution in the indirect representation into one in the direct representation is required
Permutation based representation: each individual has a permutation of all nodes and the set of communities. A decoder can transform the permutation of all nodes to the set of communities incrementally.
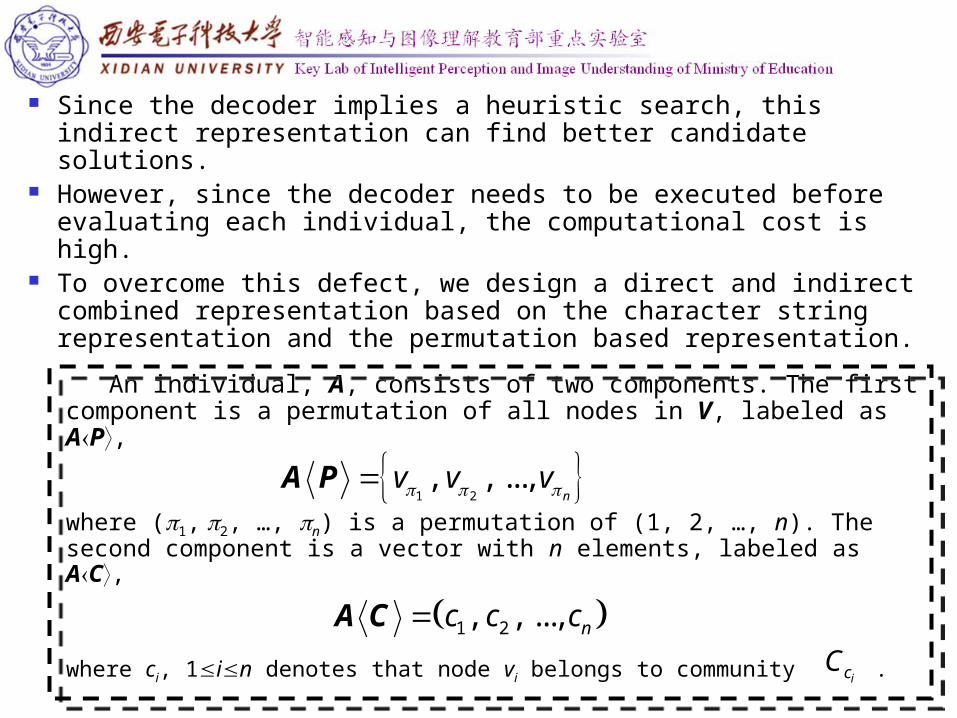
Since the decoder implies a heuristic search, this indirect representation can find better candidate solutions.
However, since the decoder needs to be executed before evaluating each individual, the computational cost is high.
To overcome this defect, we design a direct and indirect combined representation based on the character string representation and the permutation based representation.
An individual, A, consists of two components. The first component is a permutation of all nodes in V, labeled as AP,
1 2, , ...,
nv v v A P
where (1, 2, …, n) is a permutation of (1, 2, …, n). The second component is a vector with n elements, labeled as AC,
1 2, , ..., nc c cA C
where ci, 1in denotes that node vi belongs to community .icC

Implementation of MEAs-SN To make use of the advantages of both AP and AC, in MEAs-
SN, the population is first initialized to AP; Then, for detecting separated communities, each permutation is
transformed to a set of communities by the decoder. This set of communities is further transformed to AC. In the following evolutionary process, each individual is represented as AC, and the corresponding operators are conducted. In this way, the initial AP population can generate a better population through the decoder, and the following operations on AC can be realized time efficiently.
For detecting overlapping communities, AP is used during the whole evolutionary process since AC can not handle overlapping communities.
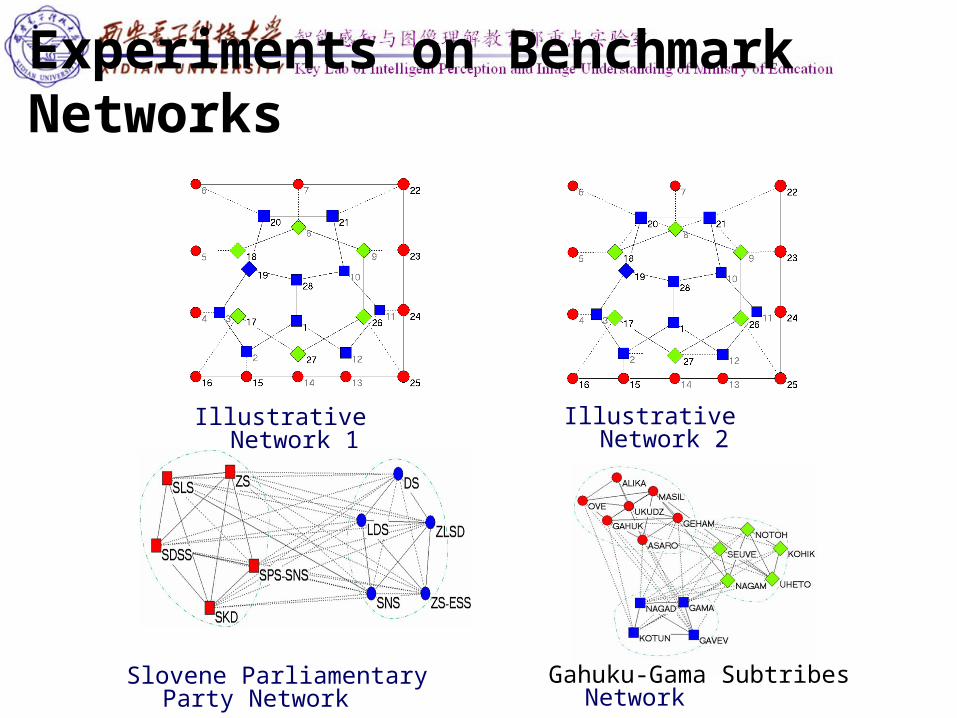
Experiments on Benchmark Networks
Slovene Parliamentary Party Network Gahuku-Gama Subtribes Network
Illustrative Network 1 Illustrative Network 2
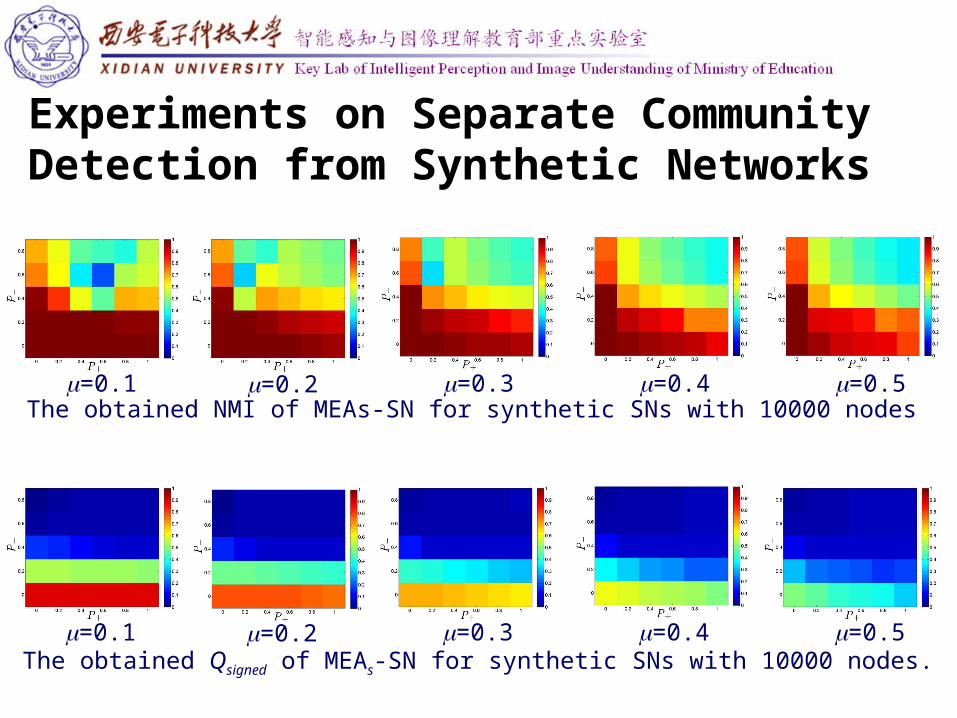
Experiments on Separate Community Detection from Synthetic Networks
=0.1 =0.2 =0.3 =0.4 =0.5The obtained NMI of MEAs-SN for synthetic SNs with 10000 nodes
=0.1 =0.2 =0.3 =0.4 =0.5The obtained Qsigned of MEAs-SN for synthetic SNs with 10000 nodes.

=0.1, P-=0.0 =0.2, P-=0.0 =0.3, P-=0.0 =0.4, P-=0.0 =0.5, P-=0.0
=0.1, P-=0.2 =0.2, P-=0.2 =0.3, P-=0.2 =0.4, P-=0.2 =0.5, P-=0.2
=0.1, P-=0.4 =0.2, P-=0.4 =0.3, P-=0.4 =0.4, P-=0.4 =0.5, P-=0.4The comparison between MEAs-SN and existing algorithms.

Experiments on Overlapping Community Detection from Synthetic Networks
=0.1 =0.2 =0.3 =0.4 =0.5The obtained GNMI of MEAs-SN for detecting overlapping communities.
=0.1 =0.2 =0.3 =0.4 =0.5The obtained Qos of MEAs-SN for detecting overlapping communities.

For More Details
Chenlong Liu, Jing Liu, Zhongzhou Jiang, “A multi-objective evolutionary algorithm based on similarity for community detection from signed social networks,” IEEE Trans. on Cybernetics, Online 2014.
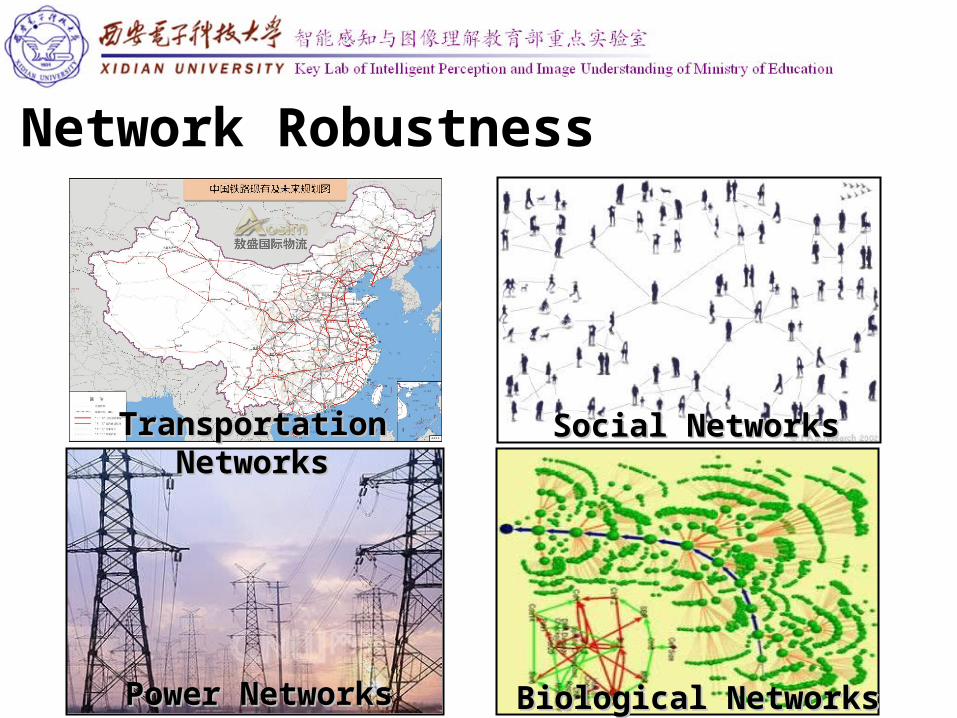
Network Robustness
Transportation NetworksTransportation Networks Social NetworksSocial Networks
Power NetworksPower Networks Biological NetworksBiological Networks
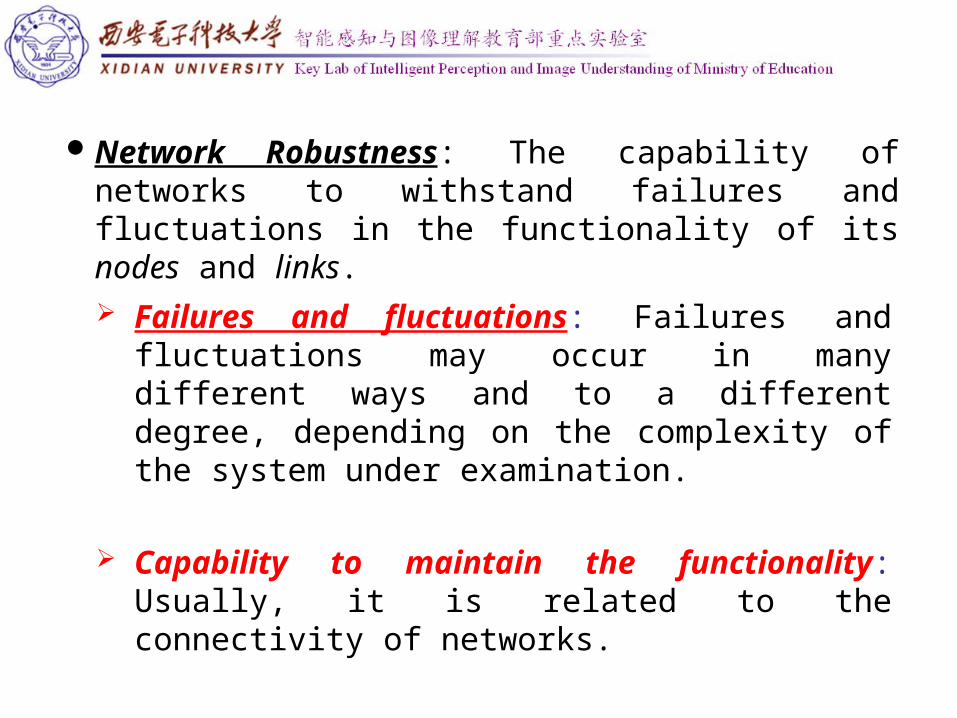
Network Robustness: The capability of networks to withstand failures and fluctuations in the functionality of its nodes and links.
Failures and fluctuations: Failures and fluctuations may occur in many different ways and to a different degree, depending on the complexity of the system under examination.
Capability to maintain the functionality: Usually, it is related to the connectivity of networks.
Attacks
Albert, R., Jeong, H., Barabasi, A. L., Error and attack tolerance of complex networks. Nature 406, 378-382, 2000.
Node attacksLink attacks
Random attacksTargeted attacks
There are potentially many ways in which the functionality of a network can be impaired partly or totally.
The study on failures starting from a simple model first.
R. Albert et al. abstracted away all other possible complexities and details and only studied the influence of the network topology on the results of the attack.

Erdös-Rény Random Networks: All nodes have a degree close to the mean, as the degree is Poisson-distributed. The effect of targeted attacks and random attacks are similar to ER networks.
Scale-free Networks: The distribution is right-skewed, most nodes have a small degree but there is a significant number of nodes of high degree called hubs. It turns out that under random attacks, degree-inhomogeneous scale-free networks are much more robust than random ones and one has to remove a significant fraction of nodes before the network falls apart and fragments itself into separated components. However this tolerance against random attacks or failures comes at a price as scale-free networks are much more vulnerable to the removal of nodes according to the nodes’ degree.
Robustness MeasuresThe purpose of robustness measures is to evaluate the capability
of networks in maintaining their functionality after suffering from attacks.
Critical removal fraction: The critical removal fraction of vertices (edges) for the disintegration of a network. As the fraction of removed vertices (or edges) increases, the performance of the network will eventually collapse at a critical fraction. The disintegration of network performance is measured in terms of network performance. The most common performance measurements include the diameter, the size of the largest component, the average path length, and efficiency.
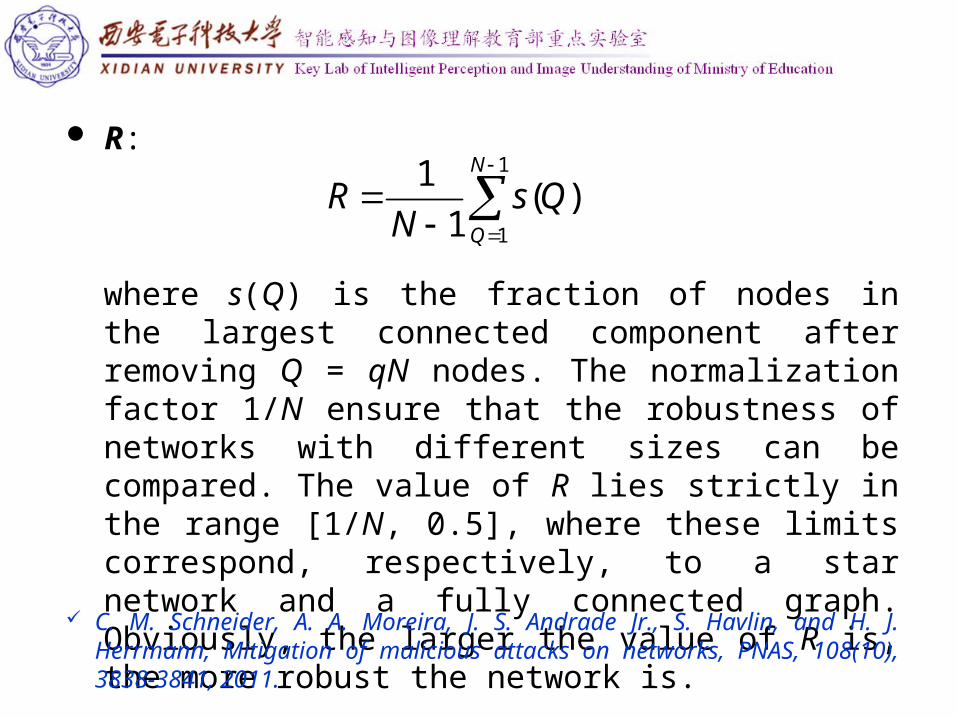
R:
where s(Q) is the fraction of nodes in the largest connected component after removing Q = qN nodes. The normalization factor 1/N ensure that the robustness of networks with different sizes can be compared. The value of R lies strictly in the range [1/N, 0.5], where these limits correspond, respectively, to a star network and a fully connected graph. Obviously, the larger the value of R is, the more robust the network is.
1
1
1( )
1
N
Q
R s QN
C. M. Schneider, A. A. Moreira, J. S. Andrade Jr., S. Havlin, and H. J. Herrmann, Mitigation of malicious attacks on networks, PNAS, 108(10), 3838-3841, 2011.
Network Structure Optimization If we were to design a network for some task, how would we go
about to make it robust against some kind of failures?
We could also be given a network and be asked how to make it more robust without altering its mean degree or even its degree distribution.
These constraints might arise from real-life conditions such as existing nodes and connections that cannot be changed.
Since scale-free networks are fragile under targeted network, most existing research focuses on improving the robustness of scale-free networks without changing the degree distribution and the connectivity of each single node.
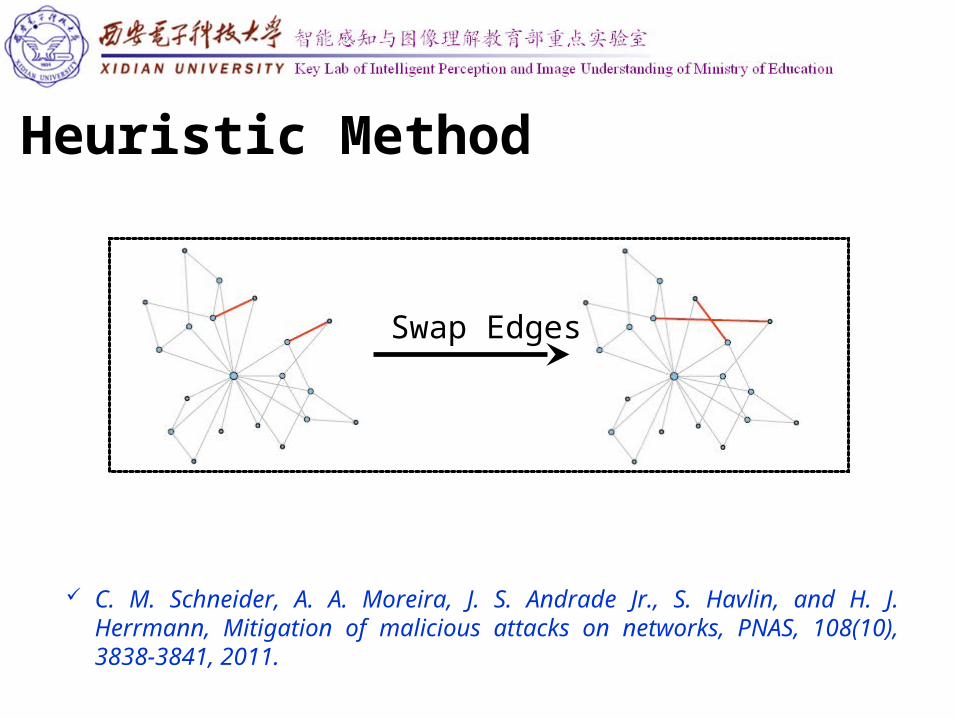
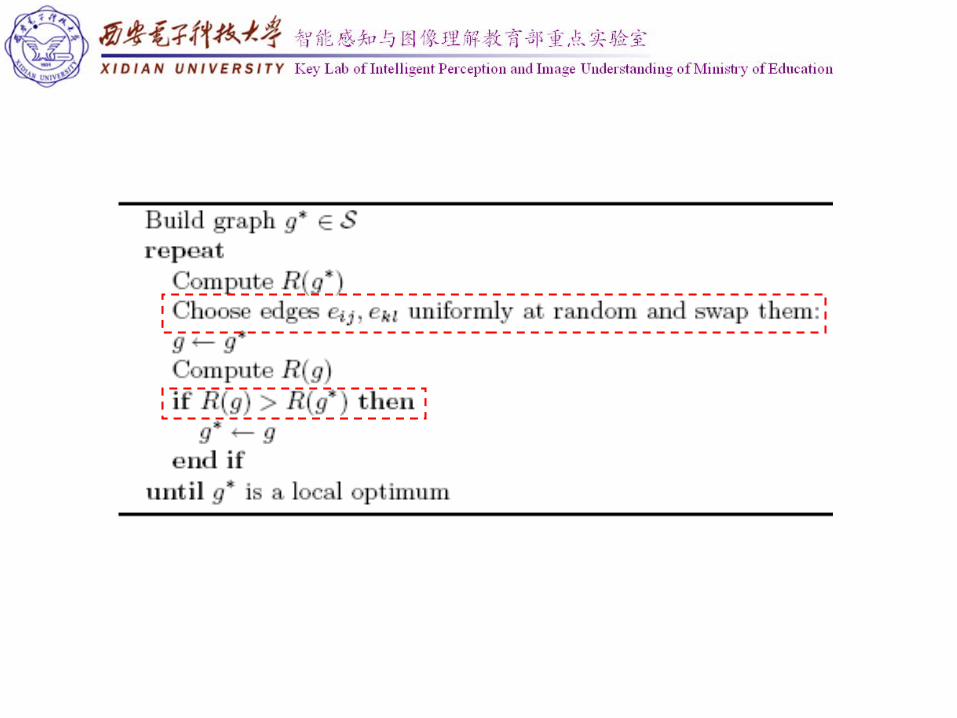
Heuristic Method
Swap Edges
C. M. Schneider, A. A. Moreira, J. S. Andrade Jr., S. Havlin, and H. J. Herrmann, Mitigation of malicious attacks on networks, PNAS, 108(10), 3838-3841, 2011.
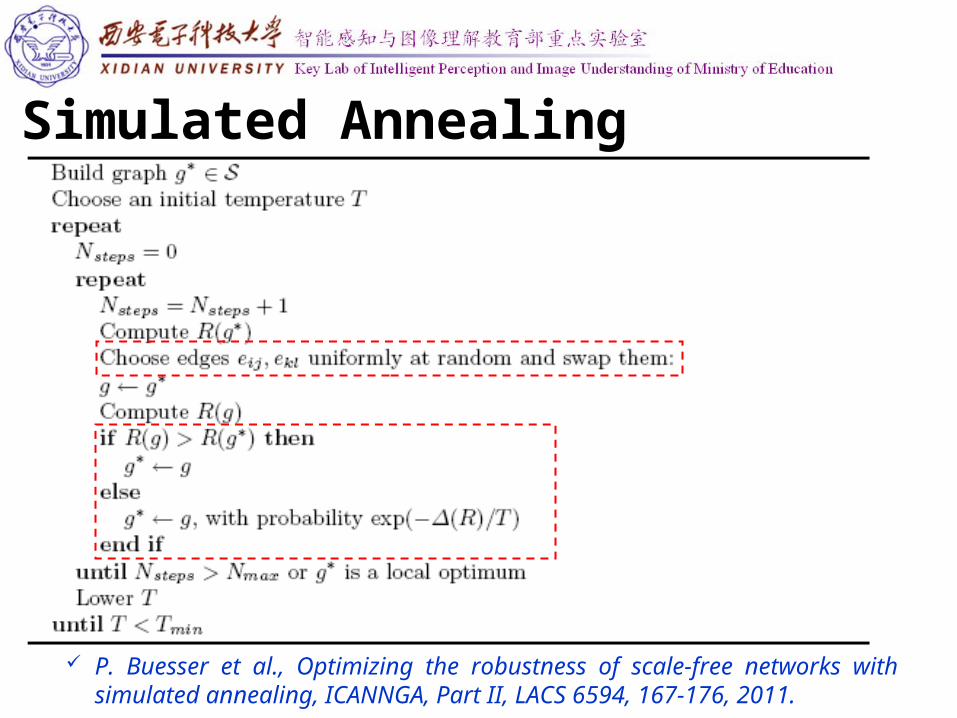
Simulated Annealing
P. Buesser et al., Optimizing the robustness of scale-free networks with simulated annealing, ICANNGA, Part II, LACS 6594, 167-176, 2011.
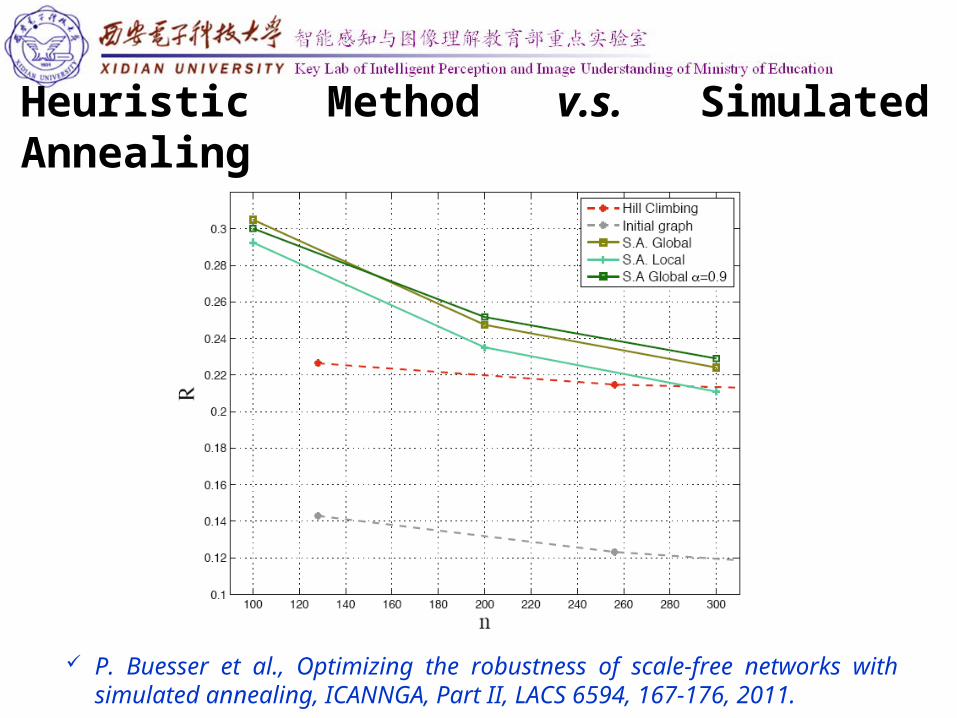
Heuristic Method v.s. Simulated Annealing
P. Buesser et al., Optimizing the robustness of scale-free networks with simulated annealing, ICANNGA, Part II, LACS 6594, 167-176, 2011.

Onion-like topology of robust networks
Memetic Algorithm
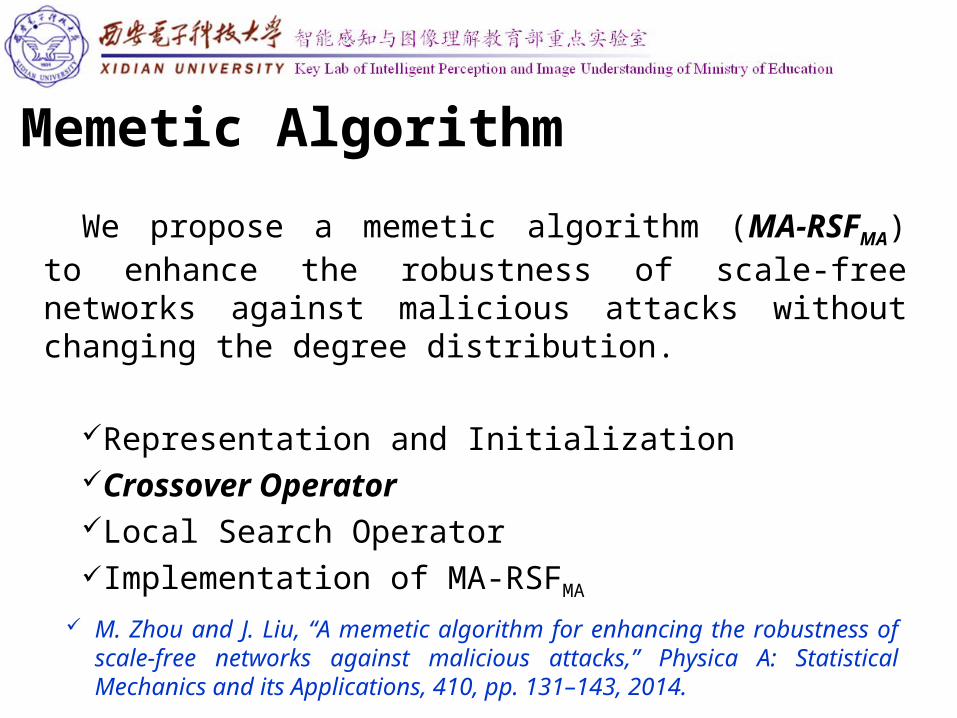
We propose a memetic algorithm (MA-RSFMA) to enhance the robustness of scale-free networks against malicious attacks without changing the degree distribution.
Representation and Initialization Crossover Operator Local Search Operator Implementation of MA-RSFMA
M. Zhou and J. Liu, “A memetic algorithm for enhancing the robustness of scale-free networks against malicious attacks,” Physica A: Statistical Mechanics and its Applications, 410, pp. 131–143, 2014.
Representation and Initialization Each chromosome represents a graphSince we need to keep invariant the number of links and the
degree of each node, each chromosome is generated by randomly adjusting a fraction of edges in the initial scale-free network
To adjust the edges in the initial graph, the previous swap operation is employed; that is, the connections of two randomly chosen edges which have no common nodes are swapped
However, since in the initial population, we just want to generate different graphs with the same degree distribution to introduce diversity for the following evolutionary process, any swap operations that can keep the graph being connected are accepted without checking whether the robustness of the network is improved or not
Crossover Operator Usually, the crossover operator works on more than one
chromosome and the challenge for the problem of optimizing the robustness we consider here lies in the child chromosomes should have the same degree distribution with the parent chromosomes.
Suppose Gp1 and Gp2 are two parent chromosomes, and Gc1 and Gc2 are two child chromosomes.
First assign Gp1 to Gc1 and Gp2 to Gc2, then for each node i in Gc1 and Gc2 do the following operations with the probability pc. Obtain the following sets of nodes,

Next, for each node , select a node that have not been used. Remove eij from Gc1 and eik from Gc2. Add eik to Gc1 and eij to Gc2. To keep the degree of each node being invariant, randomly select another edge ekl that node k connects in Gc1, then remove ekl and add ejl.
The similar operations are also need to be conducted on Gc2.
In this way, a part of network structure of Gp1 is transformed into Gp2, and vice versa.
1 1|c cG Gi ijV j e E
2 2|c cG Gi ijV j e E
1 1 1 2c c c cG G G Gi i i iV V V V I
2 2 1 2c c c cG G G Gi i i iV V V V I
1cGij V 2cG
ik V
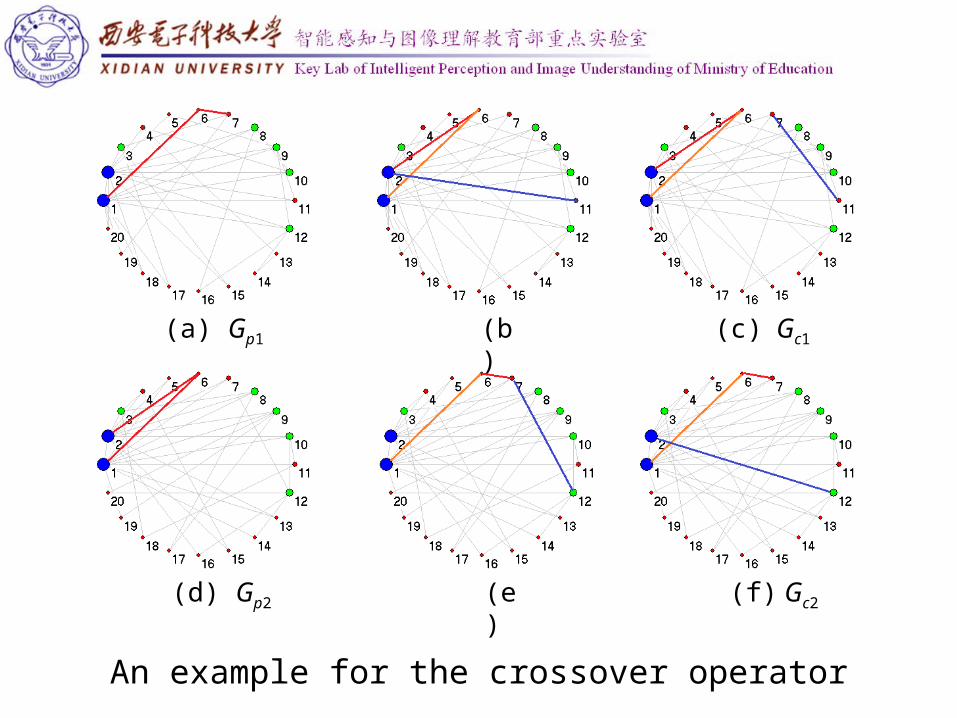
An example for the crossover operator
(a) Gp1
(d) Gp2 (e)
(c) Gc1(b)
(f) Gc2
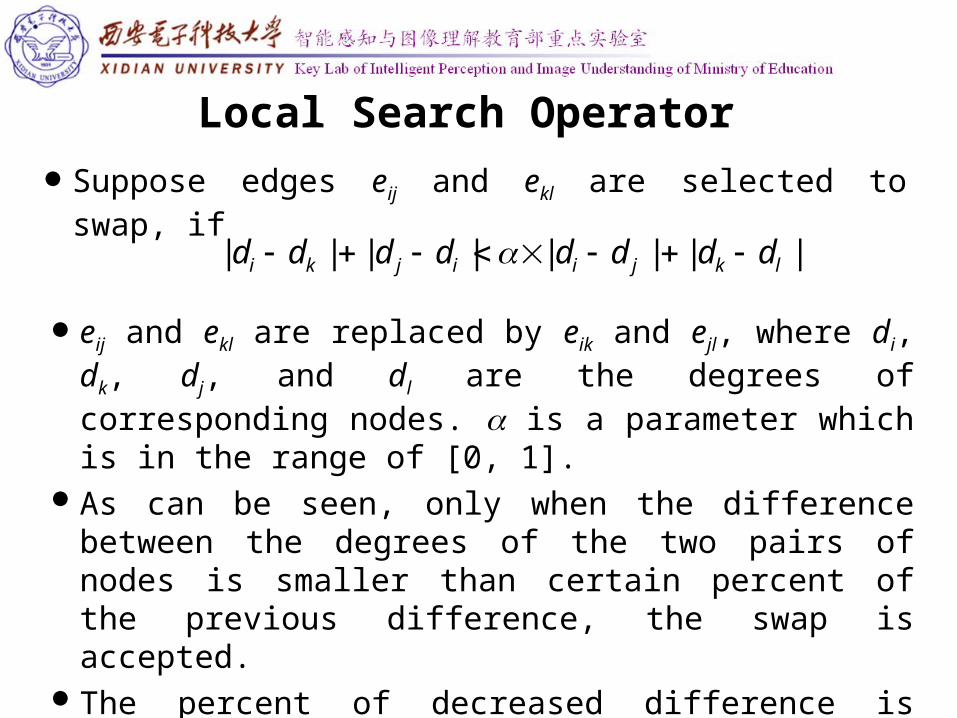
Local Search Operator
Suppose edges eij and ekl are selected to swap, if
| | | | | | | |i k j i i j k ld d d d d d d d
eij and ekl are replaced by eik and ejl, where di, dk, dj, and dl are the degrees of corresponding nodes. is a parameter which is in the range of [0, 1].
As can be seen, only when the difference between the degrees of the two pairs of nodes is smaller than certain percent of the previous difference, the swap is accepted.
The percent of decreased difference is controlled by ; that is, the larger the value of is, the weaker the condition is, and the smaller the difference is decreased.
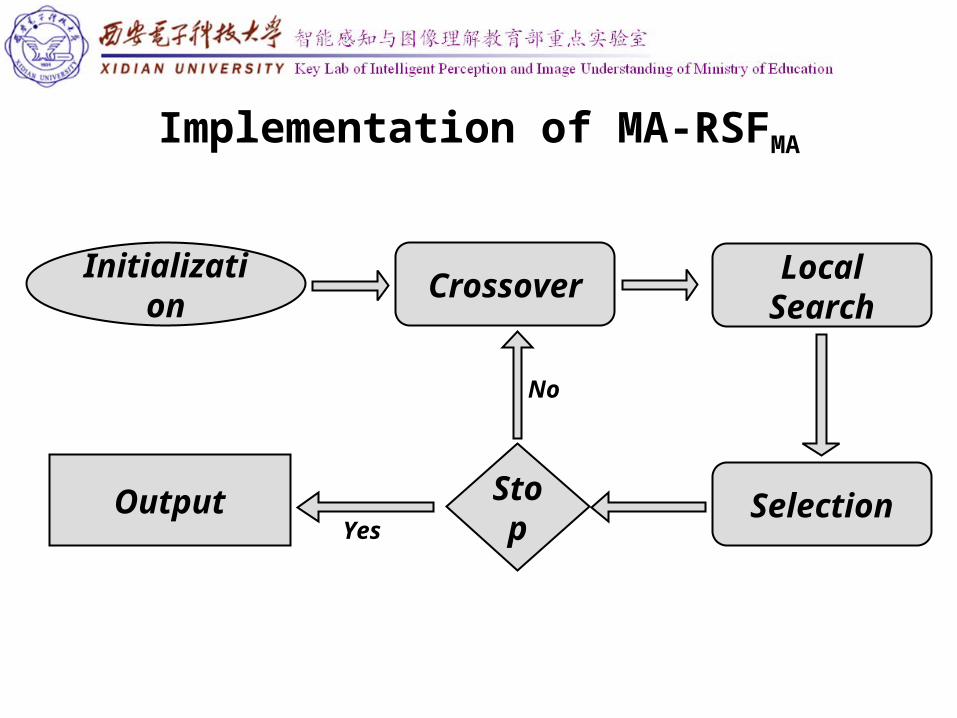
Implementation of MA-RSFMA
Initialization Crossover Local Search
SelectionStop
No
OutputYes
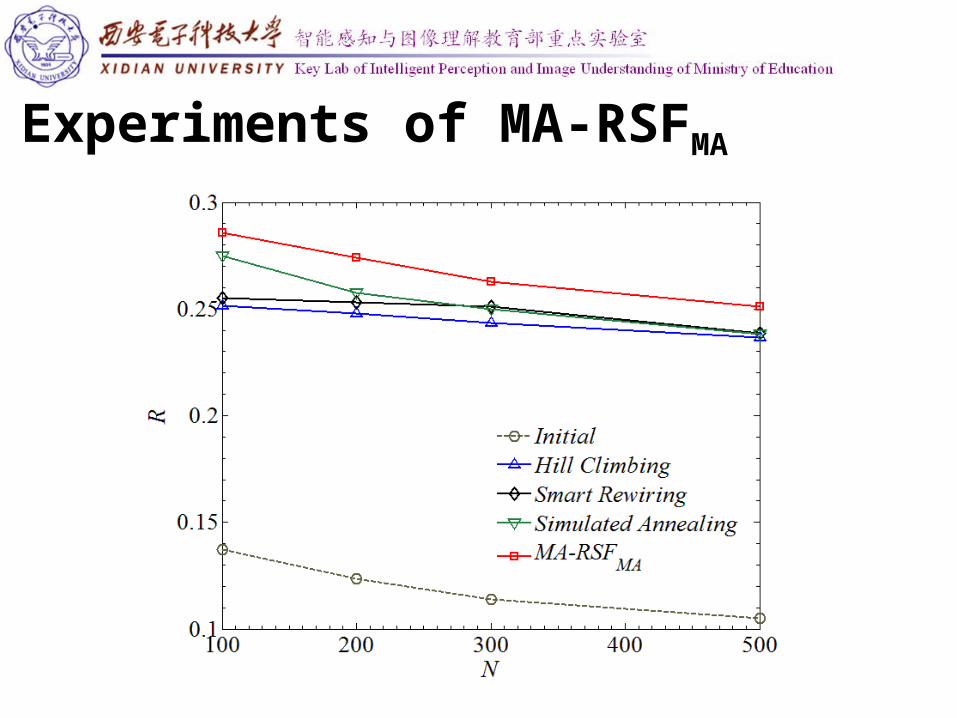
Experiments of MA-RSFMA
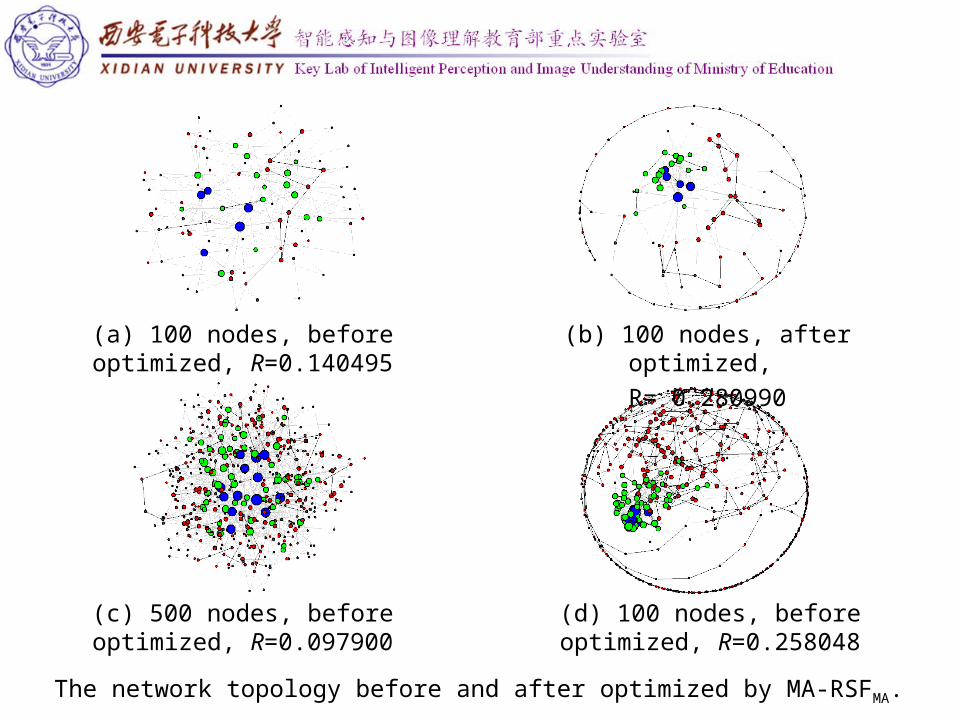
The network topology before and after optimized by MA-RSFMA.
(a) 100 nodes, before optimized, R=0.140495
(b) 100 nodes, after optimized,
R= 0.280990
(c) 500 nodes, before optimized, R=0.097900
(d) 100 nodes, before optimized, R=0.258048
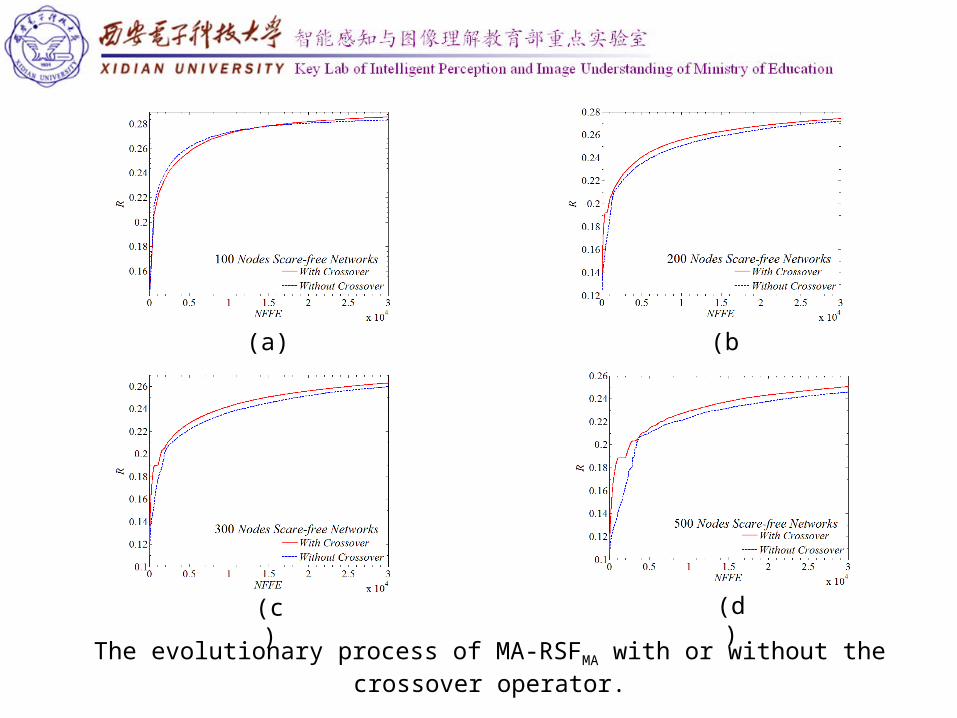
The evolutionary process of MA-RSFMA with or without the crossover operator.
(a) (b)
(c) (d)

The fraction s(q) belonging to the largest connected cluster versus the fraction q removed nodes for two real-world networks. (a) EU power grid network with N=1494
and M=2156, (b) AS Internet network with N=7671, M=27951.
(a) (b)

The topologies of real world networks before and after optimized by MA-RSFMA.
(a) EU power, before (b) EU power, after
(c) AS Internet, before (d) AS Internet, after

For More Details
Mingxing Zhou and Jing Liu, “A memetic algorithm for enhancing the robustness of scale-free networks against malicious attacks,” Physica A: Statistical Mechanics and its Applications, 410, pp. 131–143, 2014.