Embed Size (px)
Citation preview

Maximum power point tracking of partial shaded photovoltaic array using anevolutionary algorithm: A particle swarm optimization techniqueMohammadmehdi Seyedmahmoudian, Saad Mekhilef, Rasoul Rahmani, Rubiyah Yusof, and Ali Asghar Shojaei
Citation: Journal of Renewable and Sustainable Energy 6, 023102 (2014);View online: https://doi.org/10.1063/1.4868025View Table of Contents: http://aip.scitation.org/toc/rse/6/2Published by the American Institute of Physics
Articles you may be interested inModeling and global maximum power point tracking for photovoltaic system under partial shading conditionsusing modified particle swarm optimization algorithmJournal of Renewable and Sustainable Energy 6, 063117 (2014); 10.1063/1.4904436
Comprehensive analysis of maximum power point tracking techniques in solar photovoltaic systems underuniform insolation and partial shaded conditionJournal of Renewable and Sustainable Energy 7, 042701 (2015); 10.1063/1.4926844
Performance of smart maximum power point tracker under partial shading conditions of photovoltaic systemsJournal of Renewable and Sustainable Energy 7, 043141 (2015); 10.1063/1.4929665
Detailed Balance Limit of Efficiency of p-n Junction Solar CellsJournal of Applied Physics 32, 510 (2004); 10.1063/1.1736034
Tracking the global maximum power point of a photovoltaic system under partial shading conditions using amodified firefly algorithmJournal of Renewable and Sustainable Energy 8, 033501 (2016); 10.1063/1.4948524
Voltage band based improved particle swarm optimization technique for maximum power point tracking in solarphotovoltaic systemJournal of Renewable and Sustainable Energy 8, 013106 (2016); 10.1063/1.4939531
Maximum power point tracking of partial shadedphotovoltaic array using an evolutionary algorithm:A particle swarm optimization technique
Mohammadmehdi Seyedmahmoudian,1,a) Saad Mekhilef,2
Rasoul Rahmani,3 Rubiyah Yusof,3 and Ali Asghar Shojaei31School of Engineering, Deakin University, 3216 Victoria, Australia2Department of Electrical Engineering, University of Malaya, 50603 Kuala Lumpur,Malaysia3Centre for Artificial Intelligence and Robotics, Universiti Teknologi Malaysia,54100 Kuala Lumpur, Malaysia
(Received 10 August 2013; accepted 24 February 2014; published online 10 March 2014)
Partial shading is one of the unavoidable complications in the field of solar power
generation. Although the most common approach in increasing a photovoltaic (PV)
array’s efficiency has always been to introduce a bypass diode to the said array,
this poses another problem in the form of multi-peaks curves whenever the
modules are partially shaded. To further complicate matters, most conventional
Maximum Power Point Tracking methods develop errors under certain
circumstances (for example, they detect the local Maximum Power Point (MPP)
instead of the global MPP) and reduce the efficiency of PV systems even further.
Presently, much research has been undertaken to improve upon them. This study
aims to employ an evolutionary algorithm technique, also known as particle swarm
optimization, in MPP detection. VC 2014 Author(s). All article content, exceptwhere otherwise noted, is licensed under a Creative Commons Attribution 3.0Unported License. [http://dx.doi.org/10.1063/1.4868025]
I. INTRODUCTION
Compared to other means in harvesting renewable energy, photovoltaic (PV) systems can
be said to possess several fundamental advantages.1,2 For example, their application of semicon-
ductor devices makes the solar energy they collect a static, quiet, and movement-free energy
source, ensuring the system’s longevity and low-maintenance costs. Conversely, the power yield
is often diminutive, such that the individual use of PV modules is not recommended. Usually,
both, series and parallel configurations of PV modules are utilized to provide the load with the
required voltage and current.3–7 Using bypass diodes on the related configurations of PV mod-
ules, on the other hand, would produce the conditions of partial shading; whose detrimental
effects on PV array efficiency still persist despite recent advancements in technology.
Specifically, partial shading would alter the output of the array such that it results in a nonlinear
power-voltage relationship and multiple peak characteristics, the latter of which decreases the
efficiency of the conventional Maximum Power Point Tracking (MPPT) methods.8–11
Previous researches have managed to conceive appropriate MPPT methods to track the
maximum point with minimum deviations. Perturbation and Observation, Incremental
Conductance and hill climbing are the most frequently applied and well-designed of these meth-
ods used in finding the maximum power point (MPP) at a uniform insolation level.12–16
However, they are less than ideal such that, in the presence of shading, their precision in pin-
pointing the MPP becomes undermined.17–19
Studies have been undertaken to design an appropriate controller, by examining the Global
tracking method during disruptive conditions.17,20–22 In the course of these efforts, the
a)Author to whom correspondence should be addressed. Electronic mail: [email protected]
1941-7012/2014/6(2)/023102/13 VC Author(s) 20146, 023102-1
JOURNAL OF RENEWABLE AND SUSTAINABLE ENERGY 6, 023102 (2014)
conventional MPPT methods have also been improved upon, through the use of lengthy calcula-
tions. However, the research in question was constrained to a specific PV array configuration
under certain partial shading patterns. In this paper, the evolutionary algorithm termed Particle
Swarm Optimization (PSO) will be used to derive the Global MPP in a multi-peaks
function.23–26 It will also be applied to three simulations with disparate settings so as to assess
its performance in contrasting conditions.
II. MODELING
The modeling of PV systems has been extensively described in previous studies.27–31
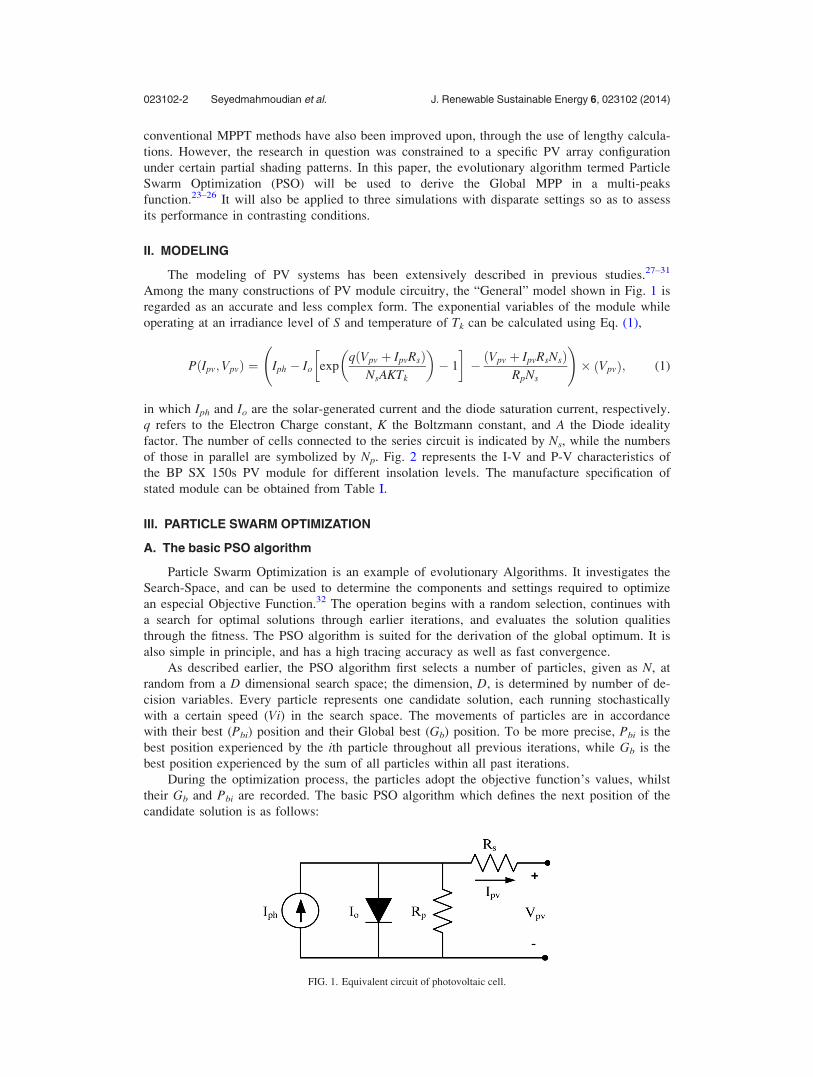
Among the many constructions of PV module circuitry, the “General” model shown in Fig. 1 is
regarded as an accurate and less complex form. The exponential variables of the module while
operating at an irradiance level of S and temperature of Tk can be calculated using Eq. (1),
PðIpv;VpvÞ ¼ Iph � Io expqðVpv þ IpvRsÞ
NsAKTk
� �� 1
� �� ðVpv þ IpvRsNsÞ
RpNs
!� Vpvð Þ; (1)
in which Iph and Io are the solar-generated current and the diode saturation current, respectively.
q refers to the Electron Charge constant, K the Boltzmann constant, and A the Diode ideality
factor. The number of cells connected to the series circuit is indicated by Ns, while the numbers
of those in parallel are symbolized by Np. Fig. 2 represents the I-V and P-V characteristics of
the BP SX 150s PV module for different insolation levels. The manufacture specification of
stated module can be obtained from Table I.
III. PARTICLE SWARM OPTIMIZATION
A. The basic PSO algorithm
Particle Swarm Optimization is an example of evolutionary Algorithms. It investigates the
Search-Space, and can be used to determine the components and settings required to optimize
an especial Objective Function.32 The operation begins with a random selection, continues with
a search for optimal solutions through earlier iterations, and evaluates the solution qualities
through the fitness. The PSO algorithm is suited for the derivation of the global optimum. It is
also simple in principle, and has a high tracing accuracy as well as fast convergence.
As described earlier, the PSO algorithm first selects a number of particles, given as N, at
random from a D dimensional search space; the dimension, D, is determined by number of de-
cision variables. Every particle represents one candidate solution, each running stochastically
with a certain speed (Vi) in the search space. The movements of particles are in accordance
with their best (Pbi) position and their Global best (Gb) position. To be more precise, Pbi is the
best position experienced by the ith particle throughout all previous iterations, while Gb is the
best position experienced by the sum of all particles within all past iterations.
During the optimization process, the particles adopt the objective function’s values, whilst
their Gb and Pbi are recorded. The basic PSO algorithm which defines the next position of the
candidate solution is as follows:
FIG. 1. Equivalent circuit of photovoltaic cell.
023102-2 Seyedmahmoudian et al. J. Renewable Sustainable Energy 6, 023102 (2014)
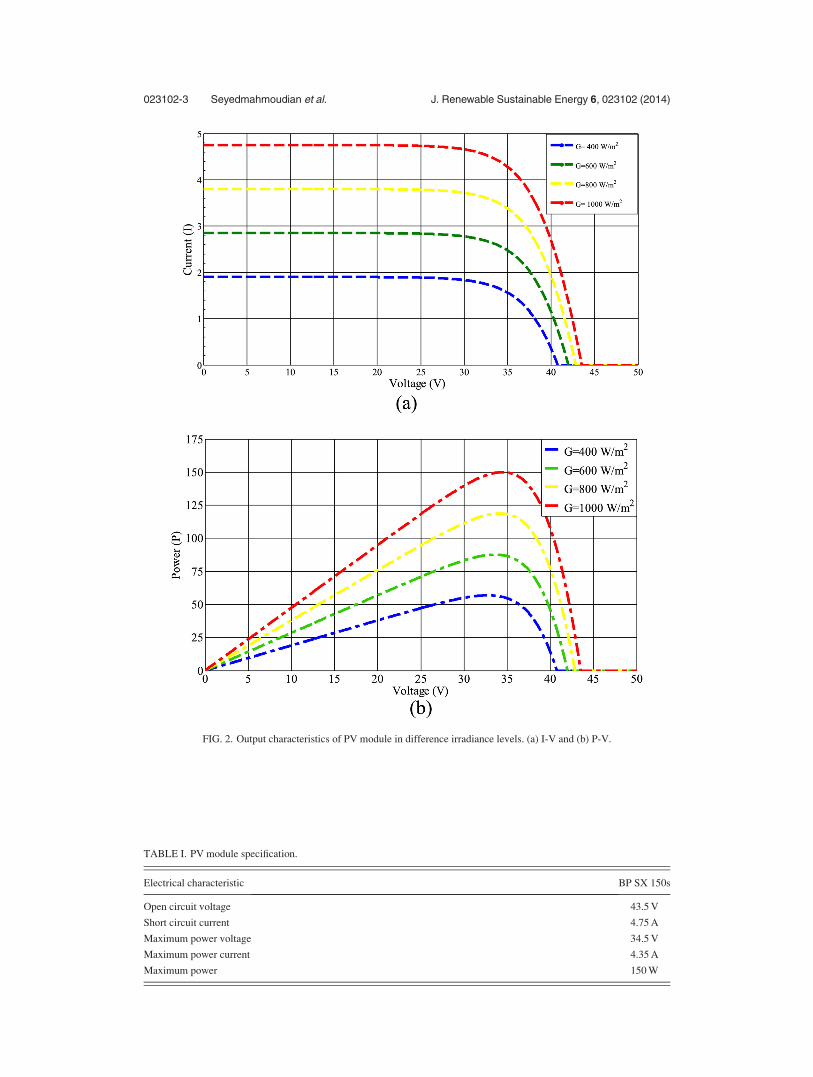
FIG. 2. Output characteristics of PV module in difference irradiance levels. (a) I-V and (b) P-V.
TABLE I. PV module specification.
Electrical characteristic BP SX 150s
Open circuit voltage 43.5 V
Short circuit current 4.75 A
Maximum power voltage 34.5 V
Maximum power current 4.35 A
Maximum power 150 W
023102-3 Seyedmahmoudian et al. J. Renewable Sustainable Energy 6, 023102 (2014)
Vikþ1 ¼ w� Vi
k þ r1 � c1 � Pbi � Xik
� �þ r2 � c2 � Gb � Xi
k� �
; (2)
Xikþ1 ¼ Xi
k þ Vik; (3)
wherein i represents the variable of the optimization vector, k is the number of iterations, Vik
and Xik the velocity and position of the ith variable within k iterations, w the inertia weight fac-
tor, c1 the cognitive coefficient of individual particles, c2 the social coefficient of all particles,
and r1 as well as r2 are the random selected variables in the range [0, 1]. The main purpose of
these random parameters is to maintain the stochastic movement within iterations. To keep the
search space in a certain area, the values of the velocity are set to the range of [0, Vmax].
As mentioned, the variable Pbi records the best position assumed by the ith particle up to
the exact time of measurement. Equation (4) indicates that this position is only recorded as Pbi
if the condition stated below is satisfied,
Pbi ¼ Xik If F Xi
k� �
� F Pið Þ: (4)
B. Design of PSO parameters
In particle swarm optimization, the parameters w, c1, and c2 are highly mutable. The slight-
est change in their values may affect on the speed and accuracy of the algorithm. The optimiza-
tion may involve in the local maximum by any poor design for c2 and its accuracy can be
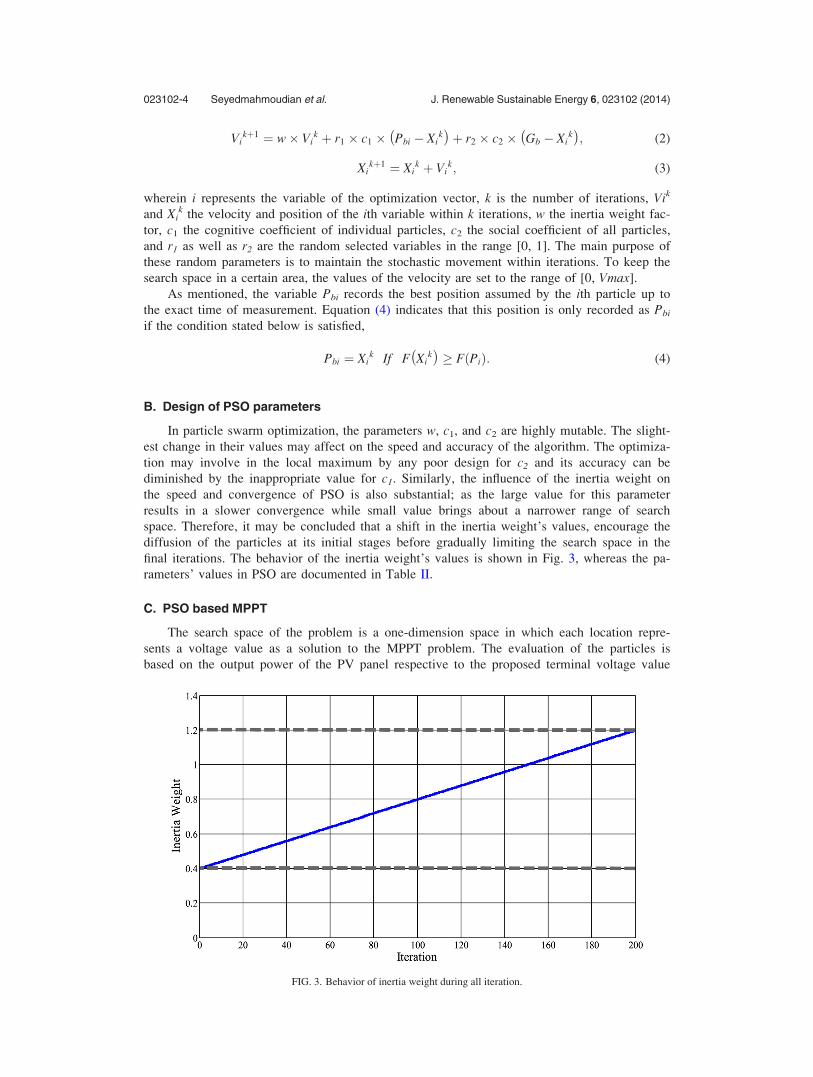
diminished by the inappropriate value for c1. Similarly, the influence of the inertia weight on
the speed and convergence of PSO is also substantial; as the large value for this parameter
results in a slower convergence while small value brings about a narrower range of search
space. Therefore, it may be concluded that a shift in the inertia weight’s values, encourage the
diffusion of the particles at its initial stages before gradually limiting the search space in the
final iterations. The behavior of the inertia weight’s values is shown in Fig. 3, whereas the pa-
rameters’ values in PSO are documented in Table II.
C. PSO based MPPT
The search space of the problem is a one-dimension space in which each location repre-
sents a voltage value as a solution to the MPPT problem. The evaluation of the particles is
based on the output power of the PV panel respective to the proposed terminal voltage value
FIG. 3. Behavior of inertia weight during all iteration.
023102-4 Seyedmahmoudian et al. J. Renewable Sustainable Energy 6, 023102 (2014)
which is denoted by F as the fitness evaluator for the particles. Equation (5) shows the location
matrix of the N particles which represents N solutions to the MPPT problem, at the same time,
Xik¼ Xk
1;Xk2;X
k3; :::::;X
ki ; ::::::X
kN�1ð Þ;X
kN
h i; (5)
where Xik is the location of ith particle at kth iteration. From a practical point of view, the gen-
erated power fluctuates due to variations in the insolation levels and degree of partial shading.
TABLE II. Parameters values of PSO.
C1 C2 w r1 and r2
2 1.5 1.2 [0–1]
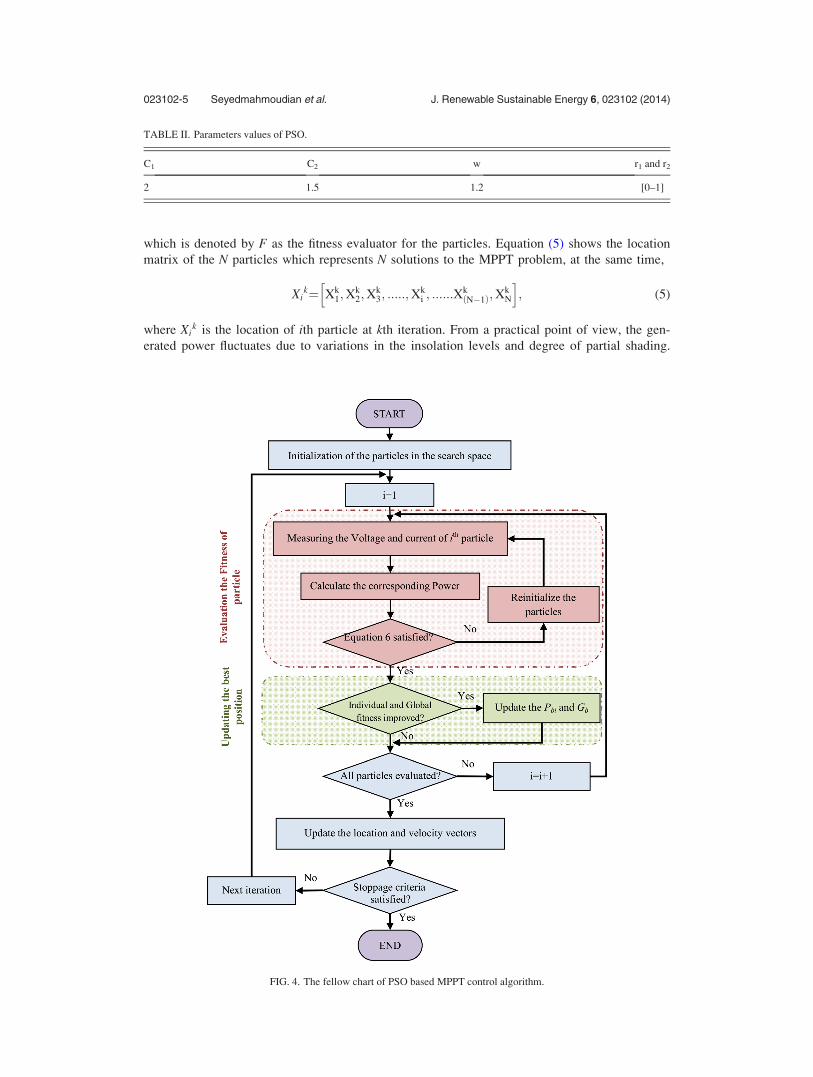
FIG. 4. The fellow chart of PSO based MPPT control algorithm.
023102-5 Seyedmahmoudian et al. J. Renewable Sustainable Energy 6, 023102 (2014)
Therefore, the algorithm must be initialized when Eq. (6) is satisfied. If this step is neglected,
the acquired values of Pbi and Gb should not be considered their actual values,
����FðXiþ1Þ � FðXiÞFðXiÞ
���� > DP: (6)
The implementation strategy of the proposed MPPT technique is briefly described in the
flowchart of Fig. 4. In the flowchart, the constraints refer to the maximum and minimum possi-
ble of the voltage which can be set for the voltage converter. In this study, voltage of the PV
array can be set from zero to Voc depending on the configuration of the array.
IV. SIMULATED CONDITIONS
In this section, the simulations of three different cases with varying degrees of partial shad-
ing are presented, to validate the performance of the proposed method in different partial shad-
ing conditions. The simulation is carried out using MATLAB software with parameters listed in
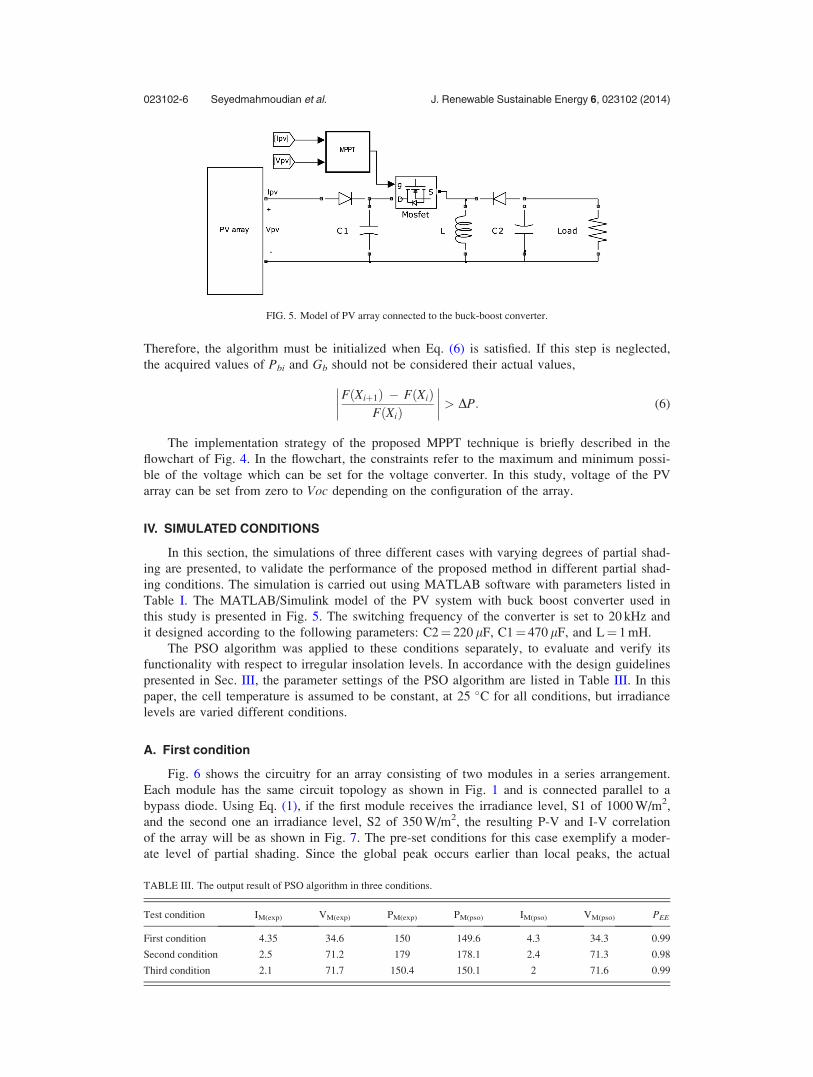
Table I. The MATLAB/Simulink model of the PV system with buck boost converter used in
this study is presented in Fig. 5. The switching frequency of the converter is set to 20 kHz and
it designed according to the following parameters: C2¼ 220 lF, C1¼ 470 lF, and L¼ 1 mH.
The PSO algorithm was applied to these conditions separately, to evaluate and verify its
functionality with respect to irregular insolation levels. In accordance with the design guidelines
presented in Sec. III, the parameter settings of the PSO algorithm are listed in Table III. In this
paper, the cell temperature is assumed to be constant, at 25 �C for all conditions, but irradiance
levels are varied different conditions.
A. First condition
Fig. 6 shows the circuitry for an array consisting of two modules in a series arrangement.
Each module has the same circuit topology as shown in Fig. 1 and is connected parallel to a
bypass diode. Using Eq. (1), if the first module receives the irradiance level, S1 of 1000 W/m2,
and the second one an irradiance level, S2 of 350 W/m2, the resulting P-V and I-V correlation
of the array will be as shown in Fig. 7. The pre-set conditions for this case exemplify a moder-
ate level of partial shading. Since the global peak occurs earlier than local peaks, the actual
FIG. 5. Model of PV array connected to the buck-boost converter.
TABLE III. The output result of PSO algorithm in three conditions.
Test condition IM(exp) VM(exp) PM(exp) PM(pso) IM(pso) VM(pso) PEE
First condition 4.35 34.6 150 149.6 4.3 34.3 0.99
Second condition 2.5 71.2 179 178.1 2.4 71.3 0.98
Third condition 2.1 71.7 150.4 150.1 2 71.6 0.99
023102-6 Seyedmahmoudian et al. J. Renewable Sustainable Energy 6, 023102 (2014)
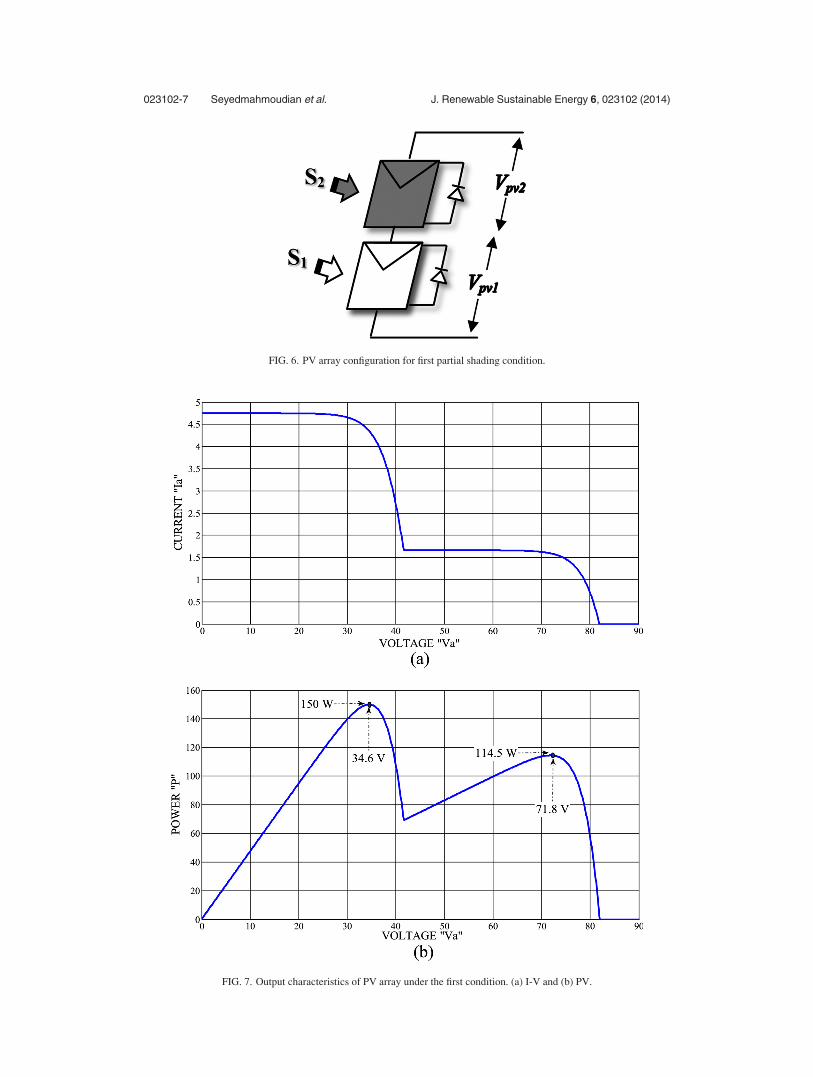
FIG. 6. PV array configuration for first partial shading condition.
FIG. 7. Output characteristics of PV array under the first condition. (a) I-V and (b) PV.
023102-7 Seyedmahmoudian et al. J. Renewable Sustainable Energy 6, 023102 (2014)
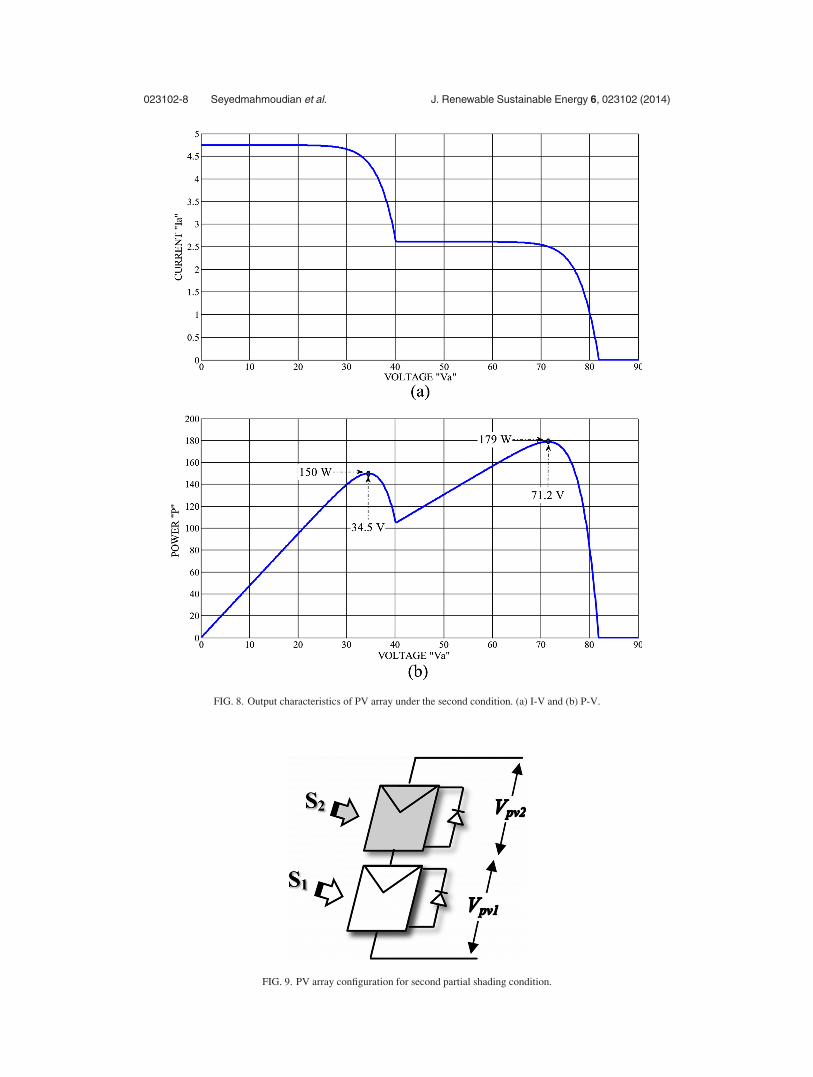
FIG. 8. Output characteristics of PV array under the second condition. (a) I-V and (b) P-V.
FIG. 9. PV array configuration for second partial shading condition.
023102-8 Seyedmahmoudian et al. J. Renewable Sustainable Energy 6, 023102 (2014)
MPP can be obtained even with the traditional MPPT techniques. This is because the conven-
tional methods are often concerned with the first peak, which basically attunes them to finding
the Global MPP under the aforementioned conditions.
B. Second condition
The second case is largely similar to the first, but differentiates from it in that there is a
huge difficulty in using the conventional MPPT methods; as the global MPP now occurs after
the local. Fig. 8 shows the output characteristic of the PV array shown in Fig. 9, while the first
and second modules receive the irradiance levels S1¼ 1000 W/m2 and S2¼ 550 W/m2,
respectively.
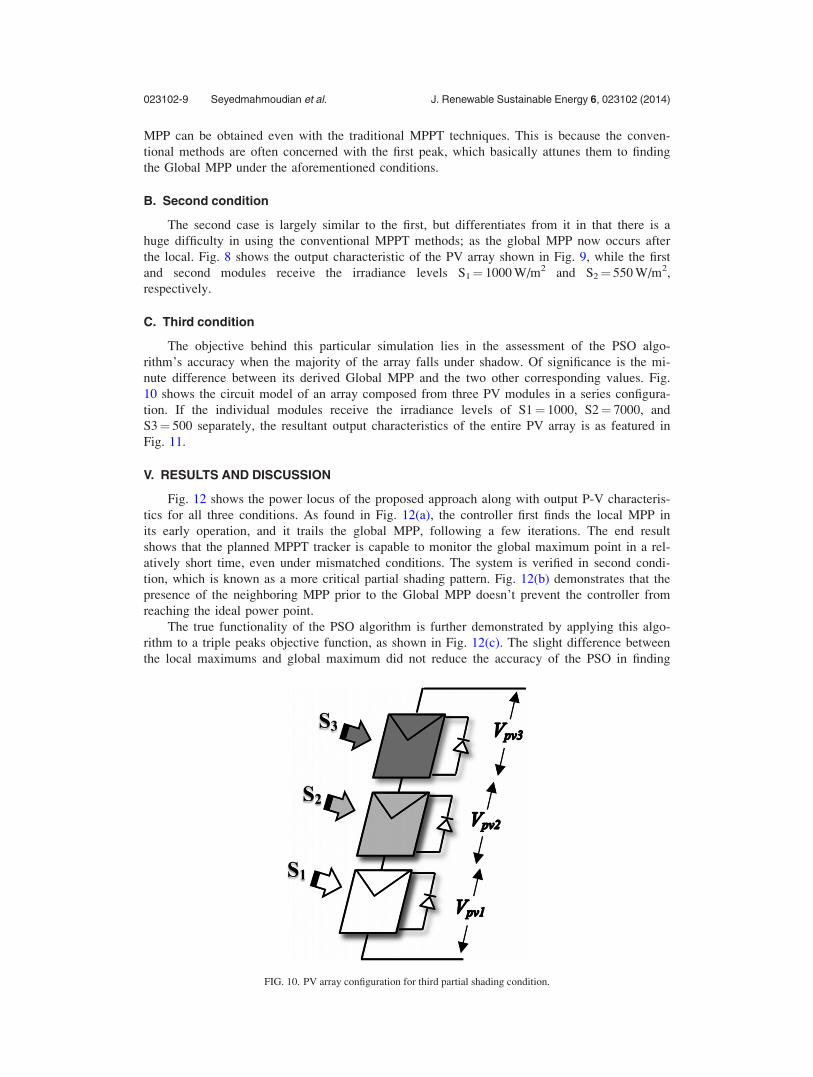
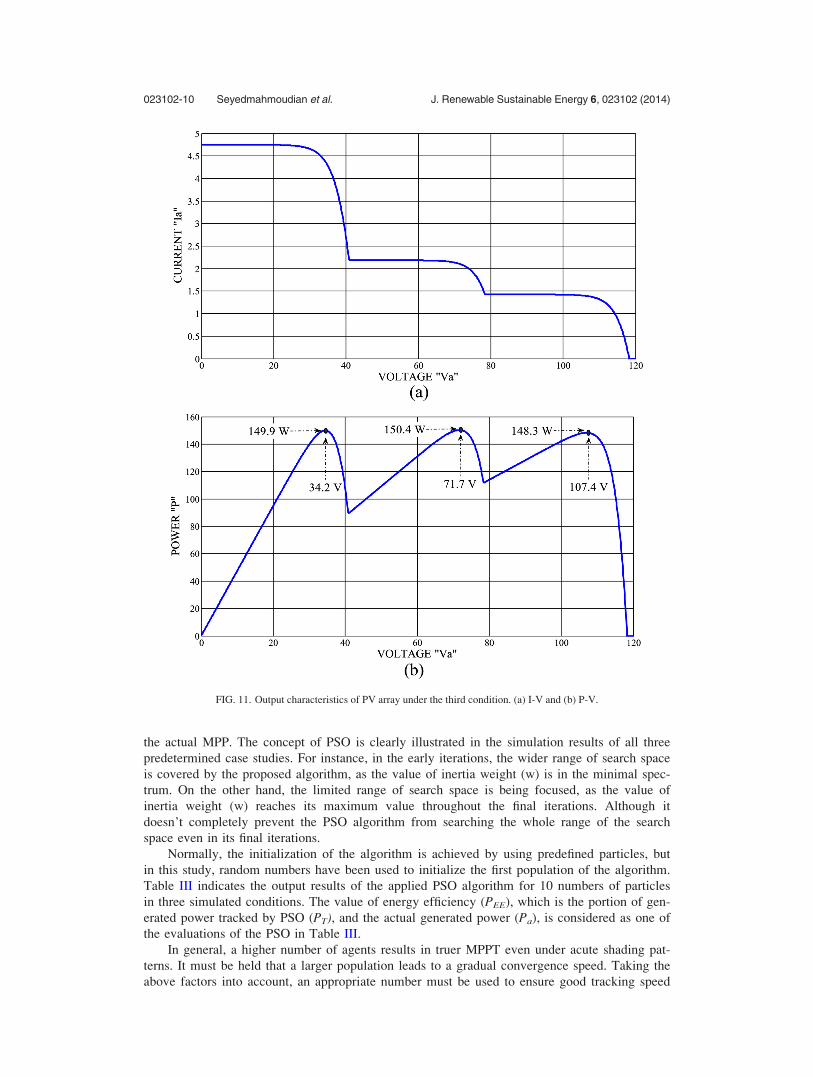
C. Third condition
The objective behind this particular simulation lies in the assessment of the PSO algo-
rithm’s accuracy when the majority of the array falls under shadow. Of significance is the mi-
nute difference between its derived Global MPP and the two other corresponding values. Fig.
10 shows the circuit model of an array composed from three PV modules in a series configura-
tion. If the individual modules receive the irradiance levels of S1¼ 1000, S2¼ 7000, and
S3¼ 500 separately, the resultant output characteristics of the entire PV array is as featured in
Fig. 11.
V. RESULTS AND DISCUSSION
Fig. 12 shows the power locus of the proposed approach along with output P-V characteris-
tics for all three conditions. As found in Fig. 12(a), the controller first finds the local MPP in
its early operation, and it trails the global MPP, following a few iterations. The end result
shows that the planned MPPT tracker is capable to monitor the global maximum point in a rel-
atively short time, even under mismatched conditions. The system is verified in second condi-
tion, which is known as a more critical partial shading pattern. Fig. 12(b) demonstrates that the
presence of the neighboring MPP prior to the Global MPP doesn’t prevent the controller from
reaching the ideal power point.
The true functionality of the PSO algorithm is further demonstrated by applying this algo-
rithm to a triple peaks objective function, as shown in Fig. 12(c). The slight difference between
the local maximums and global maximum did not reduce the accuracy of the PSO in finding
FIG. 10. PV array configuration for third partial shading condition.
023102-9 Seyedmahmoudian et al. J. Renewable Sustainable Energy 6, 023102 (2014)
the actual MPP. The concept of PSO is clearly illustrated in the simulation results of all three
predetermined case studies. For instance, in the early iterations, the wider range of search space
is covered by the proposed algorithm, as the value of inertia weight (w) is in the minimal spec-
trum. On the other hand, the limited range of search space is being focused, as the value of
inertia weight (w) reaches its maximum value throughout the final iterations. Although it
doesn’t completely prevent the PSO algorithm from searching the whole range of the search
space even in its final iterations.
Normally, the initialization of the algorithm is achieved by using predefined particles, but
in this study, random numbers have been used to initialize the first population of the algorithm.
Table III indicates the output results of the applied PSO algorithm for 10 numbers of particles
in three simulated conditions. The value of energy efficiency (PEE), which is the portion of gen-
erated power tracked by PSO (PT), and the actual generated power (Pa), is considered as one of
the evaluations of the PSO in Table III.
In general, a higher number of agents results in truer MPPT even under acute shading pat-
terns. It must be held that a larger population leads to a gradual convergence speed. Taking the
above factors into account, an appropriate number must be used to ensure good tracking speed
FIG. 11. Output characteristics of PV array under the third condition. (a) I-V and (b) P-V.
023102-10 Seyedmahmoudian et al. J. Renewable Sustainable Energy 6, 023102 (2014)
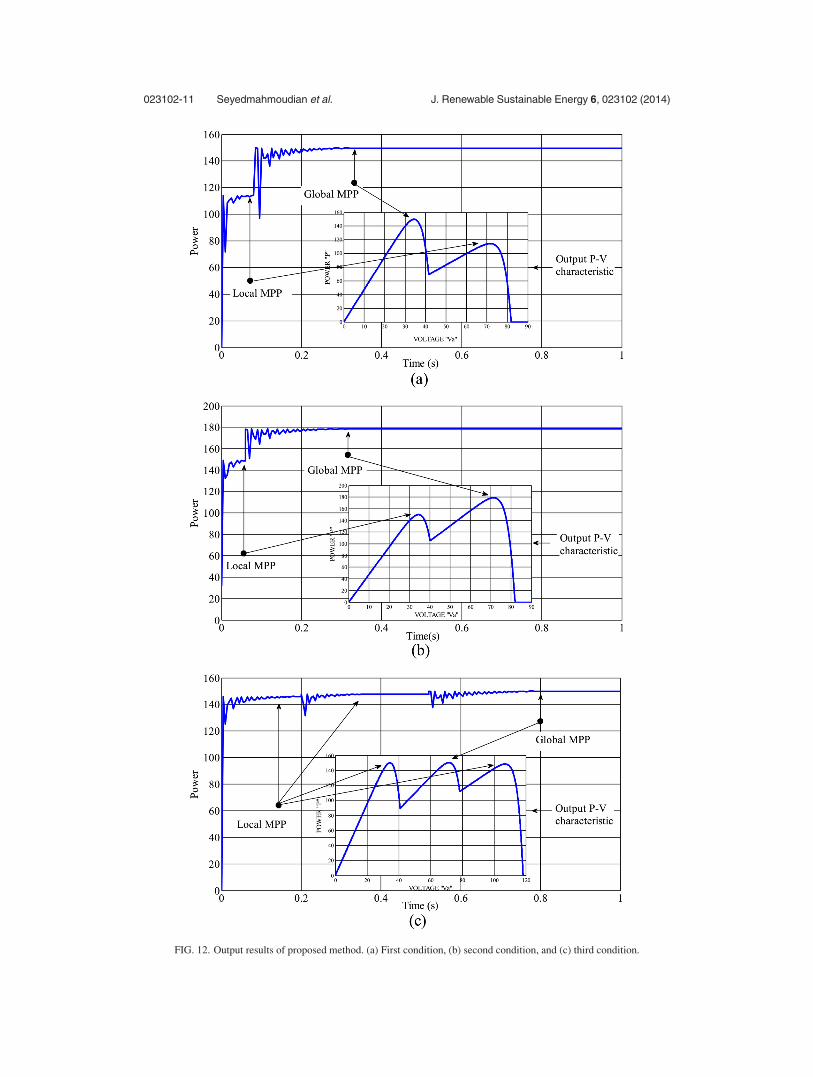
FIG. 12. Output results of proposed method. (a) First condition, (b) second condition, and (c) third condition.
023102-11 Seyedmahmoudian et al. J. Renewable Sustainable Energy 6, 023102 (2014)
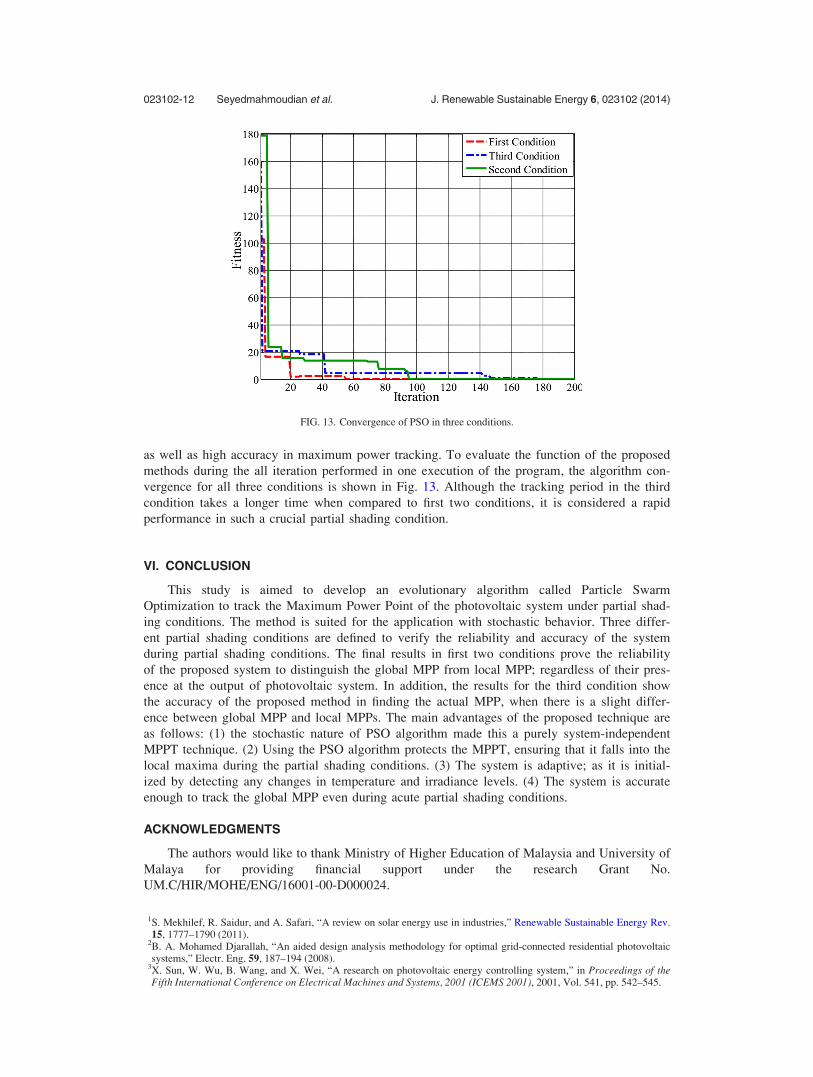
as well as high accuracy in maximum power tracking. To evaluate the function of the proposed
methods during the all iteration performed in one execution of the program, the algorithm con-
vergence for all three conditions is shown in Fig. 13. Although the tracking period in the third
condition takes a longer time when compared to first two conditions, it is considered a rapid
performance in such a crucial partial shading condition.
VI. CONCLUSION
This study is aimed to develop an evolutionary algorithm called Particle Swarm
Optimization to track the Maximum Power Point of the photovoltaic system under partial shad-
ing conditions. The method is suited for the application with stochastic behavior. Three differ-
ent partial shading conditions are defined to verify the reliability and accuracy of the system
during partial shading conditions. The final results in first two conditions prove the reliability
of the proposed system to distinguish the global MPP from local MPP; regardless of their pres-
ence at the output of photovoltaic system. In addition, the results for the third condition show
the accuracy of the proposed method in finding the actual MPP, when there is a slight differ-
ence between global MPP and local MPPs. The main advantages of the proposed technique are
as follows: (1) the stochastic nature of PSO algorithm made this a purely system-independent
MPPT technique. (2) Using the PSO algorithm protects the MPPT, ensuring that it falls into the
local maxima during the partial shading conditions. (3) The system is adaptive; as it is initial-
ized by detecting any changes in temperature and irradiance levels. (4) The system is accurate
enough to track the global MPP even during acute partial shading conditions.
ACKNOWLEDGMENTS
The authors would like to thank Ministry of Higher Education of Malaysia and University of
Malaya for providing financial support under the research Grant No.
UM.C/HIR/MOHE/ENG/16001-00-D000024.
1S. Mekhilef, R. Saidur, and A. Safari, “A review on solar energy use in industries,” Renewable Sustainable Energy Rev.15, 1777–1790 (2011).
2B. A. Mohamed Djarallah, “An aided design analysis methodology for optimal grid-connected residential photovoltaicsystems,” Electr. Eng. 59, 187–194 (2008).
3X. Sun, W. Wu, B. Wang, and X. Wei, “A research on photovoltaic energy controlling system,” in Proceedings of theFifth International Conference on Electrical Machines and Systems, 2001 (ICEMS 2001), 2001, Vol. 541, pp. 542–545.
FIG. 13. Convergence of PSO in three conditions.
023102-12 Seyedmahmoudian et al. J. Renewable Sustainable Energy 6, 023102 (2014)
4V. Salas, E. Olias, A. Barrado, and A. Lazaro, “Review of the maximum power point tracking algorithms for stand-alonephotovoltaic systems,” Sol. Energy Mater. Sol. Cells 90, 1555–1578 (2006).
5E. V. Paraskevadaki and S. A. Papathanassiou, “Evaluation of MPP voltage and power of mc-Si PV modules in partialshading conditions,” IEEE Trans. Energy Convers. 26, 923–932 (2011).
6A. H. M. Nordin and A. M. Omar, “Modeling and simulation of photovoltaic (PV) array and maximum power pointtracker (MPPT) for grid-connected PV system,” in 2011 3rd International Symposium & Exhibition in SustainableEnergy & Environment (ISESEE), 2011, pp. 114–119.
7M. A. Green, “Photovoltaics: Coming of age,” in 1990 Conference Record of the Twenty First IEEE PhotovoltaicSpecialists Conference, 1990, Vol. 1, pp. 1–8.
8S. Silvestre, A. Boronat, and A. Chouder, “Study of bypass diodes configuration on PV modules,” Appl. Energy 86,1632–1640 (2009).
9H. Patel and V. Agarwal, “MATLAB-based modeling to study the effects of partial shading on PV array characteristics,”IEEE Trans. Energy Convers. 23, 302–310 (2008).
10A. Safari and S. Mekhilef, “Incremental conductance MPPT method for PV systems,” in 2011 24th Canadian Conferenceon Electrical and Computer Engineering (CCECE), 2011, pp. 000345–000347.
11A. Safari and S. Mekhilef, “Implementation of incremental conductance method with direct control,” in 2011 IEEERegion 10 Conference on TENCON 2011, 2011, pp. 944–948.
12L. Yupeng, X. Dongwei, and H. Zhanning, “MPPT of a PV system based on the particle swarm optimization,” in 20114th International Conference on Electric Utility Deregulation and Restructuring and Power Technologies (DRPT), 2011,pp. 1094–1096.
13A. Safari and S. Mekhilef, “Simulation and hardware implementation of incremental conductance MPPT with direct con-trol method using cuk converter,” IEEE Trans. Ind. Electron. 58, 1154–1161 (2011).
14E. I. Rtiz-Rivera and P. Fang, “A novel method to estimate the maximum power for a photovoltaic inverter system,” in2004 IEEE 35th Annual Power Electronics Specialists Conference, 2004 (PESC 04), 2004, Vol. 2063, pp. 2065–2069.
15D. Hohm and M. Ropp, “Comparative study of maximum power point tracking algorithms,” Prog. Photovoltaics: Res.Appl. 11, 47–62 (2003).
16L. Fangrui, K. Yong, Z. Yu, and D. Shanxu, “Comparison of P&O and hill climbing MPPT methods for grid-connectedPV converter,” in 3rd IEEE Conference on, Industrial Electronics and Applications, 2008 (ICIEA 2008), 2008, pp.804–807.
17X. Weidong and W. G. Dunford, “A modified adaptive hill climbing MPPT method for photovoltaic power systems,” in2004 IEEE 35th Annual Power Electronics Specialists Conference, 2004 (PESC 04), 2004, Vol. 1953, pp. 1957–1963.
18D. Sera, T. Kerekes, R. Teodorescu, and F. Blaabjerg, “Improved MPPT algorithms for rapidly changing environmentalconditions,” in 12th International Power Electronics and Motion Control Conference, 2006 (EPE-PEMC 2006), 2006,pp. 1614–1619.
19W. T. Jewell and T. D. Unruh, “Limits on cloud-induced fluctuation in photovoltaic generation,” IEEE Trans. EnergyConvers. 5, 8–14 (1990).
20V. Phimmasone, Y. Kondo, T. Kamejima, and M. Miyatake, “Evaluation of extracted energy from PV with PSO-basedMPPT against various types of solar irradiation changes,” in 2010 International Conference on Electrical Machines andSystems (ICEMS), 2010, pp. 487–492.
21H. Patel and V. Agarwal, “Maximum power point tracking scheme for PV systems operating under partially shaded con-ditions,” IEEE Trans. Ind. Electron. 55, 1689–1698 (2008).
22A. M. Bazzi and S. H. Karaki, “Simulation of a new maximum power point tracking technique for multiple photovoltaicarrays,” in IEEE International Conference on Electro/Information Technology, 2008 (EIT 2008), 2008, pp. 175–178.
23Y. Shi and R. Eberhart, “A modified particle swarm optimizer,” in The 1998 IEEE International Conference onEvolutionary Computation Proceedings, 1998, IEEE World Congress on Computational Intelligence, 1998, pp. 69–73.
24J. Kennedy and R. Eberhart, “Particle swarm optimization,” in Proceedings of IEEE International Conference on NeuralNetworks, 1995 (1995), Vol.1944, pp. 1942–1948.
25R. C. Eberhart, Y. Shi, and J. Kennedy, Swarm Intelligence (Elsevier, 2001).26K. Ishaque, Z. Salam, M. Amjad, and S. Mekhilef, “An improved particle swarm optimization (PSO) based MPPT for PV
with reduced steady state oscillation,” IEEE Trans. Power Electron. 27, 3627–3638 (2012).27Y. Yusof, S. H. Sayuti, M. Abdul Latif, and M. Z. C. Wanik, “Modeling and simulation of maximum power point tracker
for photovoltaic system,” in Proceedings of National Power and Energy Conference, 2004 (PEC 2004), 2004, pp. 88–93.28A. Durgadevi, S. Arulselvi, and S. P. Natarajan, “Photovoltaic modeling and its characteristics,” in 2011 International
Conference on Emerging Trends in Electrical and Computer Technology (ICETECT), 2011, pp. 469–475.29M. S. Mahmodian, R. Rahmani, E. Taslimi, and S. Mekhilef, “Step by step analyzing, modeling and simulation of single
and double array PV system in different environmental variability,” in International Conference on Future Environmentand Energy, IPCBEE: Singapore, 2012, pp. 37–42.
30J. M. Deo Dusabe and A. Jimoh “Modelling of cloudless solar radiation for PV module performance analysis,” Electr.Eng. 60, 192–197 (2009).
31M. Seyedmahmoudian, S. Mekhilef, R. Rahmani, R. Yusof, and E. Renani, “Analytical modeling of partially shaded pho-tovoltaic systems,” Energies 6, 128–144 (2013).
32J. H. Seo, C. H. Im, C. G. Heo, J. K. Kim, H. K. Jung, and C. G. Lee, “Multimodal function optimization based on particleswarm optimization,” IEEE Trans. Magn. 42, 1095–1098 (2006).
023102-13 Seyedmahmoudian et al. J. Renewable Sustainable Energy 6, 023102 (2014)