Embed Size (px)
DESCRIPTION
Evolution of V D and I LEAK of the ATLAS barrel SCT ( Version 8 ) 5 December , 2009 Paul Dervan, Joost Vosenbeld(University of Liverpool) and Taka Kondo (KEK). [1]Reproduction of the ATLAS ID-TDR results…………...2 [2]Updating the basic parameters…........…………………3 - PowerPoint PPT Presentation
Citation preview
Evolution of VD and ILEAK of the ATLAS barrel SCT
(Version 8)5 December , 2009
Paul Dervan, Joost Vosenbeld(University of Liverpool)and
Taka Kondo (KEK)
23/04/20 1
[1] Reproduction of the ATLAS ID-TDR results…………... 2[2] Updating the basic parameters…........………………… 3[3] New luminosity profile and ATLAS radiation level….… 4[4] New access conditions and cooling scenarios……….. 5[5] Radiation damage models ………………………..…… 6[6] Full depletion voltage VD …………………………....…... 8[7] Bulk leakage current …………………….……….………. 12[8] HV profiles …………………………………………….… 16[9] Power dissipation on the sensors………………………. 18[10] Thermal stability and runaway…………………………… 20[11] Dependence on maintenance days……………………. 22[12] Barrel-6 with special cooling scenario-J ……………… 24[13] Calculation with constant coolant temperature ……… 25
[1] Reproduction of the ATLAS ID-TDR results
23/04/20 2
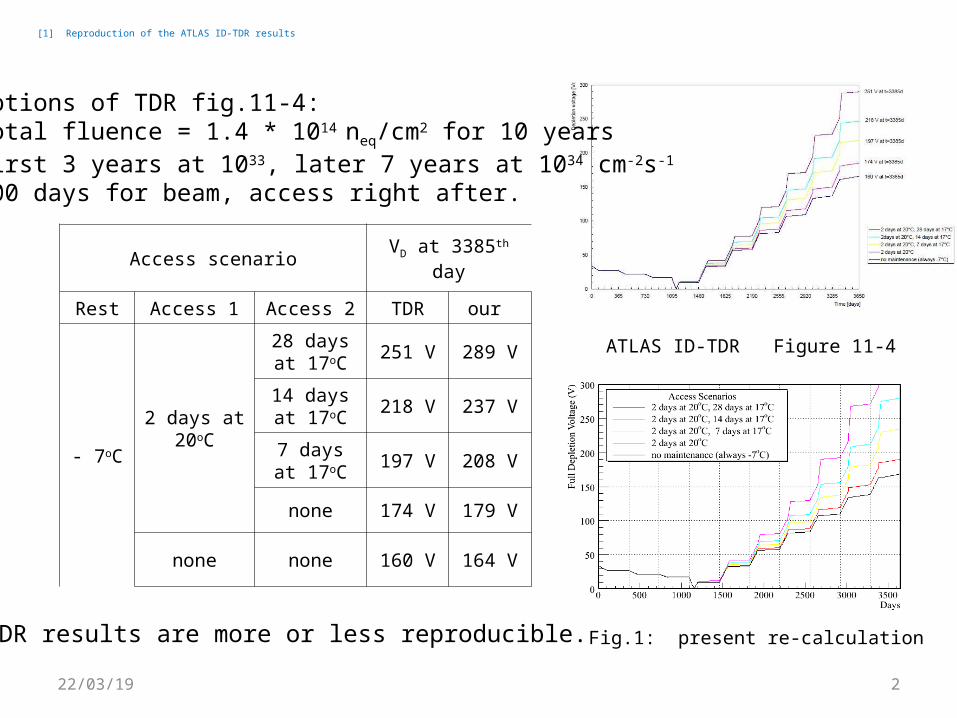
ATLAS ID-TDR Figure 11-4
Fig.1: present re-calculation
Assumptions of TDR fig.11-4: - Total fluence = 1.4 * 1014 neq/cm2 for 10 years - First 3 years at 1033, later 7 years at 1034 cm-2s-1 - 100 days for beam, access right after.
Access scenarioVD at 3385th
day
Rest Access 1 Access 2 TDR our
- 7oC
2 days at 20oC
28 days at 17oC
251 V 289 V
14 days at 17oC
218 V 237 V
7 days at 17oC
197 V 208 V
none 174 V 179 V
none none 160 V 164 V
TDR results are more or less reproducible.
[2] Updating the basic parameters
23/04/20 3
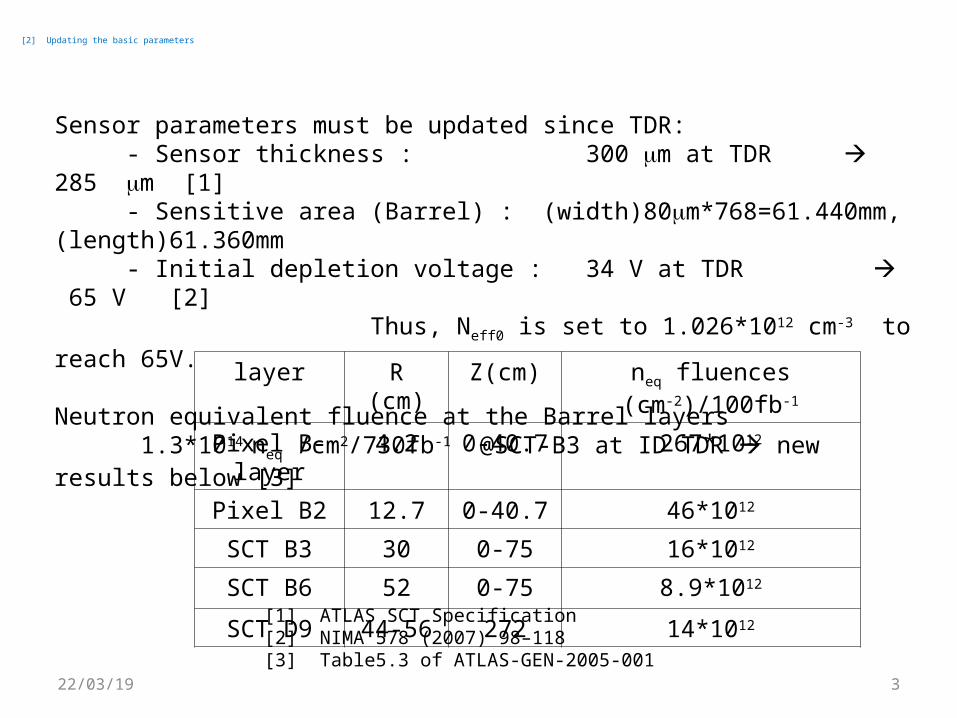
Sensor parameters must be updated since TDR: - Sensor thickness : 300 m at TDR 285 m [1] - Sensitive area (Barrel) : (width)80m*768=61.440mm, (length)61.360mm - Initial depletion voltage : 34 V at TDR 65 V [2] Thus, Neff0 is set to 1.026*1012 cm-3 to reach 65V.
Neutron equivalent fluence at the Barrel layers 1.3*1014 neq /cm2/730fb-1 @SCT-B3 at ID TDR new results below [3]
[1] ATLAS SCT Specification [2] NIMA 578 (2007) 98–118[3] Table5.3 of ATLAS-GEN-2005-001
layer R (cm) Z(cm) neq fluences (cm-2)/100fb-1
Pixel B-layer 4.2 0-40.7 267*1012
Pixel B2 12.7 0-40.7 46*1012
SCT B3 30 0-75 16*1012
SCT B6 52 0-75 8.9*1012
SCT D9 44-56 272 14*1012
23/04/20 4
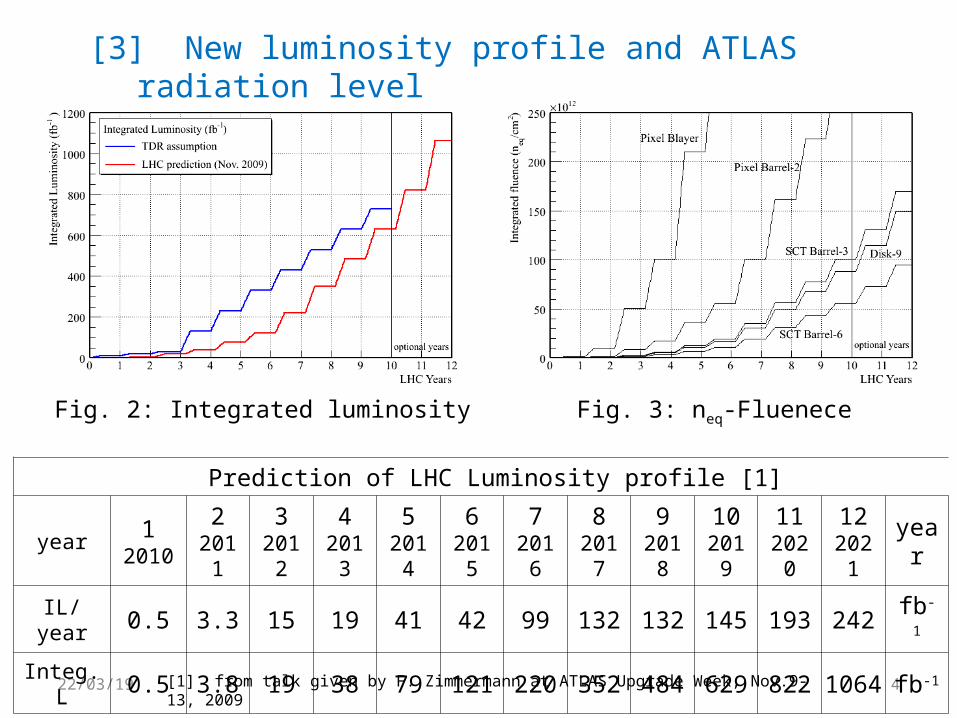
Prediction of LHC Luminosity profile [1]
year 12010
22011
32012
42013
52014
62015
72016
82017
92018
102019
112020
122021
year
IL/year 0.5 3.3 15 19 41 42 99 132 132 145 193 242 fb-1
Integ. L 0.5 3.8 19 38 79 121 220 352 484 629 822 1064 fb-1
[3] New luminosity profile and ATLAS radiation level
Fig. 2: Integrated luminosity Fig. 3: neq-Fluenece
[1] from talk given by F. Zimmermann at ATLAS Upgrade Week, Nov.9-13, 2009
23/04/20 5
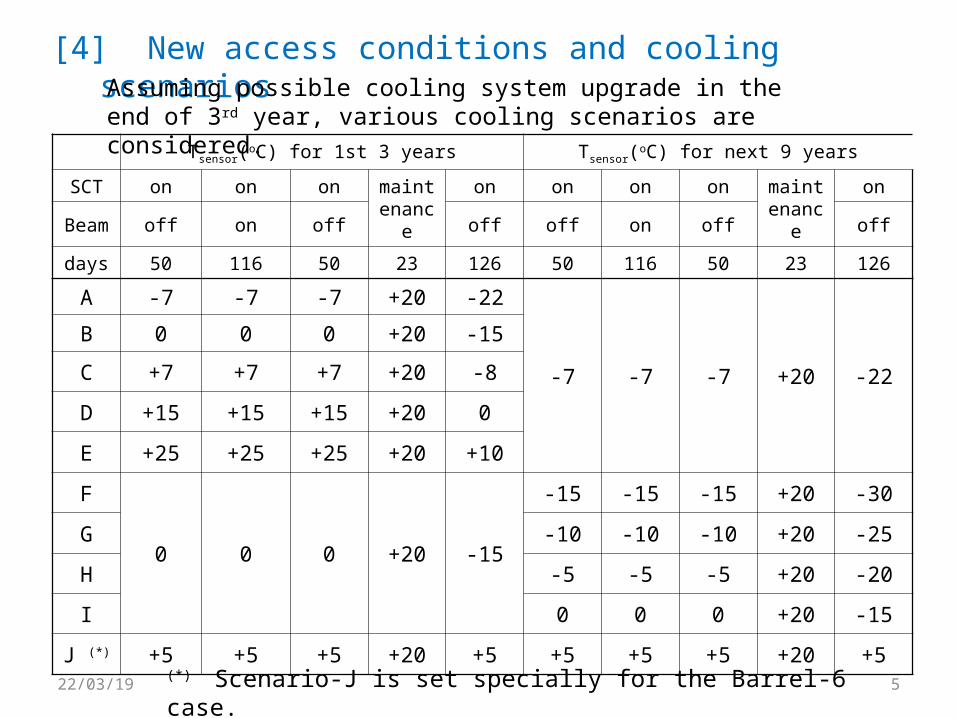
[4] New access conditions and cooling scenarios
Assuming possible cooling system upgrade in the end of 3rd year, various cooling scenarios are considered.
Tsensor(oC) for 1st 3 years Tsensor(oC) for next 9 years
SCT on on on maintenanc
e
on on on on maintenanc
e
on
Beam
off on off off off on off off
days 50 116 50 23 126 50 116 50 23 126
A -7 -7 -7 +20 -22
-7 -7 -7 +20 -22
B 0 0 0 +20 -15
C +7 +7 +7 +20 -8
D +15 +15 +15 +20 0
E +25 +25 +25 +20 +10
F
0 0 0 +20 -15
-15 -15 -15 +20 -30
G -10 -10 -10 +20 -25
H -5 -5 -5 +20 -20
I 0 0 0 +20 -15
J (*) +5 +5 +5 +20 +5 +5 +5 +5 +20 +5
(*) Scenario-J is set specially for the Barrel-6 case.
23/04/206
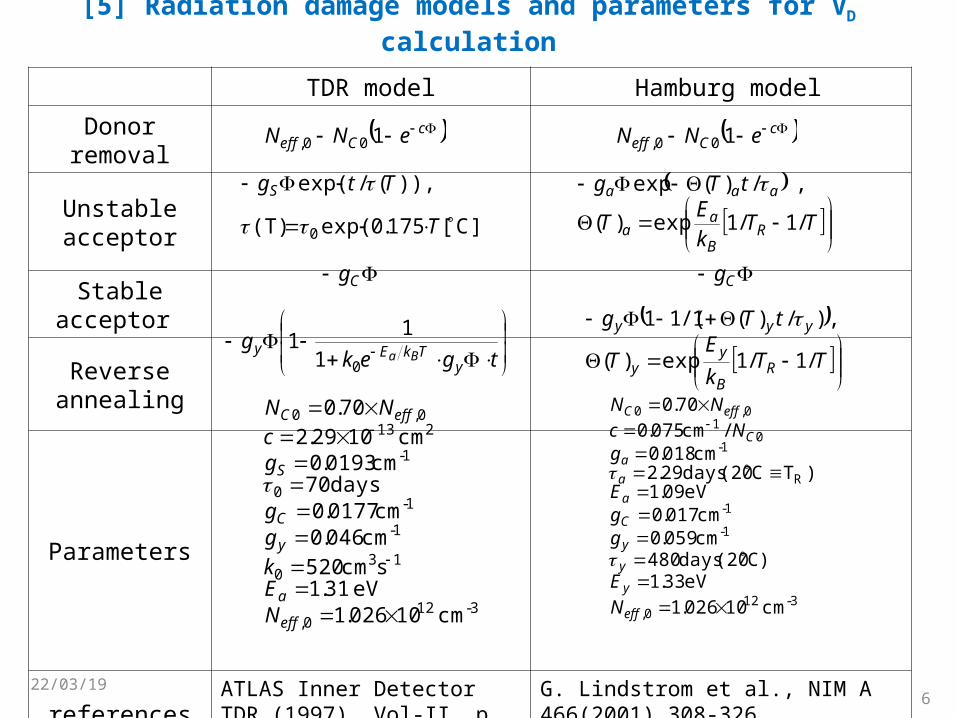
TDR model Hamburg model
Donor removal
Unstable acceptor
Stable acceptor
Reverse annealing
Parameters
references ATLAS Inner Detector TDR (1997), Vol-II, p. 402, Table 11-5
G. Lindstrom et al., NIM A 466(2001) 308-326
cCeff eNN 100,
Cg
TTk
ET
tTg
RB
aa
aaa
/1/1exp)(
, /)(exp
TTk
ET
tTg
RB
yy
yyy
/1/1exp)(
,)/)(1/(11
tgek
gy
TkEy Ba01
11
])C[175.0exp((T)
)),(/exp(
0
T
TtgS
3-120,
130
1-
1-0
1-
2130,0
cm 10026.1eV 31.1
scm 520
cm 046.0cm 0177.0
days 70cm 0193.0
cm 1029.2
70.0
eff
a
y
C
S
effC
NEk
gg
gc
NN
[5] Radiation damage models and parameters for VD calculation
cCeff eNN 100,
Cg
3-120,
1-
1-
R
1-0
10,0
cm 10026.1
eV 33.1C)(20 days 480
cm 059.0cm 017.0
eV 09.1)TC(20 days 29.2
cm 018.0 /cm 075.0
70.0
eff
y
y
y
C
a
a
a
C
effC
N
E
ggE
gNc
NN
23/04/20 7
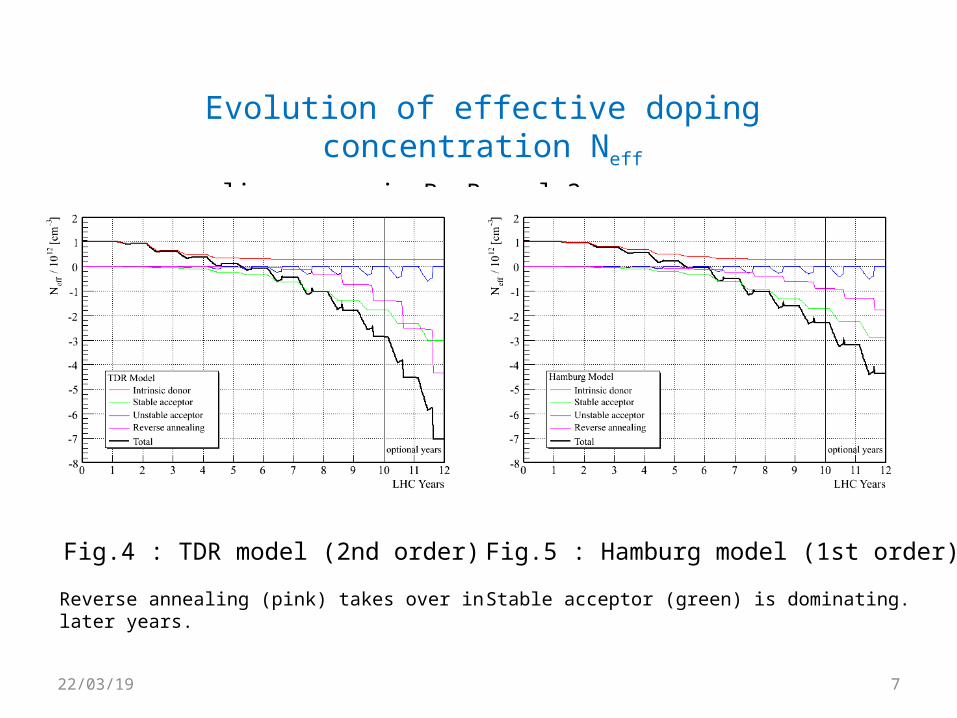
Evolution of effective doping concentration Neff
cooling scenario B, Barrel-3
Fig.4 : TDR model (2nd order)
Reverse annealing (pink) takes over in later years.
Fig.5 : Hamburg model (1st order)
Stable acceptor (green) is dominating.
23/04/20 8
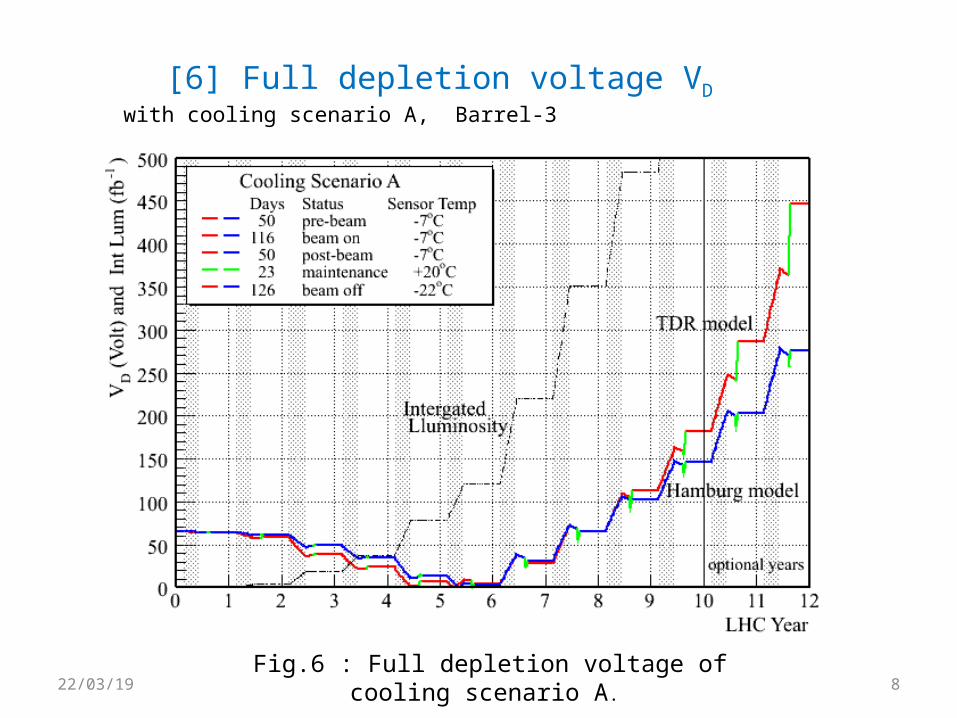
[6] Full depletion voltage VD with cooling scenario A, Barrel-3
Fig.6 : Full depletion voltage of cooling scenario A.
23/04/20 9
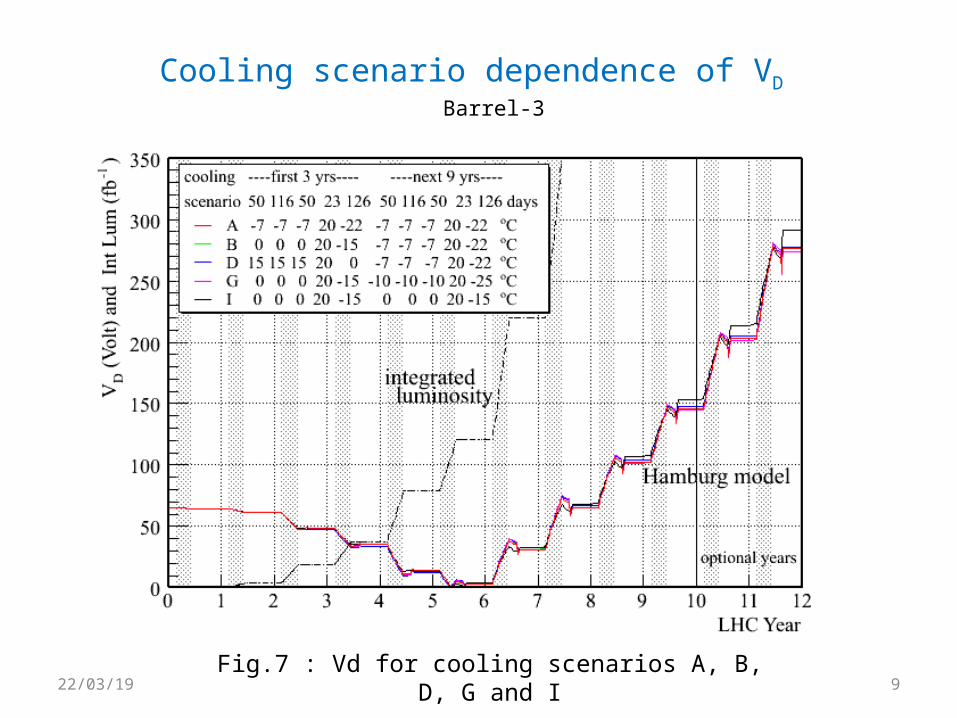
Cooling scenario dependence of VD Barrel-3
Fig.7 : Vd for cooling scenarios A, B, D, G and I
23/04/20 10
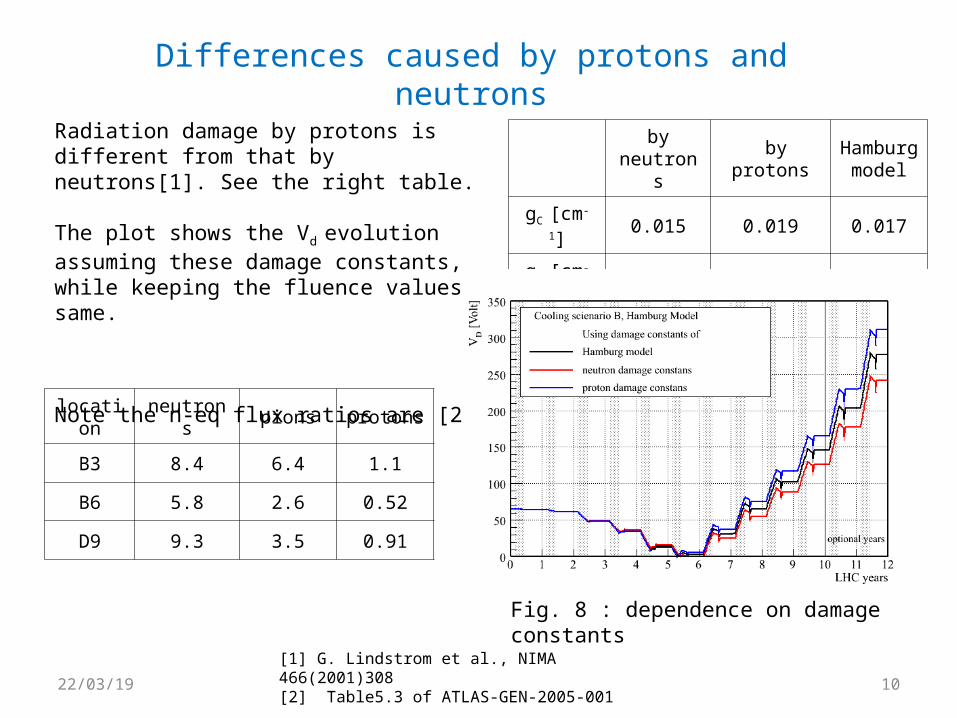
Differences caused by protons and neutrons
Radiation damage by protons is different from that by neutrons[1]. See the right table.
The plot shows the Vd evolution assuming these damage constants, while keeping the fluence values same.
Note the n-eq flux ratios are [2]
by neutrons
byprotons
Hamburg model
gC [cm-1] 0.015 0.019 0.017
gY [cm-1] 0.052 0.066 0.059
[1] G. Lindstrom et al., NIMA 466(2001)308[2] Table5.3 of ATLAS-GEN-2005-001
location
neutrons pions protons
B3 8.4 6.4 1.1
B6 5.8 2.6 0.52
D9 9.3 3.5 0.91
Fig. 8 : dependence on damage constants
11
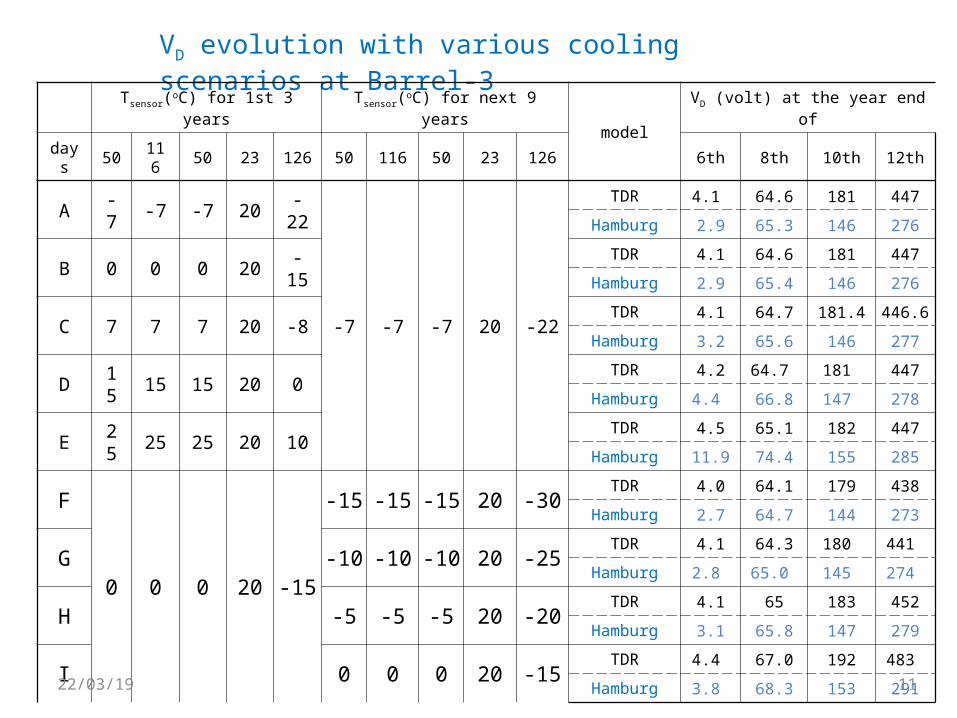
VD evolution with various cooling scenarios at Barrel-3
Tsensor(oC) for 1st 3 years Tsensor(oC) for next 9 years
model
VD (volt) at the year end of
days
50116
50 23126
50 116 50 23 126 6th 8th 10th 12th
A -7 -7 -7 20-
22
-7 -7 -7 20 -22
TDR 4.1 64.6 181 447
Hamburg 2.9 65.3 146 276
B 0 0 0 20-
15TDR 4.1 64.6 181 447
Hamburg 2.9 65.4 146 276
C 7 7 7 20 -8TDR 4.1 64.7 181.4 446.6
Hamburg 3.2 65.6 146 277
D15
15 15 20 0TDR 4.2 64.7 181 447
Hamburg 4.4 66.8 147 278
E25
25 25 20 10TDR 4.5 65.1 182 447
Hamburg 11.9 74.4 155 285
F
0 0 0 20 -15
-15 -15 -15 20 -30TDR 4.0 64.1 179 438
Hamburg 2.7 64.7 144 273
G -10 -10 -10 20 -25TDR 4.1 64.3 180 441
Hamburg 2.8 65.0 145 274
H -5 -5 -5 20 -20TDR 4.1 65 183 452
Hamburg 3.1 65.8 147 279
I 0 0 0 20 -15TDR 4.4 67.0 192 483
Hamburg 3.8 68.3 153 29123/04/20
23/04/2012
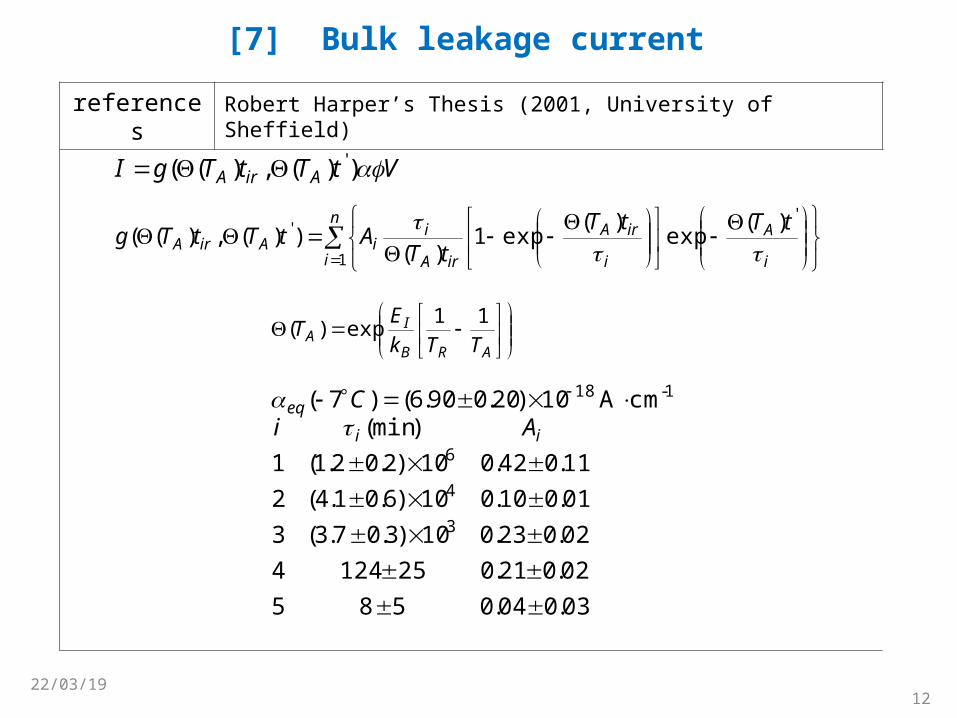
references Robert Harper’s Thesis (2001, University of Sheffield)
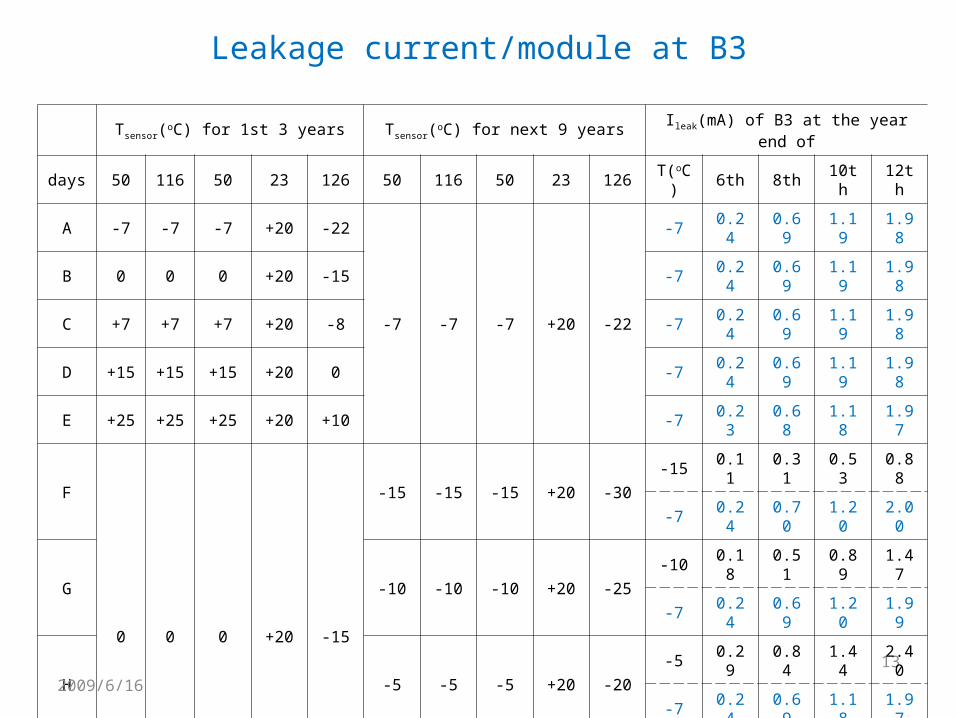
[7] Bulk leakage current
VtTtTgI AirA ))(,)(( '
n
i i
A
i
irA
irA
iiAirA
tTtT
tTAtTtTg
1
'' )(
exp)(
exp1)(
))(,)((
ARB
IA TTk
ET
11exp)(
03.004.0585
02.021.0251244
02.023.010)3.07.3(3
01.010.010)6.01.4(2
11.042.010)2.02.1(1
)min(cmA 10)20.090.6()7(
3
4
6
1-18
ii
eqAi
C
13
Leakage current/module at B3
Tsensor(oC) for 1st 3 years Tsensor(oC) for next 9 years Ileak(mA) of B3 at the year end of
days 50116
50 23 126 50 116 50 23 126T(oC
)6th 8th 10th 12th
A -7 -7 -7 +20 -22
-7 -7 -7 +20 -22
-7 0.24 0.69 1.19 1.98
B 0 0 0 +20 -15 -7 0.24 0.69 1.19 1.98
C +7 +7 +7 +20 -8 -7 0.24 0.69 1.19 1.98
D+15
+15
+15 +20 0 -7 0.24 0.69 1.19 1.98
E+25
+25
+25 +20 +10 -7 0.23 0.68 1.18 1.97
F
0 0 0 +20 -15
-15 -15 -15 +20 -30-15 0.11 0.31 0.53 0.88
-7 0.24 0.70 1.20 2.00
G -10 -10 -10 +20 -25-10 0.18 0.51 0.89 1.47
-7 0.24 0.69 1.20 1.99
H -5 -5 -5 +20 -20-5 0.29 0.84 1.44 2.40
-7 0.24 0.69 1.18 1.97
I 0 0 0 +20 -150 0.46 1.33 2.28 3.79
-7 0.23 0.68 1.16 1.92
2009/6/16
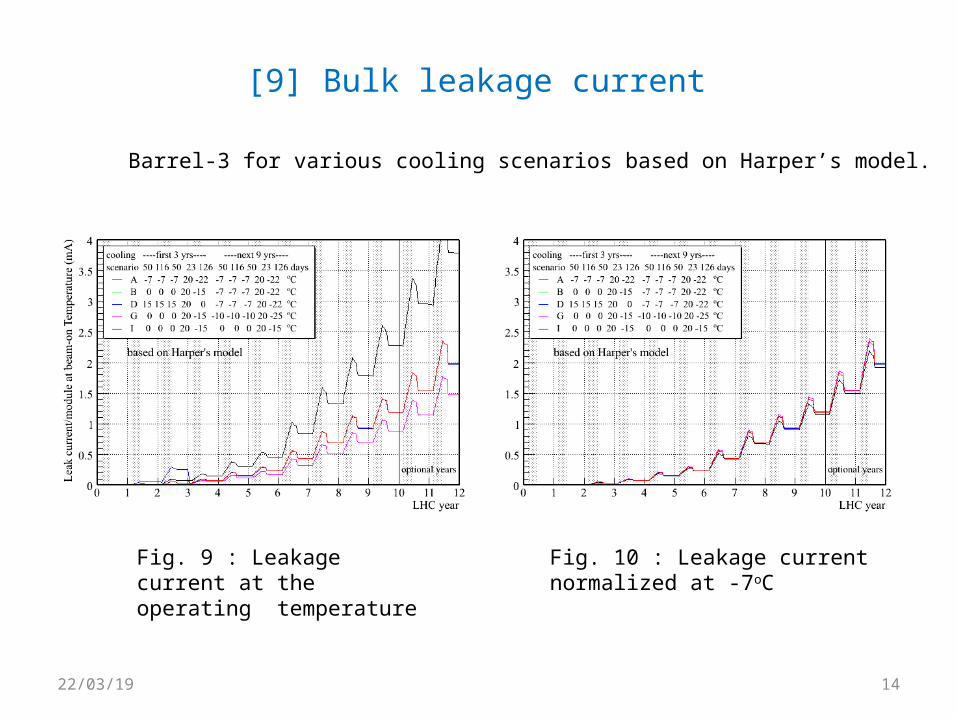
[9] Bulk leakage current
23/04/20 14
Barrel-3 for various cooling scenarios based on Harper’s model.
Fig. 9 : Leakage current at theoperating temperature
Fig. 10 : Leakage current normalized at -7oC
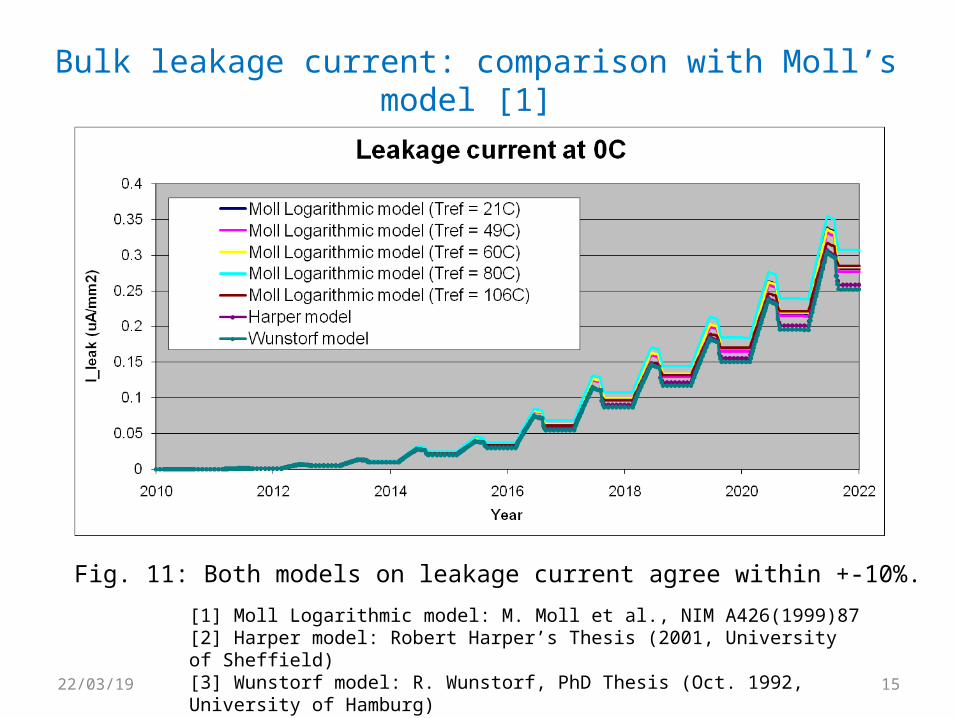
Bulk leakage current: comparison with Moll’s model [1]
23/04/20 15
Fig. 11: Both models on leakage current agree within +-10%.
[1] Moll Logarithmic model: M. Moll et al., NIM A426(1999)87[2] Harper model: Robert Harper’s Thesis (2001, University of Sheffield)[3] Wunstorf model: R. Wunstorf, PhD Thesis (Oct. 1992, University of Hamburg) and A Chilingarov et al., NIM A360 (1995) 432-437
23/04/20 16
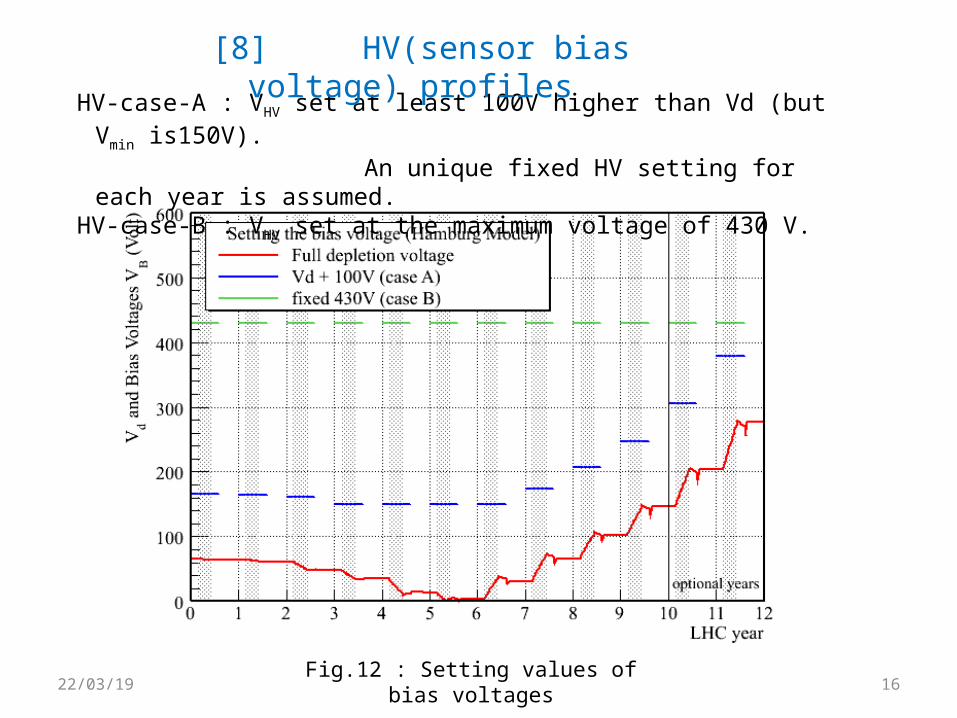
HV-case-A : VHV set at least 100V higher than Vd (but Vmin is150V). An unique fixed HV setting for each year is assumed.HV-case-B : VHV set at the maximum voltage of 430 V.
[8] HV(sensor bias voltage) profiles
Fig.12 : Setting values of bias voltages
23/04/20 17
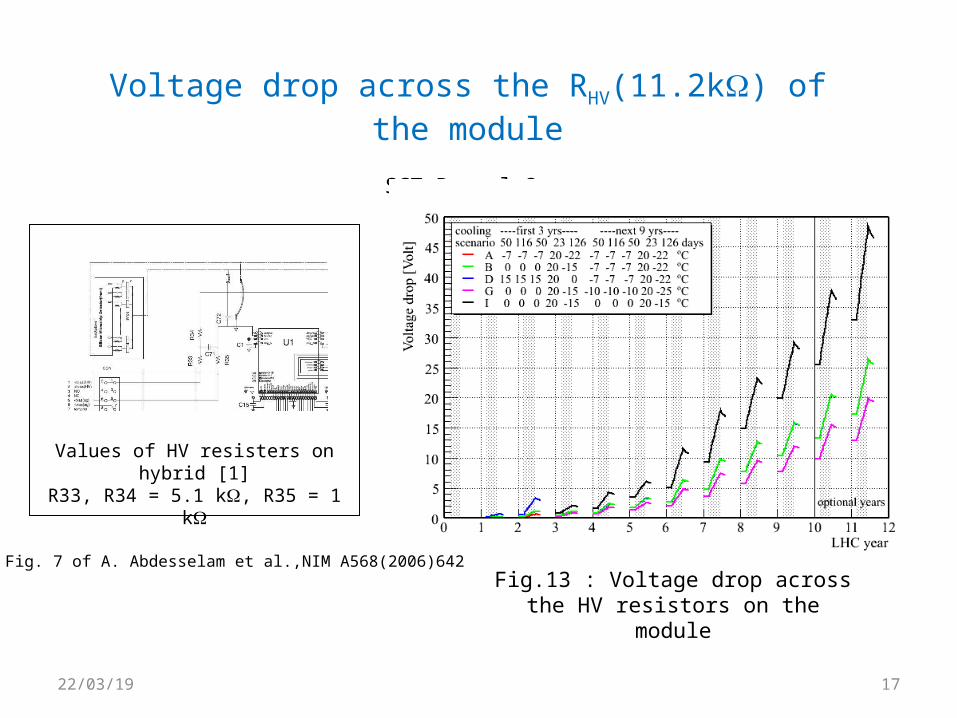
Voltage drop across the RHV(11.2k) of the module
SCT Barrel-3
Values of HV resisters on hybrid [1]R33, R34 = 5.1 k, R35 = 1 k
[1] Fig. 7 of A. Abdesselam et al.,NIM A568(2006)642 Fig.13 : Voltage drop across the HV
resistors on the module
23/04/20 18
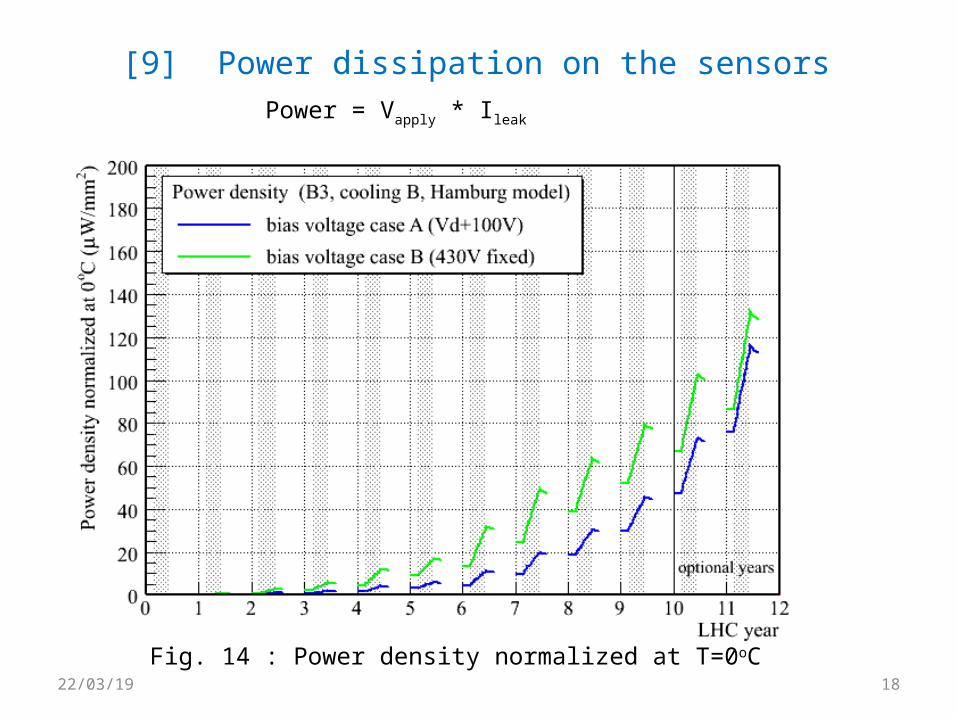
[9] Power dissipation on the sensors
Fig. 14 : Power density normalized at T=0oC
Power = Vapply * Ileak
23/04/20 19
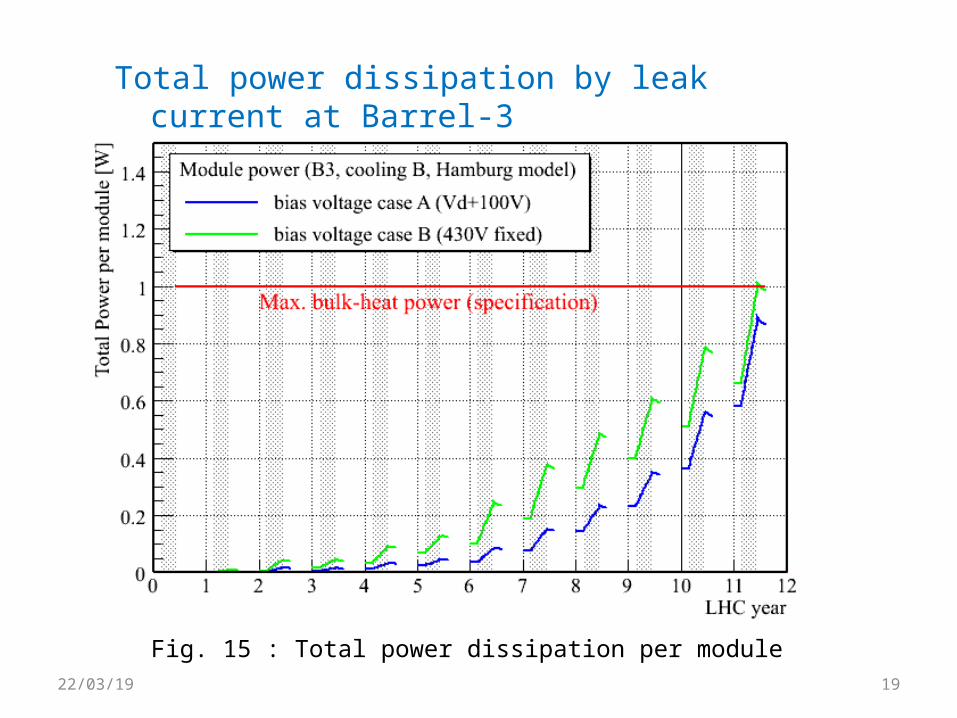
Total power dissipation by leak current at Barrel-3
Fig. 15 : Total power dissipation per module
23/04/20 20
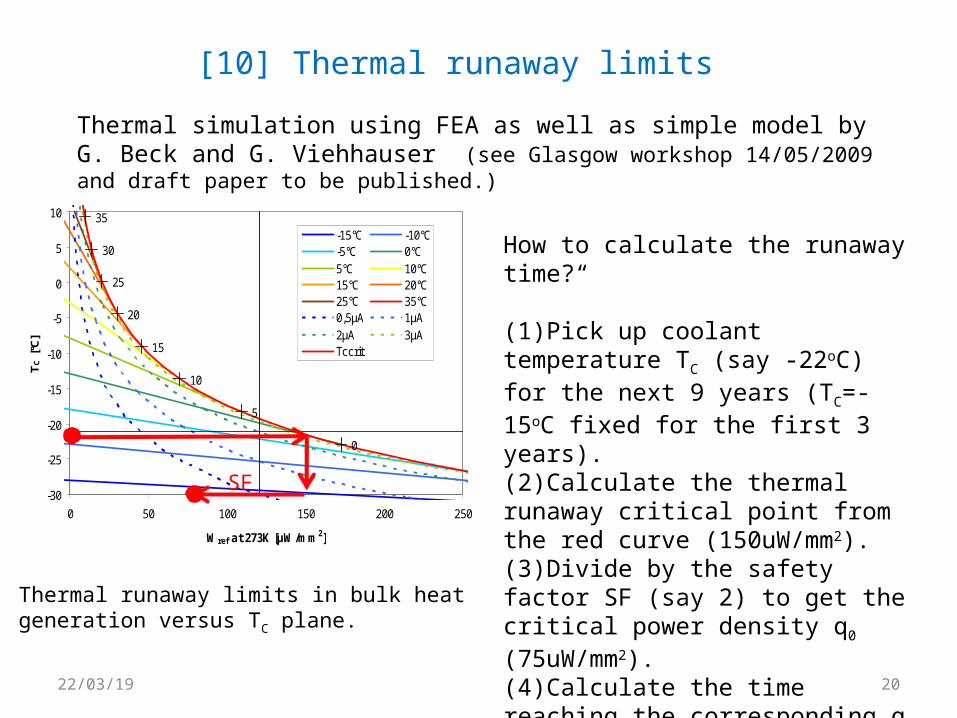
[10] Thermal runaway limits
Thermal simulation using FEA as well as simple model by G. Beck and G. Viehhauser (see Glasgow workshop 14/05/2009 and draft paper to be published.)
Thermal runaway limits in bulk heat generation versus TC plane.
20
0
15
10
5
30
25
35
-30
-25
-20
-15
-10
-5
0
5
10
0 50 100 150 200 250
Wref at 273K [μW/mm2]
TC
[°C
]
-15°C -10°C-5°C 0°C5°C 10°C15°C 20°C25°C 35°C0,5μA 1μA2μA 3μATccrit
How to calculate the runaway time?“
(1)Pick up coolant temperature TC (say -22oC) for the next 9 years (TC=-15oC fixed for the first 3 years).(2)Calculate the thermal runaway critical point from the red curve (150uW/mm2).(3)Divide by the safety factor SF (say 2) to get the critical power density q0 (75uW/mm2).(4)Calculate the time reaching the corresponding q0 .
SF
23/04/20 21
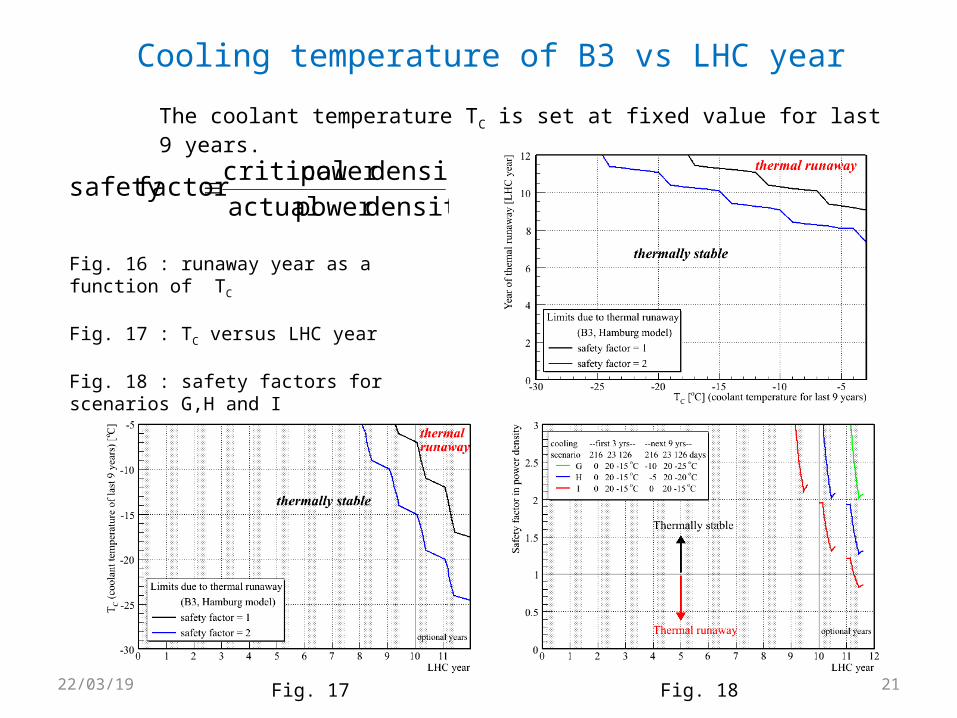
Cooling temperature of B3 vs LHC year
The coolant temperature TC is set at fixed value for last 9 years.
densitypower actualdensitypower critical
factor safety
Fig. 16 : runaway year as a function of TC
Fig. 17 : TC versus LHC year
Fig. 18 : safety factors for scenarios G,H and I
Fig. 17 Fig. 18
23/04/20 22
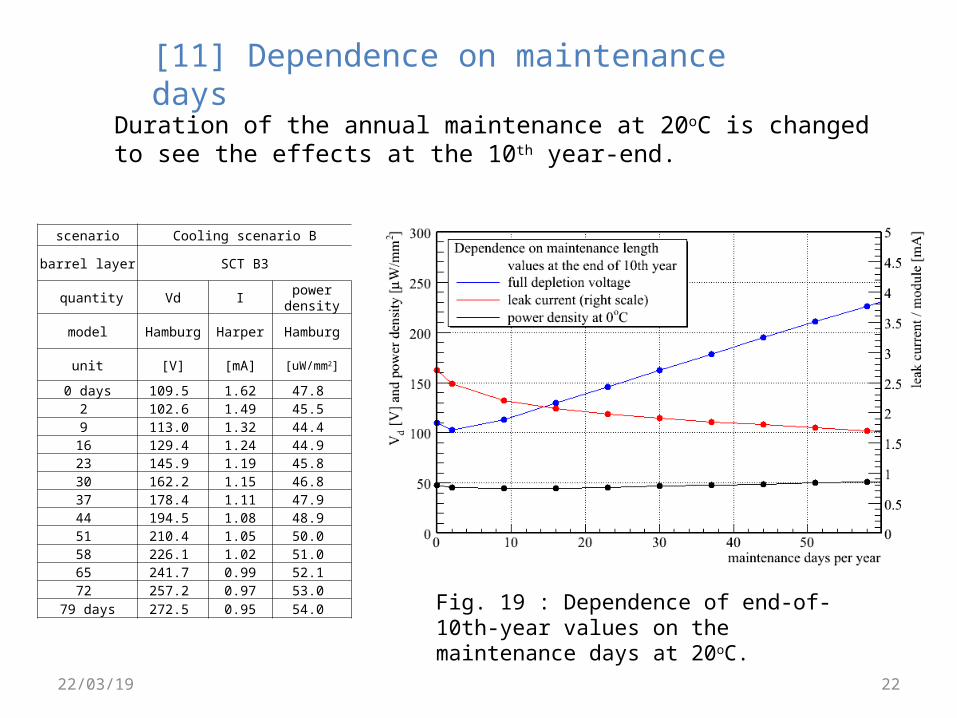
[11] Dependence on maintenance days
Duration of the annual maintenance at 20oC is changed to see the effects at the 10th year-end.
scenario Cooling scenario B
barrel layer SCT B3
quantity Vd Ipower density
model Hamburg Harper Hamburg
unit [V] [mA] [uW/mm2]
0 days 109.5 1.62 47.8 2 102.6 1.49 45.5 9 113.0 1.32 44.4
16 129.4 1.24 44.9 23 145.9 1.19 45.8 30 162.2 1.15 46.8 37 178.4 1.11 47.9 44 194.5 1.08 48.9 51 210.4 1.05 50.0 58 226.1 1.02 51.0 65 241.7 0.99 52.1 72 257.2 0.97 53.0
79 days 272.5 0.95 54.0 Fig. 19 : Dependence of end-of-10th-year values on the maintenance days at 20oC.
23/04/20 23
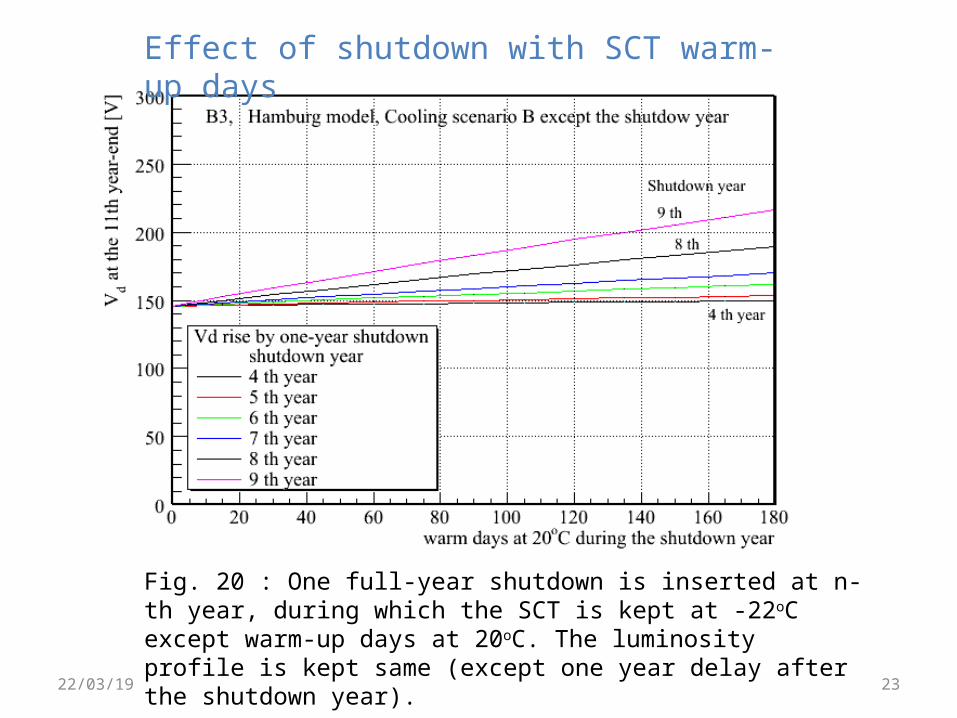
Effect of shutdown with SCT warm-up days
Fig. 20 : One full-year shutdown is inserted at n-th year, during which the SCT is kept at -22oC except warm-up days at 20oC. The luminosity profile is kept same (except one year delay after the shutdown year).
23/04/20 24
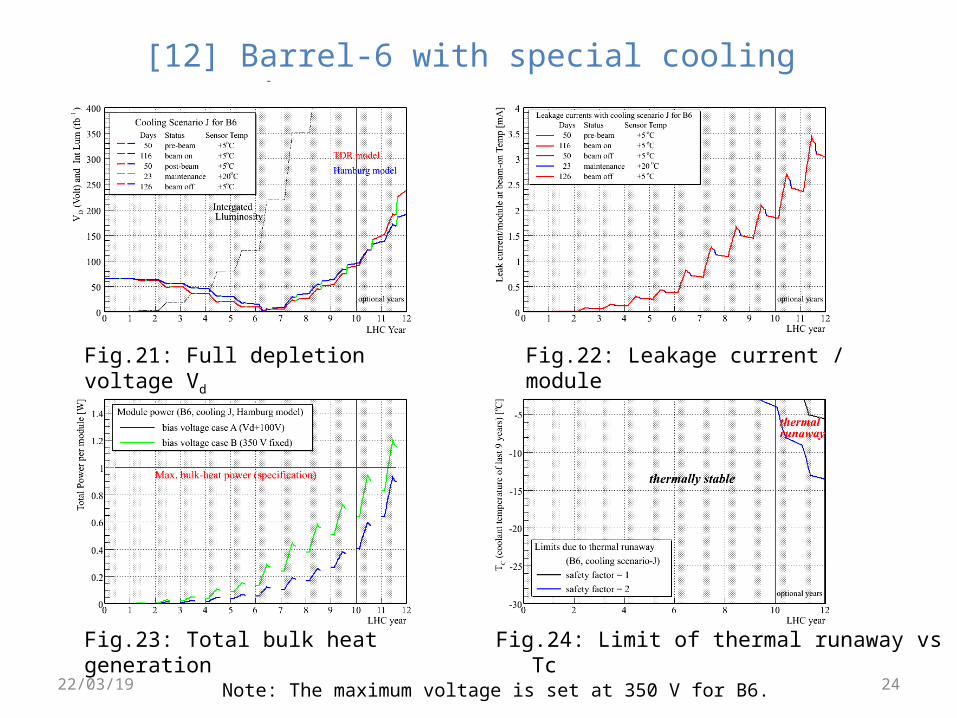
[12] Barrel-6 with special cooling scenario-J
Fig.21: Full depletion voltage Vd Fig.22: Leakage current / module
Fig.23: Total bulk heat generation Fig.24: Limit of thermal runaway vs Tc
Note: The maximum voltage is set at 350 V for B6.
23/04/20 25
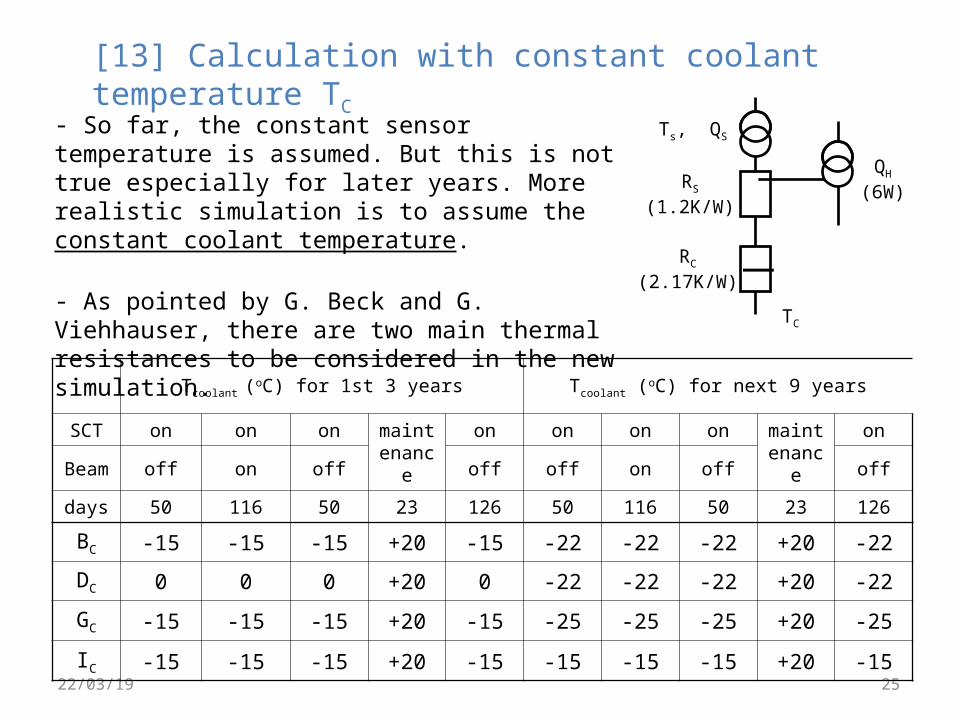
[13] Calculation with constant coolant temperature TC
- So far, the constant sensor temperature is assumed. But this is not true especially for later years. More realistic simulation is to assume the constant coolant temperature.
- As pointed by G. Beck and G. Viehhauser, there are two main thermal resistances to be considered in the new simulation.
Tcoolant (oC) for 1st 3 years Tcoolant (oC) for next 9 years
SCT on on on maintenanc
e
on on on on maintenanc
e
on
Beam
off on off off off on off off
days 50 116 50 23 126 50 116 50 23 126
BC -15 -15 -15 +20 -15 -22 -22 -22 +20 -22
DC 0 0 0 +20 0 -22 -22 -22 +20 -22
GC -15 -15 -15 +20 -15 -25 -25 -25 +20 -25
IC -15 -15 -15 +20 -15 -15 -15 -15 +20 -15
QH
(6W)
Ts, QS
RS
(1.2K/W)
TC
RC
(2.17K/W)
23/04/20 26
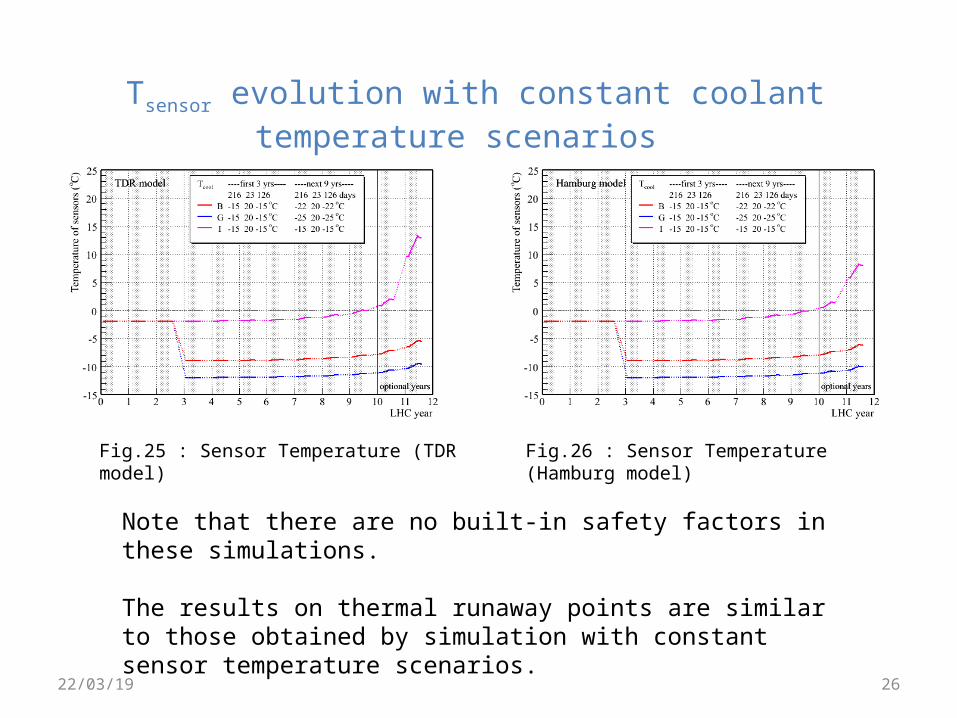
Tsensor evolution with constant coolant temperature scenarios
Fig.25 : Sensor Temperature (TDR model)
Note that there are no built-in safety factors in these simulations.
The results on thermal runaway points are similar to those obtained by simulation with constant sensor temperature scenarios.
Fig.26 : Sensor Temperature (Hamburg model)

Back up slides
23/04/20 27

23/04/20 28
Programmes and summary file can be pick up at
http://atlas.kek.jp/si-soft/Vd/index.html