Embed Size (px)
Citation preview
EVOLUTION OF SCIAMACHY CH4 SCIENTIFIC PRODUCT QUALITY & INITIAL LOOK AT THE
‘HYMN FTIR DATASET’
B. Dils, M. De Mazière, C. Vigouroux, R. Sussmann, F. Forster, T. Borsdorff, T. Blumenstock, M. Buchwitz, P.
Demoulin, P. Duchatelet, C. Frankenberg, A. Gloudemans, J. Hannigan, F. Hase, N. Jones, J. Klyft, I. Kramer, E. Mahieu, J. Mellqvist, J. Notholt, K. Petersen,
A. Strandberg, K. Strong, J. Taylor, S. Wood

Part I: EVOLUTION OF SCIAMACHY CH4 SCIENTIFIC PRODUCT QUALITY
Introduction
• Validation of SCIAMACGY NIR products using FTIR measurements started in ~2004, in the EU Evergreen project
• Since then continuous improvements on the SCIAMACHY algorithms
• Also the FTIR comparison dataset has evolved
Hard to inter-compare results from different validation studies Re-evaluate successive SCIAMACHY CH4 data products (from successive algorithm improvements ) with the same ‘standard’ FTIR dataset
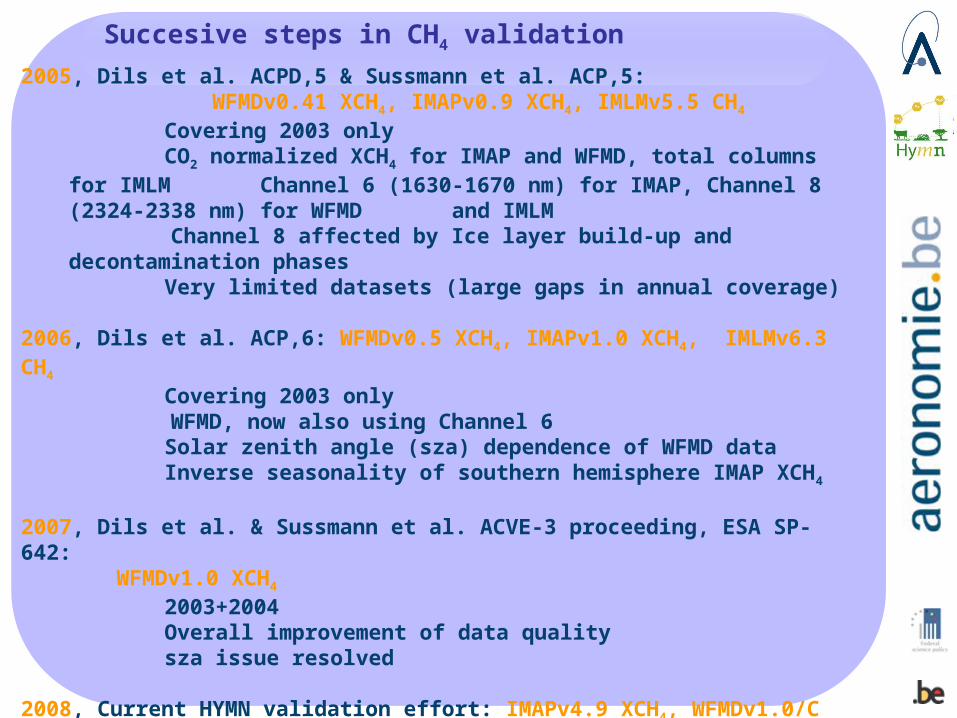
Succesive steps in CH4 validation
2005, Dils et al. ACPD,5 & Sussmann et al. ACP,5:WFMDv0.41 XCH4, IMAPv0.9 XCH4, IMLMv5.5 CH4
Covering 2003 onlyCO2 normalized XCH4 for IMAP and WFMD, total columns for IMLM Channel 6 (1630-1670 nm) for IMAP, Channel 8 (2324-2338 nm) for
WFMD and IMLM Channel 8 affected by Ice layer build-up and decontamination phases
Very limited datasets (large gaps in annual coverage)
2006, Dils et al. ACP,6: WFMDv0.5 XCH4, IMAPv1.0 XCH4, IMLMv6.3 CH4
Covering 2003 only WFMD, now also using Channel 6
Solar zenith angle (sza) dependence of WFMD dataInverse seasonality of southern hemisphere IMAP XCH4
2007, Dils et al. & Sussmann et al. ACVE-3 proceeding, ESA SP-642: WFMDv1.0 XCH4
2003+2004Overall improvement of data qualitysza issue resolved
2008, Current HYMN validation effort: IMAPv4.9 XCH4, WFMDv1.0/C XCH4
2003+2004+2005Updated CH4 spectroscopy for IMAPv4.9WFMD XCH4 CO2 normalised data using carbon tracker data
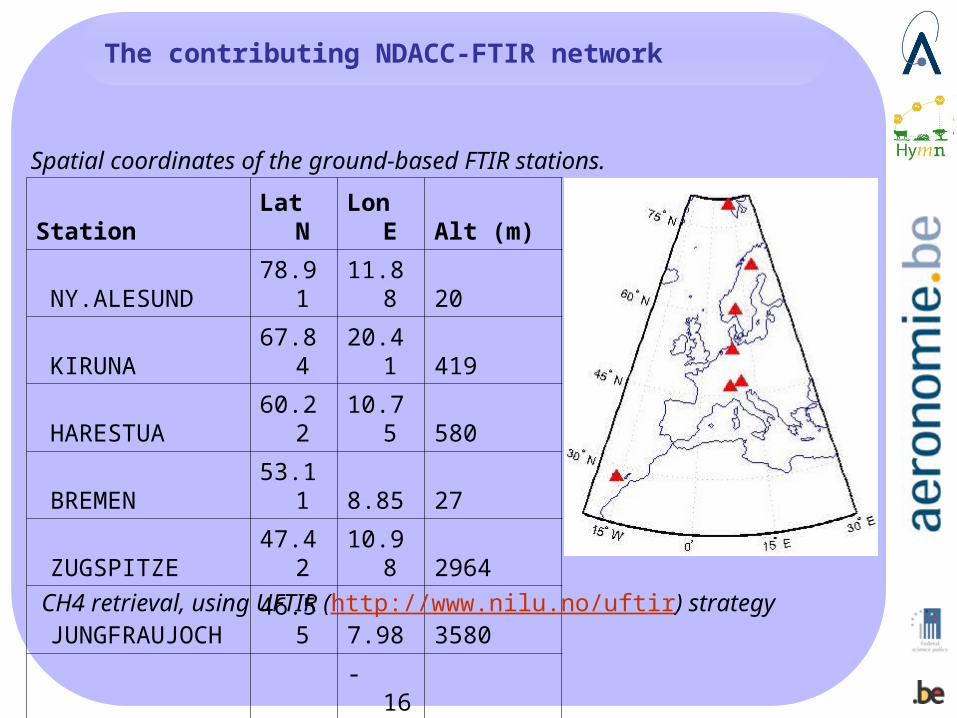
The contributing NDACC-FTIR network
Spatial coordinates of the ground-based FTIR stations.
Station Lat N Lon E Alt (m)
NY.ALESUND 78.91 11.88 20
KIRUNA 67.84 20.41 419
HARESTUA 60.22 10.75 580
BREMEN 53.11 8.85 27
ZUGSPITZE 47.42 10.98 2964
JUNGFRAUJOCH 46.55 7.98 3580
IZAÑA 28.30 -16.48 2367
CH4 retrieval, using UFTIR (http://www.nilu.no/uftir) strategy
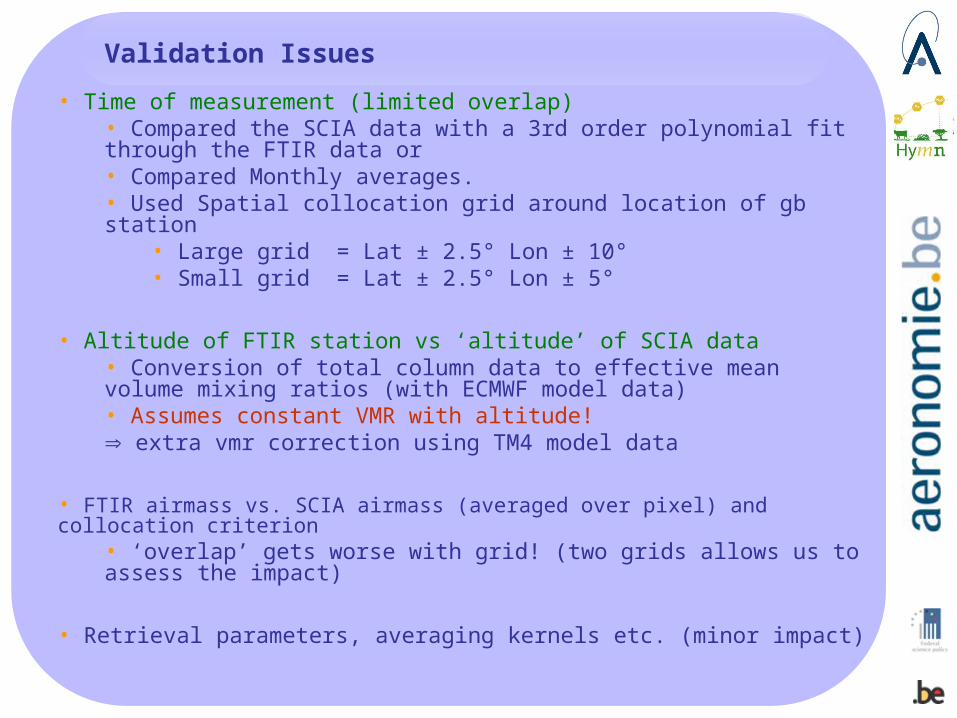
Validation Issues
• Time of measurement (limited overlap)• Compared the SCIA data with a 3rd order polynomial fit through the FTIR data or • Compared Monthly averages.• Used Spatial collocation grid around location of gb station
• Large grid = Lat ± 2.5° Lon ± 10°• Small grid = Lat ± 2.5° Lon ± 5°
• Altitude of FTIR station vs ‘altitude’ of SCIA data• Conversion of total column data to effective mean volume mixing ratios (with ECMWF model data)• Assumes constant VMR with altitude! extra vmr correction using TM4 model data
• FTIR airmass vs. SCIA airmass (averaged over pixel) and collocation criterion
• ‘overlap’ gets worse with grid! (two grids allows us to assess the impact)
• Retrieval parameters, averaging kernels etc. (minor impact)
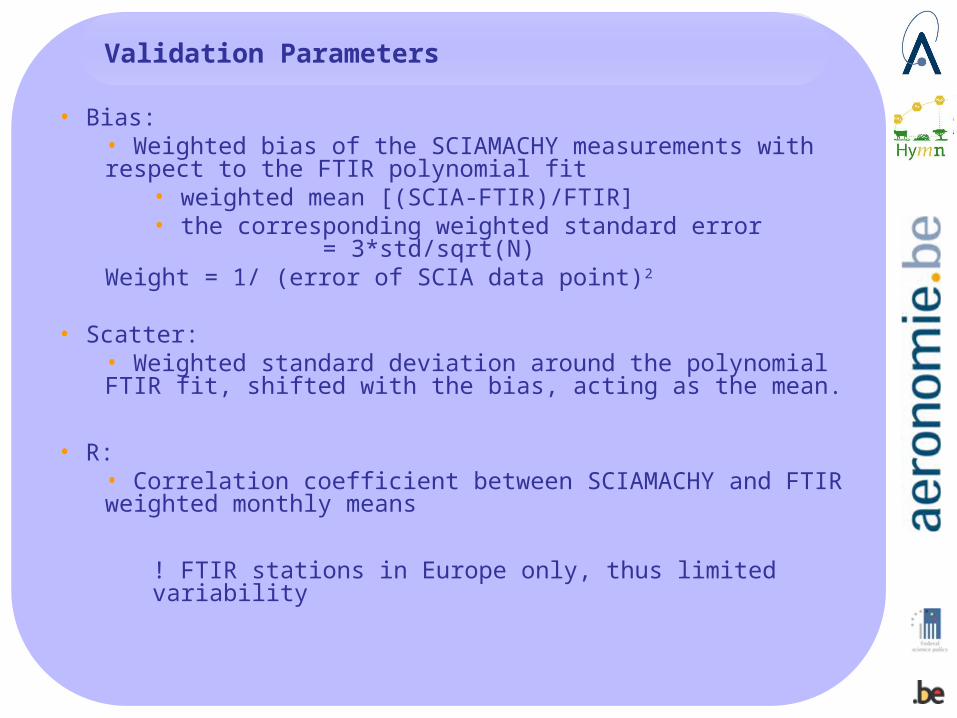
Validation Parameters
• Bias: • Weighted bias of the SCIAMACHY measurements with respect to the FTIR polynomial fit
• weighted mean [(SCIA-FTIR)/FTIR]• the corresponding weighted standard error = 3*std/sqrt(N)
Weight = 1/ (error of SCIA data point)2
• Scatter:• Weighted standard deviation around the polynomial FTIR fit, shifted with the bias, acting as the mean.
• R:• Correlation coefficient between SCIAMACHY and FTIR weighted monthly means
! FTIR stations in Europe only, thus limited variability
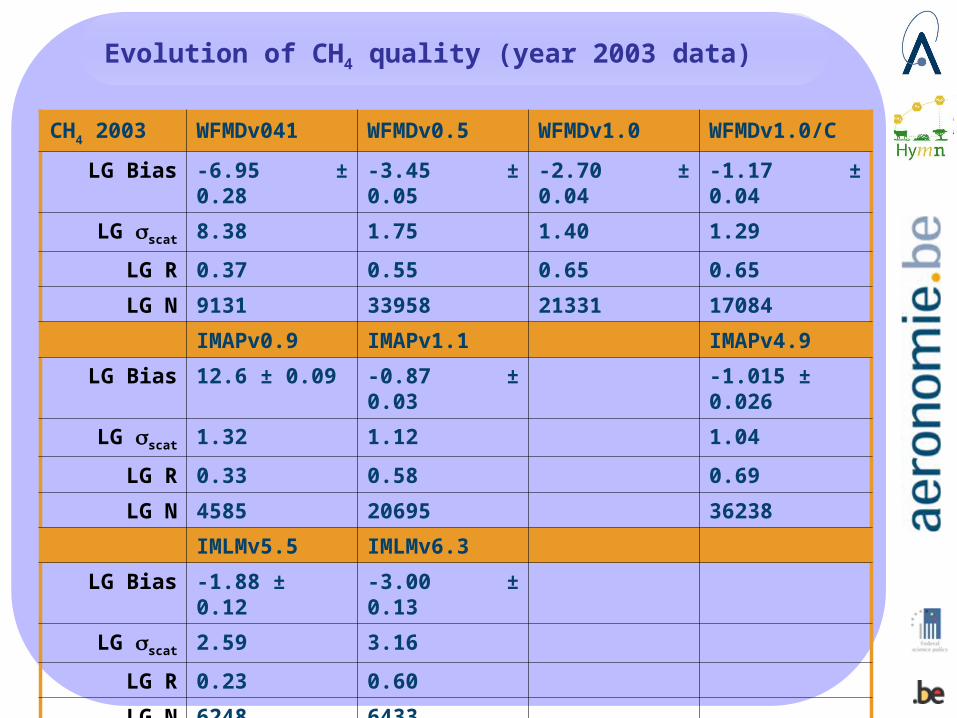
Evolution of CH4 quality (year 2003 data)
CH4 2003 WFMDv041 WFMDv0.5 WFMDv1.0 WFMDv1.0/C
LG Bias -6.95 ± 0.28 -3.45 ± 0.05 -2.70 ± 0.04 -1.17 ± 0.04
LG scat 8.38 1.75 1.40 1.29
LG R 0.37 0.55 0.65 0.65
LG N 9131 33958 21331 17084
IMAPv0.9 IMAPv1.1 IMAPv4.9
LG Bias 12.6 ± 0.09 -0.87 ± 0.03 -1.015 ± 0.026
LG scat 1.32 1.12 1.04
LG R 0.33 0.58 0.69
LG N 4585 20695 36238
IMLMv5.5 IMLMv6.3
LG Bias -1.88 ± 0.12 -3.00 ± 0.13
LG scat 2.59 3.16
LG R 0.23 0.60
LG N 6248 6433
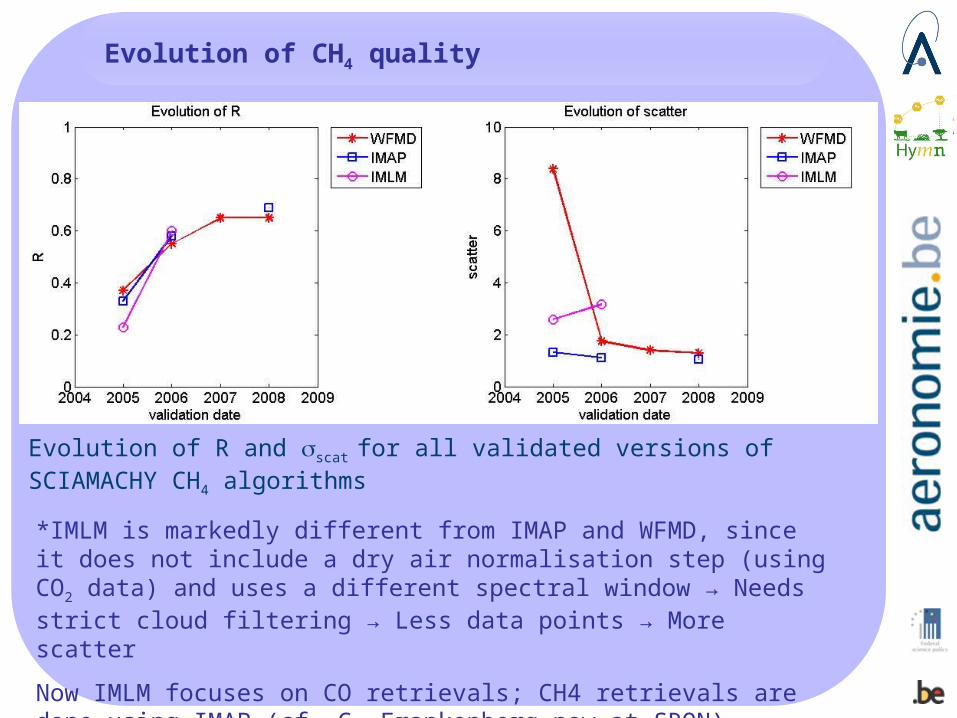
Evolution of CH4 quality
Evolution of R and scat for all validated versions of SCIAMACHY CH4 algorithms
*IMLM is markedly different from IMAP and WFMD, since it does not include a dry air normalisation step (using CO2 data) and uses a different spectral window → Needs strict cloud filtering → Less data points → More scatter
Now IMLM focuses on CO retrievals; CH4 retrievals are done using IMAP (cf. C. Frankenberg now at SRON)
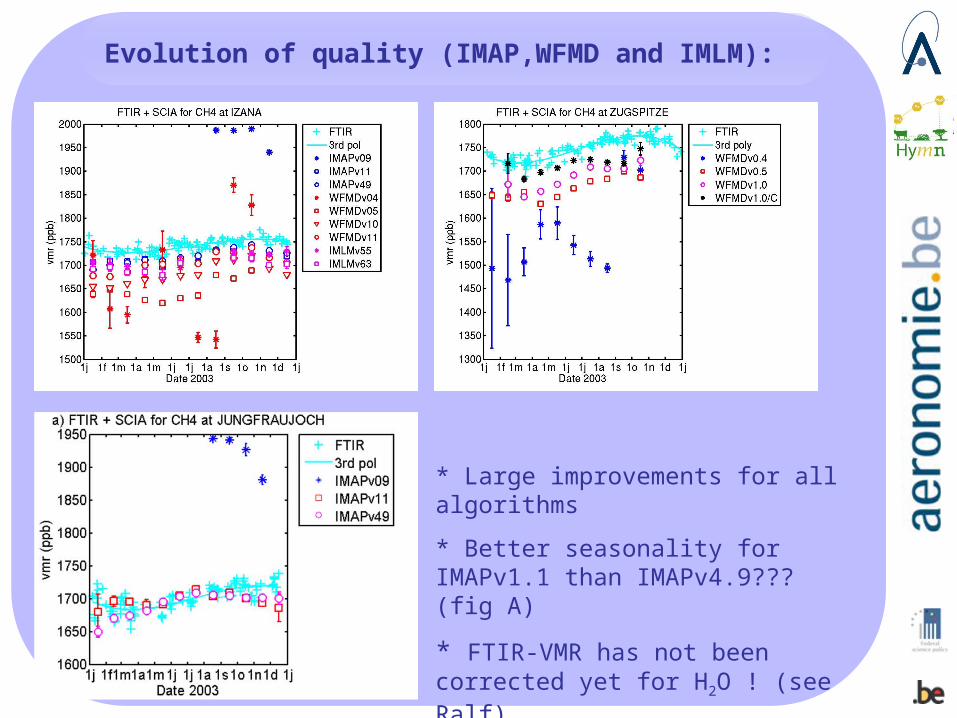
Evolution of quality (IMAP,WFMD and IMLM):
* Large improvements for all algorithms
* Better seasonality for IMAPv1.1 than IMAPv4.9??? (fig A)
* FTIR-VMR has not been corrected yet for H2O ! (see Ralf)
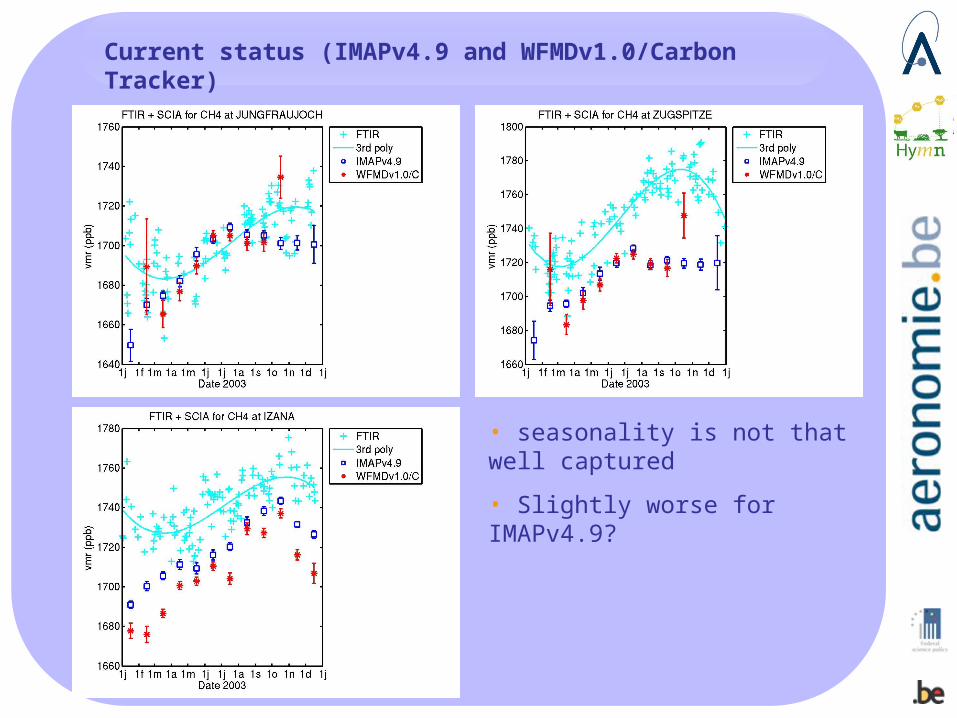
Current status (IMAPv4.9 and WFMDv1.0/Carbon Tracker)
• seasonality is not that well captured
• Slightly worse for IMAPv4.9?
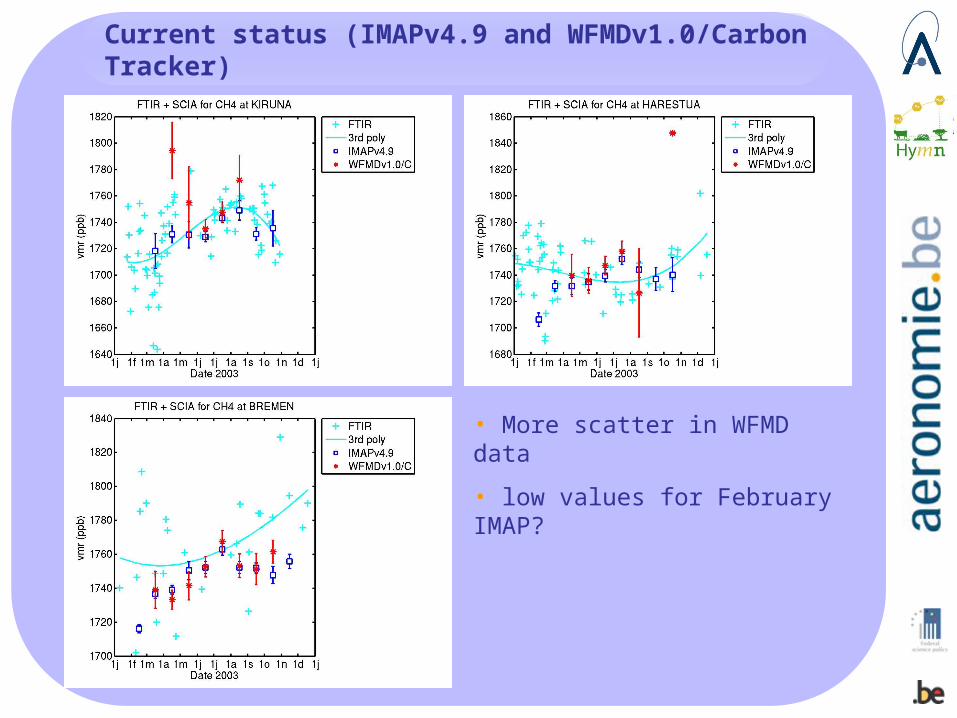
Current status (IMAPv4.9 and WFMDv1.0/Carbon Tracker)
• More scatter in WFMD data
• low values for February IMAP?
Conclusions
• Overall, one can state that all SCIAMACHY algorithms have evolved significantly over time. Both the correlation as well as the scatter have improved with each new development. Correlation coefficients of ~0.7 and scatter values of ~1% have been obtained.
• However several issues still remain. The latest IMAP product (v4.9) seems to do a worse job in capturing the seasonality than v1.1
• This study was done on a rather limited (spatial coverage) dataset.
No extensive information on bias A reliable harmonized quasi-global FTIR dataset is a must with respect to validation
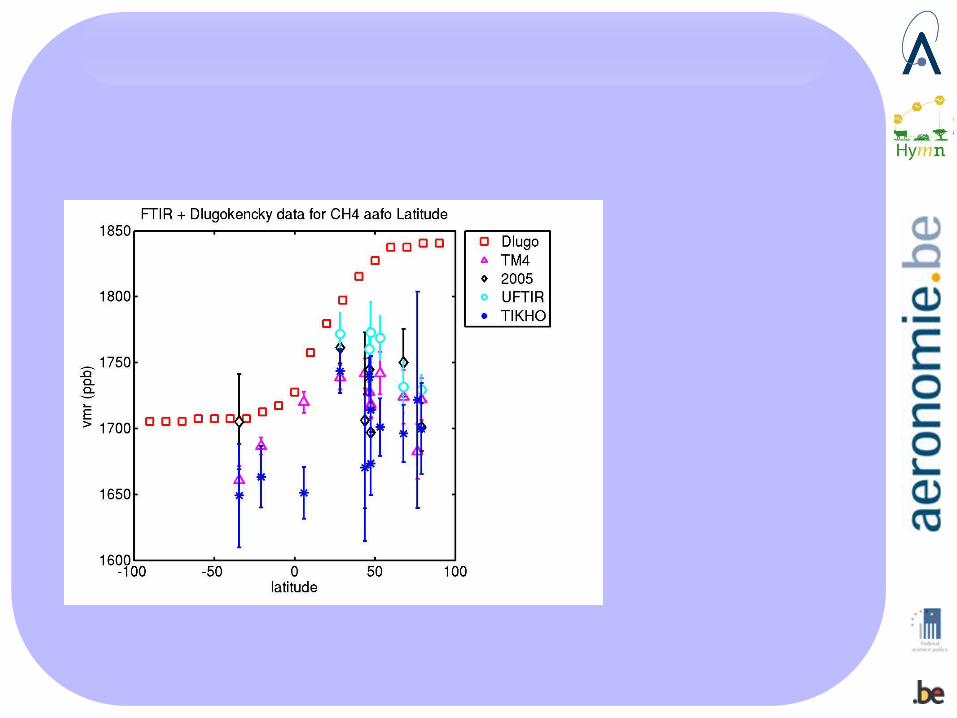
Part II: INITIAL LOOK AT THE ‘HYMN FTIR DATASET’
Introduction
• Homogenised retrieval strategy developed in HYMN, based on Tikhonov regularisation → dataset called ‘Tikhonov’ hereinafter
• Dataset was extended with a few non-European stations: Thule (76°N), Toronto (44°N), Wollongong (34°S), Lauder (44°S), Arrival Heights (78°S); the dataset includes 2 tropical stations: Paramaribo (6°N), St Denis/Reunion (21°S)
• The idea is to get a first feeling of the FTIR Tikhonov data quality by comparing both the UFTIR and the Tikhonov dataset with
• TM4 model data • IMAPv4.9 and WFM-DOASv1.0/C SCIAMACHY data
• The SCIAMACHY comparisons proceeded using the same method as outlined before
• For the TM4 data, the spatially collocated pixel was taken, from which the total column was calculated above station altitude. This was then converted (using the same ECMWF pressure data as used in the FTIR conversion) to volume mixing ratios.
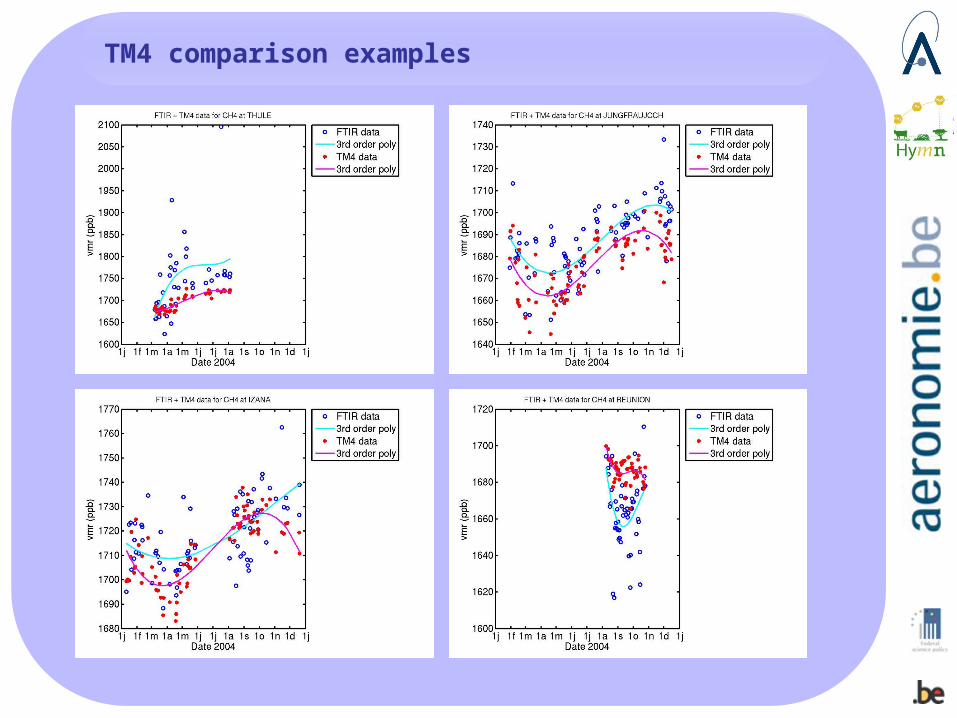
TM4 comparison examples
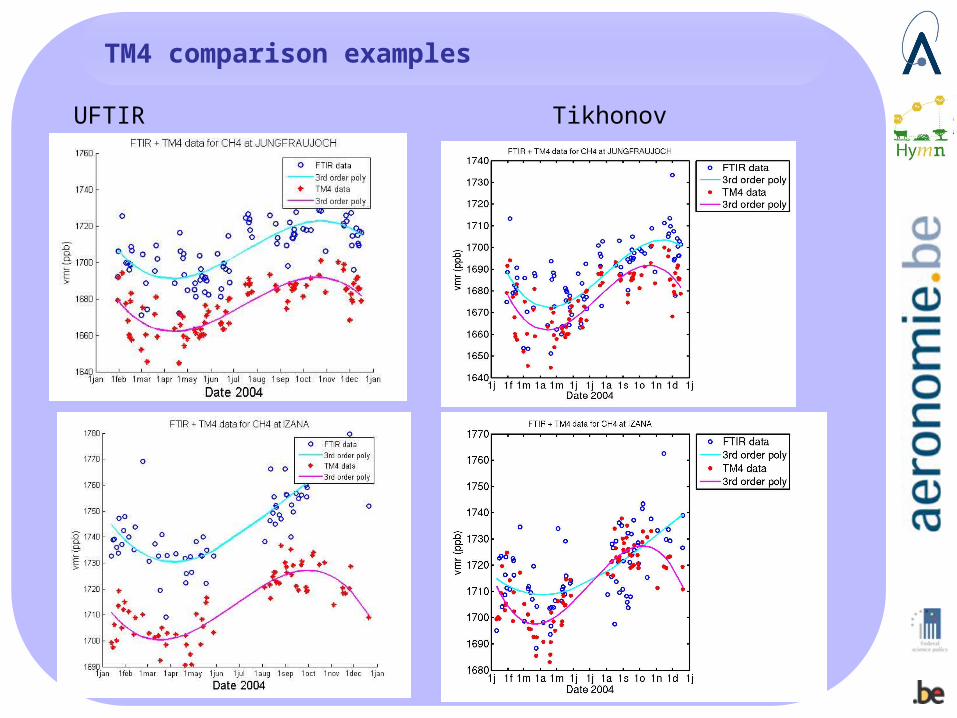
TM4 comparison examples
UFTIR Tikhonov
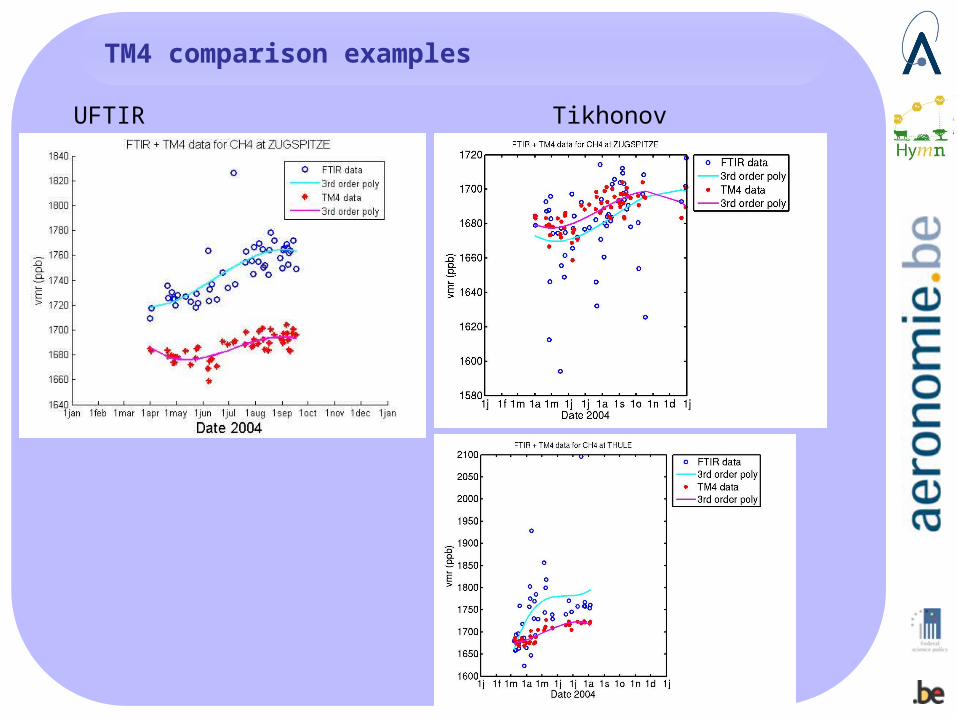
TM4 comparison examples
UFTIR Tikhonov
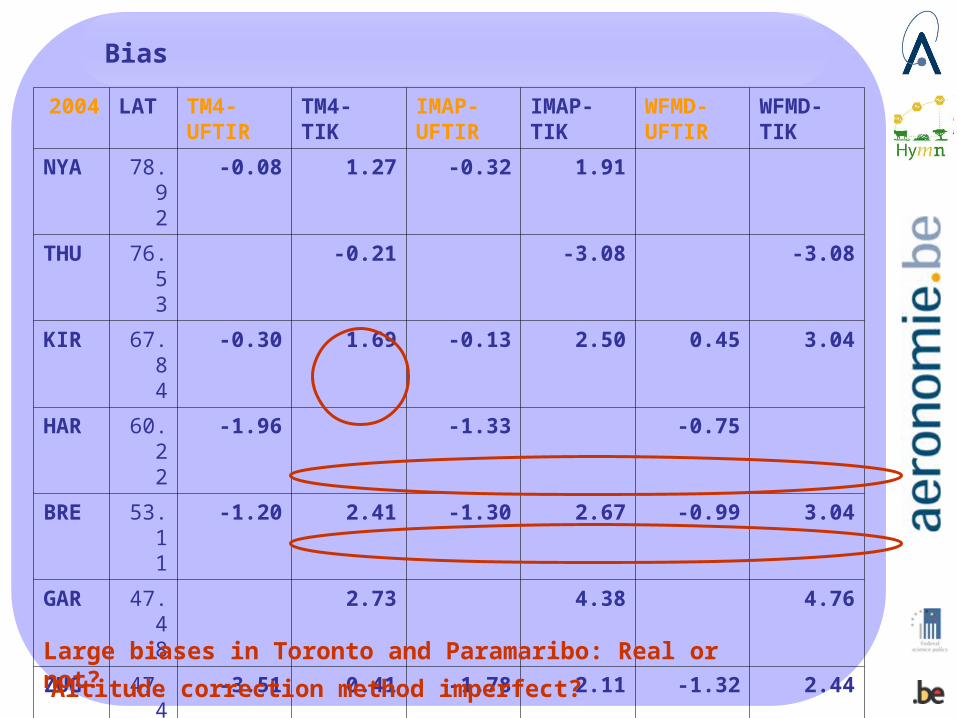
2004 LAT TM4-UFTIR
TM4-TIK
IMAP-UFTIR
IMAP-TIK
WFMD-UFTIR
WFMD-TIK
NYA 78.92 -0.08 1.27 -0.32 1.91
THU 76.53 -0.21 -3.08 -3.08
KIR 67.84 -0.30 1.69 -0.13 2.50 0.45 3.04
HAR 60.22 -1.96 -1.33 -0.75
BRE 53.11 -1.20 2.41 -1.30 2.67 -0.99 3.04
GAR 47.48 2.73 4.38 4.76
ZUG 47.42 -3.51 0.41 -1.78 2.11 -1.32 2.44
JFJ 46.55 -1.75 -0.63 -0.74 0.46 -0.52 0.68
TOR 43.66 4.86 5.70 5.87
IZA 28.3 -1.86 -0.28 -1.38 0.19 -2.03 -0.49
PAR 5.81 4.32 6.09 6.73
REU -20.9 1.37 3.02 3.37
WOL -34.4 0.69 2.35 2.13
Bias
Large biases in Toronto and Paramaribo: Real or not?
Altitude correction method imperfect?
Biases aafo Lat
-6
-4
-2
0
2
4
6
8
-50 0 50 100
Lat
Bia
s(%
)
TM4UFTIR
TM4TIK
IMAPv49UFT
IMAPv49TIK
WFMDv10CUFT
WFMDv10CTIK
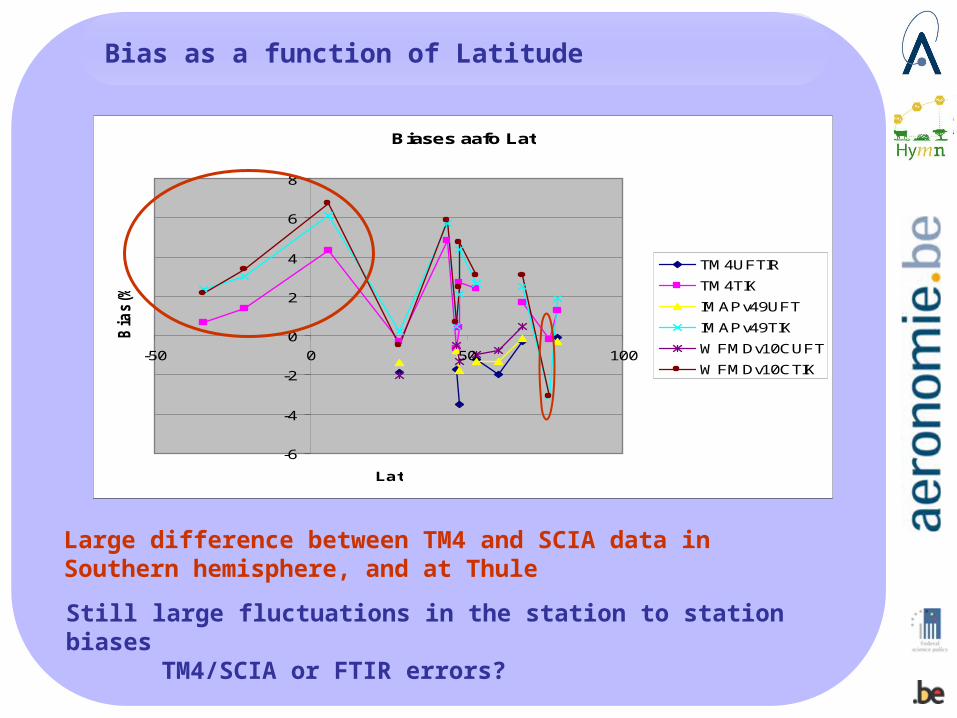
Bias as a function of Latitude
Large difference between TM4 and SCIA data in Southern hemisphere, and at Thule
Still large fluctuations in the station to station biasesTM4/SCIA or FTIR errors?
Bias aafo Lat (overlap only)
-4
-3
-2
-1
0
1
2
3
0 20 40 60 80 100
Lat
Bia
s(%
)
TM4_uftir
TM4_Tikhonov
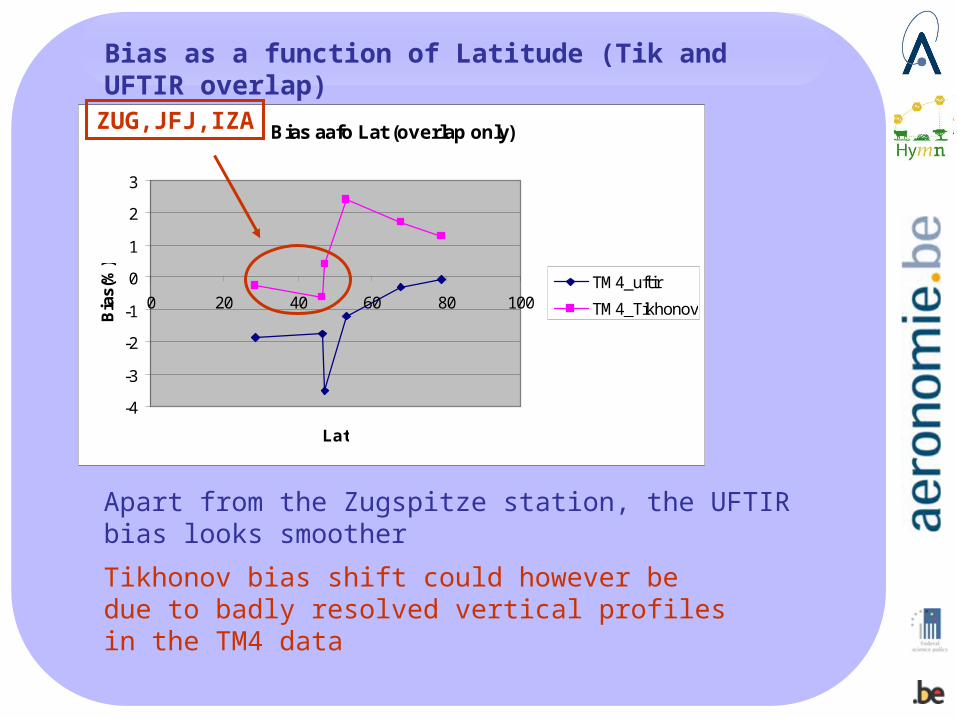
Apart from the Zugspitze station, the UFTIR bias looks smoother
ZUG,JFJ,IZA
Tikhonov bias shift could however be due to badly resolved vertical profiles in the TM4 data
Bias as a function of Latitude (Tik and UFTIR overlap)
Bias aafo Lat (overlap only)
-4
-3
-2
-1
0
1
2
3
-40 -20 0 20 40 60 80 100
Lat
Bia
s(%
)
TM4_uftir
TM4_Tikhonov
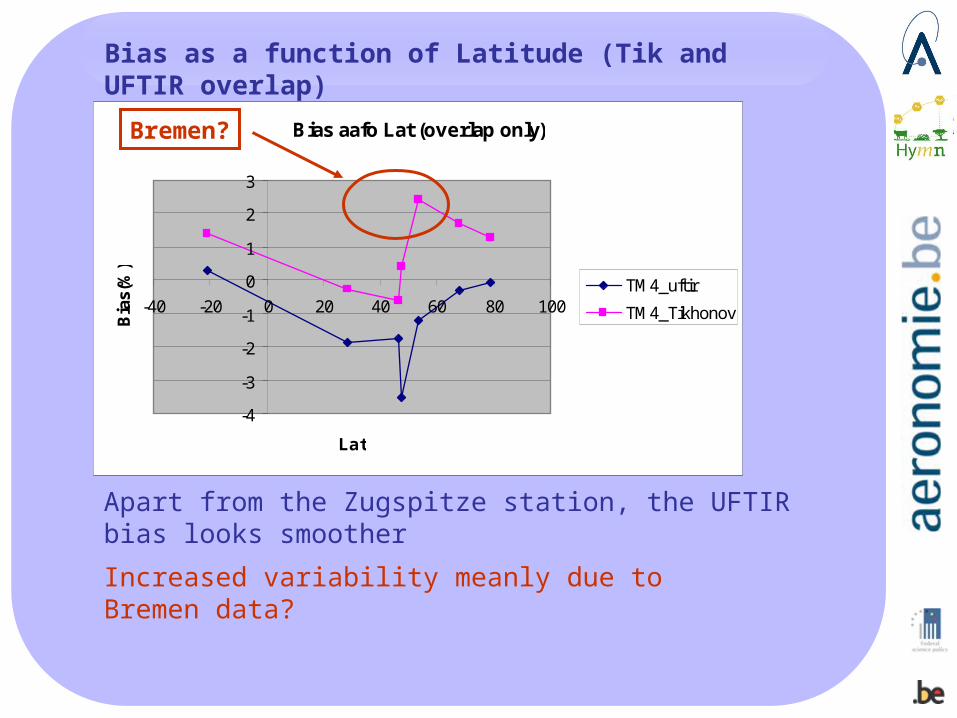
Apart from the Zugspitze station, the UFTIR bias looks smoother
Bremen?
Increased variability meanly due to Bremen data?
Bias as a function of Latitude (Tik and UFTIR overlap)
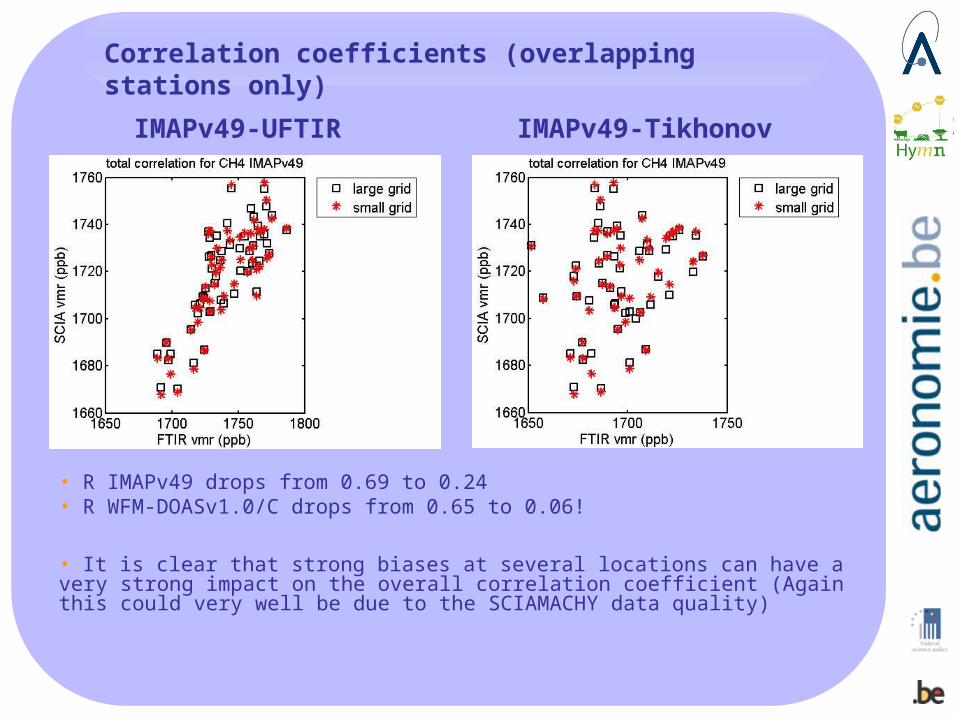
Correlation coefficients (overlapping stations only)
IMAPv49-UFTIR IMAPv49-Tikhonov
• R IMAPv49 drops from 0.69 to 0.24• R WFM-DOASv1.0/C drops from 0.65 to 0.06!
• It is clear that strong biases at several locations can have a very strong impact on the overall correlation coefficient (Again this could very well be due to the SCIAMACHY data quality)
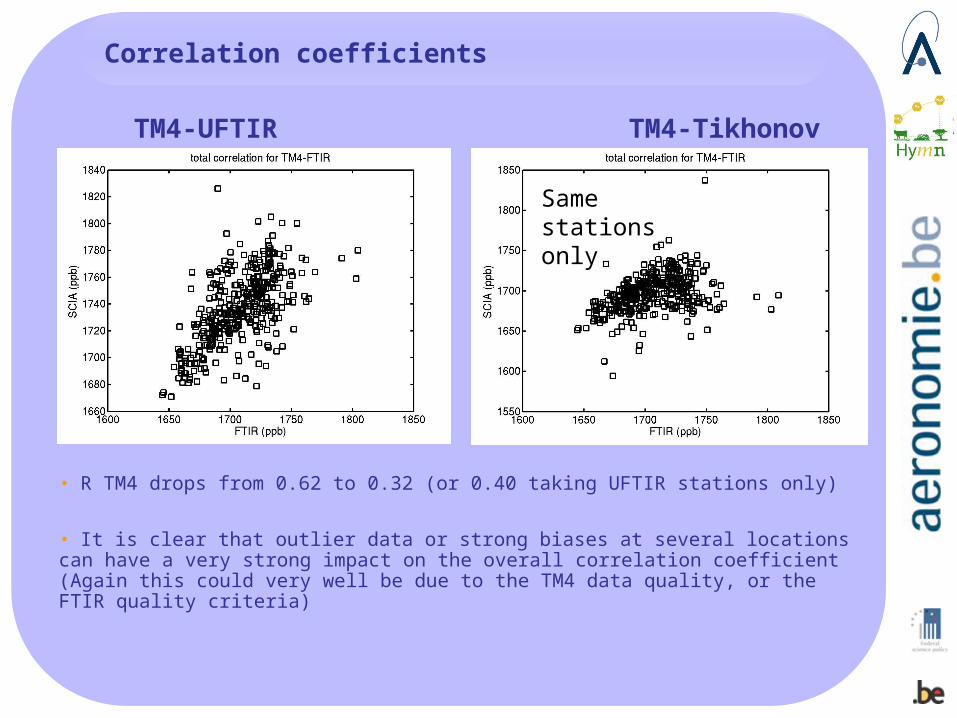
Correlation coefficients
TM4-UFTIR TM4-Tikhonov
• R TM4 drops from 0.62 to 0.32 (or 0.40 taking UFTIR stations only)
• It is clear that outlier data or strong biases at several locations can have a very strong impact on the overall correlation coefficient (Again this could very well be due to the TM4 data quality, or the FTIR quality criteria)
Same stations only
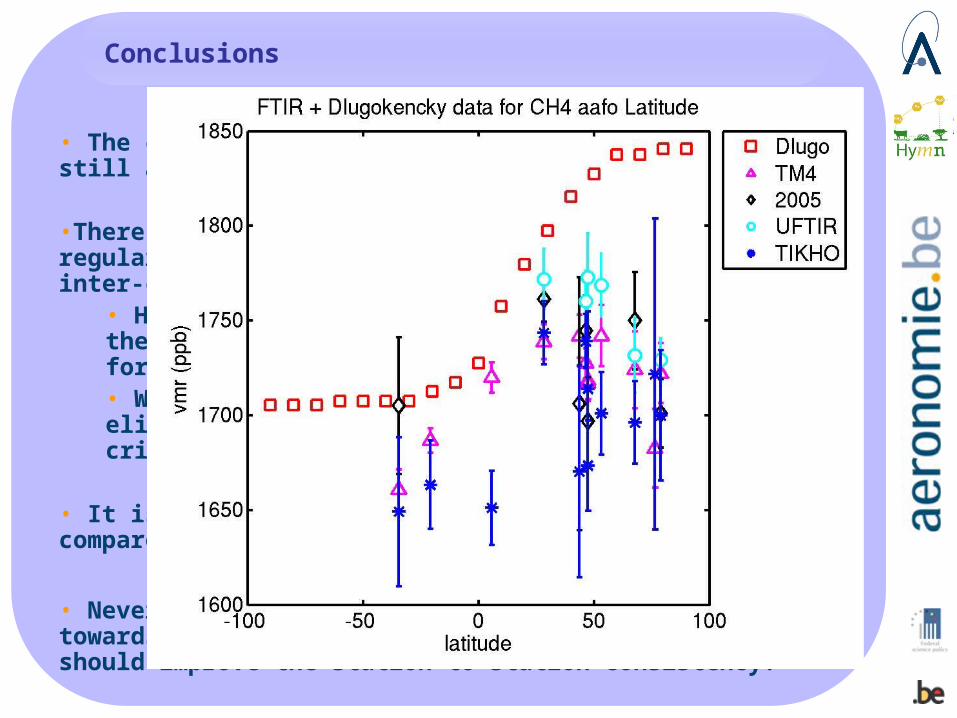
Conclusions
• The comparison exercise as performed here leaves still a lot of questions
•There is no obvious indication that the Tikhonov regularized dataset has improved station-to-station inter-comparability.
• However both SCIA and TM4 model data as well as the comparison methodology might be responsible for the issues razed in this overview• We have taken the Tikhonov data as is, only eliminating obvious outliers. Data selection criteria might improve quality
• It is clear that we lack a reliable standard to compare each station’s measurements to.
• Nevertheless, we would expect that proceeding towards an as uniform as possible retrieval method should improve the station-to-station consistency.
Still to be done: to be discussed !
• Sensitivity tests on altitude correction
• Correction of gb FTIR data for relative humidity, i.e., determine dry-air column averaged mixing ratio
• Add missing stations; Verify data quality of gb FTIR datasets
• Check error budgets for UFTIR and regularised Tikhonov approaches ? Check AVK (smoothing error): farther away from 1 for actual Tikhonov approach ?
• Take into account gb FTIR AVK in model comparisons
• Think about another measure of station-to-station consistency ?
• ?? Re-do all stations with a common but less constrained retrieval strategy, but spectroscopy as decided at Pasadena (‘FH’ spec’y)
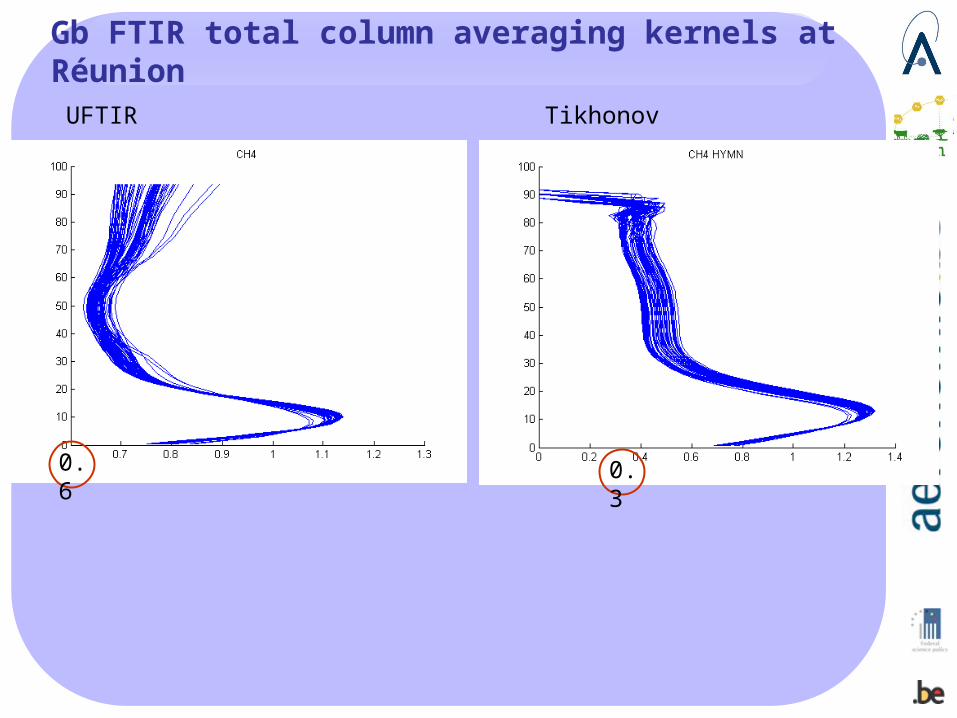
Gb FTIR total column averaging kernels at Réunion
UFTIR Tikhonov
0.6 0.3