Embed Size (px)
Citation preview
ambiguities according to ref. 29. The null hypothesis of no geographical association ofclades and nested clades was tested by permutation of clades against sampling locations fortip and interior clades in the program GeoDis ver. 2.0 (ref. 30). The biologicalinterpretation of the results was done following the inference key of ref. 15.
Received 21 May; accepted 16 August 2003; doi:10.1038/nature01942.
1. Stenseth, N. C. et al. Common dynamic structure of Canada lynx populations within three climatic
regions. Science 285, 1071–1073 (1999).
2. Krebs, C. J. et al. Impact of food and predation on the snowshoe hare cycle. Science 269, 1112–1115
(1995).
3. Stenseth, N. C., Falck, W., Bjornstad, O. N. & Krebs, C. J. Population regulation in snowshoe hare and
Canadian lynx: Asymmetric food web configurations between hare and lynx. Proc. Natl Acad. Sci. USA
94, 5147–5152 (1997).
4. Elton, C. S. & Nicholson, M. The ten-year cycle in numbers of the lynx in Canada. J. Anim. Ecol. 11,
215–244 (1942).
5. Stenseth, N. C. et al. From patterns to processes: Phase and density dependencies in the Canadian lynx
cycle. Proc. Natl Acad. Sci. USA 95, 15430–15435 (1998).
6. Mowat, G., Poole, K. G. & O’Donoghue, M. in Ecology and Conservation of Lynx in the United States
(eds Ruggiero, L. F. et al.) 265–306 (University Press of Colorado, Denver, 2000).
7. Krebs, C. J., Boutin, S. & Boonstra, R. Ecosystem Dynamics of the Boreal Forest: The Kluane Project
(Oxford Univ. Press, New York, 2001).
8. Ranta, E., Kaitala, V. & Lindstrom, J. Dynamics of Canadian lynx populations in space and time.
Ecography 20, 454–460 (1997).
9. Schwartz, M. K. et al. DNA reveals high dispersal synchronizing the population dynamics of Canada
lynx. Nature 415, 520–522 (2002).
10. Burton, C., Krebs, C. J. & Taylor, E. B. Population genetic structure of the cyclic snowshoe hare (Lepus
americanus) in southwestern Yukon, Canada. Mol. Ecol. 11, 1689–1701 (2002).
11. Dawson, A. G. Ice Age Earth: Late Quaternary Geology and Climate (Routledge, London, 1992).
12. Hewitt, G. M. Some genetic consequences of ice ages, and their role in divergence and speciation. Biol.
J. Linn. Soc. 58, 247–276 (1996).
13. Fedorov, V. B. & Stenseth, N. C. Multiple glacial refugia in the North American Arctic: Inference from
phylogeography of the collared lemming (Dicrostonyx groenlandicus). Proc. R. Soc. Lond. B 269,
2071–2077 (2002).
14. Kurten, B. & Anderson, E. Pleistocene Mammals of North America (Columbia Univ. Press, New York,
1980).
15. Templeton, A. R., Routman, E. & Phillips, C. A. Separating population structure from population
history: A cladistic analysis of the geographical distribution of mitochondrial DNA haplotypes in the
tiger salamander, Ambystoma tigrinum. Genetics 140, 767–782 (1995).
16. Avise, J. C. Phylogeography: The History and Formation of Species (Harvard Univ. Press, Cambridge,
Massachusetts, 2000).
17. Templeton, A. R., Crandall, K. A. & Sing, C. F. A cladistic analysis of phenotypic associations with
haplotypes inferred from restriction endonuclease mapping and DNA sequence data. III. Cladogram
estimation. Genetics 132, 619–633 (1992).
18. Doebeli, M. & Dieckmann, U. Speciation along environmental gradients. Nature 421, 259–264 (2003).
19. Greenwood, P. J. Mating systems, philopatry and dispersal in birds and mammals. Anim. Behav. 28,
1140–1162 (1980).
20. Mowat, G. & Slough, B. G. Some observations on the natural history and behavior of the Canada lynx,
Lynx canadensis. Can. Field-Nat. 112, 32–36 (1998).
21. Slough, B. G. & Mowat, G. Lynx population dynamics in an untrapped refugium. J. Wildl. Mgmt 60,
946–961 (1996).
22. Poole, K. G. Dispersal patterns of lynx in the Northwest Territories. J. Wildl. Mgmt 61, 497–505
(1997).
23. Menotti-Raymond, M. et al. A genetic linkage map of microsatellites in the domestic cat (Felis catus).
Genomics 57, 9–23 (1999).
24. Raymond, M. & Rousset, F. GENEPOP (v 1.2): Population genetics software for exact tests and
ecumenicism. J. Hered. 86, 248–249 (1995).
25. Janczewski, D. N., Modi, W. S., Stephens, J. C. & O’Brien, S. J. Molecular evolution of mitochondrial
12S RNA and cytochrome b sequences in the pantherine lineage of Felidae. Mol. Biol. Evol. 12,
690–707 (1995).
26. Schneider, S., Roessli, D. & Excoffier, L. Arlequin Ver. 2,000: A Software For Population Genetic Data
Analysis (Genetics and Biometry Laboratory, Univ. Geneva, Switzerland, 2000).
27. Rogers, A. R. Genetic evidence for a Pleistocene population explosion. Evolution 49, 608–615 (1995).
28. Clement, M., Posada, D. & Crandall, K. A. TCS: A computer program to estimate gene genealogies.
Mol. Ecol. 9, 1657–1660 (2000).
29. Templeton, A. R. & Sing, C. F. A cladistic analysis of phenotypic associations with haplotypes inferred
from restriction endonuclease mapping. IV. Nested analyses with cladogram uncertainty and
recombination. Genetics 134, 659–669 (1993).
30. Posada, D., Crandall, K. A. & Templeton, A. R. GeoDis: A program for the cladistic nested analysis of
the geographical distribution of genetic haplotypes. Mol. Ecol. 9, 487–488 (2000).
Supplementary Information accompanies the paper on www.nature.com/nature.
Acknowledgements We are grateful to the wildlife managers and trappers that participated in the
sampling, especially D. F. McAlpine, R. Lafond, C. Heydon, B. Verbiwski, A. Arsenault,
R. Mulders, P. W. Cotter, M. Badry, C. Apps and T. Shury. We also thank Ø. Flagstad and D. Ehrich
for discussions. This work was supported by the University of Oslo and the Norwegian Research
Council.
Competing interests statement The authors declare that they have no competing financial
interests.
Correspondence and requests for material should be addressed to N.C.S.
([email protected]). Sequences have been deposited in GenBank under accession numbers
AY319482–AY319505 (D-loop) and AY319506–AY319512 (Cytb).
..............................................................
Evolution of cooperation and conflictin experimental bacterial populationsPaul B. Rainey1,2 & Katrina Rainey3
1Department of Plant Sciences, University of Oxford, South Parks Road, OxfordOX1 3RB, UK2School of Biological Sciences, University of Auckland, Private Bag 92019,Auckland, New Zealand327 Westwell Road, Auckland, New Zealand.............................................................................................................................................................................
A fundamental problem in biology is the evolutionary transitionfrom single cells to multicellular life forms1–3. During thistransition the unit of selection shifts from individual cells togroups of cooperating cells1,3,4. Although there is much theory5–15,there are few empirical studies16. Here we describe an evolution-ary transition that occurs in experimental populations of Pseudo-monas fluorescens propagated in a spatially heterogeneousenvironment17. Cooperating groups are formed by over-pro-duction of an adhesive polymer18, which causes the interests ofindividuals to align with those of the group. The costs andbenefits of cooperation, plus evolutionary susceptibility todefecting genotypes, were analysed to determine conformationto theory1,3,12. Cooperation was costly to individuals, but ben-eficial to the group. Defecting genotypes evolved in populationsfounded by the cooperating type and were fitter in the presence ofthis type than in its absence. In the short term, defectors sabotagedthe viability of the group; but these findings nevertheless show thattransitions to higher orders of complexity are readily achievable,provide insights into the selective conditions, and facilitateexperimental analysis of the evolution of individuality.
Multicellularity has evolved independently on several occasionsand is likely to have simple, albeit diverse, explanations1,2. Untilnow, attention has focused on the advantages of multicellularity andits implications for the development of complexity1,2,19–21. Lessconsideration has been given to the selective conditions necessaryfor the evolutionary origin of simple undifferentiated groups: thesehave special significance because they may have been the rawmaterial for the evolution of multicellular organisms2,15,22.
The origin of cooperating groups of cells requires an under-standing of how selection operates at the level of individualcells1,3,6,8,12. Of central importance is the genetic relatedness of thecooperating individuals: if interactions are with relatives then genescausing altruistic or cooperative behaviour can increase in fre-quency5. While costs of cooperation to individual cells are readilyenvisaged (expression of traits necessary for cohesion, reducedaccessibility of clustered cells to nutrients, build-up of toxic meta-bolic waste) the selective benefit to forming undifferentiated groupsof cells is unclear. Size may be an important factor because largergroups of cells are less prone to predation2,16,20; some can migratefurther23. Recent theory suggests that enhanced resource utilizationefficiency and reduced interaction with noncooperative individualsare also relevant15. A related issue concerns the existence of spatialstructure13, which increases chances for interactions to occur amonggenetically related cells5.
Populations of ancestral smooth (SM) P. fluorescens rapidlydiversify when propagated in a spatially structured environment(static broth microcosms), generating, via genetic mutation, a rangeof niche specialist genotypes that are maintained by negativefrequency dependent selection17. One prominent class of nichespecialist is the wrinkly spreader (WS), which colonizes the air–liquid interface. Colonization of this niche enables cells to avoid theanoxic conditions that rapidly build up in unshaken broth culture.
Differences in niche preference of ancestral SM and derived WSgenotypes (Fig. 1) led to the hypothesis that WS genotypes owe their
letters to nature
NATURE | VOL 425 | 4 SEPTEMBER 2003 | www.nature.com/nature72 © 2003 Nature Publishing Group
evolutionary success to cooperation (Fig. 1b). If true, then accord-ing to theory, selection will favour evolution of the cooperating typeprovided the costs of cooperation to individual cells are tradedagainst increased fitness at the group level3–5,11,12.
To measure fitness of individual WS cells, equal numbers of WSand SM cells were competed over 24 h in spatially heterogeneousmicrocosms. The ratio of malthusian parameters of each competingtype was used to calculate the fitness of WS relative to SM24 Duringthe first 24 h of growth, that is, during the exponential phase(3.5 £ 102 to 5.5 £ 107 cells ml21) when resources are abundant,the relative fitness of WS was 0.80 (95% confidence interval, CI:0.69–0.91, based on the t distribution with two degrees of freedom),which is significantly less than 1.0, the fitness by definition of theancestral genotype.
Despite a much reduced doubling time, WS readily invades (froma single mutant cell) populations dominated by the ancestralgenotype to reach population densities that exceed those of theoriginally dominant ancestral type17,25. Its ability to achieve this isattributable to simple mutations that leads to over-production of acellulosic polymer18.
Theory predicts that the group will be vulnerable to the evolu-tionary emergence of defectors, which, in the absence of conflictmediators, stand to weaken the cohesiveness of the group3,4,11,12.Vulnerability stems from the fact that selection rewards cells thatavoid paying the cost of cooperation—selection especially favoursdefectors that ‘cheat’, that is, cells that gain additional advantagefrom the cooperating type over and above that gained by avoidingthe cost of cooperation.
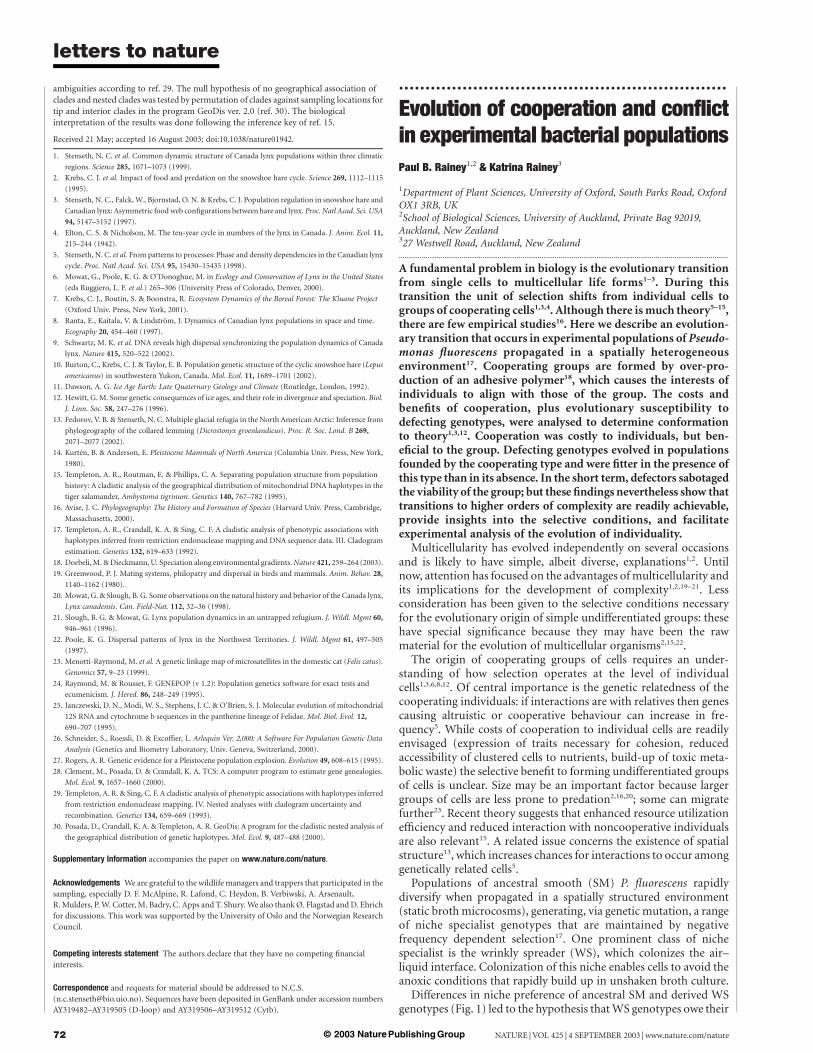
To test this prediction, replicate microcosms were founded withthe WS genotype and their evolutionary trajectory followed over aten-day period (Fig. 2). By day five, mutants that were ancestral-likein terms of colony morphology and niche preference had evolved bymutation; none of these cells showed any tendency to aggregate orform mats and there was no significant difference in competitivefitness between defectors and ancestral SM cells (mean fitness ofdefectors relative to ancestral SM was 0.96; 95% CI: 0.86–1.05, basedon the t distribution with two degrees of freedom). Because thesemutants no longer act cooperatively we refer to them as defectors.
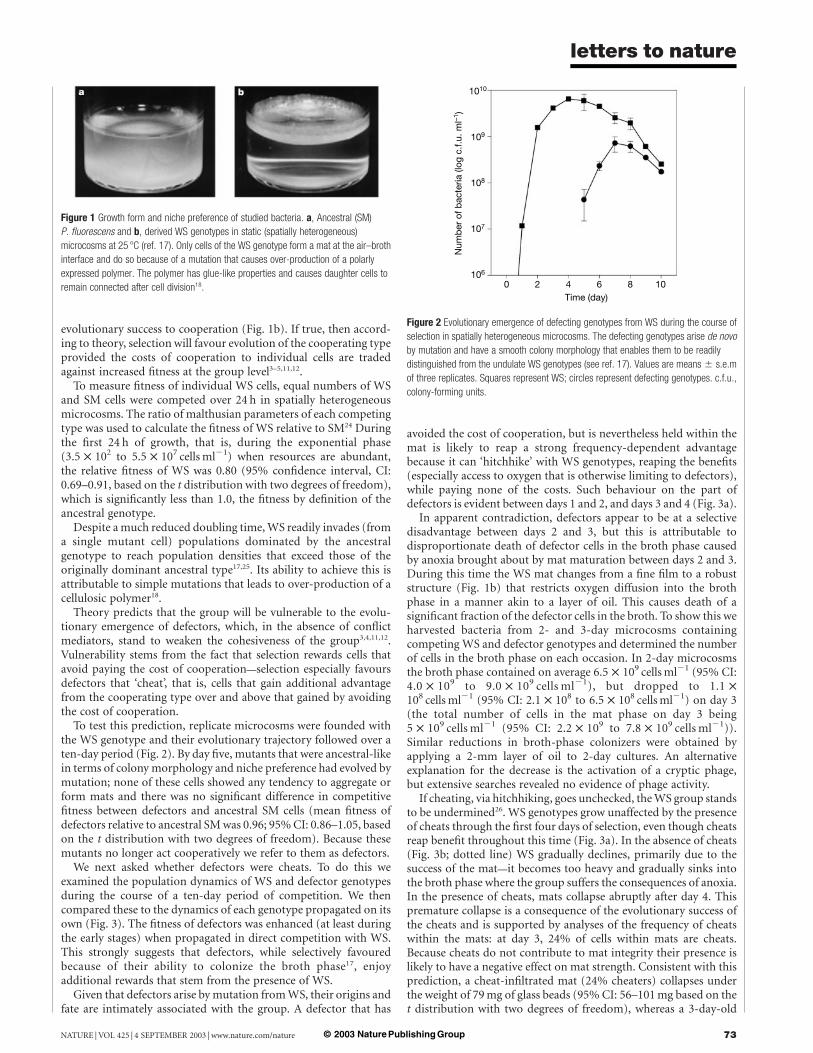
We next asked whether defectors were cheats. To do this weexamined the population dynamics of WS and defector genotypesduring the course of a ten-day period of competition. We thencompared these to the dynamics of each genotype propagated on itsown (Fig. 3). The fitness of defectors was enhanced (at least duringthe early stages) when propagated in direct competition with WS.This strongly suggests that defectors, while selectively favouredbecause of their ability to colonize the broth phase17, enjoyadditional rewards that stem from the presence of WS.
Given that defectors arise by mutation from WS, their origins andfate are intimately associated with the group. A defector that has
avoided the cost of cooperation, but is nevertheless held within themat is likely to reap a strong frequency-dependent advantagebecause it can ‘hitchhike’ with WS genotypes, reaping the benefits(especially access to oxygen that is otherwise limiting to defectors),while paying none of the costs. Such behaviour on the part ofdefectors is evident between days 1 and 2, and days 3 and 4 (Fig. 3a).
In apparent contradiction, defectors appear to be at a selectivedisadvantage between days 2 and 3, but this is attributable todisproportionate death of defector cells in the broth phase causedby anoxia brought about by mat maturation between days 2 and 3.During this time the WS mat changes from a fine film to a robuststructure (Fig. 1b) that restricts oxygen diffusion into the brothphase in a manner akin to a layer of oil. This causes death of asignificant fraction of the defector cells in the broth. To show this weharvested bacteria from 2- and 3-day microcosms containingcompeting WS and defector genotypes and determined the numberof cells in the broth phase on each occasion. In 2-day microcosmsthe broth phase contained on average 6.5 £ 109 cells ml21 (95% CI:4.0 £ 109 to 9.0 £ 109 cells ml21), but dropped to 1.1 £108 cells ml21 (95% CI: 2.1 £ 108 to 6.5 £ 108 cells ml21) on day 3(the total number of cells in the mat phase on day 3 being5 £ 109 cells ml21 (95% CI: 2.2 £ 109 to 7.8 £ 109 cells ml21)).Similar reductions in broth-phase colonizers were obtained byapplying a 2-mm layer of oil to 2-day cultures. An alternativeexplanation for the decrease is the activation of a cryptic phage,but extensive searches revealed no evidence of phage activity.
If cheating, via hitchhiking, goes unchecked, the WS group standsto be undermined26. WS genotypes grow unaffected by the presenceof cheats through the first four days of selection, even though cheatsreap benefit throughout this time (Fig. 3a). In the absence of cheats(Fig. 3b; dotted line) WS gradually declines, primarily due to thesuccess of the mat—it becomes too heavy and gradually sinks intothe broth phase where the group suffers the consequences of anoxia.In the presence of cheats, mats collapse abruptly after day 4. Thispremature collapse is a consequence of the evolutionary success ofthe cheats and is supported by analyses of the frequency of cheatswithin the mats: at day 3, 24% of cells within mats are cheats.Because cheats do not contribute to mat integrity their presence islikely to have a negative effect on mat strength. Consistent with thisprediction, a cheat-infiltrated mat (24% cheaters) collapses underthe weight of 79 mg of glass beads (95% CI: 56–101 mg based on thet distribution with two degrees of freedom), whereas a 3-day-old
Figure 2 Evolutionary emergence of defecting genotypes from WS during the course of
selection in spatially heterogeneous microcosms. The defecting genotypes arise de novo
by mutation and have a smooth colony morphology that enables them to be readily
distinguished from the undulate WS genotypes (see ref. 17). Values are means ^ s.e.m
of three replicates. Squares represent WS; circles represent defecting genotypes. c.f.u.,
colony-forming units.
Figure 1 Growth form and niche preference of studied bacteria. a, Ancestral (SM)
P. fluorescens and b, derived WS genotypes in static (spatially heterogeneous)
microcosms at 25 8C (ref. 17). Only cells of the WS genotype form a mat at the air–broth
interface and do so because of a mutation that causes over-production of a polarly
expressed polymer. The polymer has glue-like properties and causes daughter cells to
remain connected after cell division18.
letters to nature
NATURE | VOL 425 | 4 SEPTEMBER 2003 | www.nature.com/nature 73© 2003 Nature Publishing Group
mat comprised solely of WS cells supports glass beads to a mass of432 mg (95% CI: 390–473 mg based on the t distribution with twodegrees of freedom).
Here we have described an evolutionary transition from individ-ual cells to a cooperating group that occurs de novo during thecourse of selection of P. fluorescens in a heterogeneous environment.The transition is dependent upon spatial heterogeneity; compe-tition for resources (primarily oxygen) is the driving force17,25,27. Thecause of cooperation is a cellulosic polymer that is over-produced byWS cells18. Overproduction of the polymer is costly to individualWS cells, but nevertheless the trait spreads by kin selection5 becausecausing cells (clones) to adhere to one another promotes coloniza-tion of the air–liquid interface. Despite the negative impact ofdefectors on the evolutionary success of the WS mat, WS are apersistent feature of the evolved populations, emerging afresh aftereach collapse and maintained by negative frequency-dependentselection17. In all respects, our results confirm crucial elements oflong-standing theory1,3–6,8,9,11,12,26.
Undifferentiated groups of WS are a far cry from multicellularity.A likely next step is the evolution of conflict mediators1,12,28. Theform of these mediators, and the selective conditions necessary fortheir emergence, is an experimentally tractable problem; and ofsome significance because the cellulosic polymer both creates the
group and has the potential to co-evolve with traits that evolve onthe basis of the group11,29,30.
Finally, the ease and repeatability of this evolutionary transition isnotable. Microbiologists have long known that cultures left on thelaboratory bench grow a surface scum analogous to a WS mat.Similar selective forces (competition for oxygen) are likely tooperate in a range of aqueous environments, possibly resulting infrequent transitions to undifferentiated multicellularity in the wild.Indeed, an accompanying paper supports this conjecture31 andfurther highlights the significance of adhesive factors29. As such,simple undifferentiated groups of bacteria may have played animportant early role in the evolution of multicellularity2,15, but inaddition, cooperative behaviour in bacteria may be more commonthan currently thought. A
Received 5 May; accepted 11 July 2003; doi:10.1038/nature01906.
1. Maynard Smith, J. & Szathmary, E. The Major Transitions in Evolution (Freeman, Oxford, 1995).
2. Bonner, J. T. First Signals: The Evolution of Multicellular Development, (Princeton Univ. Press,
Princeton, 2000).
3. Buss, L. W. The Evolution of Individuality (Princeton Univ. Press, Princeton, 1987).
4. Maynard Smith, J. in Evolutionary Progress (ed. Nitecki, M. H.) 219–230 (Univ. Chicago Press,
Chicago, 1988).
5. Hamilton, W. D. The genetical evolution of social behaviour. J. Theor. Biol. 7, 1–52 (1964).
6. Williams, G. C. Adaptation and Natural Selection (Princeton Univ. Press, Princeton, 1966).
7. Wilson, D. S. A theory of group selection. Proc. Natl Acad. Sci. USA 72, 143–146 (1975).
8. Dawkins, R. The Selfish Gene (Oxford Univ. Press, Oxford, 1976).
9. Axelrod, R. & Hamilton, W. D. The evolution of cooperation. Science 211, 1390–1396 (1981).
10. Ferriere, R. & Michod, R. E. The evolution of cooperation in spatially heterogeneous populations. Am.
Nat. 147, 692–717 (1996).
11. Sober, E. & Wilson, D. S. Unto Others: The Evolution and Psychology of Unselfish Behaviour (Harvard
Univ. Press, Cambridge, MA, 1998).
12. Michod, R. E. Darwinian Dynamics: Evolutionary Transitions in Fitness and Individuality (Princeton
Univ. Press, Princeton, 1999).
13. Pfeiffer, T., Schuster, S. & Bonhoeffer, S. Cooperation and competition in the evolution of ATP-
producing pathways. Science 292, 504–507 (2001).
14. Smith, J. The social evolution of bacterial pathogenesis. Proc. R. Soc. Lond. B 268, 61–69 (2001).
15. Pfeiffer, T. & Bonhoeffer, S. An evolutionary scenario for the transition to undifferentiated
multicellularity. Proc. Natl Acad. Sci. USA 100, 1095–1098 (2003).
16. Boraas, M. E., Seale, D. B. & Boxhorn, J. E. Phagotrophy by a flagellate selects for colonial prey: A
possible origin of multicellularity. Evol. Ecol. 12, 153–164 (1998).
17. Rainey, P. B. & Travisano, M. Adaptive radiation in a heterogeneous environment. Nature 394, 69–72
(1998).
18. Spiers, A. J., Kahn, S. G., Bohannon, J., Travisano, M. & Rainey, P. B. Adaptive divergence in
experimental populations of Pseudomonas fluorescens. I. Genetic and phenotypic bases of wrinkly
spreader fitness. Genetics 161, 33–46 (2002).
19. Wolpert, L. The evolution of development. Biol. J. Linn. Soc. 39, 109–124 (1990).
20. Bell, G. in The Origin and Evolution of Sex (eds Halvorson, H. & Mornoy, A.) 221–256 (Alan R. Liss,
New York, 1985).
21. Koufopanou, V. & Bell, G. Soma and germ - an experimental approach using Volvox. Proc. R. Soc.
Lond. B 254, 107–113 (1993).
22. Kerszberg, M. & Wolpert, L. The origin of metazoa and the egg: a role for cell death. J. Theor. Biol. 193,
535–537 (1998).
23. Foster, K. R., Fortunato, A., Strassmann, J. E. & Queller, D. C. The costs and benefits of being a
chimera. Proc. R. Soc. Lond. B 269, 2357–2362 (2002).
24. Lenski, R. E., Rose, M. R., Simpson, S. C. & Tadler, S. C. Long-term experimental evolution in
Escherichia coli. I. Adaptation and divergence during 2,000 generations. Am. Nat. 138, 1315–1341
(1991).
25. Buckling, A., Kassen, R., Bell, G. & Rainey, P. B. Disturbance and diversity in experimental
microcosms. Nature 408, 961–964 (2000).
26. Hardin, G. The tragedy of the commons. Science 162, 1243–1248 (1968).
27. Kassen, R., Buckling, A., Bell, G. & Rainey, P. B. Diversity peaks at intermediate productivity in a
laboratory microcosm. Nature 406, 508–512 (2000).
28. Frank, S. A. Mutual policing and repression of competition in the evolution of cooperative groups.
Nature 377, 520–522 (1995).
29. Queller, D. C., Ponte, E., Bozzaro, S. & Strassmann, J. E. Single-gene greenbeard effects in the social
amoeba Dictyostelium discoideum. Science 299, 105–106 (2003).
30. Wolf, J. B. Genetic architecture and evolutionary constraint when the environment contains genes.
Proc. Natl Acad. Sci. USA 100, 4655–4660 (2003).
31. Velicer, G. J. & Yu, Y. N. Evolution of novel cooperative swarming in the bacterium Myxococcus
xanthus. Nature 425 75–78 (2003).
Acknowledgements We are grateful to D. S. Wilson and A. Buckling whose comments improved
the manuscript. A Biotechnology and Biological Sciences Research Council (UK) Research
Fellowship to P.B.R. supported the work.
Competing interests statement The authors declare that they have no competing financial
interests.
Correspondence and requests for materials should be addressed to P.B.R.
Figure 3 Population dynamics of WS and defector genotypes in the presence and
absence of competition. Competing genotypes were founded at equal densities (less than
103 cells ml21). Every 24 h three replicate microcosms were harvested and the frequency
of WS and defector genotypes was scored using colony morphology on agar plates to
distinguish variant types17. The effect of WS on the fitness of defector genotypes (a) is the
difference between dotted (absence of WS) and solid (presence of competing WS) lines.
The effect of defector genotypes on the fitness of WS genotypes (b) is the difference
between the dotted (absence of competition) and solid (presence of competing defector
genotype) lines. Values are means ^ s.e.m. (n ¼ 3).
letters to nature
NATURE | VOL 425 | 4 SEPTEMBER 2003 | www.nature.com/nature74 © 2003 Nature Publishing Group


![High-throughput isolation and sorting of gut microbes reduce … · stable co-culturing of complex bacterial populations [20]. Although these techniques increase the throughput in](https://img.pdfslide.us/doc/110x75/5e8fa1f7b311285cbd25938f/high-throughput-isolation-and-sorting-of-gut-microbes-reduce-stable-co-culturing.jpg)