Embed Size (px)
Citation preview

Evolution of choice and innovation in the EU food sector
Key findings October 2014

1 The economic impact of modern retail on choice and innovation in the EU food sector – Key Findings - October 2014
Objectives of the study
Analyse the evolution of choice and innovation
Identify the main potential drivers of choice and innovation (eg concentration) and measure their evolution
Determine the impact of drivers on choice and innovation
1 Scope and methodology
Assess the economic impact of modern retail on choice and innovation in the EU food sector

2 The economic impact of modern retail on choice and innovation in the EU food sector – Key Findings - October 2014
A comprehensive study, requiring outstanding resources
► A very broad scope to meet high expectations ► Wide scope in the EU
► Long period including pre-crisis
► Consumer standpoint: access to choice and innovation at local level in modern retail shops
► Quantitative (including econometrics) and qualitative analyses (6 case studies)
► Outstanding resources
► 2004 to 2012 (2 time periods per year)
► Selection of shops and countries based on availability of data on long period
► Data purchase / consolidation from different data sources
► Focus on local data: 343 shops, 9 Member states, 105 consumer shopping areas
► 23 product categories with a full set of information for each product
► A database of 11 million data records
1 Scope and methodology

3 The economic impact of modern retail on choice and innovation in the EU food sector – Key Findings - October 2014
► Validation of definitions: work process
Expert workshops and literature review
► Validation of conclusions providing a joint definition and operationalisation of key concepts
► Emphasis on differences encountered throughout the study
2nd survey round
► Validation of the first round
► Generation of consensus around choice and innovation
► Free discussion on each topic focusing on reactions and conclusions
Online focus group
► List of initial thoughts about choice and innovation
► Emphasis on drivers and operationalisation
1st survey round
1 Scope and methodology
4 The economic impact of modern retail on choice and innovation in the EU food sector – Key Findings - October 2014
Measurement of choice ► Food choice
► Variety of products available in shops in consumer shopping areas
► Variety of packaging sizes
► Variety of prices
► Variety of suppliers
► Shop choice
► Variety of shops to which a typical consumer has access within a normal distance (consumer shopping area)
1 Scope and methodology
Expert workshops and literature review

5 The economic impact of modern retail on choice and innovation in the EU food sector – Key Findings - October 2014
Measurement of innovation ► Need to have objective and measurable KPI, excluding subjective qualitative
qualifications
► Number of new SKUs* (excluding promotions) available for consumers at shop level
► Identification and measurement of innovation types
► New product
► Range extension
► New packaging
► New formulation
► Relaunch
* SKU = Stock keeping Unit
1 Scope and methodology
Expert workshops and literature review

6 The economic impact of modern retail on choice and innovation in the EU food sector – Key Findings - October 2014
Innovation types (Mintel – GNPD) ► New product: assigned when a new range, line, or family of products is encountered.
This launch type is also used if a brand that already exists on GNPD, in one country, crosses over to a new sub-category
► New variety/range extension: used to document an extension to an existing range of products on the GNPD
► New packaging: determined by visually inspecting the product for changes, and also when terms like New Look, New Packaging, or New Size are written on pack.
► New formulation: determined by visually looking for key terms on pack like New Formula, Even Better, Tastier, Now Lower in Fat, New and Improved, Great New Taste..
► Relaunch: some wording indicating that the product has been relaunched on the packaging or the product does not exist on the database but there is secondary source information (such as from a press release, magazine, trade show, website or a shop display) that the product has been relaunched
1 Scope and methodology
Expert workshops and literature review

7 The economic impact of modern retail on choice and innovation in the EU food sector – Key Findings - October 2014
List of shops
List of new products
(EAN, type of innovation)
Socio-demographic
statistics National and NUTS3 levels
Supplier characteristics
Retails characteristics
List of EAN present on shelves for each 343 shops of the sample
Opus
DATABASE CALCULATIONS
Shop level database Shop level database Shop level database Shop level database
Output tables for descriptive statistics
Join by period
and CSA
Join by period, MS and product
category
Join by period
and EAN
Join by period
and CSA
Join by period, MS and product
category
Database of 11 millions data records processed
Trade Dimensions
1 Scope and methodology
Database construction

8 The economic impact of modern retail on choice and innovation in the EU food sector – Key Findings - October 2014
► Selection of shops and consumer shopping area at local level ► Identification of consumer shopping areas thanks to geolocalisation
► Consumer point of view
Geographical perimeter of each consumer
shopping area (CSA)
Travel time between the central point (city hall) and outer limit of the area 15 min travel time for large
cities 20 min travel time for
medium and small cities 25 min for a rural zone
Figure 2: Example: Consumer shopping area – Clichy-sous-Bois (FR)
1 Scope and methodology
Database construction
illustrative

9 The economic impact of modern retail on choice and innovation in the EU food sector – Key Findings - October 2014
► 343 shops in 105 consumer shopping areas
Sources: Eurostat, EY analysis
GDP/Capita Low Medium - Medium + High Total
Type of living Number of CSA
Number of CSA
Number of CSA
Number of CSA
Number of CSA
Predominantly Rural (PR) 8 8 3 4 23
Intermediate (INT) 13 9 13 7 42 Predominantly Urban (PU) 5 8 15 12 40
TOTAL 26 25 31 23 105
1 Scope and methodology
Database construction
25% 25% 25% 26% 25% 24%
30%
22%
Low Medium- Medium+ High
EU27
Sample
23%
35% 42%
22%
40% 38%
PR IN PU
EU27
Sample
Representativeness of sample vs EU27 population by standard and type of living categories
10 The economic impact of modern retail on choice and innovation in the EU food sector – Key Findings - October 2014
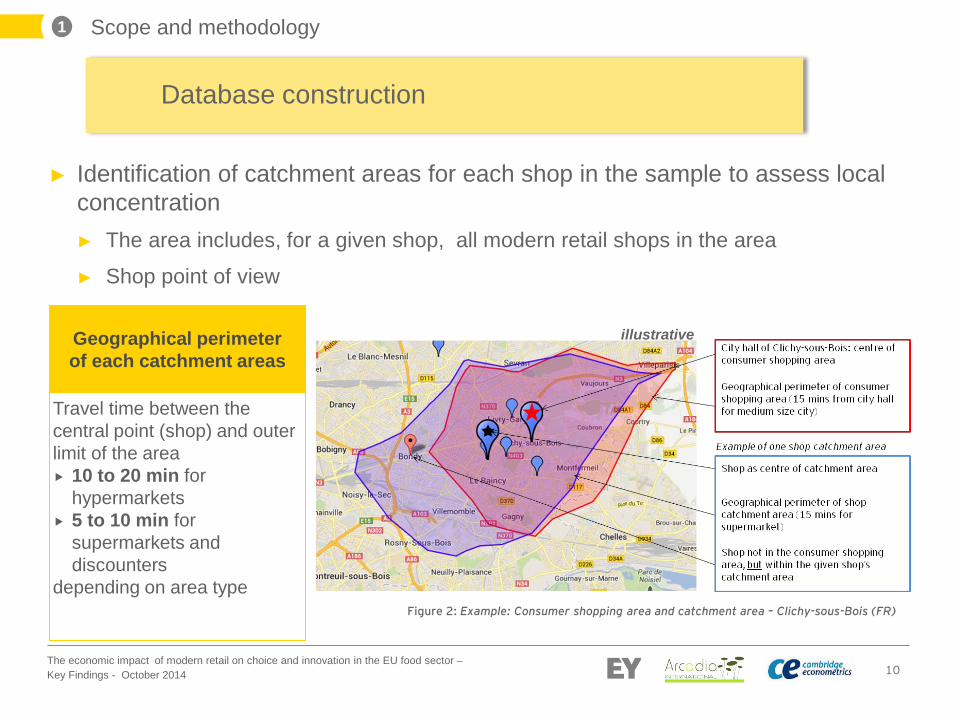
► Identification of catchment areas for each shop in the sample to assess local concentration ► The area includes, for a given shop, all modern retail shops in the area
► Shop point of view
Figure 2: Example: Consumer shopping area and catchment area – Clichy-sous-Bois (FR)
1 Scope and methodology
Database construction
Geographical perimeter of each catchment areas
Travel time between the central point (shop) and outer limit of the area 10 to 20 min for
hypermarkets 5 to 10 min for
supermarkets and discounters
depending on area type
illustrative

11 The economic impact of modern retail on choice and innovation in the EU food sector – Key Findings - October 2014
Database of 11 millions data records processed
343 shops Hypermarkets Supermarkets Discounters
All main retail groups and banners in Europe Sh
op c
over
age
Cou
ntry
cov
erag
e
Belgium
Czech Rep.
Denmark
France
Hungary
Italy
Poland
Portugal
Spain
51% of EU pop
Prod
uct c
over
age
23 categories
Tim
e co
vera
ge
Precrisis period 2004-2008
Crisis period 2008-2012
2004-2012
105 Consumer
Shopping
Areas
CSA
cov
erag
e Frozen pizzas/starter, frozen ready cooked meals, frozen vegetables
Ice cream
Milk, cheese, yoghurt, butter/margarine, desserts
Bread, ham / delicatessen
Baby food, canned vegetables, edible oil, savoury snacks
Coffee, tea, Biscuits, cereals, chocolate
Fruit juices, mineral water, soft drinks
1 Scope and methodology
Database construction

12 The economic impact of modern retail on choice and innovation in the EU food sector – Key Findings - October 2014
Descriptive analyses
► Aimed to distill the richness of the database into meaningful statistics ► Produced a consistent reporting pack covering choice, innovation and all
potential drivers for each member state and at consolidated level, for short and long periods
► Approach allowed comparison between CSA, countries, CSA types, shop types, identifying wider trends as well as those unique to particular markets
► Informs the econometric analysis and provides hypotheses for testing
1 Scope and methodology

13 The economic impact of modern retail on choice and innovation in the EU food sector – Key Findings - October 2014
► Approach ► Analyse the historical evidence for the impact of potential drivers on various
measures of choice and innovation, controlling for local and national influences
► Model the behaviour of each shop and the selection of products that it offers, with reference to various national and local drivers and shop characteristics
Econometric analyses measuring the impact of drivers on choice and innovation
1 Scope and methodology

14 The economic impact of modern retail on choice and innovation in the EU food sector – Key Findings - October 2014
[choice or innovation]s,p,t = f {
shop types,t
shop sizes,t
private label sharen/s,p,t
retailers' concentrationn/s,t
suppliers' concentrationn/s,p,t
[or imbalance (retailer vs supplier concentration)n/s,p,t]
socio-demographic indicatorsc,t
rural/urban categoryc or population densityc
product category turnovern,p,t
economic prosperity/macroeconomic conditionsc/n,t
Member Staten
product categoryp
yeary
seasonm
new competitor shop openings,t
}
1 Scope and methodology
Econometric analyses measuring the impact of drivers on choice and innovation

Main conclusions

16 The economic impact of modern retail on choice and innovation in the EU food sector – Key Findings - October 2014
Main conclusions: choice
► Choice available to consumers in local shops increased in terms of the number of alternative products, the number of different brand suppliers and the number of modern retail shops
► The increase was greater during 2004-2008 than 2008-2012 ► In addition to the shop types and shop size which have an obvious impact on
choice, economic prosperity and product category turnover have been favourable factors for choice
► Competition in the form of a new shop opening in the local area improves the choice offered in existing shops
► There is no evidence that the concentrations of retailers or suppliers have been an economic driver of choice
► The impact of private labels on the evolution of choice was found to be negative but small.

17 The economic impact of modern retail on choice and innovation in the EU food sector – Key Findings - October 2014
Main conclusions: innovation ► The presence of innovative food products at retailers’ shop level has declined in Europe
after 2008
► Innovations focused on new packaging have become considerably more common over time in most European Member States
► Innovation slowed down, particularly because of the impact of: ► Economic drivers: booming unemployment impacting the purchase power of European
households
► Increasing supplier concentration at national level
► However, the opening of new shops in the catchment areas had a positive effect on new products available to consumers, whereas greater concentration among modern retailers at a local level was associated with less innovation
► As for choice, shop type and shop size had an obvious impact on innovation available to consumers
► High share of private labels were associated with less innovation
► Evidence from the case studies suggested that, for fresh non-barcoded products, a key-driver for innovation was the organisation of the supply-chain.

Evolution of choice

19 The economic impact of modern retail on choice and innovation in the EU food sector – Key Findings - October 2014
Choice in shops, alternative products and brand suppliers has increased in the majority of sampled MS
Type of choice Component 2004-2008 2008-2012 2004-2012 Trend
Food Choice
Choice in alternative products** 7,9% 2,4% 5,1%
Choice in packaging sizes 5,0% 2,0% 3,5%
Choice in alternative suppliers** 5,6% 1,5% 3,5%
Choice in prices per product category1 + -- -
Shop Choice
Choice in shops* 1,8% 1,3% 1,6%
+ Positive CAGR; - Negative CAGR; ++ CAGR is twice as much as average growth value; -- CAGR is twice as less as average growth value 1 : Results need to be considered with caution because of inconsistency found in data
2 Evolution of choice and innovation

20 The economic impact of modern retail on choice and innovation in the EU food sector – Key Findings - October 2014
Choice in alternative products
Per product category
Source: EY analysis based on © Nielsen Opus, at local level - FR-IT-PT-SP-HU-BE, 2004-2012
8% 7% 7% 7% 7% 6% 6% 6% 6% 6% 5% 5% 5% 5% 5% 5% 5% 5% 4%
4% 3% 3% 3% 2%
0%1%2%3%4%5%6%7%8%9%
Annual growth of total number of EAN by product category 2004-2012
2 Evolution of choice and innovation

21 The economic impact of modern retail on choice and innovation in the EU food sector – Key Findings - October 2014
Choice in alternative products
Per shop type
Source: EY analysis based on © Nielsen Opus - FR-IT-PT-SP-HU-BE, 23 product categories
2 Evolution of choice and innovation
8,3%
4,7%
9,3%
2,2% 2,6%
6,8%
5,2%
3,6%
8,0%
0,76 1,26 1,76 2,26 2,76 3,26 3,76
0
10000
20000
30000
40000
50000
60000
70000
0%1%2%3%4%5%6%7%8%9%
10%
Hypermarkets Supermarkets Discount Stores
Annual growth of total number of EAN by shop type
CAGR(04 - 08) CAGR(08 - 12) CAGR(04 - 12) 2004 values

Evolution of innovation

23 The economic impact of modern retail on choice and innovation in the EU food sector – Key Findings - October 2014
Source: EY analysis based on © Nielsen Opus – BE-FR-IT-PO-PT-SP
Evolution of innovations
Innovation rate declined after 2008…
3,8%
-1,2%
-5,3% -6%
-5%
-4%
-3%
-2%
-1%
0%
1%
2%
3%
4%
5%
Total new EANs
Evolution of the number of innovations (new EAN)
CAGR(06 - 08) CAGR(08-10) CAGR(10-12)
2 Evolution of choice and innovation

24 The economic impact of modern retail on choice and innovation in the EU food sector – Key Findings - October 2014
… over almost all product categories
Source: EY analysis based on © Nielsen Opus – BE-FR-IT-PO-PT-SP
Per product category
3% 2% 1% 1% 1% 0%
0% 0% 0% -1% -1% -1% -1% -1% -2% -2% -2% -3% -3% -4% -4% -4% -5%
-7% -8%
-6%
-4%
-2%
0%
2%
4%
Annual growth in number of new EAN codes by product category 2004-2012
2 Evolution of choice and innovation
25 The economic impact of modern retail on choice and innovation in the EU food sector – Key Findings - October 2014
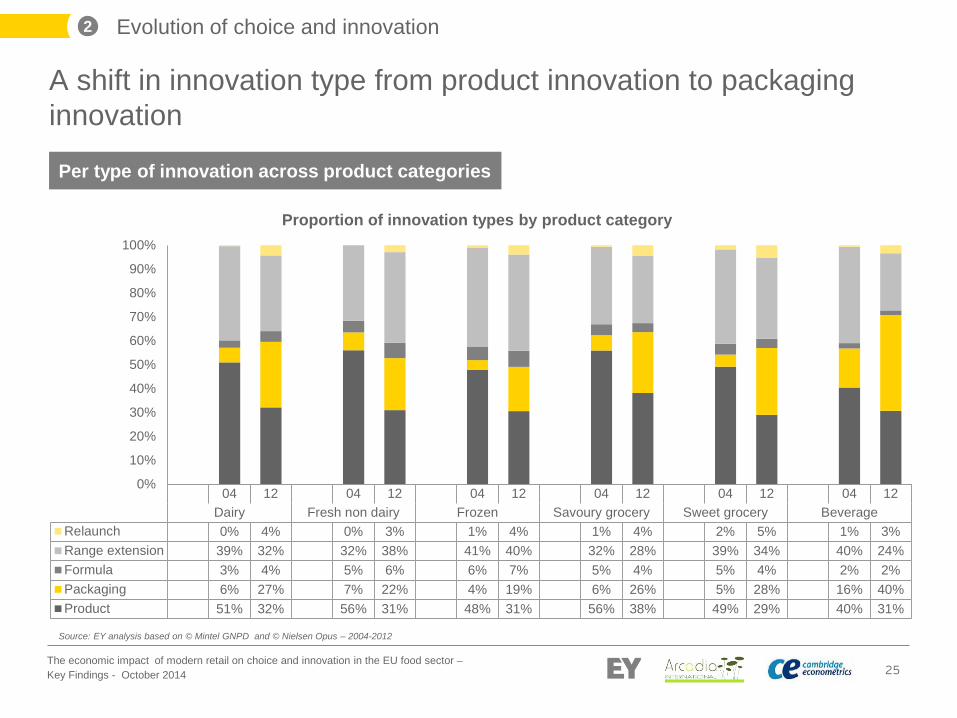
A shift in innovation type from product innovation to packaging innovation
Per type of innovation across product categories
Source: EY analysis based on © Mintel GNPD and © Nielsen Opus – 2004-2012
2 Evolution of choice and innovation
04 12 04 12 04 12 04 12 04 12 04 12Dairy Fresh non dairy Frozen Savoury grocery Sweet grocery Beverage
Relaunch 0% 4% 0% 3% 1% 4% 1% 4% 2% 5% 1% 3%Range extension 39% 32% 32% 38% 41% 40% 32% 28% 39% 34% 40% 24%Formula 3% 4% 5% 6% 6% 7% 5% 4% 5% 4% 2% 2%Packaging 6% 27% 7% 22% 4% 19% 6% 26% 5% 28% 16% 40%Product 51% 32% 56% 31% 48% 31% 56% 38% 49% 29% 40% 31%
0%
10%
20%
30%
40%
50%
60%
70%
80%
90%
100%
Proportion of innovation types by product category

26 The economic impact of modern retail on choice and innovation in the EU food sector – Key Findings - October 2014
The development of new packaging is stronger in France, Italy and Spain than in Belgium, Poland and Portugal
Belgium04
Belgium12
France04
France12 Italy 04 Italy 12 Poland
04Poland
12Portugal
04Portugal
12Spain
04Spain
12
Relaunch 0,6% 0,0% 1,0% 0,1% 0,4% 0,6% 0,6% 0,3% 0,0% 0,0% 2,4% 0,5%Range extension 45,1% 35,6% 50,6% 33,6% 30,9% 28,5% 41,4% 39,0% 33,9% 26,6% 34,9% 36,4%Formula 3,1% 3,7% 5,7% 6,2% 2,9% 2,7% 1,7% 1,8% 0,0% 2,8% 3,9% 3,0%Packaging 8,6% 9,9% 8,4% 30,8% 7,1% 33,7% 2,9% 5,8% 3,1% 8,5% 10,2% 24,1%Product 42,0% 48,7% 34,1% 24,3% 58,5% 30,3% 53,1% 52,2% 62,2% 59,6% 48,6% 33,6%
0%
10%
20%
30%
40%
50%
60%
70%
80%
90%
100%
Proportion of types of innovation by MS (local level)
Source: EY analysis based on © Mintel GNPD and © Nielsen Opus – 2004-2012
Per type of innovation across MS
2 Evolution of choice and innovation

27 The economic impact of modern retail on choice and innovation in the EU food sector – Key Findings - October 2014
New packaging development occurs across all product categories, and represents a large share of innovations for dairy products. Per type of innovation and product category
Source: EY analysis based on © Mintel GNPD and © Nielsen Opus – 2004-2012
04 12 04 12 04 12 04 12 04 12Butter/margarine Cheese Dessert Milk Yoghurt
Relaunch 0% 4% 1% 5% 0% 4% 0% 5% 1% 3%Range extension 34% 25% 35% 33% 38% 41% 33% 23% 57% 36%Formula 5% 4% 3% 2% 6% 8% 0% 2% 1% 6%Packaging 7% 31% 7% 29% 3% 19% 8% 35% 6% 23%Product 54% 35% 55% 31% 52% 28% 59% 35% 35% 32%
0%
10%
20%
30%
40%
50%
60%
70%
80%
90%
100%
Proportion of types of innovations: Dairy
2 Evolution of choice and innovation

28 The economic impact of modern retail on choice and innovation in the EU food sector – Key Findings - October 2014
New packaging share remains weaker than product innovation and range extension for fresh non dairy products
Source: EY analysis based on © Mintel GNPD and © Nielsen Opus – 2004-2012
04 12 04 12 04 12Fresh pre-packaged bread Ham/delicatessen Starters/pizzas
Relaunch 0% 2% 0% 2% 0% 5%Range extension 30% 37% 36% 41% 29% 36%Formula 3% 8% 3% 4% 9% 7%Packaging 3% 25% 8% 21% 11% 19%Product 64% 28% 53% 31% 51% 33%
0%
10%
20%
30%
40%
50%
60%
70%
80%
90%
100%
Proportion of types of innovations: Fresh non dairy
2 Evolution of choice and innovation
Per type of innovation and product category

29 The economic impact of modern retail on choice and innovation in the EU food sector – Key Findings - October 2014
New packaging share remains weaker than product innovation and range extension for frozen products
Source: EY analysis based on © Mintel GNPD and © Nielsen Opus – 2004-2012
Per type of innovation and product category
2 Evolution of choice and innovation
04 12 04 12 04 12Frozen vegetables Ready-cooked meals Ice cream
Relaunch 0% 4% 3% 6% 0% 2%Range extension 44% 44% 44% 38% 35% 39%Formula 7% 6% 9% 10% 1% 4%Packaging 4% 21% 7% 19% 1% 15%Product 44% 25% 37% 27% 62% 40%
0%
10%
20%
30%
40%
50%
60%
70%
80%
90%
100%
Proportion of innovation types by category: Frozen

30 The economic impact of modern retail on choice and innovation in the EU food sector – Key Findings - October 2014
New packaging development occurs across all product categories for savoury grocery
Source: EY analysis based on © Mintel GNPD and © Nielsen Opus – 2004-2012
Per type of innovation and product category
04 12 04 12 04 12 04 12Baby food (ambient) Canned vegetables Edible oil Savoury snacks
Relaunch 1% 9% 0% 3% 0% 2% 1% 4%Range extension 34% 25% 21% 36% 33% 21% 41% 31%Formula 9% 8% 8% 2% 0% 1% 1% 4%Packaging 1% 27% 21% 19% 0% 31% 3% 24%Product 54% 31% 50% 39% 67% 45% 53% 38%
0%
10%
20%
30%
40%
50%
60%
70%
80%
90%
100%
Proportion of types of innovations: Savoury grocery
2 Evolution of choice and innovation

31 The economic impact of modern retail on choice and innovation in the EU food sector – Key Findings - October 2014
New packaging development is quite strong for sweet grocery products.
Source: EY analysis based on © Mintel GNPD and © Nielsen Opus – BE-FR-IT-PO-PT-SP
Per type of innovation and product category
04 12 04 12 04 12 04 12 04 12
Biscuits Cereals Chocolate (Bar +Candies) Coffee Tea
Relaunch 1% 5% 3% 6% 1% 3% 2% 6% 3% 6%Range extension 40% 32% 26% 28% 49% 33% 38% 32% 45% 46%Formula 2% 4% 8% 7% 1% 3% 7% 2% 5% 4%Packaging 6% 27% 5% 31% 3% 26% 3% 35% 8% 21%Product 51% 33% 59% 29% 46% 36% 50% 25% 40% 22%
0%
10%
20%
30%
40%
50%
60%
70%
80%
90%
100%
Proportion of types of innovations: Sweet grocery
2 Evolution of choice and innovation

32 The economic impact of modern retail on choice and innovation in the EU food sector – Key Findings - October 2014
New packaging represents the larger share of innovation types for beverages.
Source: EY analysis based on © Mintel GNPD and © Nielsen Opus – 2004-2012
Per type of innovation and product category
04 12 04 12 04 12Fruit juices (ambient) Mineral water Soft-drinks
Relaunch 1% 5% 0% 2% 1% 3%Range extension 42% 31% 37% 14% 42% 27%Formula 1% 2% 6% 1% 0% 3%Packaging 11% 31% 26% 54% 12% 36%Product 45% 31% 31% 29% 45% 32%
0%
10%
20%
30%
40%
50%
60%
70%
80%
90%
100%
Proportion of types of innovations: Beverage
2 Evolution of choice and innovation

33 The economic impact of modern retail on choice and innovation in the EU food sector – Key Findings - October 2014
Econometric results: drivers of choice and innovation

34 The economic impact of modern retail on choice and innovation in the EU food sector – Key Findings - October 2014
Positive impacts on choice
► Product category turnover ► Economic prosperity ► Shop size ► Shop type ► New shop opening in the local area
No or low economic impact on choice
► Concentration drivers ► Private labels (-) ► Unemployment (+) ► Population density (-)
3 Econometrics results

35 The economic impact of modern retail on choice and innovation in the EU food sector – Key Findings - October 2014
Drivers for choice Product variety Product size variety Product supplier
variety Product price
variety
impact Signif. Import. impact Signif. Import impact Signif. Import impact Signif. Import
Product category turnover ..
GDP per capita ? ..
Shop floor space ..
Shop type N.A. N.A N.A ? N.A
New shop opening in the local area ..
..
Product category turnover, economic prosperity, shop size and shop type are the most important drivers for choice
Positive impact
Negative impact
? Where the sign varies according to whether the parameter is estimated over the long or short data sets
Significant at 5% level
Significant at 1% level
Impact of more than 5%
Impact of more than 10%
-- Not statistically significant or economically important according to these thresholds
3 Econometrics results

36 The economic impact of modern retail on choice and innovation in the EU food sector – Key Findings - October 2014
Sources: Analysis based on © Nielsen Opus and © Euromonitor International
Statistical significance ► 1% level Direction of impact ► Positive Economic importance ► Large
Product category turnover, economic prosperity, shop size and shop type are the most important drivers for choice
Product category turnover
3 Econometrics results
Choice in variety of EANS versus national product category sales turnover in 2010 period 1 in four Member States
Sources: Analysis based on © Nielsen Opus and © Euromonitor International

37 The economic impact of modern retail on choice and innovation in the EU food sector – Key Findings - October 2014
Sources: Analysis based on © Nielsen Opus and Eurostat
Statistical significance ► 1-5% level Direction of impact ► Positive Economic importance ► Large
GDP per capita
Floorspace
Statistical significance ► 1% level Direction of impact ► Positive Economic importance ► Large
Choice in variety of EAN codes versus GDP per capita
Product category turnover, economic prosperity, shop size and shop type are the most important drivers for choice
3 Econometrics results

38 The economic impact of modern retail on choice and innovation in the EU food sector – Key Findings - October 2014
Other drivers have no or low economic impact on choice
Drivers for choice Product variety Product size variety
Product supplier variety
Product price variety
impact Signif. Import impact Signif. Import impact Signif. Import impact Signif. Import
Retail concentration at national level .. .. .. .. .. .. .. .. ..
Retail concentration at local level .. .. .. .. .. .. .. .. .. ..
Supplier concentration at national level .. .. .. .. .. .. .. .. .. ..
Imbalance between retailers and suppliers at national level
.. .. .. ? .. .. .. .. ?
Private labels (local) .. .. .. .. Unemployment .. .. ..
Population density ..
Too few observations for conclusions to be drawn with confidence.
3 Econometrics results

39 The economic impact of modern retail on choice and innovation in the EU food sector – Key Findings - October 2014
Sources: Analysis based on © Nielsen Opus and © Planet Retail
Very few observations from which to draw conclusions
Statistical significance ► No, except product price variety
Direction of impact ► Negative for product price variety
Economic importance ► Large for product price variety
Little indication of an impact of national retail concentration on choice
Retail concentration at national level Choice in variety of EAN codes in the sampled shops versus national retail concentration
3 Econometrics results

40 The economic impact of modern retail on choice and innovation in the EU food sector – Key Findings - October 2014
Sources: Analysis based on © Nielsen Opus and © Euromonitor International
Statistical significance ► No (except product size variety) Direction of impact ► Positive for product size variety
Economic importance ► Small
There is no evidence that supplier concentration is an economic driver of choice
Supplier concentration at national level Choice in variety of EAN codes versus national supplier concentration by product category, 2008
3 Econometrics results

41 The economic impact of modern retail on choice and innovation in the EU food sector – Key Findings - October 2014
Statistical significance ► Various Direction of impact ► Ambiguous for statistically significant cases Economic importance ► Moderate for product price variety
Other econometric results regarding factors driving choice
Statistical significance ► 1% level
Direction of impact ► Negative
Economic importance ► Small
Population density
Statistical significance ► Various
Direction of impact ► Positive; negative for product
price variety
Economic importance ► Small
Unemployment
Statistical significance ► 1% level
Direction of impact ► Negative
Economic importance ► Small
Private labels
Measure of imbalance between retailers and suppliers at national level
3 Econometrics results

42 The economic impact of modern retail on choice and innovation in the EU food sector – Key Findings - October 2014
Sources: Analysis based on © Nielsen Opus and © Euromonitor International
High shares of private labels tend to be associated with less choice in hypermarkets and supermarkets
Share of private labels (in each product category) in each shop
Choice in variety of EAN codes versus private labels share, by shop type
3 Econometrics results

43 The economic impact of modern retail on choice and innovation in the EU food sector – Key Findings - October 2014
Measured impacts on innovation
► Product category turnover (+) ► Shop size (+) ► Shop type (+) ► New shop opening in the local area (+) ► Retailers’ business expectations (+) ► Unemployment (-) ► Population density (-) ► Local retailer and supplier concentration (-) ► Private labels (-)
3 Econometrics results

44 The economic impact of modern retail on choice and innovation in the EU food sector – Key Findings - October 2014
Drivers for innovation Opus innovations New products New packaging New
formulations New line
extensions
impact Signif. Import. impact Signif. Import impact Signif. Import impact Signif. Import impact Signif. Import
Shop size
Shop type N.A. N.A. N.A. N.A. N.A.
Retailer business expectations
?
Product category turnover
.. .. .. ? ?
Positive impact Negative impact ? Where the sign varies according to whether the parameter is estimated over the long or short data sets Significant at 5% level
Significant at 1% level Impact of more than 5% Impact of more than 10% -- Not statistically significant or economically important according to these thresholds
Shop size, shop type, retailer business expectations and product category turnover are the most important positive drivers for innovation
Too few observations for conclusions to be drawn with confidence.
3 Econometrics results

45 The economic impact of modern retail on choice and innovation in the EU food sector – Key Findings - October 2014
Statistical significance ► 1% level Direction of impact ► Positive Economic importance ► Large
Very few observations from which to draw conclusions
Statistical significance ► 1% level Direction of impact ► Positive Economic importance ► Large
Opus innovations versus retailer business expectations
Sources: Analysis based on © Nielsen Opus and © Eurostat
Statistical significance ► 1% level Direction of impact ► Positive (larger formats offer a greater number
of innovative products) Economic importance ► Large
Shop size, shop type, retailer business expectations and product category turnover are the most important positive drivers for innovation Shop size
Shop type
Retailer business expectations
3 Econometrics results

46 The economic impact of modern retail on choice and innovation in the EU food sector – Key Findings - October 2014
Statistical significance ► 1% level Direction of impact ► Generally positive Economic importance ► Various
Sources: Analysis based on © Nielsen Opus and © Euromonitor International
Shop size, shop type, retailer business expectations and product category turnover are the most important positive drivers for innovation Product category turnover
3 Econometrics results
New EAN codes (innovations) versus national product category sales turnover in 2010 period 1 in four Member States

47 The economic impact of modern retail on choice and innovation in the EU food sector – Key Findings - October 2014
Other drivers have various impacts on innovation Drivers for innovation Opus innovations New products New packaging New
formulations New line
extensions
impact Signif. Import. impact Signif. Import impact Signif. Import impact Signif. Import impact Signif. Import
Retail concentration at national level
?
Retail concentration at local level
.. .. .. .. .. .. .. .. .. .. .. ..
Supplier concentration at national level
.. .. .. ?
Imbalance between retailers and suppliers at national level
?
Private labels .. .. ..
New shop opening in the local area
.. .. .. .. .. .. .. .. .. .. .. ..
Too few observations for conclusions to be drawn with confidence.
3 Econometrics results

48 The economic impact of modern retail on choice and innovation in the EU food sector – Key Findings - October 2014
New EAN codes (innovation) versus national retail concentration
Source: Analysis based on © Nielsen Opus and © Planet Retail
Very few observations from which to draw conclusions
Statistical significance ► 1% Direction of impact ► Positive except for new packaging (negative) and new
formulations (ambiguous) Economic importance ► Large (for modern retail measure)
Statistical significance ► No (except for new packaging) Direction of impact ► Negative Economic importance ► Large for new packaging
Greater concentration among retailers at a local level is associated with less innovation in new packaging Retailer concentration at the procurement level
Retailer concentration at the local level
3 Econometrics results
New EAN codes (innovation) versus local retail concentration in two years
Sources: Analysis based on © Nielsen Opus and © Nielsen Trade Dimensions

49 The economic impact of modern retail on choice and innovation in the EU food sector – Key Findings - October 2014
Opus innovations versus national supplier concentration by product category, 2008
Sources: Analysis based on © Nielsen Opus and © Euromonitor International
Statistical significance ► 1% for several innovation indicators
Direction of impact ► Mostly negative
Economic importance ► Moderate to large
Greater concentration among suppliers at national level is associated with less innovation (some measures)
Supplier concentration at the national level
3 Econometrics results

50 The economic impact of modern retail on choice and innovation in the EU food sector – Key Findings - October 2014
Sources: Analysis based on © Nielsen Opus and © Euromonitor International
The finding for supplier concentration is also reflected in the finding for retailer – supplier imbalance
Imbalance between retailers and suppliers at national level
Choice in variety of EAN codes versus imbalance between retailers and suppliers
3 Econometrics results
Statistical significance ► 1% for most innovation indicators
Direction of impact ► Positive (i.e. a greater imbalance in
favour of suppliers has a negative impact) (except new packaging where ambiguous)
► But remember that the sample does not have cases with high national retail concentration
Economic importance ► Generally large

51 The economic impact of modern retail on choice and innovation in the EU food sector – Key Findings - October 2014
Other general economic drivers have low or negative impact on innovation
Drivers for innovation Opus innovations New products New packaging New
formulations New line
extensions
impact Signif. Import. impact Signif. Import impact Signif. Import impact Signif. Import impact Signif. Import
Unemployment .. .. ..
Population .. .. .. .. .. .. .. .. .. .. ..
Population density .. .. .. .. .. .. .. ..
3 Econometrics results
52 The economic impact of modern retail on choice and innovation in the EU food sector – Key Findings - October 2014
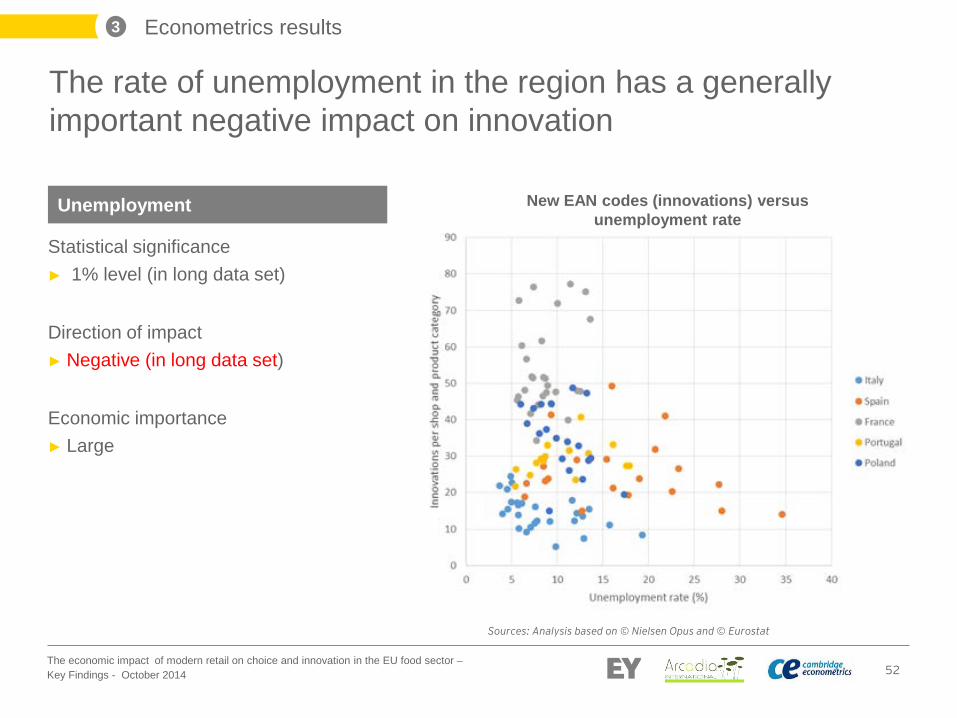
Statistical significance ► 1% level (in long data set) Direction of impact ► Negative (in long data set) Economic importance ► Large
Sources: Analysis based on © Nielsen Opus and © Eurostat
The rate of unemployment in the region has a generally important negative impact on innovation
New EAN codes (innovations) versus unemployment rate
Unemployment
3 Econometrics results
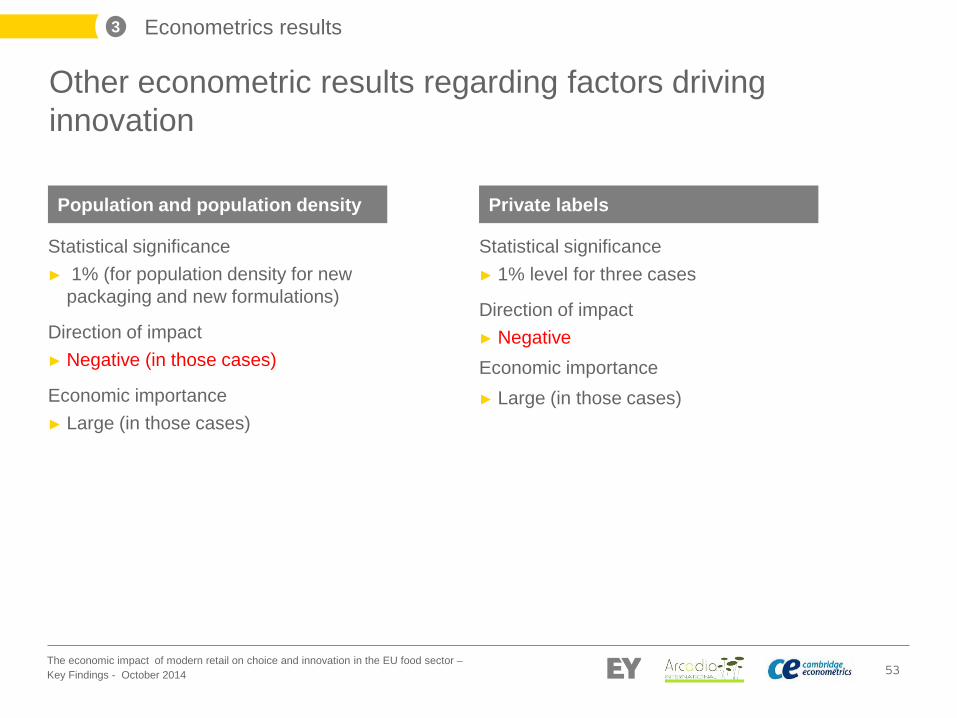
53 The economic impact of modern retail on choice and innovation in the EU food sector – Key Findings - October 2014
Statistical significance ► 1% (for population density for new
packaging and new formulations)
Direction of impact ► Negative (in those cases)
Economic importance ► Large (in those cases)
Statistical significance ► 1% level for three cases
Direction of impact ► Negative Economic importance ► Large (in those cases)
Other econometric results regarding factors driving innovation
Population and population density Private labels
3 Econometrics results

54 The economic impact of modern retail on choice and innovation in the EU food sector – Key Findings - October 2014
Sources: Analysis based on © Nielsen Opus and © Euromonitor International
High shares of private labels are associated with fewer innovative products in hypermarkets and supermarkets
Share of private labels (in each product category) in each shop
New EAN codes (innovations) versus private labels share, by shop type
3 Econometrics results

EY | Assurance | Tax | Transactions | Advisory
About EY
EY is a global leader in assurance, tax, transaction and advisory services. The insights and quality services we deliver help build trust and confidence in the capital markets and in economies the world over. We develop outstanding leaders who team to deliver on our promises to all of our stakeholders. In so doing, we play a critical role in building a better working world for our people, for our clients and for our communities.
EY refers to the global organization and may refer to one or more of the member firms of EY Global Limited, each of which is a separate legal entity. EY Global Limited, a UK company limited by guarantee, does not provide services to clients. For more information about our organization, please visit ey.com.
© 2014 EY Transaction Advisory Services All Rights Reserved.
ey.com/fr