Embed Size (px)
Citation preview
CHAPTER
5 Evolution of Biodiversity
[Notes/Highlighting]
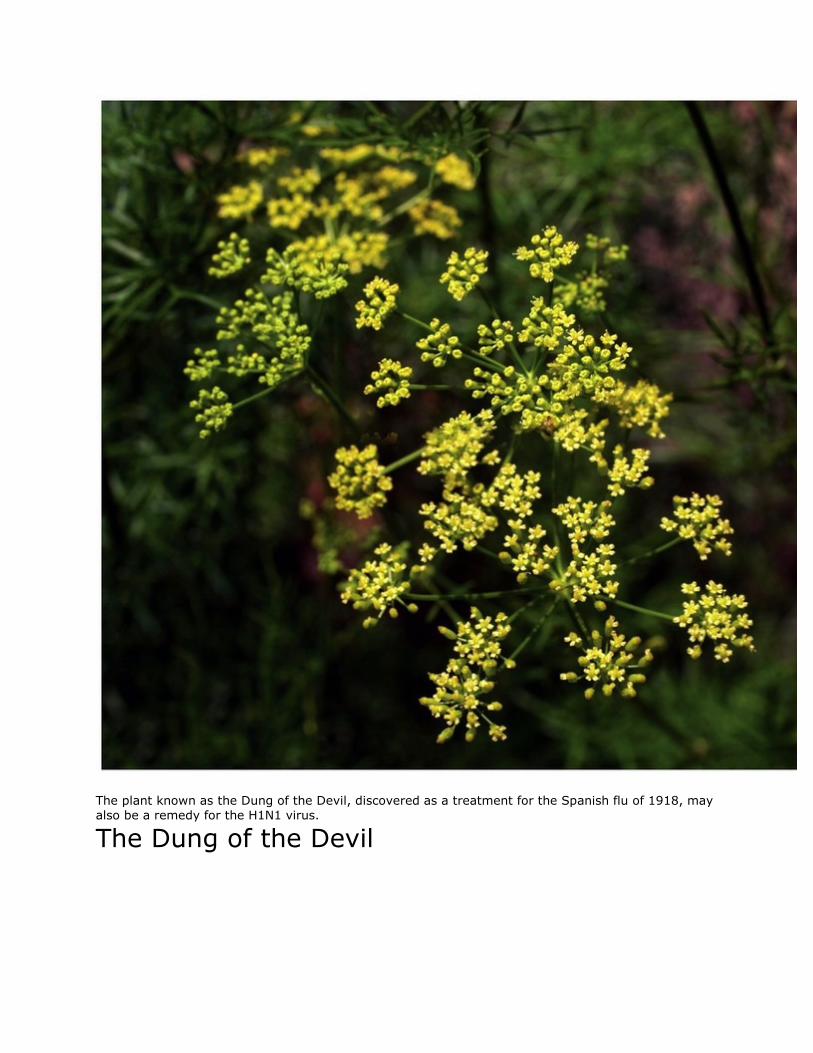
The plant known as the Dung of the Devil, discovered as a treatment for the Spanish flu of 1918, may also be a remedy for the H1N1 virus.
The Dung of the Devil
F rom 1918 to 1920, the world experienced a flu outbreak of unprecedented scale. Known
as the Spanish flu, the disease had a devastating effect. Mortality estimates from that
time vary, but somewhere between 20 million and 100 million people died
worldwide, including more than 600,000 people in the United States. During the height
of the outbreak, reports stated that some people in China had found the roots of a
particular plant beneficial in fighting the flu. The plant(Ferula assafoetida) had a
pleasant smell when cooked, but the raw sap from the roots had a foul smell that
inspired the plant’s common name, the Dung of the Devil.
The Dung of the Devil has the potential to produce a new pharmaceutical drug to fight H1N1 flu epidemics.
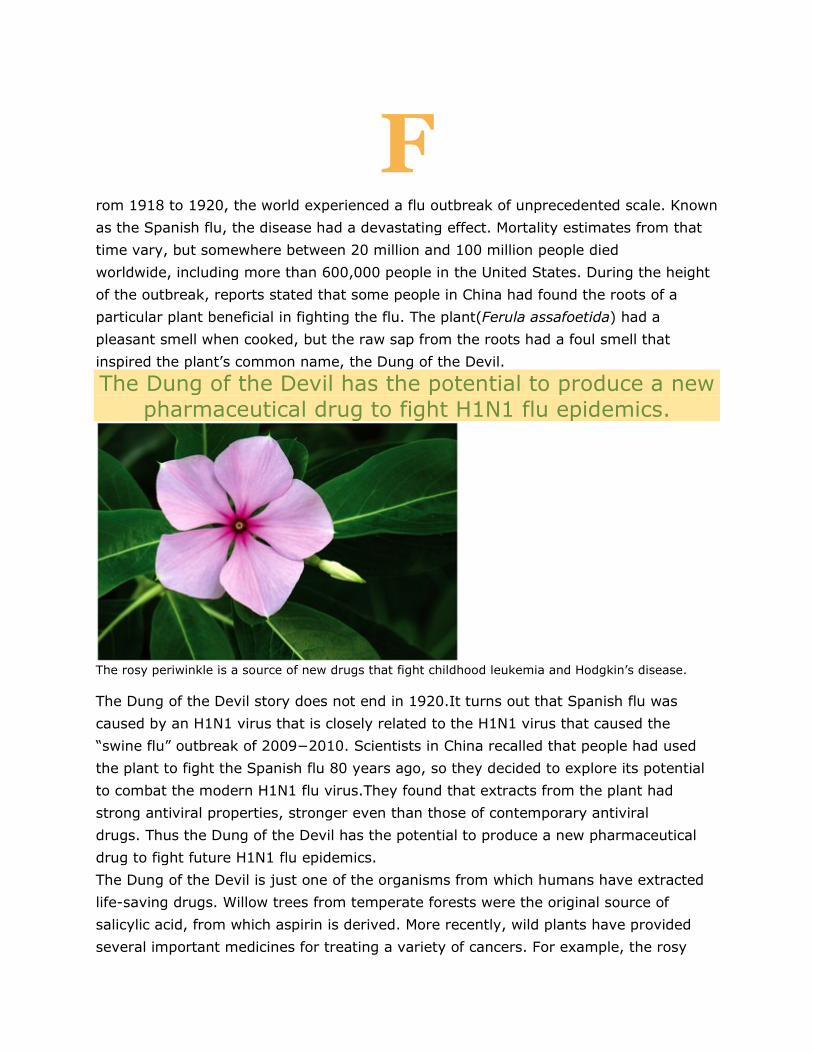
The rosy periwinkle is a source of new drugs that fight childhood leukemia and Hodgkin’s disease.
The Dung of the Devil story does not end in 1920.It turns out that Spanish flu was
caused by an H1N1 virus that is closely related to the H1N1 virus that caused the
“swine flu” outbreak of 2009−2010. Scientists in China recalled that people had used
the plant to fight the Spanish flu 80 years ago, so they decided to explore its potential
to combat the modern H1N1 flu virus.They found that extracts from the plant had
strong antiviral properties, stronger even than those of contemporary antiviral
drugs. Thus the Dung of the Devil has the potential to produce a new pharmaceutical
drug to fight future H1N1 flu epidemics.
The Dung of the Devil is just one of the organisms from which humans have extracted
life-saving drugs. Willow trees from temperate forests were the original source of
salicylic acid, from which aspirin is derived. More recently, wild plants have provided
several important medicines for treating a variety of cancers. For example, the rosy

periwinkle (Catharanthus roseus), found only in the tropical forests of Madagascar, is
the source of two drugs used to treat childhood leukemia and Hodgkin’s disease. The
mayapple (Podophyllum peltatum), a common herb of the eastern United States, is the
source of two other anticancer drugs. Many new medicines, including
antiinflammatory, antiviral,and antitumor drugs, have come from a variety of
invertebrate animals that inhabit coral reefs, including sponges, corals, and sea
squirts. Of the most promising current candidates for new drugs, 70 percent were first
discovered in plants, animals, and microbes. Unfortunately, many species that are
either known or suspected sources of drugs are being lost to
deforestation,agriculture, and other human activities. At the same time, indigenous
people with knowledge about medicinal uses of the natural drugs in their environment
are being forced to relocate, and their knowledge may soon be lost.
There are millions of species on Earth, only a small fraction of which has been screened
for useful drugs. It is likely that many more medicines could be found in living
organisms. The continual discovery of new drugs in organisms around the
world, including the Dung of the Devil, makes yet another convincing argument for
conserving Earth’s biodiversity.
Sources: C. L. Lee et al., Influenza A (H1N1) antiviral and cytotoxic agents from Ferula assafoetida, Journal of Natural
Products 72 (2009): 1568−1572; D. Newman and G. M. Cragg, Natural products as sources of new drugs over the last 25
years, Journal of Natural Products 70 (2007): 461−477.
KEY IDEAS
Biodiversity is an important indicator of environmental health. A rapid decline of
biodiversity in an ecosystem indicates that it is under stress.The biodiversity on Earth
today is the result of evolution and extinction.Understanding these processes helps us
to understand past and present environmental changes and their effects.
After reading this chapter you should be able to
• explain the concept of biodiversity and how it is measured.
• describe the ways in which evolution can occur.
• explain how environmental change affects speciation and extinction.
• explain the concept of an ecological niche.
5.1 Earth is home to a tremendous diversity of species
[Notes/Highlighting]
A short walk through the woods, a corner lot, or the city park makes one thing
clear: life comes in many forms. A small plot of untended land or a tiny pond contains
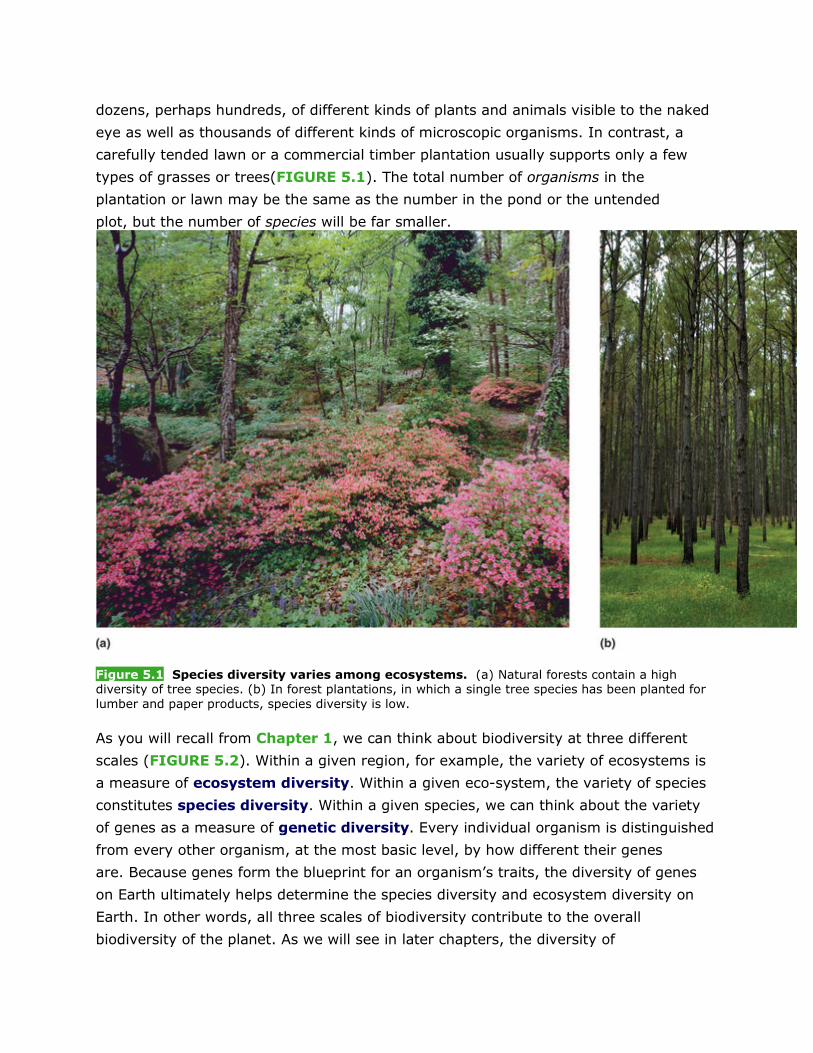
dozens, perhaps hundreds, of different kinds of plants and animals visible to the naked
eye as well as thousands of different kinds of microscopic organisms. In contrast, a
carefully tended lawn or a commercial timber plantation usually supports only a few
types of grasses or trees(FIGURE 5.1). The total number of organisms in the
plantation or lawn may be the same as the number in the pond or the untended
plot, but the number of species will be far smaller.
Figure 5.1 Species diversity varies among ecosystems. (a) Natural forests contain a high diversity of tree species. (b) In forest plantations, in which a single tree species has been planted for lumber and paper products, species diversity is low.
As you will recall from Chapter 1, we can think about biodiversity at three different
scales (FIGURE 5.2). Within a given region, for example, the variety of ecosystems is
a measure of ecosystem diversity. Within a given eco-system, the variety of species
constitutes species diversity. Within a given species, we can think about the variety
of genes as a measure of genetic diversity. Every individual organism is distinguished
from every other organism, at the most basic level, by how different their genes
are. Because genes form the blueprint for an organism’s traits, the diversity of genes
on Earth ultimately helps determine the species diversity and ecosystem diversity on
Earth. In other words, all three scales of biodiversity contribute to the overall
biodiversity of the planet. As we will see in later chapters, the diversity of

genes, species, and ecosystems plays a major role in the normal functioning of natural
systems, including the ecosystem services humans depend on.
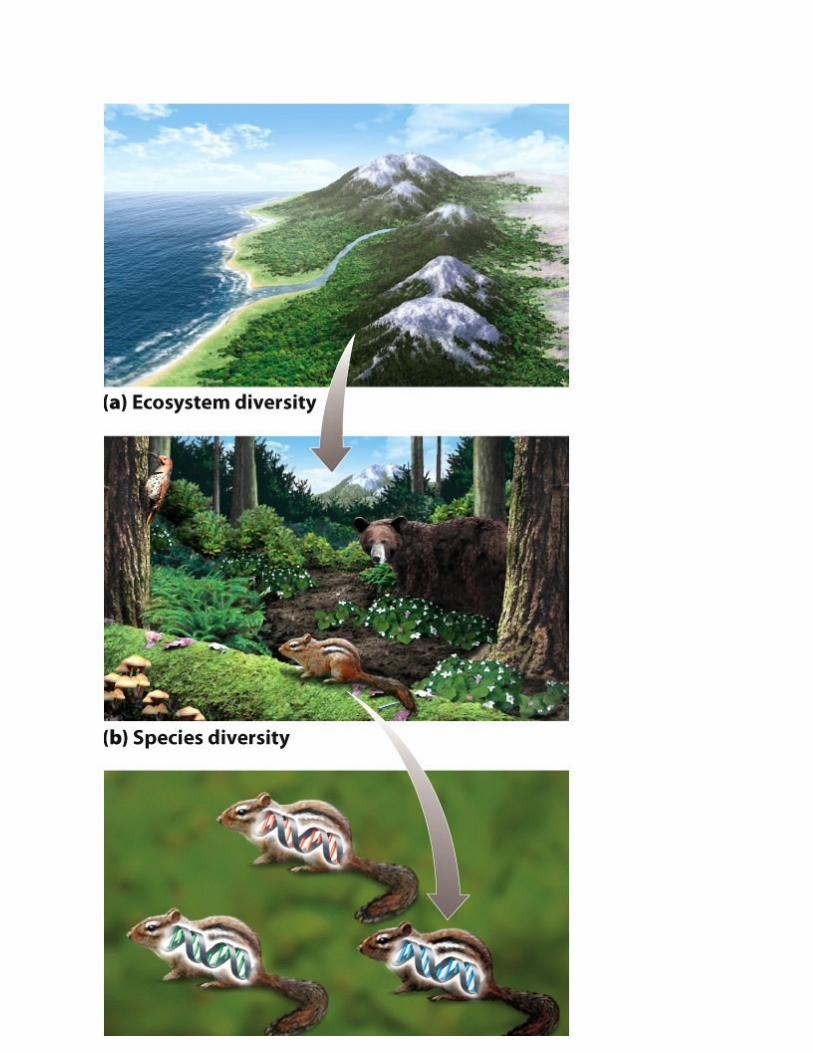
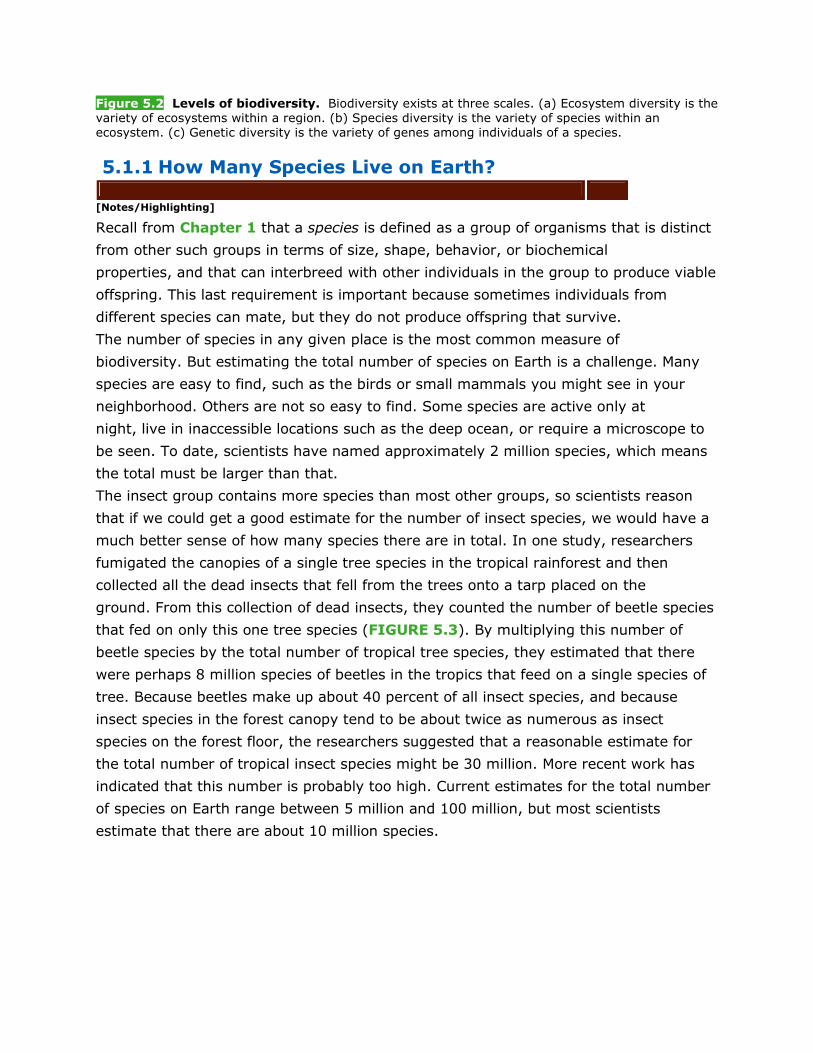
Figure 5.2 Levels of biodiversity. Biodiversity exists at three scales. (a) Ecosystem diversity is the variety of ecosystems within a region. (b) Species diversity is the variety of species within an ecosystem. (c) Genetic diversity is the variety of genes among individuals of a species.
5.1.1 How Many Species Live on Earth?
[Notes/Highlighting]
Recall from Chapter 1 that a species is defined as a group of organisms that is distinct
from other such groups in terms of size, shape, behavior, or biochemical
properties, and that can interbreed with other individuals in the group to produce viable
offspring. This last requirement is important because sometimes individuals from
different species can mate, but they do not produce offspring that survive.
The number of species in any given place is the most common measure of
biodiversity. But estimating the total number of species on Earth is a challenge. Many
species are easy to find, such as the birds or small mammals you might see in your
neighborhood. Others are not so easy to find. Some species are active only at
night, live in inaccessible locations such as the deep ocean, or require a microscope to
be seen. To date, scientists have named approximately 2 million species, which means
the total must be larger than that.
The insect group contains more species than most other groups, so scientists reason
that if we could get a good estimate for the number of insect species, we would have a
much better sense of how many species there are in total. In one study, researchers
fumigated the canopies of a single tree species in the tropical rainforest and then
collected all the dead insects that fell from the trees onto a tarp placed on the
ground. From this collection of dead insects, they counted the number of beetle species
that fed on only this one tree species (FIGURE 5.3). By multiplying this number of
beetle species by the total number of tropical tree species, they estimated that there
were perhaps 8 million species of beetles in the tropics that feed on a single species of
tree. Because beetles make up about 40 percent of all insect species, and because
insect species in the forest canopy tend to be about twice as numerous as insect
species on the forest floor, the researchers suggested that a reasonable estimate for
the total number of tropical insect species might be 30 million. More recent work has
indicated that this number is probably too high. Current estimates for the total number
of species on Earth range between 5 million and 100 million, but most scientists
estimate that there are about 10 million species.
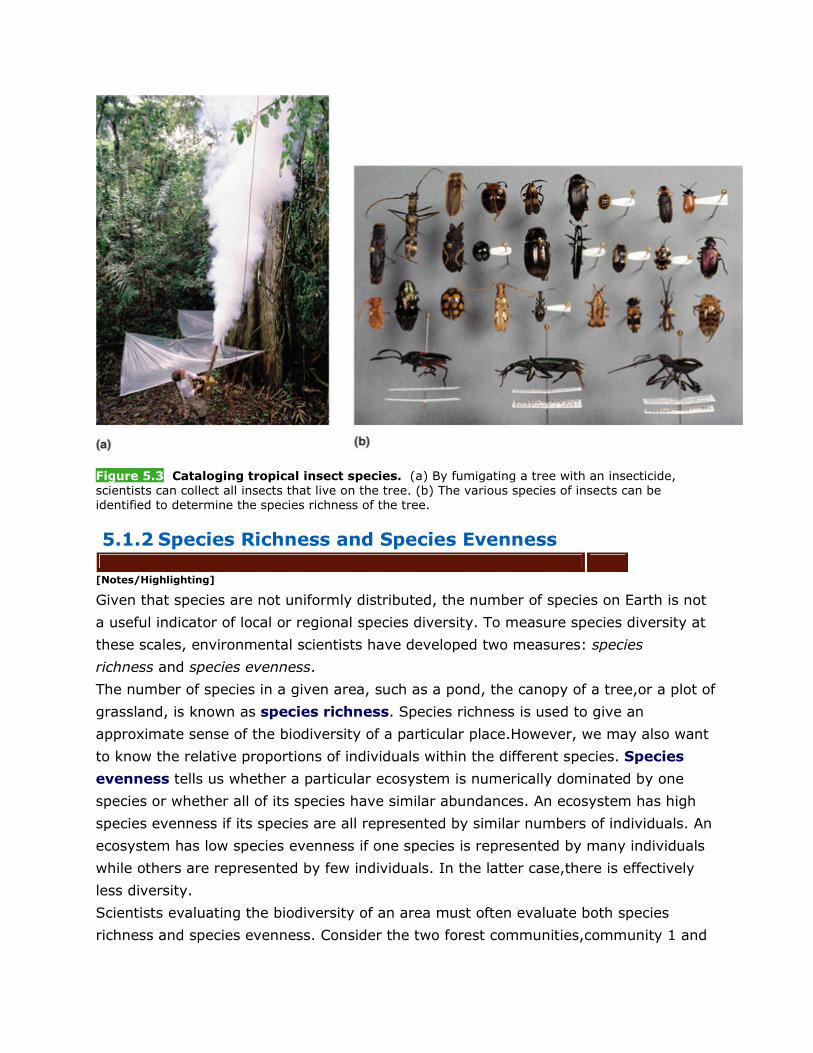
Figure 5.3 Cataloging tropical insect species. (a) By fumigating a tree with an insecticide, scientists can collect all insects that live on the tree. (b) The various species of insects can be identified to determine the species richness of the tree.
5.1.2 Species Richness and Species Evenness
[Notes/Highlighting]
Given that species are not uniformly distributed, the number of species on Earth is not
a useful indicator of local or regional species diversity. To measure species diversity at
these scales, environmental scientists have developed two measures: species
richness and species evenness.
The number of species in a given area, such as a pond, the canopy of a tree,or a plot of
grassland, is known as species richness. Species richness is used to give an
approximate sense of the biodiversity of a particular place.However, we may also want
to know the relative proportions of individuals within the different species. Species
evenness tells us whether a particular ecosystem is numerically dominated by one
species or whether all of its species have similar abundances. An ecosystem has high
species evenness if its species are all represented by similar numbers of individuals. An
ecosystem has low species evenness if one species is represented by many individuals
while others are represented by few individuals. In the latter case,there is effectively
less diversity.
Scientists evaluating the biodiversity of an area must often evaluate both species
richness and species evenness. Consider the two forest communities,community 1 and
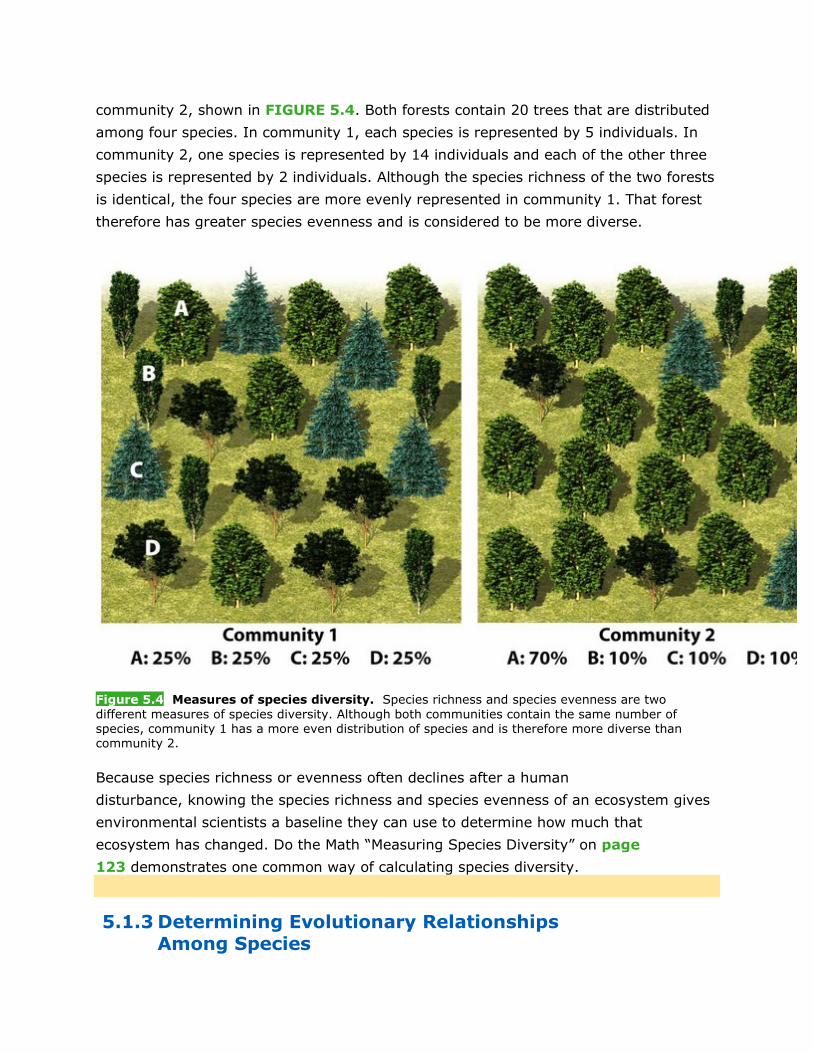
community 2, shown in FIGURE 5.4. Both forests contain 20 trees that are distributed
among four species. In community 1, each species is represented by 5 individuals. In
community 2, one species is represented by 14 individuals and each of the other three
species is represented by 2 individuals. Although the species richness of the two forests
is identical, the four species are more evenly represented in community 1. That forest
therefore has greater species evenness and is considered to be more diverse.
Figure 5.4 Measures of species diversity. Species richness and species evenness are two different measures of species diversity. Although both communities contain the same number of species, community 1 has a more even distribution of species and is therefore more diverse than community 2.
Because species richness or evenness often declines after a human
disturbance, knowing the species richness and species evenness of an ecosystem gives
environmental scientists a baseline they can use to determine how much that
ecosystem has changed. Do the Math “Measuring Species Diversity” on page
123 demonstrates one common way of calculating species diversity.
5.1.3 Determining Evolutionary Relationships Among Species
[Notes/Highlighting]
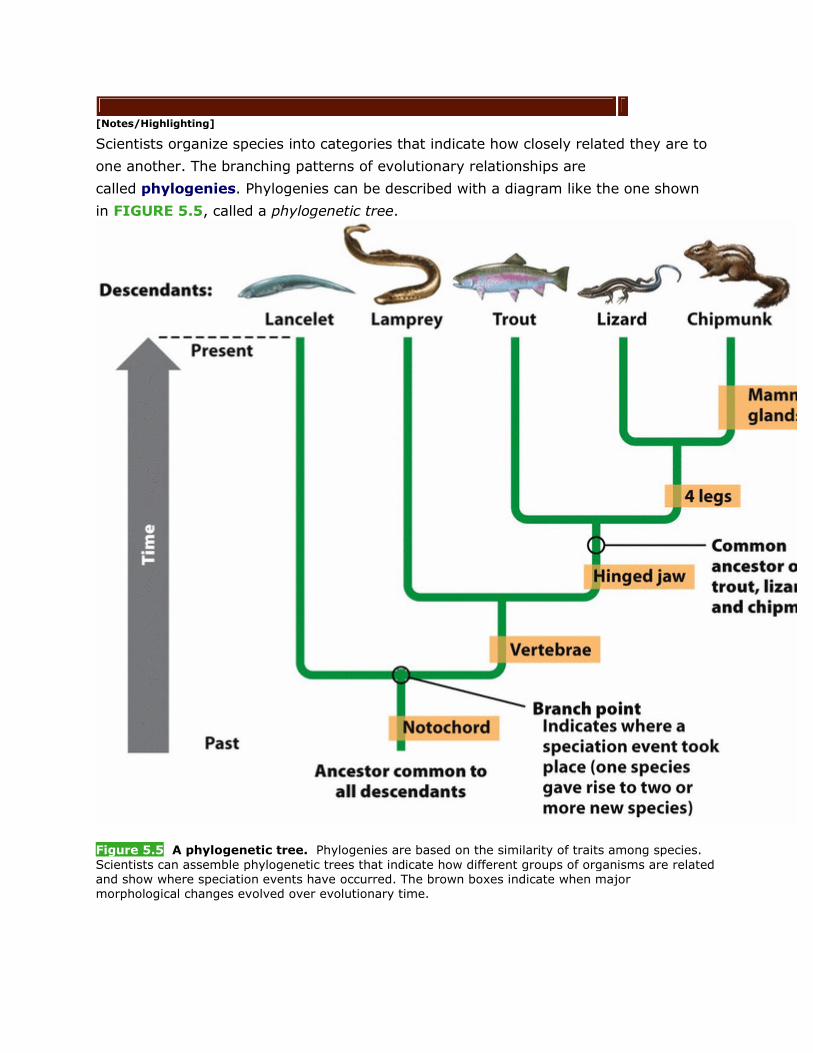
Scientists organize species into categories that indicate how closely related they are to
one another. The branching patterns of evolutionary relationships are
called phylogenies. Phylogenies can be described with a diagram like the one shown
in FIGURE 5.5, called a phylogenetic tree.
Figure 5.5 A phylogenetic tree. Phylogenies are based on the similarity of traits among species. Scientists can assemble phylogenetic trees that indicate how different groups of organisms are related and show where speciation events have occurred. The brown boxes indicate when major morphological changes evolved over evolutionary time.
The relatedness of the species in a phylogeny is determined by the similarity of their
traits: the more similar the traits of two species, the more closely related the two
species are assumed to be. Historically, scientists used mostly morphological
traits, including a large number of bone measurements,to measure
similarity. Today, scientists base phylogenies on a variety of characteristics, including
morphology, behavior, and genetic similarity.
CHECKPOINT
• Why is it challenging to determine the number of species on Earth?
• Why are estimates of species diversity valuable to environmental scientists?
• What is the difference between species richness and species evenness?Why are
they both important measures?
DO THE MATH Measuring Species Diversity
Environmental scientists are often interested in evaluating both species
richness and species evenness, so they have come up with indices of species diversity
that take both measures into account. One commonly used index is Shannon’s index of
diversity. To calculate this index, we must know the total number of species in a
community (n) and, for each species, the proportion of the individuals in the community
that represent that species (pi). Once we have this information, we can calculate
Shannon’s index (H) by taking the product of each proportion (pi) and its natural
logarithm [ln(pi)] and then summing these products, as indicated by the summation
symbol (∑):
The minus sign makes the index a positive number. Higher values of Hindicate higher
diversity.
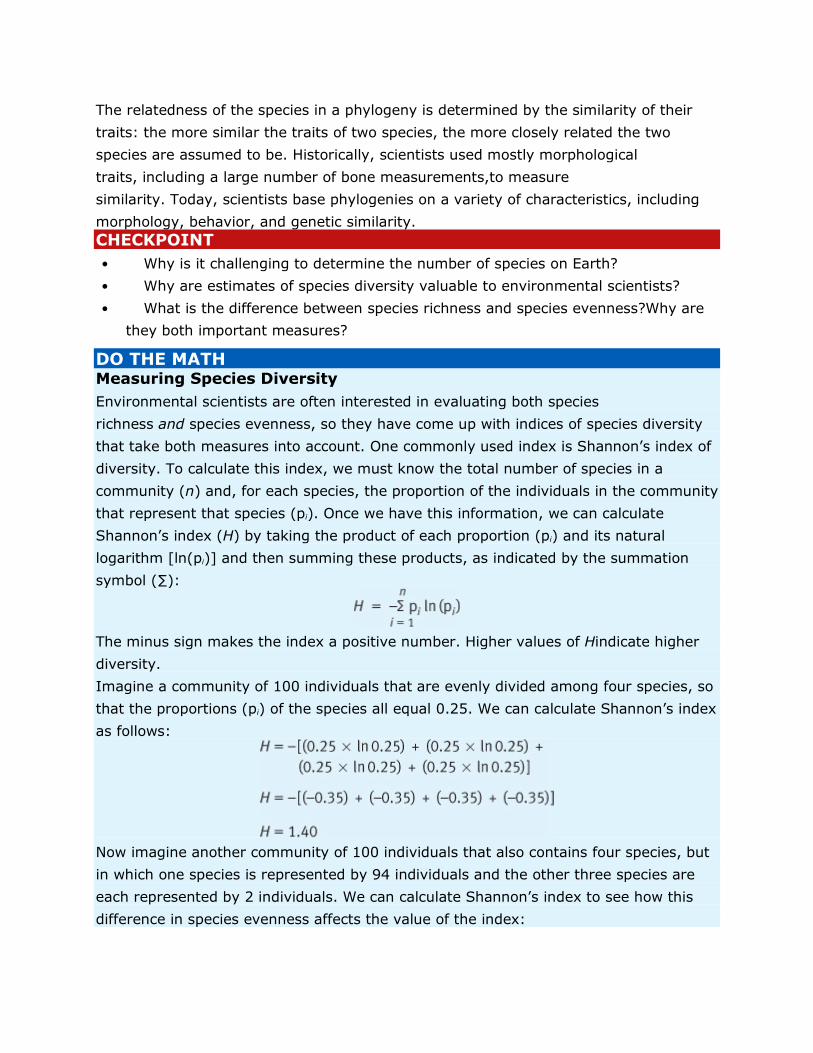
Imagine a community of 100 individuals that are evenly divided among four species, so
that the proportions (pi) of the species all equal 0.25. We can calculate Shannon’s index
as follows:
Now imagine another community of 100 individuals that also contains four species, but
in which one species is represented by 94 individuals and the other three species are
each represented by 2 individuals. We can calculate Shannon’s index to see how this
difference in species evenness affects the value of the index:
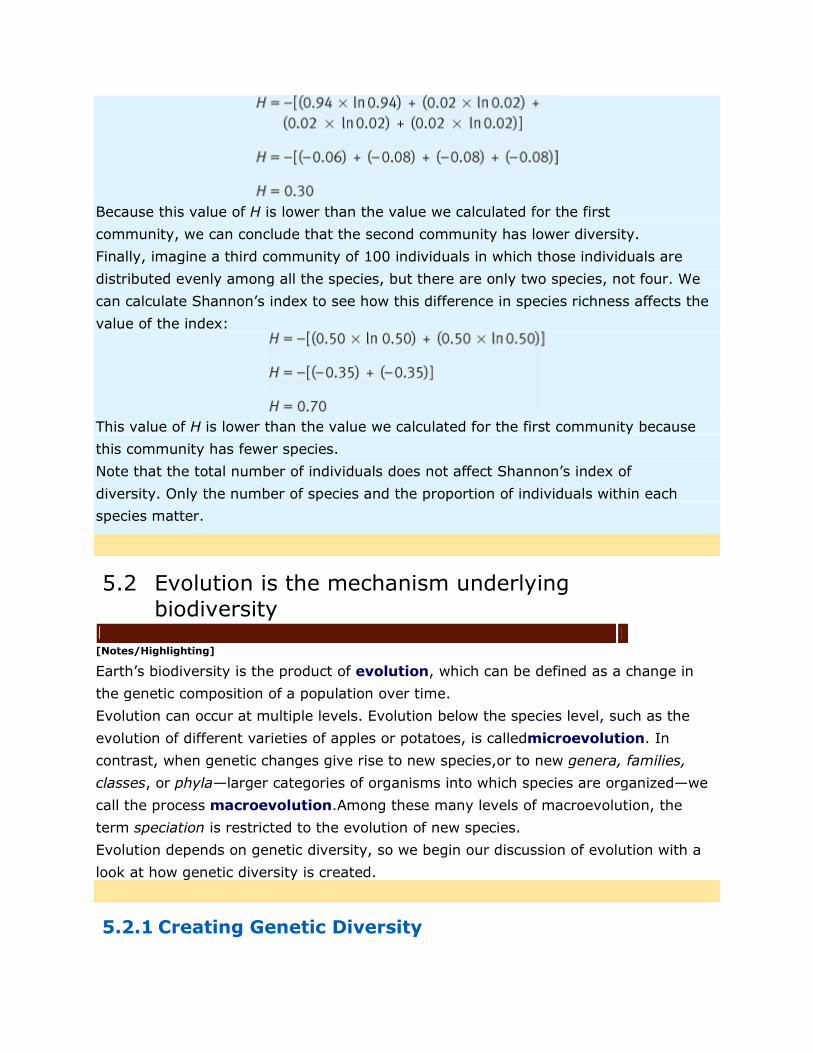
Because this value of H is lower than the value we calculated for the first
community, we can conclude that the second community has lower diversity.
Finally, imagine a third community of 100 individuals in which those individuals are
distributed evenly among all the species, but there are only two species, not four. We
can calculate Shannon’s index to see how this difference in species richness affects the
value of the index:
This value of H is lower than the value we calculated for the first community because
this community has fewer species.
Note that the total number of individuals does not affect Shannon’s index of
diversity. Only the number of species and the proportion of individuals within each
species matter.
5.2 Evolution is the mechanism underlying biodiversity
[Notes/Highlighting]
Earth’s biodiversity is the product of evolution, which can be defined as a change in
the genetic composition of a population over time.
Evolution can occur at multiple levels. Evolution below the species level, such as the
evolution of different varieties of apples or potatoes, is calledmicroevolution. In
contrast, when genetic changes give rise to new species,or to new genera, families,
classes, or phyla—larger categories of organisms into which species are organized—we
call the process macroevolution.Among these many levels of macroevolution, the
term speciation is restricted to the evolution of new species.
Evolution depends on genetic diversity, so we begin our discussion of evolution with a
look at how genetic diversity is created.
5.2.1 Creating Genetic Diversity
[Notes/Highlighting]
Genes are physical locations on chromosomes within each cell of an organism. An
organism’s genes determine the range of possible traits(physical or behavioral
characteristics) that it can pass down to its offspring.The complete set of genes in an
individual is called its genotype.
Two processes that create genetic diversity are mutation and recombination.DNA is
copied millions of times during an organism’s lifetime as cells grow and divide. An
occasional mistake in the copying process produces a random change, or mutation, in
the genetic code. Environmental factors, such as ultraviolet radiation from the Sun, can
also cause mutations. When mutations occur in cells responsible for reproduction, such
as the eggs and sperm of animals, those mutations can be passed on to the next
generation.
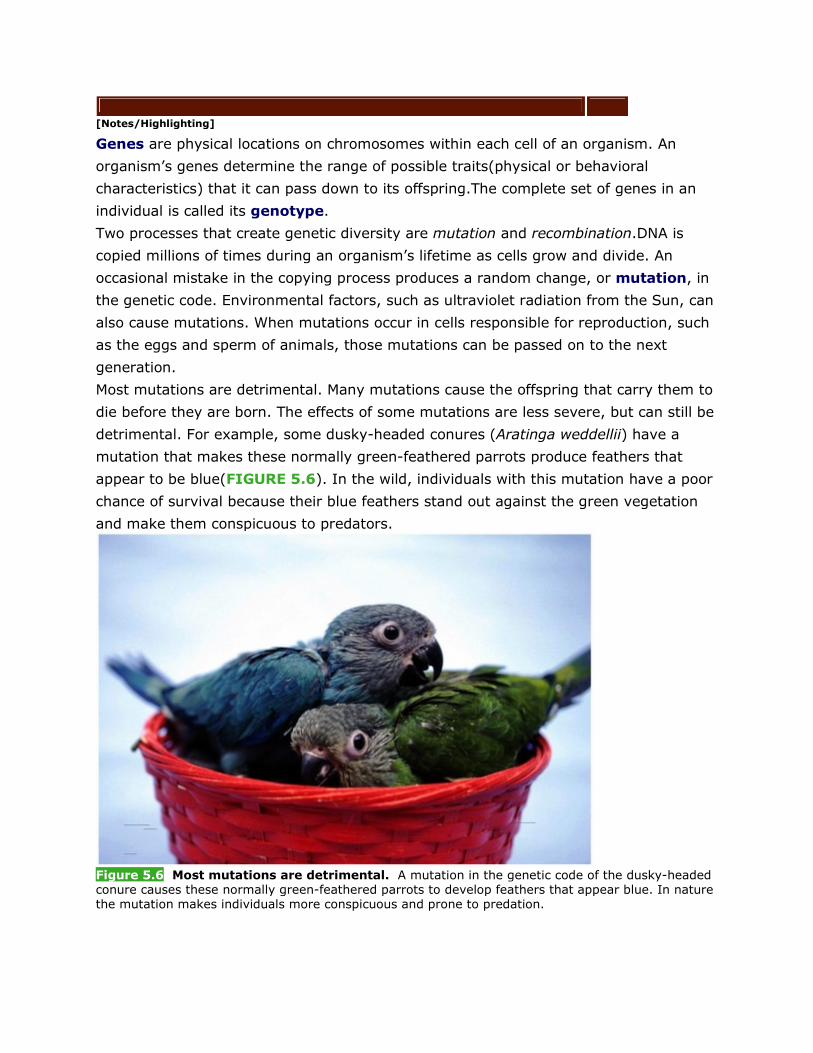
Most mutations are detrimental. Many mutations cause the offspring that carry them to
die before they are born. The effects of some mutations are less severe, but can still be
detrimental. For example, some dusky-headed conures (Aratinga weddellii) have a
mutation that makes these normally green-feathered parrots produce feathers that
appear to be blue(FIGURE 5.6). In the wild, individuals with this mutation have a poor
chance of survival because their blue feathers stand out against the green vegetation
and make them conspicuous to predators.
Figure 5.6 Most mutations are detrimental. A mutation in the genetic code of the dusky-headed conure causes these normally green-feathered parrots to develop feathers that appear blue. In nature the mutation makes individuals more conspicuous and prone to predation.
Sometimes a mutation improves an organism’s chances of survival or reproduction. If
such a mutation is passed along to the next generation, it adds new genetic diversity to
the population. Some mosquitoes, for example,possess a mutation that makes them
less vulnerable to insecticides. In areas that are sprayed with insecticides, such
mutations improve an individual mosquito’s chance of surviving and reproducing.
The second way in which genetic diversity is created is throughrecombination. In plants
and animals, genetic recombination occurs as chromosomes are duplicated during
reproductive cell division and a piece of one chromosome breaks off and attaches to
another chromosome. This process does not create new genes, but it does bring
together new combinations of genes on a chromosome and can therefore produce novel
traits. For example, the human immune system must battle a large variety of viruses
and bacteria that regularly attempt to invade the body.Recombination allows new gene
combinations to come together, providing new immune defenses that may prove to be
effective against the invading organisms.
GENOTYPES VERSUS PHENOTYPES An individual’s genotype serves as the blueprint
for the complete set of traits that organism may potentially possess. An
individual’s phenotype is the actual set of traits expressed in that individual. Among
these traits are the individual’s anatomy, physiology,and behavior. The color of your
eyes, for example, is your phenotype,whereas the genes you possess that code for eye
color are a part of your genotype. Changes in the genotype due to mutation or
recombination can produce important changes in an individual’s phenotype.
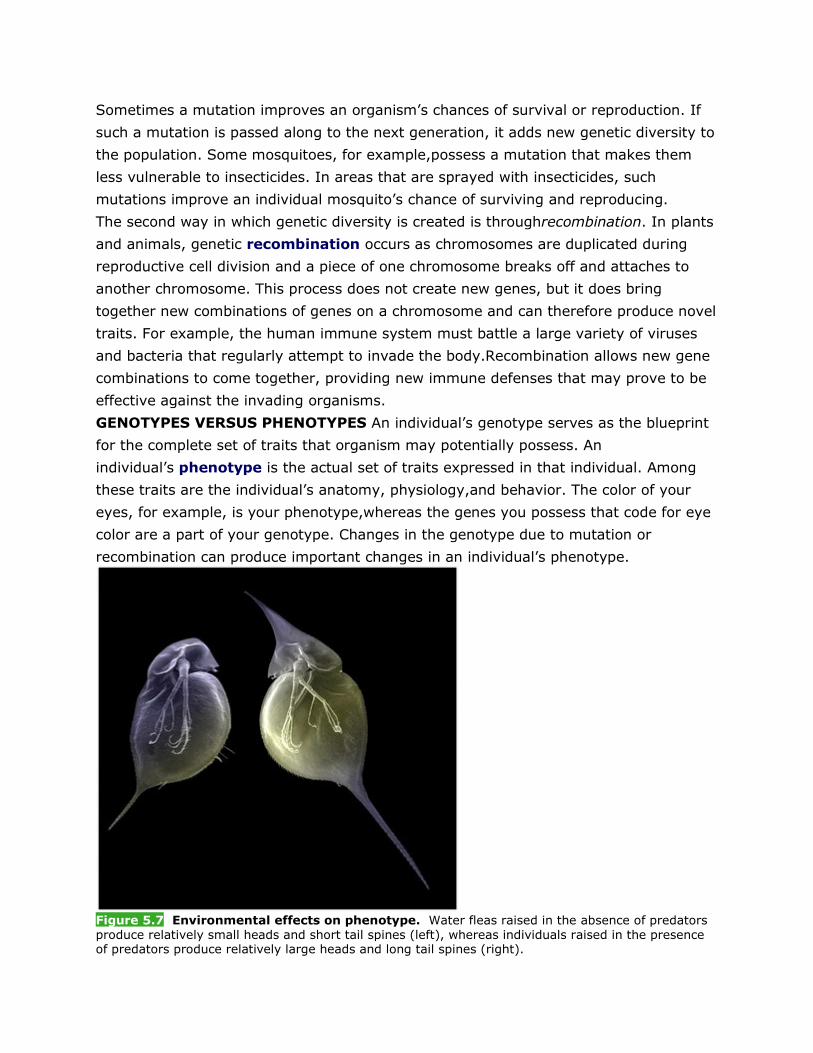
Figure 5.7 Environmental effects on phenotype. Water fleas raised in the absence of predators produce relatively small heads and short tail spines (left), whereas individuals raised in the presence of predators produce relatively large heads and long tail spines (right).
In some cases, an individual’s phenotype is determined almost entirely by its
genes. For instance, a person who inherits the genes for brown eyes will have brown
eyes, regardless of where that person lives. Most phenotypes,however, are the product
of an individual’s environment as well as its genotype. For example,in many turtle and
crocodile species, the temperature of eggs during incubation determines whether the
offspring will hatch as males or females. The water flea, a tiny animal that lives in
ponds and lakes, offers another interesting example. The body shape of the water flea
depends on whether or not a young individual smells predators in its
environment(FIGURE 5.7). If predators are absent, the water flea develops a relatively
small head and tail spine.If predators are present, however, the water flea develops a
much larger head and a long tail spine.Although the larger head and longer tail spine
help prevent the water flea from being eaten, they come at the cost of slower
reproduction. As a result, it is beneficial to the water flea not to produce these defenses
in the absence of predators, when they are not needed. By being able to respond to
changing environmental conditions, organisms such as the water flea can improve their
ability to survive and reproduce in any environment.
5.2.2 Evolution by Artificial Selection
[Notes/Highlighting]
Evolution occurs in three primary ways: by artificial selection, by natural selection, and
by random processes. Let’s look at each of these mechanisms of evolution in turn.
Humans have long influenced evolution by breeding plants and animals for traits we
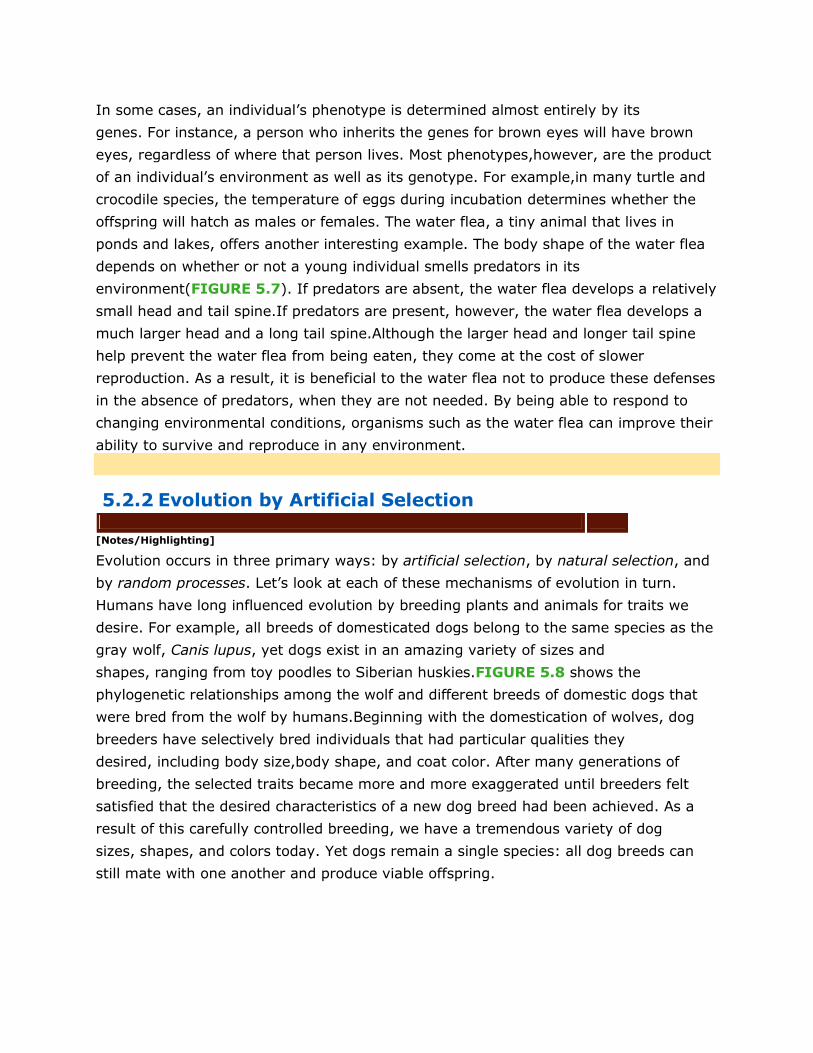
desire. For example, all breeds of domesticated dogs belong to the same species as the
gray wolf, Canis lupus, yet dogs exist in an amazing variety of sizes and
shapes, ranging from toy poodles to Siberian huskies.FIGURE 5.8 shows the
phylogenetic relationships among the wolf and different breeds of domestic dogs that
were bred from the wolf by humans.Beginning with the domestication of wolves, dog
breeders have selectively bred individuals that had particular qualities they
desired, including body size,body shape, and coat color. After many generations of
breeding, the selected traits became more and more exaggerated until breeders felt
satisfied that the desired characteristics of a new dog breed had been achieved. As a
result of this carefully controlled breeding, we have a tremendous variety of dog
sizes, shapes, and colors today. Yet dogs remain a single species: all dog breeds can
still mate with one another and produce viable offspring.
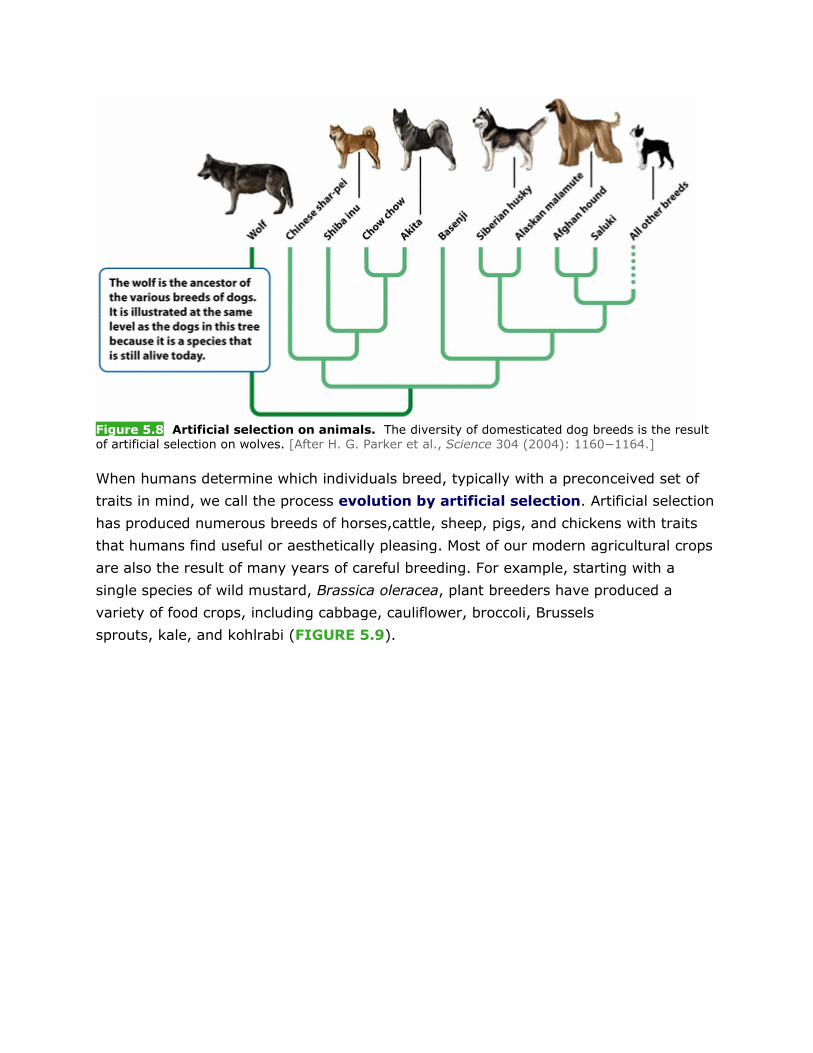
Figure 5.8 Artificial selection on animals. The diversity of domesticated dog breeds is the result of artificial selection on wolves. [After H. G. Parker et al., Science 304 (2004): 1160−1164.]
When humans determine which individuals breed, typically with a preconceived set of
traits in mind, we call the process evolution by artificial selection. Artificial selection
has produced numerous breeds of horses,cattle, sheep, pigs, and chickens with traits
that humans find useful or aesthetically pleasing. Most of our modern agricultural crops
are also the result of many years of careful breeding. For example, starting with a
single species of wild mustard, Brassica oleracea, plant breeders have produced a
variety of food crops, including cabbage, cauliflower, broccoli, Brussels
sprouts, kale, and kohlrabi (FIGURE 5.9).
Figure 5.9 Artificial selection on plants. Plant breeders have produced a wide range of edible plants from a single species of wild mustard.
As useful as artificial selection has been to humans, it can also produce a number of
unintended results. For example, farmers often use herbicides to kill
weeds. However, as we cover larger and larger areas with herbicides, there is an
increasing chance that at least one weed will possess a mutation that allows it to
survive the herbicide application. If that one mutant plant passes on its herbicide
resistance to its offspring, we will have artificially selected for herbicide resistance in
that weed. This process is occurring in many parts of the world, where increased use of
the popular herbicide Roundup (chemical name: glyphosate) has led to the evolution of
several species of Roundup-resistant weeds. A similar process has occurred in
hospitals, where the use of antibiotics and antibacterial cleaners has caused artificial
selection of harmful drug-resistant bacteria. These examples underscore the importance
of understanding the mechanisms of evolution and the ways in which humans can
purposefully or inadvertently direct the evolution of organisms.
5.2.3 Evolution by Natural Selection
[Notes/Highlighting]
The process of evolution by natural selection is similar to the process of evolution by
artificial selection, with one key difference. In evolution by natural selection, the
environment determines which individuals survive and reproduce. Simply put, members
of a population naturally vary in their traits.Certain combinations of traits make
individuals better able to survive and reproduce. As a result, the genes that produce
those traits are more common in the next generation.
Prior to the mid-nineteenth century, the idea that species could evolve over time had
been suggested by a number of scientists and philosophers.However, the concept of
evolution by natural selection did not become synthesized into a unifying theory until
two scientists, Alfred Wallace(1823−1913) and Charles
Darwin (1809−1882), independently put the various pieces together.
Of the two scientists, Charles Darwin is perhaps the better known. At age 22,he
became the naturalist on board HMS Beagle, a British survey ship that sailed around
the world from 1831 to 1836. During his journey, Darwin made many observations of
trait variation across a tremendous variety of species.In addition to observing living
organisms, he found fossil evidence of a large number of extinct species. He also
recognized that organisms produce many more offspring than are needed to replace the
parents, and that most of these offspring do not survive. Darwin questioned why, out of
all the species that had once existed on Earth, only a small fraction had
survived. Similarly,he wondered why, among all the offspring produced in a population
in a given year, only a small fraction survived to the next year. During the decades
following his voyage, he developed his ideas into a robust theory. His On the Origin of
Species by Means of Natural Selection, published in 1859, changed the way people
thought about the natural world.
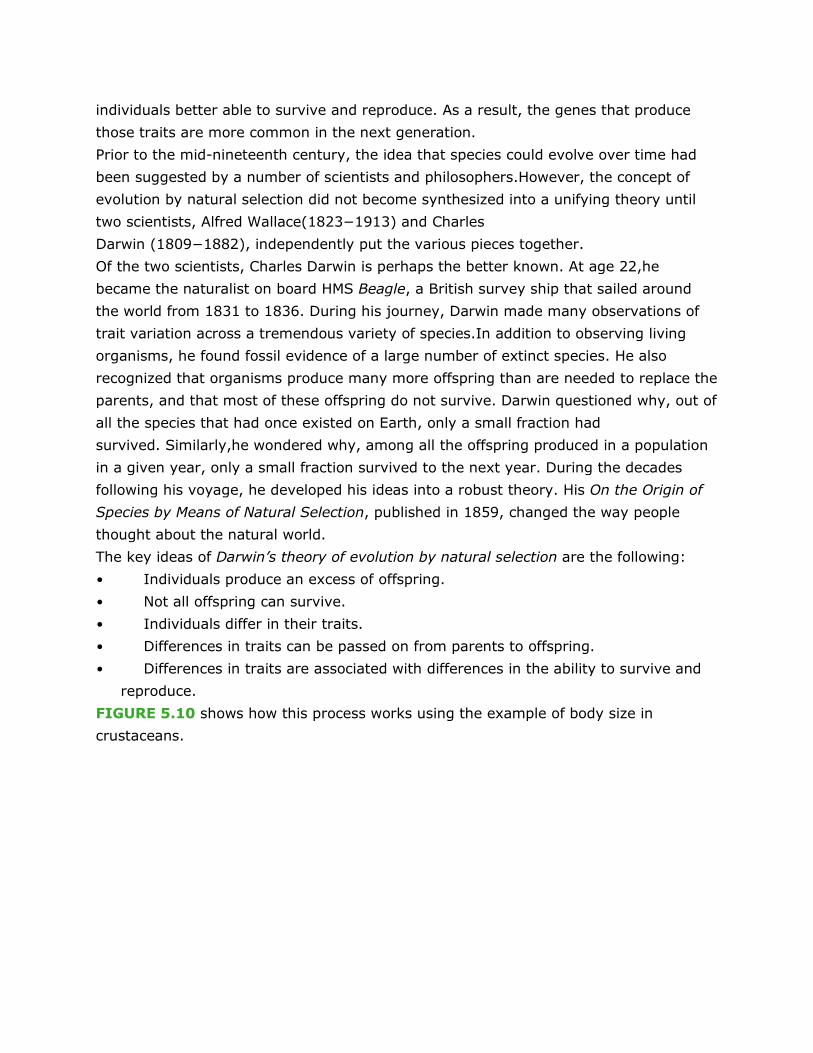
The key ideas of Darwin’s theory of evolution by natural selection are the following:
• Individuals produce an excess of offspring.
• Not all offspring can survive.
• Individuals differ in their traits.
• Differences in traits can be passed on from parents to offspring.
• Differences in traits are associated with differences in the ability to survive and
reproduce.
FIGURE 5.10 shows how this process works using the example of body size in
crustaceans.
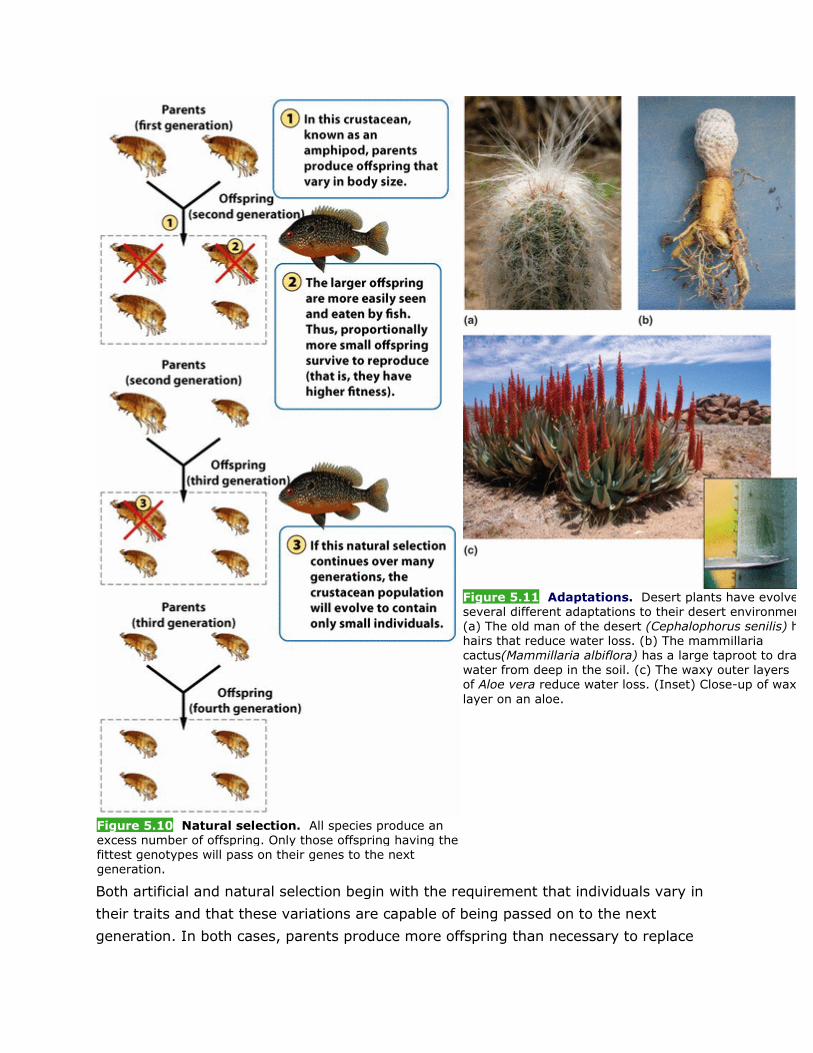
Figure 5.10 Natural selection. All species produce an excess number of offspring. Only those offspring having the fittest genotypes will pass on their genes to the next generation.
Figure 5.11 Adaptations. Desert plants have evolved several different adaptations to their desert environment. (a) The old man of the desert (Cephalophorus senilis) has hairs that reduce water loss. (b) The mammillaria cactus(Mammillaria albiflora) has a large taproot to draw water from deep in the soil. (c) The waxy outer layers of Aloe vera reduce water loss. (Inset) Close-up of waxy layer on an aloe.
Both artificial and natural selection begin with the requirement that individuals vary in
their traits and that these variations are capable of being passed on to the next
generation. In both cases, parents produce more offspring than necessary to replace
themselves, and some of those offspring either do not survive or do not reproduce. But
in the case of artificial selection, humans decide which individuals get to breed, based
on which individuals possess the traits that tend toward some predetermined goal, such
as a curly coat or large size. Natural selection does not select for specific traits that
tend toward some predetermined goal. Rather, natural selection favors any combination
of traits that improves an individual’s fitness: its ability to survive and
reproduce. Traits that improve an individual’s fitness are calledadaptations.
Natural selection can favor multiple solutions to a particular environmental
challenge, as long as each solution improves an individual’s ability to survive and
reproduce. For example, all plants living in the desert face the challenge of low water
availability in the soil, but different species have evolved different solutions to this
common challenge. Some species have evolved large taproots to draw water from deep
in the soil. Other species have evolved the ability to store excess water during
infrequent rains. Still other species have evolved waxy or hairy leaf surfaces that
reduce water loss. Each of these very different adaptations allows the plants to survive
and reproduce in a desert environment (FIGURE 5.11).
5.2.4 Evolution by Random Processes
[Notes/Highlighting]
Whereas natural selection is an important mechanism of evolution, evolution can also
occur by random, or nonadaptive, processes. In these cases, the genetic composition of
a population still changes over time, but the changes are not related to differences in
fitness among individuals. These random processes, illustrated
in FIGURE 5.12, are mutation, genetic drift, bottleneck effects, and founder effects.
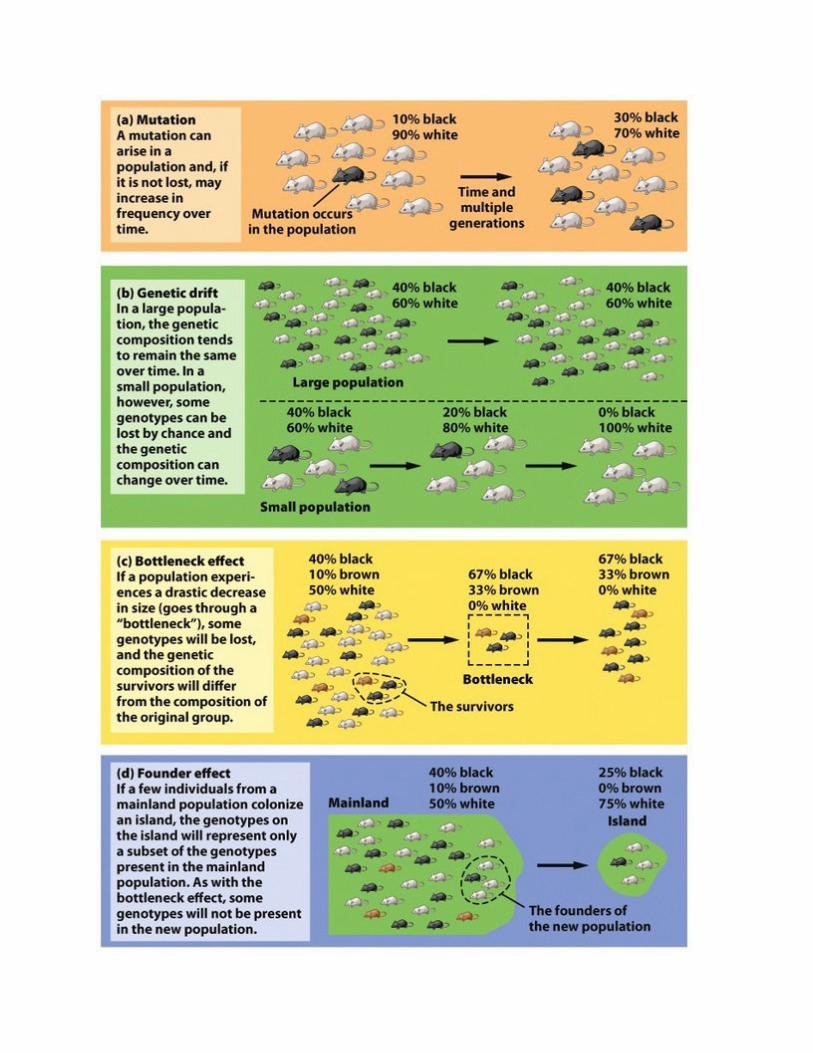
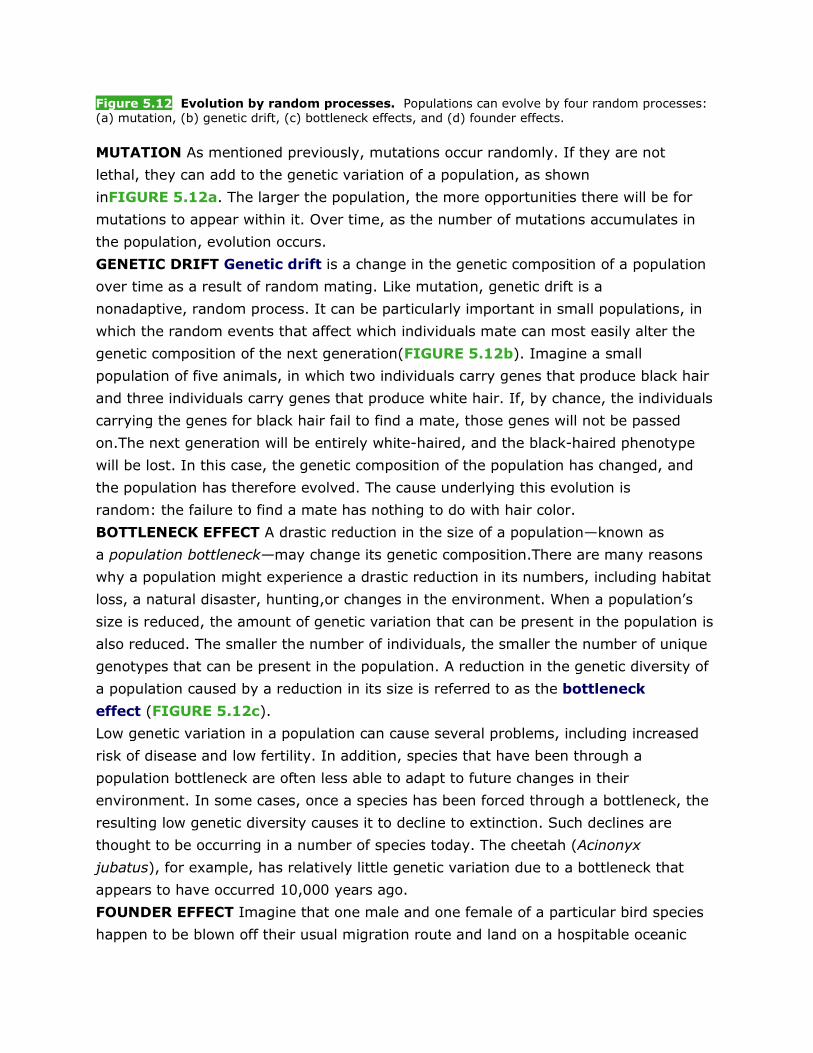
Figure 5.12 Evolution by random processes. Populations can evolve by four random processes: (a) mutation, (b) genetic drift, (c) bottleneck effects, and (d) founder effects.
MUTATION As mentioned previously, mutations occur randomly. If they are not
lethal, they can add to the genetic variation of a population, as shown
inFIGURE 5.12a. The larger the population, the more opportunities there will be for
mutations to appear within it. Over time, as the number of mutations accumulates in
the population, evolution occurs.
GENETIC DRIFT Genetic drift is a change in the genetic composition of a population
over time as a result of random mating. Like mutation, genetic drift is a
nonadaptive, random process. It can be particularly important in small populations, in
which the random events that affect which individuals mate can most easily alter the
genetic composition of the next generation(FIGURE 5.12b). Imagine a small
population of five animals, in which two individuals carry genes that produce black hair
and three individuals carry genes that produce white hair. If, by chance, the individuals
carrying the genes for black hair fail to find a mate, those genes will not be passed
on.The next generation will be entirely white-haired, and the black-haired phenotype
will be lost. In this case, the genetic composition of the population has changed, and
the population has therefore evolved. The cause underlying this evolution is
random: the failure to find a mate has nothing to do with hair color.
BOTTLENECK EFFECT A drastic reduction in the size of a population—known as
a population bottleneck—may change its genetic composition.There are many reasons
why a population might experience a drastic reduction in its numbers, including habitat
loss, a natural disaster, hunting,or changes in the environment. When a population’s
size is reduced, the amount of genetic variation that can be present in the population is
also reduced. The smaller the number of individuals, the smaller the number of unique
genotypes that can be present in the population. A reduction in the genetic diversity of
a population caused by a reduction in its size is referred to as the bottleneck
effect (FIGURE 5.12c).
Low genetic variation in a population can cause several problems, including increased
risk of disease and low fertility. In addition, species that have been through a
population bottleneck are often less able to adapt to future changes in their
environment. In some cases, once a species has been forced through a bottleneck, the
resulting low genetic diversity causes it to decline to extinction. Such declines are
thought to be occurring in a number of species today. The cheetah (Acinonyx
jubatus), for example, has relatively little genetic variation due to a bottleneck that
appears to have occurred 10,000 years ago.
FOUNDER EFFECT Imagine that one male and one female of a particular bird species
happen to be blown off their usual migration route and land on a hospitable oceanic
island. These two individuals will have been drawn at random from the mainland
population, and the genotypes they possess are only a subset of those in the original
mainland population. These colonizing individuals, or founders, will give rise to an
island population that has a genetic composition very different from that of the original
mainland population (FIGURE 5.12d). Such a change in a population descended from
a small number of colonizing individuals is known as the founder effect. Like
mutation, genetic drift, and the bottleneck effect, the founder effect is a random
process that is not based on differences in fitness.
CHECKPOINT
• What is evolution, and what are the three main ways in which it occurs?
• How are artificial and natural selection similar? How are they different?
• How does evolution lead to biodiversity?
5.3 Speciation and extinction determine biodiversity
[Notes/Highlighting]
Over time, speciation has given rise to the millions of species present on Earth
today. Beyond knowing how many species exist, environmental scientists are also
interested in understanding how quickly existing species can change, how quickly new
species can evolve, and how quickly species can go extinct. In this section we will
examine some of the tools available to explore these questions.
5.3.1 Allopatric versus Sympatric Speciation
[Notes/Highlighting]
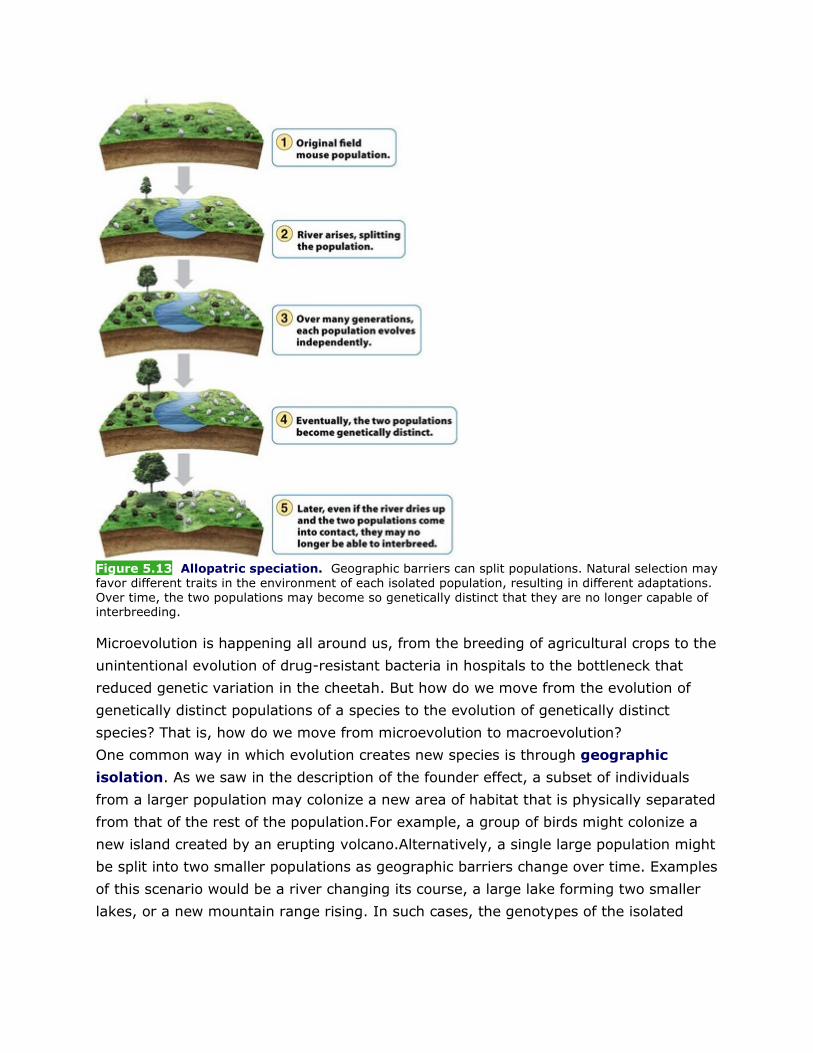
Figure 5.13 Allopatric speciation. Geographic barriers can split populations. Natural selection may favor different traits in the environment of each isolated population, resulting in different adaptations. Over time, the two populations may become so genetically distinct that they are no longer capable of interbreeding.
Microevolution is happening all around us, from the breeding of agricultural crops to the
unintentional evolution of drug-resistant bacteria in hospitals to the bottleneck that
reduced genetic variation in the cheetah. But how do we move from the evolution of
genetically distinct populations of a species to the evolution of genetically distinct
species? That is, how do we move from microevolution to macroevolution?
One common way in which evolution creates new species is through geographic
isolation. As we saw in the description of the founder effect, a subset of individuals
from a larger population may colonize a new area of habitat that is physically separated
from that of the rest of the population.For example, a group of birds might colonize a
new island created by an erupting volcano.Alternatively, a single large population might
be split into two smaller populations as geographic barriers change over time. Examples
of this scenario would be a river changing its course, a large lake forming two smaller
lakes, or a new mountain range rising. In such cases, the genotypes of the isolated
populations might diverge over time, either because of random processes or because of
natural selection.
If the two separated habitats differ in environmental conditions, such as
temperature,precipitation, or the occurrence of predators,natural selection will favor
different phenotypes in each of the habitats. If individuals cannot move between the
populations,then over time, the two geographically isolated populations will continue to
become more and more genetically distinct. FIGURE 5.13 shows how this
happens. Eventually, the two populations will be separated not only by geographic
isolation, but also by reproductive isolation: they will become so different that even
if the physical barrier were removed, they could no longer interbreed and produce
viable offspring. At this point, the two populations will have become distinct
species. Because this process of speciation requires geographic isolation, it is
called allopatric speciation(from the Greek allos, meaning “other,”
and patris, meaning “fatherland”).
Allopatric speciation is thought to be responsible for the diversity of the group of birds
known as Darwin’s finches. When Charles Darwin visited the Galápagos Islands, located
just west of Ecuador, he noted a large variety of finch species, each of which seemed to
live in different habitats or eat different foods. Research on these birds has
demonstrated that they all share a common ancestor from the mainland that colonized
the islands long ago. FIGURE 5.14 is a phylogenetic tree for these finches. As Darwin
discovered, over a few million years, the finches that were geographically isolated on
different islands became genetically distinct and eventually became reproductively
isolated.
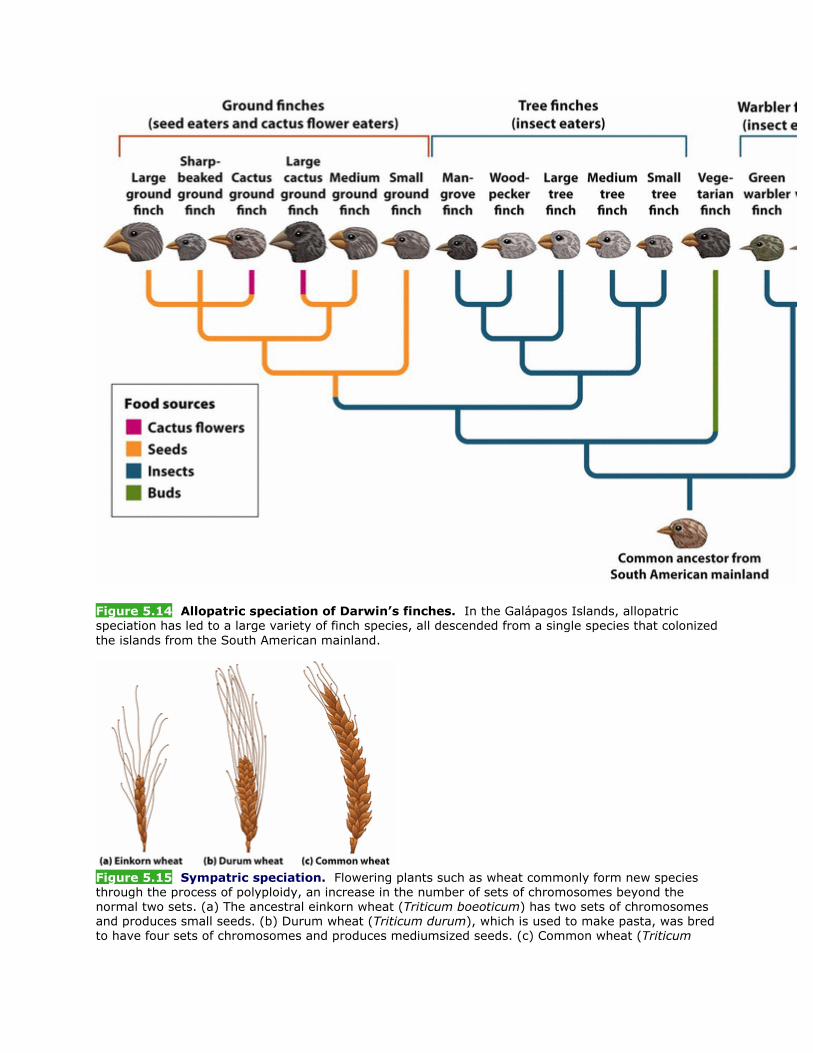
Figure 5.14 Allopatric speciation of Darwin’s finches. In the Galápagos Islands, allopatric speciation has led to a large variety of finch species, all descended from a single species that colonized the islands from the South American mainland.
Figure 5.15 Sympatric speciation. Flowering plants such as wheat commonly form new species through the process of polyploidy, an increase in the number of sets of chromosomes beyond the normal two sets. (a) The ancestral einkorn wheat (Triticum boeoticum) has two sets of chromosomes and produces small seeds. (b) Durum wheat (Triticum durum), which is used to make pasta, was bred to have four sets of chromosomes and produces mediumsized seeds. (c) Common wheat (Triticum
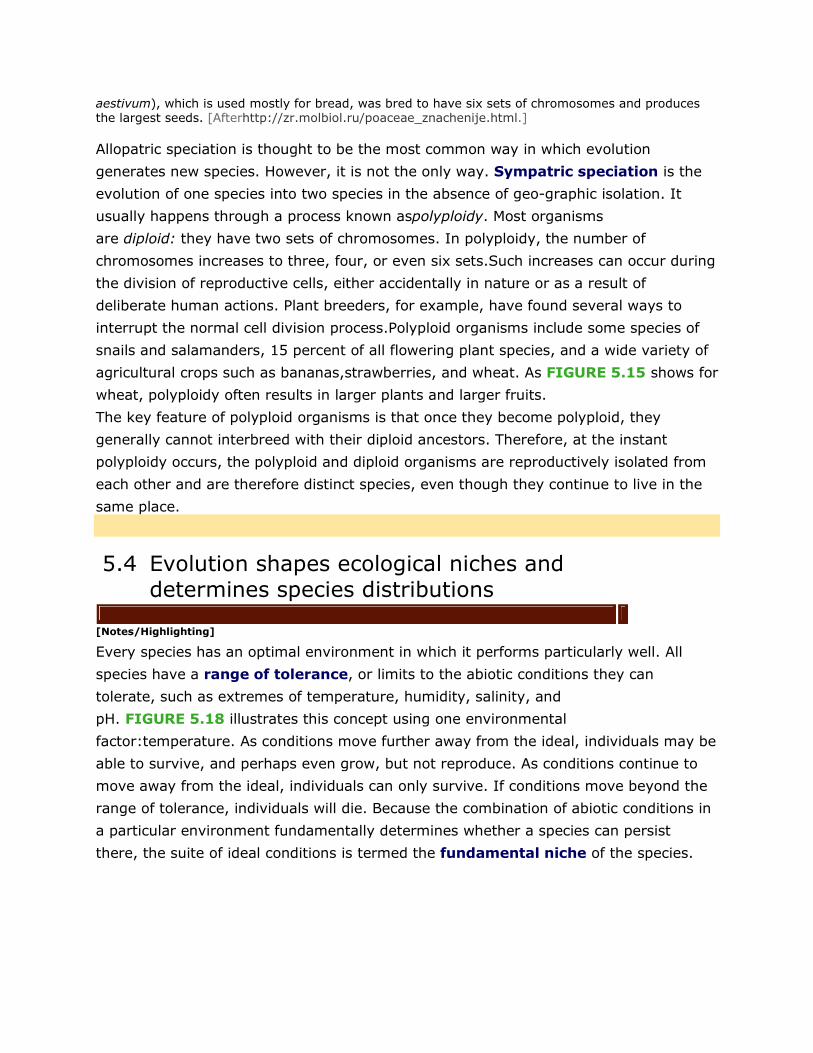
aestivum), which is used mostly for bread, was bred to have six sets of chromosomes and produces the largest seeds. [Afterhttp://zr.molbiol.ru/poaceae_znachenije.html.]
Allopatric speciation is thought to be the most common way in which evolution
generates new species. However, it is not the only way. Sympatric speciation is the
evolution of one species into two species in the absence of geo-graphic isolation. It
usually happens through a process known aspolyploidy. Most organisms
are diploid: they have two sets of chromosomes. In polyploidy, the number of
chromosomes increases to three, four, or even six sets.Such increases can occur during
the division of reproductive cells, either accidentally in nature or as a result of
deliberate human actions. Plant breeders, for example, have found several ways to
interrupt the normal cell division process.Polyploid organisms include some species of
snails and salamanders, 15 percent of all flowering plant species, and a wide variety of
agricultural crops such as bananas,strawberries, and wheat. As FIGURE 5.15 shows for
wheat, polyploidy often results in larger plants and larger fruits.
The key feature of polyploid organisms is that once they become polyploid, they
generally cannot interbreed with their diploid ancestors. Therefore, at the instant
polyploidy occurs, the polyploid and diploid organisms are reproductively isolated from
each other and are therefore distinct species, even though they continue to live in the
same place.
5.4 Evolution shapes ecological niches and determines species distributions
[Notes/Highlighting]
Every species has an optimal environment in which it performs particularly well. All
species have a range of tolerance, or limits to the abiotic conditions they can
tolerate, such as extremes of temperature, humidity, salinity, and
pH. FIGURE 5.18 illustrates this concept using one environmental
factor:temperature. As conditions move further away from the ideal, individuals may be
able to survive, and perhaps even grow, but not reproduce. As conditions continue to
move away from the ideal, individuals can only survive. If conditions move beyond the
range of tolerance, individuals will die. Because the combination of abiotic conditions in
a particular environment fundamentally determines whether a species can persist
there, the suite of ideal conditions is termed the fundamental niche of the species.
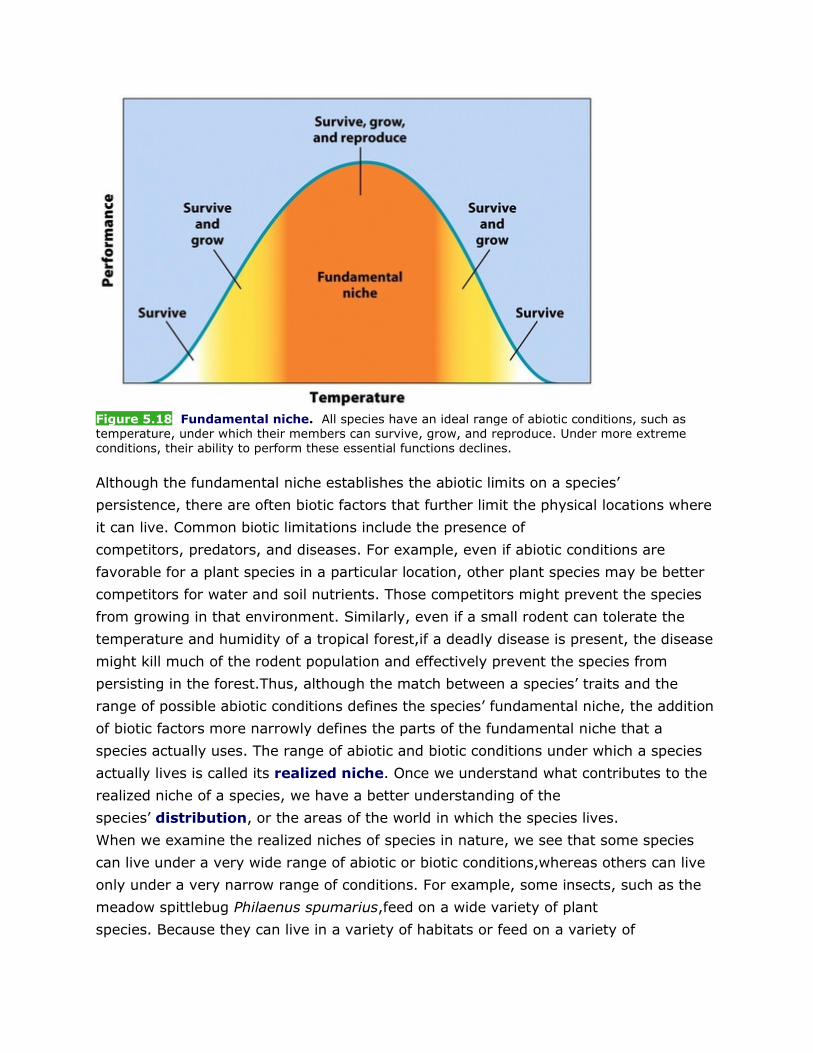
Figure 5.18 Fundamental niche. All species have an ideal range of abiotic conditions, such as temperature, under which their members can survive, grow, and reproduce. Under more extreme conditions, their ability to perform these essential functions declines.
Although the fundamental niche establishes the abiotic limits on a species’
persistence, there are often biotic factors that further limit the physical locations where
it can live. Common biotic limitations include the presence of
competitors, predators, and diseases. For example, even if abiotic conditions are
favorable for a plant species in a particular location, other plant species may be better
competitors for water and soil nutrients. Those competitors might prevent the species
from growing in that environment. Similarly, even if a small rodent can tolerate the
temperature and humidity of a tropical forest,if a deadly disease is present, the disease
might kill much of the rodent population and effectively prevent the species from
persisting in the forest.Thus, although the match between a species’ traits and the
range of possible abiotic conditions defines the species’ fundamental niche, the addition
of biotic factors more narrowly defines the parts of the fundamental niche that a
species actually uses. The range of abiotic and biotic conditions under which a species
actually lives is called its realized niche. Once we understand what contributes to the
realized niche of a species, we have a better understanding of the
species’ distribution, or the areas of the world in which the species lives.
When we examine the realized niches of species in nature, we see that some species
can live under a very wide range of abiotic or biotic conditions,whereas others can live
only under a very narrow range of conditions. For example, some insects, such as the
meadow spittlebug Philaenus spumarius,feed on a wide variety of plant
species. Because they can live in a variety of habitats or feed on a variety of
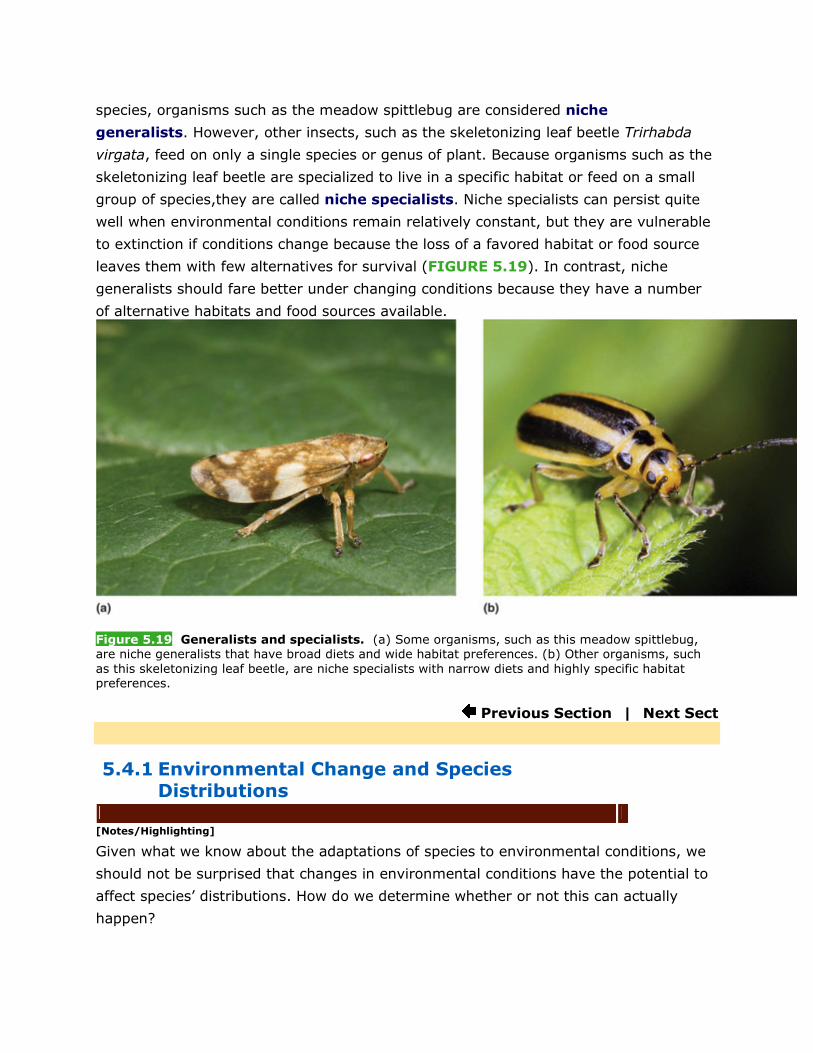
species, organisms such as the meadow spittlebug are considered niche
generalists. However, other insects, such as the skeletonizing leaf beetle Trirhabda
virgata, feed on only a single species or genus of plant. Because organisms such as the
skeletonizing leaf beetle are specialized to live in a specific habitat or feed on a small
group of species,they are called niche specialists. Niche specialists can persist quite
well when environmental conditions remain relatively constant, but they are vulnerable
to extinction if conditions change because the loss of a favored habitat or food source
leaves them with few alternatives for survival (FIGURE 5.19). In contrast, niche
generalists should fare better under changing conditions because they have a number
of alternative habitats and food sources available.
Figure 5.19 Generalists and specialists. (a) Some organisms, such as this meadow spittlebug, are niche generalists that have broad diets and wide habitat preferences. (b) Other organisms, such as this skeletonizing leaf beetle, are niche specialists with narrow diets and highly specific habitat preferences.
Previous Section | Next Sect
5.4.1 Environmental Change and Species Distributions
[Notes/Highlighting]
Given what we know about the adaptations of species to environmental conditions, we
should not be surprised that changes in environmental conditions have the potential to
affect species’ distributions. How do we determine whether or not this can actually
happen?
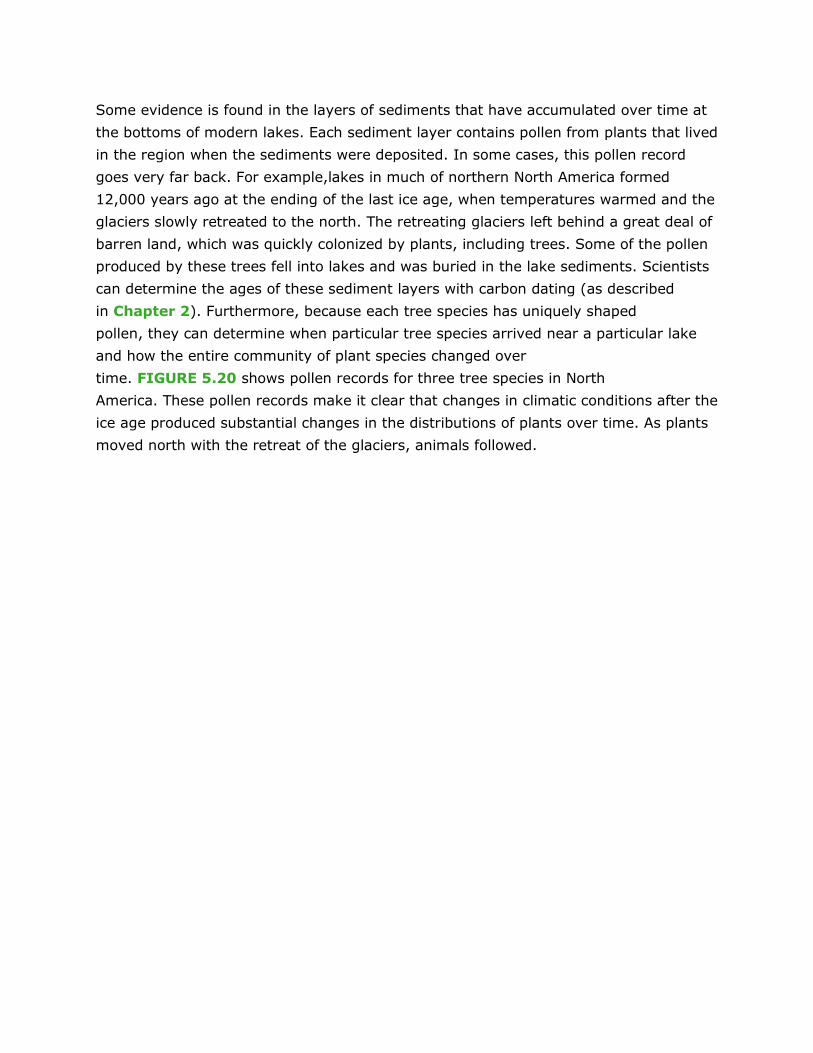
Some evidence is found in the layers of sediments that have accumulated over time at
the bottoms of modern lakes. Each sediment layer contains pollen from plants that lived
in the region when the sediments were deposited. In some cases, this pollen record
goes very far back. For example,lakes in much of northern North America formed
12,000 years ago at the ending of the last ice age, when temperatures warmed and the
glaciers slowly retreated to the north. The retreating glaciers left behind a great deal of
barren land, which was quickly colonized by plants, including trees. Some of the pollen
produced by these trees fell into lakes and was buried in the lake sediments. Scientists
can determine the ages of these sediment layers with carbon dating (as described
in Chapter 2). Furthermore, because each tree species has uniquely shaped
pollen, they can determine when particular tree species arrived near a particular lake
and how the entire community of plant species changed over
time. FIGURE 5.20 shows pollen records for three tree species in North
America. These pollen records make it clear that changes in climatic conditions after the
ice age produced substantial changes in the distributions of plants over time. As plants
moved north with the retreat of the glaciers, animals followed.
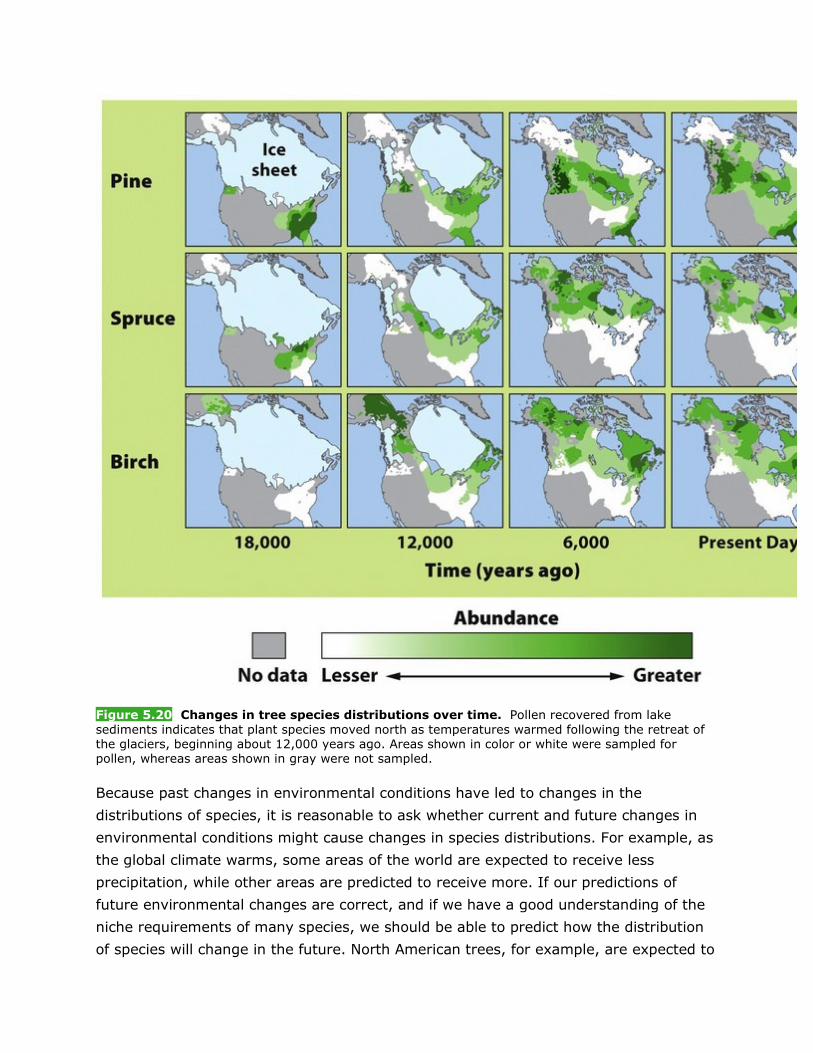
Figure 5.20 Changes in tree species distributions over time. Pollen recovered from lake sediments indicates that plant species moved north as temperatures warmed following the retreat of the glaciers, beginning about 12,000 years ago. Areas shown in color or white were sampled for pollen, whereas areas shown in gray were not sampled.
Because past changes in environmental conditions have led to changes in the
distributions of species, it is reasonable to ask whether current and future changes in
environmental conditions might cause changes in species distributions. For example, as
the global climate warms, some areas of the world are expected to receive less
precipitation, while other areas are predicted to receive more. If our predictions of
future environmental changes are correct, and if we have a good understanding of the
niche requirements of many species, we should be able to predict how the distribution
of species will change in the future. North American trees, for example, are expected to
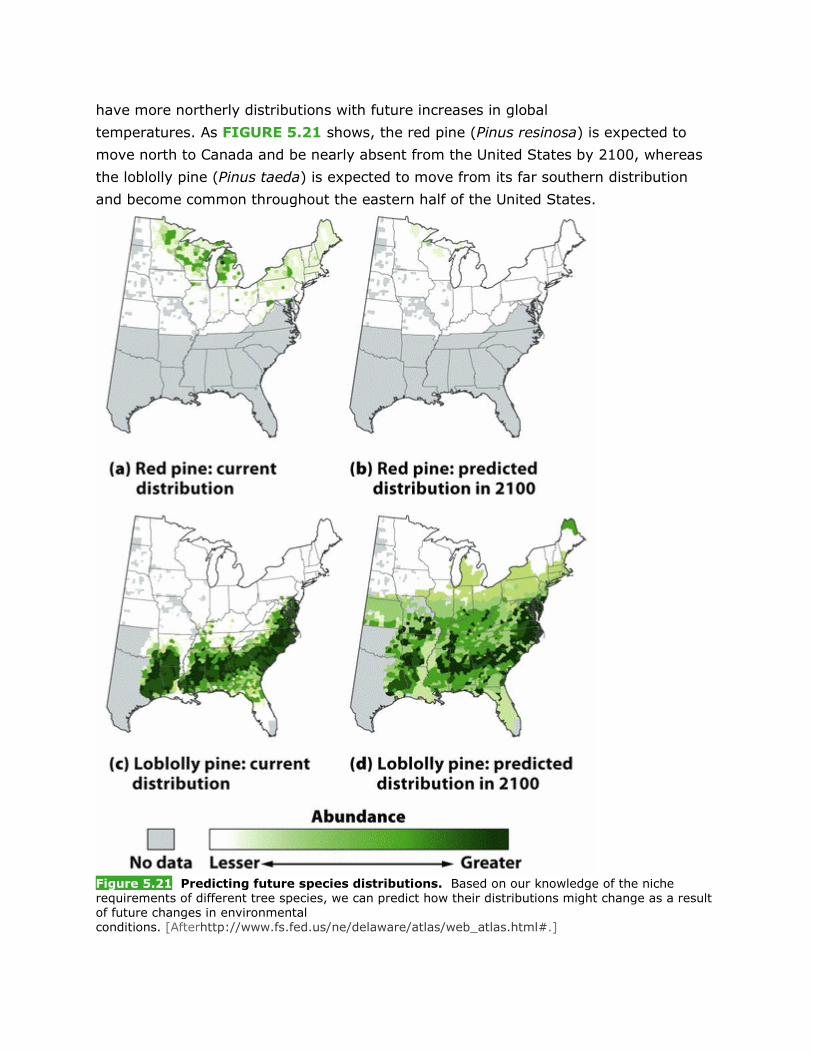
have more northerly distributions with future increases in global
temperatures. As FIGURE 5.21 shows, the red pine (Pinus resinosa) is expected to
move north to Canada and be nearly absent from the United States by 2100, whereas
the loblolly pine (Pinus taeda) is expected to move from its far southern distribution
and become common throughout the eastern half of the United States.
Figure 5.21 Predicting future species distributions. Based on our knowledge of the niche requirements of different tree species, we can predict how their distributions might change as a result of future changes in environmental conditions. [Afterhttp://www.fs.fed.us/ne/delaware/atlas/web_atlas.html#.]
Species vary in their ability to move physically across the landscape as the environment
changes. Some species are highly mobile at particular life stages: adult birds and wind-
dispersed seeds, for example, move across the landscape easily. Other organisms, such
as the desert tortoise (Gopherus agassizii), are slow movers. Furthermore, the
movements of many species may be impeded by anthropogenic obstacles, including
roads and dams. It remains unclear how species that face these challenges will shift
their distributions as global climate change occurs.
5.4.2 Environmental Change and Species Extinctions
[Notes/Highlighting]
If environmental conditions change, species that cannot adapt to the changes or move
to more favorable environments will eventually go extinct. The average life span of a
species appears to be only about 1 million to 10 million years. In fact, 99 percent of the
species that have ever lived on Earth are now extinct.
There are several reasons why species might go extinct. First, there may be no
favorable environment that is geographically close enough to move to.This is the
current situation of the polar bear (Ursus maritimus), which depends on sea ice as a
vital habitat for hunting seals, one of its main prey.Because of rising global
temperatures, the Arctic sea ice now melts 3 weeks earlier than it did 20 years
ago, leaving less time for the bears to hunt. As a result, polar bears observed near
Hudson Bay in Canada are in poorer condition than they were 30 years ago, with males
weighing an average of 67 kg (150 pounds) less.
Even if there is an alternative favorable environment to which a species can move, it
may already be occupied by other species against which the moving populations cannot
successfully compete. For example, the predicted northern movement of the loblolly
pine, shown in FIGURE 5.21, might not happen if another pine tree species in the
northern United States is a better competitor and prevents the loblolly pine from
surviving in that area.
Finally, an environmental change may occur so rapidly that the species does not have
time to evolve new adaptations.
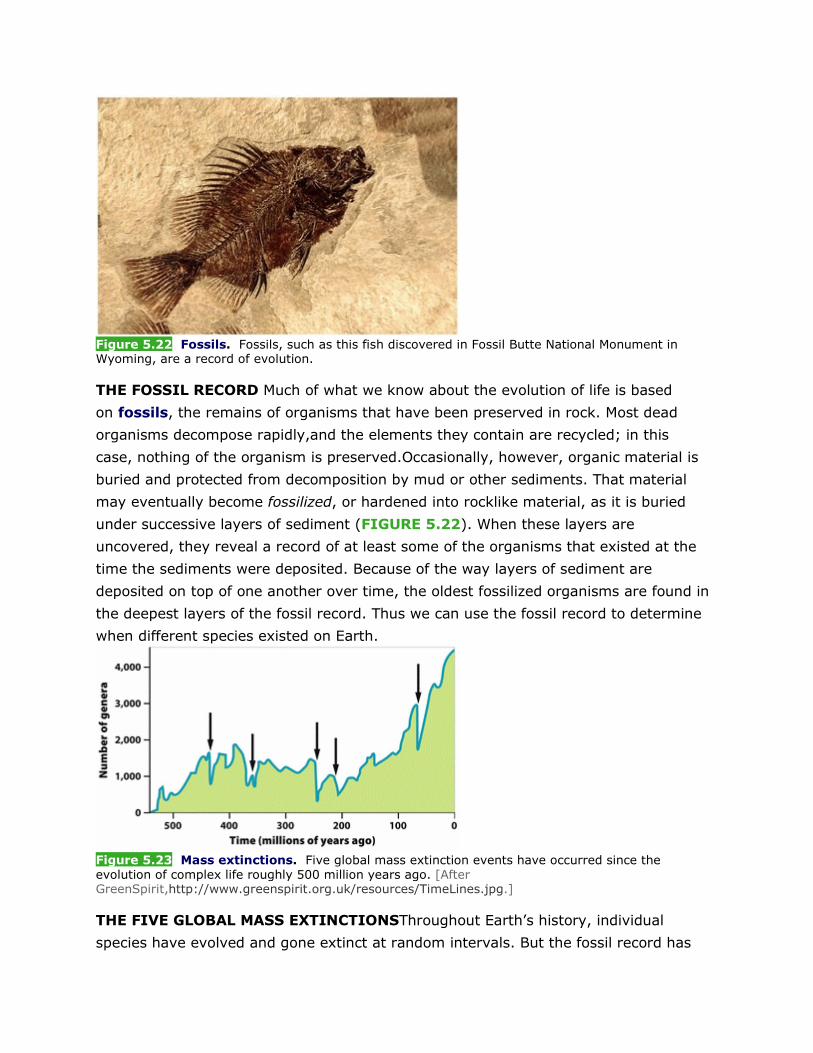
Figure 5.22 Fossils. Fossils, such as this fish discovered in Fossil Butte National Monument in Wyoming, are a record of evolution.
THE FOSSIL RECORD Much of what we know about the evolution of life is based
on fossils, the remains of organisms that have been preserved in rock. Most dead
organisms decompose rapidly,and the elements they contain are recycled; in this
case, nothing of the organism is preserved.Occasionally, however, organic material is
buried and protected from decomposition by mud or other sediments. That material
may eventually become fossilized, or hardened into rocklike material, as it is buried
under successive layers of sediment (FIGURE 5.22). When these layers are
uncovered, they reveal a record of at least some of the organisms that existed at the
time the sediments were deposited. Because of the way layers of sediment are
deposited on top of one another over time, the oldest fossilized organisms are found in
the deepest layers of the fossil record. Thus we can use the fossil record to determine
when different species existed on Earth.
Figure 5.23 Mass extinctions. Five global mass extinction events have occurred since the evolution of complex life roughly 500 million years ago. [After GreenSpirit,http://www.greenspirit.org.uk/resources/TimeLines.jpg.]
THE FIVE GLOBAL MASS EXTINCTIONSThroughout Earth’s history, individual
species have evolved and gone extinct at random intervals. But the fossil record has
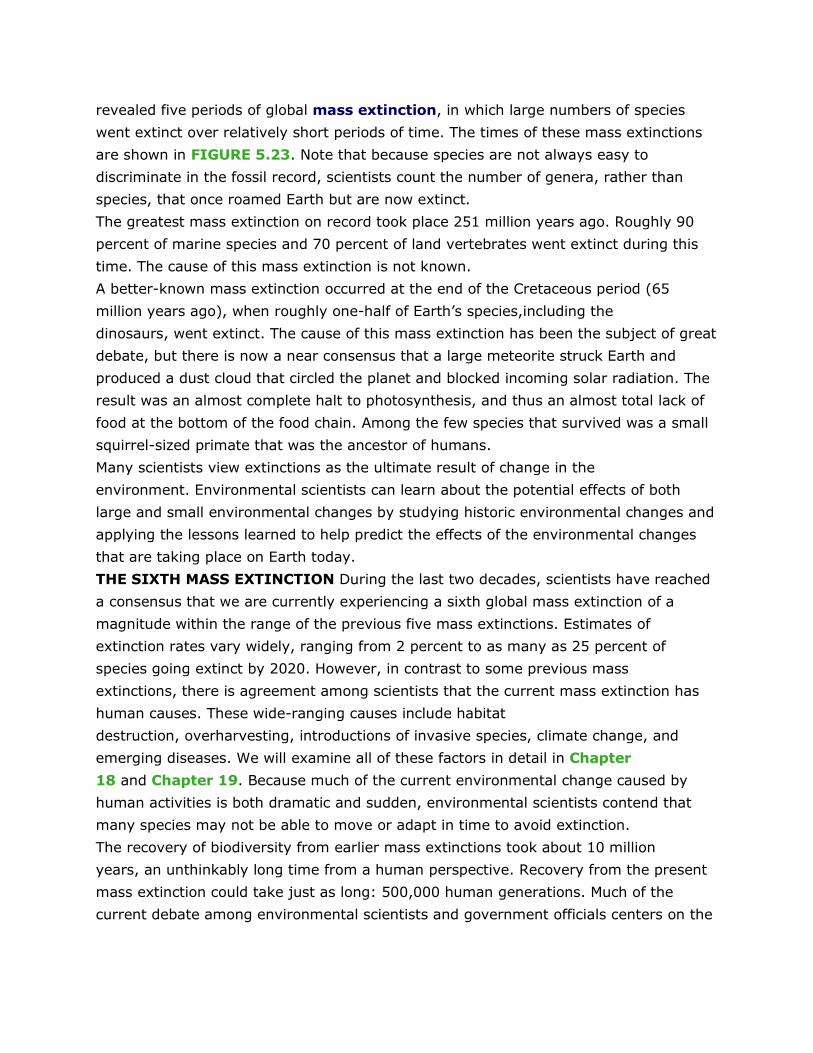
revealed five periods of global mass extinction, in which large numbers of species
went extinct over relatively short periods of time. The times of these mass extinctions
are shown in FIGURE 5.23. Note that because species are not always easy to
discriminate in the fossil record, scientists count the number of genera, rather than
species, that once roamed Earth but are now extinct.
The greatest mass extinction on record took place 251 million years ago. Roughly 90
percent of marine species and 70 percent of land vertebrates went extinct during this
time. The cause of this mass extinction is not known.
A better-known mass extinction occurred at the end of the Cretaceous period (65
million years ago), when roughly one-half of Earth’s species,including the
dinosaurs, went extinct. The cause of this mass extinction has been the subject of great
debate, but there is now a near consensus that a large meteorite struck Earth and
produced a dust cloud that circled the planet and blocked incoming solar radiation. The
result was an almost complete halt to photosynthesis, and thus an almost total lack of
food at the bottom of the food chain. Among the few species that survived was a small
squirrel-sized primate that was the ancestor of humans.
Many scientists view extinctions as the ultimate result of change in the
environment. Environmental scientists can learn about the potential effects of both
large and small environmental changes by studying historic environmental changes and
applying the lessons learned to help predict the effects of the environmental changes
that are taking place on Earth today.
THE SIXTH MASS EXTINCTION During the last two decades, scientists have reached
a consensus that we are currently experiencing a sixth global mass extinction of a
magnitude within the range of the previous five mass extinctions. Estimates of
extinction rates vary widely, ranging from 2 percent to as many as 25 percent of
species going extinct by 2020. However, in contrast to some previous mass
extinctions, there is agreement among scientists that the current mass extinction has
human causes. These wide-ranging causes include habitat
destruction, overharvesting, introductions of invasive species, climate change, and
emerging diseases. We will examine all of these factors in detail in Chapter
18 and Chapter 19. Because much of the current environmental change caused by
human activities is both dramatic and sudden, environmental scientists contend that
many species may not be able to move or adapt in time to avoid extinction.
The recovery of biodiversity from earlier mass extinctions took about 10 million
years, an unthinkably long time from a human perspective. Recovery from the present
mass extinction could take just as long: 500,000 human generations. Much of the
current debate among environmental scientists and government officials centers on the
true magnitude of this crisis and on the costs of reducing the human impact on
extinction rates.
CHECKPOINT
• How do fundamental niches and realized niches differ?
• How does environmental change determine species distribution? When does it
lead to extinction?
• How are human activities affecting extinction rates, and why is their impact a
particular concern?
WORKING TOWARD SUSTAINABILITY Buying the Oceans?
F or over 50 years, The Nature Conservancy (TNC) has protected biodiversity using a
simple strategy: buy it. The Conservancy uses grants and donations to purchase
privately owned natural areas or to buy development rights to those areas. TNC owns
over 0.8 million hectares (2 million acres) of land and has protected over 46 million
hectares(115 million acres) of land by buying development rights. As a
nonprofit,nongovernmental organization, TNC has great flexibility to use innovative
conservation and restoration techniques on natural areas in its possession.
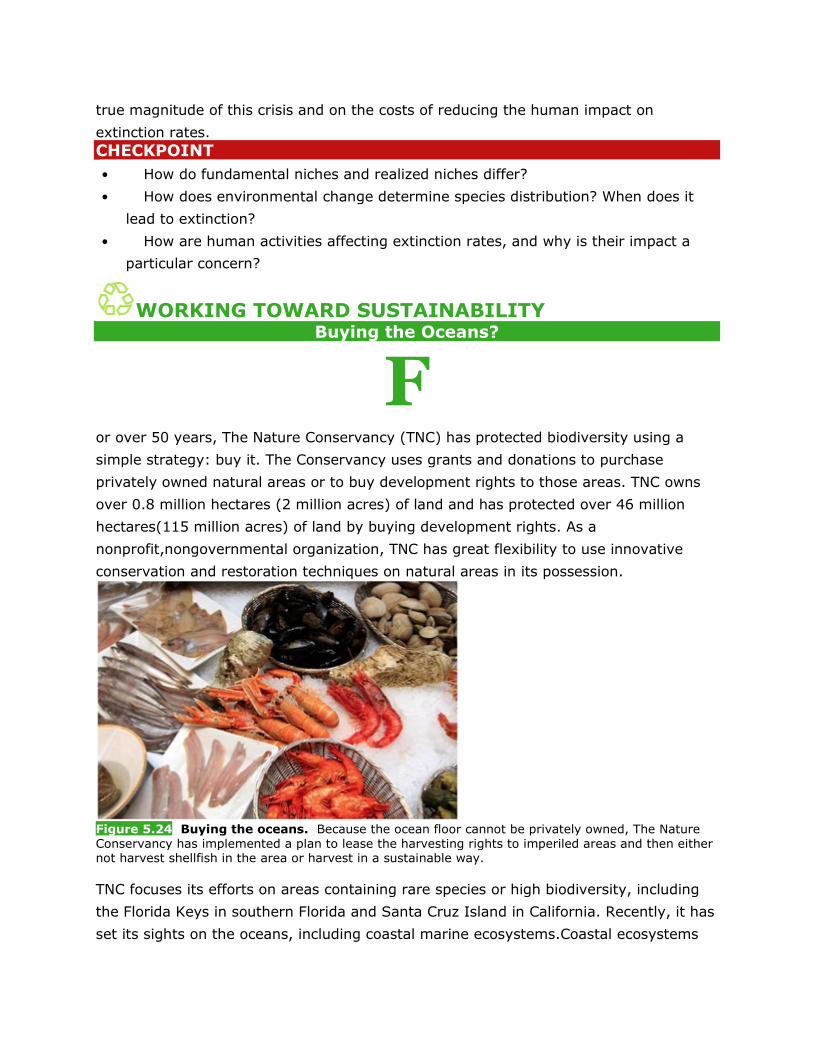
Figure 5.24 Buying the oceans. Because the ocean floor cannot be privately owned, The Nature Conservancy has implemented a plan to lease the harvesting rights to imperiled areas and then either not harvest shellfish in the area or harvest in a sustainable way.
TNC focuses its efforts on areas containing rare species or high biodiversity, including
the Florida Keys in southern Florida and Santa Cruz Island in California. Recently, it has
set its sights on the oceans, including coastal marine ecosystems.Coastal ecosystems

have experienced steep declines in the populations of many fish and shellfish, including
oysters, clams, and mussels,due to a combination of overharvesting and
pollution (FIGURE 5.24). By preserving these coastal ecosystems, TNC hopes to create
reserves that will serve as breeding grounds for declining populations of overharvested
species. In this way,protecting a relatively small area of ocean will benefit the much
larger unprotected areas, and even the very industries that have led to the population
declines.
Shellfish are particularly valuable in many coastal ecosystems because they are filter
feeders: they remove tiny organisms,including algae, from large quantities of
water, cleaning the water in the process. However, shellfish worldwide have been
harvested unsustainably,leading to a cascade of effects throughout many coastal
regions. For example, oyster populations in the Chesapeake Bay were once sufficient to
filter the water of the entire bay in 3 to 6 days. Now there are so few individuals that it
would take a year for them to filter the same amount of water. As a result, the bay has
become much murkier, and excessive algae have led to lowered oxygen levels that
make the bay less hospitable to fish.
Conserving marine ecosystems is particularly challenging because private ownership is
rare. State and federal governments generally do not sell areas of the
ocean. Instead, they have allowed industries to lease the harvesting or exploitation
rights to marine resources such as oil, shellfish, and physical space for marinas and
aquaculture. So how can TNC protect coastal eco-systems if they cannot buy an area of
the ocean? The Nature Conservancy’s strategy is to purchase harvesting and
exploitation rights and use them as a conservation tool. In some cases, TNC will not
harvest any shellfish in order to allow the populations to rebound. In many cases, the
leases require at least some harvesting, and TNC hopes to demonstrate sustainable
management practices that will serve as an example of how shellfish harvests can be
conducted while restoring the shellfish beds.
In 2002, TNC acquired the rights to 4,650 ha (11,500 acres) of oyster beds in New
York’s Great South Bay, along the southern edge of Long Island.These rights, which
were donated to TNC by the Blue Fields Oyster Company,were valued at $2 million. TNC
plans to begin by developing restoration strategies. After the oyster populations have
rebounded, TNC hopes to engage in sustainable harvesting over part of this area and
conduct research in the rest of it. TNC has similar projects under way off the coasts of
Virginia,North Carolina, and Washington State. In California, TNC has purchased
trawling permits, and by allowing them to go unused, has secured a notrawl area the
size of Connecticut. By 2009, TNC had accumulated the rights to 10,000 ha (25,000
acres) of marine fisheries along the coasts of the United States. In the future, they
hope to lease these permits to other harvesters of fish and shellfish that will use
sustainable practices. References
The Nature Conservancy. 2002. Leasing and Restoration of Submerged Lands:Strategies for
Community-Based, Watershed-Scale Conservation.
The Nature Conservancy. 2006. Annual
Report.http://www.nature.org/media/annualreport/annualreport2008.pdf.
KEY IDEAS REVISITED • Explain the concept of biodiversity and how it is measured.
Biodiversity exists at three scales: ecosystem diversity, species diversity,and genetic
diversity. Environmental scientists measure species diversity both by the number of
species in a particular location (species richness)and by how evenly individuals are
distributed among those species(species evenness). The greater the number of
species, and the more even the distribution, the higher the diversity. • Describe the ways in which evolution can occur.
Evolution can occur through artificial selection, natural selection, or random
processes. Artificial selection occurs when humans determine which individuals will
mate and pass on their genes to the next generation to achieve a predetermined suite
of traits. Natural selection does not favor a predetermined suite of traits, but simply
favors those individuals that are best able to survive and reproduce. Random
processes (mutation, genetic drift, bottleneck effects, and founder effects) do not favor
a predetermined suite of traits, nor do they favor individuals with the highest fitness. • Explain how environmental change affects speciation and extinction.
Allopatric and sympatric speciation are two ways in which new species can evolve. Four
factors that affect a species’ ability to adapt to environmental change are the rate of
environmental change, the amount of genetic variation within the species, population
size, and generation time. • Explain the concept of an ecological niche.
Evolution by natural selection favors combinations of traits that perform well under
particular environmental conditions. As a result, each species has a range of preferred
abiotic conditions that constitute its fundamental niche. This fundamental niche is
further restricted by biotic factors,including competition, predation, and disease, to
form the species’ realized niche. Changes in environmental conditions therefore have
the potential to change species’ distributions.
PREPARING FOR THE AP EXAM
MULTIPLE-CHOICE QUESTIONS
[Notes/Highlighting]
1. Which of the following is not a measure of biodiversity?
• (a) Economic diversity
• (b) Ecosystem diversity
• (c) Genetic diversity
• (d) Species diversity
• (e) Species richness [Answer Field]
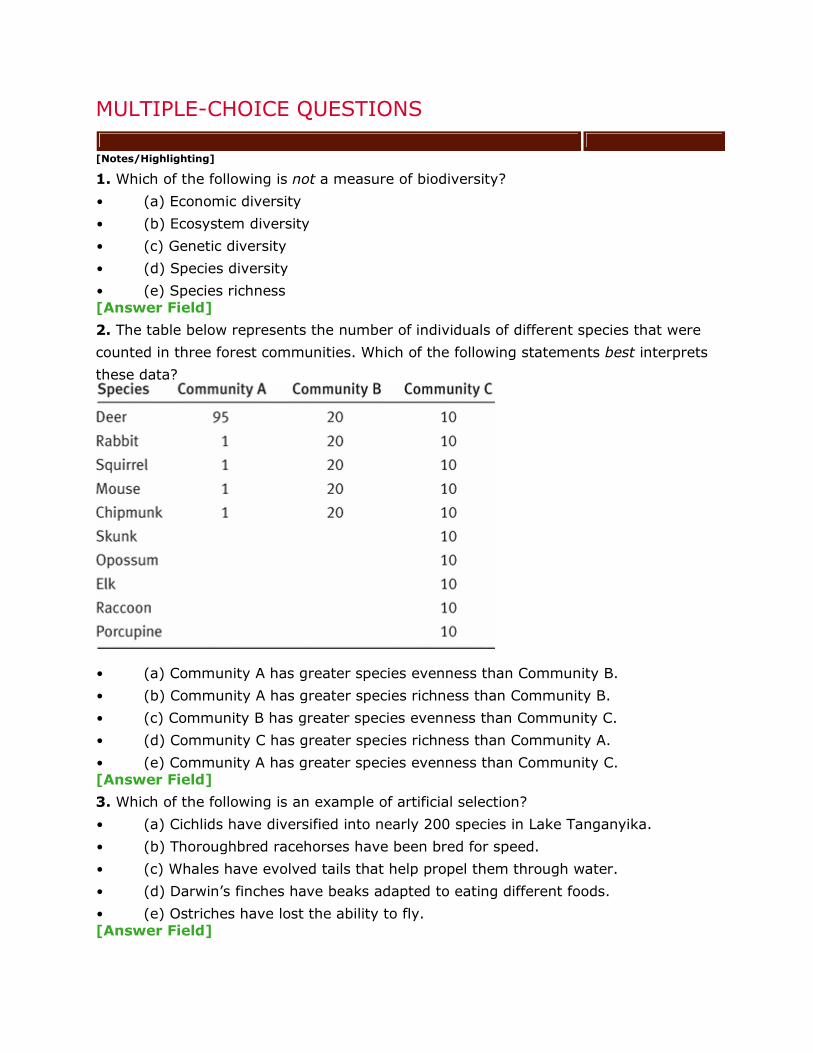
2. The table below represents the number of individuals of different species that were
counted in three forest communities. Which of the following statements best interprets
these data?
• (a) Community A has greater species evenness than Community B.
• (b) Community A has greater species richness than Community B.
• (c) Community B has greater species evenness than Community C.
• (d) Community C has greater species richness than Community A.
• (e) Community A has greater species evenness than Community C. [Answer Field]
3. Which of the following is an example of artificial selection?
• (a) Cichlids have diversified into nearly 200 species in Lake Tanganyika.
• (b) Thoroughbred racehorses have been bred for speed.
• (c) Whales have evolved tails that help propel them through water.
• (d) Darwin’s finches have beaks adapted to eating different foods.
• (e) Ostriches have lost the ability to fly. [Answer Field]
4. The yellow perch (Perca flavescens) is a fish that breeds in spring. A single female
can produce up to 40,000 eggs at one time. This species is an example of which of the
key ideas of Darwin’s theory of evolution by natural selection?
• (a) Individuals produce an excess of offspring.
• (b) Humans select for predetermined traits.
• (c) Individuals vary in their phenotypes.
• (d) Phenotypic differences in individuals can be inherited.
• (e) Different phenotypes have different abilities to survive and reproduce. [Answer Field]
5. In 2002, Peter and B. Rosemary Grant studied a population of Darwin’s finches on
one of the Galápagos Islands that feed on seeds of various sizes.After a drought that
caused only large seeds to be available to the birds,they found that natural selection
favored those birds that had larger beaks and bodies. Once the rains returned and
smaller seeds became much more abundant, however, natural selection favored those
birds that had smaller beaks and bodies. Which of the following processes is
the best interpretation of this scenario?
• (a) Genetic drift
• (b) Founder effect
• (c) Microevolution
• (d) Macroevolution
• (e) Bottleneck effect [Answer Field]
6. The northern elephant seal (Mirounga angustirostris) was once hunted to near
extinction. Only 20 animals remained alive in 1890. After the species was protected
from hunting, its population grew to nearly 30,000 animals, but the large population
possesses very low genetic variation. Which of the following processes is
the best interpretation of this scenario?
• (a) Evolution by natural selection
• (b) Evolution by artificial selection
• (c) Evolution by the founder effect
• (d) Evolution by the bottleneck effect
• (e) Evolution by genetic drift [Answer Field]
7. Which of the following statements is not correct?
• (a) Most speciation is thought to occur via allopatric speciation.
• (b) Polyploidy is an example of sympatric speciation.
• (c) Speciation can be caused by either natural selection or random processes.
• (d) Geographic isolation can eventually lead to reproductive isolation.
• (e) Speciation cannot occur without geographic isolation.
[Answer Field]
8. Which of the following allows more rapid evolution?
• (a) Long generation times
• (b) Rapid environmental change
• (c) Large population sizes
• (d) Low genetic variation
• (e) High genetic variation [Answer Field]
9. Which of the following conditions does not define the fundamental niche of a
species?
• (a) Humidity
• (b) Predators
• (c) Temperature
• (d) Salinity
• (e) pH [Answer Field]
10. Some scientists estimate that the current global extinction rate is about 30,000
species per year. If there are currently 10,000,000 species on Earth,how long will it
take to destroy all of Earth’s biodiversity?
• (a) Less than 100 years
• (b) Between 100 and 300 years
• (c) Between 300 and 500 years
• (d) Between 500 and 700 years
• (e) Between 700 and 1,000 years
FREE-RESPONSE QUESTIONS
[Notes/Highlighting]
1. Look at the photograph below and answer the following questions.
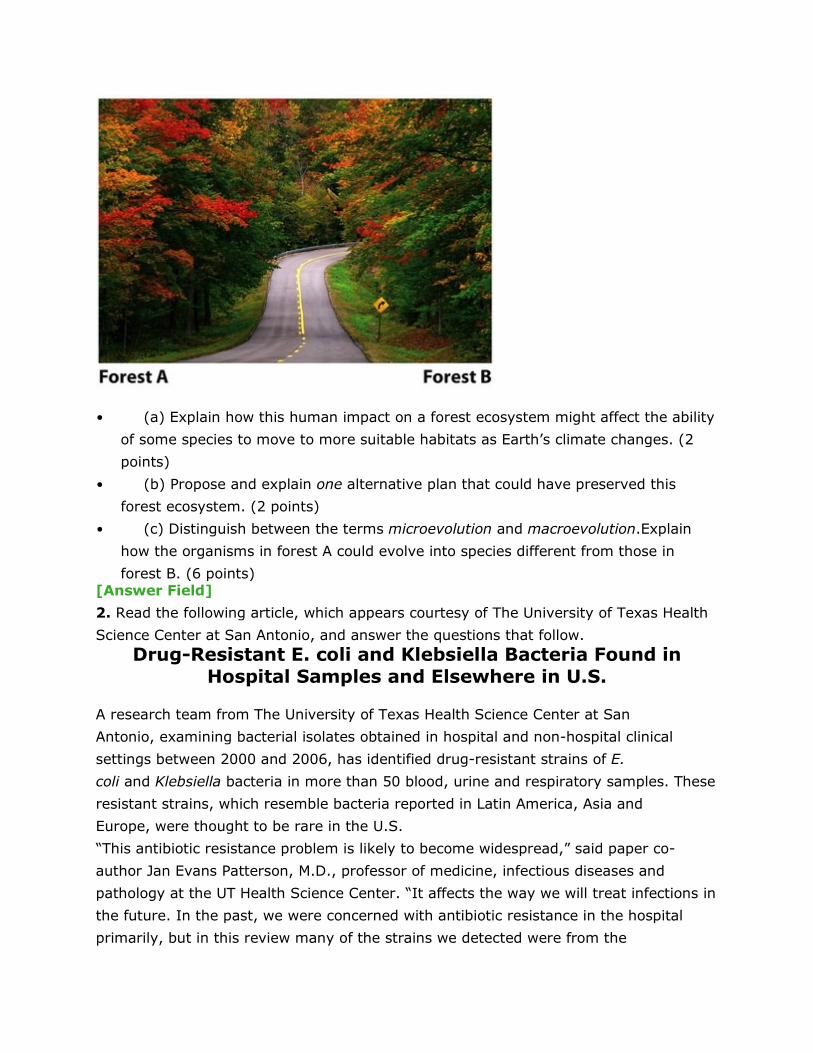
• (a) Explain how this human impact on a forest ecosystem might affect the ability
of some species to move to more suitable habitats as Earth’s climate changes. (2
points)
• (b) Propose and explain one alternative plan that could have preserved this
forest ecosystem. (2 points)
• (c) Distinguish between the terms microevolution and macroevolution.Explain
how the organisms in forest A could evolve into species different from those in
forest B. (6 points) [Answer Field]
2. Read the following article, which appears courtesy of The University of Texas Health
Science Center at San Antonio, and answer the questions that follow.
Drug-Resistant E. coli and Klebsiella Bacteria Found in
Hospital Samples and Elsewhere in U.S.
A research team from The University of Texas Health Science Center at San
Antonio, examining bacterial isolates obtained in hospital and non-hospital clinical
settings between 2000 and 2006, has identified drug-resistant strains of E.
coli and Klebsiella bacteria in more than 50 blood, urine and respiratory samples. These
resistant strains, which resemble bacteria reported in Latin America, Asia and
Europe, were thought to be rare in the U.S.
“This antibiotic resistance problem is likely to become widespread,” said paper co-
author Jan Evans Patterson, M.D., professor of medicine, infectious diseases and
pathology at the UT Health Science Center. “It affects the way we will treat infections in
the future. In the past, we were concerned with antibiotic resistance in the hospital
primarily, but in this review many of the strains we detected were from the
community. This tells us antibiotic resistance is spreading in the community, as
well, and will affect how we choose antibiotics for outpatient infections."
If the trend continues, it may become difficult to select appropriate antibiotic therapy
for urinary tract infections, for example. “The trend over the last decade has been to
treat urinary infections empirically, to pick the drug that has worked,” said James
Jorgensen, Ph.D., professor of pathology, medicine,microbiology and clinical laboratory
sciences at the Health Science Center.“Now it is important for physicians to culture the
patient’s urine to be sure they have selected the right antibiotic. The top three drugs
that are often prescribed may not be effective with these resistant bacteria."
• (a) Explain how drug-resistant strains of bacteria could evolve in a hospital. (4
points)
• (b) According to the article, what is it that the scientists are now concerned
about that they were not concerned about in the past? (2 points)
• (c) Explain how new drugs could be viewed as restricting the fundamental niche
of a particular bacterial species. (2 points)
• (d) Propose two possible solutions to the current problem of drug-resistant
bacteria. (1 point each)
MEASURING YOUR IMPACT
[Notes/Highlighting]
1. The True Cost of a Green Lawn One area of potential biodiversity improvement
that many people overlook is their own lawn. Mowing a lawn and applying herbicides
and fertilizer typically reduces plant diversity to only a few species of grasses. In
contrast, unmowed fields can contain dozens of plant species, including many species of
wildflowers that are not only aesthetically pleasing but also promote a high diversity of
animal species.
• (a) Given that approximately 85 million Americans have a lawn, and that the
average lawn size is 0.08 ha (0.2 acres), how much total land area is composed of
lawns in the United States?
• (b) If every lawn owner set aside 10 percent of his or her lawn and let it grow
into an area of natural wildflowers, how many hectares of this higher-biodiversity
land would be added?
• (c) Given that lawn owners spend a total of $40 billion on professional lawn care
services each year, what would be the annual savings on lawn care services if 10
percent of all lawns were set aside to grow natural wildflowers?
• (d) Approximately 2.2 billion liters (0.6 billion gallons) of gasoline are used
annually for lawn mowers. If gas costs $0.80 per liter ($3.00 per gallon),how many
total dollars could be saved in the United States each year if lawn owners stopped
mowing 10 percent of their lawns?
• (e) What do these data suggest about the economics of preserving biodiversity?
How Should We Prioritize the Protection of Species Diversity? As a result of human activities, we have seen a widespread decline in biodiversity
across the globe. Many people agree that we should try to slow or even stop this
loss. But how do we proceed? Ideally, we might want to preserve all biodiversity. In
reality, preserving biodiversity requires compromises. For example, in order to preserve
the biodiversity of an area,we might have to set aside land that would otherwise be
used for housing developments, shopping malls, or strip mines. If we cannot preserve
all biodiversity, how do we decide which species receive our attention?
In 1988, Oxford University professor Norman Myers noted that much of the world’ s
biodiversity is concentrated in areas that make up a relatively small fraction of the
globe. Part of the reason for this uneven pattern of biodiversity is that so many species
are endemic species. Endemic speciesare species that live in a very small area of the
world and nowhere else, often in isolated locations such as the Hawaiian
Islands. Because they are home to so many endemic species, these isolated areas end
up containing a high proportion of all the species found on Earth. Myers called these
areasbiodiversity hotspots.
Scientists originally identified 10 biodiversity hotspots, including Madagascar,western
Ecuador, and the Philippines. Myers argued that these 10 areas were in need of
immediate conservation attention because human activities there could have
disproportionately large negative effects on the world’ s biodiversity. A year later, the
group Conservation International adopted Myers’ s concept of biodiversity hotspots to
guide its conservation priorities.As of 2010, Conservation International had identified
the 34 biodiversity hotspots shown in FIGURE SA2.1. Although these hotspots
collectively represent only 2.3 percent of the world’ s land area, 50 percent of all plant
species and 42 percent of all vertebrate species are confined to these areas.As a result
of this categorization, major conservation organizations have adjusted their funding
priorities and are spending hundreds of millions of dollars to conserve these
areas. What does environmental science tell us about the hotspot approach to
conserving biodiversity?
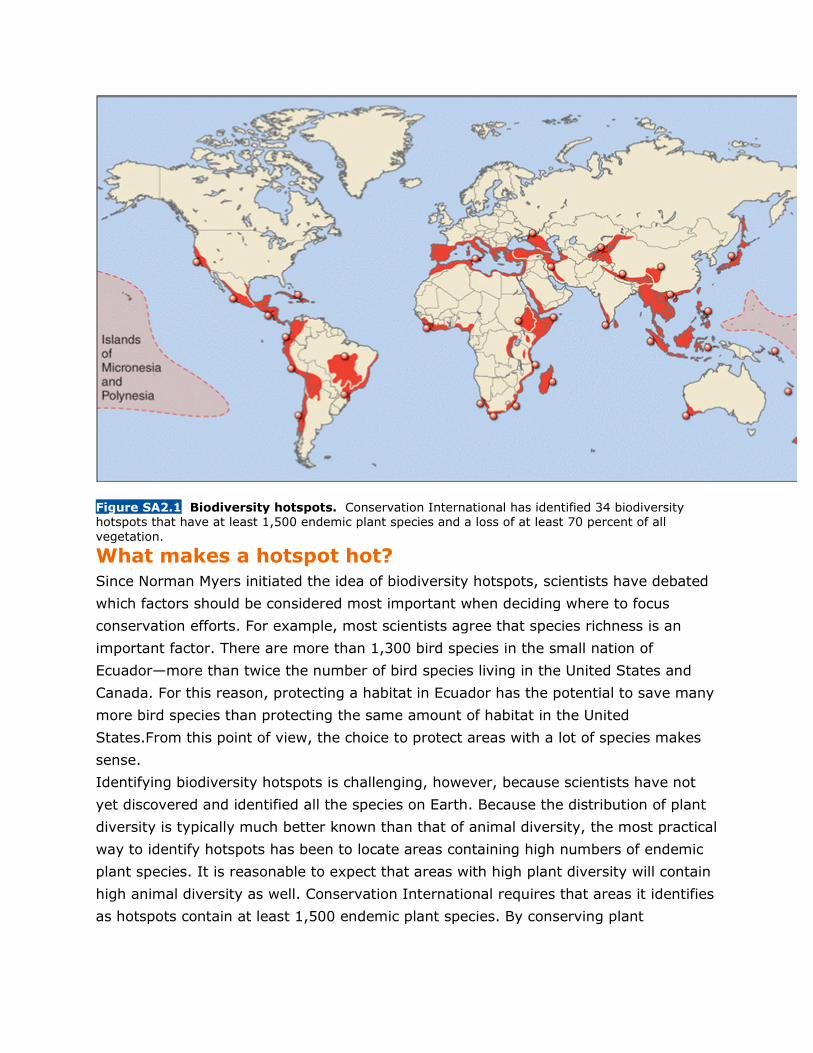
Figure SA2.1 Biodiversity hotspots. Conservation International has identified 34 biodiversity hotspots that have at least 1,500 endemic plant species and a loss of at least 70 percent of all vegetation.
What makes a hotspot hot?
Since Norman Myers initiated the idea of biodiversity hotspots, scientists have debated
which factors should be considered most important when deciding where to focus
conservation efforts. For example, most scientists agree that species richness is an
important factor. There are more than 1,300 bird species in the small nation of
Ecuador—more than twice the number of bird species living in the United States and
Canada. For this reason, protecting a habitat in Ecuador has the potential to save many
more bird species than protecting the same amount of habitat in the United
States.From this point of view, the choice to protect areas with a lot of species makes
sense.
Identifying biodiversity hotspots is challenging, however, because scientists have not
yet discovered and identified all the species on Earth. Because the distribution of plant
diversity is typically much better known than that of animal diversity, the most practical
way to identify hotspots has been to locate areas containing high numbers of endemic
plant species. It is reasonable to expect that areas with high plant diversity will contain
high animal diversity as well. Conservation International requires that areas it identifies
as hotspots contain at least 1,500 endemic plant species. By conserving plant
diversity, the hope is that we will simultaneously conserve animal diversity, especially
for those groups, such as insects, that are poorly cataloged.
In addition to requiring high numbers of endemic plant species, Conservation
International requires its hotspots to have lost more than 70 percent of the vegetation
that contains those endemic plant species. In this way, high-diversity areas with a high
level of habitat loss receive the highest conservation priority. High-diversity areas that
are not being degraded receive lower conservation priority.
What else can make a hotspot hot?
The number of endemic species in an area is undoubtedly important in identifying
biodiversity hotspots, but other scientists have argued that this criterion alone is not
enough. They suggest that we also consider the total number of species in an area or
the number of species currently threatened with extinction in an area. Would all three
approaches identify similar regions of conservation priority? A recent analysis of birds
suggests they would not.When scientists identified bird diversity hotspots using each of
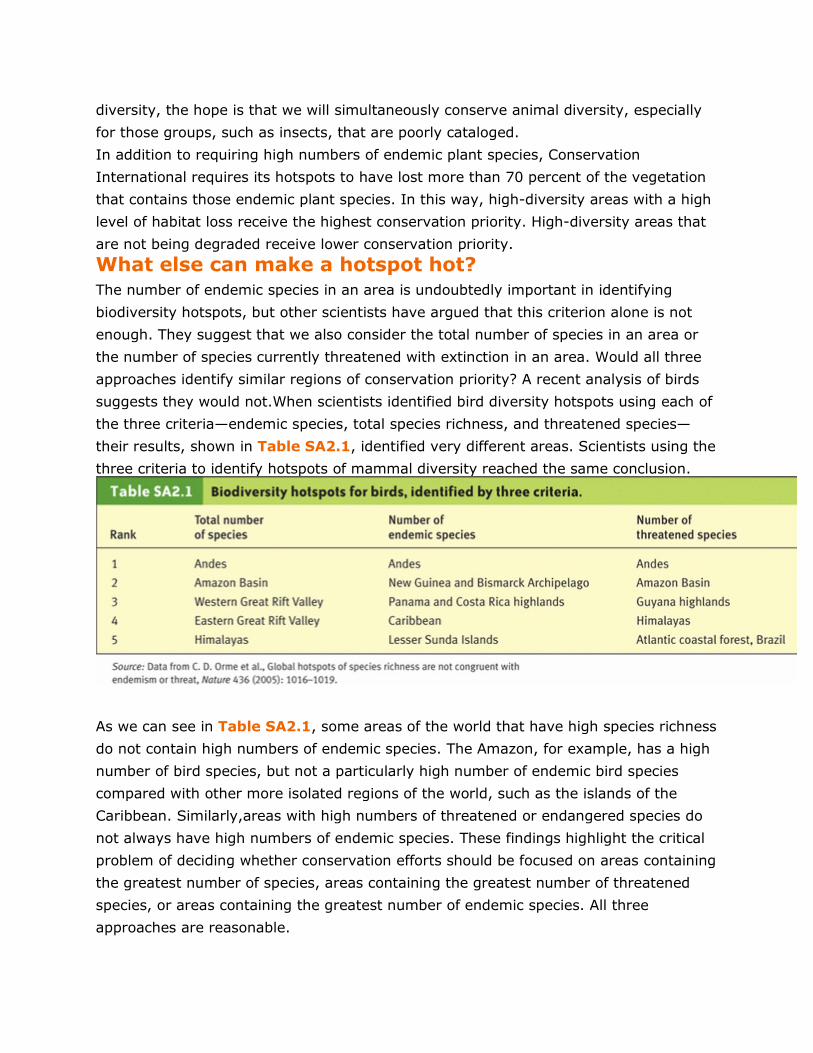
the three criteria—endemic species, total species richness, and threatened species—
their results, shown in Table SA2.1, identified very different areas. Scientists using the
three criteria to identify hotspots of mammal diversity reached the same conclusion.
As we can see in Table SA2.1, some areas of the world that have high species richness
do not contain high numbers of endemic species. The Amazon, for example, has a high
number of bird species, but not a particularly high number of endemic bird species
compared with other more isolated regions of the world, such as the islands of the
Caribbean. Similarly,areas with high numbers of threatened or endangered species do
not always have high numbers of endemic species. These findings highlight the critical
problem of deciding whether conservation efforts should be focused on areas containing
the greatest number of species, areas containing the greatest number of threatened
species, or areas containing the greatest number of endemic species. All three
approaches are reasonable.
In addition to considering species diversity, some scientists have argued that we must
also consider the size of the human population in diverse areas. For example, we might
expect that natural areas containing more people face a greater probability of being
affected by human activities. Furthermore, if we wish to project into the future, we
must consider not only the size of the human population today, but also the expected
size of the human population several decades from now. Scientists have found that
many hotspots for endemic species have human population densities that are well
above the world’ s average. Whereas the world has an average human population
density of 42 people per square kilometer, the average hotspot has a human population
of 73 people per square kilometer. Such places may be at a higher risk of degradation
from human activities. This risk should be incorporated into our choices of priority areas
for conservation, and it should motivate us to promote smarter development that does
not come at the cost of species diversity.
What are the costs and benefits of conserving
biodiversity hotspots?
A focus on regions containing large numbers of species places a clear priority on
preserving the largest number of species within a given region. However,it does not
explicitly consider the likelihood of succeeding in this goal, nor does it consider the
costs associated with the effort. For example, there may be many ways of helping a
species persist in an area, including buying habitat, entering into agreements with
landowners not to develop their land,or removing threats such as invasive species. Each
option will have a different impact on the number of species that will be helped, and
each option will have different costs of implementation. Given the limited funds that are
available for protecting species, it is certainly worth comparing the expected costs and
benefits of different options, both within and among biodiversity hotspots. In this
way, we have the potential to maximize the return on our conservation investment.
What about biodiversity coldspots?
The concept of biodiversity hotspots assumes that our primary goal is to protect the
maximum number of species. That goal is an admirable one, but it could come at the
cost of many important ecosystems that do not fall within hotspots. Yellowstone
National Park, for example, has a relatively low diversity of species, yet it is one of the
few places in the United States that contains remnant populations of large
mammals, including wolves, grizzly bears, and bison. Does this mean that places such
as Yellowstone National Park should receive decreased conservation attention?
Biodiversity coldspots also provide ecosystem services that humans value at least as
much as species diversity. For example, wetlands in the United States are incredibly
important for flood control, water purification, wildlife habitat, and recreation. Many
wetlands, however, have relatively low plant diversity and, as a result, would not be
identified as biodiversity hotspots. It is true that increased species richness leads to
improved ecosystem services,but only as we move from very low species richness to
moderate species richness. Moving from moderate species richness to high species
richness generally does not further improve the functioning of an ecosystem. Since very
high species diversity is not expected to provide any substantial improvement in
ecosystem function, protecting more and more species produces diminishing returns in
terms of protecting ecosystem services.Hence, if our primary goal is to preserve the
functioning of the ecosystems that improve our lives, we do not necessarily need to
preserve every species in those ecosystems.
How can we reach a resolution?
During the past two decades, it has become clear that scientists and policy makers
need to set priorities for the conservation of biodiversity. No single criterion may be
agreed upon by everyone. However, it is important to appreciate the bias of each
approach and to consider the possible unintended consequences of favoring some
geographic regions over others. Our investment in conservation cannot be viewed as an
all-or-nothing choice of some areas over others. Instead, our decisions must take into
account the costs and benefits of alternative conservation strategies and incorporate
current and future threats to both species diversity and ecosystem function.In this
way, we can strike a balance between our desire to preserve Earth’ s species diversity
and our desire to protect the functioning of Earth’ s ecosystems.


![CHAPTER 12ambermillerscience.weebly.com/uploads/2/2/6/7/22677146/chapter_12.… · United States for much of this chapter. 12.1. 2 Patterns of Energy Use in the United States [Notes/Highlighting]](https://img.pdfslide.us/doc/110x75/60565daf3f78b271cb5a68c9/chapter-united-states-for-much-of-this-chapter-121-2-patterns-of-energy-use-in.jpg)


![JJ102 Electrical Technology CHAPTER_5 Tansfomers [Compatibility Mode]](https://img.pdfslide.us/doc/110x75/55cf8f0c550346703b986586/jj102-electrical-technology-chapter5-tansfomers-compatibility-mode.jpg)