Embed Size (px)
Citation preview
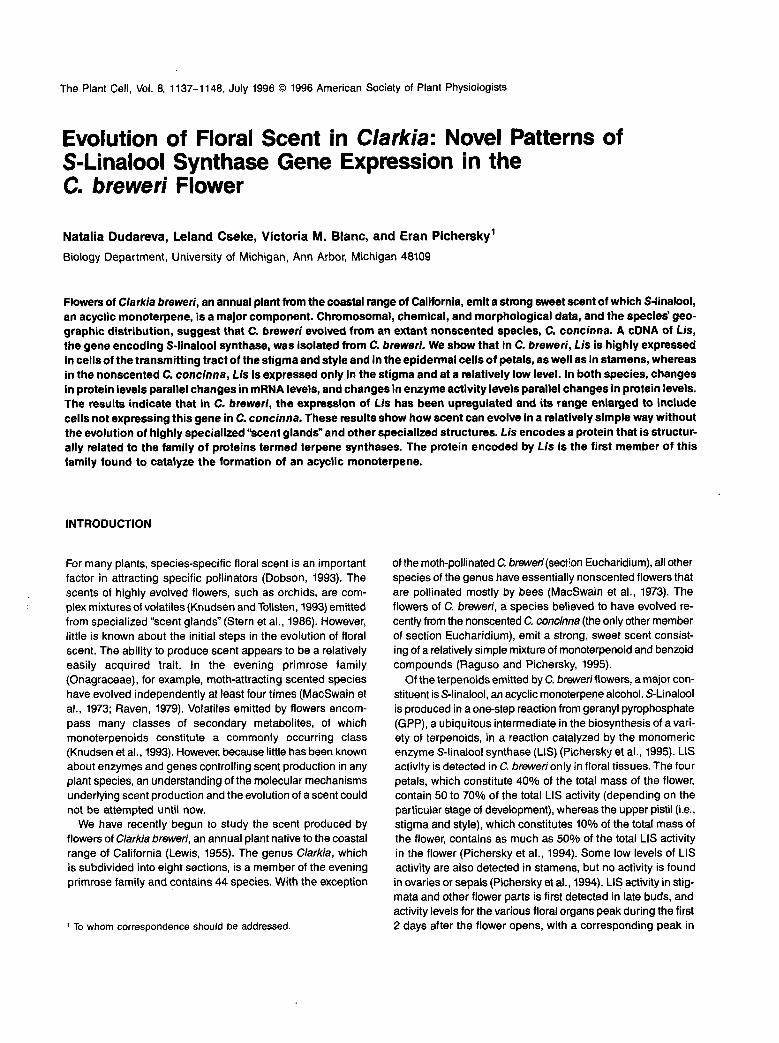
The Plant Cell, Vol. 8, 1137-1 148, July 1996 O 1996 American Society of Plant Physiologists
Evolution of Floral Scent in Clarkia: Nove1 Patterns of S-Linalool Synthase Gene Expression in the C. breweri Flower
Natalia Dudareva, Leland Cseke, Victoria M. Blanc, and Eran Pichersky‘ Biology Department, University of Michigan, Ann Arbor, Michigan 48109
Flowers of Clarkia breweri, an annual plant f” the coastal range of California, emit a strong sweet scent of which S-linalool, an acyclic monoterpene, is a major component. Chromosomal, chemical, and morphological data, and the species’ geo- graphic distribution, suggest that C. breweri evolved from an extant nonscented species, C. concinna. A cDNA of Lis, the gene encoding S-linalool synthase, was isolated from C. breweri. We show that in C. breweri, Lis is highly expressed in cells of the transmitting tract of the stigma and style and in the epidermal cells of petals, as well as in stamens, whereas in the nonscented C. concinna, Lis is expressed only in the stigma and at a relatively low level. In both species, changes in protein levels parallel changes in mRNA levels, and changes in enzyme activity levels parallel changes in protein levels. The results indicate that in C. breweri, the expression of Lis has been upregulated and its range enlarged to include cells not expressing this gene in C. concinna. These results show how scent can evolve in a relatively simple way without the evolution of highly specialized ”scent glands” and other specialized structures. Lis encodes a protein that is structur- ally related to the family of proteins termed terpene synthases. The protein encoded by Lis is the first member of this family found to catalyze the formation of an acyclic monoterpene.
INTRODUCTION
For many plants, species-specific floral scent is an important factor in attracting specific pollinators (Dobson, 1993). The scents of highly evolved flowers, such as orchids, are com- plex mixtures of volatiles (Knudsen and Tollsten, 1993) emitted from specialized “scent glands” (Stern et al., 1986). However, little is known about the initial steps in the evolution of floral scent. The ability to produce scent appears to be a relatively easily acquired trait. In the evening primrose family (Onagraceae), for example, moth-attracting scented species have evolved independently at least four times (MacSwain et al., 1973; Raven, 1979). Volatiles emitted by flowers encom- pass many classes of secondary metabolites, of which monoterpenoids constitute a commonly occurring class (Knudsen et al., 1993). However, because little has been known about enzymes and genes controlling scent production in any plant species, an understanding of the molecular mechanisms underlying scent production and the evolution of a scent could not be attempted until now.
We have recently begun to study the scent produced by flowers of Clarkia braveri, an annual plant native to the coastal range of California (Lewis, 1955). The genus Clarkia, which is subdivided into eight sections, is a member of the evening primrose family and contains 44 species. With the exception
To whom corrsspondence should be addressed.
of the moth-pollinated C. breweri(section Eucharidium), all other species of the genus have essentially nonscented flowers that are pollinated mostly by bees (MacSwain et al., 1973). The flowers of C. breweri, a species believed to have evolved re- cently from the nonscented C. concinna (the only other member of section Eucharidium), emit a strong, sweet scent consist- ing of a relatively simple mixture of monoterpenoid and benzoid compounds (Ragus0 and Pichersky, 1995).
Of the terpenoids emitted by C. breweriflowers, a major con- stituent is S-linalool, an acyclic monoterpene alcohol. S-Linalool is produced in a one-step reaction from geranyl pyrophosphate (GPP), a ubiquitous intermediate in the biosynthesis of a vari- ety of terpenoids, in a reaction catalyzed by the monomeric enzyme S-linalool synthase (LIS) (Pichersky et al., 1995). LIS activity is detected in C. brewerionly in floral tissues. The four petals, which constitute 40% of the total mass of the flower, contain 50 to 70% of the total LIS activity (depending on the particular stage of development), whereas the upper pistil &e., stigma and style), which constitutes 10% of the total mass of the flower, contains as much as 50% of the total LIS activity in the flower (Pichersky et al., 1994). Some low levels of LIS activity are also detected in stamens, but no activity is found in ovaries or sepals (Pichersky et al., 1994). LIS activity in stig- mata and other flower parts is first detected in late buds, and activity levels for the various floral organs peak during the first 2 days after the flower opens, with a corresponding peak in
11 38 The Plant Cell
S-linalool emission (Pichersky et al., 1994). Interestingly, a low level of LIS activity (.US0/o of that found in C. breweri stigmata) was detected in the stigmata of C. concinna (Pichersky et al., 1994).
No specialized scent glands or similar structures have been found in C. breweri(Raguso and Pichersky, 1995). This is con- sistent with the observation that the scent is a newly evolved trait in this species, and specialized structures may not have had time to evolve. Whereas our work cited above showed a large increase in, and a wider distribution of, LIS activity in C. breweri flowers as compared with C, concinna flowers, these observations by themselves did not reveal whether such changes were brought about by changes in the level of Lis gene transcription or by changes at subsequent steps con- trolling gene expression. Nor could it be determined whether all or only some types of cells within a floral organ express the Lis gene. Here, we set out to determine the specific types of cells in the C. breweriflower that express the Lis gene and to identify the specific point(s) of control responsible for the high levels of Lis expression in this species. By comparing the results with those from C. concinna, we may begin to under- stand the initial steps in the evolution of scent in Clarkia.
RESULTS
lsolation and Characterization of C. breweri Lis cDNA Clones
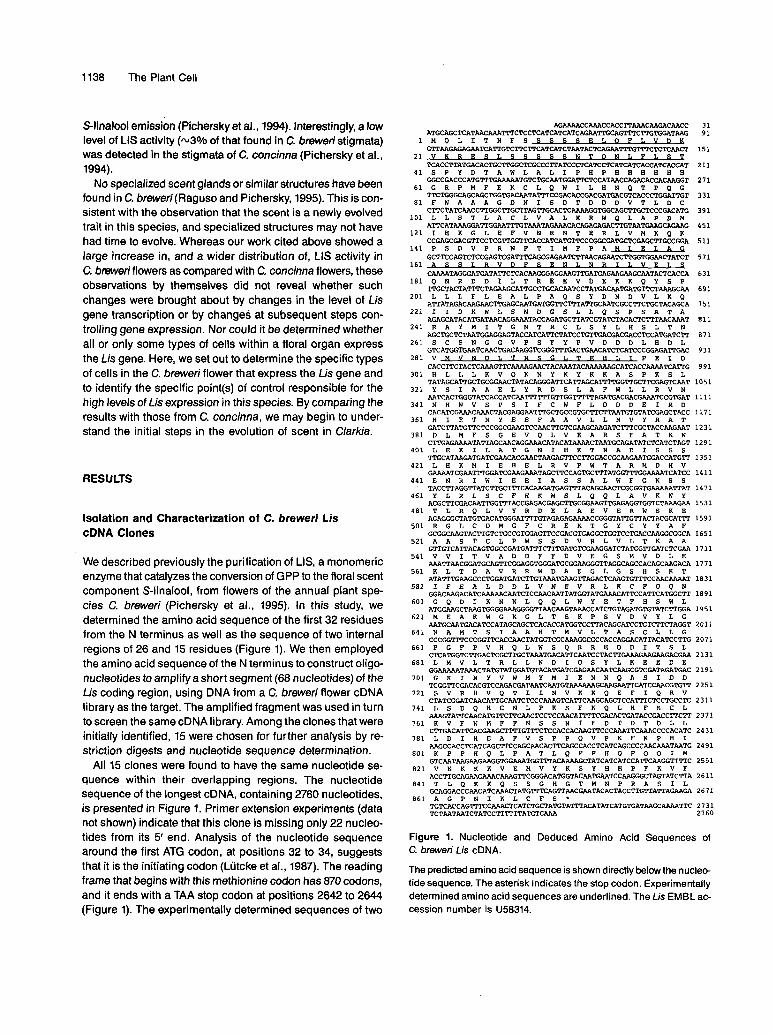
We described previously the purification of LIS, a monomeric enzyme that catalyzes the conversion of GPP to the floral scent component S-linalool, from flowers of the annual plant spe- cies C. breweri (Pichersky et al., 1995). In this study, we determined the amino acid sequence of the first 32 residues from the N terminus as well as the sequence of two interna1 regions of 26 and 15 residues (Figure 1). We then employed the amino acid sequence of the N terminus to construct oligo- nucleotides to amplify a short segment (68 nucleotides) of the Lis coding region, using DNA from a C. breweri flower cDNA library as the target. The amplified fragment was used in turn to screen the same cDNA library. Among the clones that were initially identified, 15 were chosen for further analysis by re- striction digests and nucleotide sequence determination.
All 15 clones were found to have the same nucleotide se- quence within their overlapping regions. The nucleotide sequence of the longest cDNA, containing 2760 nucleotides, is presented in Figure 1. Primer extension experiments (data not shown) indicate that this clone is missing only 22 nucleo- tides from its 5’ end. Analysis of the nucleotide sequence around the first ATG codon, at positions 32 to 34, suggests that it is the initiating codon (Lütcke et al., 1987). The reading frame that begins with this methionine codon has 870 codons, and it ends with a TAA stop codon at positions 2642 to 2644 (Figure 1). The experimentally determined sequences of two
AGRAARCCAAACCACCTTAAAWGAWCC ATGCAGCTCATAACAAATTTCTCCTCATCATCATCAWTTGCAGTTTCTTGTGGATAAG
31 91
1 H Q L I T N F S S S S S E L O F L V D K
2 1 V K R E S L S S S S S N T Q N L F L S Z
4 1 S P Y D T A W L A L I P H P H H H H H H
6 1 G R P H F E K C L Q W I L H N Q T P Q G
8 1 F W A A A G D N I S D T D D D V T L D C
GTTAAGAGAGAATCA1TGTCTTCTTCATCATCTAATAC~GAATTTG1TTCTCTCAACT 151
~ C C T T A T G A C A C T T T A ~ ~ ~ T C A ~ ~ C C A T C A C C A T z 1 i
GGCCGACCCATGTTTGGTC%CAATGGATTCTCCATAACCAGACACCACAAGGT 271
TTCTGGGCAGCAGCTGGTGACAATATTTCCGACACCGACGATGACGTCACCCTGGATTGT 331
C T T C T A T C A P I C C T T G G C T T G C T T ~ ~ C ~ G G ~ G C T T G C T C C C G A C A T G 3 9 1 1 O l L L S T L A C L V A L K R W Q L A P D M
1 2 1 I H K G L E F V N R N T E R L V H K Q K
1 4 1 P S D V P R W F T I M F P A H L E L A G
A T T U \ T ~ G G A ~ G A A T T n ; T m T A G A A A C A C R G A W L G 4 5 1
CCGAGCGACGTTCCTCGTTGGTTCACCATCATGTTCCCGGCGATGCTCGAGCTTGCCGGA 511
GCTTCCAGTCTCCGAGTCGATTTCAGCGAGAATCTTAACAGAA~~E~TGGAACTATCT 1 6 1 A S S L R V D F S E N L N R I L V E L S
1 8 l Q N R D D I L T R E E V D E K K Q Y S P
2 0 1 L L L F L E A L P A Q S Y D N D V L K Q
Z Z I I I D K N L S N D G S L L Q S P S A T A
2 4 1 R A Y M I T G N T R C L S Y L H S L T N
2 6 1 S C S N G G V P S F Y P V D D D L H D L
281 V H V N D L T R S G L T E H L I P E I D
CAAAATAU;GATGATATTCTCACAAGGGAGG~~~~GAAGCAATACTCACCA
TTGCTACTATTTCTAGAAGCATTGCCTGCACI\ATCCTATGACAATGATGTTCTAAAGCAA
A T T A T A G A C A A G R A C T T G A G C A A T G A ~ ~ C T T T A T T G C A
AGAGCATACATGATAACAGGAAATACCAGATGCTTATCGTATCTACACTCTlTAACAAAT
AGCTGCTCTAATGGAGGAGTACCATCATTCTATCCTGTTGACGACGACCTCCATGATCTT
GTCATGGTGAATCAACTGACAAGGTCGGGTTTGACTGAACATCTCATCCCGGAGATTGAC
571
631
691
751
811
871
931
C A C C T T C T A C T C A R A G T T C A T A C m T A C A A A T R C A R A R 991
TATAGCATTGCTGCGGAACTATACAGGGATTCATTAGCATTTIGGTTGCTTCGAGTCAAT 1051
AATCACTGGGTATCACCATCTlTTlTGTIGGTTMTAGATGACGACGAAATCCGTGAT 1111
CACATCGAUCAAACTACGAGGAATTTGCTGCCGTGCTTCTTAATGTGTATCGAGCTACC 1171
G A T C T T A T G T T C T C C G G C G A A G T C C A A C T T G T C G A A G C R R 1231
3 0 1 H L L L K V Q K N Y K Y K K A S P K S L
3 2 1 Y S I A A E L Y R D S L A F W L L R V N
3 4 1 N H W V S P S I F C W F L D D D E I R D
3 6 l H I E T N Y E E F A A V L L N V Y R A T
381
401
421
441
461
481
501
521
541
561
581
601
621
641
661
681
701
1291
1351
1411
1471
1531
1591
1651
1711
1771
ATATGTGAAGCCCTGGATGATCTTGTAAATGAAGTTAGACTCAAGTGTITCCAACAUAT 1831 I F E A L D D L V N E V R L K C F Q Q N
G Q D I K N N L Q Q L W Y E T F H S W L
M E A K W G K G L T S K P S V D V Y L G
N A M T S I A A H T H V L T A S C L L G
P G F P V H Q L W S Q R R H Q D I T S L
L H V L T R L L N D I Q S Y L K E E D E
G K I N Y V W H Y H I E N N Q A S I D D
GGACAAGACATCAAAAACAATCTCCAACAATTATGGTAVZAAACATTCCATTCATGGCTI 1891
ATGGAAGCTAAGTGGGGGTTAACAAGTAAACCATCTGTAGATGTGTATCTTGGA 1951
AATGCAATGACATCCATAGCAGCTCACACCATGGWCTTACAGCATCC%TCTTCTAGGT 2011
CCCGGTTTCCCGGTTCACCAACTATGGTCGCAAAGGCGCCACCAGGACATTACATCCTTG 2071
CTCATGGTCTTGACTCGCTTCTAAATWLULTTCAATCCTACTTGAMGAAGAAGACGAA 2131
GGAAAAATAAACTATGTATGGATGTACATGATCGAGAACAATCAAGCGTCGATAGATGAC 2191
TCGGTTCGACACGTCCAGACGATAATCAATGTAAAAAAGCAAGAATTCATCCAACGTGTT 2251
2311
2371
2431
2491
2551
2611
2671
TGTCACCAGTTTCCAAACTCATCTGCTATGTATTTACATATCATGTGATAAGCAA4ATTC 2731 TCTAATAATCTATCCTTTTTTATGTCAAA 2760
Figure 1. Nucleotide and Deduced Amino Acid Sequences of C. breweri Lis cDNA.
The predicted amino acid sequence is shown directly below the nucleo- tide sequence. The asterisk indicates the stop codon. Experimentally determined amino acid sequences are underlined. The Lis EMBL ac- cession number is U58314.
Lis Expression in Clarkia Flowers 11 39
internal peptides of the purified LIS protein, as well as its N-terminal sequence, are found within this open reading frame (Figure l), verifying its identity as a Lis cDNA. The results of DNA gel blots suggest that Lis is a single-copy gene in both C. breweri and C. concinna (data not shown).
The open reading frame of Lis contains eight additional amino acids at the N terminus compared with the N-terminal sequence of the purified protein, indicating either that LIS un- dergoes a proteolytic processing event in the cell or that cleavage of the protein occurs during the purification proce- dure. The calculated molecular mass of the precursor protein encoded by the Lis cDNA is 99.7 kD. The molecular weight of the native, monomeric LIS protein was previously determined
A
L I S LMS VES EAS CAS
L I S LMS VES EAS CAS
B
L I S GA1 Anl
LIS GA1 An 1
L I S G A l An 1
by severa1 methods to be in the range of 73 to 90 kD (Pichersky et al., 1995; L. Cseke and E. Pichersky, unpublished data). The discrepancy between the calculated and experimentally determined molecular mass is probably due partly to the eight residues missing from the N terminus and partly to the appar- ently tight packing of the native protein, which contains 16 cysteine residues. Evidence for internal disulfide bridges in the LIS protein has been described by Pichersky et al. (1995).
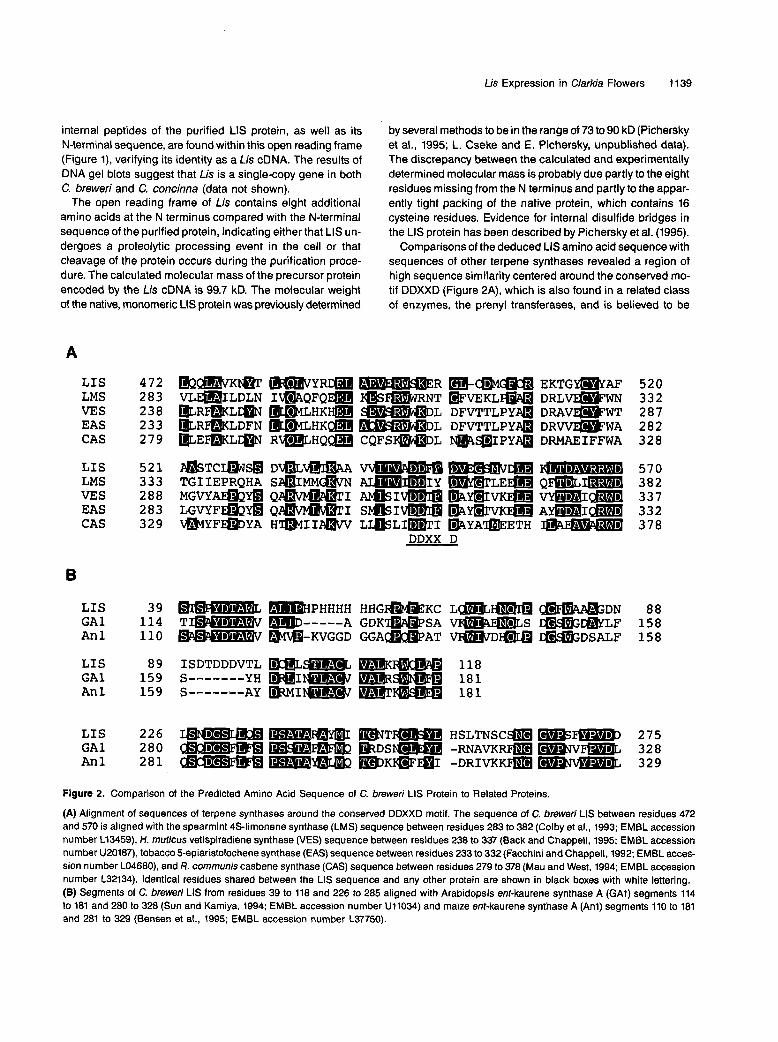
Comparisons of the deduced LIS amino acid sequence with sequences of other terpene synthases revealed a region of high sequence similarity centered around the conserved mo- tif DDXXD (Figure 2A), which is also found in a related class of enzymes, the prenyl transferases, and is believed to be
472 m m m m Y R m -R A E K T G m A F 520 2 8 3 V L ~ I L D L N I ~ Q F Q ~ I@S-NT ~ V E K L - DRL-WN 332 238 E R ~ L ~ - H K ~ -L D F V T T L P Y ~ D R A V E ~ F W T 287 2 3 3 E R ~ L D F N - H K ~ -L A D F V T T L P Y ~ DRW-WA 282 279 B E - L m R m H Q m CQFS-L m g I P Y 4 DRMAEIFFWA 328
5 2 1 P&TCmSH D l , @ L W B B B m a $ ] 570 333 TGIIEPRQHA SdIMMdhrN a m L E m Q - m 382 288 M G V Y m a Q-I -1- V-1- 337 2 8 3 L G V Y F m a Q-I S m I - mmm A-1- 332 329 m Y F m Y A HmIIW L I & L I m I DYA-ETH 378
DDXX D
Figure 2. Comparison of the Predicted Amino Acid Sequence of C. breweri LIS Protein to Related Proteins.
(A) Alignment of sequences of terpene synthases around the conserved DDXXD motif. The sequence of C. breweri LIS between residues 472 and 570 is aligned with the spearmint 4s-limonene synthase (LMS) sequence between residues 283 to 382 (Colby et al., 1993; EMBL accession number L13459), H. muficos vetispiradiens synthase (VES) sequence betwsen residues 238 to 337 (Back and Chappell, 1995; EMBL accession number U20187), tobacco 5-epiaristolochene synthase (EAS) sequence between residues 233 to 332 (Facchini and Chappell, 1992; EMBL acces- sion number L04680), and R. communis casbene synthase (CAS) sequence between residues 279 to 378 (Mau and West, 1994; EMBL accession number L32134). ldentical residues shared between the LIS sequence and any other protein are shown in black boxes with white lettering. (E) Ssgments of C. brewefi LIS from residues 39 to 118 and 226 to 285 aligned with Arabidopsis ent-kaurene synthase A (GAI) segments 114 to 181 and 280 to 328 (Sun and Kamiya, 1994; EMBL accession number U11034) and maize ent-kaurene synthase A (Anl) segments 110 to 181 and 281 to 329 (Bensen et al., 1995; EMBL accession number L37750).
1140 The Plant Cell
involved in the binding of the divalent metal cofactor (Tarshiset al., 1994). The overall sequence identity of this region inthe C. brewer; LIS with the spearmint 4S-limonene synthaseis 31%; with Hyoscyamus muticus vetispiradiene synthase, itis 34%; with tobacco 5-epiaristolochene synthase, it is 33%;and with Ricinus communis casbene synthase, it is 27%. Whenconservative substitutions are considered, the overall se-quence similarity of LIS with any of these terpene synthasesis ^60%. LIS does not share significant sequence similaritywith known prenyl transferase sequences.
enf-Kaurene synthase A, an enzyme in the gibberellin path-way that catalyzes the cyclization of a diterpene without theremoval of the pyrophosphate group, shows some similaritywith other terpene synthases but lacks the DDXXD motif (Sunand Kamiya, 1994; Bensen et al., 1995). LIS also displays somesequence identity with enf-kaurene synthase A (Figure 2B).The two segments with the highest similarity, residues 39 to118 and 226 to 275 of LIS, show 41 and 51% identity toArabidopsis enf-kaurene synthase A residues 114 to 181 and280 to 328, respectively, and 39 and 53% to maize enf-kaurenesynthase A residues 110 to 181 and 281 to 329, respectively.Incidentally, the two enf-kaurene A synthases are the only avail-able examples of two sequences of the same terpene synthasefrom two different species, and in the segments comparedabove, they show 58 and 71% sequence identity, respectively,with each other.
Tissue-Specific Expression of Lis
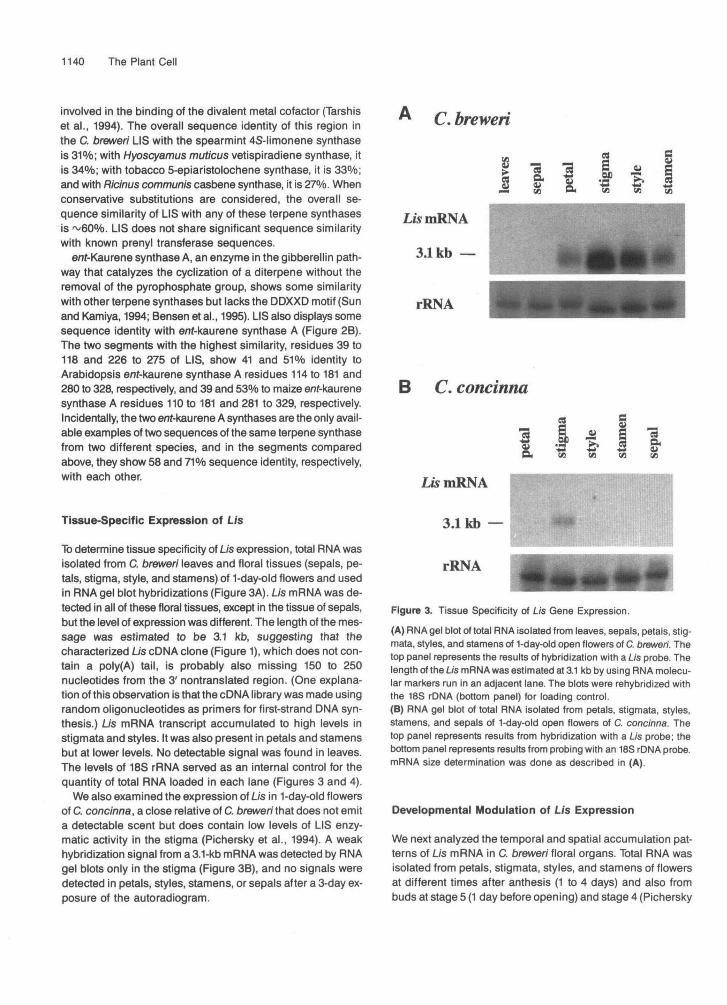
To determine tissue specificity of Lis expression, total RNA wasisolated from C. brewer/ leaves and floral tissues (sepals, pe-tals, stigma, style, and stamens) of 1-day-old flowers and usedin RNA gel blot hybridizations (Figure 3A). Lis mRNA was de-tected in all of these floral tissues, except in the tissue of sepals,but the level of expression was different. The length of the mes-sage was estimated to be 3.1 kb, suggesting that thecharacterized Lis cDNA clone (Figure 1), which does not con-tain a poly(A) tail, is probably also missing 150 to 250nucleotides from the 3' nontranslated region. (One explana-tion of this observation is that the cDNA library was made usingrandom oligonucleotides as primers for first-strand DMA syn-thesis.) Lis mRNA transcript accumulated to high levels instigmata and styles. It was also present in petals and stamensbut at lower levels. No detectable signal was found in leaves.The levels of 18S rRNA served as an internal control for thequantity of total RNA loaded in each lane (Figures 3 and 4).
We also examined the expression of Lis in 1-day-old flowersof C. concinna, a close relative of C. breweri that does not emita detectable scent but does contain low levels of LIS enzy-matic activity in the stigma (Pichersky et al., 1994). A weakhybridization signal from a 3.1-kb mRNA was detected by RNAgel blots only in the stigma (Figure 3B), and no signals weredetected in petals, styles, stamens, or sepals after a 3-day ex-posure of the autoradiogram.
C. breweri
Lis mRNA
3.1kb —
rRNA
B C. concinna
£• aO9 09
rRNA
Figure 3. Tissue Specificity of Lis Gene Expression.(A) RNA gel blot of total RNA isolated from leaves, sepals, petals, stig-mata, styles, and stamens of 1-day-old open flowers of C. breweri. Thetop panel represents the results of hybridization with a Lis probe. Thelength of the Lis mRNA was estimated at 3.1 kb by using RNA molecu-lar markers run in an adjacent lane. The blots were rehybridized withthe 18S rDNA (bottom panel) for loading control.(B) RNA gel blot of total RNA isolated from petals, stigmata, styles,stamens, and sepals of 1-day-old open flowers of C. concinna. Thetop panel represents results from hybridization with a Lis probe; thebottom panel represents results from probing with an 18S rDNA probe.mRNA size determination was done as described in (A).
Developmental Modulation of Lis Expression
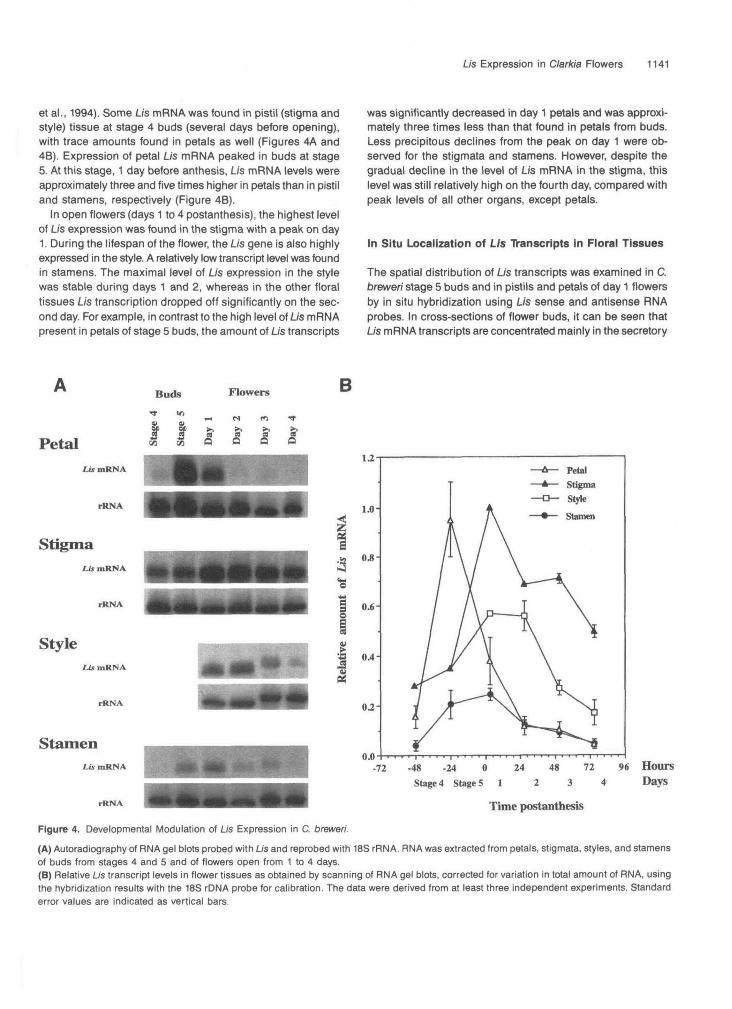
We next analyzed the temporal and spatial accumulation pat-terns of Lis mRNA in C. breweri floral organs. Total RNA wasisolated from petals, stigmata, styles, and stamens of flowersat different times after anthesis (1 to 4 days) and also frombuds at stage 5 (1 day before opening) and stage 4 (Pichersky
LJs Expression in Clarkia Flowers 1141
et al., 1994). Some Lis mRNA was found in pistil (stigma andstyle) tissue at stage 4 buds (several days before opening),with trace amounts found in petals as well (Figures 4A and46). Expression of petal Lis mRNA peaked in buds at stage5. At this stage, 1 day before anthesis, Lis mRNA levels wereapproximately three and five times higher in petals than in pistiland stamens, respectively (Figure 4B).
In open flowers (days 1 to 4 postanthesis), the highest levelof Lis expression was found in the stigma with a peak on day1. During the lifespan of the flower, the Lis gene is also highlyexpressed in the style. A relatively low transcript level was foundin stamens. The maximal level of Lis expression in the stylewas stable during days 1 and 2, whereas in the other floraltissues Lis transcription dropped off significantly on the sec-ond day. For example, in contrast to the high level of LJs mRNApresent in petals of stage 5 buds, the amount of Lis transcripts
was significantly decreased in day 1 petals and was approxi-mately three times less than that found in petals from buds.Less precipitous declines from the peak on day 1 were ob-served for the stigmata and stamens. However, despite thegradual decline in the level of Lis mRNA in the stigma, thislevel was still relatively high on the fourth day, compared withpeak levels of all other organs, except petals.
In Situ Localization of Lis Transcripts in Floral Tissues
The spatial distribution of Lis transcripts was examined in C.brewer/ stage 5 buds and in pistils and petals of day 1 flowersby in situ hybridization using Lis sense and antisense RNAprobes. In cross-sections of flower buds, it can be seen thatLis mRNA transcripts are concentrated mainly in the secretory
Buds Flowers B
Petal Ifen
O •«
£wmRNA
rRNA
StigmaLt! mRNA
rRNA
StyleLismKNA
1.0-
0.8-
§ 0.6o
0.4
0.2
StamenLis mRNA ^̂ ^̂ ^̂ ^̂ ^̂ ^̂ ^̂ ^̂ ^̂ H .72
0.0-48 -24 0
Stage 4 Stage 524 48 72 96 HoUTS
2 3 4 Days
Time postanthesis
Figure 4. Developmental Modulation of Us Expression in C. brewer/.(A) Autoradiography of RNA gel blots probed with LJs and reprobed with 18S rRNA. RNA was extracted from petals, stigmata, styles, and stamensof buds from stages 4 and 5 and of flowers open from 1 to 4 days.(B) Relative Us transcript levels in flower tissues as obtained by scanning of RNA gel blots, corrected for variation in total amount of RNA, usingthe hybridization results with the 18S rDNA probe for calibration. The data were derived from at least three independent experiments. Standarderror values are indicated as vertical bars.
1142 The Plant Cell
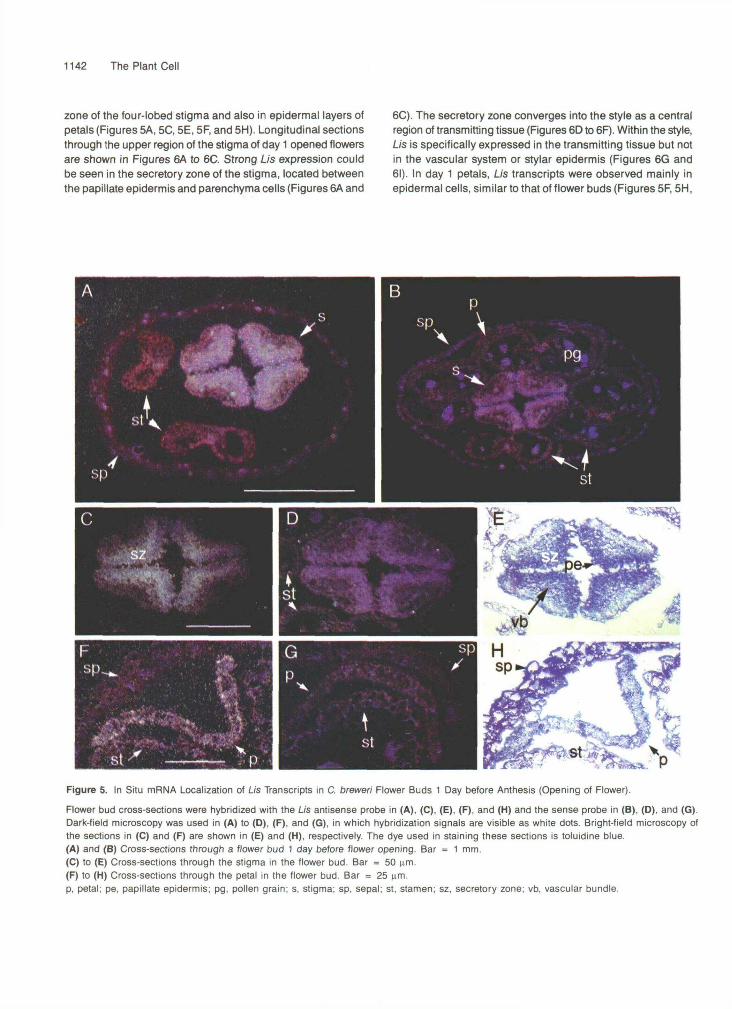
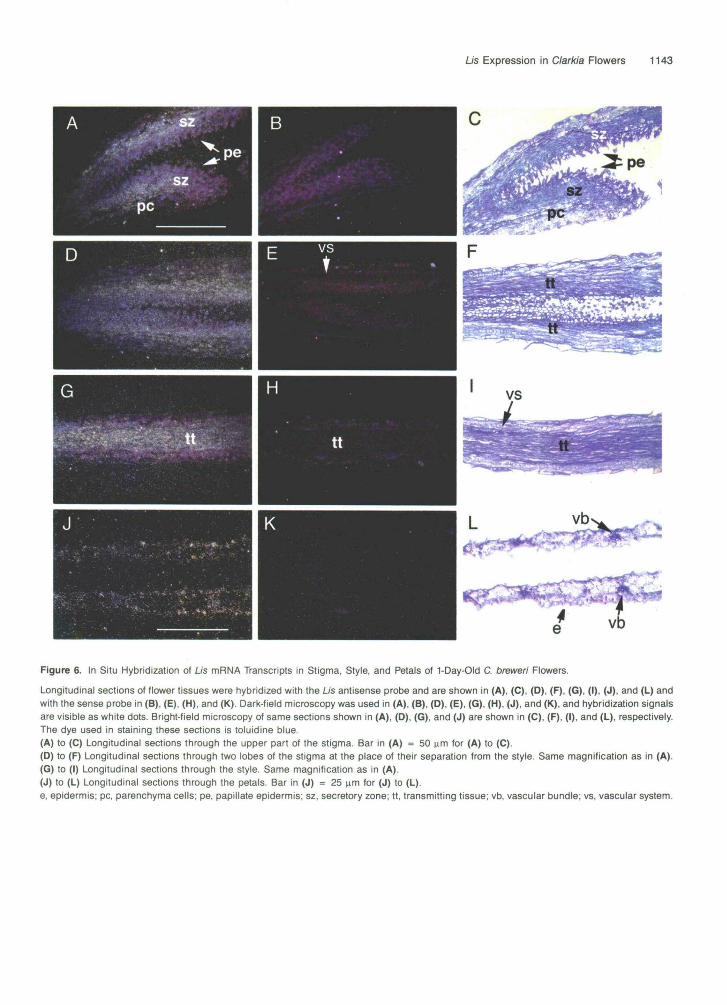
zone of the four-lobed stigma and also in epidermal layers ofpetals (Figures 5A, 5C, 5E, 5F, and 5H). Longitudinal sectionsthrough the upper region of the stigma of day 1 opened flowersare shown in Figures 6A to 6C. Strong Us expression couldbe seen in the secretory zone of the stigma, located betweenthe papillate epidermis and parenchyma cells (Figures 6A and
6C). The secretory zone converges into the style as a centralregion of transmitting tissue (Figures 6D to 6F). Within the style,Us is specifically expressed in the transmitting tissue but notin the vascular system or stylar epidermis (Figures 6G and61). In day 1 petals, Us transcripts were observed mainly inepidermal cells, similar to that of flower buds (Figures 5F, 5H,
Figure 5. In Situ mRNA Localization of Lis Transcripts in C. breweri Flower Buds 1 Day before Anthesis (Opening of Flower).
Flower bud cross-sections were hybridized with the Lis antisense probe in (A), (C), (E), (F), and (H) and the sense probe in (B), (D), and (G).Dark-field microscopy was used in (A) to (D), (F), and (G), in which hybridization signals are visible as white dots. Bright-field microscopy ofthe sections in (C) and (F) are shown in (E) and (H), respectively. The dye used in staining these sections is toluidine blue.(A) and (B) Cross-sections through a flower bud 1 day before flower opening. Bar = 1 mm.(C) to (E) Cross-sections through the stigma in the flower bud. Bar = 50 urn.(F) to (H) Cross-sections through the petal in the flower bud. Bar = 25 urn.p, petal; pe, papillate epidermis; pg, pollen grain; s, stigma; sp, sepal; st, stamen; sz, secretory zone; vb, vascular bundle.
Lis Expression in Clarkia Flowers 1143
e vb
Figure 6. In Situ Hybridization of Lis mRNA Transcripts in Stigma, Style, and Petals of 1-Day-Old C. brewer! Flowers.
Longitudinal sections of flower tissues were hybridized with the Lis antisense probe and are shown in (A), (C), (D), (F), (G), (I), (J), and (L) andwith the sense probe in (B), (E), (H), and (K). Dark-field microscopy was used in (A), (B), (D), (E), (G), (H), (J), and (K), and hybridization signalsare visible as white dots. Bright-field microscopy of same sections shown in (A), (D), (G), and (J) are shown in (C), (F), (I), and (L), respectively.The dye used in staining these sections is toluidine blue.(A) to (C) Longitudinal sections through the upper part of the stigma. Bar in (A) = 50 urn for (A) to (C).(D) to (F) Longitudinal sections through two lobes of the stigma at the place of their separation from the style. Same magnification as in (A).(G) to (I) Longitudinal sections through the style. Same magnification as in (A).(J) to (L) Longitudinal sections through the petals. Bar in (J) = 25 urn for (J) to (L).e, epidermis; pc, parenchyma cells; pe, papillate epidermis; sz, secretory zone; tt, transmitting tissue; vb, vascular bundle; vs, vascular system.
1144 The Plant Cell
6J, and 6L). No hybridization was detected when sense UsRNA was used as a probe (Figures 5B, 5D, and 5G, and 6B,6E, 6H, and 6K).
Developmental Modulations In the Levels of LISProtein in Floral Tissue
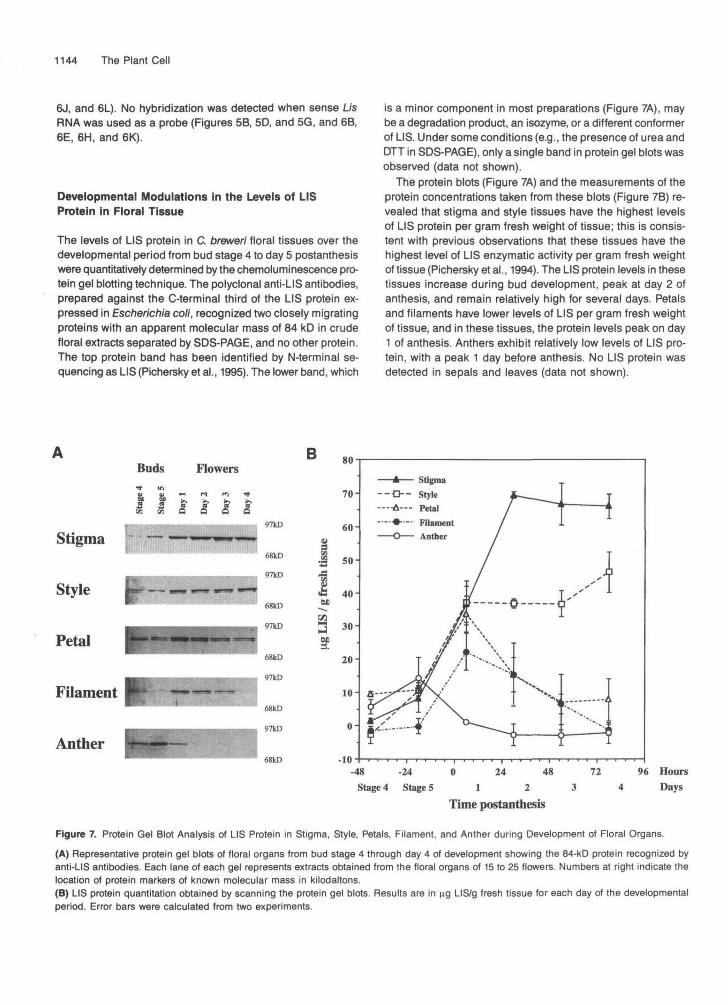
The levels of LIS protein in C. breweri floral tissues over thedevelopmental period from bud stage 4 to day 5 postanthesiswere quantitatively determined by the chemoluminescence pro-tein gel blotting technique. The polyclonal anti-LIS antibodies,prepared against the C-terminal third of the LIS protein ex-pressed in Escherichia coli, recognized two closely migratingproteins with an apparent molecular mass of 84 kD in crudefloral extracts separated by SDS-PAGE, and no other protein.The top protein band has been identified by N-terminal se-quencing as LIS (Pichersky et al., 1995). The lower band, which
is a minor component in most preparations (Figure 7A), maybe a degradation product, an isozyme, or a different conformerof LIS. Under some conditions (e.g., the presence of urea andDTT in SDS-PAGE), only a single band in protein gel blots wasobserved (data not shown).
The protein blots (Figure 7A) and the measurements of theprotein concentrations taken from these blots (Figure 7B) re-vealed that stigma and style tissues have the highest levelsof LIS protein per gram fresh weight of tissue; this is consis-tent with previous observations that these tissues have thehighest level of LIS enzymatic activity per gram fresh weightof tissue (Pichersky et al., 1994). The LIS protein levels in thesetissues increase during bud development, peak at day 2 ofanthesis, and remain relatively high for several days. Petalsand filaments have lower levels of LIS per gram fresh weightof tissue, and in these tissues, the protein levels peak on day1 of anthesis. Anthers exhibit relatively low levels of LIS pro-tein, with a peak 1 day before anthesis. No LIS protein wasdetected in sepals and leaves (data not shown).
BBuds Flowers
I I I I I I97kD
OJD
Anther68kD
80
70-
60-
40-
30-
20-
10-
0-
-100 24-48 -24
Stage 4 Stages 1 2Time postanthesis
48 72 96 Hours3 4 Days
Figure 7. Protein Gel Blot Analysis of LIS Protein in Stigma, Style, Petals, Filament, and Anther during Development of Floral Organs.
(A) Representative protein gel blots of floral organs from bud stage 4 through day 4 of development showing the 84-kD protein recognized byanti-LIS antibodies. Each lane of each gel represents extracts obtained from the floral organs of 15 to 25 flowers. Numbers at right indicate thelocation of protein markers of known molecular mass in kilodaltons.(B) LIS protein quantitation obtained by scanning the protein gel blots. Results are in ng LIS/g fresh tissue for each day of the developmentalperiod. Error bars were calculated from two experiments.
Lis Expression in Clarkia Flowers 11 45
DlSCUSSlON
Linalool Synthase 1s a Member of the Terpene Synthase Protein Family
All terpene synthases bind a terpene precursor that contains a pyrophosphate group, whether it be GPP (monoterpene syn- thases; e.g., limonene synthase), Farnesyl pyrophosphate (sesquiterpene synthases; e.g., vetispiradiene synthase and 5-epiaristolochene synthase), or geranylgeranyl pyrophosphate (diterpene synthases; e.g., casbene synthase). With the ex- ception of LIS, which catalyzes the synthesis of the acyclic monoterpene S-linalml, all terpene synthases whose sequence is currently known catalyze a reaction that results in a cyclic product. ent-Kaurene synthase A is another exception in this group because although it produces a cyclic product, copalyl pyrophosphate, this product still contains the pyrophosphate group, whereas all other products resulting from the catalysis by this group of enzymes-S-linalool, limonene, 5-epiaris- tolochene, vetispiradiene, and casbene- have lost the pyrophosphate group.
Previous investigations have shown that the sequence similarity between different terpene cyclases is not especially high (ranging from 31 to 42%). However, a region that con- tains the sequence DDXXD has been noted before (Mau and West, 1994; Chappell, 1995; McGarvey and Croteau, 1995) to be more highly conserved in all plant terpene synthases, with the exception of ent-kaurene synthase A. It is difficult to as- sess the overall sequence similarity between C. breweri LIS and the terpene cyclases because LIS is a much larger pro- tein (870 residues compared with 550 to 600 residues). Our data show that although the amino acid sequence of LIS has low (but statistically significant) overall sequence identity with terpene synthases, several regions show higher levels of iden- tity. In particular, a region of 4 0 0 residues that contains the motif DDXXD shows 27 to 34% sequence identity with the cor- responding region in other terpene synthases, and when conservative substitutions are equated, the overall sequence similarity in this region is ~ 6 0 % (Figure 2A). Because this re- gion is not conserved in ent-kaurene synthase A, perhaps its significance lies not in the cyclization step but rather in the interaction with and the removal of the pyrophosphate group, possibly mediated by the divalent metal cofactor which the DDXXD motif has been hypothesized to bind (Tarshis et al., 1994; Chappell, 1995; McGarvey and Croteau, 1995).
Although ent-kaurene synthase A lacks the DDXXD motif and the rest of the conserved region around it, two other seg- ments in this protein show high sequence similarity with LIS (Figure 28). Although the significance of these two segments is not known, they are located close to the N terminus, a re- gion in both LIS and ent-kaurene synthase A that shows no sequence similarity to other terpene cylcases. ent-Kaurene syn- thase A is, like LIS, a larger protein (ent-kaurene A has 802 residues), and the additional amino acid sequence in these two enzymes, compared with other terpene synthases, appears
to have been added to the N-terminal region. In summary, the LIS protein sequence appears to be a composite of sequences found in at least two types of terpene synthases. A more pre- cise delineation of its evolution must await the characterization of additional sequences of terpene synthases.
Emission of S-Linalool from C. breweri Flowers 1s Regulated at the Nucleic Acid Leve1
C. breweri flowers emita strong scent, of which S-linalool and one of its oxides are major components (Raguso and Pichersky, 1995). We have shown previously that LIS activity is found in several parts of the C. breweri flower, whereas in C. concinna, a scentless close relative from which C. breweri arose (Raguso and Pichersky, 1995), low levels of LIS activity could only be found in the stigma (3% of that found in the stigma of C. breweri; Pichersky et al., 1994). The LIS activity levels determined by Pichersky et al. (1994) show strong positive correlation with the level of LIS protein in a given tissue (Figure 7), suggesting that differences in LIS activity in different tissues and at different stages of developnient are due primarily to changes in amounts of LIS protein and not to post-translational modification.
The data presented in this report also show that the level of LIS protein is tightly correlated with the steady state levels of Lis mRNA in C. breweri (Figures 4 and 7). This is also true in C. concinna, where the level of Lis mRNA in the stigma is very low (Figure 36) and the amount of LIS protein is so low that it cannot be detected by the protein gel blotting technique (data not shown). In addition, our data show that there is a lag time of 4 day between the peak levels of mRNA and the peak levels of LIS protein in peta1 and stigma tissues but not in styles and anthers.
Nove1 Expression Patterns of Lis in Floral Cells of C. breweri
60th C. concinna and C. breweri show Lis expression in the stigma, suggesting that this is an ancestral condition. It has been shown previously (Pichersky et al., 1994; Raguso and Pichersky, 1995) that the expression of LIS in the stigma of C. breweri leads to the emission of linalml oxides, not S-linalool. Linalool oxides are produced from S-linalool via an additional enzymatic step(s), and they also serve as pollinator attractants in C. bmefi(Raguso and Pichersky, 1995; Raguso et al., 1996). However, in C. concinna stigmata, the levels of the S-linalool and linalool oxides produced are very low, and they do not seem to serve to attract pollinators (Raguso et al., 1995). Thus, the function of Lis expression in the stigma of C. concinna is still obscured.
The most significant observation concerning the expression of Lis in C. breweri is that in addition to being upregulated sig- nificantly in the stigma compared with C. concinna, Lis is also expressed in other types of floral tissues such as styles, fila- ments, and petals. Up to 70% of the total LIS activity in the
13 46 The Plant Cell
C. breweri flower is found in the petals, which are the major Source of emitted S-linalool (Pichersky et al., 1994; Raguso and Pichersky, 1995). The in situ RNA hybridization experi- ments (Figures 5 and 6) show that Lis is expressed in petals preferentially in epidermal cells, leading to the production of water-insoluble S-linalool on the surface of the petals, a posi- tion from which it can most easily escape into the atmosphere. Thus, it appears that C. breweri has evolved its ability to emit large amounts of S-linalool simply by highly expressing Lis in the epidermal cells of the petals, without the concomitant de- velopment of specialized ”scent glands,” as has been found in some other plants such as orchids (Stern et al., 1986). Be- cause the petals of C. breweri emit additional scent volatiles (benzyl acetate is another major component), it would be of interest to examine whether the mechanisms responsible for their production and emission have evolved in ways similar to those governing the production and emission of S-linalool. It would also be interesting to determine whether C. breweri has evolved concomitantly a reward system, such as produc- ing nectar of appropriate composition and suitable for the moth pollinator.
METHODS
Protein Sequencing
We previously reported the purification of linalool synthase from stig mata of Clarkia breweri flowers (Pichersky et al., 1995). The purified S-linalool synthase protein was subjected to N-terminal sequencing in a protein sequencer (model 477; Applied Biosystems, Foster City, CA). A sequence of 32 residues was determined in this way (Figure 1). In addition, the whole protein was cleaved with cyanogen bromide, the digestion products were subjected to SDS-PAGE, and two addi- tional peptides were isolated and sequenced (Figure 1) by using standard protocols.
cDNA Library
Total RNA was isolated from petals and stigmata of 1-day-old C. breweri flowers and from flower buds 1 day before opening (stage 5 buds; Pichersky et al., 1994) by using the protocol described by Lewinsohn et al. (1994). AcDNA library was constructed in the phage vector Map l l by using poly(A)+ mRNA (Strategene), according to company pro- tocols. 60th poly(T) and random primers were used in first-strand DNA synthesis. The titer of the unamplified library was 1.9 x 10⁶.
lsolation and Characterization of cDNA Clones
Two oligonucleotides designed to match the region encoding the N-terminal peptide were synthesized. These oligonucleotides were (1) the sense 23-mer oligonucleotide for the amino acid sequence QFLVDKVK (positions 7 to 14 from the N terminus) CA(AG)TT(TC)- (TC)C(ACGT)GT(ACGT)GA(CT)AA(AG)GT(ACGT)AA and (2) the an- tisense 17-mer for amino acid sequence NMNLF (positions 24 to 29
from the N terminus) AA(ACGQG(AG)(AG)TT(CT)TG(ACGQGT(AG)TT. Polymerase chain reaction was performed on DNA extracted from the cDNA library by using these two oligonucleotides in a previously de- scribed protocol (Schwartz et al., 1991). The anticipated 68-nucleotide fragment was obtained and cloned into the vector pCRll (Invitrogen, San Diego, CA). The complete sequence of the 68-bp fragment was determined to ascertain that the rest of its sequence indeed encoded the experimentally determined amino acid sequence from position 15 to 23. After obtaining a positive result, the cloned 68-bp fragment was excised from the vector and used as a probe to screen the cDNA li- brary. Fifteen cDNA clones were isolated, and their 5‘sequence was determined. All proved to have identical sequences within their over- lapping regions. The sequence of both strands of the longest clone was determined by the dideoxy chain termination method (Sanger et al., 1977).
RNA lsolation and RNA Gel Blot Analysis
Total RNA was isolated from 0.1 g of frozen plant tissues by using the RNeasy Plant Total RNA Kit (Qiagen Inc., Chatsworth, CA). The amount of RNA was determined by using a spectrophotometer. RNA samples (2 pg per lane) were size fractionated by electrophoresis under dena- turing conditions in vertical urea-agarose gels (Locker, 1979) at 4OC for 5 hr at 20 W and transferred to Hybond N+ membranes (Amer- sham). A 2.2-kb EcoRl Lis cDNA fragment containing the 5’ end of the gene was used as a probe, and hybridizations were performed in 5 x SSPE (1 x SSPE is 0.15 M NaCI, 10 mM sodium phosphate, pH 7.4,O.l mM EDTA), 50% formamide, 5 x Denhardt’s solution (1 x Denhardt’s solution is 0.020/0 Ficoll, 0.02% PVE 0.02% BSA), and 0.5% SDS at 37°C for at least 18 hr. Membranes were washed once at 37°C with 5 x SSPE, 0.5% SDS, and twice with 2 x SSPE at 65OC before being exposed to x-ray film. mRNA transcripts were quantified by using a molecular imager system (model GS-363; Bio-Rad). Lis mRNA tran- script levels were normalized to 18s rRNA levels to overcome error in RNA quantitation by using spectrophotometry. In addition, all gels contained a standard RNA sample from stigma tissue for equalizing signals among gels.
In Situ Hybridization
Preparation of tissues and hybridization conditions were the same as those described by Drews et al. (1991), with modifications used by Sakai et al. (1995). The Lis 35S-labeled sense and antisense mRNA probes were synthesized with T3 and T7 ANA polymerase from an EcoRV- or BamHI-linearized pBluescript SK+ vector containing 450 nucleo- tides of the 3’ end of Lis cDNA. Slides were coated with emulsion (NTB-2; Eastman Kodak) and exposed for 2 to 4 weeks at 4OC.
Protein Gel Blots
Crude extracts of C. breweri floral organ tissues (stigma, style, petal, filament, anther, and sepal) were made by macerating each tissue from 15 to 25 individual flowers in a mircocentrifuge tube containing ex- traction buffer (50 mM Tris, pH 6.9,5 mM sodium bisulfite, 10% glycerol, 1% insoluble PVPP, 2% SDS) in a ratio of 3:l buffer per tissue fresh weight for 1 min by using a hand-held homqenizer. Extracts were made from the last two stages of bud development (stages 4 and 5) and four stages of open flower development (day 1 through day 4). All extracts
Lis Expression in Clarkia Flowers 11 47
were spun for 10 min in a microcentrifuge at 13,000 rpm to remove cell debris and PVPP. The supernatants were prepared for SDS-PAGE by adding an equal volume of loading buffer (125 mM Tris, pH 6.6,0.05% bromophenol blue, 20% glycerol, 10% P-mercaptoethanol, 4% SDS) and heating for 5 min at 95°C.
Samples (20 pL of each extract) were loaded on 10% SDS-poly- acrylamide mini-gels along with samples of four known concentrations of purified native LIS. Gels were run at 200 V for 45 min. Transfer of proteins to nitrocellulose membranes was performed at 100 V for 1.5 hr in 48 mM Tris, 40 mM glycine, 0.04% SDS, and 20% methanol at 4OC in a Bio-Rad Mini Trans-Blot Cell.
Filters were blocked for 1 hr with PBS solution (pH 7.4) containing 0.5% Tween-20 (PBST) and 5% Carnation nonfat dry milk. Blocked filters were washed twice in PBST for 5 min to remove the milk. LIS protein bands were visualized by using Western Blot Chemilumines- cence Reagent (Du Pont-New England Nuclear), according to the manufacturer’s protocols except for the following modifications. Pri- mary anti-LIS antibody (diluted 1:1540) and secondary goat anti-rabbit IgG horseradish peroxidase conjugate (diluted 1:30,000) were prepared in PBST instead of PBST plus 1% BSA. lncubations with primary and secondary antibody were performed for 1 hr at room temperature.
Bands were visualized on Kodak X-OMAT AR film. Quantitation was performed by using a molecular imager system (model GS-363; Bio- Rad) to scan images from 5-hr exposures onto an imaging screen (model CH GS-250; Bio-Rad) into a computer file using the Molecular Analyst program (Bio-Rad). The four standards from each protein gel blot for each tissue were used to produce standard curves for each given blot. These standard curves along with the initial data from tis- sue collection were then used to calculate concentration of LIS protein (in micrograms per gram fresh weight of tissue).
ACKNOWLEDGMENTS
This work was supported by National Science Foundation Grant No. IBN-9417582. L.C. is a recipient of a National lnstitutes of Health (NIH) training grant fellowship in biotechnology (No. 5T32GM08353). V.M.B. is a recipient of an NIH training grant fellowship in genetics (No. 5T32GM07544). We thank Dr. R.A. Raguso for help in growing the plants.
Received March 29, 1996; accepted May 21, 1996.
REFERENCES
Back, K., and Chappell, J. (1995). Cloning and bacterial expression of a sesquiterpene cyclase from Hyoscyamus muricus and its mo- lecular comparison to related terpene cyclases. J. Biol. Chem. 270,
Bensen, R.J., Johal, G.S., Grane, V.C., Tossberg, J.T., Schnable, P.S., Meeley, R.B., and Briggs, S.P. (1995). Cloning and charac- terization of the maize Anl gene. Plant Cell 7, 75-84.
Chappell, J. (1995). The biochemistry and molecular biology of isopre- noid metabolism. Plant Physiol. 107, 1-6.
Colby, S.M., Alonso, W.R., Katahira, E.J., McGarvey, D.J., and Croteau, R. (1993). 4s-limonene synthase from the oil glands of
7375-7381.
spearmint (Menfha spicata): cDNA isolation, characterization, and bacterial expression of the catalytically active monoterpene CyChSe. J. Biol. Chem. 268, 23016-23024.
Dobson, H.E.M. (1993). Floral volatiles in insect biology. In Insect-Plant Interactions, Vol. 5, E. Bernays, ed (Boca Raton, FL: CRC Press),
Drews, G.K., Bowman, J.L., and Meyerowitz, E.M. (1991). Negative regulation of the Arabidopsis homeotic gene AGAMOUS by the APETALAP product. Cell 65, 991-1002.
Facchini, P.J., and Chappell, J. (1992). Gene family for an elicitor- induced sesquiterpene cyclase in tobacco. Proc. Natl. Acad. Sci.
Knudsen, J.T., and Tollsten, L. (1993). Trends in floral scent chemis- try in pollination syndromes: Floral scent composition in moth- pollinated taxa. Bot. J. Linn. SOC. 113, 263-284.
Knudsen, J.T., Tollsten, L., and Bergstrom, G. (1993). Floral scents- A check-list of volatile compounds isolated by head-space tech- niques. Phytochemistry 33, 253-280.
Lewinsohn, E., Steele, C.L., and Croteau, R. (1994). Simple isola- tion of functional RNA from woody stems of gymnosperms. Plant MOI. Biol. Rep. 12, 20-25.
Lewis, M. (1955). The genus Clarkia. Univ. Calif. Publ. Bot. 20,241-392. Locker, J. (1979). Analytical and preparative electrophoresis of RNA
in agarose-urea. Anal. Biochem. 98, 358-367.
Liitcke, H.A., Chow, K.C., Micbl, F.S., Moss, K.A., Kern, H.F., and Scheele, G.A. (1987). Selection of AUG initiation codons differs in plants and animals. EMBO J. 6, 43-48.
MacSwain, J., Raven, P., and Thorp, R. (1973). Comparative behavior of bees and Onagraceae. IV. Clarkia bees of the western United States. Univ. Calif. Publ. Entomol. 70, 1-80,
Mau, C.J.D., and West, C.A. (1994). Cloning of casbene synthase cDNA: Evidence for conserved structural features among terpenoid cyclases in plants. Proc. Natl. Acad. Sci. USA 91, 8497-8501.
McGarvey, D.J., and Croteau, R. (1995). Terpenoid metabolism. Plant Cell 7, 1015-1026.
Pichersky, E., Raguso, R.A., Lewinsohn, E., and Cmteau, R. (1994). Floral scent production in Clarkia (Onagraceae). I. Localization and developmental modulation of monoterpene emission and linalool synthase activity. Plant Physiol. 106, 1533-1540.
Pichersky, E., Lewinsohn, E., and Croteau, R. (1995). Purification and characterization of S-linalool synthase, an enzyme involved in the production of floral scent in Clarkia bwer i . Arch. Biochem. Bio-
Raguso, R.A., and Pichersky, E. (1995). Floral volatiles from Clarkia breweri and C. concinna (Onagraceae): Recent evolution of floral scent and moth pollination. Plant Syst. Evol. 194, 55-67.
Raguso, R.A., Light, D.M., and Pichersky, E. (1996). Electroanten- nogram responses of Hyles lineata (Sphingidae; Lepidoptera) to volatile compounds from Clarkia breweri (Onagraceae) and other moth-pollinated flowers. J. Chem. Ecol., in press.
Raven, R (1979). A survey of reproductive biology in Onagraceae. N. Z.
Sakai, H., Medrano, L.J., and Meyerowitz, E.M. (1995). Role of SU- PERMAN in maintaining Arabidopsis floral whorl boundaries. Nature
Sanger, F., Nicklen, S., and Coulson, A.R. (1977). DNAsequencing with chain terminating inhibitors. Proc. Natl. Acad. Sci. USA 74,
pp. 47-81.
USA 89, 11088-11092.
phys. 316, 803-807.
J. BOt. 17, 575-593.
378, 199-203.
5463-5467.
11 48 The Plant Cell
Schwartz, E., Shen, D., Aebersold, R., McGrath, J.M., Pichersky, E., and Green, B.R. (1991). Nucleotide sequence and chromosomal location of cabl l and cabl2, the genes for the tourth polypeptide of the photosystem I light-harvesting antenna (LHCI). FEBS Lett. 280, 229-234.
Stern, W., Curry, K., and Whltten, W.M. (1986). Staining fragrance glands in orchid flowers. Bull. Torrey Bot. Club 113, 288-297.
Sun, T.-p., and Kamiya, Y. (1994). The Arabidopsis GA7 locus encodes the cyclase ent-kaurene synthetase A of gibberellin biosynthesis. Plant Cell 6, 1509-1518.
Tarshis, L.C., Yan, M., Poulter, C.D., and Sacchettini, J.C. (1994). Cry!tal structure of recombinant farnesyl diphosphate synthase at 2.6-A resolution. Biochemistry 33, 10871-10877.
DOI 10.1105/tpc.8.7.1137 1996;8;1137-1148Plant Cell
N Dudareva, L Cseke, V M Blanc and E PicherskyC. breweri flower.
Evolution of floral scent in Clarkia: novel patterns of S-linalool synthase gene expression in the
This information is current as of January 6, 2019
Permissions 98X
https://www.copyright.com/ccc/openurl.do?sid=pd_hw1532298X&issn=1532298X&WT.mc_id=pd_hw15322
eTOCs http://www.plantcell.org/cgi/alerts/ctmain
Sign up for eTOCs at:
CiteTrack Alerts http://www.plantcell.org/cgi/alerts/ctmain
Sign up for CiteTrack Alerts at:
Subscription Information http://www.aspb.org/publications/subscriptions.cfm
is available at:Plant Physiology and The Plant CellSubscription Information for
ADVANCING THE SCIENCE OF PLANT BIOLOGY © American Society of Plant Biologists