Embed Size (px)
Citation preview

1
India Ex-Post Evaluation of Japanese ODA Loan
“Kurnool-Cuddapah Canal Modernization Project (I) (II)” External Evaluator: Junko FUJIWARA, OPMAC Corporation
0. Summary This project was intended to utilize water resources efficiently, recover the original designed
area of irrigation, and increase agricultural production by the rehabilitation and modernization of the irrigation system between Kurnool and Cuddapah in Andhra Pradesh State in Southern India, thereby contributing to income improvement for farmers. The project relevance is high as project implementation was well in line with India’s development policy and development needs, as well as with Japan’s ODA policy at the time of both appraisal and the ex-post evaluation. The project output achieved more or less as planned and the project cost was within the plan. The efficiency of the project is fair as the project period was significantly longer than planned. Water supply to farmland has been improved, the area benefited by Kurnool-Cuddapah Canal has been expanded, there has been stable planting of principal food, improvement of production volume and yields, and the diversification of agricultural products has been promoted since project implementation. Furthermore, household income, farm and non-farm incomes in the target area have been improved, and household savings have been secured since project implementation. The living environment of local residents has been improved to a large extent as seen in improvements in the level of children’s education and in life infrastructure, and their living standards have been steadily improving. Therefore it is concluded that the effectiveness and impacts of the project are high since the planned effectiveness has been achieved through project implementation. With regard to project sustainability, there are no problems with the institutional and technical aspects and the present operation and maintenance condition of the irrigation facilities covered under the project, but there have been some issues with the financial aspects. The sustainability of the effects realized by this project is therefore fair. In light of the above, this project is evaluated to be satisfactory.

2
1. Project Description
Project Location Alaganur Balancing Reservoir constructed
under the Project 1.1 Background
Agriculture in India had largely been dependent on the precipitation during the rainy season, and ensuring a sufficient amount of water had been an urgent issue to be tackled through the development of irrigation facilities for securing stable food production. In Andhra Pradesh, the target state of this project, agriculture was an important industry, with approximately 70% of the total workforce as of 1991 involved in agriculture. The agriculture sector had about a 40% share of the State GDP. However, the farming population largely depended on water sourced from major rivers in the state, and water was scarce at the end of the dry season. Under these circumstances, Andhra Pradesh State targeted the expansion of agricultural production and promoted the efficient use of irrigation facilities through the construction of new irrigation canals and the rehabilitation of existing ones.
The irrigation system between Kurnool and Cuddapah was constructed for navigation purposes in the 1860s, and converted into an irrigation facility in the 1930s. A severe deterioration of the aging facilities had made it difficult to deliver water to the peripheral and tail-end area of the system, and the amount of water available in the system was not sufficient, particularly during the dry season. To cope with the above situation, it was necessary to construct and rehabilitate the lining of the main canal, the existing structure, and to distribute water properly in order to secure irrigation water in the catchment area. Also to establish an appropriate cropping system, increase agricultural production and thus improve income for farmers.
1.2 Project Outline
The objective of this project is to utilize scarce water resources efficiently, recover the original designed area of irrigation, and increase the production of agriculture by the rehabilitation and modernization of the deteriorated irrigation system located between Kurnool

3
and Cuddapah districts, thereby contributing to the improvement of farmers’ income in the project area.
Phase I Phase II
Loan Approved Amount / Disbursed Amount
16,049 million yen / 15,729 million yen
4,773 million yen / 3,394 million yen
Exchange of Notes Date / Loan Agreement Signing Date
January 1996/ January 1996
March 2004/ March 2004
Terms and Conditions Phase I Phase II
Interest Rate: 2.3 % 1.3 % Repayment Period : 30 years 30 years (Grace Period) (10 years) (10 years) Conditions for Procurement: General untied (main portion) General untied Partial untied (consulting portion)
Final Disbursement Date February 2005 June 2012
Borrower / Executing Agency President of India / Department of Irrigation & Command Area Development, State Government of Andhra Pradesh
Main Contractor (Over 1 billion yen)
Progressive Construction Ltd, New Delhi (India) Gayatri Projects Ltd. (India)
Main Consultant (Over 100 million yen)
Water And Power Consultancy Services (India) Limited (Inia) / WAPCOS (India) / Nippon Koei Co., Ltd. (Japan)
Related Projects None
2. Outline of the Evaluation Study 2.1 External Evaluator
Junko FUJIWARA, OPMAC Corporation
2.2 Duration of Evaluation Study Duration of the Study: September 2014 – September 2015 Duration of the Field Study: December 7, 2014– December 20, 2014, and March 8, 2015 –
March 14, 2015

4
3. Results of the Evaluation (Overall Rating: B1) 3.1 Relevance (Rating: ③2)
3.1.1 Relevance to the Development Plan of India (1) National development plan level In the 8th Five-Year Plan (April 1992 to March 1997), the national development plan of
India on which the first appraisal of the project was based (1995), the total investment amount in the public sector was 4,341 billion rupees. Out this amount, investment in the agriculture sector accounted for 20% of the total budget for the enhancement of rural employment and income through food production growth and the diversification of rural industries in order to sustain the increasing population, for the resolution of regional disparity, for environmental considerations, and for enforcement of the private sector. The irrigation sector was emphasized in the said five-year plan as agricultural activities in India largely depended on the rainfall during the rainy season and agricultural production was unstable. Focus was put on on-going irrigation projects for completing their construction at their earliest and the modernization of existing irrigation facilities, for the expansion of the irrigated area with the intension of increasing food production and for more efficient water management.
At the timing of the ex-post evaluation of this project (2014), the 12th Five-Year Plan (April 2012 to March 2017) was underway. The Plan targeted an 8.2% of real GDP growth rate during its period, out of which the benchmark of the growth rate of the whole agriculture sector was 4.0%. With the intension of achieving employment creation and fiscal soundness of the Government, public investment was expected to be as large as 56 trillion rupees for the acceleration of further economic growth. The total planned amount of investment in the irrigation sector was as much as 5,000 billion rupees, following the energy, road, communication and railway sectors. The Plan also targeted an increase in the total irrigated area of the nation from 90 million ha to 103 million ha during the period through recovery and increase of irrigated areas by the modernization, rehabilitation and expansion of existing irrigation facilities, the completion of irrigation facilities under construction, and the promotion of improvement of small-scale irrigation facilities by public-private partnership.
(2) State development plan level for Andhra Pradesh Andhra Pradesh State is located in the southern part of India, and the share in GDP of the
agriculture sector was approximately 40% of the whole State GDP at the time of appraisal (1995). The State played an important role in India as its rice production was approximately 10% of that of the whole country. The development budget for the irrigation sector in the State in the 1994 Plan shared as much as 25.7%, following the power and energy sector
1 A: Highly satisfactory, B: Satisfactory, C: Partially satisfactory, D: Unsatisfactory 2 ③: High, ② Fair, ① Low

5
(29%). In Andhra Pradesh State, where a high economic growth rate had been achieved, further
economic growth was expected in the 12th Five-Year Plan which was underway at the time of the ex-post evaluation of this project (2014). The State GDP growth rate expected in the period of the Plan was 8.4%, out of which the target for the agriculture sector was 5.2%. As much as 750 billion rupees (21.9%) investment budget was allocated to the irrigation sector, which was second only to the social sector3 (38.9%). Modernization, improvement and expansion of the existing irrigation facilities and the completion of on-going projects were given the most priority, and food production volume was expected to expand from 2 billion to 3 billion metric tons during the implementation period 12th Five-Year Plan.
To summarize, the relevance of this project implementation to the national development plan and the state’s irrigation sector development plan was recognized both at the timing of appraisal and the ex-post evaluation.
3.1.2 Relevance to Development Needs of India
Approximately 70% of the employed population in Andhra Pradesh State at the time of this project’s appraisal (1995) was involved in agriculture. The State is in a semi-dry zone nearing a dry zone in the western part of India. A stable water supply was thus essential as a majority of the agricultural activities in the State depended on rain-shed agriculture and suffered from droughts mainly during the dry season. Furthermore, irrigation facilities were available in less than half of the total cultivated area. In addition to the expansion of agricultural production, there was the need for securing the efficiency of irrigation through the construction of new irrigation canals and rehabilitation of the existing ones.
According to data collected by the Department of Planning of Andhra Pradesh State at the time of the ex-post evaluation (2014), the share of the agricultural sector in the State GDP was down from the 30% of 2004 to 23% in 2012. The agricultural sector, however, still played an important role as shown in the fact that the population involved in agriculture was still over half of the entire employed population of the State.
Looking at the shift in the net cultivated area and the net irrigated area from 2000/01 to 2010/11 in Andhra Pradesh State (Figure 1), it can be seen that the cultivated area was apt to decrease while industrialization, population increase, and housing land development accelerated in the State. The net irrigated area, on the other hand, repeatedly increased and decreased in total, while the area per household tended to be subdivided for land inheritance among siblings or for sales to people outside. The number of farmland owners was on the increase while the total area was not; immediate benefits of individuals have been pursued, which has made people less committed to the daily operation and maintenance of irrigation
3 The “Social sector” in the 12th Five-Year Plan comprised of education, health, water supply, housing, urban development and other social services.

6
Figure 1: Shift in Net Cultivated Area and Net Irrigated Area of Andhra
Pradesh State
0
1,000
2,000
3,000
4,000
5,000
6,000
7,000
8,000
2000-01 2005-06 2010-11
(1,000 ha)
(year)
Net Area Sown Total Net Area Irrigated
Source: Andhra Pradesh State Development Planning Society http://www.apsdps.ap.gov.in/gdp.html (Accessed in January 2015)
facilities. Their duties and responsibilities have thus become unclear, and facilities management has become more complicated. It was thus necessary that the existing irrigation systems were managed more attentively in order to ensure a stable water supply to farmland.
To summarize, the agriculture sector GDP of Andhra Pradesh State has been relatively on the decrease, but the farming population has a 50% share of the whole, which means that the agriculture sector remains important in the State. The need for continued support for improvement of the existing irrigation facilities to ensure an assured water supply to farmland is still recognized in the State.
3.1.3 Relevance to Japan’s ODA Policy
At the timing of the first project appraisal, the combat against poverty was among the highly prioritized sectors and this was also described in the country assistance policy by the Government of Japan toward India (1997). The promotion of agricultural and rural development (improvement of agricultural productivity and the development of agricultural infrastructure for sustaining self-sufficiency in food production along with population growth) was one of the policy instruments. Assistance for rural development to cope with the poverty issue was prioritized in Japan’s 2006 country assistance plan for India, in which the development of intensive irrigation facilities and technical dissemination for the improvement of agricultural productivity were included.
In summary, this project has been highly relevant to the country’s development plan and
development needs, as well as Japan’s ODA policy. Therefore its relevance is high.
3.2 Efficiency (Rating: ②) 3.2.1 Project Outputs
Through the project implementation, weir facilities were constructed and rehabilitated, a reservoir was newly constructed, main canal and distributaries, related structures, farm roads and drainage systems were constructed and rehabilitated, pilot farms were developed with related equipment, and technical training on agriculture extension was provided.
Major differences between the original plan and the actual are as follows:

7
Rehabilitation of the main canal: the total canal length for rehabilitation increased from the planned length of 244.8 km to 305.6 km in order to repair damage caused by the torrential rains of 2000 and 2007 while the project was being implemented. New rehabilitation works on existing parts of the main canal were added when deterioration took place after the project commenced.
Construction and rehabilitation of distributaries: the total canal length for rehabilitation increased from the planned length of 790.3 km to 840.0 km for similar reasons as the main canal. The extension of new distributaries, on the other hand, became shorter in total length from the planned 169.2 km to 50.0 km as there were difficulties in land acquisition.
Construction and rehabilitation of farm roads: the amount of farm road development increased from the planned 336.1 km (235.5 km of existing road rehabilitation and 100.6 km of new road construction) to 407.0 km (71.0 km of rehabilitation and 336.0 km of new construction). The plan was revised with less rehabilitation and more new construction taking into consideration the better transportation of farm products and the traffic access of local farmers.
On-farm development (10,000 ha of the area benefited by the project): Development of pilot farms at 10,000 ha of the area benefitted by the project was planned aiming at rational and efficient water management and the dissemination of relevant technologies. However, local farmers strongly showed reluctance for such development as they anticipated that their farming area would be reduced. The plan was reviewed at the timing of the second appraisal (2003) and the direction taken that on-farm development should go step-by-step with the promotion of farmers’ understanding through demonstrating good practices. The actual pilot farms constructed under the project resulted in 70.97 ha in total at five venues after difficulties in acquiring the required land and gaining the understanding of farmers.
Sustainability Scheme (Water Users Association consolidation activities and capacity building of farmers / WUAs): Along with the enactment of “the Andhra Pradesh Farmers management of Irrigation Systems Act 1997”, this incentive scheme was created and added at the timing of the second appraisal in order to assist farmers and WUAs to develop their skills and technical capacity. Under this scheme equipment such as farming instruments required at pilot farms were procured, and local technical instructors, NGOs and volunteers provided farmers with technical training on agriculture extension works4.
4 The expenses for the employment of local instructors, NGOs and volunteers came from the budget item ‘sustainability scheme’. All 200 samples of the beneficiary survey (explained in the latter part of this report) referred to improvement in farm skills through training conducted by the project, and it is concluded that no problem is found in the effectiveness of training .
8
Such changes in output were deemed appropriate for achieving the project objectives and worked positively in securing project effectiveness as it was anticipated that the function of the whole irrigation system would have become severely deteriorated without them. The actual project outputs against the plan are shown in the table “Comparison of the Original and Actual Scope of the Project” at the end of this report.
3.2.2 Project Inputs
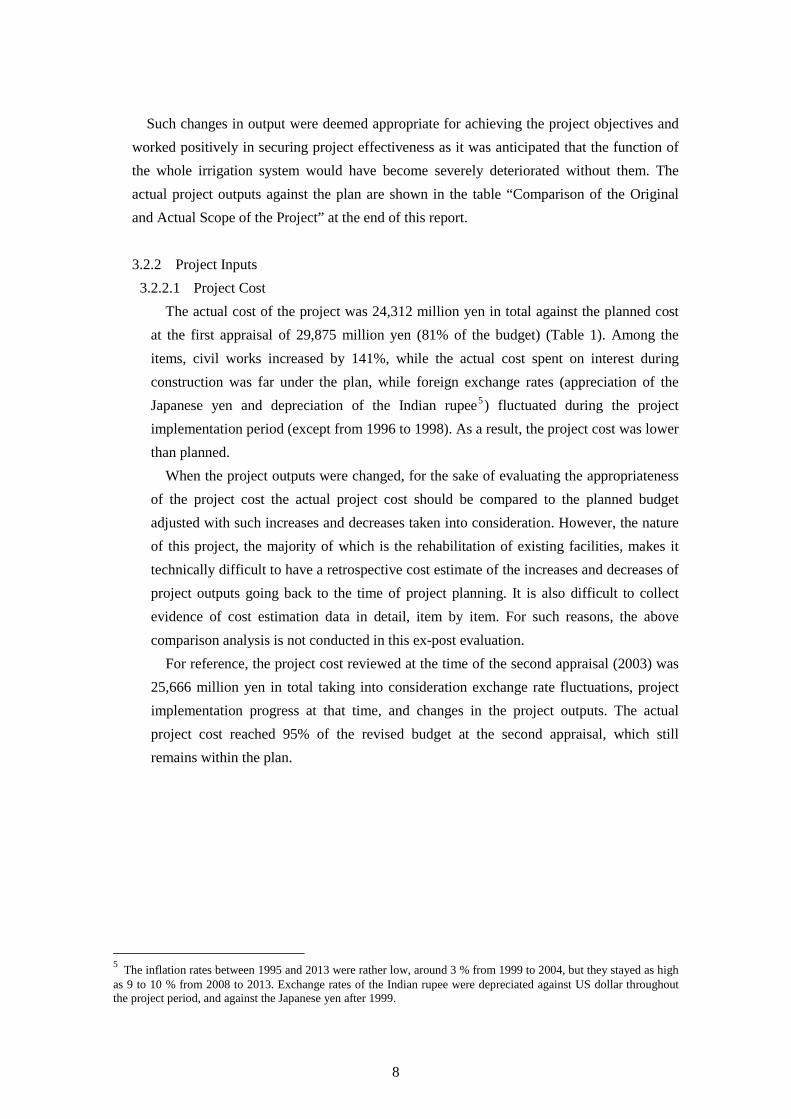
3.2.2.1 Project Cost The actual cost of the project was 24,312 million yen in total against the planned cost
at the first appraisal of 29,875 million yen (81% of the budget) (Table 1). Among the items, civil works increased by 141%, while the actual cost spent on interest during construction was far under the plan, while foreign exchange rates (appreciation of the Japanese yen and depreciation of the Indian rupee5) fluctuated during the project implementation period (except from 1996 to 1998). As a result, the project cost was lower than planned.
When the project outputs were changed, for the sake of evaluating the appropriateness of the project cost the actual project cost should be compared to the planned budget adjusted with such increases and decreases taken into consideration. However, the nature of this project, the majority of which is the rehabilitation of existing facilities, makes it technically difficult to have a retrospective cost estimate of the increases and decreases of project outputs going back to the time of project planning. It is also difficult to collect evidence of cost estimation data in detail, item by item. For such reasons, the above comparison analysis is not conducted in this ex-post evaluation.
For reference, the project cost reviewed at the time of the second appraisal (2003) was 25,666 million yen in total taking into consideration exchange rate fluctuations, project implementation progress at that time, and changes in the project outputs. The actual project cost reached 95% of the revised budget at the second appraisal, which still remains within the plan.
5 The inflation rates between 1995 and 2013 were rather low, around 3 % from 1999 to 2004, but they stayed as high as 9 to 10 % from 2008 to 2013. Exchange rates of the Indian rupee were depreciated against US dollar throughout the project period, and against the Japanese yen after 1999.

9
Table 1: Plan and Actual of Project Cost Unit: million JPY
Budget Item
Plan (at the time of the first project appraisal) Actual Foreign
Currency Local
Currency Total Foreign Currency
Local Currency Total
Total ODA loan Total ODA
loan Total ODA loan Total ODA
loan Total ODA loan Total ODA
loan CW*1(1) 0 0 13,861 12,336 13,861 12,336 21 19 19,578 17,434 19,599 17,453
Sustainability 0 0 0 0 0 0 0 0 16 14 16 14 MIS 20 20 0 0 20 20 0 0 0 0 0 0
Vehicle 0 0 15 15 15 15 0 0 0 0 0 0 LA*1(2) 0 0 390 0 390 0 0 0 742 0 742 0 Admin 0 0 714 0 714 0 0 0 2,300 0 2,300 0 PE*1(3) 2 2 9,378
9,966 9,380
9,966 0 0 0 0 0 0
PC*1(4) 2 2 2,436 2,438 0 0 0 0 0 0 C/S*1(5) 657 657 85 85 742 742 593 593 273 273 867 867 IDC*1(6) 2,314 2,314 0 0 2,314 2,314 789 789 0 0 789 789
Total 2,995 2,995 26,880 22,398 29,875 25,393 1,403 1,401 22,909 17,722 24,312 19,123 Source: Survey response from executing agency. Note 1: Abbreviations in the table are as follows: (1) CW: civil works, (2) LA: land acquisition, (3) PE: price escalation, (4) PC: physical contingency, (5) C/S: consulting service and (6) IDC: interest during construction. Note 2: The exchange rate at the time of the first project appraisal was 1 rupee = 2.89 yen as of April 1995. Physical contingency was estimated as 10% of the total project cost, price escalation was estimated 2.0% per year for foreign currency, and 10.9% per year for local currency. Note 3: Expenditure for the on-farm development planned in the first appraisal are included in that for civil works, with which pilot farms were developed in a step-by-step manner aiming at the dissemination of water management skills. A budget item named “sustainability scheme” (Consolidation activities of Water Users’ Associations (WUAs) and capacity building of farmers / WUAs) was created and added at the time of the second project appraisal. This was used for the cost for procuring equipment at pilot farms and providing skill development training on agriculture extension works by local instructors, NGOs and volunteers.
3.2.2.2 Project Period
Although the project period planned at the time of the first appraisal was for 90 months from January 1996 6 to June 2003 7, all construction works under both the first and second phases were completed in July 2013 8. The main reasons, confirmed at the time of the second appraisal (2003 9), for the extended project period were: delay in design approvals by the Indian authorities, delay and prolonging of the tender process and construction works, prolonging of the land acquisition process, and the necessary response to damage caused by the torrential rains and floods of 2000. Approximately only 20% of contract packages was complete as of the second appraisal. Moreover, some outputs were changed such the length of the main canal and the distributaries for rehabilitation. A “sustainability scheme” (WUA consolidation activities and capacity
6 The project start was defined as the signing of the loan agreement for the first phase. 7 The project completion was not defined in any relevant document at that time. 8 Although the last loan was disbursed in June 2012, the Indian side continued some unfinished construction works (rehabilitation of damage to the main canal and distributaries caused by the heavy rain of 2007) using their own funds up to July 2013. 9 The Government of Japan suspend all new loan assistance to India after the nuclear test of 1998. The second appraisal of this project was therefore conducted in 2003 after the Government of Japan restarted its loan assistance.

10
building of farmers / WUAs) was created and added under which equipment were procured at pilot farms and technical training on agriculture extension activities was conducted. Accordingly, the majority of the major outputs of this project was complete in the first half of 2006. Drastic rehabilitation works on the main canal and distributaries were then conducted as countermeasures for the severe damage caused by the torrential rains and large-scale floods of 2007. These additional construction works ended in July 2013. On the other hand, the operation of the whole irrigation system commenced in May 2007 10.
The above circumstances taken into consideration, the timing of project completion is judged in this ex-post evaluation to have been May 2007, when the construction of the major facilities was complete and their operation commenced at full-scale. Based on this, the actual project duration was 137 months, from January 1996 to May 2007, which was significantly longer than planned (152% of the plan).
3.2.3 Results of Calculations of Internal Rates of Return
The Financial Internal rate of Return (FIRR) was not calculated while the Economic Internal Rate of Return (EIRR) was 16.9% at the time of the first project appraisal and 17.2% at the time of the second appraisal. The calculation basis for the EIRR in each phase is shown in Table 2.
Table 2: Calculation Basis of EIRR (at the time of appraisals)
At the timing of the first project appraisal At the timing of the second project appraisal
Cost: Cost required for the project and maintenance cost Construction cost and maintenance cost
Benefit: Agricultural production increase through increase of irrigated area and improvement of farming methods
Agricultural production increase through irrigation
Project Life: 30 years 50 years Source: Information provided by JICA.
This ex-post evaluation does not calculate the FIRR same as in both appraisals. It does not
calculate the EIRR either because the cropping pattern in the area benefited by the project saw significant changes during the project implementation period, which requires alternative parameters as the base of calculation, and it was impossible to get hold of the data and information required for the recalculation of the EIRR.
10 The evaluator consulted with the executing agency and found that it was 2006 when the development of the drainage structure in this irrigation system (inlets, tunnel sluices, drainage culverts, aqueducts and such) was completed, and that it was May 2007 when the whole irrigation system started to function at full scale as the amount of water flowing into the main canal was taken under control and water was distributed properly in all reaches of the whole system by recovering and reinforcing the drainage function for directing rain water and diverting flood water.

11
To summarize, the project cost was lower than planned, but the project period was significantly longer than planned. Therefore, the efficiency of this project is fair.
3.3 Effectiveness11 (Rating: ③)
The intended outcome of the project was to “utilize scarce water resources efficiently, recover the original designed area of irrigation, and increase the production of agriculture”. The degree of accomplishment of the quantitative and qualitative effects of the project were analyzed in this ex-post evaluation.
In order to measure the quantitative effects, the Operation Indicators (“area benefited by the project” and “planted area by crop”) and the Effect Indicators (“production volume by crop” and “yield per unit area by crop”12) set at the time of the project appraisal of the second phase (2002) were analyzed, comparing the base figures (2002), the target figures (three years after project completion), and the actual figures collected at ex-post evaluation (2014)13. For the evaluation of the extent to which the “efficient utilization of water resources” was achieved, quantitative data on the water volume secured in the irrigation system of the project was collected, in addition to the above indicators (as none of the latter included this).
For the analysis of the qualitative effects, the results of a beneficiary survey conducted in the project area were used14. The beneficiary survey targeted 200 farmers, out of whom 95 (in four villages) were from Kurnool District, and the rest 105 (in thirteen villages) were from Cuddapah District15. The average age of beneficiary survey respondents was approximately 49 years of age, and the average number of household members was 4.4.
The project objectives, indicators and data used for the analysis of the project effectiveness are shown in Table 3.
11 Sub-rating for effectiveness is to be put with consideration of Impact. 12 Base figures and target figures for paddy, groundnut, cotton, sunflower, pulses and cereals were set as measurable indicators for planted area, production volume and unit yield. In this ex-post evaluation, some more major crops (chilly, vegetable, turmeric and onion) were added and the actual figures were collected for analysis as it had been admitted visually in the first site survey (December 2014) of this ex-post evaluation that there had been crop diversification and cropping pattern change in the project area. 13 In addition to the “area benefited by the project” and the “planted area by crop”, the “collection rate of the irrigation water tax” was also among the Operation Indicators set at the time of the project appraisal of the second phase, while “gross annual average farm income” was added to the Effect Indicators along with “production volume by crop” and “yield per unit area by crop”. However, these two figures were used for the analysis of sustainability and impact respectively as the “collection rate of irrigation water tax” was part of the quantitative data for the analysis of financial sustainability, and the “gross annual average farm income” was one of the indicators for the degree of accomplishment of the overall goal of this project: “improvement of farmers’ income.” 14 The results of beneficiary survey were also reflected in the analysis of “project impact.” 15 This was from 10 to 14 December 2014 when the beneficiary survey was conducted in the project area. As the irrigation system between Kurnool and Cuddapah is divided into five reaches, the number of samples taken from Reach 1 to Reach 5 were 15, 44, 36, 72 and 33 respectively.

12
Table 3: Indicators / Data for the Measurement of Project Effectiveness and the Project Objectives
Indicators and Data Relevant
Tables and Figures
Project Objectives Efficient
utilization of water resources
Recovery of the original designed area of irrigation
Increase of agricultural production
Qua
ntita
tive
Dat
a Amount of water available in the irrigation system -
Area benefited by the Project Table 4 Planted area by crop Table 4 Production volume by crop Table 5 Yield per unit area by crop Table 6
Qua
litat
ive
Dat
a
Water supply to farmland, water quality and quantity
Table 7, Table 8
Irrigated land area for cultivation Table 9
Change in cropping pattern Table 10 Crop diversification Table 11 Change in planted crops Figure 2 Change in yield by crop Table 12
Source: Developed by the Evaluator Note 1: Quantitative data obtained from the executing agency through a questionnaire survey, and qualitative data through the results of beneficiary survey. Note 2: There is no figure or table created for the “amount of water available in the irrigation system” as no quantitative data was obtained.
3.3.1 Quantitative Effects (Operation and Effect Indicators)
(1) Efficient utilization of water resources According to the executing agency, the Department of Irrigation and Command Area
Development of Andhra Pradesh State (hereinafter as the “I&CAD Dept.”), out of the total 900 million m3 of water volume taken from the original water source, approximately 680 million m3 of water was available in the Kurnool-Cuddapah irrigation canals at the time of the ex-post evaluation16. It was confirmed that approximately 620 million m3 were actually used for crop production in farmland (92.0 % of the water available in the project area) while the remaining amount of water remained in the irrigation system as excess.
Quantitative data for whether or not water efficiency had improved through project implementation was not accessible although the Evaluator did try to obtain this from the executing agency.
16 There was as much as 5,663 m3 of water loss between the original water source dam and the project irrigation system. Approximately 170 million m3 of water was exclusively used as drinking water as prioritized by the State Government. Andhra Pradesh State prioritizes the drinking water supply, and orders that a certain amount of irrigation water is allocated for drinking purpose in response to “drought declarations” issued by the local government based on precipitation and yields. Some surface water in the project irrigation system is also secured for drinking purposes, particularly during dry season. According to the I&CAD Dept., certain farmers also take groundwater by themselves and strategically choose specific products in each season based on the available amount of water in total. The whole picture, including these individual efforts made by farmers, however, has not been figured out nor has it been reflected in the quantitative data.

13
(2) Recovery of the original designed area of irrigation The area benefited by the project and planted area by crop are shown in Table 4. The
totals were over 80% of the target figures both in 2012/13 and 2013/14 17.
Table 4: Area Benefited by the Project and Planted Area by Crop (Operation Indicators)
Unit: ha
Indicators Baseline (2002)
Target (3 years after completion)
Actual 2012/13
(5 years after completion)
2013/14 (6 years after completion)
Area benefited by the Project 47,552 106,420 100,079 92,526 Total planted area 47,552 110,510 100,079 92,526
Mea
sure
d cr
ops Paddy 2,613 49,030 35,067 56,560
Groundnut 549 26,760 12,575 1,340 Cotton 725 13,380 3,309 2,518
Sunflower 5,322 3,770 4,118 2,136 Pulses 15,189 12,000 2,787 1,488 Cereals 23,124 5,540 26,248 11,348
Oth
er c
rops
Chilly - - 322 626 Vegetable - - 4,819 2,896 Turmeric - - 611 1,231
Onion - - 70 123 Source: Survey response from executing agency Note 1: “Area benefited by the project” indicates the cultivated area out of the entire area where irrigation facilities are developed, and the “planted area by crop” indicates the sum of the planted area of each crop within a year in the area benefited by the project. Note 2: The actual figures for the area benefited by the project and the planted area are based on the facts of planting for the benefitted area which is sufficiently covered by the amount of surface water available for irrigation purposes. Note 3: The sum of the planted area of crops appearing in the table is not compatible with the total planted area or the area within the whole irrigation system and the area benefited by the project, since crops other than those in the table were also planted.
Looking at the planted area by crop, although the planted area of paddy in 2012 was below
target, that of 2013 exceeded target. The executing agency explained that paddy, which is one of main staples, was planted in a sustainable and stable manner in the project target area, though the planted area changes a little year by year. Cereals18 were found planted in far larger areas than the target. Those of measured plants, i.e., groundnut, cotton, and pulses, were far below the targets; the planted areas change greatly year by year. The I&CAD Dept. provides an annual precipitation forecast and water budget for the whole irrigation system, as
17 The actual figure of 2013/14 was lower than that of 2012/13 due to a severe water shortage in 2013/14. According to the executing agency, it is anticipated that the area benefited by the project will no longer be expanded due to housing development, mainly in the suburb of Kurnool, the construction of health and education facilities, road expansion, and development activities in Cuddapah District where the commercial value of land is high. 18 The data obtained from the executing agency for describing the actual figure of cereals was divided into two: one for sorghum and another for jowar. Sorghum is jowar in the local language of Andhra Pradesh State, and both words are used with the same meaning in most cases. Due to this, the sums of data for sorghum and jowar are shown as “cereals” for the planted area (Table 4) and the production volume (Table 5), while two different data are shown separately for the unit yield (Table 6).

14
so does the Department of Agriculture of Andhra Pradesh State (hereinafter referred as the “DOA”) for soil condition, technical advice based on natural conditions and year-to-year specific market information to farmers. Farmers then choose specific crops with intention and rotate them based on the information and advice given as above. In addition to those crops determined as the Operation and Effect Indicators at the time of project appraisal, other crops such as chilly, vegetable, and turmeric were also found planted in the project area.
(3) Increase in agricultural production Production volume by crop is shown in Table 5. The production volume of paddy and
cereals exceeded the target figures, which indicates that farmers produced a sufficient amount of staple foods. The production volume of the rest of the measured crops did not reach the target figures either in 2012/13 or 2013/14 as described above, since farmers choose crops year by year for specific reasons (also as described above). However, other crops such as chilly, vegetable and onion showed a high production volume given the small planted areas. This implies that farmers, along with staple crops, often grow those crops which have a high profit and high yield and are able to do so as they have already secured the stable planting of their principal crops as well as diversified crops.
Table 5: Production Volume by Crop (Effect Indicators)
Unit: ton/year
Indicators Baseline (2002)
Target (3 years after completion)
Actual 2012/13
(5 years after completion)
2013/14 (6 years after completion)
Mea
sure
d cr
ops Paddy 14,894 316,845 177,523 343,955
Groundnut 824 86,172 42,512 4,164 Cotton 7,450 40,140 11,570 8,566
Sunflower 4,258 7,823 8,137 3,194 Pulses 4,365 12,111 4,069 1,665 Cereals 34,686 23,470 109,116 39,074
Oth
er c
rops
Chilly - - 2,103 4,128 Vegetable - - 17,807 10,062 Turmeric - - 417 1,741
Onion - - 5,378 9,308 Source: Survey response from executing agency
The actual figures for the unit yield by crop are shown in Table 6. Looking at the yield of
the rainy season, the unit yield of staple foods and others exceeded the targets. Paddy and groundnut exceeded the targets for both 2012/13 and 2013/14. Cereals, both sorghum and jowar, exceeded the target in 2012/13. Cotton exceeded the yield target for the year 2012/13, and reached close to the target in 2013/14. On the contrary, in the dry season, only the unit yield of cereal (sorghum) in 2012/13 reached the target, while that for paddy and groundnut

15
reached close to 80 % of the target in 2012/13, and nearly 90 % in 2013/14. Pulses showed stable yields reaching close to 90 % of the target figure in 2012/13, and 80 % in 2013/14.
Among the yields of other crops at the time of the ex-post evaluation, that of chilly, which is grown with a large amount of water, was remarkably high in the dry seasons of both 2012/13 and 2013/14. Turmeric had a higher yield in the dry season than in the rainy season of 2013/14. Vegetable and onion had a certain amount of yield throughout the year in 2013/14.
It is concluded that the yields of not only the main staples but also high-valued crops and productive crops were secured in a stable manner.
Table 6: Unit Yield by Crop (Effect Indicators)
Unit: ton/ha
Indicators
Baseline (2002)
Target Figure (3 years after completion)
Actual 2012/13
(5 years after completion)
2012/13 (6 years after completion)
Rainy season
Dry season
Rainy season
Dry season
Rainy season
Dry season
Rainy season
Dry season
Mea
sure
d cr
ops
Paddy 5.7 - 6.5 6.0 6.7 4.6 6.8 5.3 Groundnut 1.5 - 2.3 3.5 2.5 2.6 2.5 3.1
Cotton 2.0 - 3.0 - 3.4 4.0 2.9 3.7 Sunflower 0.8 - 2.0 2.1 1.1 0 1.4 1.5
Pulses 1.0 - 2.0 2.5 1.9 2.2 0 2.0
Cereals Sorghum 1.5 - 3.5 4.5 5.4 6.4 1.2 2.2
Jowar - - - - 3.9 0 2.0 2.9
Oth
er c
rops
Chilly - - - - 11.9 20.0 9.5 22.0 Vegetable - - - - 9.2 0 8.5 8.4 Turmeric - - - - 1.2 0 1.2 2.0
Onion - - - - 4.9 0 4.9 4.9 Source: Survey response from executing agency Note: In the base year 2002 there was a severe drought and there was no production during the dry season (“-”). No base figures were obtained for “other crops” as it was only the actual figures that were collected in the ex-post evaluation. There was no record of planting those crops for which the actual figures were “0” at the time of the ex-post evaluation.
3.3.2 Qualitative Effects
(1) Efficient utilization of water resources As in 3.3.1 (1), it was impossible to obtain quantitative data on to what extent the water
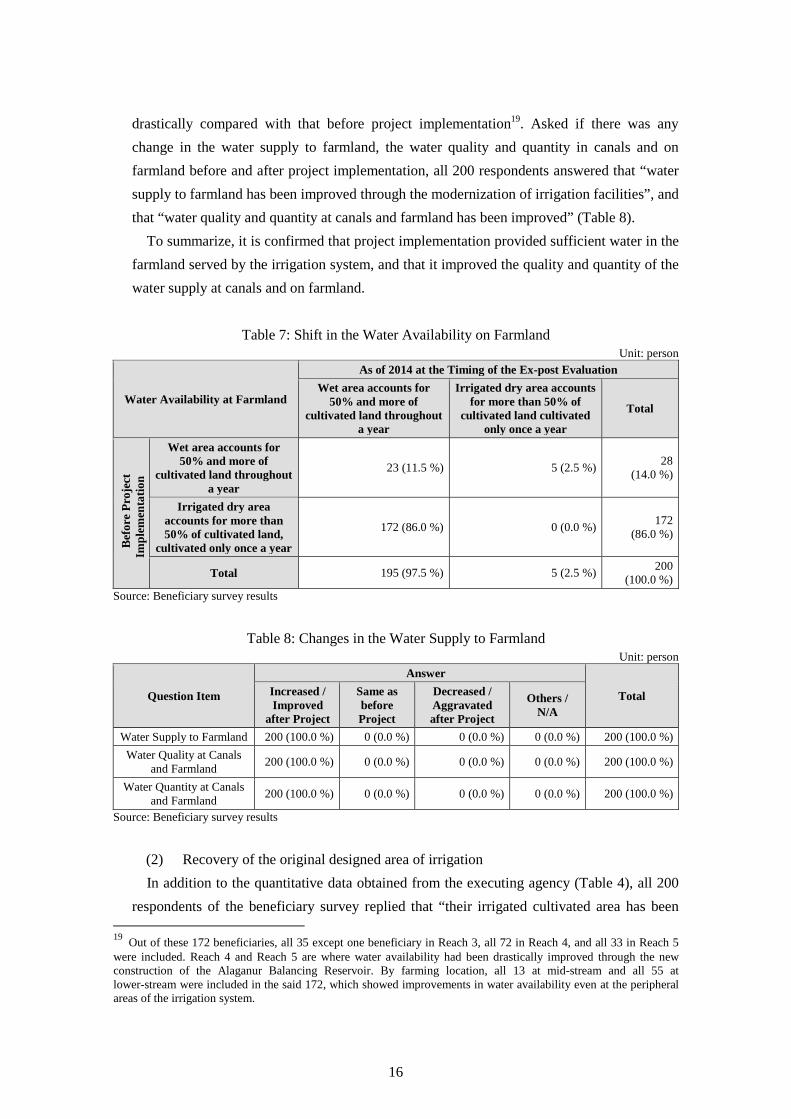
supply and distribution reached the peripheral area and the far reaches of the irrigation system. However, in the beneficiary survey (see the eighth page of this report), as shown in Table 7, 195 respondents, including 172 whose “cultivation area with a sufficient amount of water throughout a year was less than 50% of their total farmland and who had cultivated only once a year” before the project, answered that “their cultivation area with a sufficient amount of water use had risen to over 50% of their total farmland throughout a year” at the time of the ex-post evaluation (2014). The water supply to their farmland had improved
16
drastically compared with that before project implementation19. Asked if there was any change in the water supply to farmland, the water quality and quantity in canals and on farmland before and after project implementation, all 200 respondents answered that “water supply to farmland has been improved through the modernization of irrigation facilities”, and that “water quality and quantity at canals and farmland has been improved” (Table 8).
To summarize, it is confirmed that project implementation provided sufficient water in the farmland served by the irrigation system, and that it improved the quality and quantity of the water supply at canals and on farmland.
Table 7: Shift in the Water Availability on Farmland
Unit: person
Water Availability at Farmland
As of 2014 at the Timing of the Ex-post Evaluation Wet area accounts for
50% and more of cultivated land throughout
a year
Irrigated dry area accounts for more than 50% of
cultivated land cultivated only once a year
Total
Bef
ore
Proj
ect
Impl
emen
tatio
n
Wet area accounts for 50% and more of
cultivated land throughout a year
23 (11.5 %) 5 (2.5 %) 28 (14.0 %)
Irrigated dry area accounts for more than 50% of cultivated land,
cultivated only once a year
172 (86.0 %) 0 (0.0 %) 172 (86.0 %)
Total 195 (97.5 %) 5 (2.5 %) 200 (100.0 %)
Source: Beneficiary survey results
Table 8: Changes in the Water Supply to Farmland
Unit: person
Question Item
Answer
Total Increased / Improved
after Project
Same as before Project
Decreased / Aggravated after Project
Others / N/A
Water Supply to Farmland 200 (100.0 %) 0 (0.0 %) 0 (0.0 %) 0 (0.0 %) 200 (100.0 %) Water Quality at Canals
and Farmland 200 (100.0 %) 0 (0.0 %) 0 (0.0 %) 0 (0.0 %) 200 (100.0 %)
Water Quantity at Canals and Farmland 200 (100.0 %) 0 (0.0 %) 0 (0.0 %) 0 (0.0 %) 200 (100.0 %)
Source: Beneficiary survey results
(2) Recovery of the original designed area of irrigation In addition to the quantitative data obtained from the executing agency (Table 4), all 200
respondents of the beneficiary survey replied that “their irrigated cultivated area has been 19 Out of these 172 beneficiaries, all 35 except one beneficiary in Reach 3, all 72 in Reach 4, and all 33 in Reach 5 were included. Reach 4 and Reach 5 are where water availability had been drastically improved through the new construction of the Alaganur Balancing Reservoir. By farming location, all 13 at mid-stream and all 55 at lower-stream were included in the said 172, which showed improvements in water availability even at the peripheral areas of the irrigation system.

17
improved compared with the situation before project implementation” when asked if there had been any change before and after project implementation (Table 9). This implies that the irrigated area for cultivation had increased compared to the situation before project implementation.
Table 9: Changes in Irrigated Cultivated Area
Unit: person
Question Item
Answer
Total Increased / Improved
after Project
Same as before Project
Decreased / Aggravated after Project
Others / N/A
Irrigated Cultivated Area 200 (100.0 %) 0 (0.0 %) 0 (0.0 %) 0 (0.0 %) 200 (100.0 %) Source: Beneficiary survey results
(1) Increase in agricultural production • Changes in cropping pattern Looking at changes in planting, those beneficiaries who used to plant sugarcane accounted
for 28 (14.0 %) of 200, and those who planted a crop once a year during the rainy season with a sufficient amount of water were 172 (86.0 %) before project implementation. At the time of the ex-post evaluation, however, the “single crop without water shortage” figure stood at 21 samples (10.5 %) only, and 179 (89.5 %), which is close to 90 % of the total respondents, planted crops twice a year without experiencing water shortage (Table 10).
These results confirm that farmers had a better environment for planting whatever crops they wanted to plant throughout the year without specific limitations after the project implementation.
Table 10: Changes in Cropping Pattern
Unit: person
Cropping Pattern
Current Situation (As of 2014 at the Time of the Ex-post Evaluation)
Sugarcane
Single crop (rainy season only: without
water shortage)
Double crops (without
water shortage)
Single crop with less
water Total
Bef
ore
Proj
ect
Impl
emen
tatio
n
Sugarcane 0 (0.0 %) 0 (0.0 %) 28 (14.0 %) 0 (0.0 %) 28 (14.0 %) Single crop (rainy
season only: without water
shortage)
0 (0.0 %) 21 (10.5 %) 151 (75.5 %) 0 (0.0 %) 172 (86.0 %)
Double crops (without water
shortage) 0 (0.0 %) 0 (0.0 %) 0 (0.0 %) 0 (0.0 %) 0 (0.0 %)
Single crop with less water 0 (0.0 %) 0 (0.0 %) 0 (0.0 %) 0 (0.0 %) 0 (0.0 %)
Total 0 (0.0 %) 21 (10.5 %) 179 (89.5 %) 0 (0.0 %) 200 (100.0 %) Source: Beneficiary survey results

18
• Diversification of Farm Crops In order to confirm the project effect on changes in cropping pattern, beneficiaries were
asked if improvement of the irrigation facilities had contributed to the diversification of their farming crops, and all 200 respondents answered positively (Table 11). Moreover, a question about whether or not there had been any change in planted crops before and after the project implementation revealed that there was a large difference among foods excluding principal ones such as paddy and cereals as in Figure 2.
There were large numbers of beneficiaries (191 and 190 respectively) who, before project implementation, planted groundnut, which requires a relatively small amount of water to grow and which takes only four months for cropping with high yields, and sunflower which needs more or less three months to grow with a small amount of water. However, these sharply declined after project implementation (51 and 40 respectively) (Figure 2). On the other hand, the number of beneficiaries planting cotton, pulses and chilly increased to a large extent after project implementation (from 52 to 200, 3 to 198, and 48 to 200 respectively) (Figure 2). Chilly requires a large amount of water, and cotton and chilly need a large number of laborers for harvesting although the expected cash income is high.
It was thus confirmed that project implementation made it possible for farmers to plant crops which need a larger amount of water, and to rotate crops, including those with a high profit.
Table 11: Diversification in Crops
Unit: person
Question Item
Answer
Total Increased / Improved
after Project
Same as before Project
Decreased / Aggravated after Project
Others / N/A
Diversification in Crops 200 (100.0 %) 0 (0.0 %) 0 (0.0 %) 0 (0.0 %) 200 (100.0 %) Source: Beneficiary survey results

19
200
191
52
190
3
200
48
189
200
51
200
40
198
200
200
199
0 25 50 75 100 125 150 175 200
Paddy
Groundnut
Cotton
Sunflower
Pulses
Cereals
Chilly
Vegetables
(No of respondents)
(Plannted crops)
before project after project
Source: Beneficiary survey results
Figure 2: Changes in Planted Crops Before / After the Project • Stable crop production When asked if there was any change in crop yield, all 200 respondents said that it had
increased and improved for all the crops except groundnut, for which the answer “others / N.A.” had the greatest share20 (Table 12). This implies that improvements in crop yield mainly came from the fact that project implementation enabled farmers to use the required amount of water when needed, to change cropping patterns, to promote crop diversification, and to sustain soil fertility by rotating crops.
Table 12: Changes in Yields by Crop
Unit: person
Question Item
Answer
Total Increased / Improved after
Project
Same as before Project
Decreased / Aggravated after Project
Others / N/A
Paddy 200 (100.0 %) 0 (0.0 %) 0 (0.0 %) 0 (0.0%) 200 (100.0 %) Groundnut 35 (17.5 %) 0 (0.0 %) 0 (0.0 %) 165 (82.5%) 200 (100.0 %)
Cotton 200 (100.0 %) 0 (0.0 %) 0 (0.0 %) 0 (0.0 %) 200 (100.0 %) Sunflower 200 (100.0 %) 0 (0.0 %) 0 (0.0 %) 0 (0.0 %) 200 (100.0 %)
Pulses 200 (100.0 %) 0 (0.0 %) 0 (0.0 %) 0 (0.0 %) 200 (100.0 %) Cereals 200 (100.0 %) 0 (0.0 %) 0 (0.0 %) 0 (0.0 %) 200 (100.0 %) Chilly 200 (100.0 %) 0 (0.0 %) 0 (0.0 %) 0 (0.0 %) 200 (100.0 %)
Vegetable 200 (100.0 %) 0 (0.0 %) 0 (0.0 %) 0 (0.0 %) 200 (100.0 %) Source: Beneficiary survey results
20 This result was mainly due to the fact that it was only 51 households out of 200 who planted groundnut at the time of the ex-post evaluation.

20
To summarize, water availability to farmland has improved in each Reach as far as peripheral areas, the area benefited by the project and the planted area has expanded, staple crops have been planted in a stable manner, production volume and the unit yield by crop have improved, and changes in cropping pattern and crop diversification have been in progress. Therefore, the project objective “to enhance improvement in water efficiency, the recovery of the irrigated area, and the expansion of agricultural production” has been achieved and the project effectiveness is high.
3.4 Impacts
3.4.1 Intended Impacts A series of analyses was made based on the results of the questionnaire survey with the
executing agency, the beneficiary survey, interviews with people living in the project area, and the site survey to ascertain whether or not there was any contribution to the accomplishment of the overall goal of this project, “improvement in farmers’ income”, and the extent to which this contribution had been achieved as project impact.
(1) Household income and expenditure The beneficiary survey results on the household income and expenditure showed that 30
(15.0 %) and 50 (25.0 %) out of 200 respondents saw an increase / improvement in their household income and expenditure respectively. Those who said that their household income and expenditure remained at the same level, on the other hand, share the majority (170 (85.0 %) and 150 (75.0 %) respectively) (Table 13).
According to the results of beneficiary survey, however, 161 out of 200 (80.5%) beneficiaries answered that “their savings had increased”, which implies that they had secured and improved their incomes to the extent that they could afford to save excess money in their households. Apart from the beneficiary survey, interviews with residents and the site survey confirmed that farming activities had become more active than before and that farmers were better off (owning home appliances, motorbikes and vehicles, having better education for their children, better clothes and houses) as well as having increased savings. This gave confidence that there had been increases in income and expenditure.
Table 13: Household Income and Expenditure
Unit: person
Question Item
Answer
Total Increased / Improved
after Project
Same as before Project
Decreased / Aggravated after Project
Others / N/A
Household Income 30 (15.0 %) 170 (85.0 %) 0 (0.0 %) 0 (0.0 %) 200 (100.0 %) Household Expenditure 50 (25.0 %) 150 (75.0 %) 0 (0.0 %) 0 (0.0 %) 200 (100.0 %)
Source: Beneficiary survey results

21
Table 14: Savings Unit: person
Question Item
Answer
Total Increased / Improved
after Project
Same as before Project
Decreased / Aggravated after Project
Others / N/A
Savings 161 (80.5 %) 39 (19.5 %) 0 (0.0 %) 0 (0.0 %) 200 (100.0 %) Source: Beneficiary survey results
(2) Farm income and expenditure Looking at farm income21, the actual figures for the “gross average annual farm income
per household” for both 2012/13 and 2013/14 collected from the executing agency at the time of the ex-post evaluation show that they were above the base figure as well as the target (Table 15), which confirmed a quantitative improvement in farm income. The beneficiary survey showed that 170 respondents (85.0 %) out of 200 answered that “their farm income had increased from what it had been before project implementation” (Table 16). Taking into account the expansion of planted area, mainly of principle food crops, the attainment of the stable production of major crops, improvements in production volume and yields, the diversification of crops and the production of high value crops, the contribution of project implementation to increases in farm income can be seen and regarded to have been to a considerable degree.
Meanwhile, 140 beneficiaries (70.0 %) replied that “their farm expenditure had increased” (Table 16). The increase in farm expenditure is confirmed together with an increase in farm income, and the purchase of high quality seeds, fertilizers and farming equipment were given by residents as reasons for this increase. Moreover, all 200 beneficiaries said “they now required more laborers compared to before project implementation”, which implies that they spend more on laborers for cultivating larger farmland, ensuring a higher production volume, increasing yields, and securing manpower for planting high-value crops.
Table 15: Gross Annual Average Farm Income per Household
Unit: rupee/year/household/ha
Indicator Baseline (2002)
Target (3 years after completion)
Actual
2012/13 2013/14
Gross Annual Average Farm Income per Household 37,329 54,353 72,949 68,352
Source: Survey response from the executing agency Note: The gross annual average farm income is the crop production volume multiplied by crop price.
21 “Farm” income and expenditure includes those due to cultivating farmland. Those due to dairy farm and livestock raising are given in “non-farm” income and expenditure.

22
Table 16: Farm Income and Expenditure Unit: person
Question Item
Answer
Total Increased / Improved
after Project
Same as before Project
Decreased / Aggravated after Project
Others / N/A
Farm Income 170 (85.0 %) 30 (15.0 %) 0 (0.0 %) 0 (0.0 %) 200 (100.0 %) Farm Expenditure 140 (70.0 %) 60 (30.0 %) 0 (0.0 %) 0 (0.0 %) 200 (100.0 %)
Farm Labor 200 (100.0 %) 0 (0.0 %) 0 (0.0 %) 0 (0.0 %) 200 (100.0 %) Source: Beneficiary survey results
(3) Non-farm income and expenditure The number of beneficiaries who answered that both non-farm income and expenditure
had “increased” reached 198 (99.0 %), which indicates that the trend is for increases in areas other than farm income and expenditure (Table 17).
For non-farm expenditure, residents said in their interviews that they had spent on high quality dairy cattle and other livestock, animal raising, high quality seeds, farm machines, electrical appliances such as mobile phones and TVs, the purchase and repair / maintenance of motorbikes and vehicles, the purchase of furniture and the construction of permanent houses. It is confirmed that they also applied for loans from banks with their farmland as collateral, which meant repayment as expenditure. It was also confirmed through interviews that farmers were interested in spending money on their children’s education (details are given later in this report), on healthcare and on investments.
Looking at non-farm income, on the other hand, there were profits from the sale of dairy cattle and livestock raised in farmers’ dairy farms, as well as income from the renting of farmland. Beneficiaries are seen to have been involved in such activities as stable agricultural production, increase in yields per unit area and improvement in farm income had enabled them to secure a certain level of livelihood. A total of 171 respondents (85.5 %) stated that “job opportunities for family members remained the same as before project implementation”, which indicates that this did not contribute much to non-farm income.
Table 17: Non-farm Income and Expenditure
Unit: person
Question Item
Answer
Total Increased / Improved
after Project
Same as before Project
Decreased / Aggravated after Project
Others/N/A
Household Non-farm Income 198 (99.0 %) 1 (0.5 %) 1 (0.5 %) 0 (0.0 %) 200 (100.0 %) Household Non-farm Expenditure 198 (99.0 %) 1 (0.5 %) 1 (0.5 %) 0 (0.0 %) 200 (100.0 %)
Job opportunities for family members 29 (14.5 %) 171 (85.5 %) 0 (0.0 %) 0 (0.0 %) 200 (100.0 %) Source: Beneficiary survey results

23
To summarize, although the beneficiary survey results show that the majority of respondents said their household income had remained at the same level as before, according to the same survey it can be seen that household savings were secured, and it was confirmed through interviews with residents and the site survey that living standards improved. Moreover, improvements in farm and non-farm income were confirmed in the beneficiary survey, and it is judged that the project effectiveness contributed to this to a major degree. Farm expenditure and non-farm expenditure were also on the increase, with the expenditure mainly used for better farm and non-farm income and improvements in living standards. As people became more affluent, more expenditure was required for production activities and life improvement, and the project implementation was a major factor in the raising of incomes to sustain expenditure.
Although this is not a counter factual comparison of “with” or “without” project, it can be considered from a comprehensive point of view, taking into account all kinds of survey results in this ex-post evaluation, that the project has contributed to the overall goal of “improvement in farmers’ income” and that the degree of this contribution was high.
3.4.2 Other Impacts
(1) Impacts on the Natural Environment This project was appraised in accordance with the “OECF Environmental Guidelines for
ODA Loans (enacted in October 1989)” when the first phase was appraised. Also, an Environmental Impact Assessment (EIA) report was submitted in 1997 to the Ministry of Environment and Forestry (MOEF) of the Government of India, after the first project appraisal. The MOEF issued environmental clearance in November of the same year determined that the degree of environmental impact caused by this project was considered as small, most components of this project being the rehabilitation and enhancement of the existing irrigation facilities. In addition, no adverse impact was anticipated due to the inundation caused by the construction of the Alaganur Balancing Reservoir as there was no forest in the sunken area, and it was farmland or abandoned areas no longer cultivated. When the second phase was appraised in 2003, it was “JBIC Environmental Guidelines for ODA Loans (April 2002)” which was referred and this project was classified as Category A22. The executing agency promised that “environmental mitigation measures (such as canal lining and embankment installation) would be incorporated into the design to prevent water leakage from the reservoir in order that there would be no impact on the habitat of wild birds at the wild life sanctuary near the reservoir.”
In the first site survey in December 2014 of this ex-post evaluation, it was confirmed 22 Since this project included a large-scale reservoir construction, it was classified as Category A defined in the JBIC Guidelines as “ likely to have a significant adverse impact on the environment”. However, no EIA was conducted at the time of the second appraisal as the Indian side had already conducted one when the first phase of this project was appraised.

24
through interviews with the executing agency as well as check with eyes during the site visit that an impact on the wild life sanctuary near the reservoir had been avoided. The executing agency no longer report to the MOEF, but they submit reports to the Central Water Commission twice a year in accordance with their guidelines on the safety of the Alaganur Balancing Reservoir.
(2) Land Acquisition and Resettlement Land as large as 1,905 ha was acquired between 1997 and March 2004 for project
implementation (Table 18). Seven households were resettled due to the said land acquisition. The executing agency confirmed that it was the Revenue Department which compensated them in accordance with the conditions described in the Resettlement Policy of Andhra Pradesh State.
Table 18: Land Acquisition and Compensation (Actual)
Land Acquisition and Compensation (i) Canal Improvement
(ii) Construction of Alaganur Balancing Reservoir and Inlet
Channel of ABR
(iii) Total (i+ii)
Land Acquisition 306 ha 1,599 ha 1,905 ha
Kurnool District 216 ha in total in three
divisions 1,599 ha in total in five
divisions 1,815 ha
Cuddapah District 90 ha in total in two divisions - 90 ha
Compensation None 145.3 million rupees 145.3 million rupees Source: Survey response from executing agency
(3) Unintended Positive/Negative Impacts • Improvement in educational environment In the beneficiary survey, 170 respondents (85.0%) out of 200 answered that “their
children’s education level had improved after project implementation” (Table 19). For schooling, a sizable amount of money was necessary for transportation and clothes in addition to that needed for education materials. Increases in farm income mainly due to project implementation and improvements in non-farm income made it easier for farmers to meet such costs than they it had been for them before project implementation, and to let their children attend school.
Table 19: Improvement in Educational Environment
Unit: person
Question Item
Answer
Total Increased / Improved
after Project
Same as before Project
Decreased / Aggravated after Project
Others / N/A
Education Level for Children 170 (85.0 %) 30 (15.0 %) 0 (0.0 %) 0 (0.0 %) 200 (100.0 %) Source: Beneficiary survey results

25
• Enhancement in life infrastructure All 200 beneficiaries answered that the “water supply to their households improved after
project implementation” (Table 20). The water taken from the water source of the whole irrigation system of this project was used not only for irrigation purposes but also for drinking purpose as directed by Andhra Pradesh State (See footnotes 16 and 17). Water was now available at distributaries for residents’ daily use. Water supplied by the project contributed to satisfying the need for water for general purposes in peoples’ daily lives.
Similarly, all 200 beneficiaries answered that “road access has improved”. Improvement in the income of beneficiaries was confirmed at the time of this ex-post evaluation, as they were able to use motorbikes and other vehicles as their living standards improved. It is considered that the development of the surrounding infrastructure (such as farm roads and bridges) as well as the roads around the main canal and distributaries helped people move smoothly within regions and contributed to better traffic connections with neighboring villages.
Moreover, 170 residents (85.0 %) out of 200 mentioned that their houses were improved after project implementation. According to interviews with residents, they used to live in temporary or semi-permanent houses of one story before project implementation. Income improved after project implementation as they were able to harvest agricultural products in a stable manner.
Table 20: Improvement in Life Infrastructure
Unit: person
Question Item
Answer
Total Increased / Improved
after Project
Same as before Project
Decreased / Aggravated after Project
Others / N/A
Water Supply to Household 200 (100.0 %) 0 (0.0 %) 0 (0.0 %) 0 (0.0 %) 200 (100.0 %) Road Access 200 (100.0 %) 0 (0.0 %) 0 (0.0 %) 0 (0.0 %) 200 (100.0 %)
Housing Situation 170 (85.0 %) 30 (15.0 %) 0 (0.0 %) 0 (0.0 %) 200 (100.0 %) Source: Beneficiary survey results
In summary, it can be confirmed that appropriate measures were taken to mitigate impacts
on the natural environment, and impacts caused by land acquisition and resettlement. Improvements in children’s education levels and the living environment of local residents in the form of water supply to households, road access and houses have also been confirmed, and the living standards of beneficiaries have been steadily improving. These are positive impacts that are considered to have been brought about indirectly by implementation of the project.
This project has largely achieved its objectives. Therefore effectiveness and impact of the
project are high.

26
3.5 Sustainability (Rating: ②) 3.5.1 Institutional Aspects of Operation and Maintenance
(1) Organization of the executing agency The Chief Engineer of the I&CAD Kurnool Office is ultimately responsible for the whole
of the operation, maintenance and budget arrangement of the irrigation system between Kurnool and Cuddapah, including the facilities rehabilitated and developed under this project. Under his supervision, the Superintending Engineer conducts the O&M of the project facilities, while the Executive Engineer of the Nandyal Division Office performs guidance, management and overall planning (O&M planning, budget planning and expenditure management). The Deputy Executive Engineers at the Sub-divisional Offices of Kurnool, Nandyal, Allagadda, Mydukur, and Nandikotkur are in charge of implementing the O&M related activities (Table 21).
Table 21: O&M Organizational Framework of the Project Irrigation System
Position Main Functions Office Chief Engineer Responsible for the O&M of the project and budget arrangements with the
State Government Kurnool Division Office
Superintending Engineer
O&M of the project facilities
Executive Engineer Guides and manages the O&M of the project facilities (such as water supply), water management, the preparation of the O&M plan and cost estimates
Nandyal Division Office
Deputy Executive Engineer
Actual execution of the O&M of the project facilities (such as water supply, gate operation etc.)
Sub-division Office
Sunkesula Barrage, main canal and distributaries from km 0.0 to km.120.19 (Reach 1) and Lock-in-Sula
Kurnool
Santhajutur Anicut, main canal and distributaries from km.120.19 to 150.65 (Reach 2) and km.150.65 to 174.00 (part of Reach 3)
Nandyal
Main canal and distributaries from km.174.00 to 234.64 (part of Reach 3) Allagadda Rajoli Anicut, Adinimmayapalli Anicut and main canal and distributaries
from km.234.64 to 290.22 (Reach 4) and from km.290.22 to 305.60 (Reach 5)
Mydukur
Alaganur Balancing Reservoir and Inlet Channel of ABR Nandikotkur Source: Survey responses from executing agency
The staff allocation for O&M as at the ex-post evaluation is shown in Table 22. There
were no technicians, skilled workers, nor gate operators (lascar), and so for each of these the executing agency requested that an additional ten staff be allocated. As for service rendered contracts, Andhra Pradesh State employs and allocates manpower together with those for other irrigation systems, but recruitment was behind schedule. Under these circumstances the existing staff conducted O&M as required, and there were no specific problems in the irrigation system.

27
Table 22: Staff Allocation for the Project Irrigation System Unit: person
Position Name Cadre Existing Requirements for the strength of sanctions submitted to the
State Government Executing agency staff Chief Engineer, Superintending Engineer 1 1 1 Executive Engineer 1 1 1 Deputy Executive Engineer 5 5 5 Assistant Executive Engineer 25 25 25 Manager (Admin) Superintendent 1 1 1 Manager (Financial) 1 1 1 Technician 0 0 10 (new) Skilled worker 0 0 10 (new) Gate operator (lascar) 0 0 10 (new) Total 34 34 64
Service rendered contracts for the maintenance of canals and water regulations (work charged establishment) Work Inspector Grade I 1 0 1 Work Inspector Grade II 4 0 4 Work Inspector Grade III 16 11 16 Work Inspector Grade IV 58 9 58 Lascar / Watchman / Head of worker / Worker) 346 308 346 Driver 5 5 5 Total 430 333 430
Source: Survey response from executing agency Note: Shortages in service rendered contracts (work charged establishment) are filled with those applicants who provide their private land according to their skills. Andhra Pradesh State manages information and appoints by proxy as other projects have also acquired land from private owners.
(2) O&M by farmers organizations In accordance with the Andhra Pradesh Farmers Management of Irrigation Systems Act
enacted in 1997, Andhra Pradesh State conducted elections for the members of Water Users’ Associations (WUA), Distributary Committees (DC) covering 5 to 8 WUAs, and for Project Committees (PC) supervising DCs, and also organizing them. These farmers’ organizations and the I&CAD Dept. were expected to jointly manage the irrigation systems for distributing water equally, to promote and confirm the efficient and economical way of using water, to encourage the modernization of agriculture, maximize agricultural production and maintain irrigation systems based on annual water budgets and operation plans.
However, with the planned separation of Andhra Pradesh State into two states in 2014 as the main reason, the State has not held an election of farmers’ organizations nor their own organizations since February 201323. The State was split into two in June 2014, after which there has also been no action taken. At the time of the ex-post evaluation no farmers’ organizations existed in the irrigation system of this project, and future schedule of elections remained unknown.
23 There organized 86 numbers of WUA, 14 Distributary Committee (DC), and one Project Committee (PC) in this project irrigation system as of February 2013.

28
The farmers’ organizations of the irrigation system of this project used to report to and consult with the I&CAD Dept. regarding the condition of the farmland they covered, meanwhile the executing agency provided technical judgements and instructions whenever necessary and took measures which required financial expenditure. In response to the suspension of elections and the organization of farmers’ organizations in 2013, the officers of the executing agency in charge and staff members at division offices as shown in Table 21 took over the O&M roles of the WUAs, DCs and PC. It was confirmed at the ex-post evaluation that the executing agency systematically worked well on the operation and maintenance of the irrigation system based on the 1997 Act, which they managed well and no specific problems had occurred.
To summarize, although farmers’ organizations did not exist as of the ex-post evaluation,
each division office of the executing agency looked after their functions, roles and responsibilities. There are thus no specific problems found in the institutional aspect.
3.5.2 Technical Aspects of Operation and Maintenance
The executing agency conducts staff skill evaluation once a year, and systematically promotes the improvement of technical, management and administrative skills.
The Water and Land Management Training and Research Institute (hereinafter “WALAMTARI”), established in 1983 in Andhra Pradesh State, provides training opportunities on quality control, soil management, water management, basin management and irrigation project operation and maintenance to the staff members of the executing agency.
The WALAMTARI also provides technical training to farmers. The executing agency provides farmers with advice on planning of maintenance plans, on estimating budgets for operation and maintenance, water regulation and annual water budgets, as well as on technical site inspections at irrigated land. In addition, the DOA provides assistance to farmers on the development of action plans for agricultural production, guidance on agricultural records, direction on growing agricultural products in peripheral areas of the irrigation system, on comprehensive nutrition management, and integrated pest management. In order to respond to various inquiries from farmers, the DOA also regularly writes technical articles and introduces and promotes farm technology on TV programs, as well as establishing a telephone help line exclusively for technical consultation, conducting soil inspections, providing advice on which crops to choose based on the soil condition, providing high quality seeds and subsidies, and allocating agriculture extension workers at village level. The executing agency and the DOA exchange information as required at ground level, coordinate and collaborate with each other. Both of them provide useful technical inputs on the O&M of this project as well as the provision of guidance to residents.

29
To summarize, the executing agency promotes the improvement of staff skills with a periodic evaluation system to secure the quality of operation and maintenance. In addition to the executing agency, the WALAMTARI and the DOA fulfill their roles according to their functions. Thus no specific problems were found in the technical aspect.
3.5.3 Financial Aspects of Operation and Maintenance
(1) The Kurnool - Cuddapah Canal Operation and Maintenance Budget Table 23 shows the operation and maintenance budget and expenditure of the past three
years approved and allocated by Andhra Pradesh State. The same budget has been secured for “Operation” and “Maintenance” every year, and a certain budget allocation and expenditure for “Human Resources (staffing costs)” has also been admitted. There has been no budget allocation in recent years to “Staff Training Costs” as the organizations often conduct training by themselves. “Others” includes large-scale rehabilitation and the new construction of canals.
According to the executing agency, the budget allocated for operation and maintenance was not sufficient, and activities were prioritized based on the degree of urgency for repair and rehabilitation. De-silting in peripheral areas and in field channels as well as weed removal where there was no great harm to the function of the irrigation system were given less priority.
Table 23: O&M Budget and Expenditure for the Project Irrigation System
Unit: million rupees
Item 2011/12 2012/13 2013/14
Budget Expenditure Budget Expenditure Budget Expenditure Operation 5.0 4.6 5.0 2.5 5.0 2.5
Maintenance 5.4 2.3 5.4 3.9 5.4 2.7 Others 370.4 311.9 475.4 251.3 689.8 91.8
Human Resources 70.9 55.3 80.9 63.7 94.5 60.2 Staff Training costs 2.3 2.3 - - - -
Gov. Subsidies - - - - - - Total 454.0 376.4 566.7 321.4 794.7 157.2
Source: Survey responses from the executing agency
(2) Collection of irrigation water tax Table 24 shows the shift in the planned amount of collection, the actual amount of
collection, the actual expenditure of the irrigation water tax, and its collection rates. The irrigation water tax was expected to be redistributed after being collected24. The collection rate at the time of the second project appraisal (2002) was as low as 6.6 %, and JICA strongly proposed that the executing agency improve the rates and review the water charge
24 These were re-distributed to WUAs, DCs, PCs, and GCs at 50%, 30%, 20%, and 10% respectively for the purpose of irrigation system management.

30
ratio25. As for the shift in collection rates, they remained below the target (50%) except those of
2007/08 and 2009/10, and those after 2011 were found to be lower than the base figure of 2002. According to the executing agency, the tax collection rates had been low as it depended on the Revenue Department of each division as to what extent collection was completed. Residents felt no motivation to pay tax as its advantages were not recognized by them. In addition, the executing agency did not collect the irrigation water tax during the dry seasons, taking into account the droughts of recent years26. Although the existence of WUAs, the entry point for irrigation water tax collection, was terminated at the beginning of 2013, the local Revenue Department continued to collect the tax even after termination, although not much was spent on maintenance as the collected amount was far below that required. The executing agency explained that no irrigation water tax was collected at the time of the ex-post evaluation (2014).
Table 24: Shift in the Planned and Actual Amount of Irrigation Water Tax Collection and
the Actual Expenditure and Collection Rate of the Irrigation Water Tax in the Project Irrigation System
Irrigation Water Tax (Unit)
Baseline (2002)
Target (3 years after Completion)
Actual
2007/08 (comple-
tion year)
2008/09 (1 year after
comple- tion)
2009/10 (2 years
after comple-
tion)
2010/11 (3 years
after comple-
tion)
2011/12 (4 years
after comple-
tion)
2012/13 (5 years
after comple-
tion)
2013/14 (6 years
after comple-
tion) Planned Amount of
Collection (mil rupees) - - 15.0 41.1 53.9 55.5 39.2 30.5 39.3
Actual Amount of Collection (mil rupees) - - 13.5 10.1 30.7 13.8 2.5 0.6 0.6
Actual Expenditure (mil rupees) - - - 34.3 40.0 4.3 0.07 0.07 0.05
Collection Rate (%) 6.6 50 89.8 24.5 56.9 24.9 6.3 1.9 1.5
Source: The data on the planned amount, actual amount, and actual expenditure from 2007 to 2010 was collected from PCR, while the figures for 2011 to 2013 are from the data submitted by the executing agency in this ex-post evaluation. The collection rate is calculated as the actual amount of collection divided by planned amount of collection.
25 The amount of water charges are based on the Andhra Pradesh State Government Order by the Revenue Department. This project is categorized as a “major” sector and Rs. 200 are charged per acre (Rs. 50 from WUAs, Rs. 20 from DCs, Rs. 20 from PC and Rs. 10 from villages (Gram Pachayats), and Rs. 100 from the I&CAD Dept.). The charge ratio has been left unchanged since July 2001. 26 Described as in footnote 16, as there are drinking water shortages mainly in the dry season, the Andhra Pradesh State Government preferentially allocates some irrigation water to the drinking water supply including in the irrigation system of this project. The executing agency is supposed to provide irrigation water only to those with registered farmland, but unofficially they extend their service to the non-registered area. The executing agency therefore is not in a position to provide surface water officially as they cannot guarantee the provision of a sufficient amount of irrigation water until the end of dry season when the water supply is most required, although they do supply available water as much as possible. Instead, therefore, they do not collect the irrigation water tax during the dry season.

31
The planned amount of the irrigation water tax collection far exceeds the operation and maintenance budget allocated by Andhra Pradesh State (Table 23). This implies that a sufficient amount will be secured if the irrigation water tax is collected as planned. In order to supplement the fund shortage, the executing agency took countermeasures such as the provision of excess water to private companies (factories and power generation companies) in order to collect water royalty charges in return. They said that they would continue to discuss to increases in water sales to private companies, but the income remains insufficient27.
In summary, the Andhra Pradesh State Government has allocated a certain budget for the
operation and maintenance of the project in a stable manner. However, the amount is not sufficient and operation and maintenance works are implemented according to the degree of urgency. The irrigation water tax, part of which is supposed to be spent on facility maintenance, had not been collected as planned, particularly recent years, resulting in a chronic shortage in the operation and maintenance budget. The executing agency has made efforts to secure alternative funds by selling excess water to private companies, but it is unknown to what extent this has been effective. There are therefore some problems in the financial aspect of the operation and maintenance.
3.5.4 Current Status of Operation and Maintenance
(1) Maintenance works for the project The executing agency develops an annual water budget, forecasts the amount of water
intake within the system before the rainy season, confirms how much water remains at the reservoir, and distributes water in the system. At the end of each season they confirm the planting area and develop a detailed plan for the discharge and blockade of water. Based on the Andhra Pradesh Farmers Management of Irrigation Systems Act of 1997, the executing agency is supposed to conduct O&M activities together with the WUA as described in Table 25. As of December 2014, at the time of the ex-post evaluation, no WUA existed and it was the executing agency who conducted such works. They conducted repair works based on the urgency to do so as allocated from the State, and there was no specific problem found in their O&M works.
27 Data from the executing agency shows that the actual water sales collected from private enterprises in 2013/14 was 522,798 rupees against the planned amount 743,194 rupees.

32
Table 25: O&M Activities of the Project Irrigation System
Maintenance Works Contents
Daily Inspection
De-silting Weed removal Embankment repairs Revetment Repairs to shutters Repairs to masonry and lining Cleaning and oiling of screw gearing shutters Painting of hoists and gates etc. Emergent breach closing works Maintenance of inspection paths
Periodic Inspection
Reconstruction of sluices Reconstruction / repairs to drops and regulators Reconstruction of measuring devices Rehabilitation of the system
Large-scale Works Modernization of the system Other construction work in the irrigation system
System Diagnosis Inspection of each and every hydraulic structure and recording of its status before
each season Identification of all critical reaches
Source: Survey response from executing agency
(2) Current operational condition of the irrigation system At the time of the ex-post evaluation, no breakdown or deterioration of the irrigation
facilities was identified, nor were there problems caused by bad construction. The irrigation system was found in good condition. Construction and lining of the existing part of the main canal and distributaries under the project had contributed to a reduction in seepage losses to a large extent, and also to a minimization of the time necessary to deliver water to peripheral and tail-end areas. It is also confirmed that there was a sufficient amount of water compared to the period before project implementation.
Thus no specific problems were found in the inspection and repair works, and the
operation of the irrigation system, nor in the present condition of operation and maintenance.
To summarize, no problems have been observed in the institutional and technical aspects of the operation and maintenance system, however there is room for improvement of the financial aspects. Therefore sustainability of the project effects is fair.
4. Conclusion, Lessons Learned and Recommendations 4.1 Conclusion
This project was intended to utilize water resources efficiently, recover the original designed area of irrigation, and increase agricultural production by the rehabilitation and modernization of the irrigation system between Kurnool and Cuddapah in Andhra Pradesh State in Southern India, thereby contributing to income improvement for farmers. The project relevance is high as

33
project implementation was well in line with India’s development policy and development needs, as well as with Japan’s ODA policy at the time of both appraisal and the ex-post evaluation. The project output achieved more or less as planned and the project cost was within the plan. The efficiency of the project is fair as the project period was significantly longer than planned. Water supply to farmland has been improved, the area benefited by Kurnool-Cuddapah Canal has been expanded, there has been stable planting of principal food, improvement of production volume and yields, and the diversification of agricultural products has been promoted since project implementation. Furthermore, household income, farm and non-farm incomes in the target area have been improved, and household savings have been secured since project implementation. The living environment of local residents has been improved to a large extent as seen in improvements in the level of children’s education and in life infrastructure, and their living standards have been steadily improving. Therefore it is concluded that the effectiveness and impacts of the project are high since the planned effectiveness has been achieved through project implementation. With regard to project sustainability, there are no problems with the institutional and technical aspects and the present operation and maintenance condition of the irrigation facilities covered under the project, but there have been some issues with the financial aspects. The sustainability of the effects realized by this project is therefore fair. In light of the above, this project is evaluated to be satisfactory.
4.2 Recommendations
4.2.1 Recommendations to the Executing Agency Collection rates of the irrigation water tax were overall low since project appraisal as the
extent to which the irrigation water tax collection was completed depended on the Revenue Department in each division of the project irrigation system, and the motivation and willingness of residents to pay the tax remained low. Drinking water is in short supply, particularly during the dry season, and Andhra Pradesh State has a policy to prioritize the water supply for drinking purposes. The executing agency allocates some water in the project irrigation system for drinking purposes, and provides water to non-registered farmland through the Revenue Department. As they cannot guarantee a sufficient amount of water for registered farmland, the executing agency does not collect the irrigation water tax during the dry season. The planned amount of collection far exceeds the operation and maintenance budget allocated from Andhra Pradesh State, and a sufficient amount of funds will be secured if the entire planned amount of the irrigation water tax is collected. In order to secure the stable allocation of the operation and maintenance budget, it is necessary that the irrigation water tax is continued to be collected, which should help raise the awareness of farmers and motivate them to participate in O&M activities more positively. It is strongly recommended that the executing agency secure stable water supply throughout a year, and examine concrete measures to directly collect the irrigation water tax from farmers, while on

34
the other hand introducing penal regulations and thorough discipline for those farmers who do not pay the tax.
4.2.2 Recommendations to JICA
None.
4.3 Lessons Learned None.

35
Comparison of the Original and Actual Scope of the Project Item Plan Actual
1. Project Outputs (1) Construction and
Rehabilitation of Weir Facilities
Construction of the Sunkesula Weir (Barrage), the Rehabilitation of Four Weirs (Anicuts) (Lock-in Sula, Santa Jutur, Rajoli, and Adinimmayapalli)
Construction of Sunkesula Weir (Barrage), Rehabilitation of Four Weirs (Anicuts) (Lock-in Sula, Santa Jutur, Rajoli, and Adinimmayapalli)
(2) Construction of the Alaganur Balancing Reservoir
Reservoir area (water surface): 15.64 km2 Storage capacity: 84 million m3 Designed cull water level: 265 m Dam crest elevation: 269 m Dam crest length: 5,500 m
Reservoir area (water surface): 13.59 km2 Storage capacity: 84 million m3 Designed cull water level: 265 m Dam crest elevation: 269 m Dam crest length: 7,500 m
(3) Construction and Rehabilitation of the Main Canal and Distributaries
Main Canal: 244.8 km (rehabilitation) Distributary: 790.3 km (rehabilitation) and 169.2 km (new construction)
Main Canal: 305.6 km (rehabilitation) Distributary: 840.0 km (rehabilitation) and 50.0 km (new construction)
(4) Construction and Rehabilitation of Related Structures
Bridges: 30, Cross drains: 14, Aqueducts: 8, Offtakes: 137, Measuring devices: 900, Outlets to field channel: 2,700
Bridges: 30, Cross drains: 14 Aqueducts: 8, Offtakes: 137, Measuring devices: 900, Outlets to field channels: 2,700
(5) Construction and Rehabilitation of Farm (Ayacut) Roads
100.6 km (construction of new roads) and 235.5 km (rehabilitation of existing roads)
336.0 km (construction of new roads) and 71.0 km (rehabilitation of existing roads)
(6) Construction and Rehabilitation of Drainage System
71.0 km in length, and 165,000 m3 for earthworks volume
71.0 km in length, and 165,000 m3 for earthworks volume
(7) On-farm Development
Development of on-farm facilities: 10,000 ha in total (5 places in the area benefited by the project)
Development of pilot farms: 70.97 ha in total (5 places)
(8) Sustainability Scheme (WUA consolidation activities and capacity building of farmers / WUAs)
- Procurement of farming equipment at pilot farms and provision of technical training on agriculture extension
(9) Improvement of VHS Communication System and MIS
Procurement of computers and VHS communication system and MIS
Procurement of computers and VHS communication system (without MIS)
(10) Procurement of Vehicles
Included Excluded
(11) Consulting Service 482 man / month (International: 132 and Local: 350)
474.5 man / month (International: 172 and Local: 302.5)
2. Project Period
January 1996 – June 2003 (90 months)
January 1996 – May 2007 (137 months)
3. Project Cost Amount paid in Foreign currency
2,995 million yen
1,403 million yen
Amount paid in Local currency
26,880 million yen 22,909 million yen (9,301 million rupees) (9,235 million rupees)
Total 29,875 million yen 24,312 million yen Japanese ODA loan portion
25,393 million yen 19,123 million yen
Exchange rate 1 Indian rupee = 2.89 Japanese yen (As of April 1995)
1 Indian rupee = 2.48 Japanese yen (Average between 1996 and 2013)
Note: Although this project was implemented until July 2013, it is concluded in this ex-post evaluation that the project completion was May 2007 when the major facilities such as weirs, reservoir and drainage structures were developed and their operation was commenced at full-scale.


![Le Châtelier’s principle. The significance of Kc values Kc = Products Reactants Kc = Products Reactants If Kc is small (0.001 or lower), [products] must](https://img.pdfslide.us/doc/110x75/56649cff5503460f949cff35/le-chateliers-principle-the-significance-of-kc-values-kc-products-reactants.jpg)